Article

Investigation of Spatter Trajectories in an SLM Build Chamber under Argon Gas Flow

by
Awad B. S. Alquaity
1,2,* and
Bekir S. Yilbas
1,3,4
1
Department of Mechanical Engineering, King Fahd University of Petroleum and Minerals, Dhahran 31261, Saudi Arabia
2
Interdisciplinary Research Center for Hydrogen and Energy Storage, King Fahd University of Petroleum and Minerals, Dhahran 31261, Saudi Arabia
3
Interdisciplinary Research Center for Renewable Energy and Power, King Fahd University of Petroleum and Minerals, Dhahran 31261, Saudi Arabia
4
K.A.CARE Energy Research and Innovation Center, Dhahran 31261, Saudi Arabia
*
Author to whom correspondence should be addressed.
Metals 2022, 12(2), 343; https://doi.org/10.3390/met12020343
Submission received: 20 December 2021 / Revised: 13 February 2022 / Accepted: 14 February 2022 / Published: 16 February 2022
(This article belongs to the Special Issue Optimization of Metal Additive Manufacturing Processes)

Abstract

:
Spatter particles ejected from the melt pool during selective laser melting processes can get redeposited on the build plate region and impact final part quality. Although an inert gas flow is used to purge the spattered particles away from the build plate region, some of the spatter particles get redeposited on the plate region leading to increased porosity and surface roughness. In this regard, the current study focuses on the numerical modeling of the interactions between the inert gas flow and spatter particles by using the discrete phase model. A Renishaw AM250 build chamber is used as the base geometry and the flow field within the build chamber is evaluated for various inert gas flow rates and nozzle diameters of 6 mm and 12 mm. For the first time, spatter trajectories are tracked at specific spatter diameters and ejection angles to pinpoint the influence of drag and gravitational forces on the evolution of spatter trajectories. The findings reveal that the spatter particles between 120 and 180 μm diameter travel beyond the build plate only at specific gas ejection angles and gas flow rates (≥750 L/min). Reducing the nozzle diameter to 6 mm increases the inert gas flow velocity in the build region and enhances the range of spatter particles. New correlations are proposed to relate the range of particles and inert gas flow rates, which can be used to identify the spatter diameters, ejection angles, and inert gas flow rates required to transport the particles beyond the sensitive build plate region.

1. Introduction

Additive manufacturing techniques are gaining prominence as the solution of choice for manufacturing complex and intricate geometric structures for a multitude of applications. Among the various metal additive manufacturing techniques, selective laser melting (SLM) is gaining traction in various domains from the aerospace to the medical sector due to its accuracy and feature resolution in addition to its ability to produce both porous and fully dense shapes [1,2]. The SLM manufacturing process involves locally melting a thin sheet of micro-sized metal powder using a high-power laser beam and building the cross-section of the desired geometry one layer at a time. As the laser beam interacts with the metal powder, metal vapor and spatter are ejected from the melt pool with recoil pressure being a crucial factor in causing liquid spatters [3]. An inert gas stream (generally argon) carries away the process by-products away from the build area thereby avoiding deposition of the spatters on the powder bed as well as attenuation of the laser beam, both of which would adversely impact the final part quality. Ideally, the inert gas carries all the spattering particles away from the powder bed and into the vacuum where it is trapped inside the machine’s filters, however, this is not always the case. In situations where the inert gas does not carry away all the spattering particles, the final build quality of the component being fabricated can be severely compromised [4]. Considering that the SLM machines typically operate over a few days to build the desired parts, any non-uniformities in inert gas distribution and other non-idealities introduced due to spatter deposition end up reducing the final product quality. The issues of porosity, residual stresses coupled with the thermal history of the part lead to uncertainties in the properties of parts built using additive manufacturing techniques and are a significant barrier to its widespread adoption [5]. Therefore, any effort that can reduce standard deviation in parameters quantifying product quality is crucial [6].
On the other hand, the spatter removal rate depends significantly on the inert gas flow rate, laser process parameters, metal powder material and associated powder size among other factors. To improve part quality and repeatability, it is essential to predict the spatter removal rate and identify the regions within the build plate that are susceptible to spatter deposit. Previous studies have demonstrated that inert gas velocity within the build chamber is an important process variable that needs to be taken into account to ensure the consistency and repeatability of the manufactured specimens [7]. Non-uniformities in gas flow over the powder bed surface increase standard deviation in the final product properties, which is linked to the deposition of spattering particles as well as insufficient removal of vapor fumes from the path of the laser beam.
Both computational and experimental approaches have been used to understand and optimize the inert gas flow to improve the build quality of the final product. Kong et al. [8] investigated the effect of reducing the cross-sectional area of the inlet baffle of a SLM250 on the mechanical properties of the additively manufactured solid blocks of Ti6Al4V alloy. A significant reduction in porosities of solid blocks was observed for the modified inlet design which was attributed to the increased inert gas velocity across the build plate region caused by the reduction in the flow area of the modified inlet design. Ferrar et al. [7] utilized the CFD code ANSYS Fluent [9] to understand and improve the uniformity of gas flow distribution in the build chamber of a ReaLizer SLM250 machine. The velocity of inert gas on and above the build plate is crucial as the spattering particles and vapor fumes are removed due to the drag force imparted by the incoming inert gas flow. The proposed design of the gas flow delivery system led to an enhancement in the gas flow uniformity within the build chamber as predicted by the simulations. The subsequent improvement in the build quality of the parts measured via the reduction in porosity and increase in compression strength was therefore attributed to the increase in flow uniformity. However, better flow uniformity in the planes above the build plate also increases the minimum gas flow velocity. The increase in minimum gas velocity can also lead to improvement in part quality as discussed by Reijonen et al. [10]. Therefore, it may be possible to achieve improved part quality by simply increasing the minimum velocity of inert gas above the build plate without making any drastic changes to the gas inlet system. This argument is supported by the fact that Ferrar et al. [7] observed inferior part quality primarily in the regions with relatively low inert gas velocities. Nonetheless, improvement in flow uniformity is desired whenever possible as it allows achieving the minimum required inert gas velocity across the build plate for a lower inert gas flow rate entering the chamber. Ladewig et al. [11] and Anwar et al. [12] experimentally investigated the influence of gas flow velocity on the build quality of parts and recommended the need for further efforts to understand and optimize gas flow within build chambers. Recently Anwar et al. [13] performed a numerical study to investigate the spatter removal rate in an SLM 280 build chamber and showed that the spatter was not completely removed from the build plate even in the presence of inert gas flow for the flow rates considered in their study.
Philo et al. [14] simulated the velocity field within a Renishaw AM250 build chamber with a build plate of 250 mm × 250 mm for three different flow rates and validated it by measuring the velocity of air (a surrogate for argon) at various points within the build chamber using hot-wire anemometry technique. Subsequently, the validated CFD model was coupled with a discrete phase modeling (DPM) approach to track the spattering particles and relocation of the inlet and outlet of the chamber was proposed which significantly improved flow uniformity. Various radii (between 3.1 and 8.9 mm) and cross-sections (circular and oval) were also evaluated for the inlet with relatively larger radii of oval cross-section improving both flow uniformity as well as spatter removal from the build plate. However, no details were provided regarding the inlet radius that led to improvement in flow uniformity. Chen et al. [15] numerically investigated the flow inside a Renishaw AM250 build chamber with a view to improve the uniformity of flow at a height of 3 mm above the build plate. The authors varied the height and length of inlet nozzles in addition to increasing the number of nozzles to improve flow uniformity of air for a given inlet volume flow rate (250 L per minute (LPM)). Increased flow uniformity was obtained by increasing the number of nozzles in the inlet rails and lowering them. It is pertinent to note that the authors did not model the spattering particles in this work and focused singularly on improving flow uniformity at 3 mm above the build plate. Zhang et al. [16] performed a similar numerical investigation on a Renishaw AM250 build chamber, however, the focus was on improving spatter removal from the build plate. Therefore, the interaction between inert gas and spatter was modelled using the Eulerian-Lagrangian technique and argon was selected as the inert gas for the simulations. Along expected lines, the flow rate was found to have a significant influence on the spatter removal rate from the build plate with the spatter removal increasing by about 33% when the inlet flow rate of 250 LPM was doubled. Spatter removal was the highest for the baseline case with an inlet height of 67.5 mm while the different inlet widths considered in their study showed minor effect on spatter removal rate. Their work was extended in a later study [17] which proposed new designs of inlet rails for a generic flow chamber with a larger build plate of 280 mm × 280 mm. Recently Ding et al. [18] performed an experimental study along with preliminary simulations to show the significant influence of inert gas flow on the microstructure and tensile strength of the additively manufactured test sample.
Previous studies proposed significant changes to the design of inlet/outlet manifold of the Renishaw AM250 build chamber to improve spatter removal rate. However, the proposed design changes are difficult to implement on existing machines. To keep using the Renishaw AM250 chamber effectively, it is crucial to identify the flow rates that can increase the spatter removal and possibly improve flow uniformity with a specific focus on the region above the build plate. Moreover, it is essential to investigate the effect of easily implementable changes such as reduction in the diameter of inlets on the spatter removal. In this vein, the current study utilizes a commercial CFD code to thoroughly investigate the velocity profiles above the build plate for various inlet flow rates. Additionally, trajectories of spatter particles of various diameters are tracked to identify the spatter diameters that are susceptible to deposition on the build plate for a given ejection angle and speed. Lastly, the effect of change in the inlet rail design in terms of reduction in nozzle diameter are examined for the current build chamber geometry to identify the most appropriate design.
In what follows, we present in detail the modeling framework used for the numerical study. Details on a numerical solution including mesh used, the grid independence, and validation are presented. The upper limit for an inert gas flow rate that avoids erosion of metal powder on the build plate is predicted as a function of powder diameter. Next, detailed velocity profiles across various cross-sections of the build chamber are presented for various flow rates with the upper limit dictated by the blowing limit for metal powder under consideration. Spattering particles are incorporated into the CFD simulation with discrete phase model (DPM) and the effect of spatter size and ejection angles on the spatter particle trajectory are presented. Lastly, the effect of reducing nozzle inlet diameter is investigated on the velocity profiles and the spatter trajectories within the build chamber.

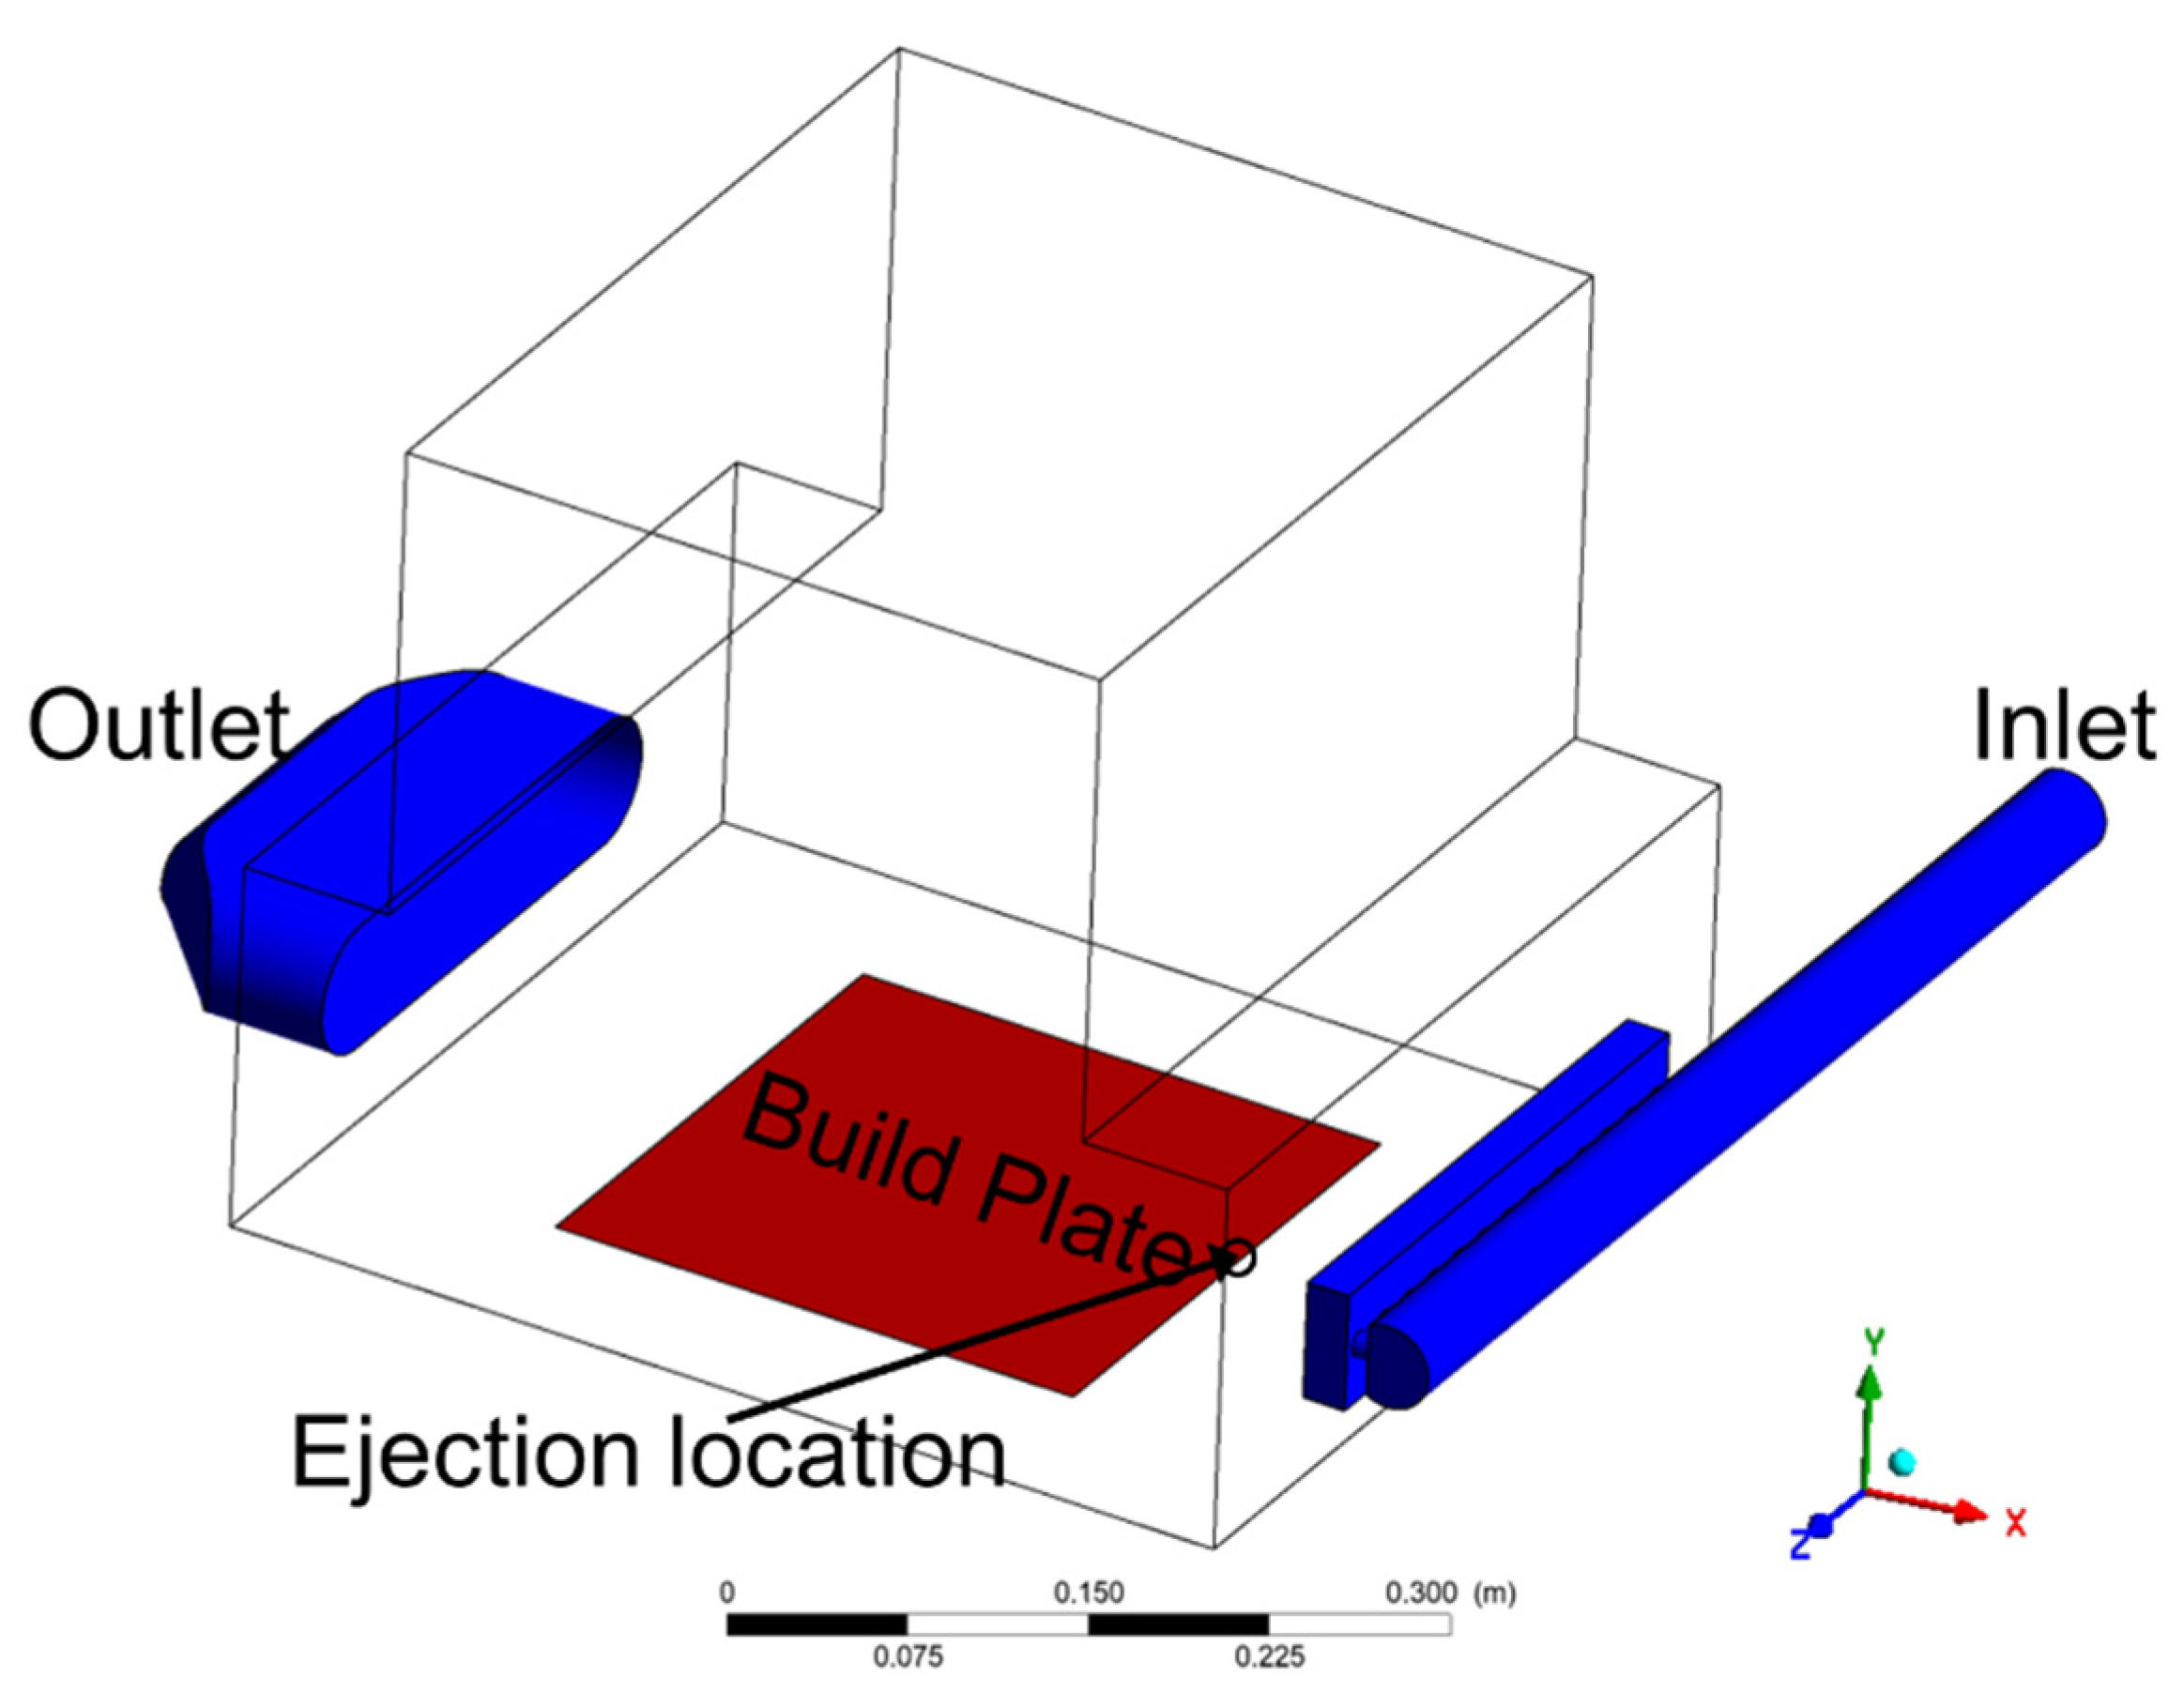
2. Modeling Framework

A geometry representing the build chamber of an AM250 build system (Renishaw, Wotton-under-Edge, Gloucestershire, United Kingdom) is used in this study (Figure 1) with build plate width and depth of 250 mm by 250 mm respectively. The gas flow inlet consists of a rail of the circular cross-section of 39 mm diameter, which joins the main body of the chamber through thirteen nozzles of 12 mm diameter each. The center of the inlet nozzles is located at a height of 67.5 mm above the build plate/bottom of the chamber. The outlet consists of a converging section placed at the same height as the inlet nozzles.
Gas flow in the AM250 build chamber has been probed by numerically modeling the flow using CFD software ANSYS Fluent 2020 R2 [9]. The fluid flow model is assumed to be incompressible and turbulent in a steady state to capture the dynamics of the flow within the build chamber. Due to the complex nature of the problem under consideration, the multiphase modeling approach has been used for tracking the trajectory of spattering particles inside the chamber. Among the various multiphase modeling approaches, DPM is the most appropriate to track spatter particle trajectories and has been used successfully to track spatter particles trajectories in earlier studies [13,14,17]. The DPM uses an Eulerian-Lagrangian approach wherein the fluid is treated as a continuum for which Navier-Stokes equations are solved, while the discrete phase is solved by tracking individual particles through the flow field. For dilute gas-solid flow similar to the spatter flow in inert gas, particle-particle interactions can be neglected and one-way coupling is considered. One-way coupling significantly reduces the computational time and this approach has been validated by Anwar et al. [13] by matching the predicted spatter deposition maps with the experimental spatter data for their additive manufacturing chamber. Each particle is individually tracked and particles are assumed spherical and non-reacting. The governing equations for the fluid flow and spatter particles are presented below.

Governing Equations

The equations governing the turbulent flow for the fluid are shown below:
Continuity equation:
· v = 0
Momentum equation:
· ( ρ v v ) = p + μ 2 v
In the above equations, v is the velocity, ρ is the density of the fluid, p is the static pressure and μ is the dynamic viscosity for the fluid. For the flow rates considered, the gas flow inside the build chamber becomes turbulent and therefore k-ε turbulence model has been used. The transport equations for turbulent kinetic energy (k) and kinetic energy dissipation rate (ε) are given as [9]:
t ( ρ k ) + x i ( ρ k u i ) = x i [ ( μ + μ t σ k ) k x i ] + G k + G b ρ ϵ .
t ( ρ ϵ ) + x i ( ρ ϵ u i ) = x i [ ( μ + μ t σ ϵ ) ϵ x i ] + C 1 ϵ ϵ k C 3 ϵ G b ρ C 2 ϵ 2 k + v ϵ .
In the above equations, ui is the fluid velocity component, μt is the eddy viscosity, Gk corresponds to the generation of turbulent kinetic energy attributed to mean velocity gradients while Gb represents the turbulence kinetic energy generation by buoyancy. σk and σε represent the turbulent Prandtl numbers for k and ε respectively. C1ε, C2, and C3ε are constants whose default values given for the Realizable k-ε model in ANSYS Fluent were used.
The spattering particles are ejected at a fixed location from the center of the east edge of the build plate (Figure 1). The force balance on each particle dictates the evolution of its trajectory within the flow domain and is given as:
d u p d t = F D ( u u p ) + g ( ρ p ρ ) ρ p ,
where u p is the particle velocity, u is the fluid velocity, FD is the drag force per unit particle mass acting on the particle, ρp is the particle density and g is the acceleration due to gravity. The drag force per unit mass is calculated as:
F D = 18 μ ρ p d p 2 C D R e 24 ,
where dp is the particle diameter. Re is the relative Reynolds number defined as:
R e = ρ d p | u p u | μ .
The drag coefficient CD for smooth spherical particles is:
C D = b 1 + b 2 R e + b 3 R e 2 ,
where b1, b2, and b3 are constants given by Morsi and Alexander [9,19].
In the simulations discussed here, mass flow inlet and outflow have been selected as the inlet and outlet boundary conditions respectively. The build plate and the bottom wall of the chamber have been set as trap wall conditions indicating that the spatter trajectory will terminate once the spatter reaches the trap wall boundary. All the remaining surfaces have been set to “reflect” wall boundary conditions. All the spatter particles are subjected to gravity (−Y direction) and are assumed to have solidified at the time of ejection from the build plate.

3. Numerical Solution

The CFD code ANSYS Fluent 2020 R2 [9] is used for the discretization of governing equations. Pressure and momentum equations were coupled using the SIMPLE algorithm. A second-order upwind scheme was utilized for discretizing the momentum and turbulent kinetic energy equations. The convergence criterion for the scaled residuals is set to 10−4 for continuity and momentum equations. Moreover, the area-weighted average velocity at the outlet is monitored to verify the convergence of the solution.

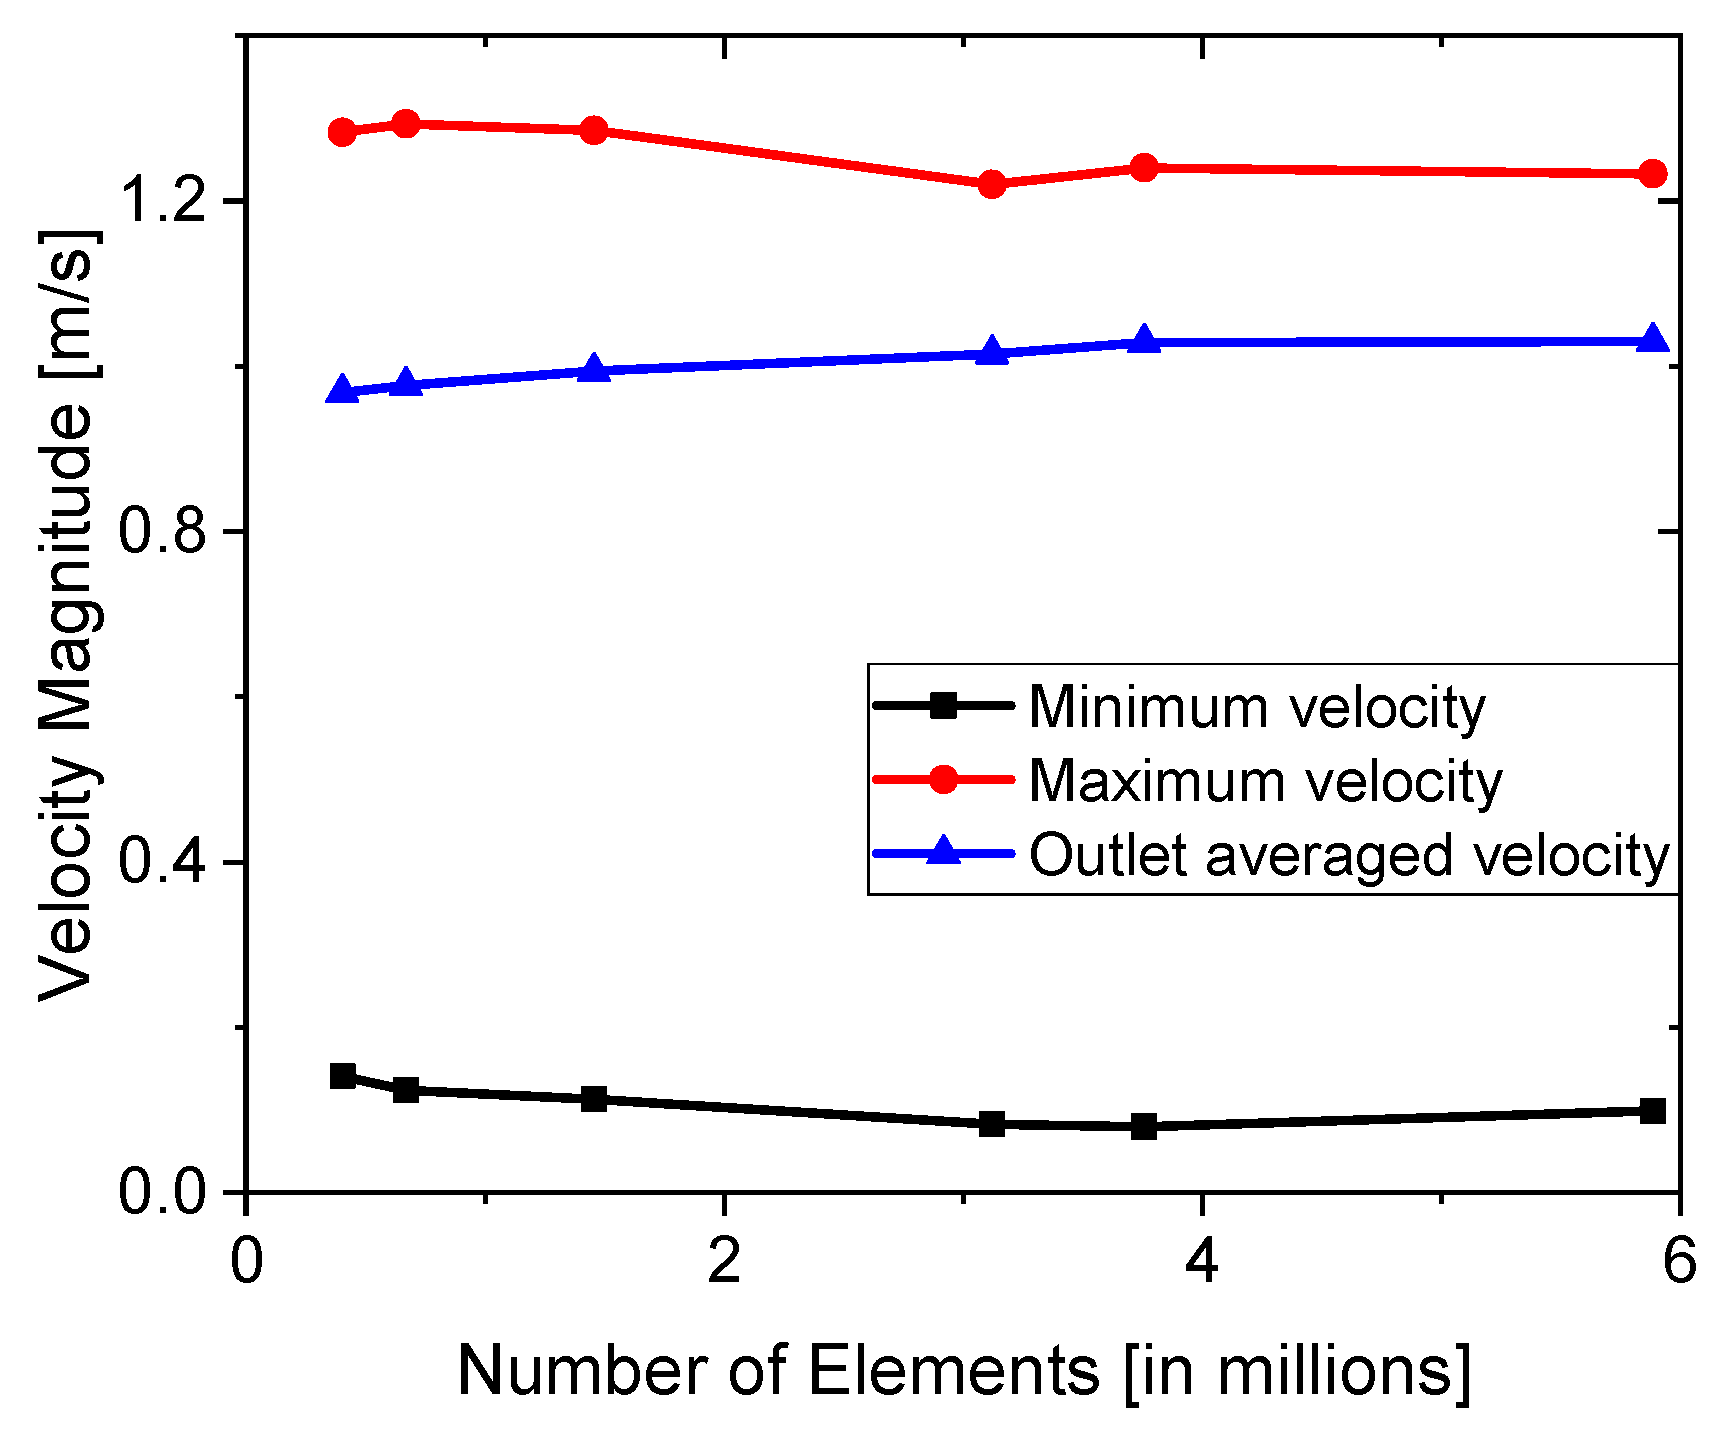
3.1. Grid Independence Test

The build chamber geometry was created in SolidWorks and imported into the ANSYS workbench to generate multiple meshes using four-node linear tetrahedron elements. Large gradients near the build chamber walls were captured by using five inflation layers with a growth rate of 1.1 that necessitated the use of additional six-node linear wedge (prism) elements near the walls. Six grid resolutions with various element sizes were generated with total elements within the grid varying between 0.4 and 5.88 million elements (Figure 2, each data point represents a grid). All six meshes were used for simulating the flow field within the build chamber and tracking the maximum, minimum velocity magnitudes at the center plane (67.5 mm above the build plate, XZ plane) and the area-weighted average outlet velocity. The maximum, minimum, and outlet velocity magnitudes start to stabilize at the mesh size representing 3.12 million elements (Grid 4). Moreover, the velocity contour at the outlet for Grid 4 matches with the finer grids (Grids 5 and 6) thereby confirming the grid-independent solution. Therefore, Grid 4 with 3.12 million elements has been used for further simulations in this work (Figure 2). For the grid independence test and validation, the air was selected as the working fluid.

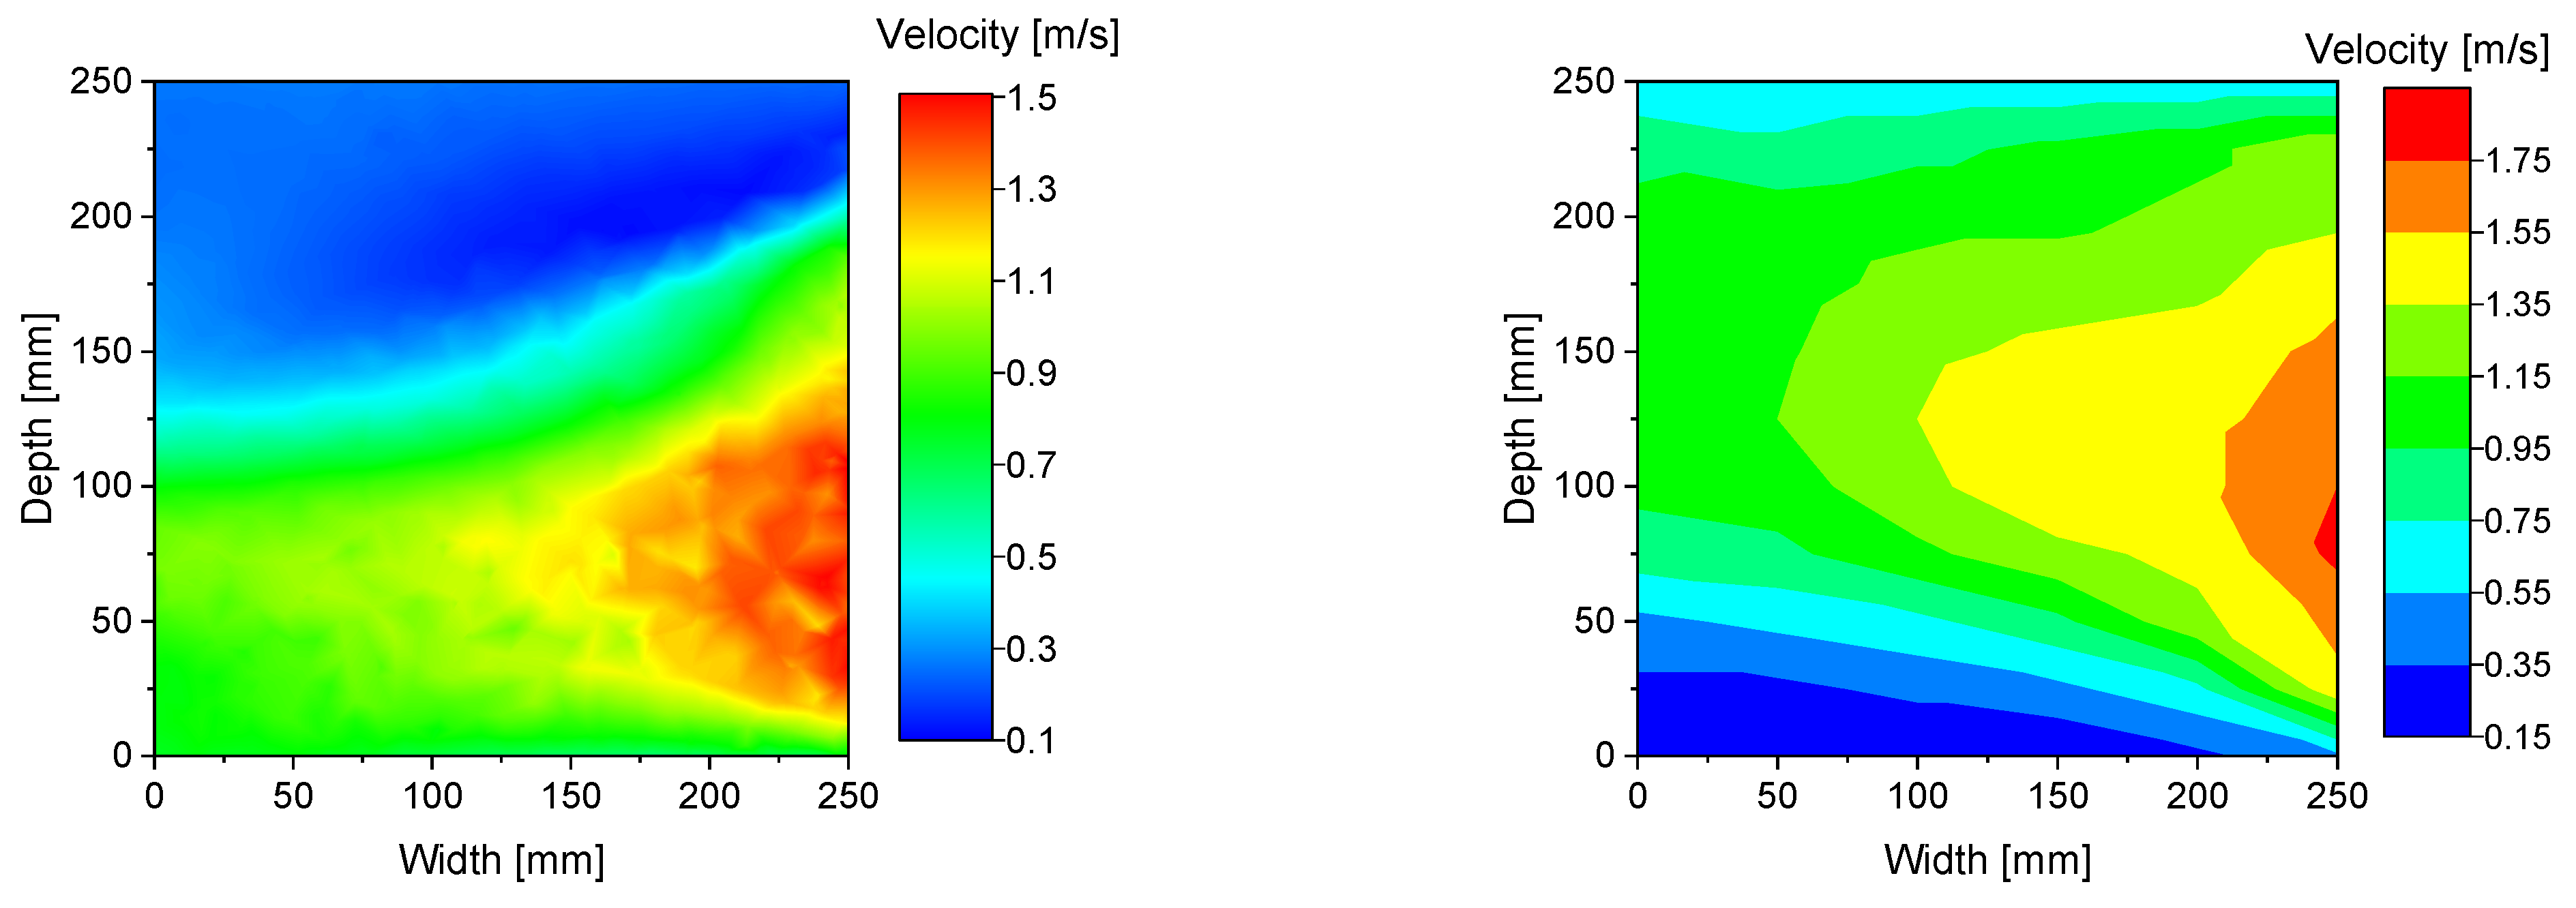
3.2. Model Validation

The simulation results are compared with an earlier experimental work that characterizes the flow within a similar Renishaw AM250 build chamber with air as the working fluid [14]. Both the standard k-ε and realizable k-ε turbulence models have been used in previous studies [13,14,17] to model the turbulent flow within the build chamber. Although the predictions of both the standard k-ε and realizable k-ε models agree qualitatively with the experimental data (not shown here), the realizable k-ε model was used in this work as it had better quantitative agreement with the peak velocity magnitude measured experimentally (Figure 3). For reference, a peak velocity magnitude of 1.22 m/s was obtained using the standard k-ε standard model while it was 1.5 m/s for the realizable k-ε model.

4. Results and Discussion

Although the air was used as the working fluid for the validation studies, argon is the inert gas of choice in a majority of SLM machines for carrying away the spattering particles and vapor fumes from the build plate region. Therefore, argon has been used as the working fluid in the rest of the simulations discussed in this study. Although gas flow rates of 250 LPM are typically used in SLM machines, it is desirable to obtain the highest volume flow rate possible beyond which the metal powder from the build plate starts to get blown away. Therefore, the current section starts by computing the upper limit for the gas flow rates followed by a discussion on the effect of gas flow rates and spatter properties. The thermophysical properties for the inert gas and spatter particles (316L and AlSi10Mg) considered in this work are presented in Table 1.

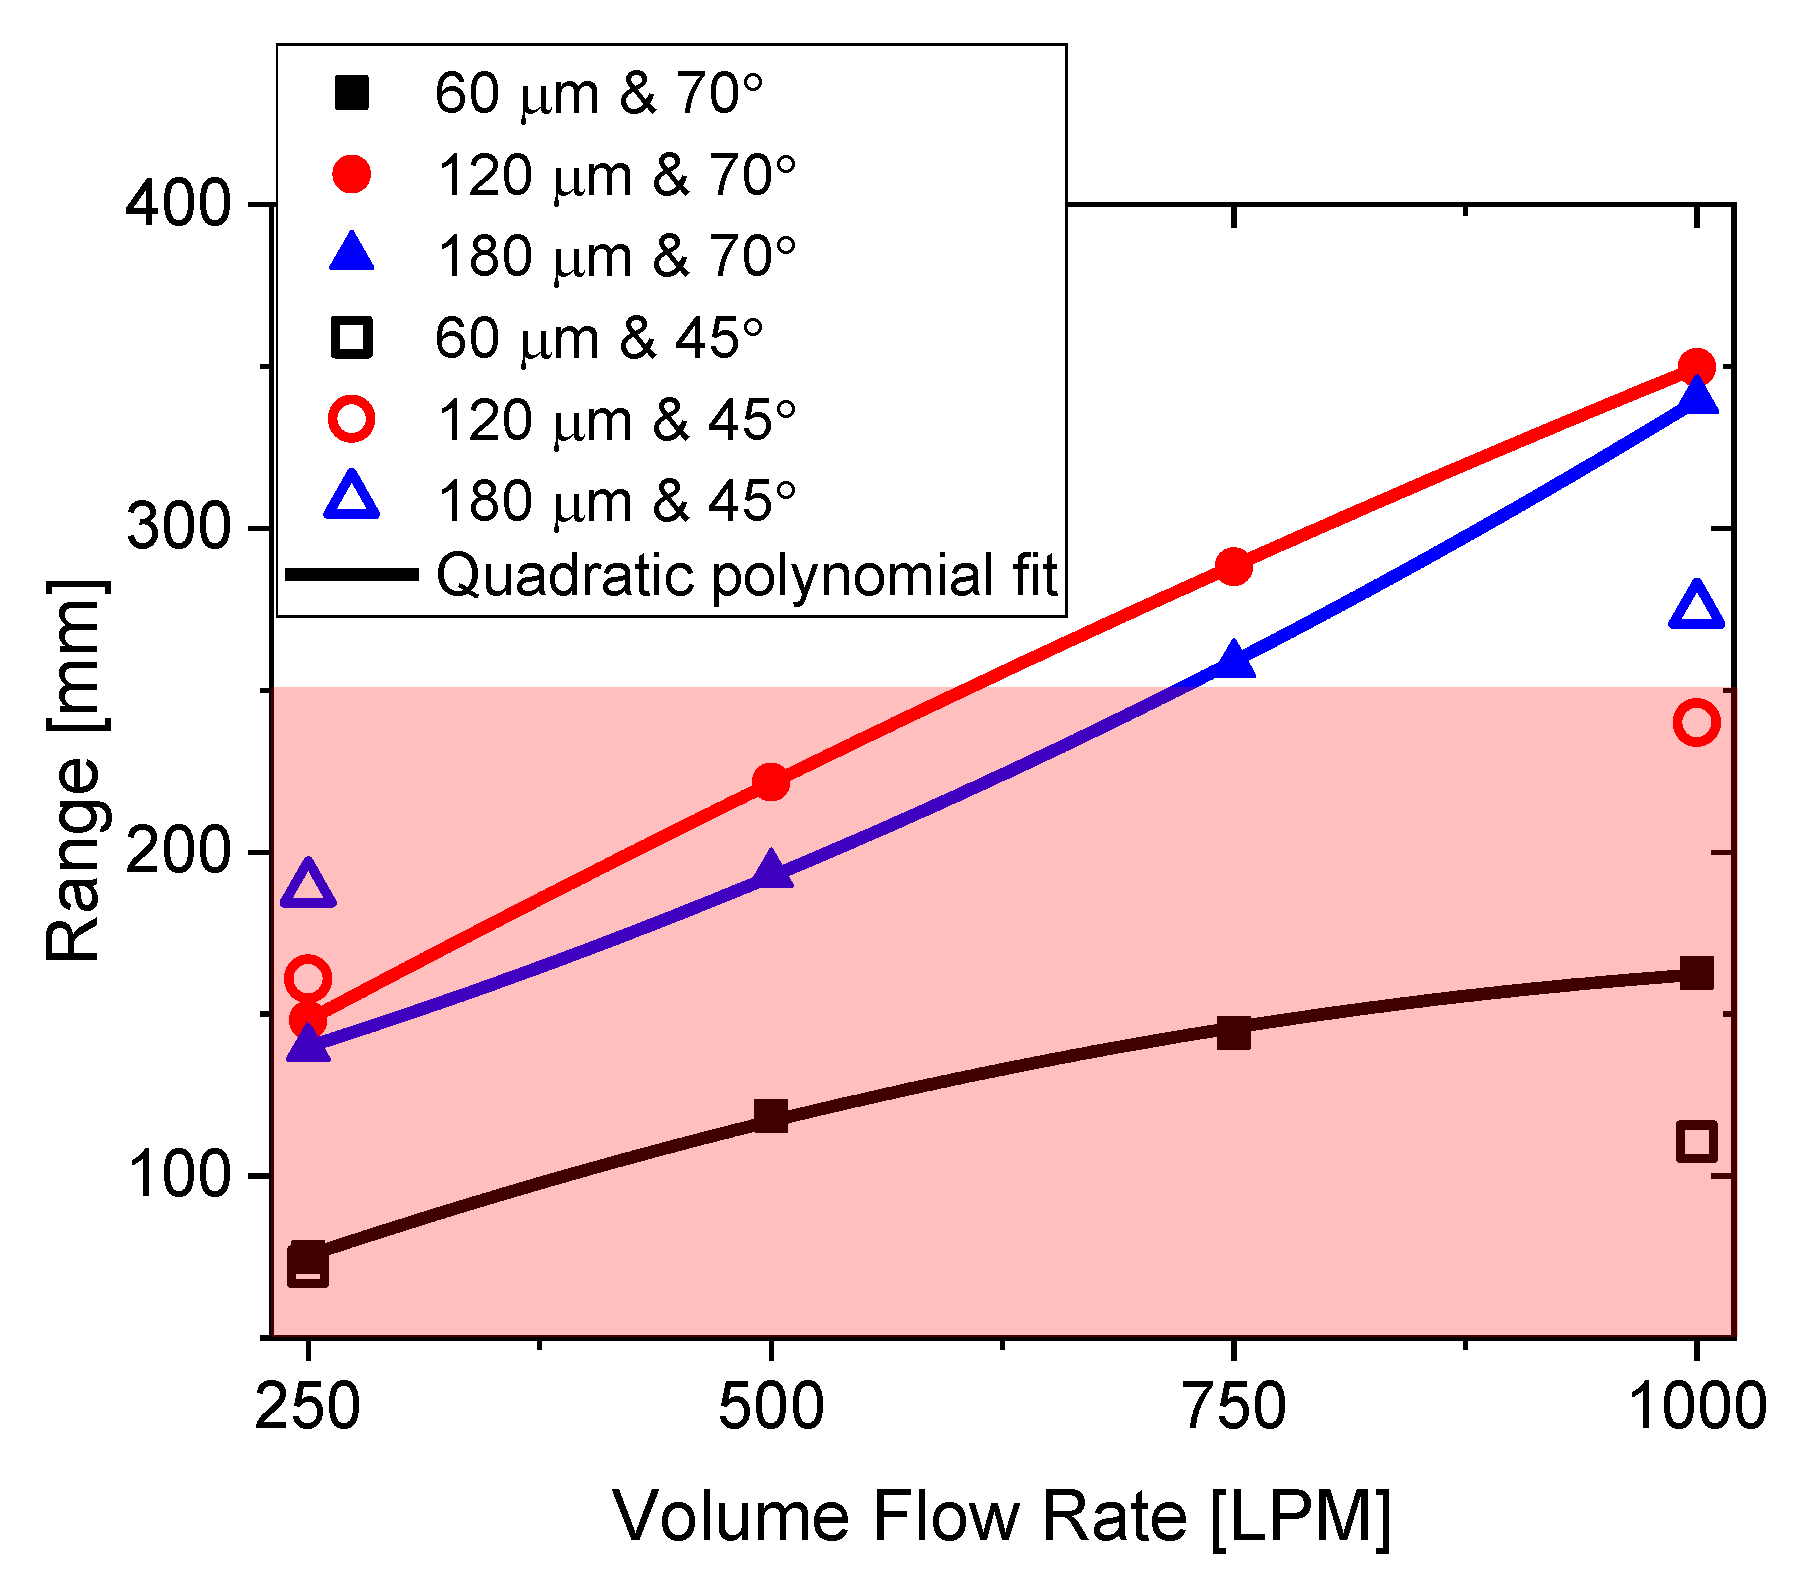
4.1. Upper Limit for Inlet Flow Rates

The threshold velocity beyond which the virgin powder on the powder bed starts to blow away is calculated assuming the powder bed consists of dry spherical particles that are loosely spread over a dry surface. The analytical expression is valid for idealized soils that satisfy the aforementioned assumptions in which case the threshold velocity becomes solely a function of powder particle diameter. Considering the metal powder particles spread on the build plate, the drag and lift forces experienced by the powder particles are balanced by gravitational and other forces including the particle cohesive force [20]. The analytical expression validated for powder diameters between 10 μm and 3000 μm has been used to compute the threshold velocity for argon for multiple powder sizes. The threshold velocity has been computed for powder diameters between 10 and 180 μm as 180 μm corresponds to the largest spatter size considered in this study. Threshold velocities have been calculated for two commonly used materials, namely stainless steel 316L (SS 316L) and aluminum alloy (AlSi10Mg), to predict the effect of powder density on the argon threshold velocity. Along expected lines, metal powder with lower density has a lower threshold velocity; however, the threshold velocity decreases with increasing powder size before stabilizing and having a weak dependence on powder diameter (Figure 4). This interesting phenomenon is due to the two competing forces of aerodynamic drag/lift versus the cohesive and gravity forces that dominate at different powder sizes. For both the powder materials, the threshold velocity becomes weakly dependent on powder diameter beyond 60 μm. Since for both materials, decreasing the powder diameter significantly increases the threshold velocity, lowering virgin powder sizes could potentially be used to achieve a better spatter removal rate. Due to the higher threshold velocity possible for the higher density SS 316L powder particles, they were considered in this study for computing spatter trajectories.
The effect of flow rate on spatter trajectories has not been thoroughly explored in earlier works with the maximum flow rate limited to 500 LPM. However, based on the threshold velocity calculated for 316L stainless steel from Figure 4, the flow rates within the build chamber can be increased till the maximum velocity magnitude (X velocity) at 1 mm above the build plate reaches 3.4 m/s for a 60 μm stainless steel powder size. The velocity magnitude of 3.4 m/s at 1 mm height above the build plate was obtained by assuming that the turbulent velocity profile in this region follows the log-law velocity profile. Therefore, the upper limit of inlet flow rates based on the threshold erosion velocity turns out to be 1077.5 LPM, which allows the exploration of much larger parameter space in terms of flow rates. Therefore, simulations were performed at 250 LPM intervals in the range of 250 to 1000 LPM.

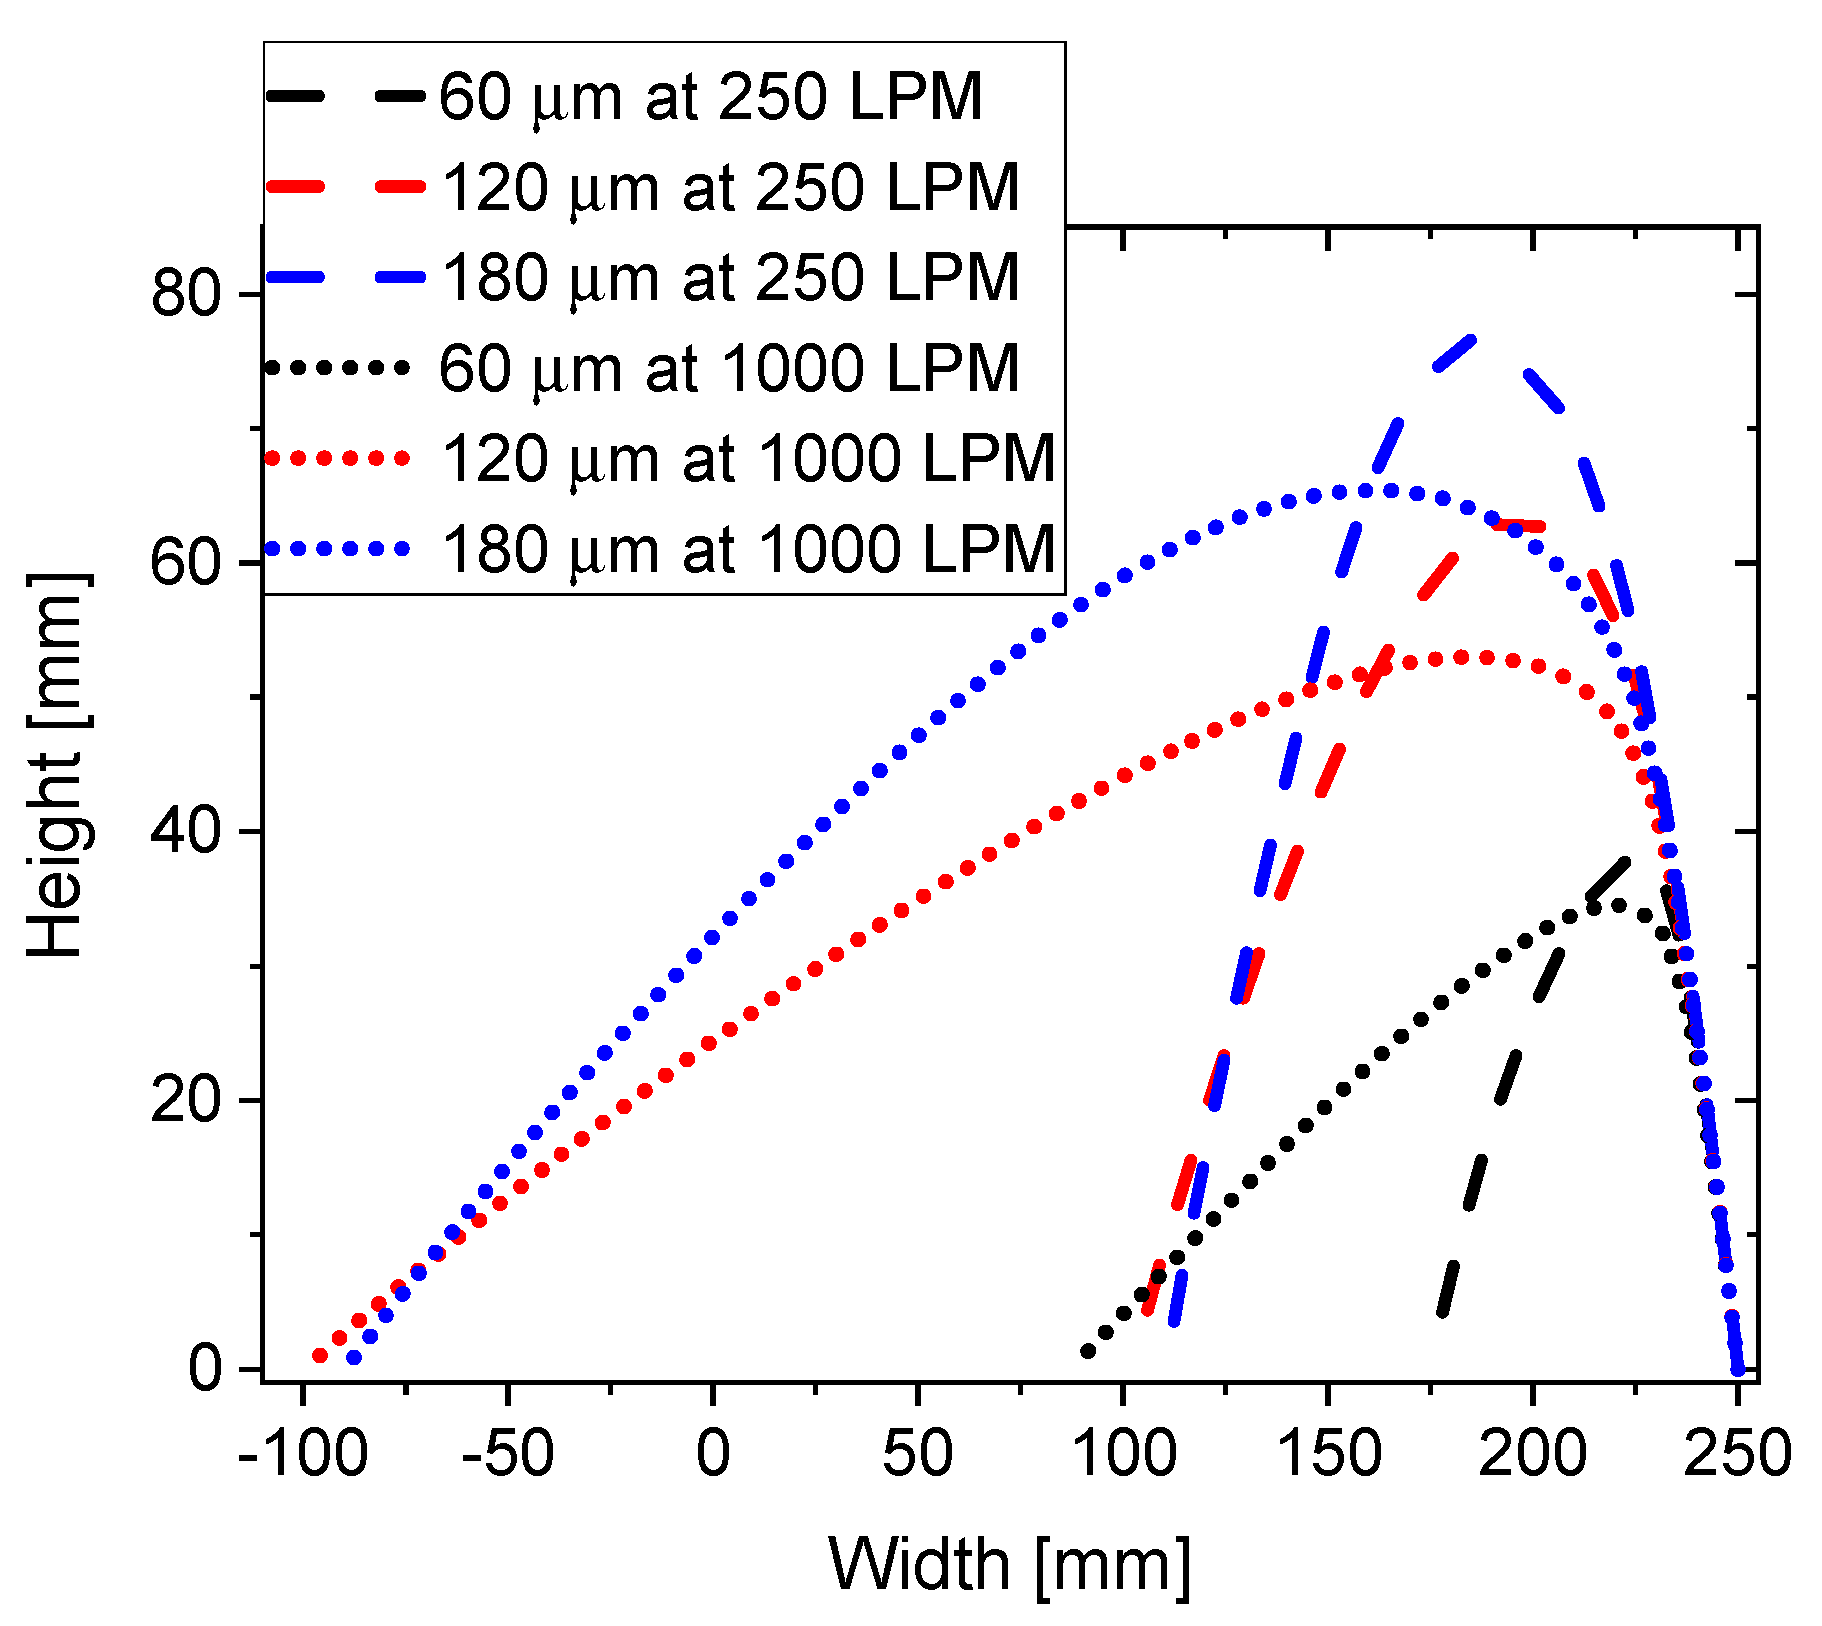
4.2. Effect of Inert Gas Flow Rates

Before the discussion on the effect of flow rates on the velocity profiles within the chamber, it is pertinent to obtain a better understanding of the inert gas flow profiles within the vertical plane (XY plane in Figure 1) for the baseline case of 250 LPM. The velocity magnitude in the central vertical plane shows the Coanda effect observed in similar build chamber geometries in earlier works [14,15,16,17] with the gas flow coming out of the nozzle and moving downwards towards the build plate (Figure 5). The gas flow reaches near the bottom wall of the chamber with the majority of the flow exiting through the outlet while some part of the flow undergoes recirculation.
The gas flow profiles within the build chamber were computed for multiple flow rates to evaluate the effect of inlet volume flow rates in the build plate region. The velocity profiles have been plotted at the center plane (XZ plane at a height of 67.5 mm height above the build plate in Figure 1) corresponding to the center of the inlet nozzles and the central vertical plane (XY plane) bounded to a height of 135 mm above the build plate to focus on the velocity profiles exclusively in and around the build plate region (Figure 6 and Figure 7). The normalized velocity profile in the center plane (Figure 6) indicates similar qualitative behavior across the two extreme flow rates of 250 and 1000 LPM with a peak velocity observed near a depth of about 75 mm from the front of the center plane. Low-velocity regions are observed near the rear of the center plane which makes it a region susceptible to spatter deposition as observed earlier by Ferrar et al. for a build chamber with similar inlet geometry [7].
Velocity profiles in the vertical region above the center of the build plate (XY plane) are presented in Figure 7. The velocity inlet is located at a height of 67.5 mm above the build plate and for both the flow rates; the normalized velocity contour plots indicate similar qualitative behavior. The gas flow follows the chamber geometry and moves downwards towards the build plate as captured earlier in Figure 5. A low-velocity region is formed around 15 to 30 mm above the build plate on its east side for both the flow rates considered here. The effect of this low-velocity region on the spatter trajectory depends on the ejection angle and has been discussed in Section 4.3.
The similar velocity profiles observed for the two extreme flow rates considered above indicated that the flow behavior remains qualitatively similar irrespective of the gas flow rate in the range considered in this study. To understand the flow behavior at other flow rates, the maximum velocity in the center plane has been plotted for all the flow rates considered in this study (Figure 8). The maximum velocity has been plotted at the center plane and an XZ plane located 1 mm above the build plate. The plane located 1 mm above the build plate has been selected as it lies within the log-law region and provides an indication of the acceptable gas flow rates below which the gas does not blow away the metal powder on the build plate. In turbulent flow, the region near the wall where the average flow velocity at any location is proportional to the logarithm of its distance from the wall is referred to as the log-law region. For the virgin powder diameter of 60 μm considered here, the maximum velocity at 1 mm above the build plate is reached at the gas flow rate of 1077.5 LPM, slightly higher than the maximum flow rate of 1000 LPM considered here. As expected from the velocity contour plots presented earlier in Figure 6 and Figure 7, the maximum velocity in both the planes increases linearly as a function of volume flow rate indicating qualitatively similar flow behavior across the range of flow rates considered here. The correlation for predicting the maximum velocity in the center plane and the plane located 1 mm above the build plate is shown in Figure 8 and can be used for predicting the maximum velocity at other flow rates between 250 and 1000 LPM.

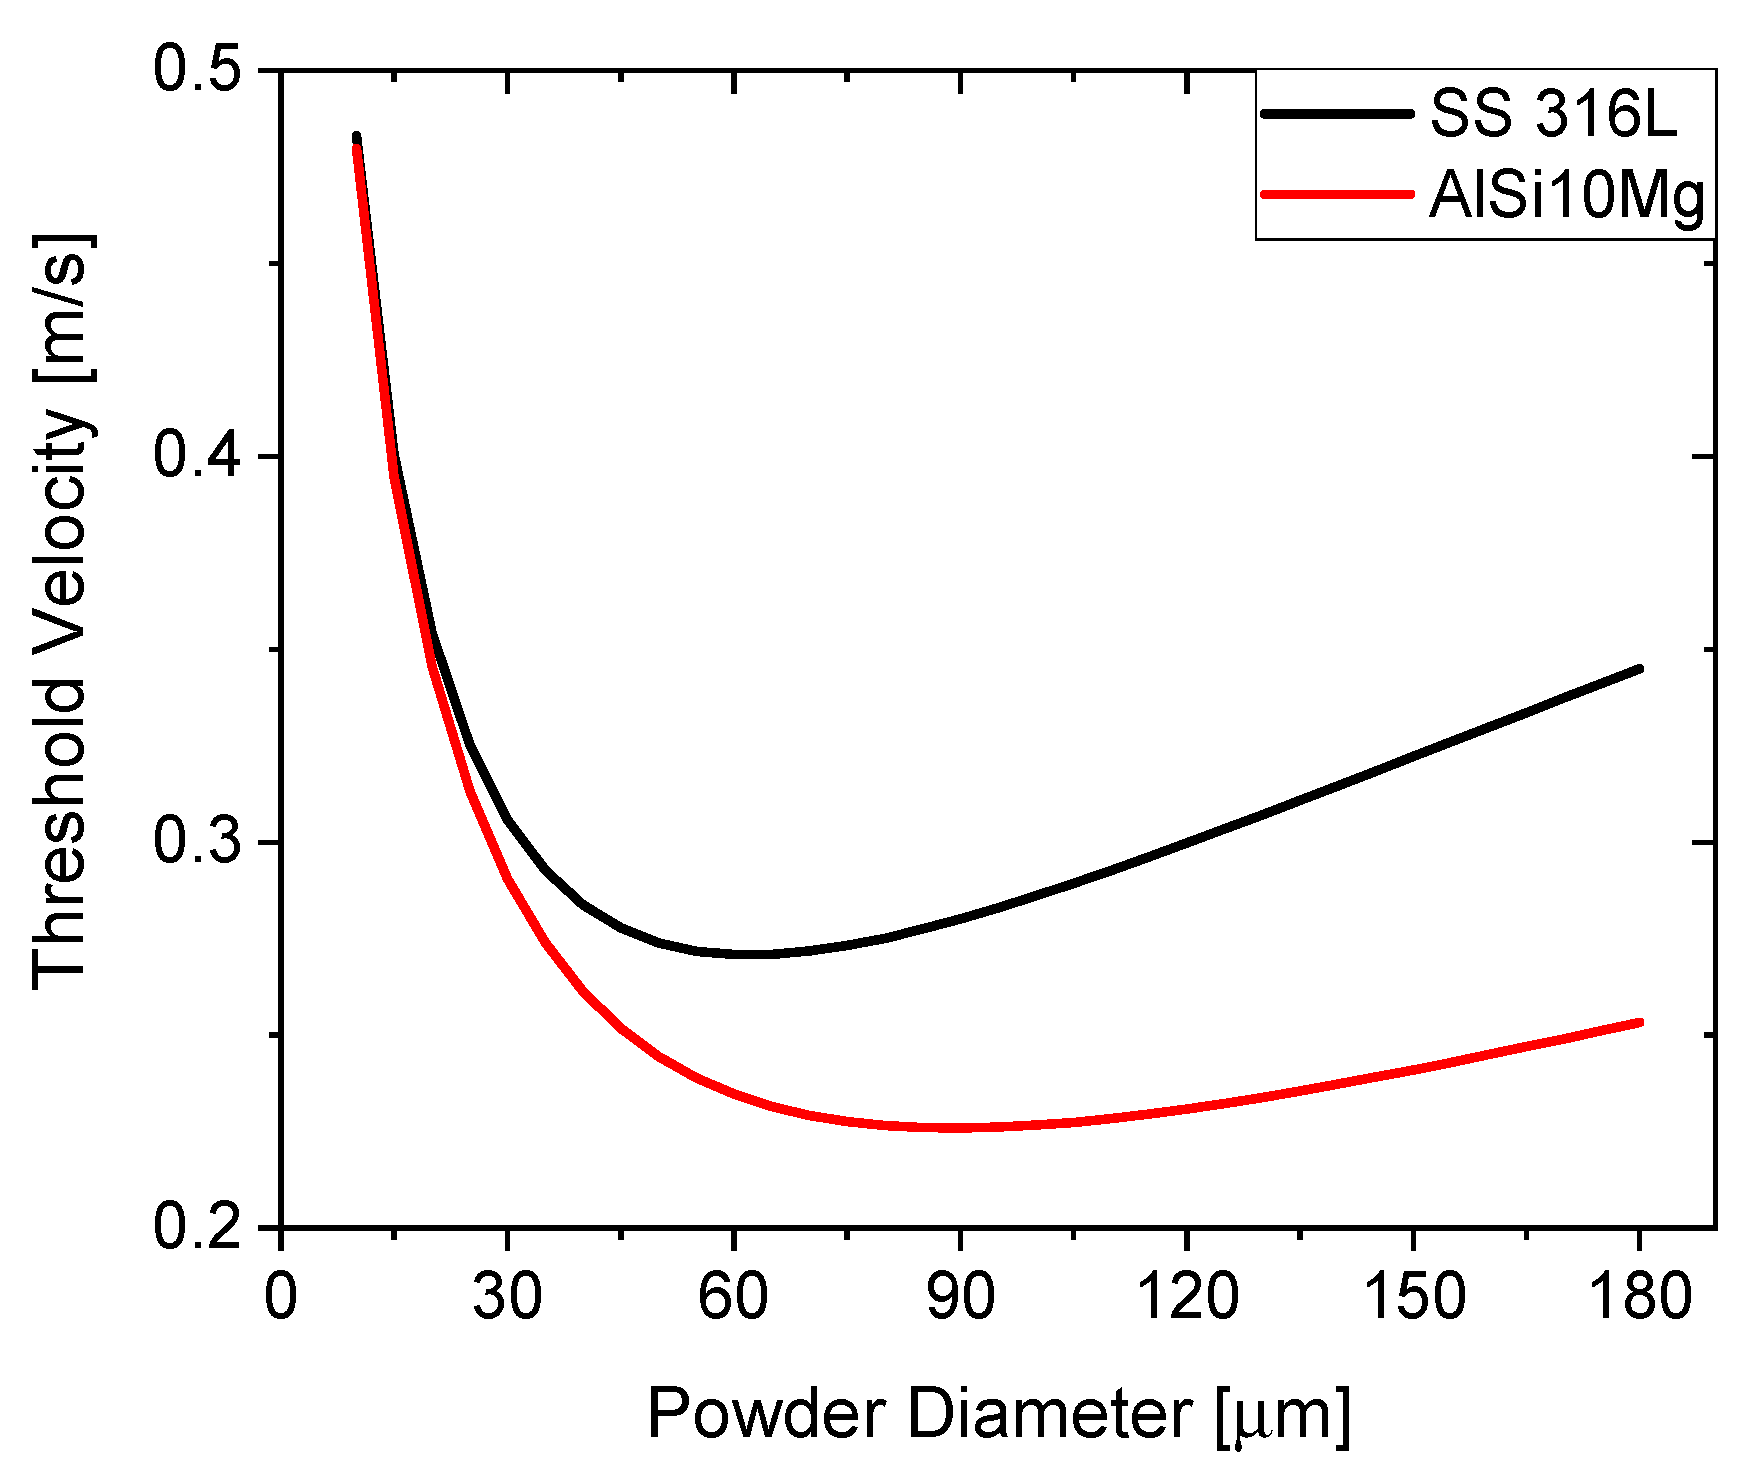
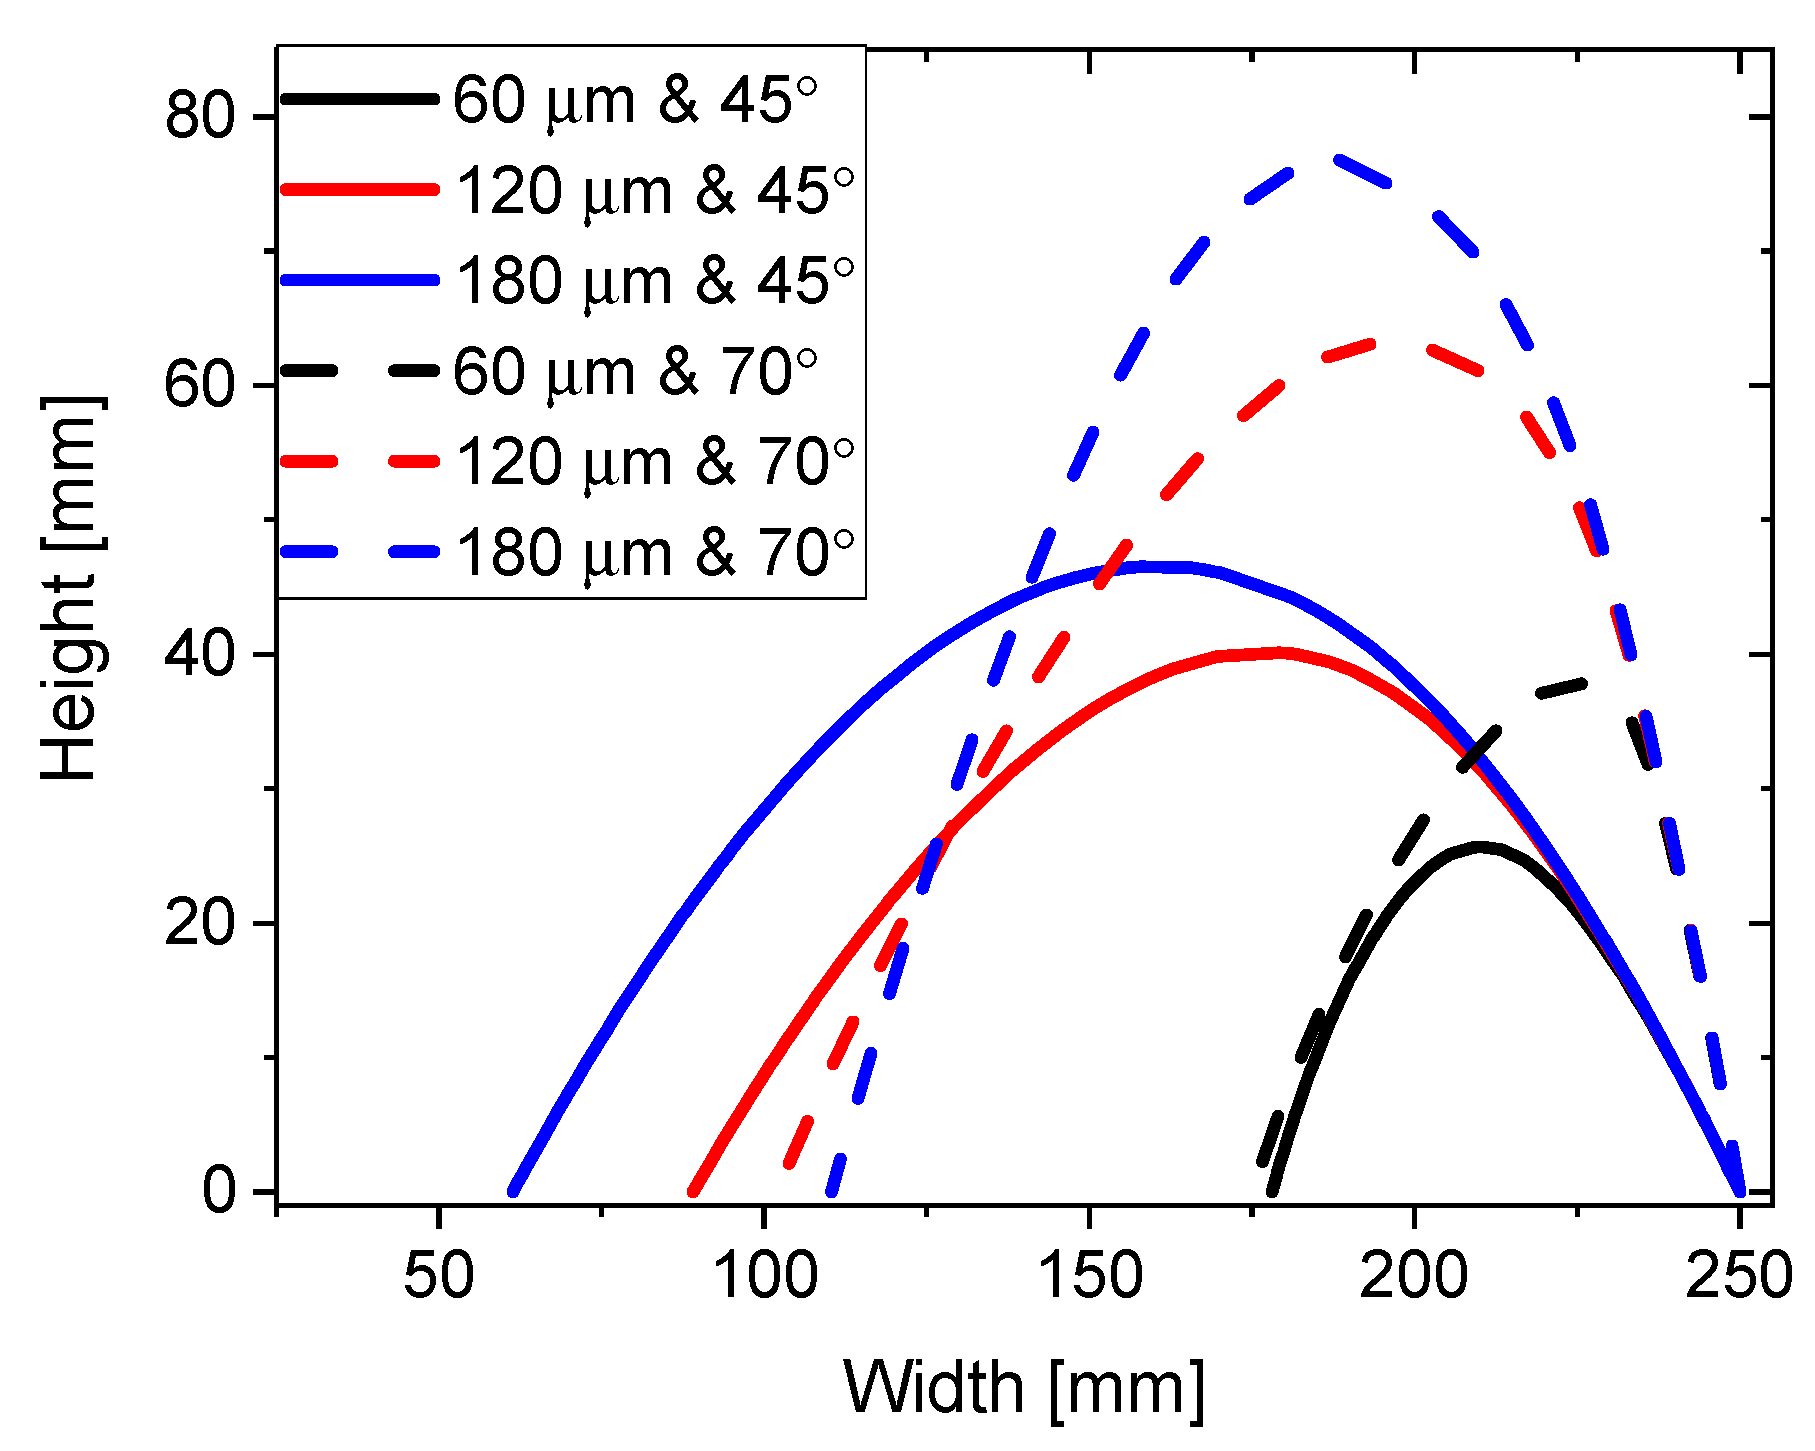
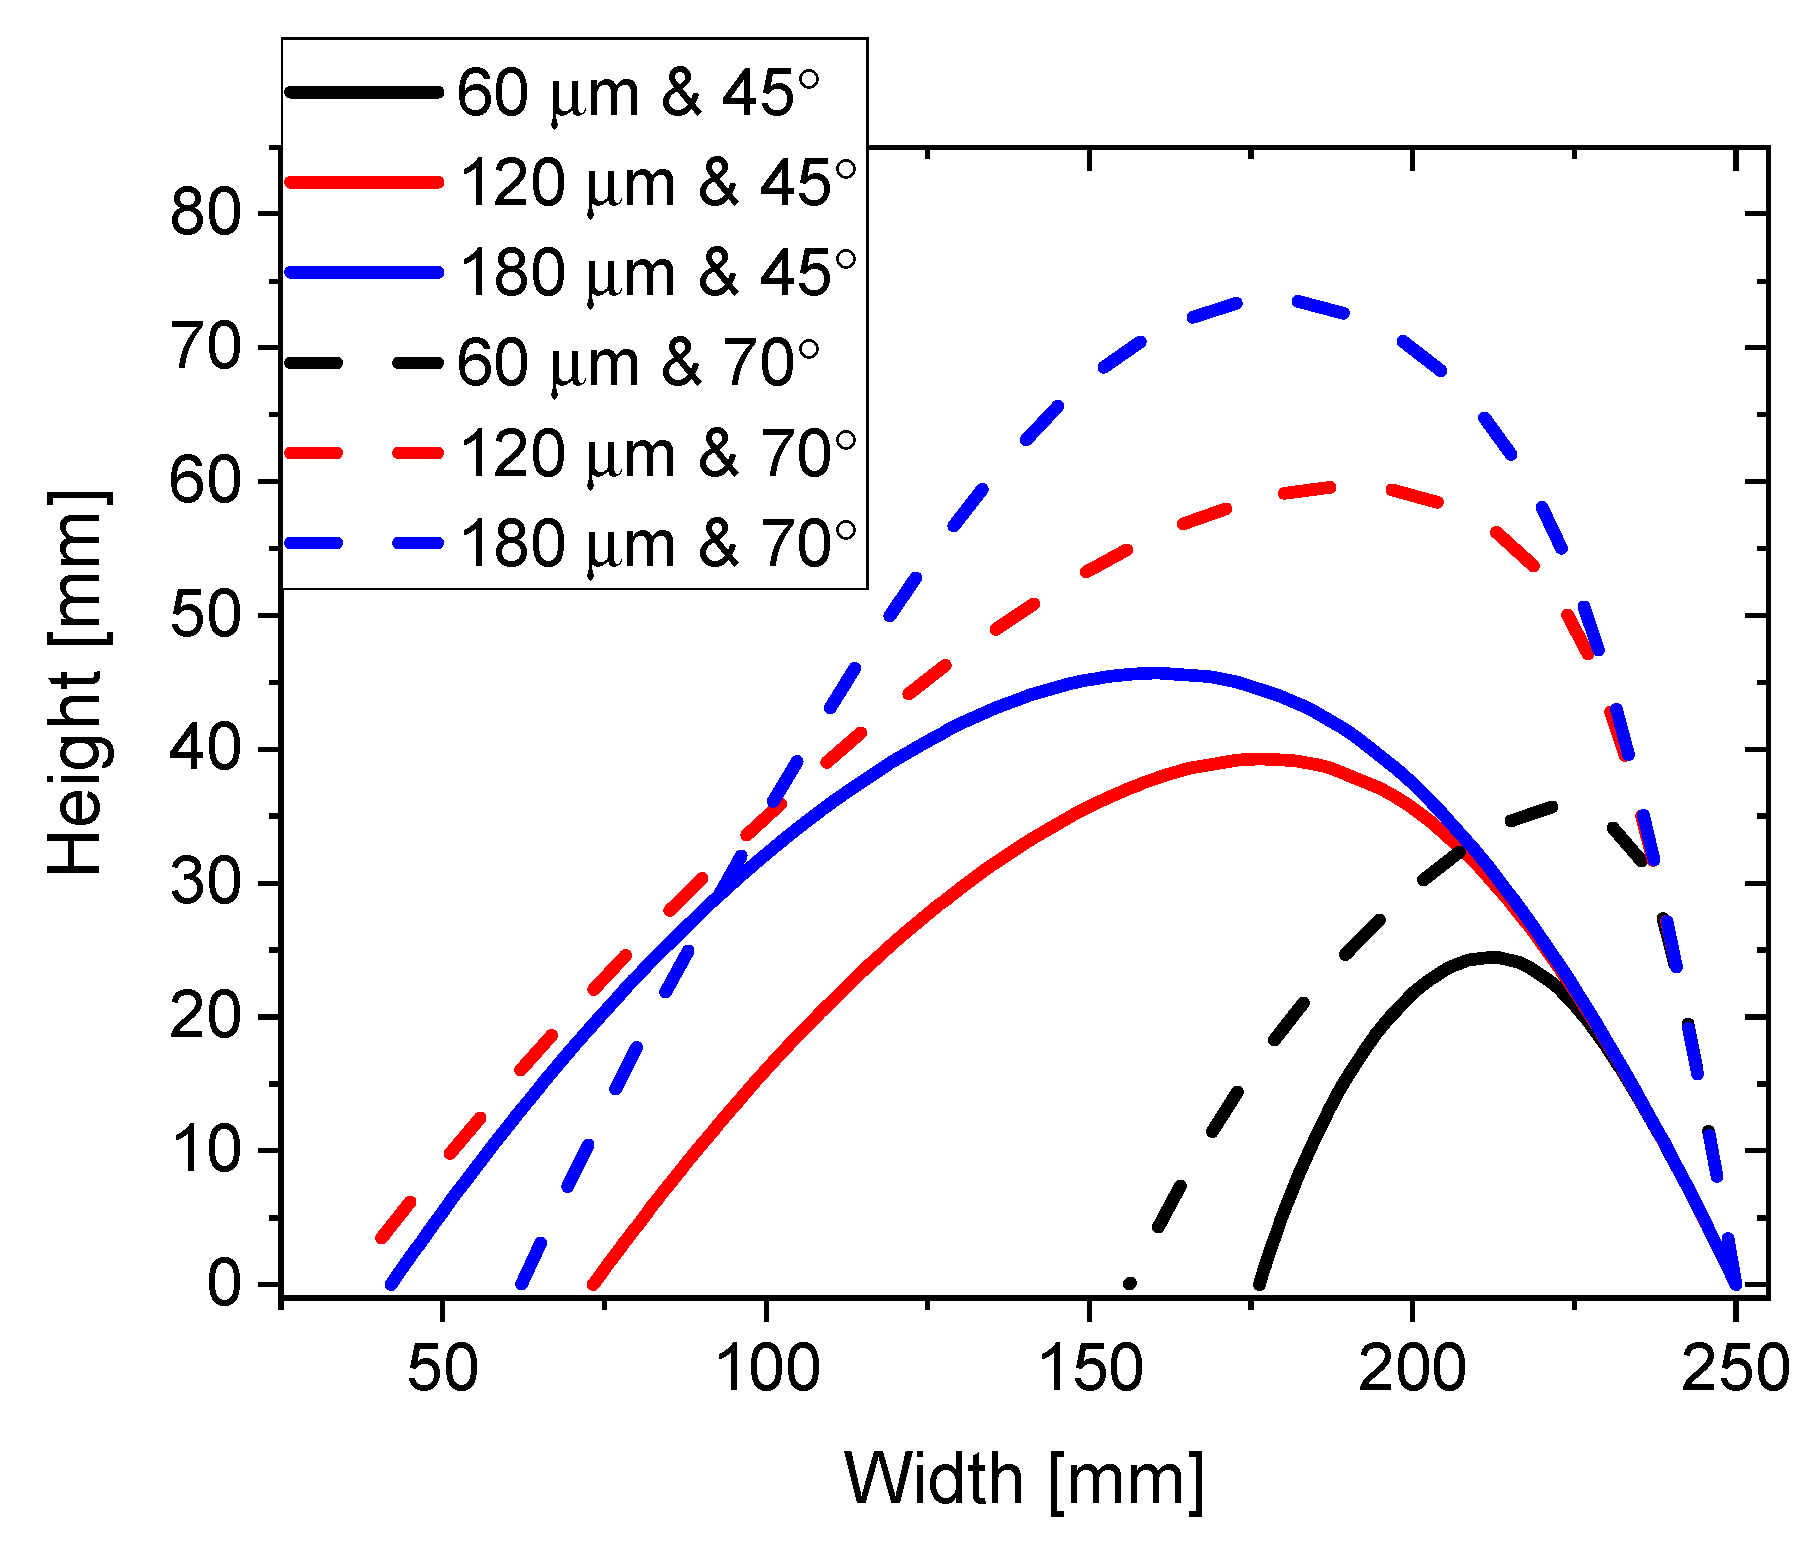
4.3. Effect of Spatter Diameter and Ejection Angle

In SLM processes, spatter is ejected from the melt pool as well as from the powder bed. The spatter ejection speed and angle can vary over a large range depending on its formation mechanism. The ejection angle/speed of the spatter which is driven by vapor plume is largely related to the keyhole morphology, which itself depends on laser operational parameters [21,22]. Since spattering depends on laser process parameters, the experimentally measured spatter ejection speeds and angles for SS 316L powder with laser power of 720 W and scanning speed of 330 mm/s [23] were used in the current work. The spatter ejection speed was found to vary between 1.5 and 35 m/s with the spatter ejection angle between 45° and 70° from the build plate surface. Spatter trajectories predicted by Zhang et al. [17] for the same spatter angles and ejection speeds indicate that more than 90% of the spatter with an ejection speed of 1.5 m/s is re-deposited on the build plate. Therefore, the ejection speed of 1.5 m/s is used in the current study to identify the particle sizes and ejection angles that can cause the deposition of spatter on the build plate under the various flow rates considered here. Moreover, only spatter ejected in the direction of inert gas flow is considered here.
Considering that the virgin powder size is 60 μm, trajectories for spatter diameters of 60 μm, 120 μm and 180 μm have been computed for spatter ejection angles of 45° and 70° at the baseline flow rate of 250 LPM. In contrast to the usual approach of utilizing a distribution of spatter diameters to compute spatter trajectories, specific spatter diameters have been considered here to tease out the effects of competing forces i.e., the gravitational force and the drag force on the evolution of spatter trajectory. The lowest spatter diameter is limited by the size of the virgin powder (60 μm) and the largest spatter diameter of three times the virgin powder size is considered as such over-size spatters have been measured experimentally for 316L stainless steel parts produced using the SLM method [4].
To compare the particle trajectories, ejection of spatter is assumed to be occurring only from the center of the eastern edge of the build plate (Figure 1) as the particles ejected from this location have to travel the longest distance (250 mm) to cross the build plate. Spatter trajectories for two spatter ejection angles and three spatter diameters have been computed for 250 LPM gas flow rate and are shown in Figure 9. Due to the same ejection speed of 1.5 m/s, the spatter momentum is a function of the particle size and is different for the three spatter sizes. Except for the spatter size of 60 μm, spatter particles ejected at 45° travel a longer horizontal distance (range) compared to ejection angle of 70° with particles of 180 μm diameter reaching a range of about 189 mm. For ejection angle of 70°, although the range for 120 μm spatters decreases compared to ejection angle of 45°, it is still higher than the range for 180 μm diameter. This is due to larger diameter spatter experiencing a stronger gravitational pull at higher ejection angles. Additionally, the larger spatter size reaches a higher altitude due to its larger initial momentum and thereby experiences a lower drag force than 120 μm spatter as the downward-facing high-velocity gas flow is centered at a height of about 50 mm at a build plate width of 200 mm (Figure 7). For the gas flow rate of 250 LPM, all the spatter particles considered here have a range smaller than the build plate width of 250 mm and get deposited on the build plate, which is undesirable. A closer inspection of spatter particle trajectories at 250 LPM indicates a close resemblance to the classical projectile trajectories observed in the absence of drag force, thereby indicating a negligible influence of the drag force imparted by the gas flow at this flow rate.
The spatter ejection angle of 70° was used to evaluate its influence on the spatter range at various gas flow rates. Particle trajectories for the three spatter diameters are presented for two extreme flow rates of 250 LPM and 1000 LPM in Figure 10. The increased gas flow velocity at 1000 LPM drastically changes the evolution of trajectory away from the classical projectile trajectory showing the strong effect of the drag force imparted by the gas flow. The range for all spatter sizes is significantly increased at a gas flow rate of 1000 LPM. Interestingly, the range for 120 μm spatter is still slightly larger than 180 μm spatter. A similar trend of an increased range is observed for the 45° ejection angle at 1000 LPM gas flow rate with the range being largest for the 180 μm as observed earlier. A closer inspection of Figure 10 also reveals that the spatter trajectory for 1000 LPM deviates from the trajectory corresponding to 250 LPM only beyond a height of 30 mm above the build plate for all particle sizes. This is due to the low-velocity region extending until about 30 mm above the build plate (see Figure 7). Above 30 mm height, the increased gas flow velocity imparts a larger drag force and transports the spatter particles over a larger range.
The spatter range for ejection angle of 70° has been plotted for various flow rates and spatter sizes considered in this study (Figure 11). Spatter particles of all sizes are deposited on the build plate for gas flow rate of up to 500 LPM with spatter particles of 60 μm diameter having a range smaller than 164 mm for all ejection angles and gas flow rates considered here. Only spatter particles of 120 μm and 180 μm diameter is transported away from the build plate region provided the gas flow low rates of 750 LPM or higher are used. At higher flow rates, the range for 45° spatters ejection angle is smaller than the range for 70° as the spatter ejected at 70° reaches a higher altitude and is carried away by the relatively high inert gas velocity above 30 mm height (Figure 7). Therefore, the spatter ejected at 70° represents the upper limit of the spatter range at higher flow rates (≥ 500 LPM) whereas the 45° ejection angle represents the upper limit of the range for the flow rate of 250 LPM.
A quadratic polynomial equation has been used to fit the range (in mm) for spatter ejection angle of 70° for the three-particle diameters considered here:
For spatter size of 60 μm:
R a n g e 60 = 21.425 + 0.24127 × V F R 1.00484 × 10 4 × V F R 2 .
For spatter size of 120 μm:
R a n g e 120 = 69.05 + 0.3286 × V F R 4.8 × 10 5 × V F R 2 .
For spatter size of 180 μm:
R a n g e 180 = 101.3575 + 0.12651 × V F R + 1.1164 × 10 4 × V F R 2 ,
where VFR is the gas volume flow rate in LPM. The range for different spatter sizes indicates that spatter sizes below 60 μm will deposit on the build plate even at inert gas flow rates as high as 1000 LPM. Spatter between 120 and 180 μm diameters is carried away from the build plate for specific inert gas flow rates and ejection angles with ejection angles of 45° or lower leading to deposition of 120 μm spatter on the build plate even for the highest inert gas flow rate of 1000 LPM. Overall, higher ejection angles are favored for the current geometry due to the presence of a low-velocity region in the 15 to 30 mm height range above the build plate that reduces the range for spatter ejected at smaller ejection angles. Therefore, the correlations presented above are useful in providing an insight into the build plate regions that are most susceptible to sputter deposition and a similar procedure can be utilized for multiple ejection locations to develop detailed spatter deposition maps for improving part repeatability and reliability.

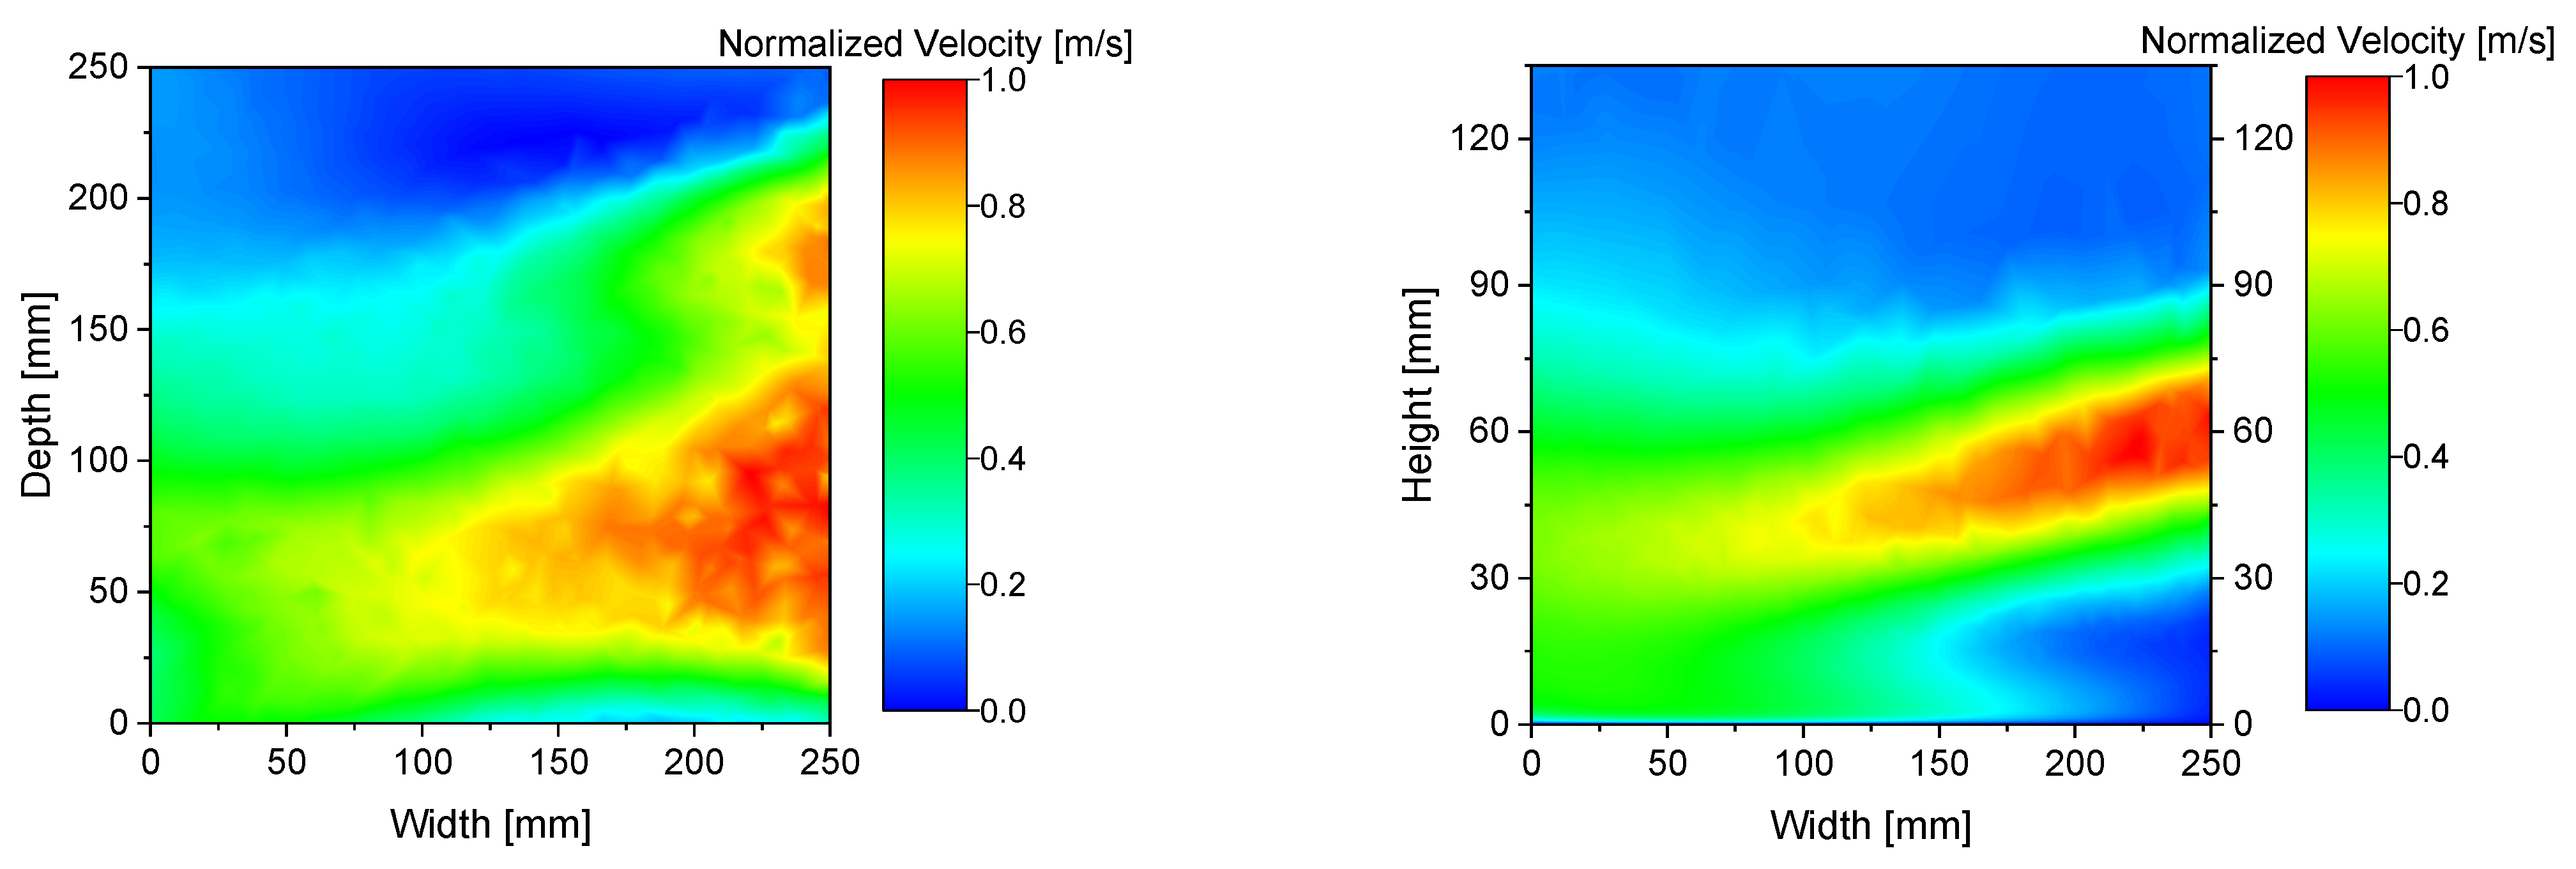
4.4. Velocity Profiles and Particle Trajectories for Improved Design

Philo et al. [14] mentioned that an improvement in flow uniformity and spatter removal rate can be achieved by reducing the nozzle diameter of the gas flow inlets. However, no details were provided relating the diameter of the inlet nozzles to the change in velocity contours, pressure or the improvement in spatter removal. As the focus of this work is on identifying possible routes to improve spatter removal with minimal changes to the build chamber design, the effect of reducing inlet nozzle diameter to 6 mm is investigated for the gas flow rate of 250 LPM. Reducing the diameter of the inlet nozzle from 12 mm to 6 mm is a simple task that can be readily achieved by using a sleeve to block a part of the inlet nozzle used in the baseline design. Reducing the nozzle diameter with the same inlet flow rate of 250 LPM will certainly increase the gas velocity at the inlet, however, the resulting changes in velocity contours and spatter range need to be investigated.
The normalized velocity profiles in the center plane and the central vertical plane have been presented in Figure 12 for the case with reduced inlet nozzle diameters of 6 mm. The velocity profiles in the vertical plane follow the same trend as the baseline design with the gas flow moving downward towards the build plate. However, the low-velocity region identified between 15 and 30 mm height in Figure 7 for the baseline design is extended down to the build plate for the reduced nozzle diameter case. The velocity profiles in the center plane indicate a more uniform velocity distribution with the low-flow region reduced as compared to the base case (Figure 6). Additionally, multiple peaks in the velocity stream are observed that extend over a depth exceeding 200 mm thereby creating a more uniform flow. Compared to the center plane of the baseline design, the reduction of nozzle diameters increases the peak velocity to 2.61 m/s representing a 64% increase in velocity for the same inlet argon flow rate of 250 LPM. Higher velocity in the center plane is expected to lead to a larger range for the spatter for the same inlet flow conditions and has been presented in Figure 13 for different ejection angles and spatter diameters.
Due to the significantly increased gas flow velocity and drag force for the same inlet flow rate of 250 LPM, the range is larger for all spatter particles at all ejection angles compared to the base case (Figure 13). To put the increased velocity in perspective, the gas flow rate has to be increased to 407.7 LPM in the baseline design to achieve the same maximum velocity of 2.61 m/s as obtained in the center plane for the modified design. An increase in the ejection angle from 45° to 70° increases the range for spatter sizes of 60 μm and 120 μm while the range is reduced for the spatter size of 180 μm. The aforementioned observations regarding spatter trajectories are attributed to the specific inlet height and the interplay between the competing gravitational and drag forces. For each ejection angle, the trends of spatter trajectories are similar to what has been observed earlier, i.e., the range increases with particle size for 45° ejection angle and the range for 120 μm spatter size is higher than the range for 180 μm spatter for 70° ejection angle. Notably, the spatter particles of 120 μm or larger diameter have a range larger than 175 mm for both the extreme ejection angles considered here, thereby suggesting that the majority of the build plate is clear of such particle sizes ejected at speed of 1.5 m/s or higher.
To summarize, there are multiple options available to transport the spatter away from the build plate. Drag force is the dominant mechanism responsible for the transport of spatter and can be increased either by increasing the gas flow rate or by reducing the inlet nozzle diameter. Appropriate powder size and laser process parameters can also be selected, whenever possible, to tune the spatter size and ejection angles and thereby improve the spatter removal rate. Depending on the ease of implementation of the aforementioned options, the spatter trajectory correlations presented here can be used to identify the regions of the build plate that will remain unaffected by the spatter and the SLM process may be limited to that space to achieve improved mechanical properties. Lastly, for processes where spatter ejection angles below 45°are expected, it may be worthwhile to consider reducing the height of the inlets to increase the inert gas velocity at lower heights and thereby improve the chances of spatter depositing beyond the build plate.

5. Conclusions

A majority of spatter particles and other by-products of the selective laser melting (SLM) process are typically carried away from the critical build plate region by flowing an inert gas through the build chamber. However, the inert gas flow is not always successful in removing all the spatter from the build plate region. The current work focuses on numerically modeling the interaction between the inert gas flow and spatter particles by using the Eulerian-Lagrangian approach. Since the drag force imparted by the inert gas flow plays a decisive role in the evolution of spatter trajectories, the gas flow rate was varied between 250 and 1000 LPM. For all the flow rates considered here, the velocity profiles in the center plane and vertical plane remained qualitatively similar indicating no changes in flow structure. Subsequently, spatter particles of different sizes were ejected at 45° and 70° ejection angles to predict the spatter trajectory and range at various inert gas flow rates. For the ejection speed and location considered here, all spatter particles below 60 μm diameter deposit on the build plate with the largest range being less than 164 mm. Spatter particles between 120 and 180 μm size travel beyond the build plate region only for inert gas flow rates of 750 LPM or higher and ejection angles approaching 70°. Lastly, the effect of reducing inlet nozzle diameter to 6 mm on the velocity profiles and spatter trajectories was evaluated. At smaller inlet diameters, the range for spatter particles of all sizes is increased due to the increased influence of drag force on the particle trajectories. Moreover, reduction in nozzle diameter also led to increased uniformity in the velocity profiles located in the center plane. The spatter trajectories and inert gas velocity profiles discussed above provide detailed insights into the physics of spatter removal and contribute to a better understanding of the knobs available in the designer’s toolkit to increase spatter removal rate.

Author Contributions

Conceptualization, A.B.S.A. and B.S.Y.; methodology, A.B.S.A. and B.S.Y.; validation, A.B.S.A.; formal analysis, A.B.S.A.; writing—original draft preparation, A.B.S.A.; writing—review and editing, A.B.S.A. and B.S.Y.; project administration, A.B.S.A.; funding acquisition, A.B.S.A. All authors have read and agreed to the published version of the manuscript.

Funding

This research was funded by the Deanship of Research Oversight and Coordination, King Fahd University of Petroleum and Minerals, Dhahran, Saudi Arabia under project # SR191028.

Institutional Review Board Statement

Not applicable.

Informed Consent Statement

Not applicable.

Data Availability Statement

Not applicable.

Acknowledgments

The authors acknowledge the financial support of the Deanship of Research Oversight and Coordination, King Fahd University of Petroleum and Minerals, Dhahran, Saudi Arabia under project # SR191028.

Conflicts of Interest

The authors declare no conflict of interest. The funders had no role in the design of the study; in the collection, analyses, or interpretation of data; in the writing of the manuscript, or in the decision to publish the results.

References

  1. Ladani, L.; Sadeghilaridjani, M. Review of Powder Bed Fusion Additive Manufacturing for Metals. Metals 2021, 11, 1391. [Google Scholar] [CrossRef]
  2. Gor, M.; Soni, H.; Wankhede, V.; Sahlot, P.; Grzelak, K.; Szachgluchowicz, I.; Kluczyński, J. A Critical Review on Effect of Process Parameters on Mechanical and Microstructural Properties of Powder-Bed Fusion Additive Manufacturing of SS316L. Materials 2021, 14, 6527. [Google Scholar] [CrossRef] [PubMed]
  3. Mostafaei, A.; Zhao, C.; He, Y.; Ghiaasiaan, S.R.; Shi, B.; Shao, S.; Shamsaei, N.; Wu, Z.; Kouraytem, N.; Sun, T.; et al. Defects and anomalies in powder bed fusion metal additive manufacturing. Curr. Opin. Solid State Mater. Sci. 2022, 26, 100974. [Google Scholar] [CrossRef]
  4. Ali, U.; Esmaeilizadeh, R.; Ahmed, F.; Sarker, D.; Muhammad, W.; Keshavarzkermani, A.; Mahmoodkhani, Y.; Marzbanrad, E.; Toyserkani, E. Identification and characterization of spatter particles and their effect on surface roughness, density and mechanical response of 17-4 PH stainless steel laser powder-bed fusion parts. Mater. Sci. Eng. A 2019, 756, 98–107. [Google Scholar] [CrossRef]
  5. Bedmar, J.; Riquelme, A.; Rodrigo, P.; Torres, B.; Rams, J. Comparison of Different Additive Manufacturing Methods for 316L Stainless Steel. Materials 2021, 14, 6504. [Google Scholar] [CrossRef] [PubMed]
  6. King, W.E.; Anderson, A.T.; Ferencz, R.M.; Hodge, N.E.; Kamath, C.; Khairallah, S.A.; Rubenchik, A.M. Laser powder bed fusion additive manufacturing of metals; physics, computational, and materials challenges. Appl. Phys. Rev. 2015, 2, 041304. [Google Scholar] [CrossRef]
  7. Ferrar, B.; Mullen, L.; Jones, E.; Stamp, R.; Sutcliffe, C.J. Gas flow effects on selective laser melting (SLM) manufacturing performance. J. Mater. Process. Technol. 2012, 212, 355–364. [Google Scholar] [CrossRef]
  8. Kong, C.-J.; Tuck, C.J.; Ashcroft, I.A.; Wildman, R.D.; Hague, R. High density TI6AL4V via SLM processing: Microstructure and mechanical properties. In Proceedings of the 22nd Annual International Solid Freeform Fabrication Symposium—An Additive Manufacturing Conference (SFF 2011), Austin, TX, USA, 8–10 August 2011; pp. 475–483. [Google Scholar] [CrossRef]
  9. Ansys Fluent User’s Guide; ANSYS 2020; ANSYS, Inc.: Canonsburg, PA, USA, 2020.
  10. Reijonen, J.; Revuelta, A.; Riipinen, T.; Ruusuvuori, K.; Puukko, P. On the effect of shielding gas flow on porosity and melt pool geometry in laser powder bed fusion additive manufacturing. Addit. Manuf. 2020, 32, 101030. [Google Scholar] [CrossRef]
  11. Ladewig, A.; Schlick, G.; Fisser, M.; Schulze, V.; Glatzel, U. Influence of the shielding gas flow on the removal of process by-products in the selective laser melting process. Addit. Manuf. 2016, 10, 1–9. [Google Scholar] [CrossRef]
  12. Anwar, A.B.; Pham, Q.-C. Selective laser melting of AlSi10Mg: Effects of scan direction, part placement and inert gas flow velocity on tensile strength. J. Mater. Proc. Technol. 2017, 240, 388–396. [Google Scholar] [CrossRef]
  13. Bin Anwar, A.; Ibrahim, I.H.; Pham, Q.-C. Spatter transport by inert gas flow in selective laser melting: A simulation study. Powder Technol. 2019, 352, 103–116. [Google Scholar] [CrossRef]
  14. Philo, A.M.; Sutcliffe, C.J.; Sillars, S.; Sienz, J.; Brown, S.G.R.; Lavery, N.P. A study into the effects of gas flow inlet design of the Renishaw AM250 laser powder bed fusion machine using computational modelling. In Proceedings of the 28th Annual International Solid Freeform Fabrication Symposium—An Additive Manufacturing Conference, Austin, TX, USA, 7–9 August 2017; pp. 1203–1219. [Google Scholar]
  15. Chen, Y.; Vastola, G.; Zhang, Y.W. Optimization of Inert Gas Flow inside Laser Powder-Bed Fusion Chamber with Computational Fluid Dynamics. In Proceedings of the 29th Annual International Solid Freeform Fabrication Symposium—An Additive Manufacturing Conference, Austin, TX, USA, 13–15 August 2018; pp. 1931–1939. [Google Scholar]
  16. Zhang, X.; Tuffile, C.; Cheng, B. Computational modeling of the inert gas flow behavior on spatter distribution in selective laser melting. In Proceedings of the 30th Annual International Solid Freeform Fabrication Symposium—An Additive Manufacturing Conference, Austin, TX, USA, 12–14 August 2019; pp. 1362–1372. [Google Scholar]
  17. Zhang, X.; Cheng, B.; Tuffile, C. Simulation study of the spatter removal process and optimization design of gas flow system in laser powder bed fusion. Addit. Manuf. 2020, 32, 101049. [Google Scholar] [CrossRef]
  18. Ding, R.; Yao, J.; Du, B.; Li, K.; Li, T.; Zhao, L.; Guo, Y. Effect of Shielding Gas Volume Flow on the Consistency of Microstructure and Tensile Properties of 316L Manufactured by Selective Laser Melting. Metals 2021, 11, 205. [Google Scholar] [CrossRef]
  19. Morsi, S.A.; Alexander, A.J. An investigation of particle trajectories in two-phase flow systems. J. Fluid Mech. 1972, 55, 193–208. [Google Scholar] [CrossRef]
  20. Shao, Y.; Lu, H. A simple expression for wind erosion threshold friction velocity. J. Geophys. Res. Earth Surf. 2000, 105, 22437–22443. [Google Scholar] [CrossRef]
  21. Zhao, C.; Guo, Q.; Li, X.; Parab, N.; Fezzaa, K.; Tan, W.; Chen, L.; Sun, T. Bulk-Explosion-Induced Metal Spattering During Laser Processing. Phys. Rev. X 2019, 9, 021052. [Google Scholar] [CrossRef] [Green Version]
  22. Cunningham, R.; Zhao, C.; Parab, N.; Kantzos, C.; Pauza, J.; Fezzaa, K.; Sun, T.; Rollett, A.D. Keyhole threshold and morphology in laser melting revealed by ultrahigh-speed x-ray imaging. Science 2019, 363, 849–852. [Google Scholar] [CrossRef] [PubMed]
  23. Gunenthiram, V.; Peyre, P.; Schneider, M.; Dal, M.; Coste, F.; Koutiri, I.; Fabbro, R. Experimental analysis of spatter generation and melt-pool behavior during the powder bed laser beam melting process. J. Mater. Process. Technol. 2018, 251, 376–386. [Google Scholar] [CrossRef]
Figure 1. Schematic of the Renishaw AM250 chamber presenting the inlet, outlet, build plate, and ejection location. The build plate dimensions are 250 mm × 250 mm.
Metals 12 00343 g001
Figure 2. Grid independence test. Volume flow rate: 250 LPM, gas: air.
Metals 12 00343 g002
Figure 3. Velocity contour in the center plane (XZ plane at a height of 67.5 mm above build plate). (Left): Simulated velocity profiles using realizable k-ε turbulence model. (Right): Experimental velocity measurements. Volume flow rate: 250 LPM, gas: air.
Metals 12 00343 g003
Figure 4. Threshold velocity as a function of powder diameter for two metal powder materials (stainless steel 316L (SS 316L) and aluminum alloy (AlSi10Mg)).
Metals 12 00343 g004
Figure 5. Velocity profiles across the vertical cross-section (XY plane) of the build chamber. Volume flow rate: 250 LPM.
Metals 12 00343 g005
Figure 6. Velocity profiles normalized by maximum velocity in the center plane for different gas flow rates. (Left): 250 LPM and maximum velocity of 1.59 m/s. (Right): 1000 LPM and maximum velocity of 6.36 m/s.
Metals 12 00343 g006
Figure 7. Velocity profiles normalized by maximum velocity in the central vertical plane for different gas flow rates. (Left): 250 LPM and maximum velocity of 1.5 m/s. (Right): 1000 LPM and maximum velocity of 6 m/s.
Metals 12 00343 g007
Figure 8. Maximum velocity magnitude as a function of flow rate in the center plane (XZ plane located 67.5 mm above the build plate) and another XZ plane located 1 mm above the build plate.
Metals 12 00343 g008
Figure 9. Spatter trajectories for various particle diameters and ejection angles at an ejection speed of 1.5 m/s. Volume flow rate: 250 LPM.
Metals 12 00343 g009
Figure 10. Effect of inert gas flow rate on spatter trajectories at ejection angle of 70° and ejection speed of 1.5 m/s.
Metals 12 00343 g010
Figure 11. The range for spatter particles of different diameters ejected at 45° and 70° plotted against the inert gas volume flow rate for the base design.
Metals 12 00343 g011
Figure 12. Normalized velocity profiles for the modified design with 6 mm nozzle inlet diameter. (Left): Velocity magnitude in the center plane normalized with the maximum velocity of 2.61 m/s. (Right): Velocity magnitude in the vertical plane normalized with the maximum velocity of 2.59 m/s.
Metals 12 00343 g012
Figure 13. Particle trajectories for reduced inlet nozzle diameter of 6 mm. Volume flow rate: 250 LPM.
Metals 12 00343 g013
Table 1. Thermophysical properties of inert gas and spatter. Virgin powder diameter: 60 μm.
MaterialPhaseDensity (kg/m3)Dynamics Viscosity (kg/m·s)
Argon (inert gas)Continuous1.62282.125 × 10−5
316L (stainless steel)Discrete7950-
AlSi10Mg (aluminum alloy)Discrete2700-
Publisher’s Note: MDPI stays neutral with regard to jurisdictional claims in published maps and institutional affiliations.

