Article

Benchmarking a 9Cr-2WVTa Reduced Activation Ferritic Martensitic Steel Fabricated via Additive Manufacturing

1
Material Science and Technology Division, Oak Ridge National Laboratory, Oak Ridge, TN 37831, USA
2
Lincoln Electric Company, Chengalpattu 603004, India
*
Author to whom correspondence should be addressed.
Metals 2022, 12(2), 342; https://doi.org/10.3390/met12020342
Submission received: 27 December 2021 / Revised: 7 February 2022 / Accepted: 8 February 2022 / Published: 15 February 2022

Abstract

:
Reduced activation ferritic (RAF) martensitic steels are promising candidates for the first wall of fusion reactors. However, current manufacturing capabilities call for these components to be made by welding wrought plates. This limits design freedom and necessitates the use of post-weld heat treatments (PWHT) in accordance with the boiler and pressure vessel code. Additive manufacturing (AM) can offer a unique solution to solve this challenge by leveraging the layer-wise deposition strategy to come up with temper bead deposition techniques to eliminate post-processing heat treatments (PPHT). However, it is necessary to benchmark the properties of RAF steels fabricated by AM with their wrought counterparts to identify the process-structure-property correlation, which is the goal of this study. The study demonstrates that while tensile properties at room temperature and high temperatures are satisfactory, the as fabricated and samples after PPHT have significant heterogeneity in tensile elongation. This has been attributed to the presence of discontinuities in the build. The as-fabricated samples have an average tensile strength of 1190 + 12 MPa and an average elongation of 15 + 5% at room temperature and 658 ± 20 MPa ultimate tensile strength (UTS) and 14 ± 7% at 600 °C. After the post-weld heat treatment, mechanical properties decrease to around 600–650 MPa and an elongation between 20–25% at room temperature to 300 MPa UTS and 25–28% elongation at 600 °C. The characterization of microstructures at various length scales demonstrates that the as-fabricated structure has a significant fraction of delta ferrite in a lath martensitic matrix. No precipitates could be identified in the as-fabricated structure. PPHT led to a decrease in the area fraction of delta ferrite and precipitation of M23C6 and MX. Detailed characterization clearly demonstrates that the lack of precipitates in the as-fabricated structure could be due to the slow tempering response of the alloy. Finally, the needs to develop new alloys to achieve the objectives stated above are articulated.

1. Introduction

Advanced manufacturing is a disruptive manufacturing process that has found widespread adoption in the automotive, aerospace and fossil fuel power industries [1,2,3]. However, the fusion materials community has been slow to capitalize on the benefits of AM [1]. This is due to the difficulty in the qualification of AM processes, non-availability of data to bench mark performance of alloys fabricated via AM with those of the wrought counterparts, and finally a lack of new materials developed specifically for AM [1]. To address this gap, it becomes necessary to evaluate the feasibility of fabricating these alloys, understand the challenges in fabrication and document the performance of alloys fabricated using additive manufacturing.
When ferritic martensitic steels were considered as structural materials for fusion reactors in the late 1970s, Sandvik HT9 was the front runner, attracting significant interest in the fusion community in the US [4,5]. HT9 is an 11–12% Cr steel with a C content ~0.2 wt.% strengthened by Mo and V carbides after tempering. In the 1980s, the idea of using low activation materials was introduced to prevent the steels from activating after neutron irradiation per the guidelines of the US nuclear regulatory commission (10 CFR Part 61) [4,5]. Such guidelines indicate that typical steel alloying elements, such as Mo, Nb, Ni, Cu, and N must be eliminated or minimized to obtain ‘reduced activation’. Therefore, alloying elements, such as Mo, were replaced with W and V, leading to the development of Cr-W-V alloys [6]. After three decades of alloy development, RAF steels for structural fusion applications have converged to a nominal 9 wt.% of Cr. The Cr content was optimized largely based on considerations of a radiation-induced ductile to brittle transition temperature (DBTT) shift. In addition, the steels with 9% Cr were preferred due to the difficulty in eliminating delta-ferrite in steels with higher Cr (12%) content without Mn, C or Ni stabilization [7].
The most popular RAF steels are F82H (Japan), EUROFER (Europe) and ORNL 9Cr-2WVTa (USA) [8]. The chemistries of F82H and ORNL-9Cr-2WVTa are very similar [4,5]. In comparison, EUROFER heats exhibit a lower W content, which makes the alloy less susceptible to the Laves phase (FeCr)2(MoW) formation [9,10]. The Laves phase is detrimental to toughness and typically occurs during long-term aging and post-weld heat treatment and highly depends on the W content of the alloys. Steels that contain less than 1% W typically do not form a Laves phase, even after extended aging for 10,000 h at 250–500 °C or at 750 °C for 500 h [11]. Similar experiments on EUROFER steel did not lead to any Laves phase precipitates after long-term aging at 500 °C for 5000 h and 600 °C for 1000 h [12]. In case of the ORNL 9Cr-2WVTa, the formation of a Laves phase did not occur until a temperature of 550 °C. Previous studies undertaken demonstrated that the 9Cr-2WVTa steels have impact toughness and performance close to the Grade-91 steels that needed to be replaced [13].
Typically, these alloys are used in a normalized and tempered condition. Tempering leads to the recovery of the dislocation substructure and, consequently, the precipitation of the dominant carbides M23C6 (60–150 nm) on the lath boundaries and the precipitation of a fine distribution (20–80 nm) of Nb-based MX carbides [14]. V and Ta, which substitute Nb as a precipitate former in other alloys, are expected to form favorable MX precipitates. However, the behavior of Ta is not very clear, with some evidence of Ta remaining in solid solution and not partitioning in the precipitation process. While M23C6 helps to stabilize the lath boundaries, MX particles tend to exert a pinning pressure on dislocations and therefore retard recovery and grain growth [15,16,17].
According to the current design for the ITER Test Blanket Module, there are six subcomponents, which have to be fabricated and assembled using RAF steels [18,19,20]: the first wall, caps, stiffening grid, breeding units, back plates/manifolds and attachment systems [21]. These assemblies need to be fabricated by welding, which leads to challenges in maintaining necessary preheat and interpass temperatures [21,22,23]. During welding it is crucial to preheat the base material and maintain an interpass temperature to mitigate hydrogen-induced cracking of RAF steels and other ferritic martensitic steels [18,20]. After fabrication, it is mandatory to heat treat welds fabricated on RAF/FM steels to temper the martensite for a time period determined by the thickness of the part, as mandated by the ASME boiler and pressure vessel code [24]. However, for certain cases, it has been reported that welds fabricated with laser or EB welds can meet the toughness requirements without any post-weld heat treatment. For instances, welds fabricated on 5 mm thick EUROFER plates using laser and electron beam (EB) welds had a ductile to brittle transition temperature (DBTT) close to −10 °C and −65 °C, respectively, while those from gas tungsten arc welding (GTAW) were close to 25 °C [18]. When the thickness of the plate is increased to 40 mm the welds need PWHT treatment to improve the toughness [18]. It is important to note that these results are encouraging from the viewpoint that the DBTT requirements can be met without PWHT. The code, however, does not allow any relaxation in PWHT requirements [18]. The fundamental reason for the weld technique discrepancy was not discussed but could be due to the lower heat inputs in the laser and EB welds compared to TIG welds. This could contribute to an increase in toughness through a reduction in the delta ferrite content in the weld metal, as reported by Arivazhagan et al. [25]. Delta ferrite is the first phase to form during solidification of the molten weld [26,27,28]. This ferrite transforms to austenite upon further cooling and the austenite transforms to martensite on cooling below the Ms temperature. However, under non-equilibrium cooling conditions, the delta ferrite may not transform to austenite and may be present as stringers along the austenite grain boundaries [26]. During a reheating process, an increase in the delta ferrite content in the weld is observed, where the weld metal is reheated in the gamma-delta region. The delta ferrite content is directly proportional to the heat input with high heat input welds having a higher delta ferrite content [25,26]. Consequently, the low heat input welds, such as narrow gab EB welding and laser welding, have a smaller heat affected zone and therefore increased toughness is observed.
The other factor affecting the mechanical properties in general (and toughness in particular) during multipass welding is the degree of tempering of the steel [7]. For example, it has been observed and documented that weld beads, when thin and wide, allow for a higher degree of tempering-promoted grain refinement. Thicker weld beads/layers lead to a drop in toughness due to the lack of grain refinement. These findings have resulted in the development of temper bead welding [29]. While popular for repairs, there is activity to use this process to fabricate new welds to avoid PWHT. The temper bead welding, as the name suggests, utilizes the reheating effects in multipass welding to temper the previous bead. Once the first layer is welded, a second layer is deposited adjacent to the first layer. This heat from the second layer penetrates the layer below and tempers the first layer. In certain cases, part of the first layer is ground off before the second layer is deposited to increase the extent of tempering. This procedure is called the half-bead tempering process [30,31]. In another modification (“butter-bead” temper bead welding), the heat input to deposit subsequent passes is progressively changed by changing the size of the electrode. It has been reported by Bhaduri et al. that the “butter-bead” temper bead process is more suitable for welding 9Cr steels [29]. The reason for reviewing this literature is to present the reader with information on the state-of-the-art welding of these alloys. While there have been significant strides made to reduce challenges coming from the weldability of these alloys, most of these challenges remain.
Additive manufacturing is a new manufacturing process, which involves fabricating the part layer-by-layer from power [3,32] or wire-based feedstock [33,34]. The layer-wise deposition also necessitates melting and reheating cycles, which has challenges very similar to multipass welding. However, the key difference between layer-wise deposition and multipass welding is the amount of control which can be achieved by systematically altering the spatial and temporal changes to the thermal gradients. This type of control is unprecedented in this type of manufacturing [35,36,37,38]. In addition to greater control during processing, if the process parameters are carefully controlled in principle, one could perform in situ tempering, which could potentially lead to “born qualified parts”. This could eventually negate the need for expensive post-weld heat treatments and other supply chain issues that conventional welding-based manufacturing needs [39]. New complex designs to overcome the unsolved challenge of a divertor concept for Fusion reactors are possible using AM instead of traditional manufacturing routes. AM excels at high product complexity and small production volume [40]. However, while great strides have been made in the ability to fabricate non-weldable Ni-based superalloys without any cracks [41], the amount of work on AM of FM/RAF steel is limited to a few feasibility studies [2]. Some seminal studies pertaining to the feasibility to fabricate FM steels using laser direct-energy deposition (DED) have indicated that it is possible to achieve temper bead welding in HT-9 [3,42]. Previous work on HT9 has demonstrated that by depositing layers that were ~0.5 mm thick, the subsequent passes led to the precipitation of both M23C6 and MC carbides and carbonitrides that were in the size range ~80 nm, which, after PWHT, coarsened to ~150 nm [1,2]. In the case of HT9, the high delta ferrite content in the as-fabricated state of around 15% will limit the maximum toughness. This is probably due to the high Cr equivalent in the alloy, as detailed by Onoro et al. [43,44]. Future work conducted on a new FM alloy for Gen IV fission reactors, designed specifically for AM, also indicated that it was possible to achieve a toughness level comparable to ODS Eurofer, while achieving the same levels of strength [3,42]. Toughness was achieved by two primary mechanisms:
  • Balancing the Cr and Ni equivalent to prevent the formation of delta ferrite in the weld metal.
  • Enhancing tempering by careful control of process parameters.
The key processing goal was to ensure maximum precipitation of MX precipitates in the previous layer during the subsequent deposition of the next layer. In addition, the thin and shallow bead size ensures enough tempering in the previously deposited layers. These successes in the fabrication of steels for fission have sparked interest in evaluating the feasibility of fabricating RAF steels using AM and identifying the opportunities to design a RAF alloy tailored for additive manufacturing. However, to start modifying existing alloys for AM, we need to understand the challenges with the current generation of RAF steels in the context of AM. The goal of this manuscript is, therefore, to:
  • Benchmark a 9Cr-2WVTa alloy fabricated via AM and rank its performance with wrought variants of the same alloy;
  • Understand the response of the alloy to post-processing heat treatments and compare the performance of similar treatments on wrought counterparts;
  • Identify gaps in processing and provide insight into further areas for alloy design and set the stage for future activities in this area.

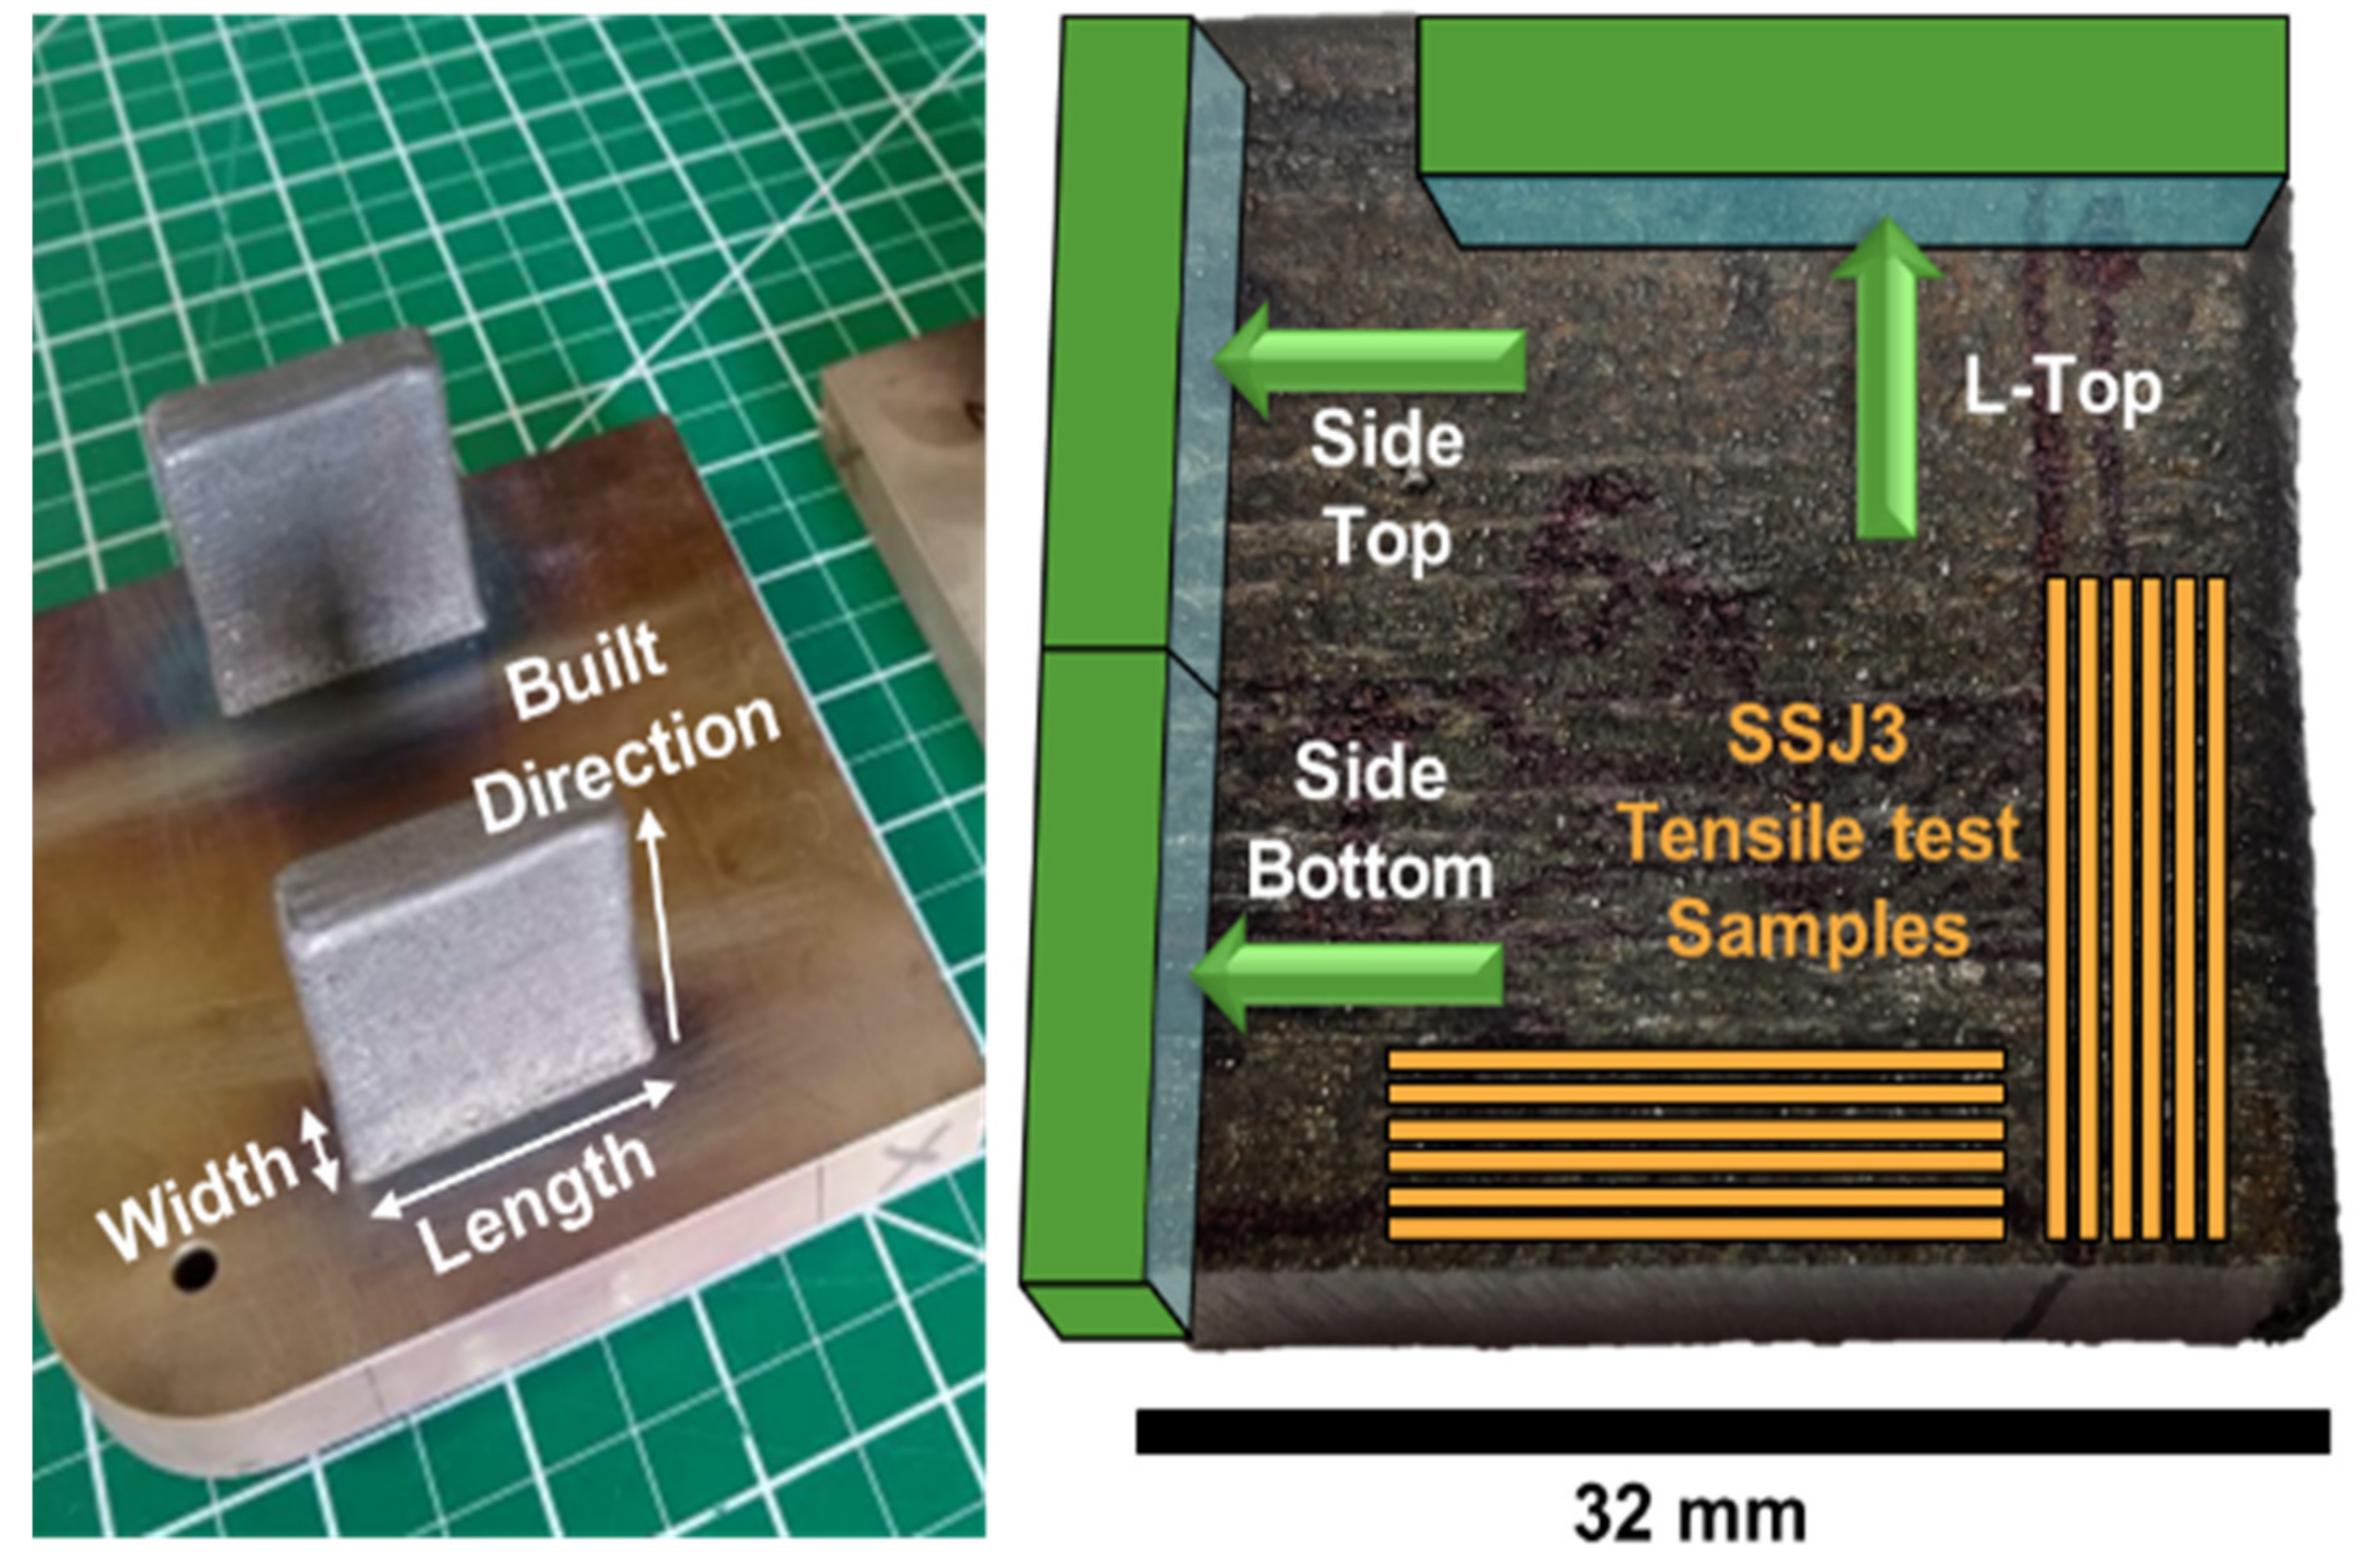
2. Experimental Techniques

We deposit a RAF steel developed at Oak Ridge National Laboratory using laser blown powder additive manufacturing (LAM) and perform detailed mechanical and microstructural characterization. Four identical (40 × 40 × 10 mm3) samples of Fe-9Cr-2WV alloy with the chemistry listed below in Table 1 were fabricated using laser blown powder DED Modulo 450 by BeAM® in Cincinnati, OH, USA, with a laser power of 700 W, travel speed of 700 mm/min and powder ulkarni rate of 6 g/min. The targeted layer thickness was 0.5 mm per layer and the actual layer thickness was measured to be around 0.6 mm per layer. A regular 90° raster was used with a hatch spacing of 0.6 mm. The nominal chemical composition of comparable RAF steels is presented in Table 2.
Following fabrication, three samples were normalized and tempered using different conditions. The conditions were:
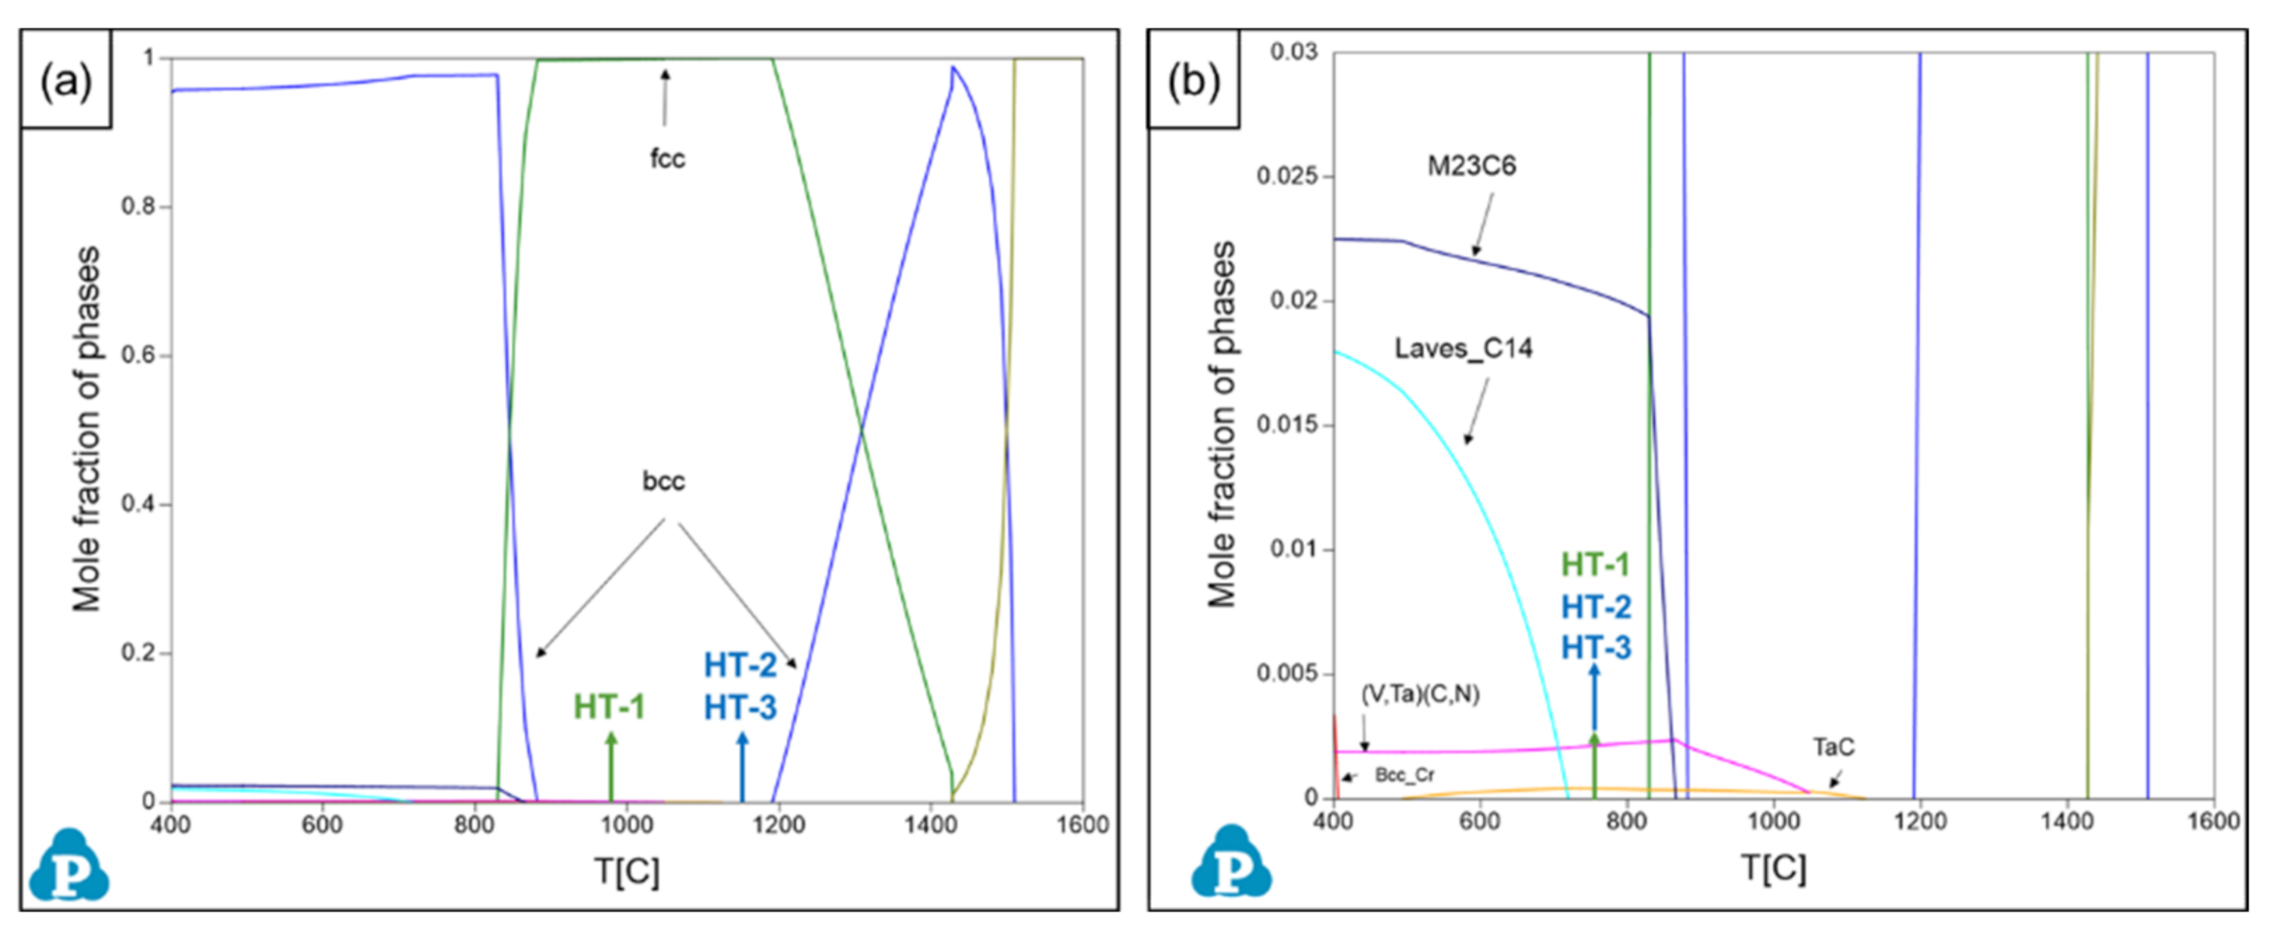
  • HT-1: 980 °C normalize for 30 min and temper at 750 °C for 120 min;
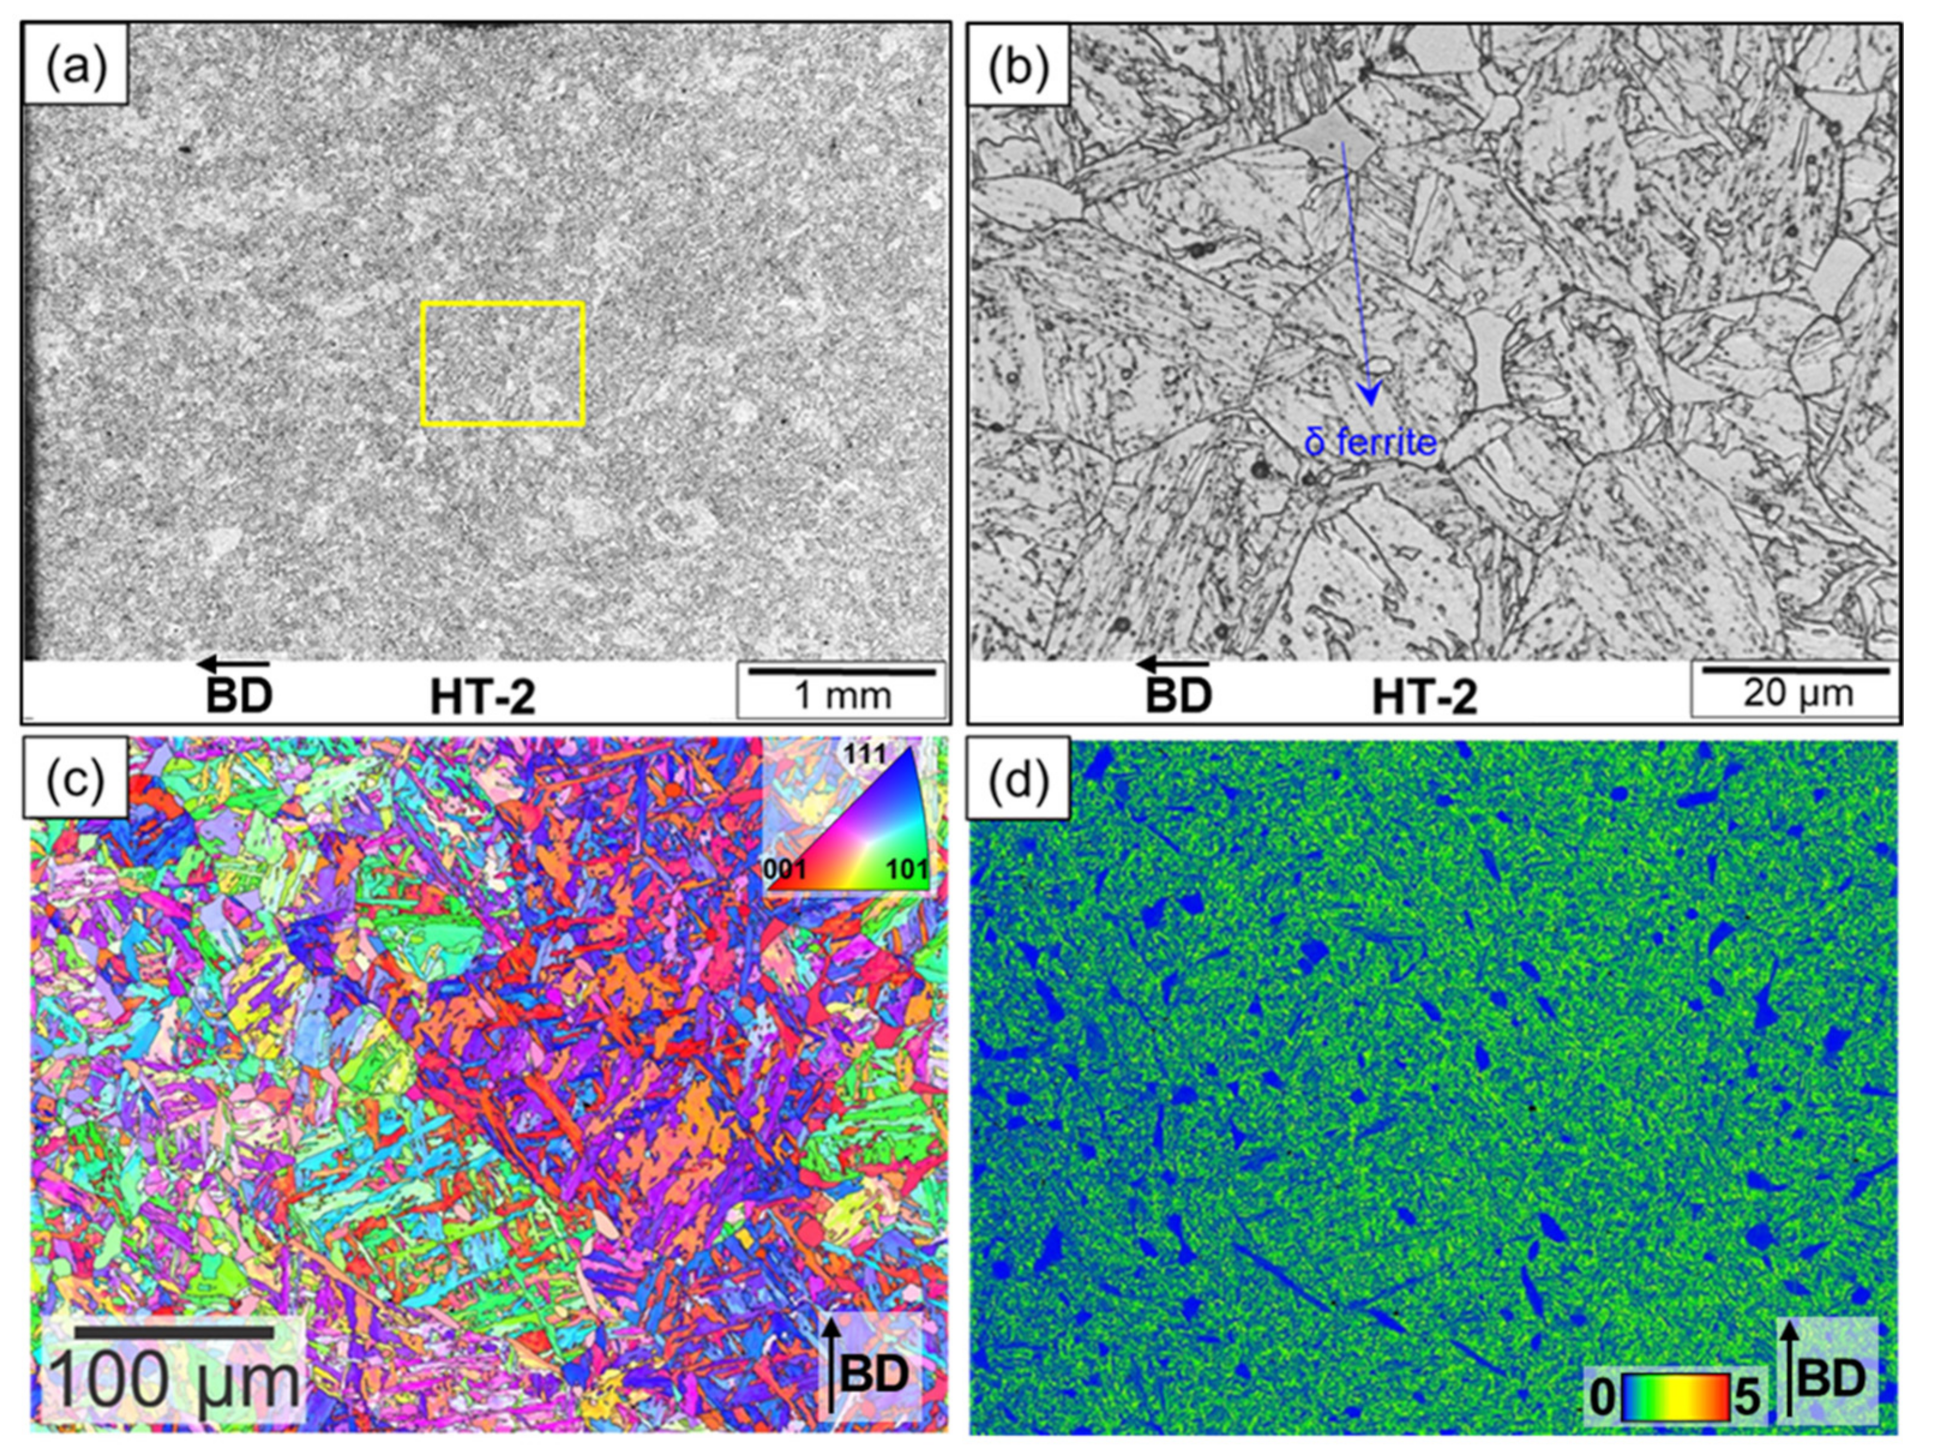
  • HT-2: 1150 °C normalization for 60 min and temper at 750 °C for 60 min;
  • HT-3: 1150 °C normalization for 30 min and temper at 750 °C for 30 min.
HT-1 uses conditions applied for EUROFER and OPTIFER [45,46,47], while HT-2 and HT-3 use the same temperatures utilized for the recent CNA development. HT-2 and HT-3 exhibit varying normalization and tempering durations to investigate the impact of reduced heat treatment times on the delta-phase fraction, lath sizes and precipitate formation.
The heat treatments were performed in an Ar atmosphere to avoid oxidation of the samples. Following the heat treatment, the samples were extracted for characterization and sectioned off using a low-speed saw to avoid any damage to the substructure. Following sectioning, pieces were polished to a submicron finish. Samples for optical microscopy were then etched using a modified Vilella’s etch to delineate the grain boundaries, delta ferrite and precipitates. Optical microscopy was performed using a microscope by Olympus America. Following optical microscopy, the samples were polished with a colloidal silica solution for 4 h and scanning electron microscopy (SEM) was performed using a MIRA 3 SEM by TESCAN USA, Inc. equipped with an Oxford Symmetry EBSD detector using a probe current of 4 nA. All EBSD data were collected using a 20 kV accelerating voltage with a 6 nA beam current. Identical step sizes of 0.1 micron were used for all scans. The printed samples and the investigated areas as well as the position of machined tensile test samples are shown in Figure 1.
Specimens for transmission electron microscopy (TEM) were prepared using standard focused ion beam (FIB) preparation. Lift-outs of bulk samples with a length of 20 microns were subsequently thinned to a thickness of around 100 nm in the regions of interest. Primary TEM was performed using an FEI (now Thermo Fisher Scientific, Waltham, MA, USA) Talos F200X scanning transmission electron microscope (S/TEM) operating at 200 kV in ORNL’s Low Activation Materials Development and Analysis (LAMDA) laboratory. Energy dispersive X-ray spectroscopy (EDS) was used to map the carbide distributions and observe local micro chemical variations. The mapping was completed using a probe current of ~1 nA and a probe size of less than 1 nm with active drift correction every 10 s. The spectrum images were recorded using a 1024 × 1024 pixels region with a 3 × 3 neighborhood averaging filter applied during image post-processing. Spectrum images were cropped in post-processing to generate the included figures. Mechanical tests were performed on a SS-J3 specimen. This geometry has been used extensively in the past to enable in reactor irradiations. SS-J3 specimens with dimensions 0.75T × 1.25W × 5.00L mm3 were extracted perpendicularly and with in-built directions to investigate the directionality in the properties. The tensile tests were performed at room temperature (RT), 500 °C, 600 °C and 700 °C with a strain rate of 10−3 s−1 using shoulder loading.

3. Results

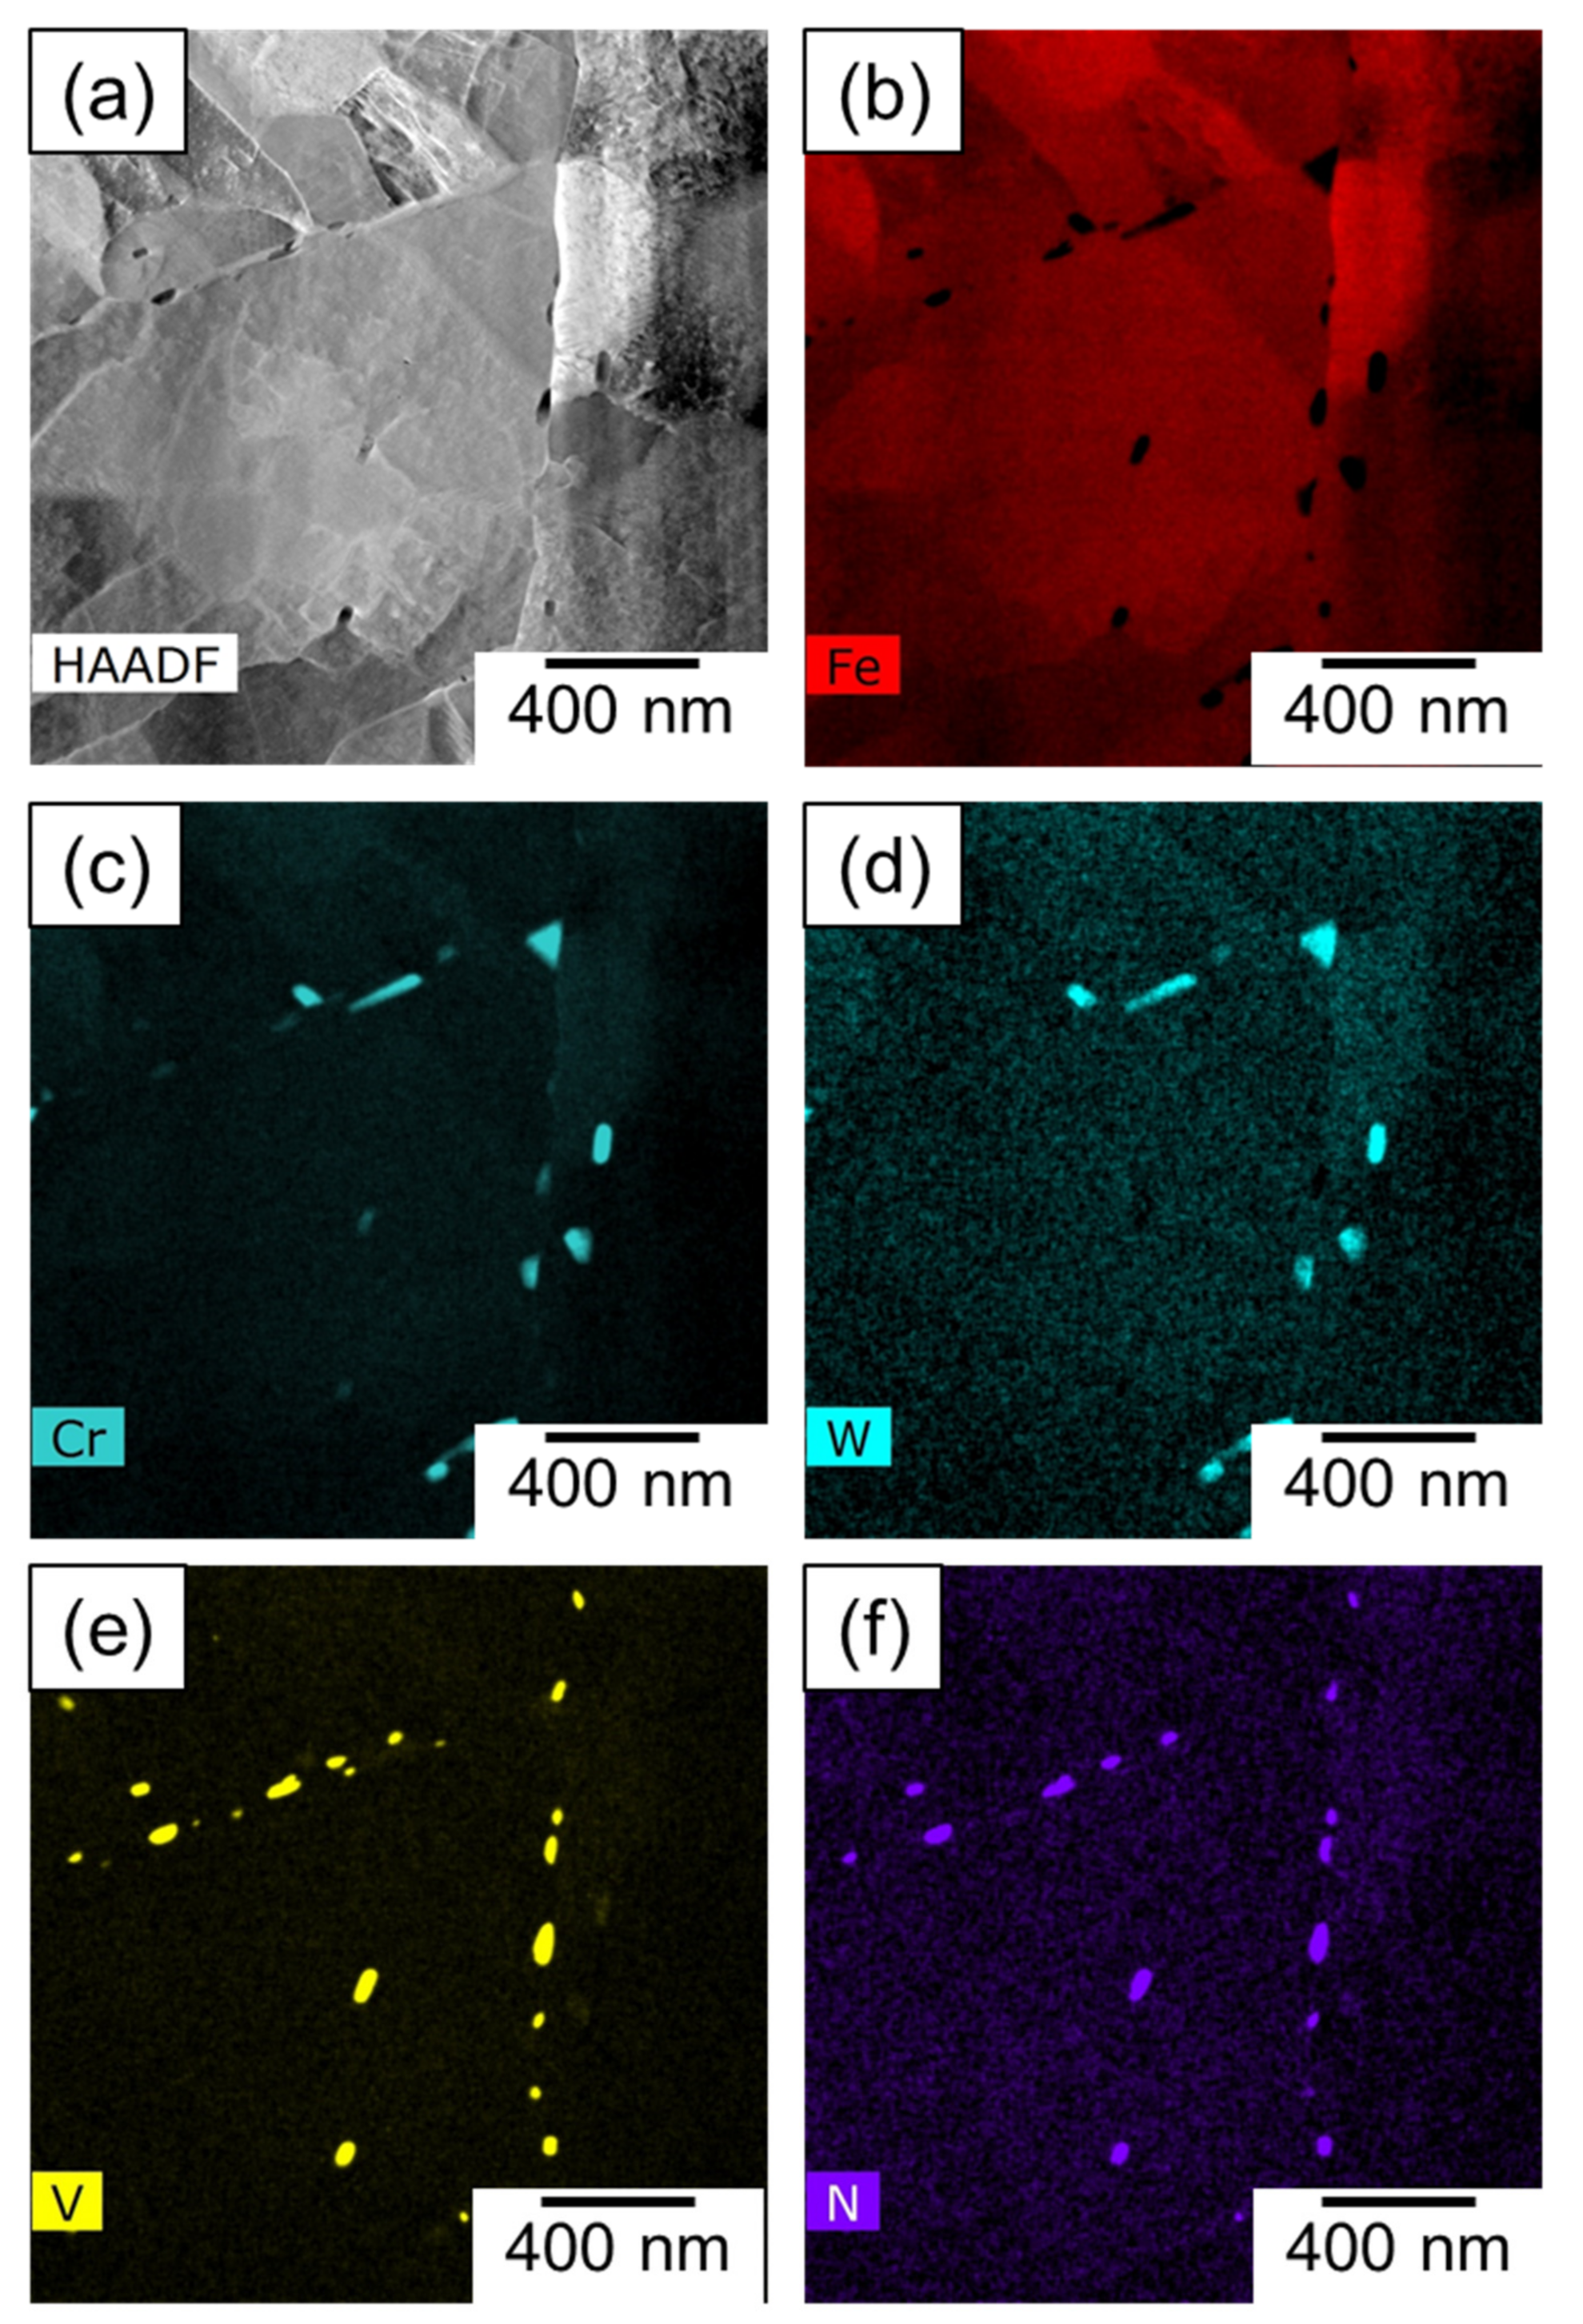
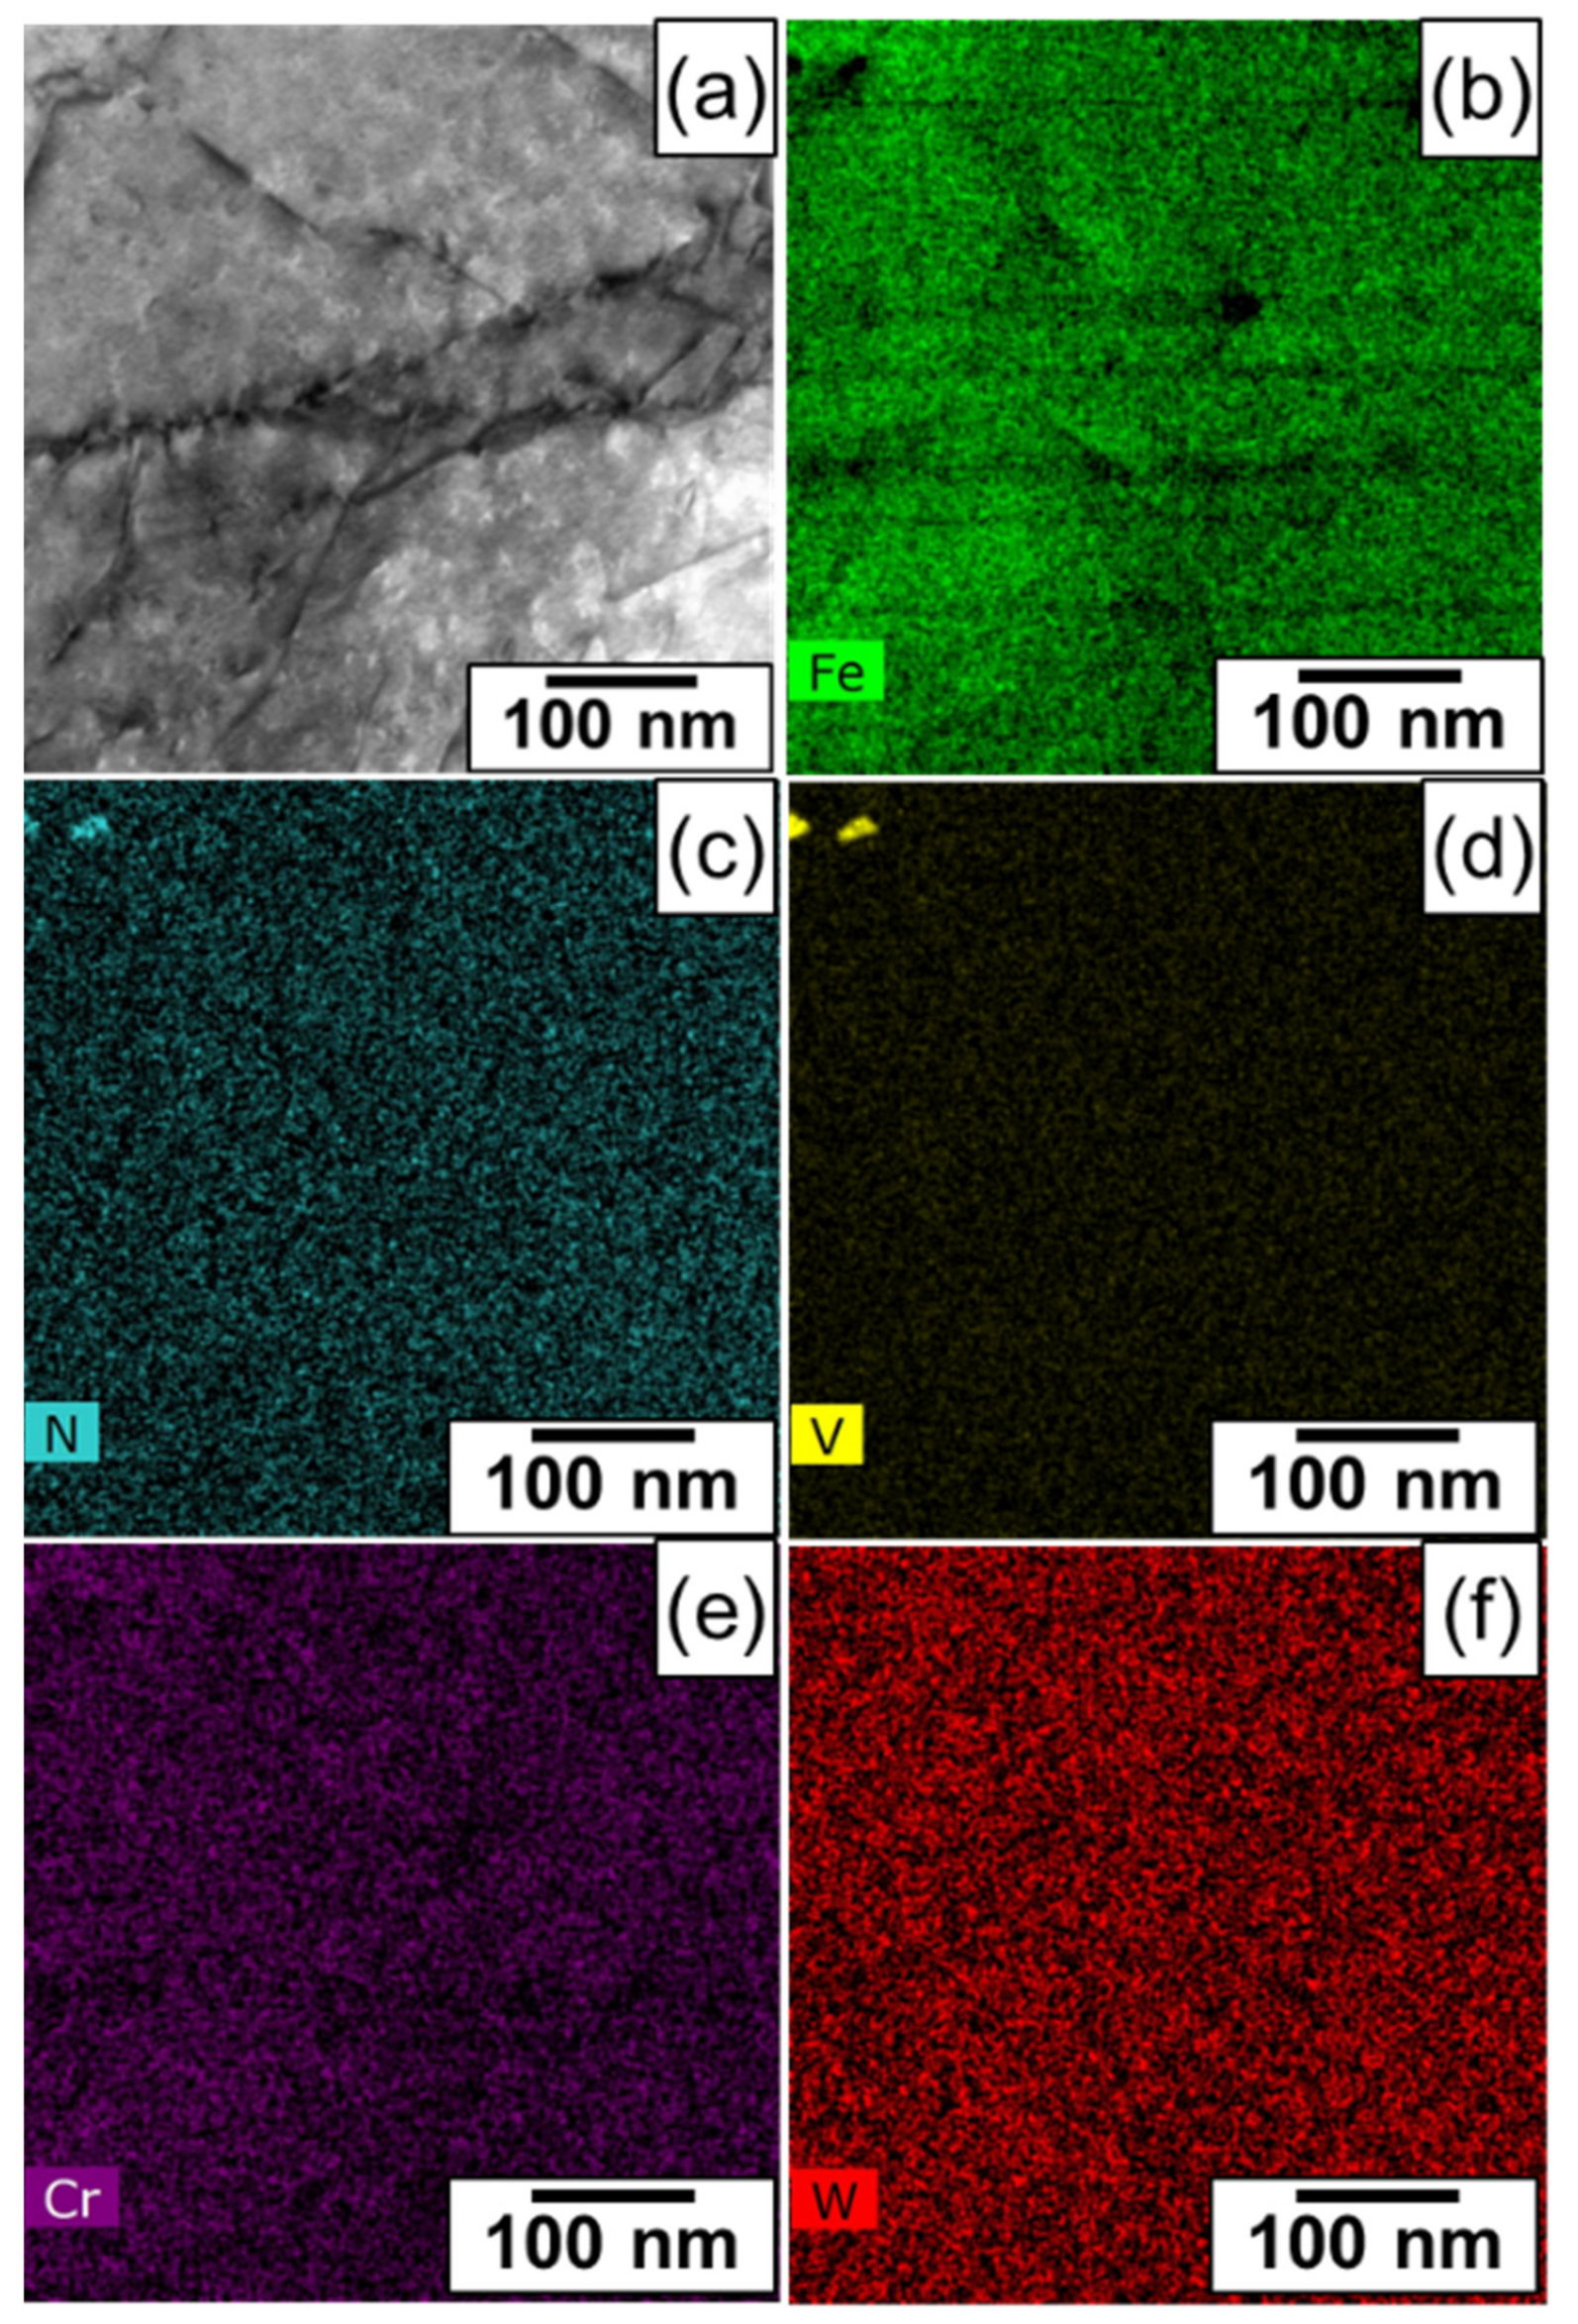
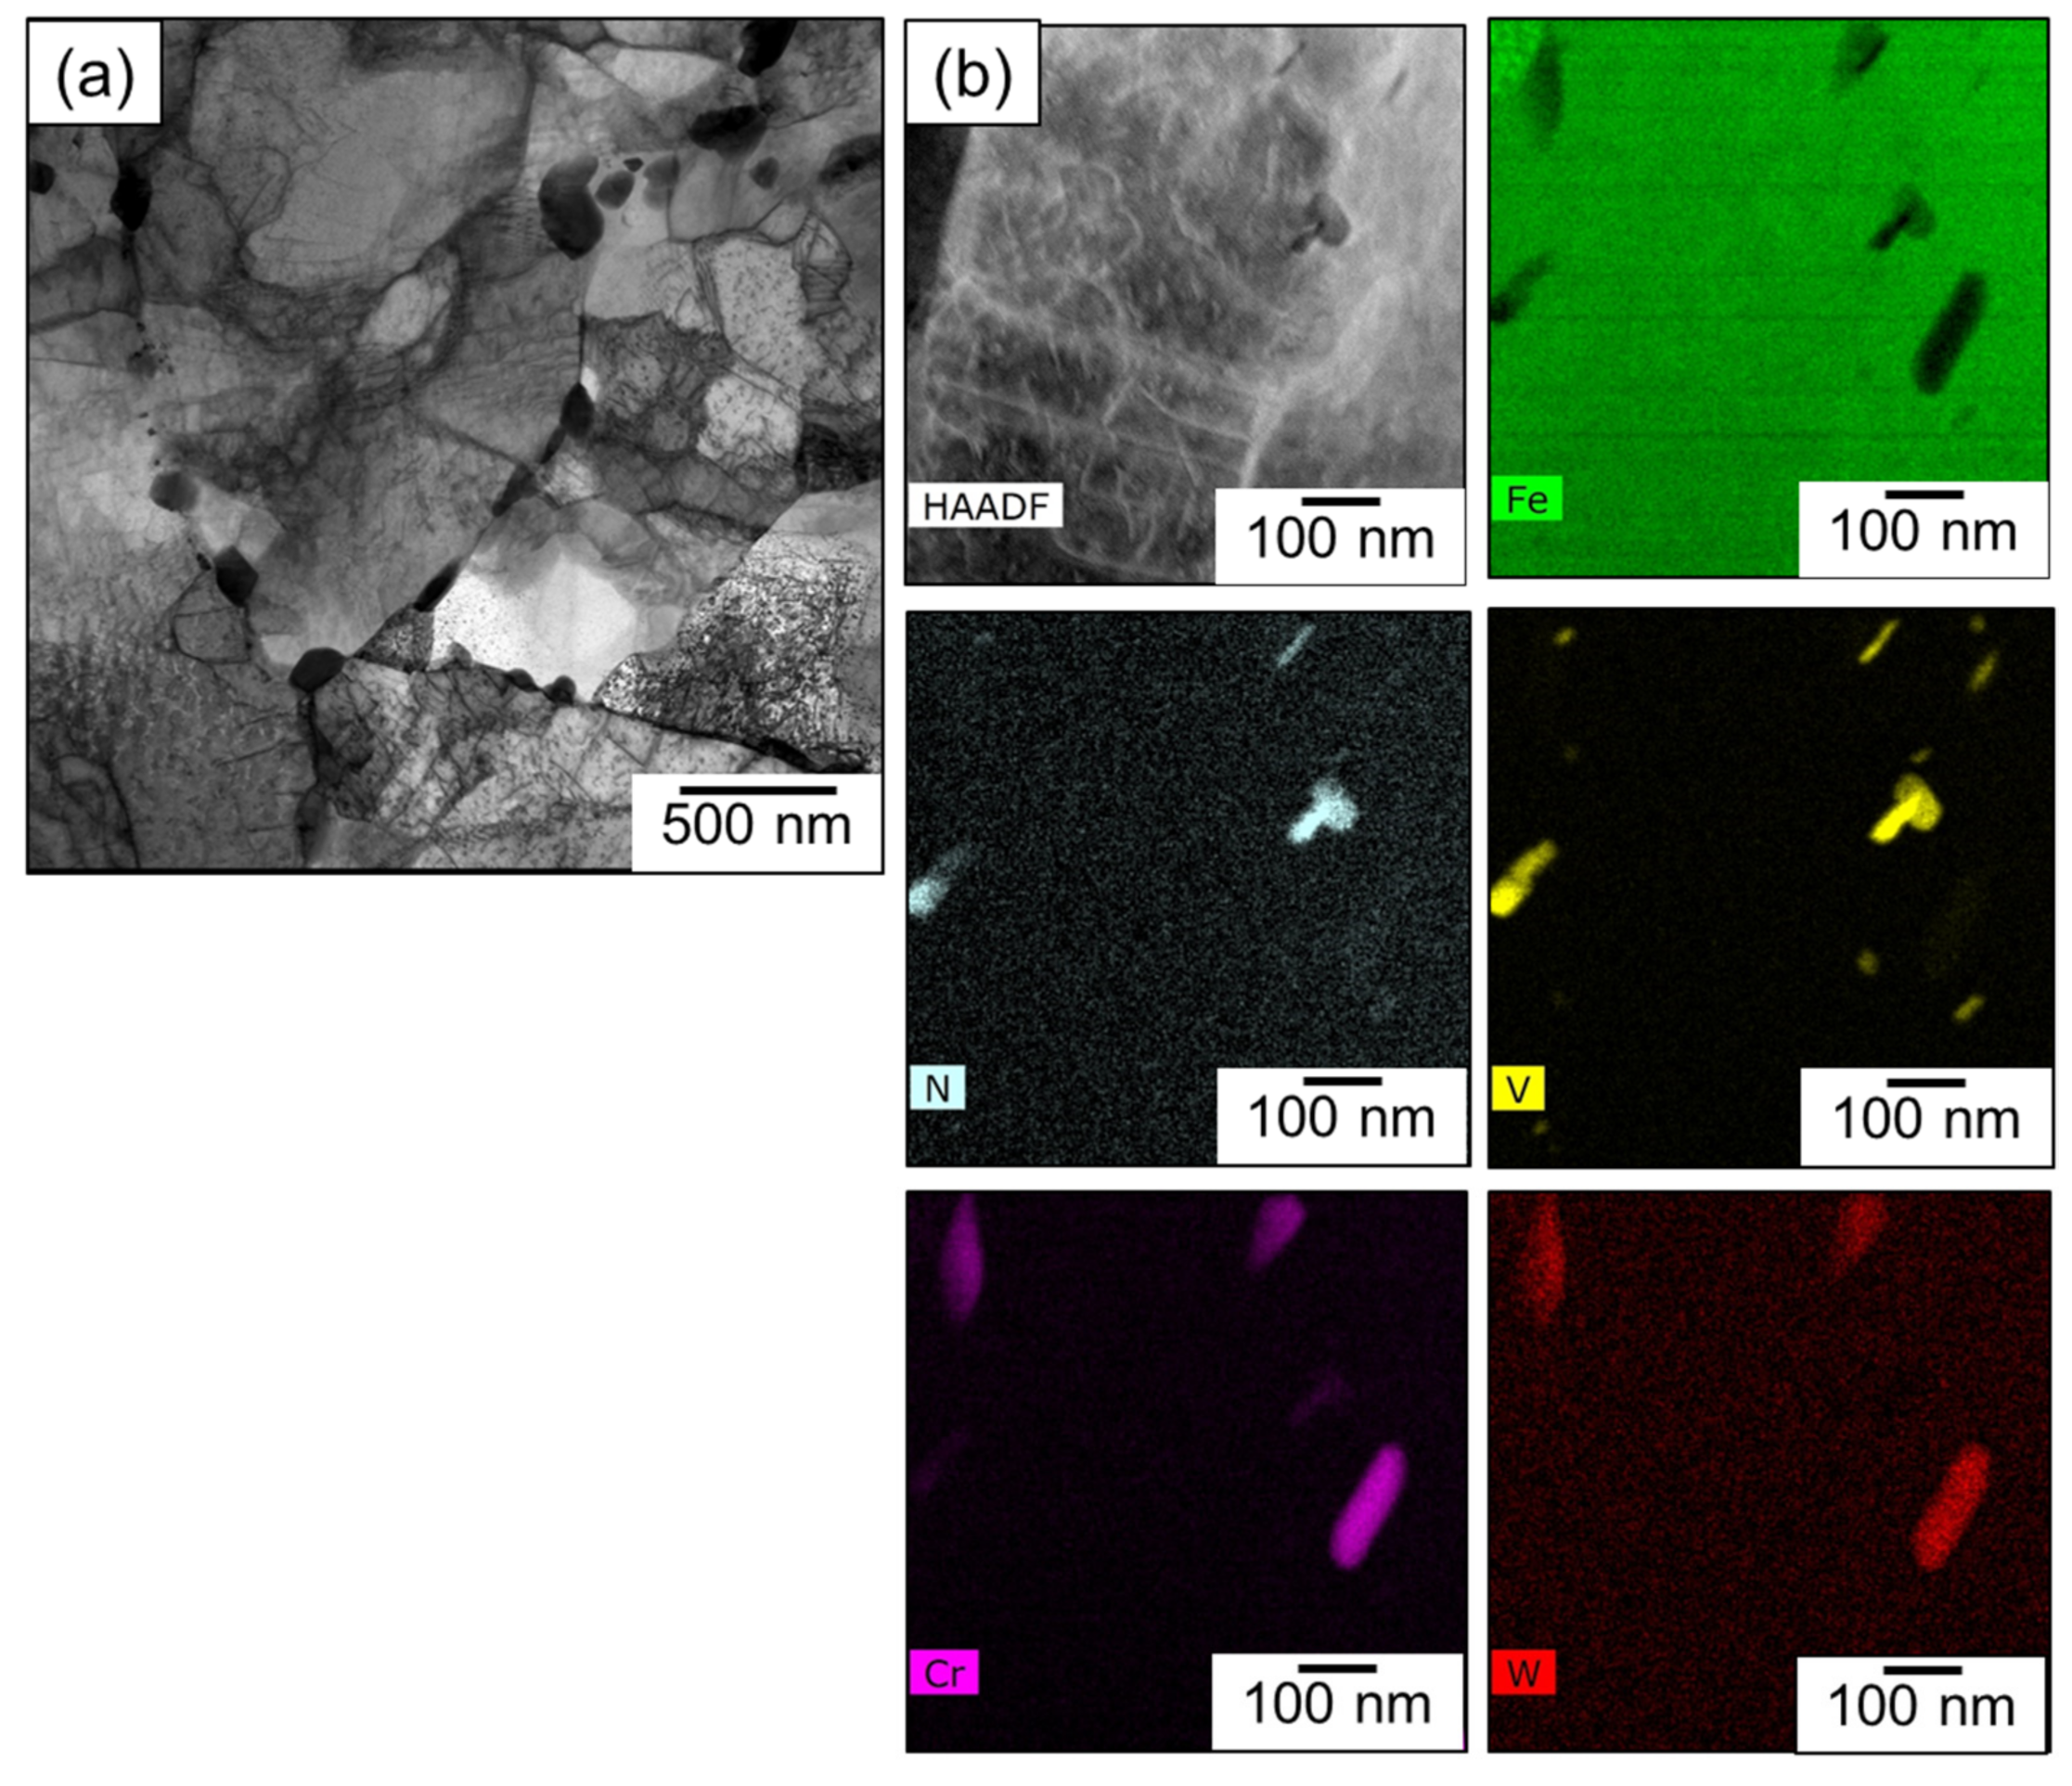
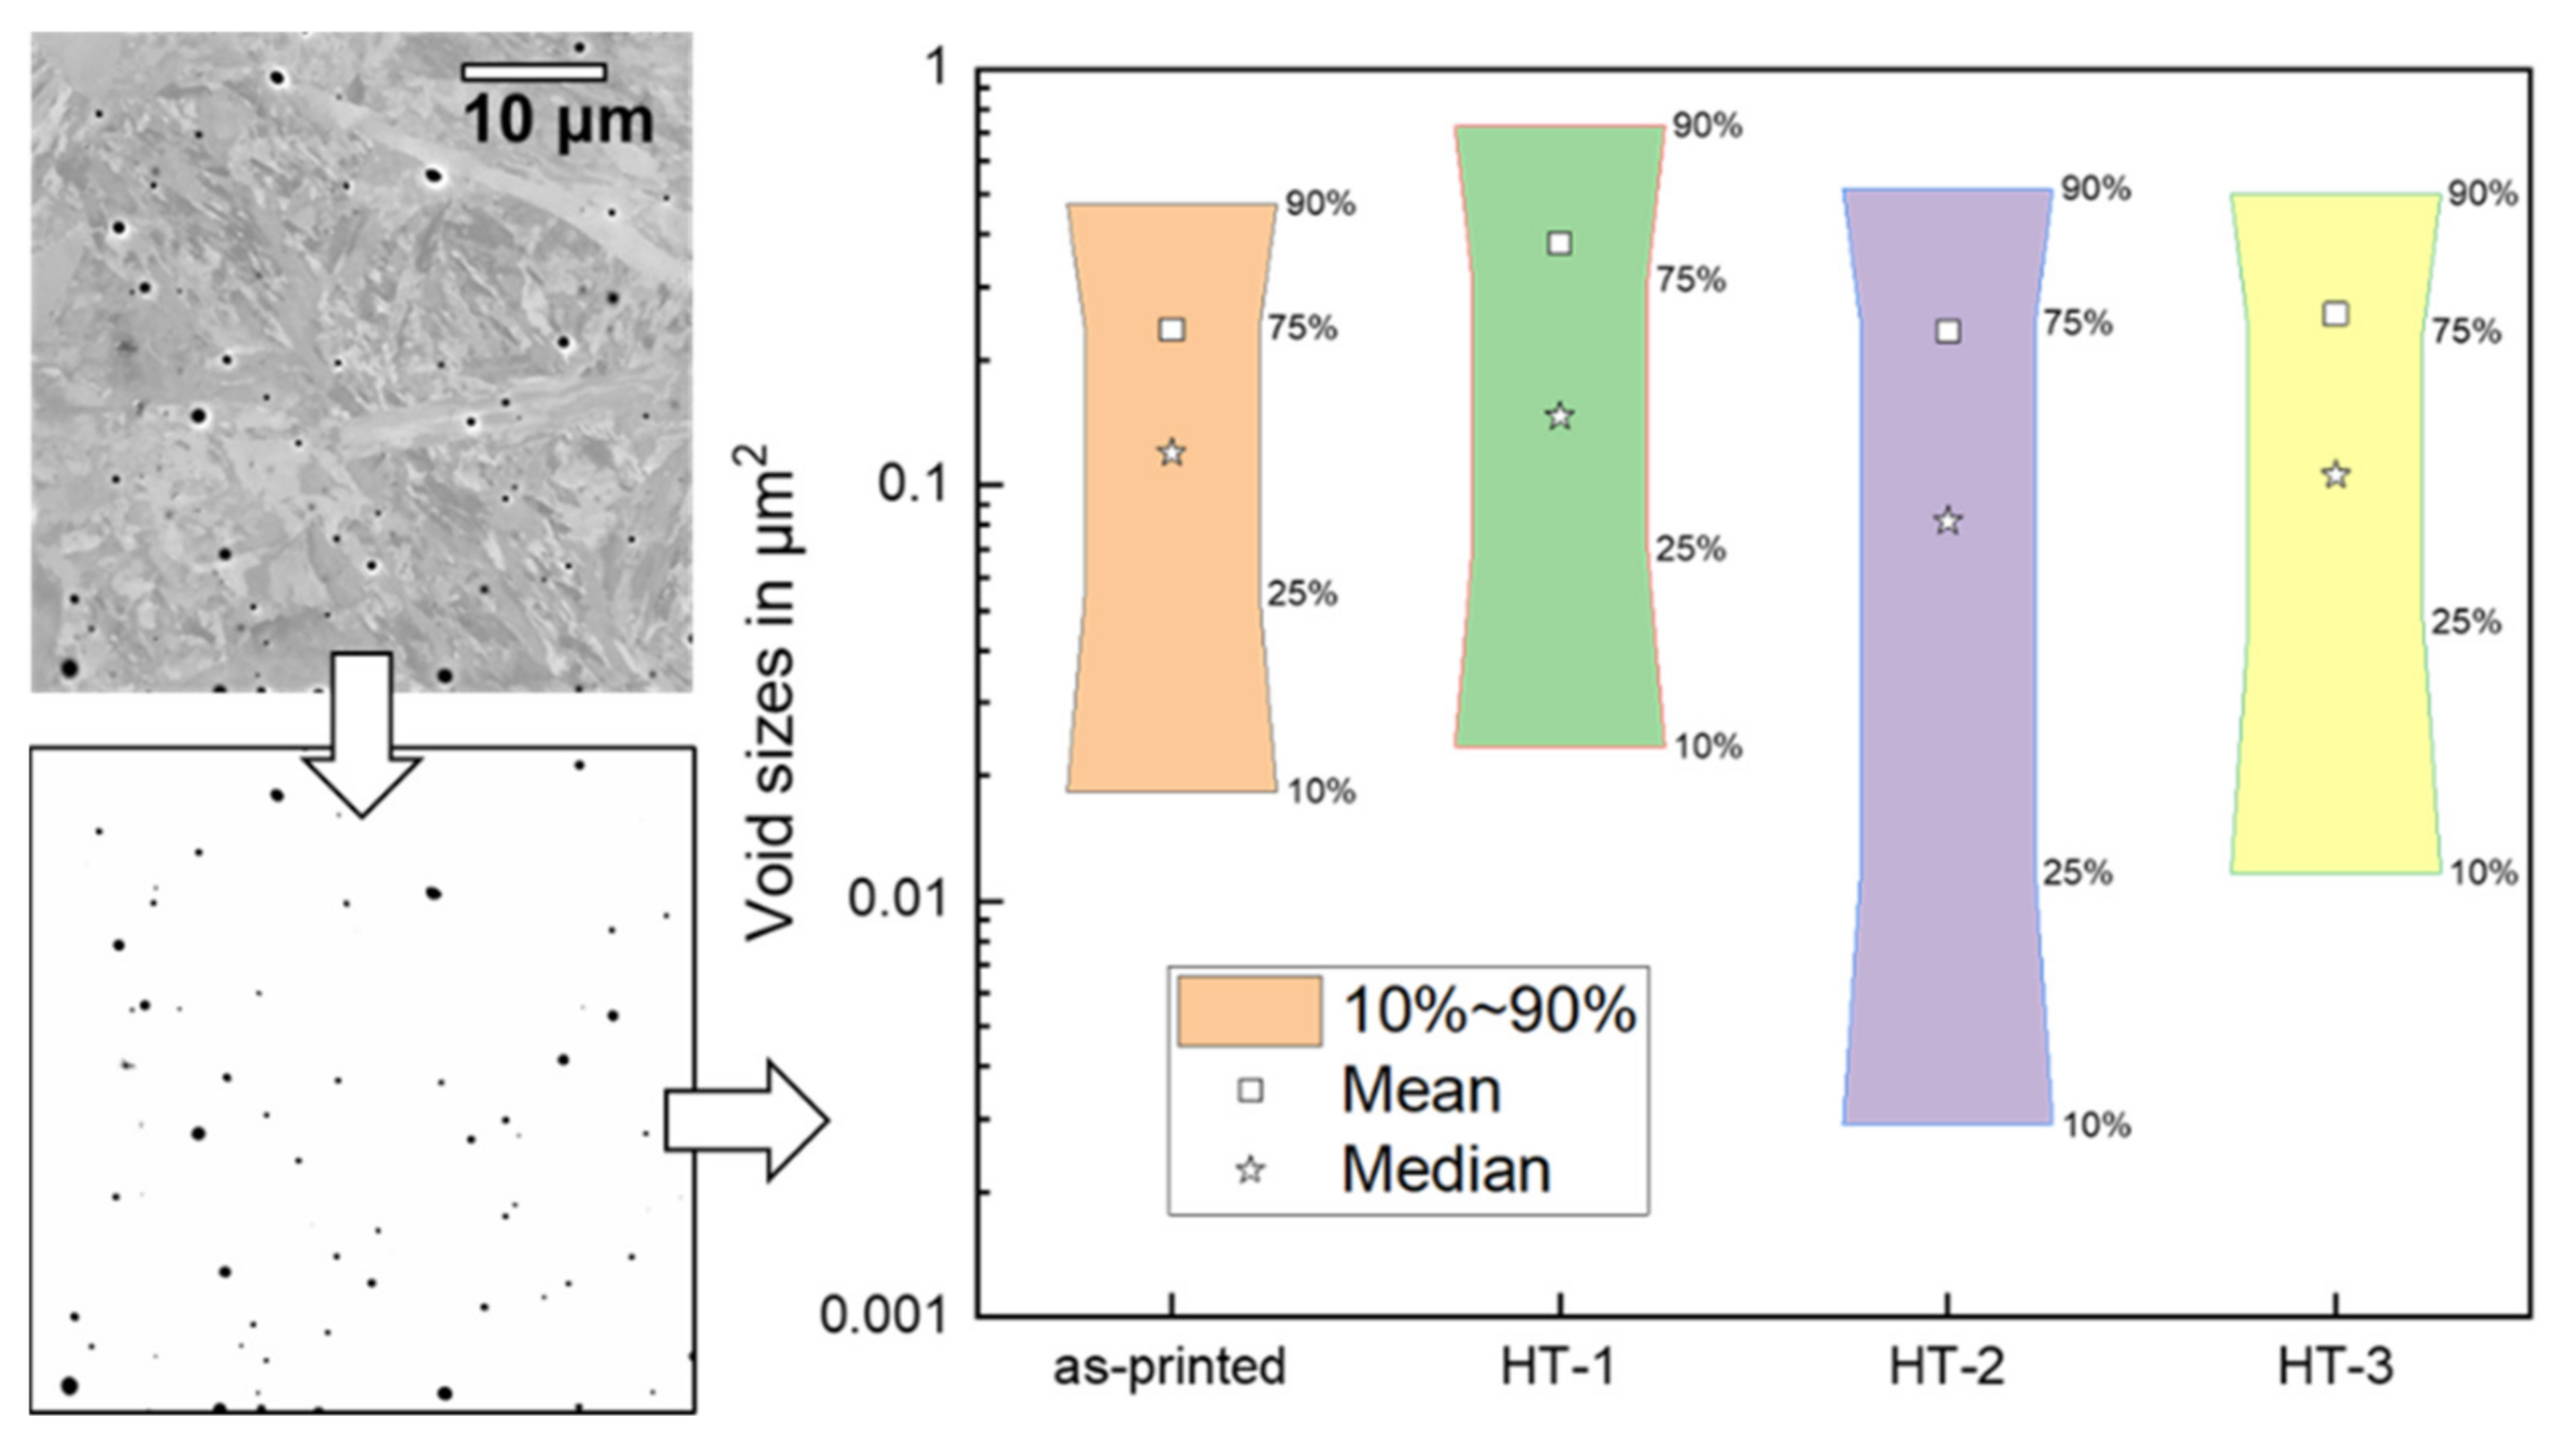
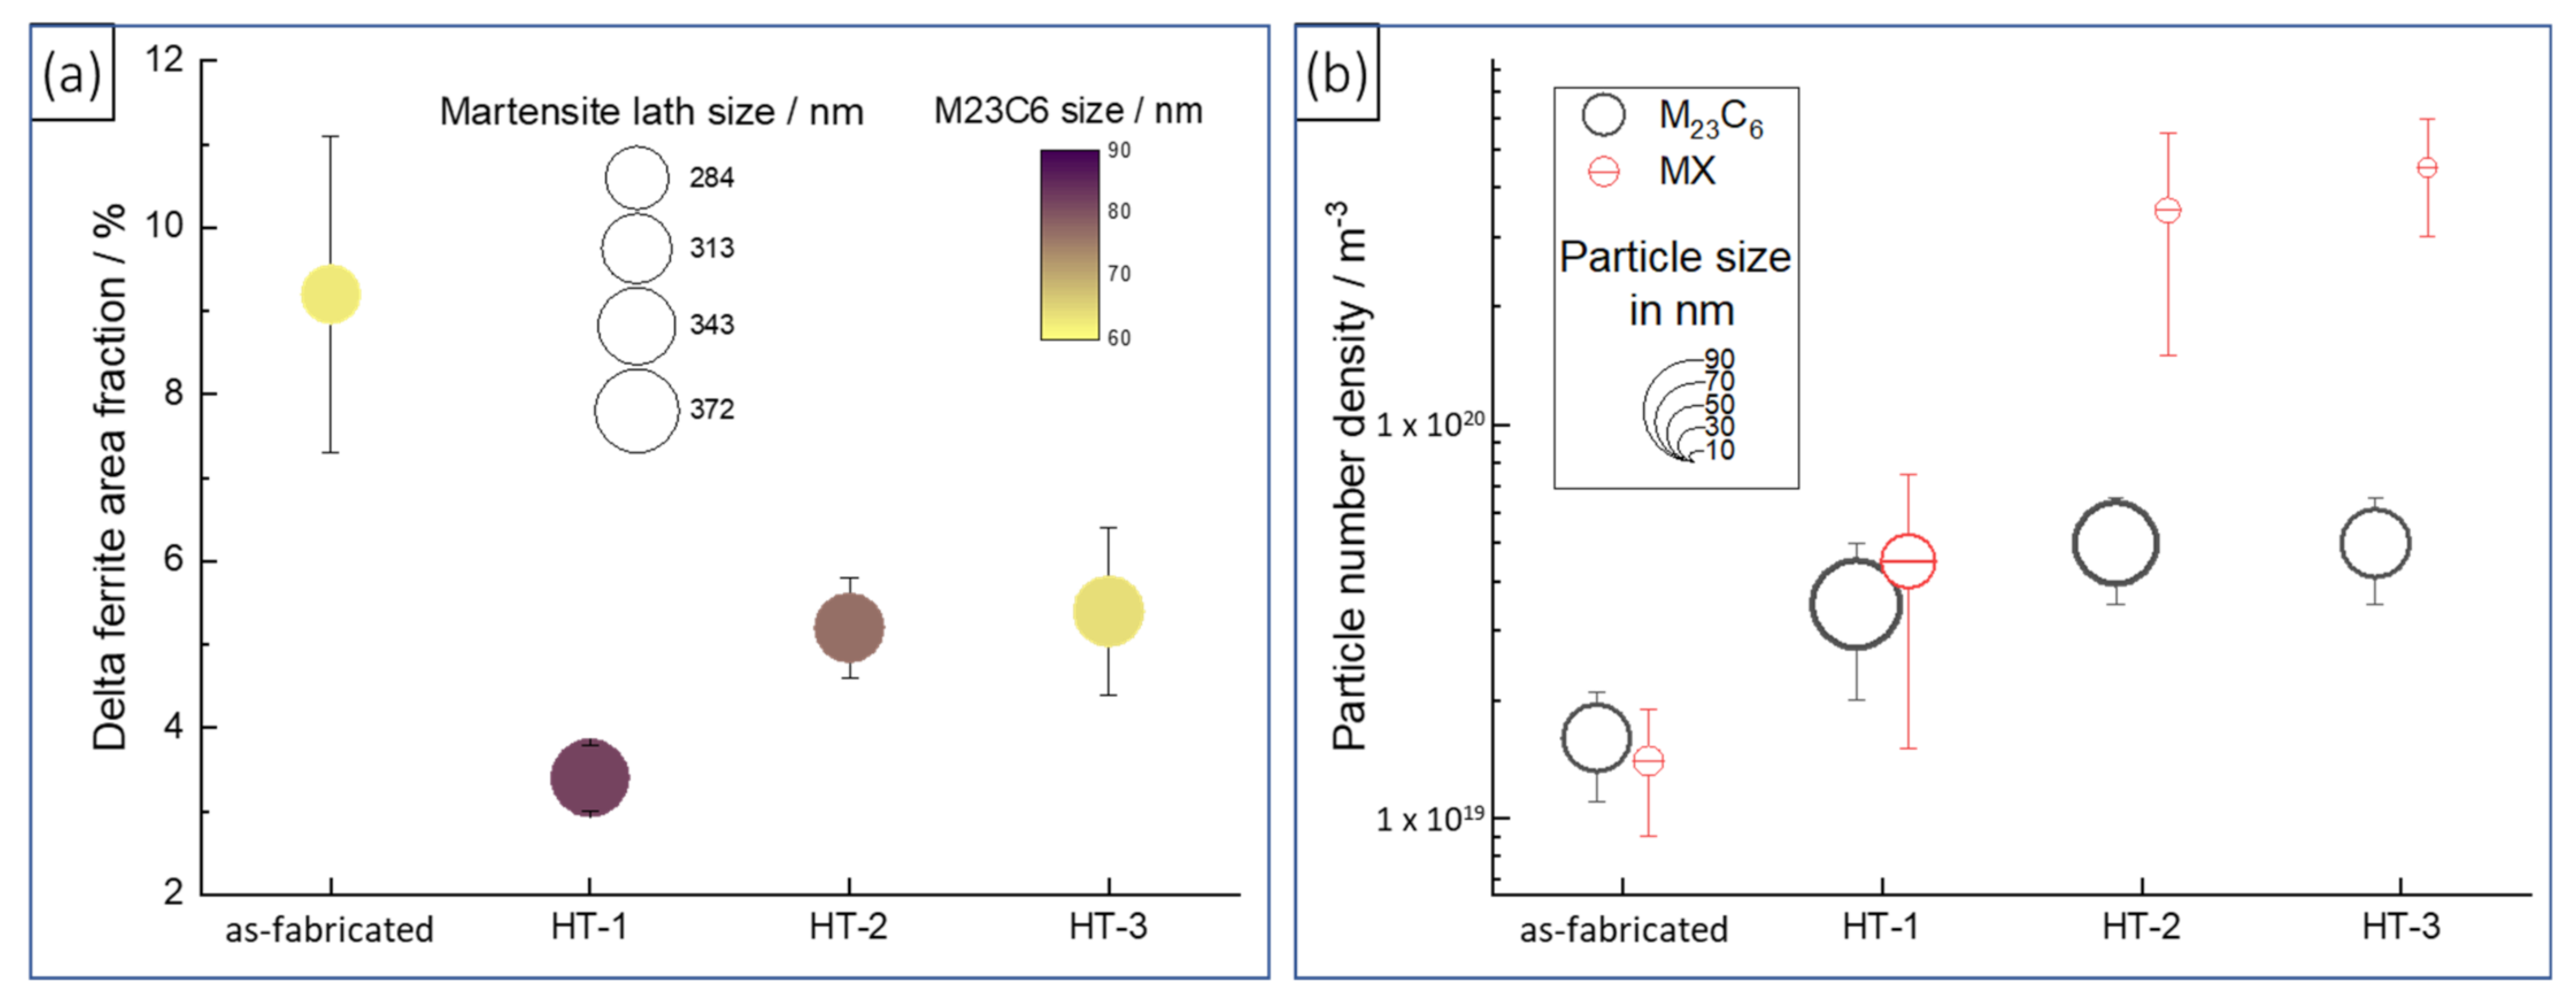
3.1. Microstructure Characterization

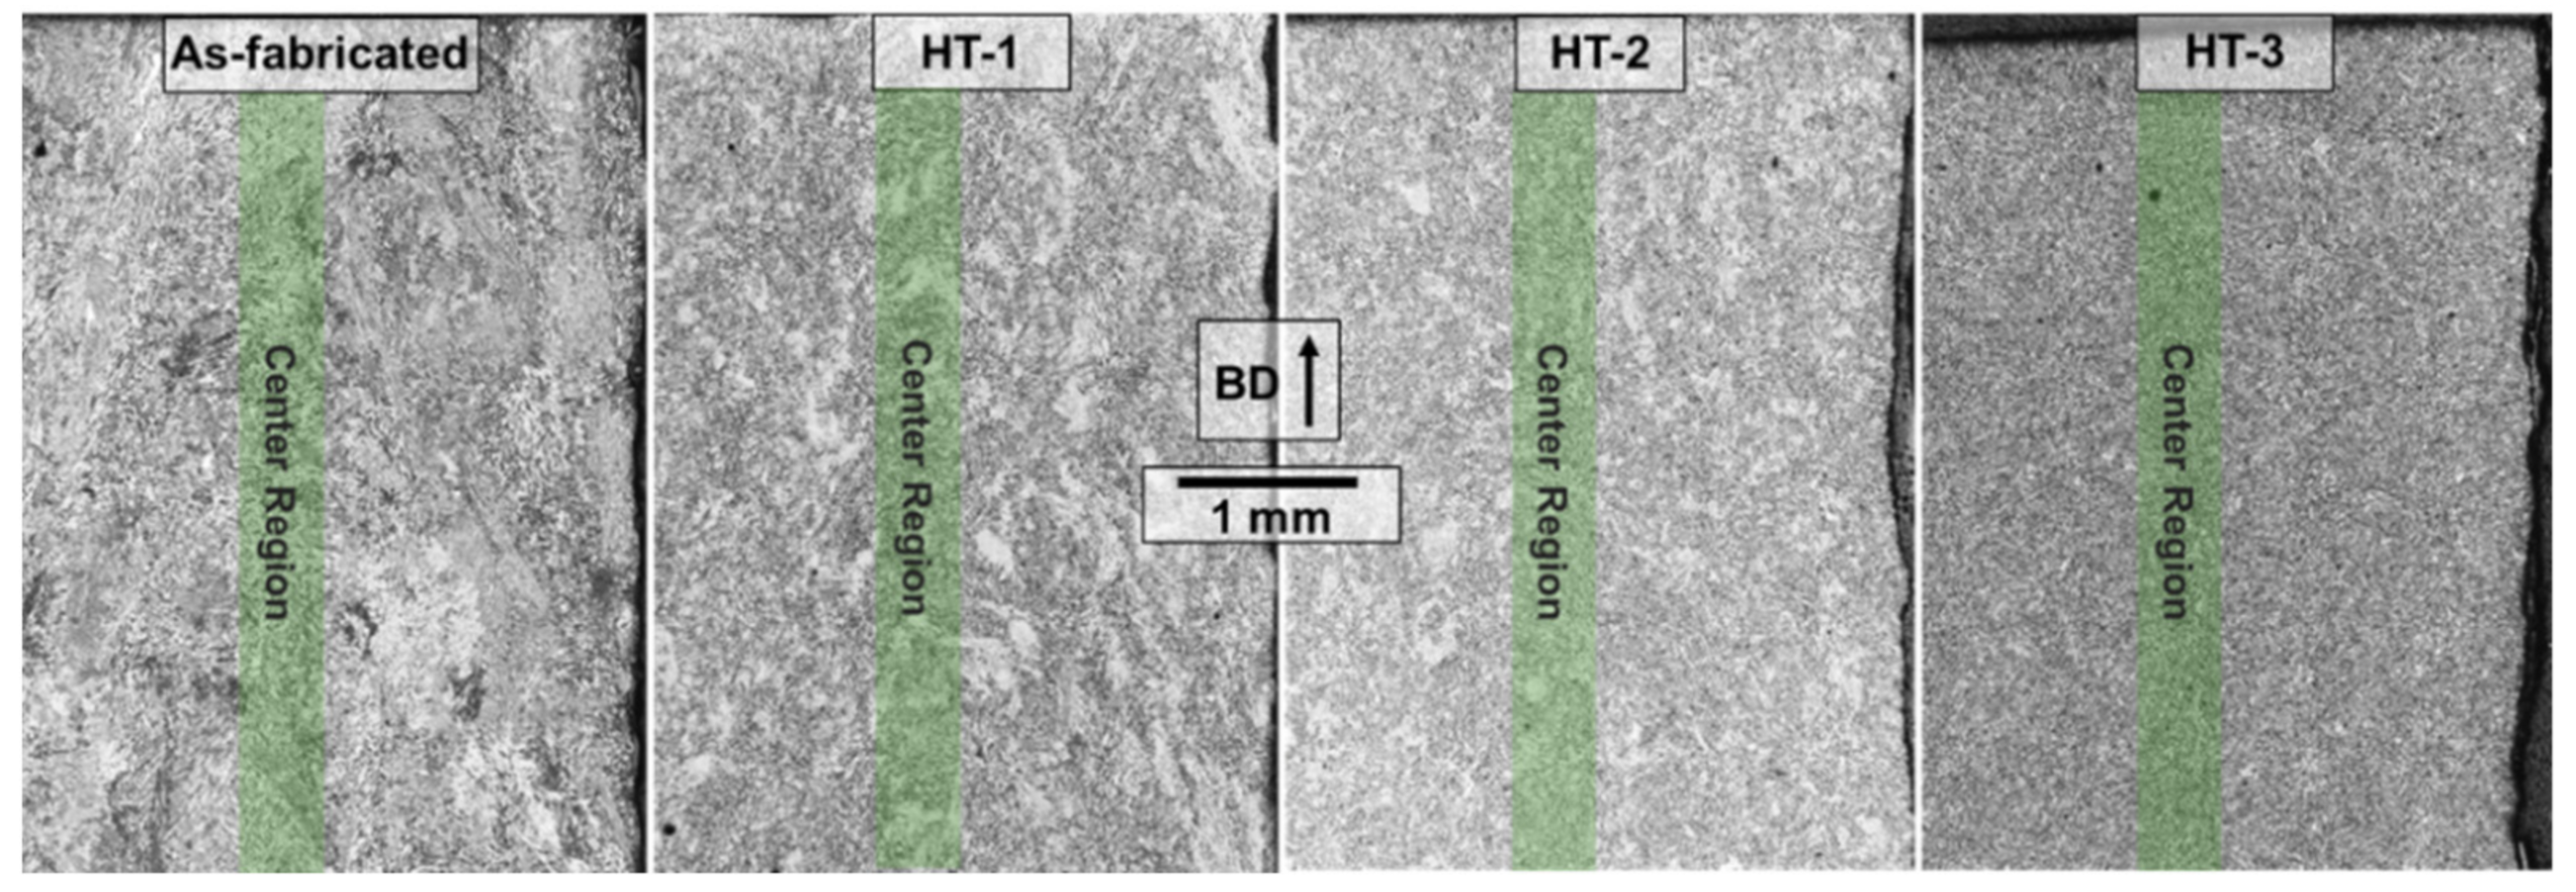
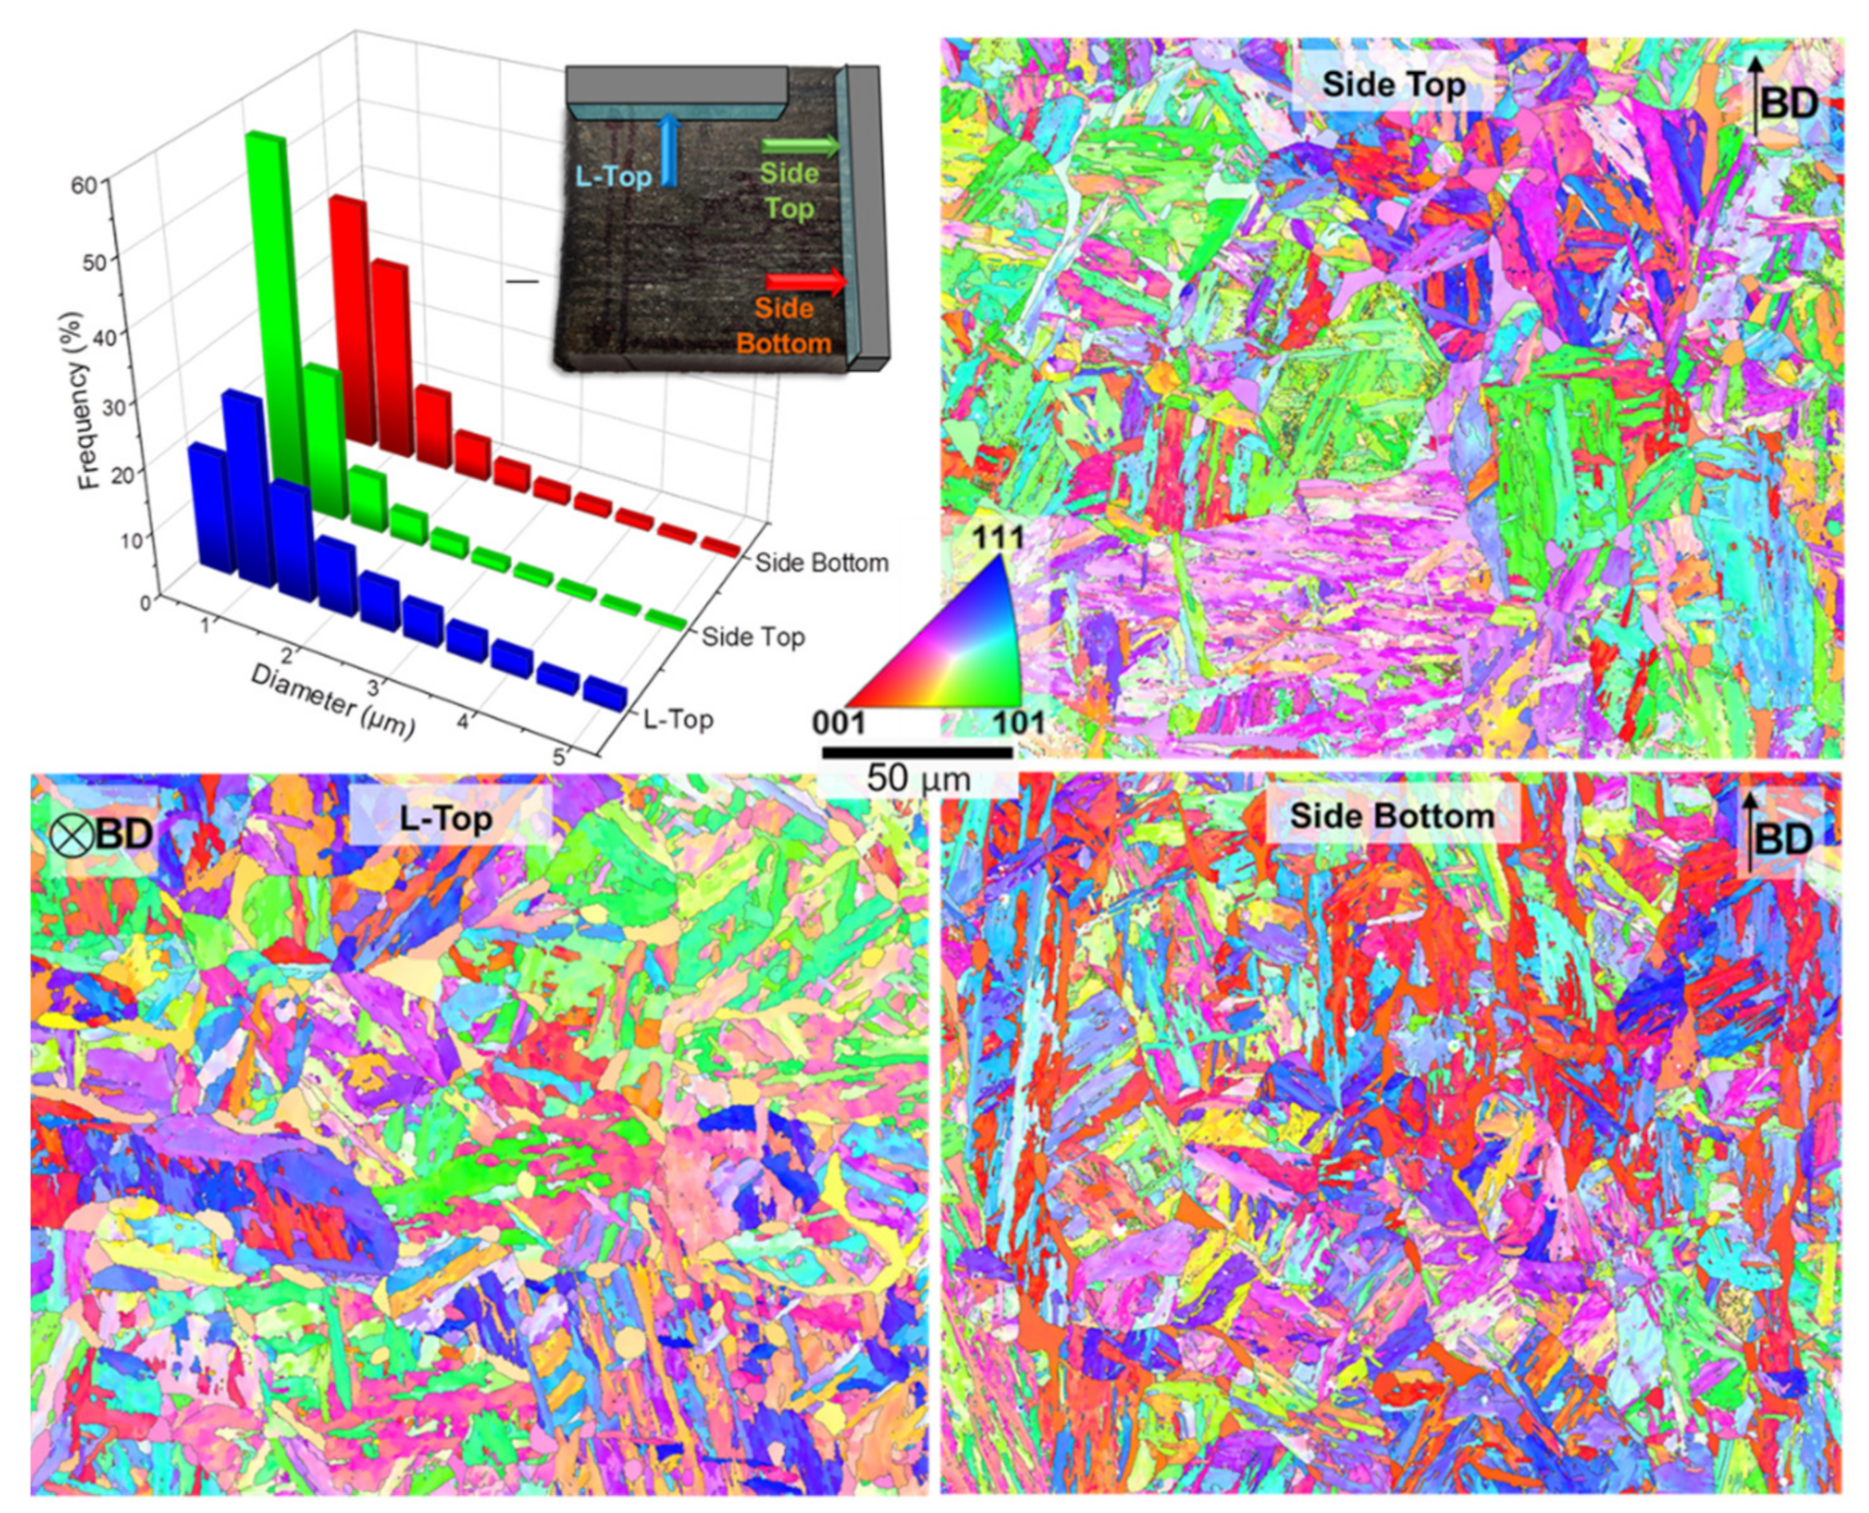
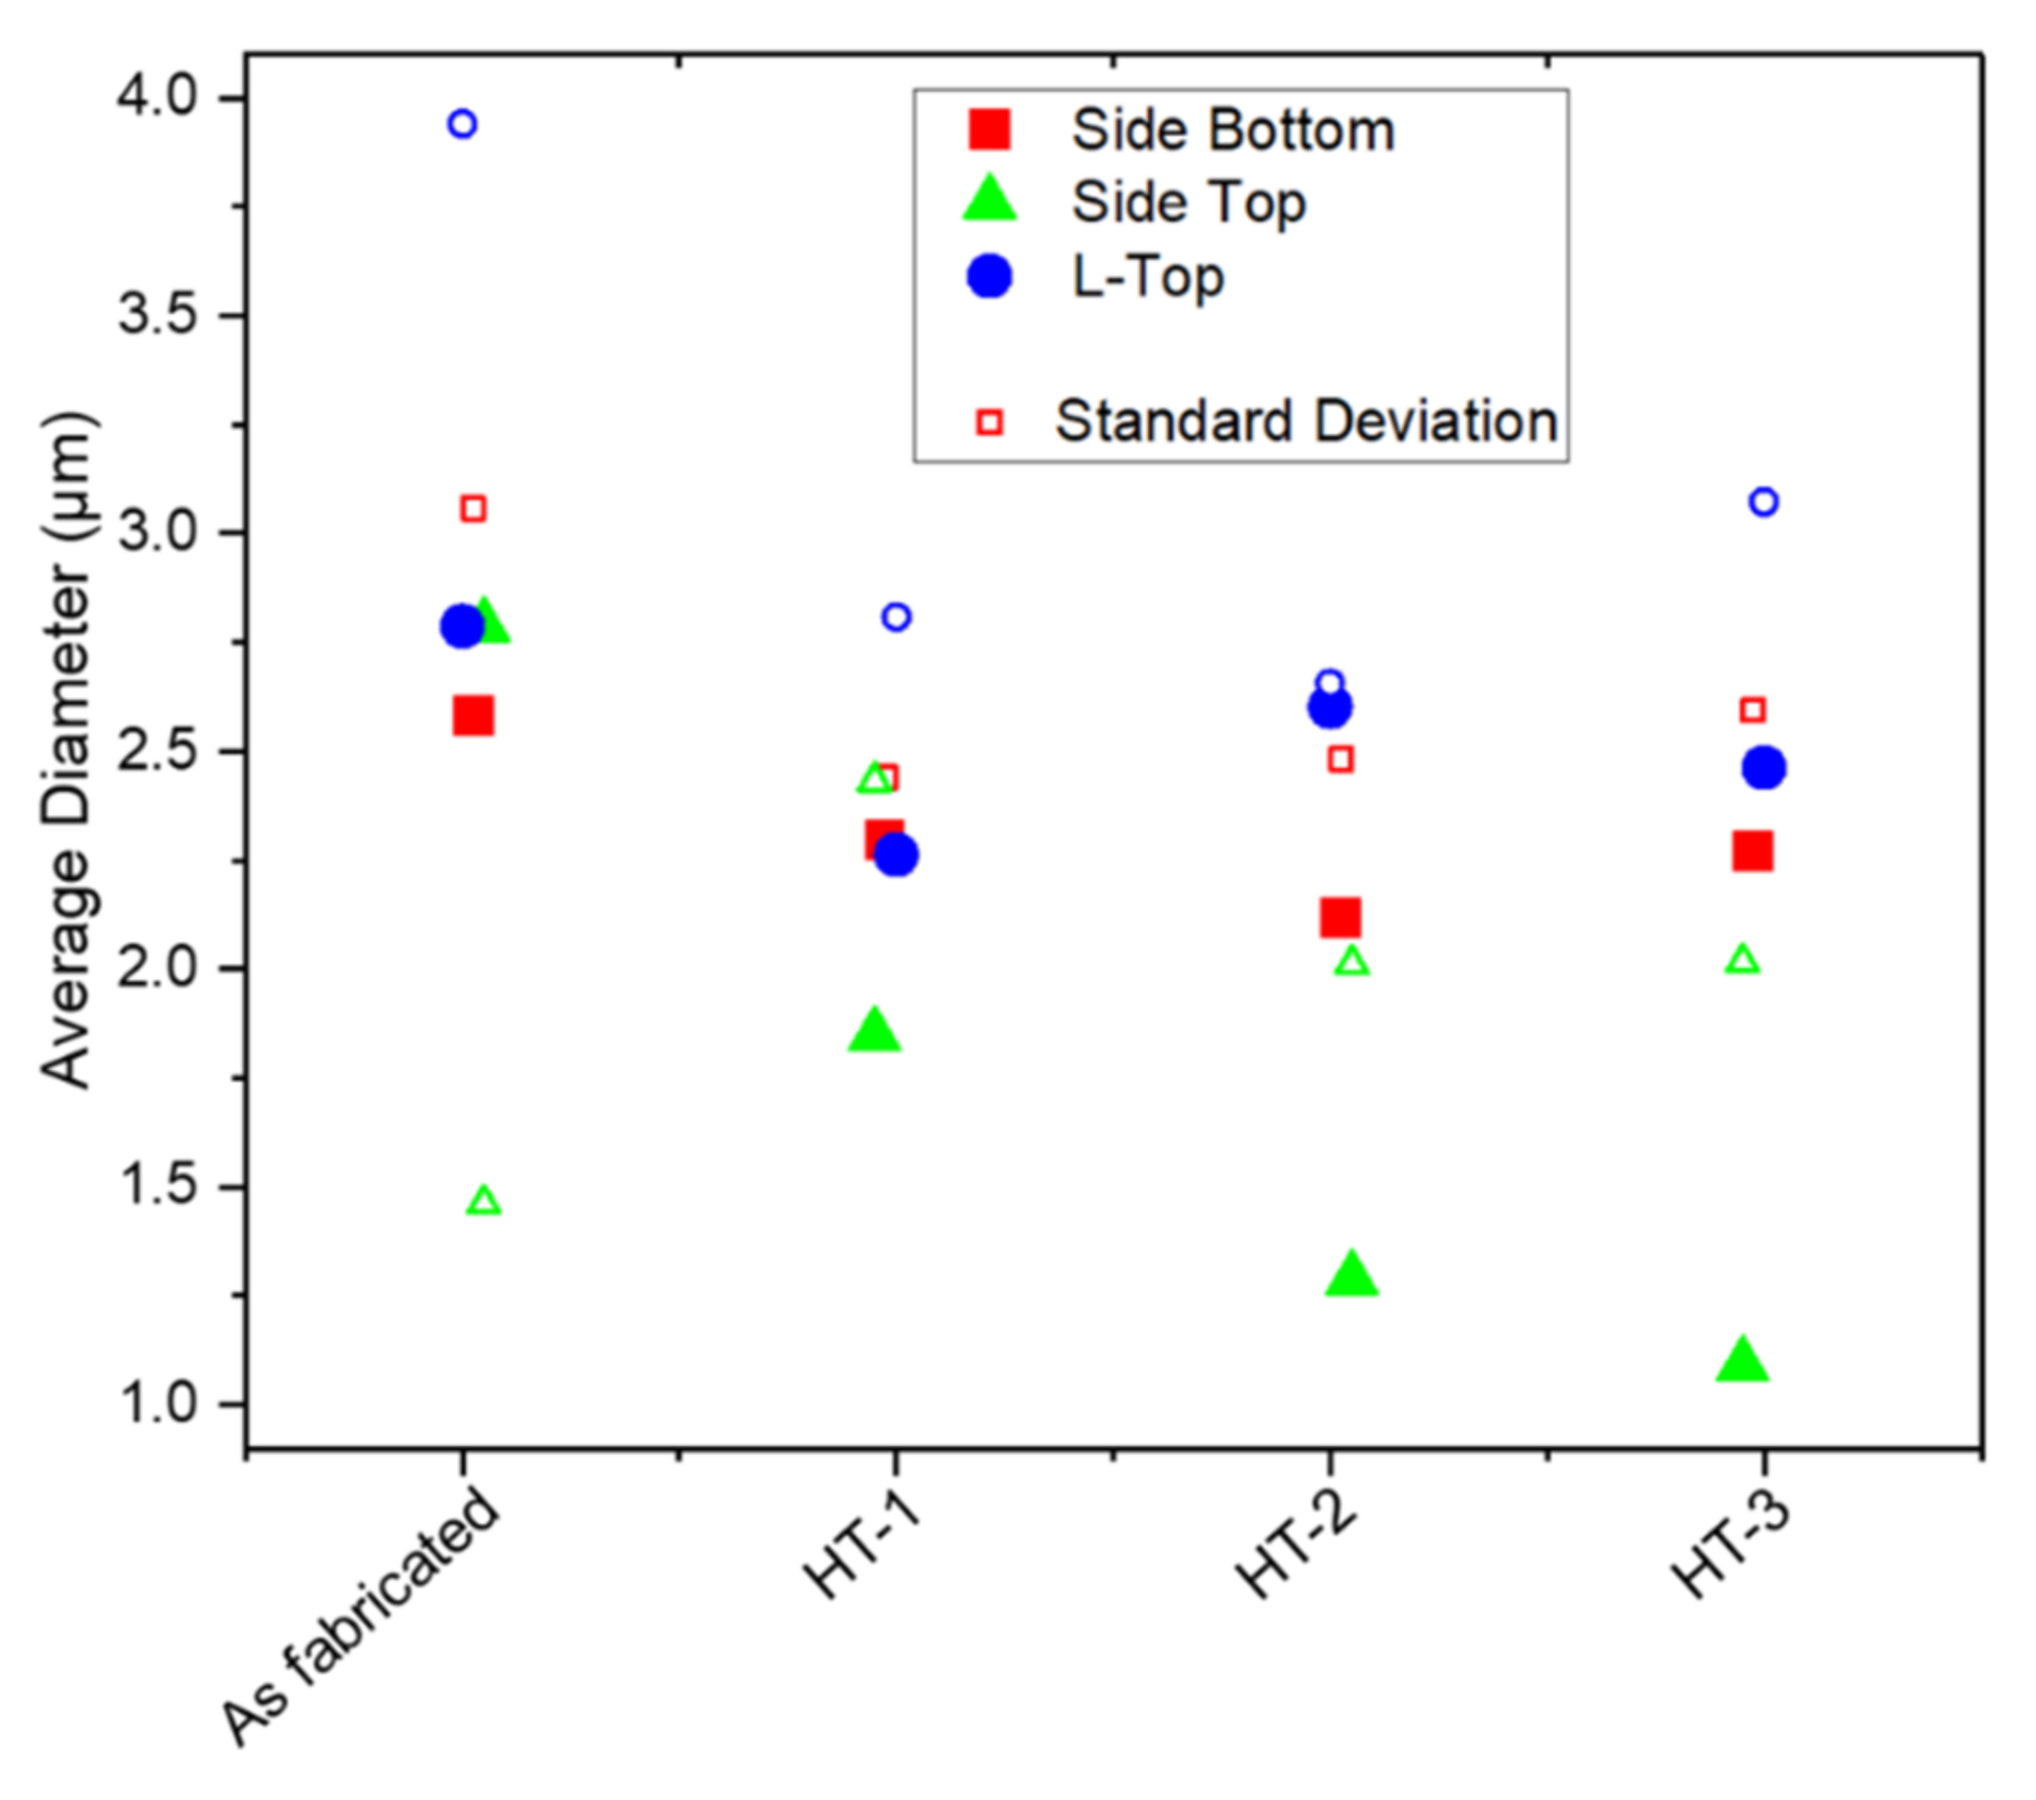
3.1.1. Impact of the Investigated Region in the Sample

Microstructure characterizations were performed at three positions labeled “L-Top”, “Side Top”, and “Side Bottom”, as shown in Figure 1. An overview of the grain structure and the difference between the boundary (top of each micrograph) and center of the as-fabricated and heat-treated samples are shown in Figure 2. Each image shows a 3.4 mm width and 4.9 mm length of the “Side Bottom” cut piece, with the top of each micrograph showing the cut between the “Side Bottom” and “Side Top” sample, as displayed in Figure 1. The build direction is from bottom to top in Figure 2. The optical micrographs for each heat treatment demonstrate a more homogenous microstructure in comparison with the as-fabricated condition. Some regions were etched less and led to some brighter spots in comparison, displayed for the EUROFER-like HT-1 and the CNA-like HT-2 micrographs in Figure 2. Those regions exhibited far fewer high angle grain boundaries, but martensite structures within the prior austenitic grains were clearly visible. EBSD methods were deployed to identify grain boundaries and kernel average misorientations as a measure to determine martensite and delta ferrite regions.
Several EBSD maps were taken in the center of the width of each sample in an attempt to minimize the impact of varying cooling rates between the center and boundary regions, the goal of which is to give better comparability between the as-fabricated and heat-treated samples. Grain sizes are shown together with inverse pole figure maps in Figure 3 exemplarily for the as-fabricated condition with a binning of 0.5 micron. The grain sizes along the build direction (BD) demonstrate a significant difference in the frequency of small grains—with 55 percent of the grains smaller than 0.75 micron in the “Side-Top” region in comparison to only 40 percent of the grains exhibiting a grain size smaller 0.75 micron in the “Side-Bottom” region. The observed grain growth appears to be the effect of an intrinsic heating of the already printed material (i.e., “Side-Bottom”) when new layers of material are printed on top (prevalent for “Side-Top”). To investigate the impact of this intrinsic heating, the mean grain diameters for all areas and sample conditions are compared in Figure 4.
The mean grain sizes for the “Side-Bottom” and the “L-Top” areas do not display any trend between grain size and heat treatment—as shown in Figure 4. However, the “Side-Top” area reveals a clear trend—that annealing reduces the mean grain size but increases the standard deviation. HT-2 and HT-3 used higher normalization temperatures in comparison with HT-1 and shorter tempering times at the same temperature as HT-1. There is no difference between HT-2 and HT-3 regarding the normalization and tempering temperatures, but the durations were halved for HT-3. Figure 4 shows that there is no significant difference in the grain size between HT-2 and HT-3, but a significant difference between those and HT-1 and the as-fabricated condition. A higher normalization temperature and a shorter tempering duration led to a reduction in the grain size in an area with its normal direction perpendicular to the build direction.
However, to investigate the impact of additive manufacturing and its intrinsic heating, tensile test samples were taken from the center of the “Side-Bottom” region, close to the “Side-Top” region, as shown in Figure 1; all further microstructure characterizations in this manuscript refer to the “Side-Bottom” region.

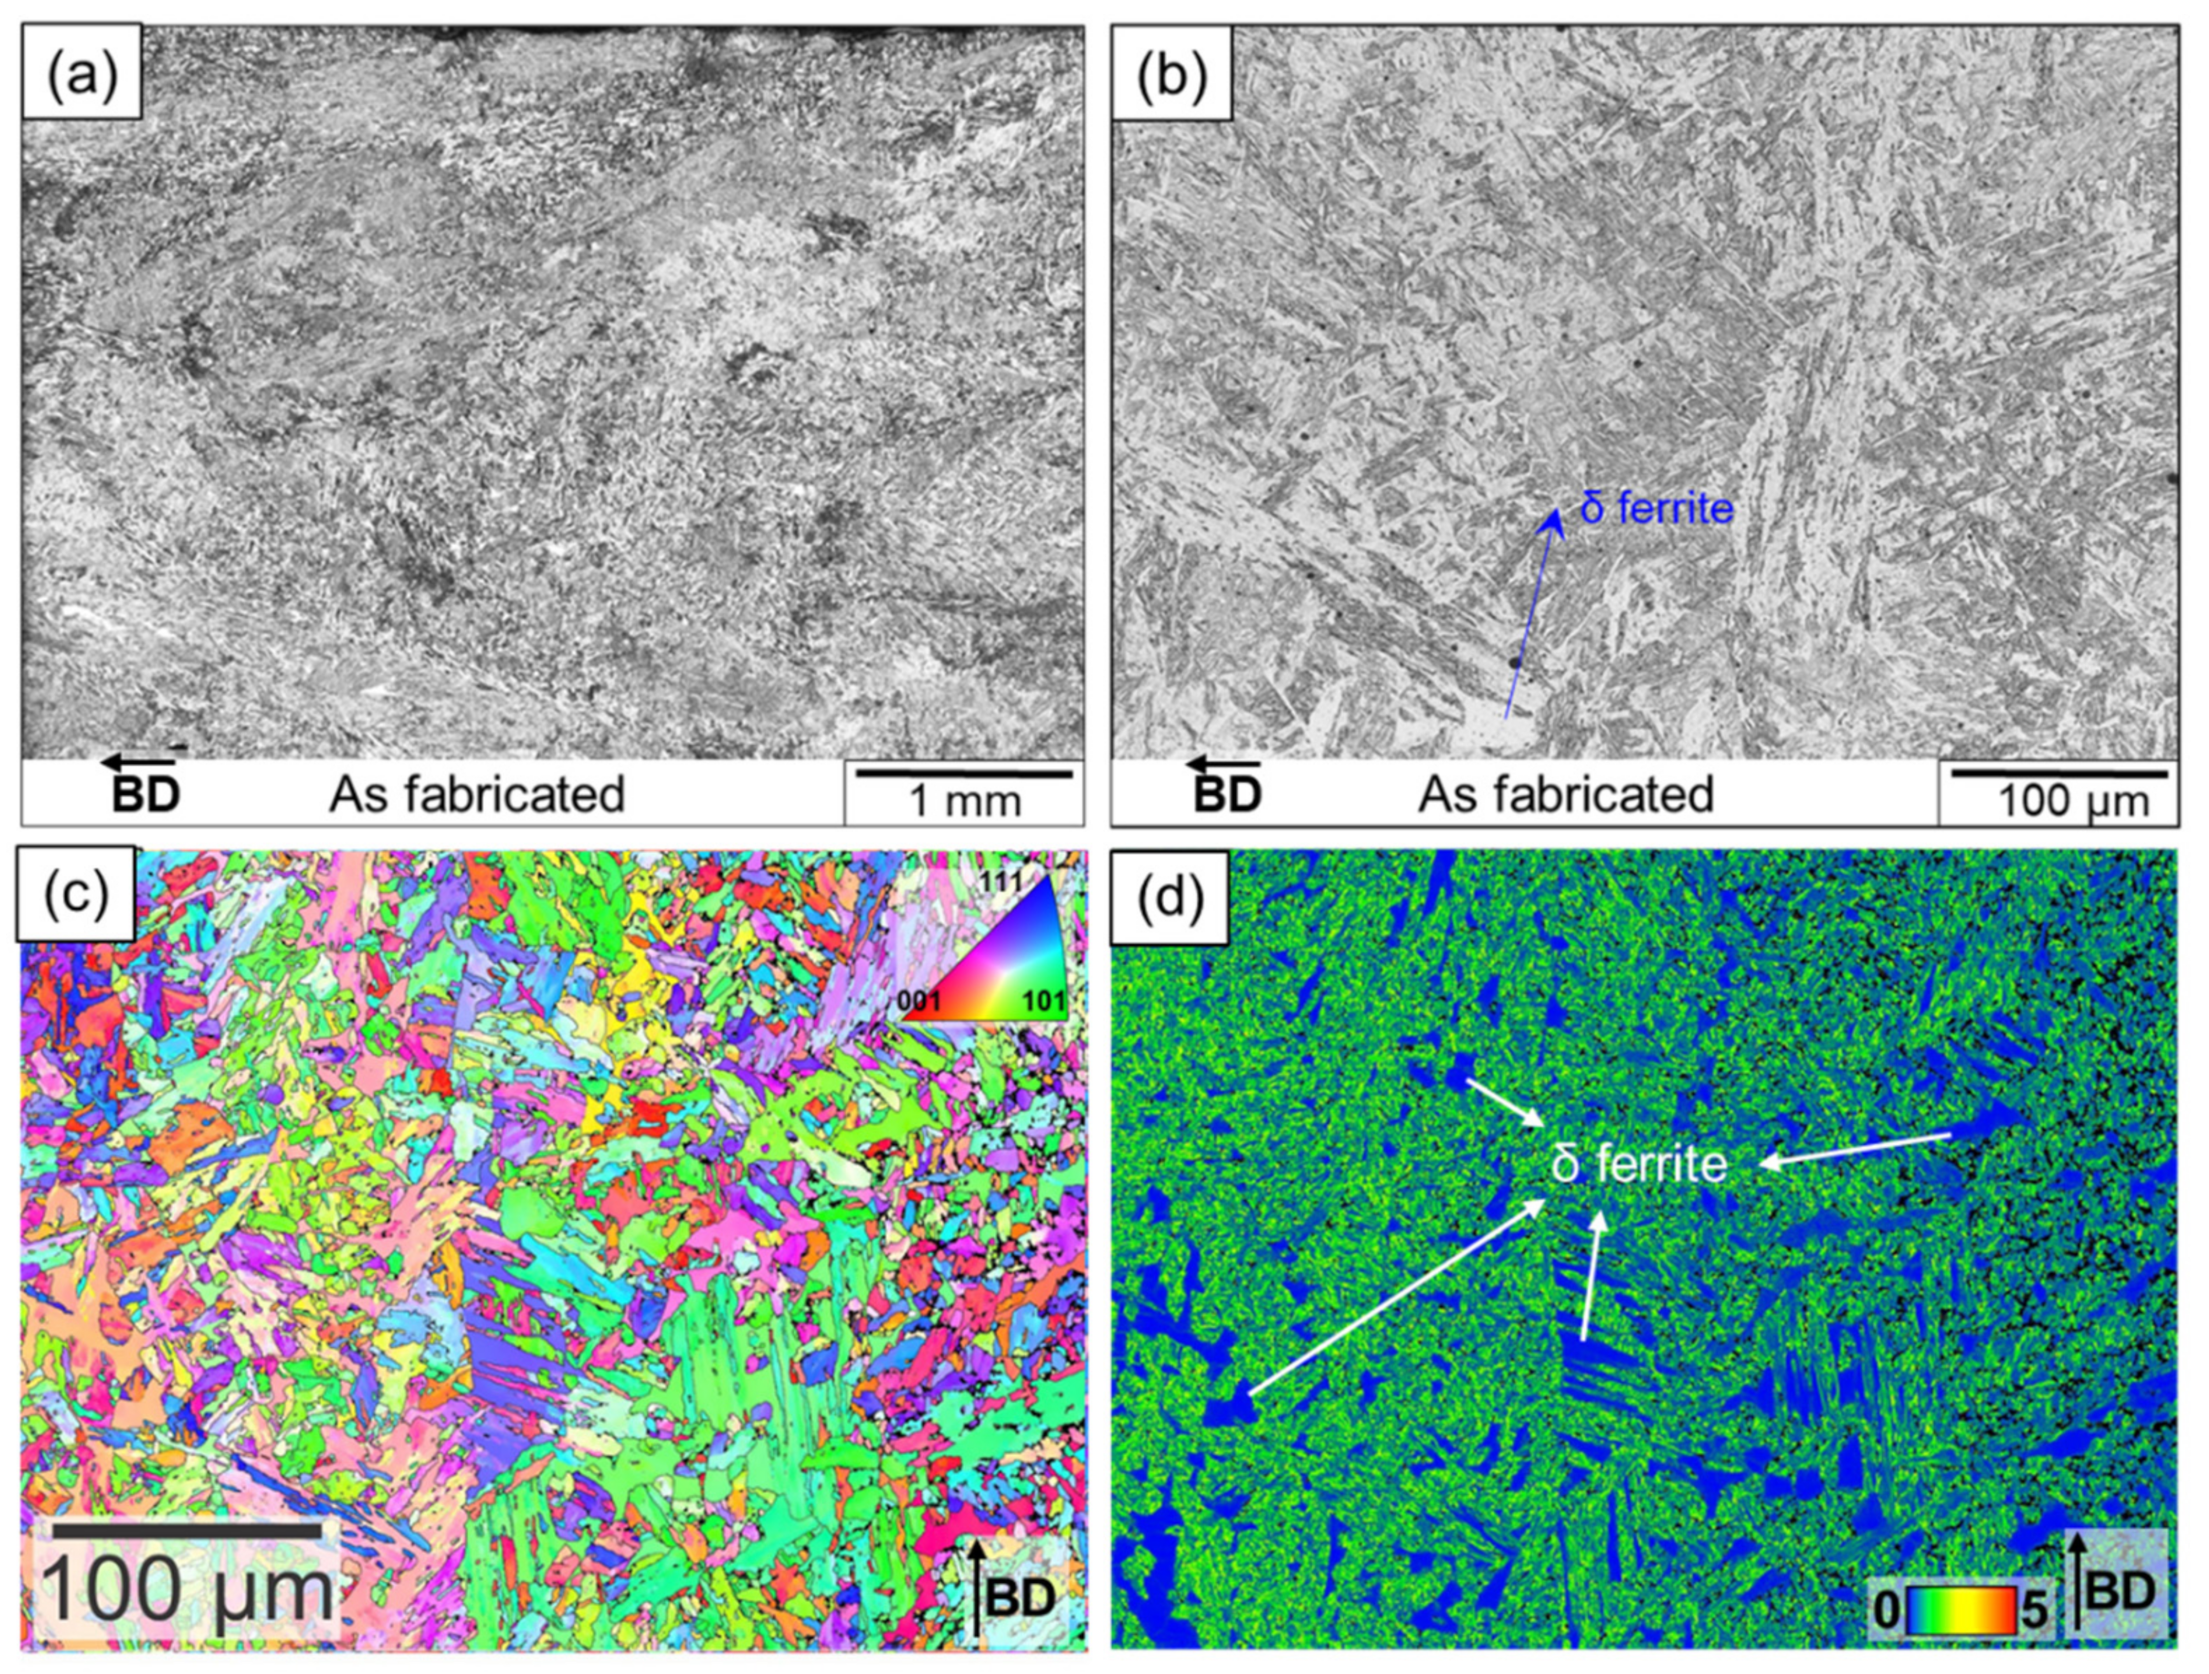
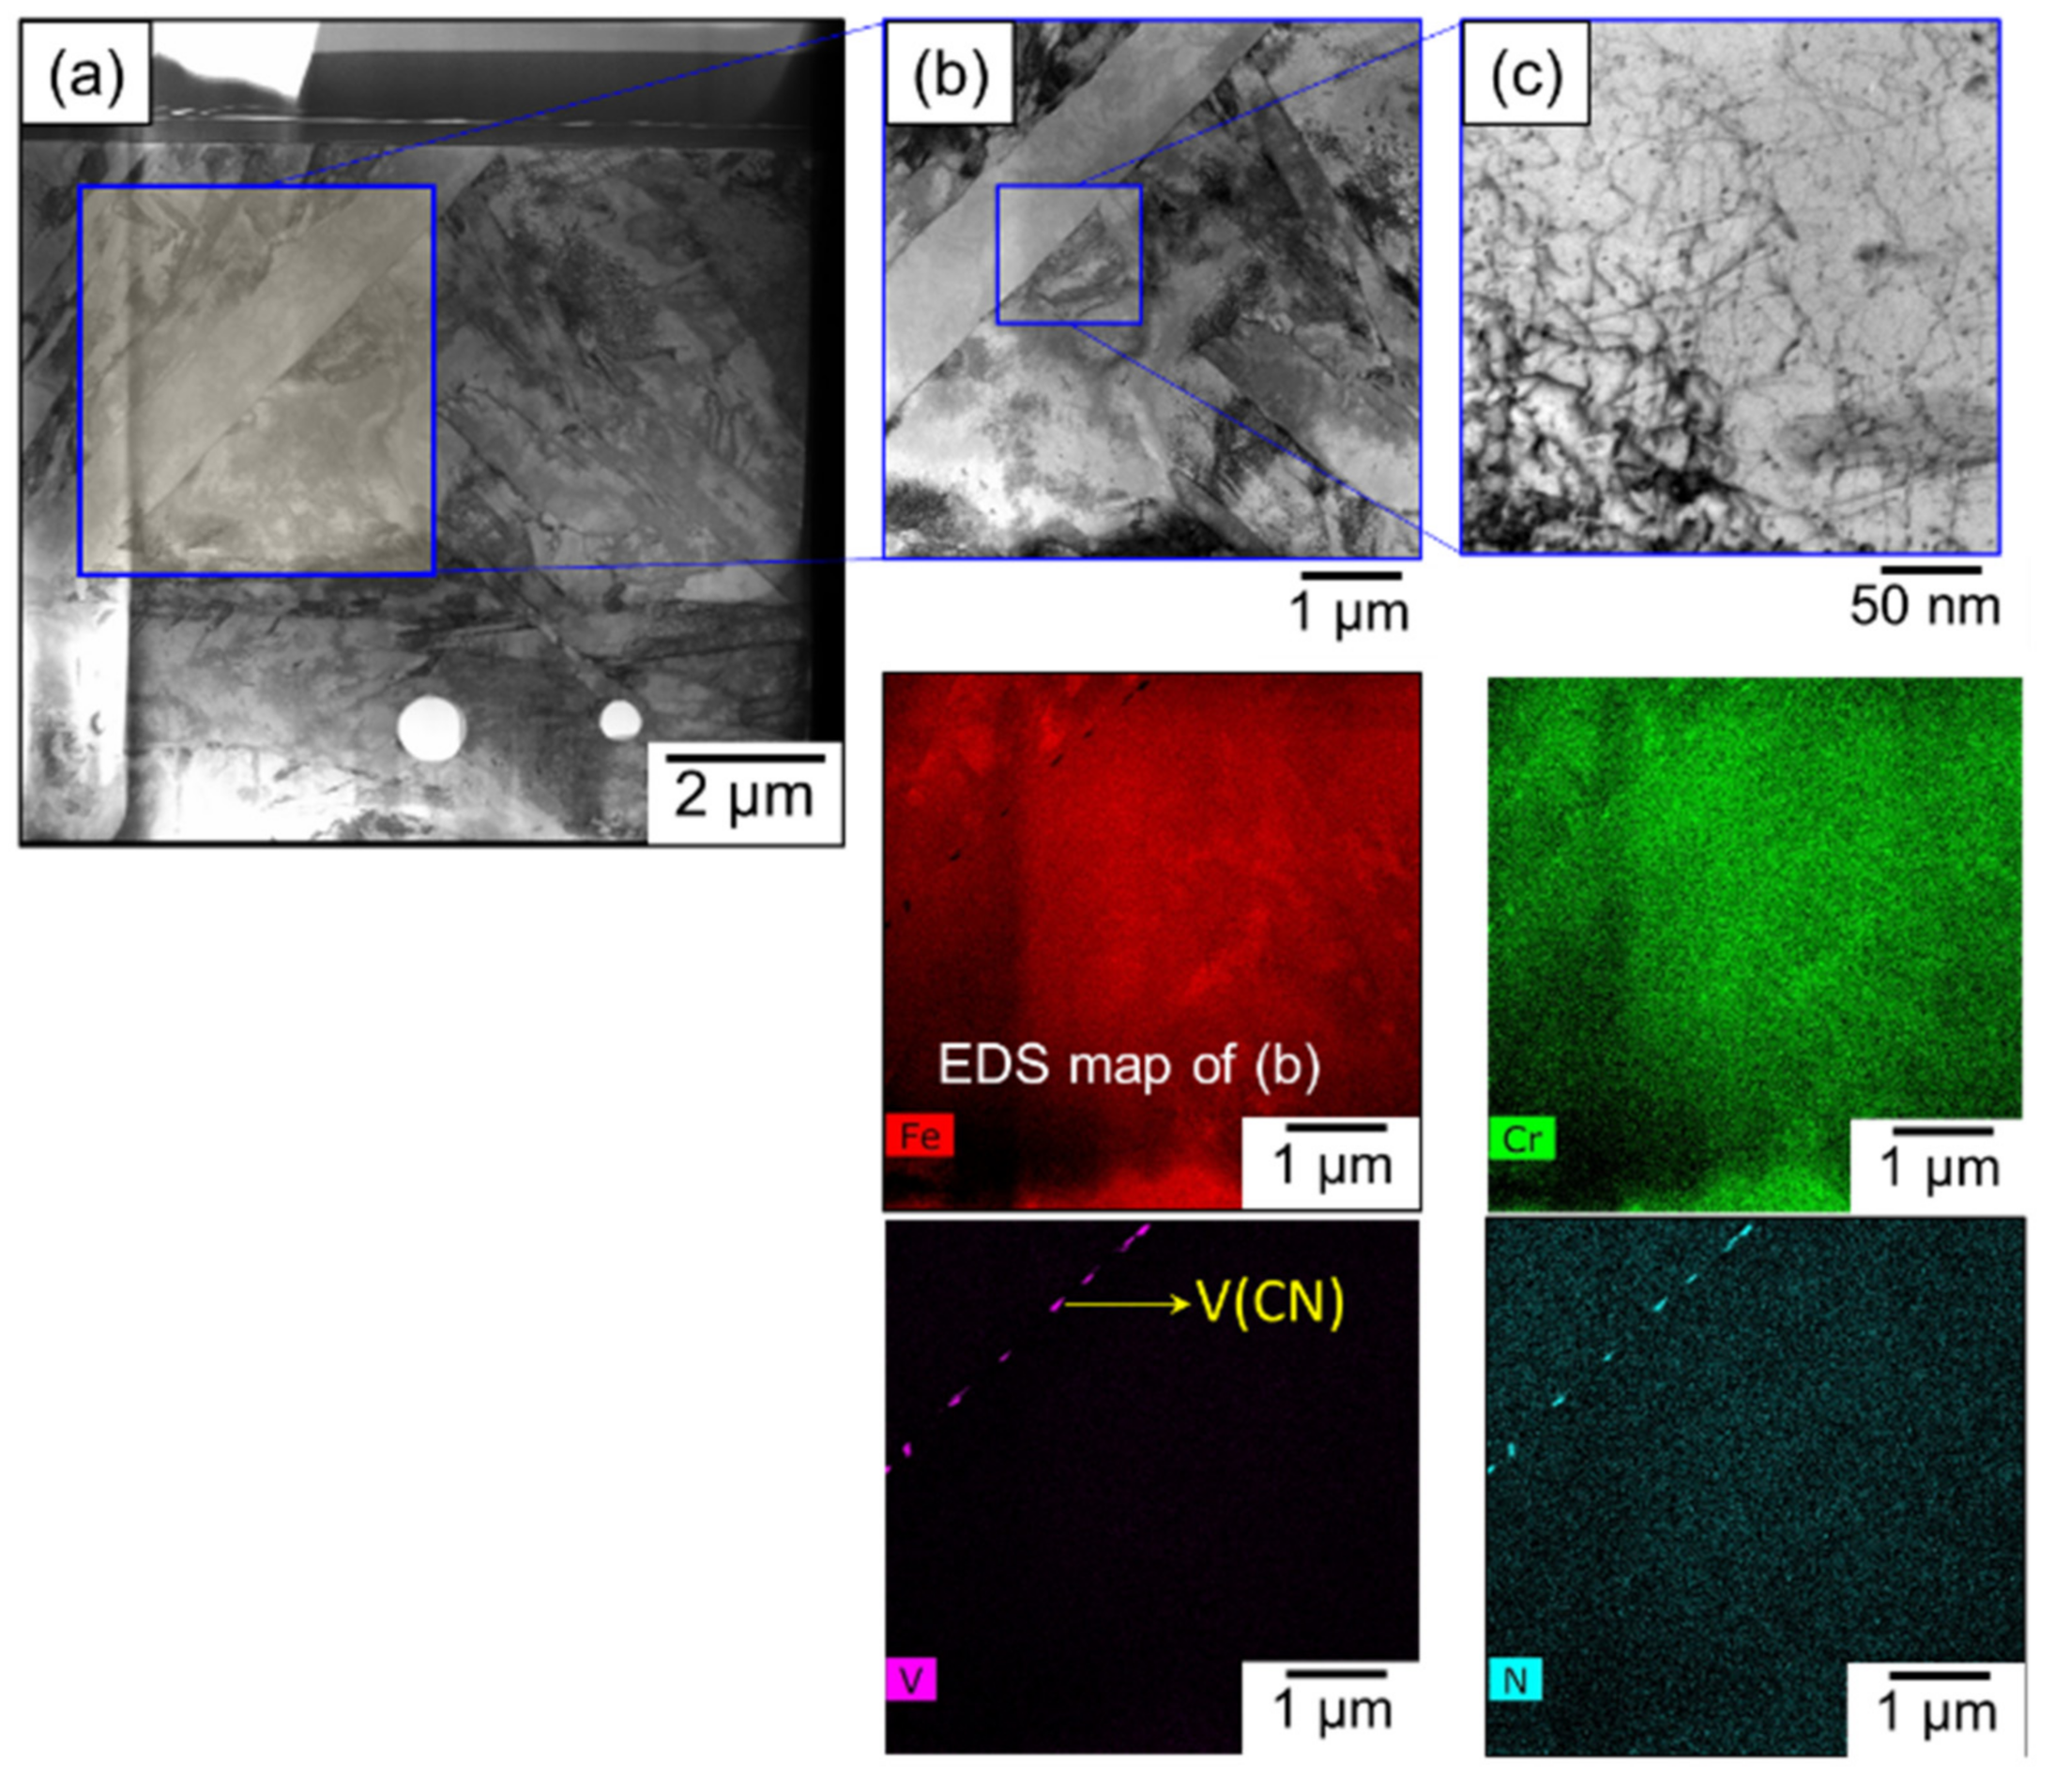
3.1.2. As-Fabricated Condition

The samples in the as-fabricated condition demonstrated extensive amount of delta ferrite and a columnar prior austenite grain structure. The microstructure was predominantly martensitic and SEM and optical microscopy could not detect the presence of any carbide/carbo nitride phases. Formation of delta ferrite in these steels has been well studied and documented. The higher delta ferrite in the sample probably resulted from the higher Cr content from the high W content in the welds. While previous work has documented the presence of a layered delta ferrite in this work, delta ferrite occurs as localized islands. The difference in morphology is probably driven by the differences in the Cr and Ni equivalent between the alloy studied in the literature and the alloy under investigation. The mechanism of formation of delta ferrite during reheating or solidification has been discussed extensively by Sridharan et al. and will not be discussed here [2]. To rationalize whether these islands form via a reheating mechanism or primary delta ferrite during solidification, optical microscopy and electron back scatter diffraction was performed, and the results are presented in Figure 5. Figure 5a,b shows optical microscopy images at different magnifications to demonstrate the uniformity of the sample between the center and the boundary region. Figure 5c shows the inverse pole figure (IPF) map of the center of a different area in comparison with the area shown in Figure 3, and Figure 5d displays the Kernel average misorientation (KAM) map of Figure 5c.
Both martensite and delta ferrite have similar crystal structures with BCC and BCT lattices, respectively. However, the metastable BCT structure of martensite exhibits higher dislocation densities and demonstrates a higher KAM value, while the delta ferrites have a smaller KAM value and correspond to the blue regions in the KAM map in Figure 5d. The orientation of these delta ferrite grains can then be detected from the inverse pole figure in Figure 5c. Predominantly, most of the delta ferrite grains have a <100> pole indicative that the delta ferrite does not occur during reheating and is from the solidification process [48], but some areas, such as in Figure 5, show varying delta ferrite orientations. To investigate the lath structure and the presence of carbides in the build scanning TEM (STEM), EDS was performed on the samples, and the results are presented in Figure 6.
The TEM micrographs clearly demonstrate the presence of an untempered martensitic structure. The martensitic laths are heavily dislocated, indicating that the subsequent passes did not temper the microstructure. The EDS maps of vanadium and chromium also indicate a low density of vanadium nitrides and chromium carbides unlike previous studies, suggesting that the chemical composition of the alloy used for this study has an increased resistance to tempering in comparison with previously tested alloys [2,49].
Therefore, to optimize the microstructure, a series of post-processing treatments were performed to understand the relationship between structure and processing. Typically, ferritic martensitic steels are subject to normalizing and tempering post-processing treatments to eliminate delta ferrite and ensure a high density of refined MX and M23C6 precipitates [50]. The key is to ensure that the normalizing treatments dissolve pre-existing carbides and carbo nitrides and the tempering treatments should ensure an optimum size distribution of precipitates. To optimize the heat treatments CALPHAD-based Pandat software with an in-house database [51] was used to determine the normalizing and tempering treatments. In addition, two heat treatments were selected to replicate wrought material treatments. The third treatment was designed to eliminate the delta ferrite. Figure 7 shows the thermodynamic calculations, highlighting the major phases in Figure 7a and pointing out the precipitate formation in Figure 7b. Figure 7a shows clearly that the normalization temperature for HT-1 (typical EUROFER97 heat treatment) completely transforms the microstructure in fcc gamma at 980 °C but is not high enough to dissolve already existing V-rich carbides (V,Ta)(C,N), as shown in Figure 7b. Those carbides fully dissolve at around 1060 °C. CNA-like heat treatments 2 and 3 are set at a higher normalization temperature to dissolve and precipitate those carbides during the tempering process. However, HT-2 and 3 are very close to the bcc delta phase region, which could lead to a localized formation of delta ferrite. The tempering times were carefully chosen to form a large number of nanosized MX-type precipitates, while limiting the formation of M23C6 type precipitates. In addition, the tempering temperatures were high enough to avoid the formation of an embrittling C14 Laves phase.

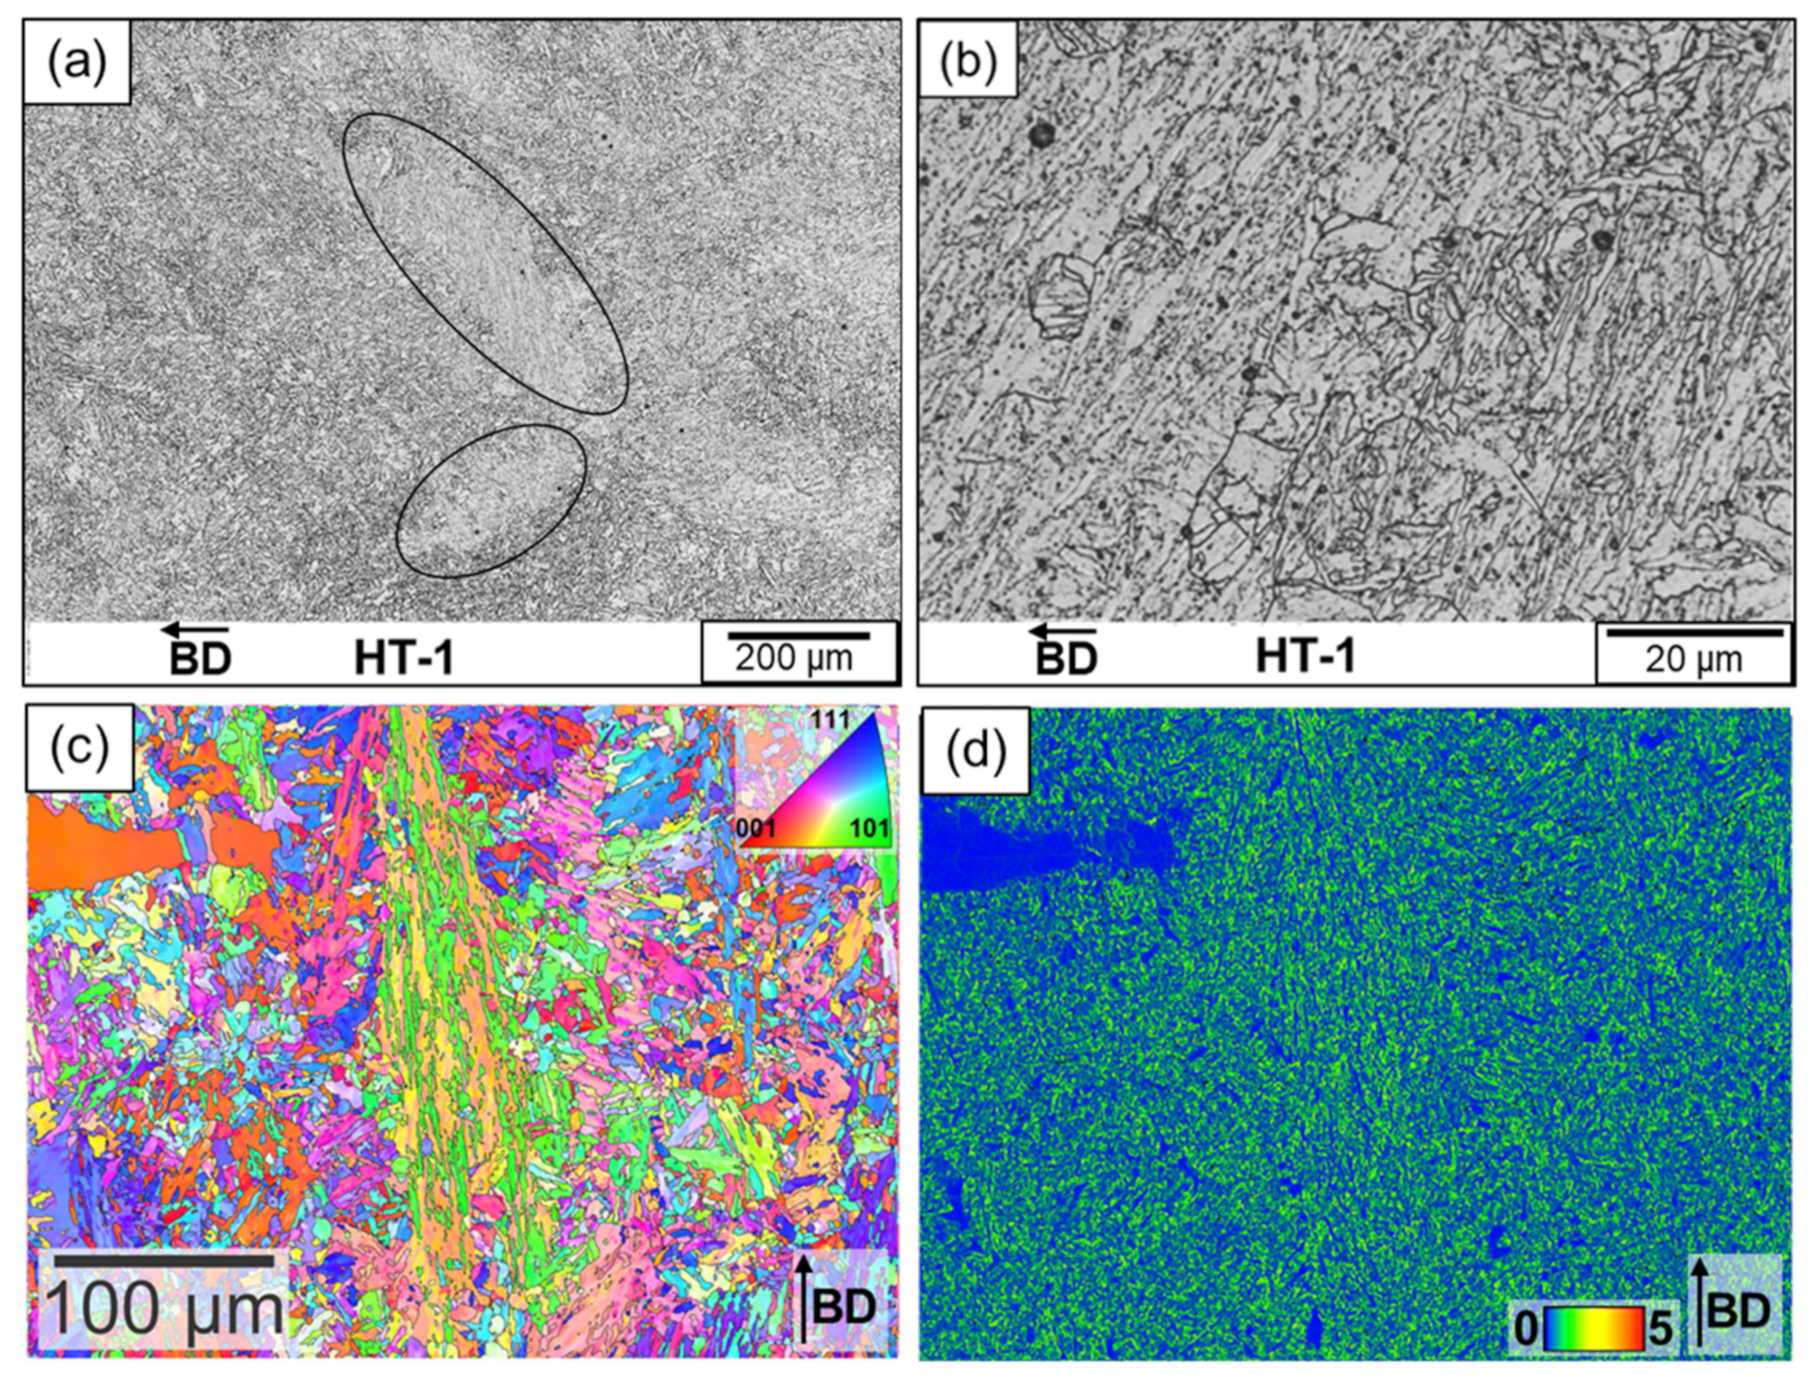
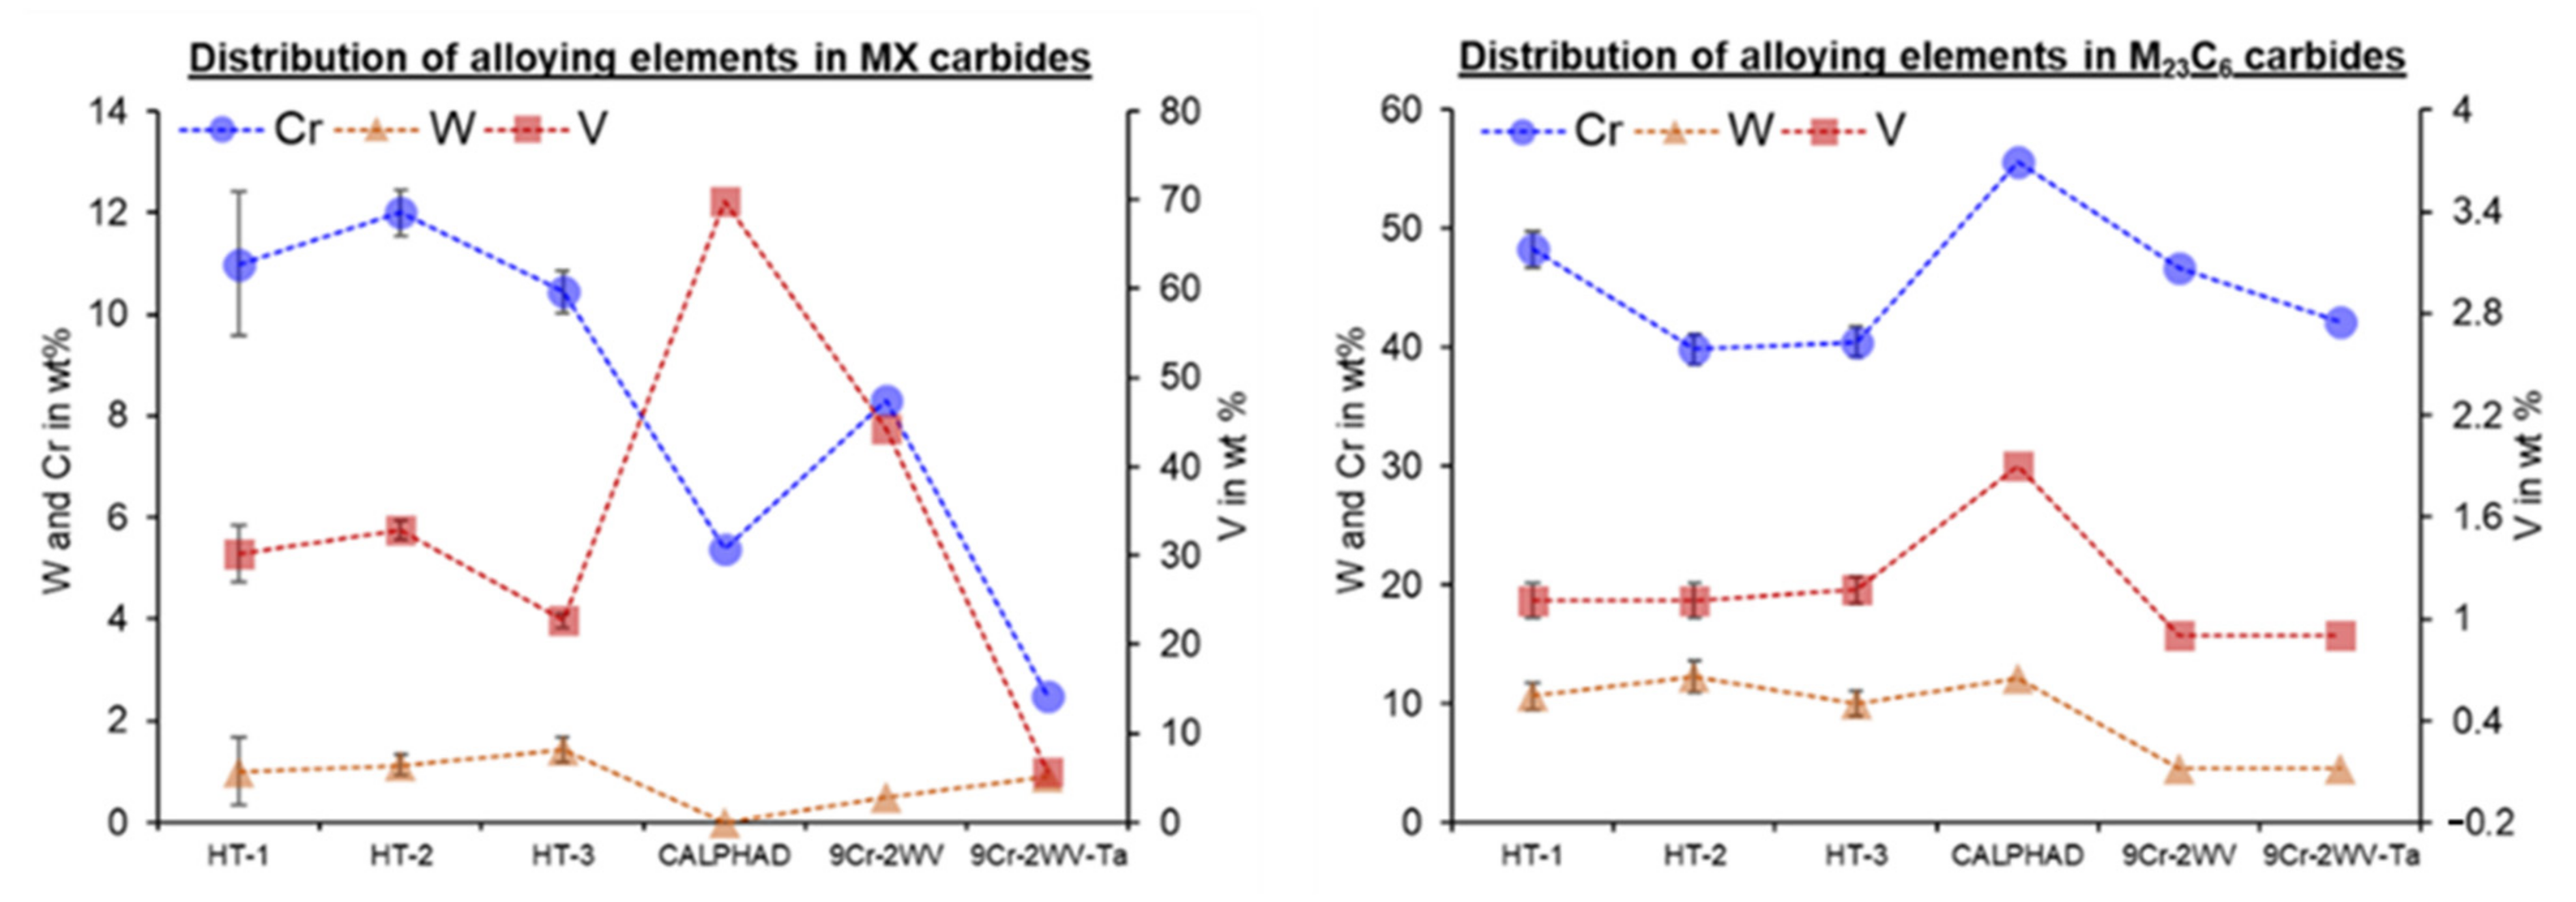
3.1.3. Heat Treatment-1

This heat treatment was performed to emulate the wrought EUROFER alloys. These alloys are essentially FM steels designed for fusion; the heat treatments are optimized to enhance the sink strength by optimizing precipitate size distribution. The optical microscopy in Figure 8 shows that the sample (after the described heat treatment) still has some remnants of the columnar grain structure. While there were some regions that had some grain refinement due to the nucleation of the prior austenite grains, a significant number of columnar grains exist. There are some indications of tempering, and the presence of tempered martensite can be observed from the optical micrographs. Delta ferrite stringers could not be observed from the optical micrographs with different magnifications presented in Figure 8a,b. To study the role of this heat treatment on delta ferrite, EBSD was performed, and the results are presented in Figure 8c,d. Figure 8c shows the inverse pole figure and Figure 8d shows the KAM map. The KAM map clearly indicates that the morphology of delta ferrite does not change and is predominantly in the interdendritic regions. However, an abnormal large delta ferrite grain was identified. Further scans were not able to identify more of the abnormally grown grains. In addition, there is a marginal reduction in the phase fraction of delta ferrite, as summarized in Table 3. The reduction of the kernel average misorientation in comparison with the as-fabricated material demonstrates that the material underwent a recovery process. The IPF also demonstrates that the delta ferrite does not form during the heat treatment, as observed in heat treatment-1, but is a remnant from the fabrication process. For that reason, controlled intrinsic heat treatment by optimizing the AM parameters can presumably reduce the formation of delta ferrite. However, the KAM map demonstrates clearly abnormal grain growth, which indicates the lack of local precipitate formation, as the precipitates were not able to inhibit abnormal grain growth.
A STEM micrograph presented in Figure 9a demonstrates limited recovery in the martensite laths—possibly due to the lower normalization and tempering temperatures compared to previously published research on similar RAFM steels [1,2]. While large M23C6 precipitates could be observed in EDS maps shown in Figure 9b–f, those maps also show that the finer MX carbides are absent and not observed in the number densities previously observed. Therefore, to re-confirm this observation, an EDS map at higher magnification was recorded and the results are summarized in Figure 10a–f, showing the STEM image and the associated elemental maps.
The results confirm that while both M23C6 and MX coexist, they are not refined. This has been observed and documented in previous studies, where low austenitizing temperatures lead to the coarser precipitates due to incomplete dissolution of preexisting precipitates. However, as was observed previously, W segregates almost exclusively to M23C6, while the MX precipitates contain mostly V and N. In addition, the precipitates form almost exclusively along the prior austenite grain boundaries. It is pertinent to mention that in comparison to HT-2 and HT-3, a lower normalizing temperature could drastically reduce the number density of precipitates and increase the overall size of the precipitates, as the precipitates do not get dissolved, as shown in Figure 7b. In addition, a high tempering duration of 2 h further facilitates the growth of precipitates but gives enough time for recovery of the microstructure.
A reduced tempering time could potentially lead to reduced recovery leading to the observed lath structure as shown in other TEM micrographs [50,52]. The implications will be discussed in the later sections.

3.1.4. Heat Treatment-2

This heat treatment was performed to replicate the heat treatments used for CNA alloys [53]. Note that this heat treatment has a significantly higher normalizing temperature and a shorter tempering time in comparison to HT-1. The optical microstructures and electron backscatter diffraction results are presented in Figure 11a–d.
The figures show the presence of a refined prior austenite grain size with a tempered martensitic structure. In addition, the microstructure also has a significant amount of delta ferrite in the microstructure. The extent of microstructural change is more significant than observed for heat treatment-1. To elucidate whether this delta ferrite is retained from the processing or is a result of the heat treatment, electron back scatter diffraction was performed, and the results are presented in Figure 11c,d with Figure 11c showing the inverse pole figure and Figure 11d showing the corresponding KAM map. Again, we can use the KAM to identify the orientation of the delta ferrite phases. The KAM map shows a significant change in the morphology of the delta ferrite phase: The interdendritic delta ferrite in the as-fabricated condition is broken into localized islands of delta ferrite, as shown in the KAM maps. Delta ferrite in the as-build condition should transform into austenite during normalization; however, a larger area fraction of delta ferrite for HT-2 (and HT-3) in comparison with the low normalization temperature, HT-1, suggests a formation of delta ferrite during normalization (summarized in Table 3). The CALPHAD calculations show that the normalizing temperature is close to the two-phase region. This could have resulted in the breaking up of the delta ferrite phase leading the formation of the observed microstructure. To investigate the tempered structure and characterize the precipitates, a more detailed TEM campaign was performed.
TEM micrographs are presented in Figure 12. Figure 12a shows a STEM micrograph of HT-2, which clearly shows the presence of a tempered martensitic structure with a high density of precipitates. EDS mapping was performed at a higher magnification to understand the overall distribution. Chemistry and morphology of the precipitates are shown in EDS maps of the region displayed in Figure 12b, which clearly show the presence of two morphologies of precipitates. EDS maps suggest that the Cr-rich larger precipitates potentially could be classified as M23C6 and the finer V-rich precipitates could be V(CN). The nitrogen maps demonstrate preferential segregation of nitrogen to the vanadium-rich regions. It is also observed from the EDS maps that tungsten segregates to the chromium-rich regions.
To further understand and identify the precipitates, detailed high resolution TEM and diffraction patterns were performed on the two types of precipitates. The results are presented in Figure 13. Figure 13A shows a combined EDS map of Cr and V of a region from the sample and Figure 13B shows the high resolution bright field micrograph of the precipitates marked in Figure 13A. Figure 13C,D show the corresponding simulated diffraction patterns using fast Fourier transformation (FFT) from the chromium-rich regions and the vanadium-rich regions, respectively.
Analysis of the diffraction patterns was performed using CrystalMaker Software Ltd., Oxford, England. ICSD files 155292 (VN), 159870 (VC) and 167668 (M23C6) were used for overlayed patterns in CrystalMaker to identify the Cr-rich regions to be M23C6 and the V-rich regions to be vanadium nitrides or carbonitrides. The differences between VN and VC are too small to distinguish in the diffraction pattern, but due to the EDS data it can be concluded that the precipitate is either a vanadium nitride or carbonitride. Similar results have also been reported in other studies [54].

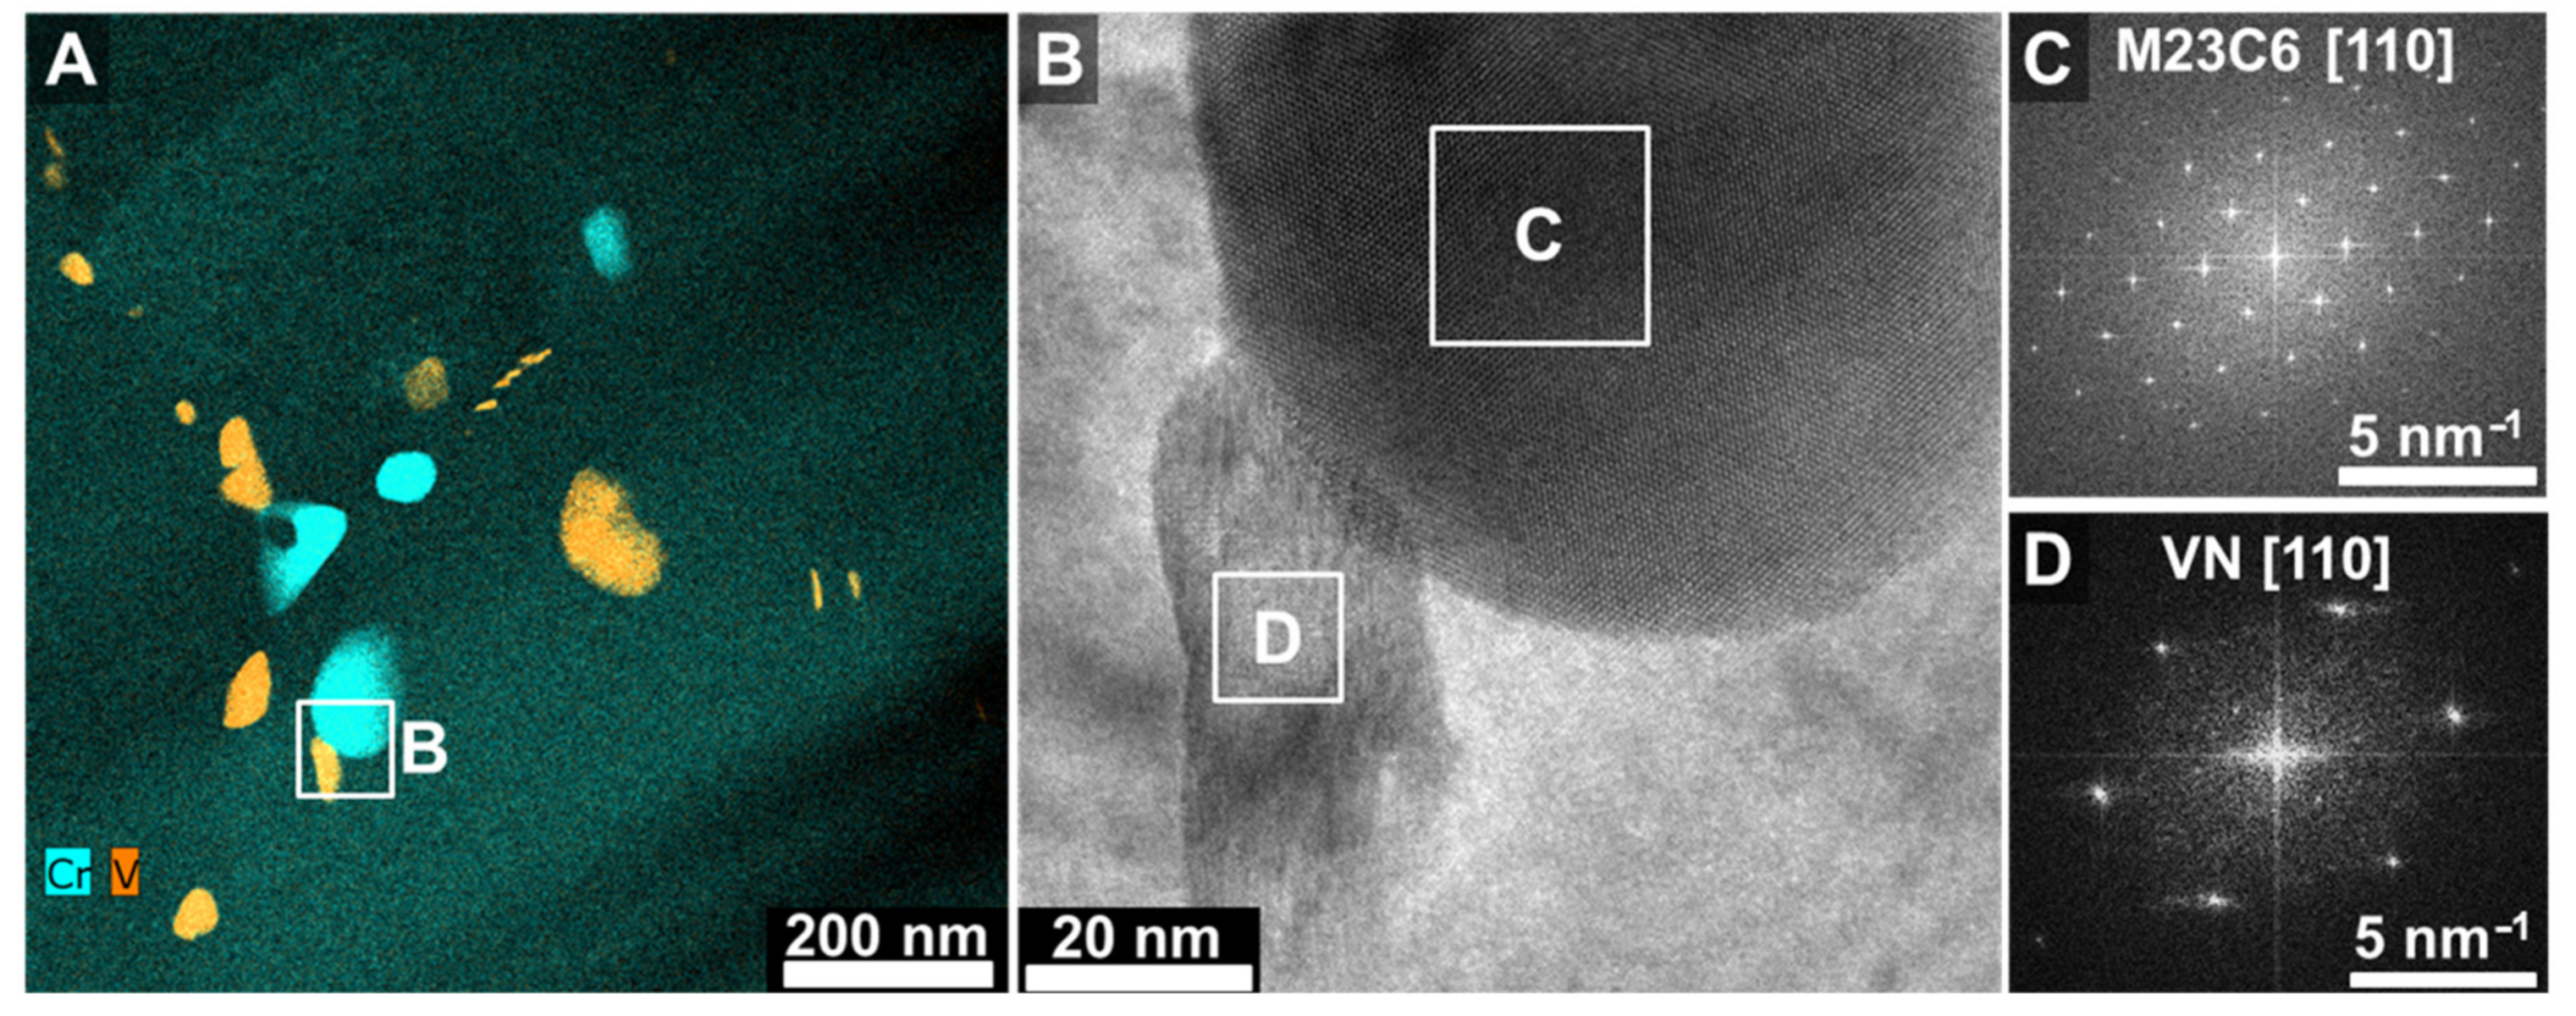
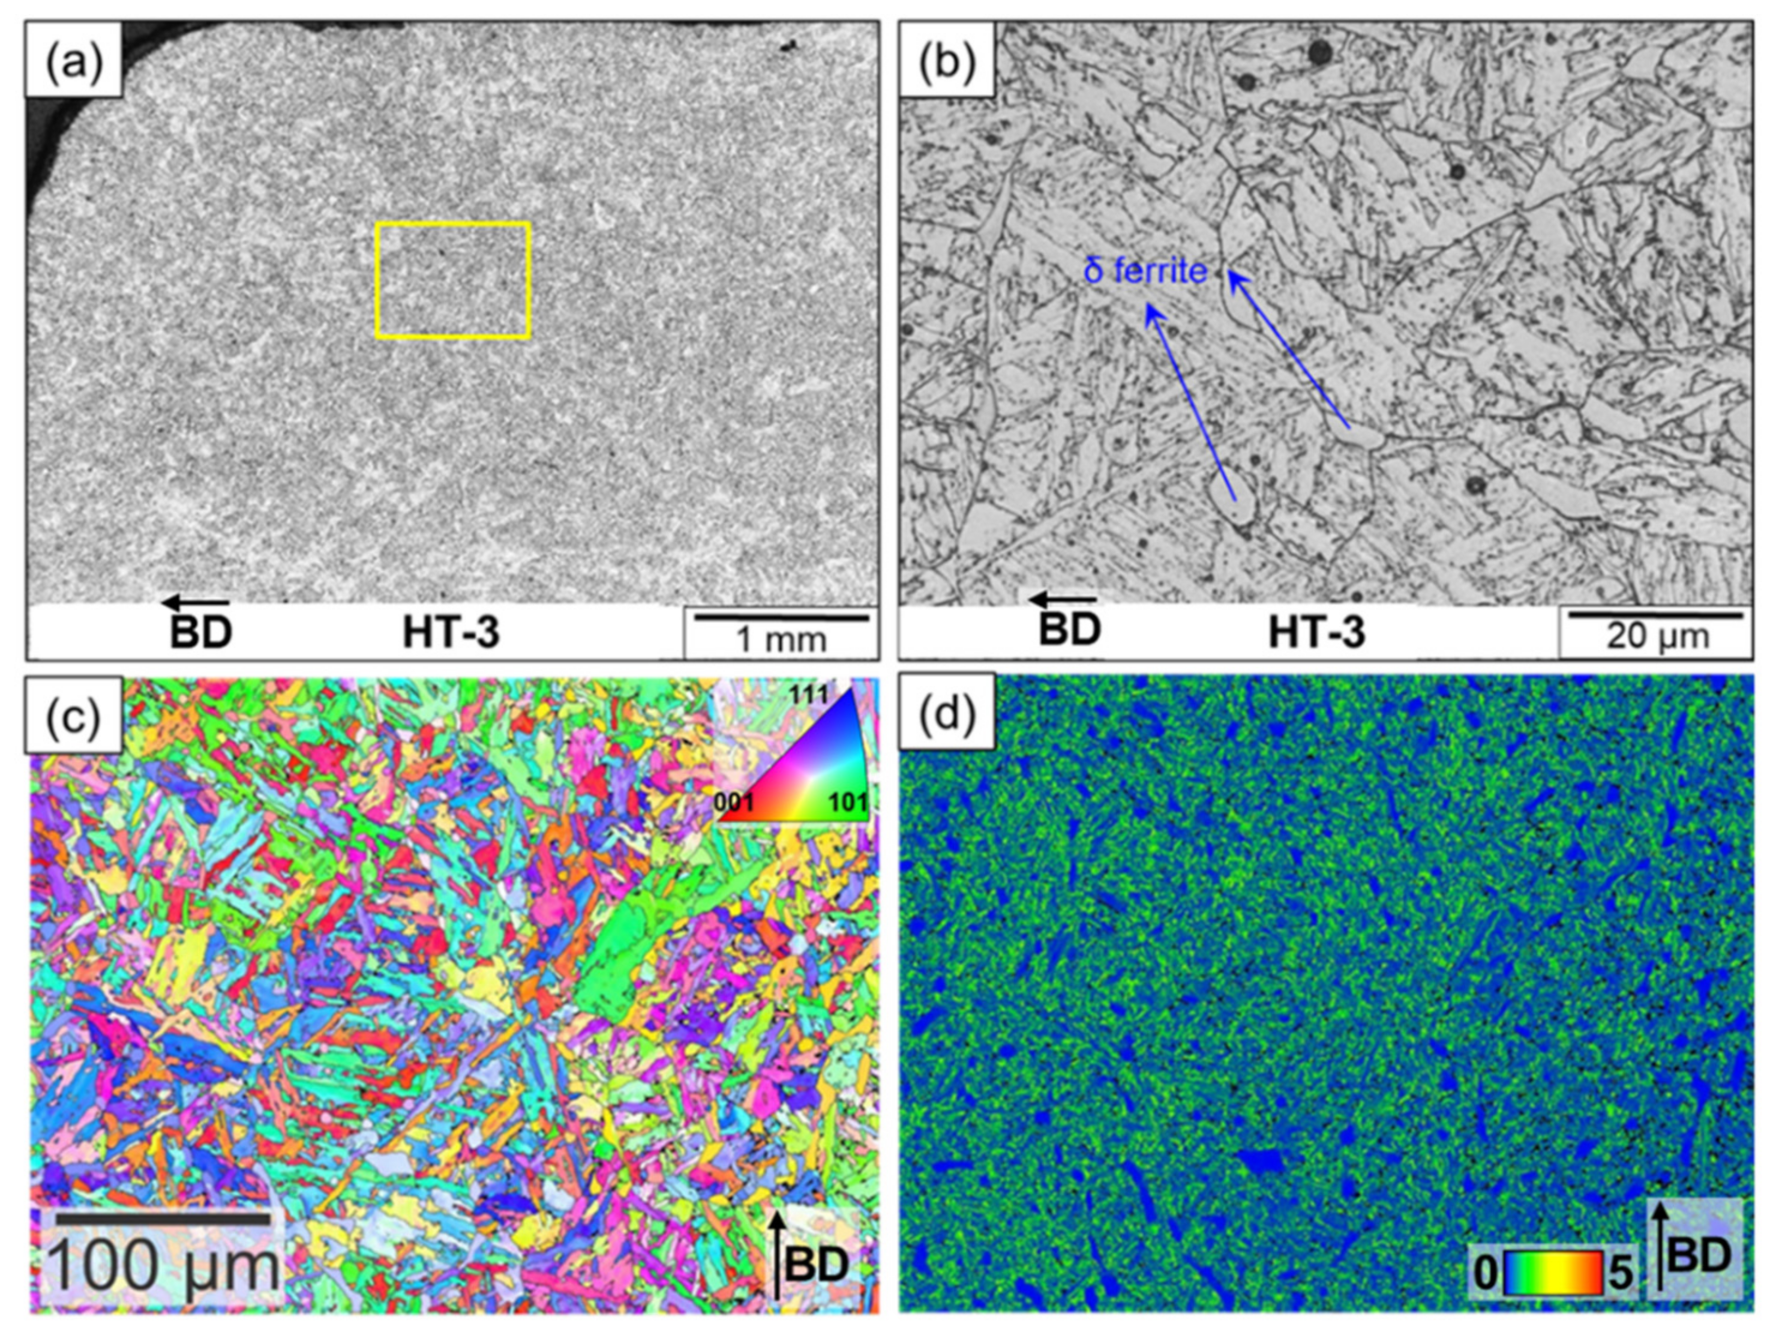
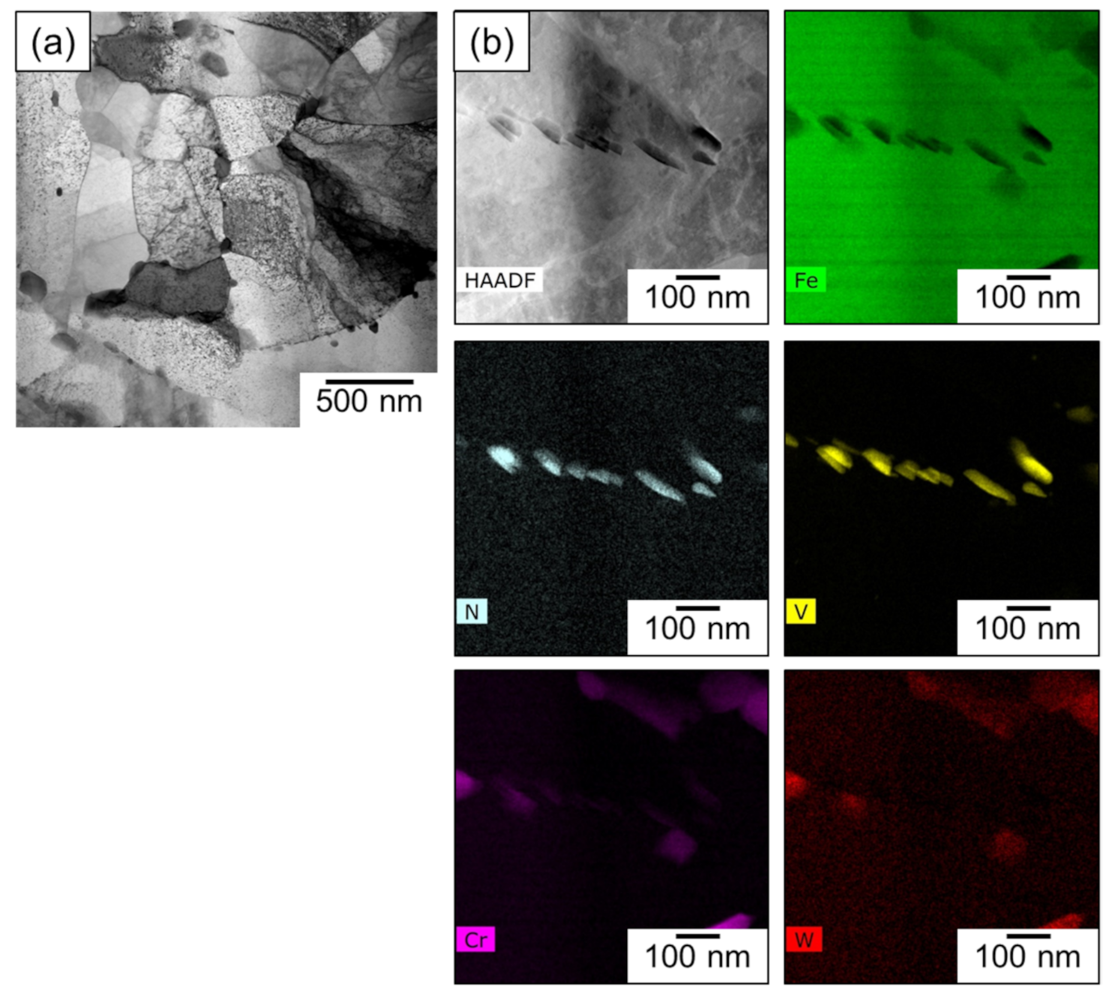
3.1.5. Heat Treatment-3

This heat treatment was performed to be similar to the second heat treatment, but with a lower tempering time. The tempering time was reduced primarily to prevent the coarsening of the precipitates and to prevent extended recovery of the martensite laths. The microstructural results are presented in Figure 14a–d. The optical micrographs are similar to what was documented earlier for HT-2 in Figure 11. The high temperature normalizing led to an excessive precipitation of delta ferrite, as shown in the KAM maps. Based on the interpretations of the KAM maps and the IPF maps it can be hypothesized that the delta ferrite is primarily a result of reheating (excessive normalizing temperature) or localized variations in the chemical composition. To investigate the effects of the reduced tempering time on the precipitate formation, TEM analysis was performed and the results are demonstrated in Figure 15. The TEM micrographs demonstrate that with shorter tempering times, the size of MX and M23C6 precipitates is reduced. However, the TEM micrograph demonstrates that the reduced tempering cycle and the formation of smaller precipitates did not serve to reduce the extent of coarsening of the lath structure.

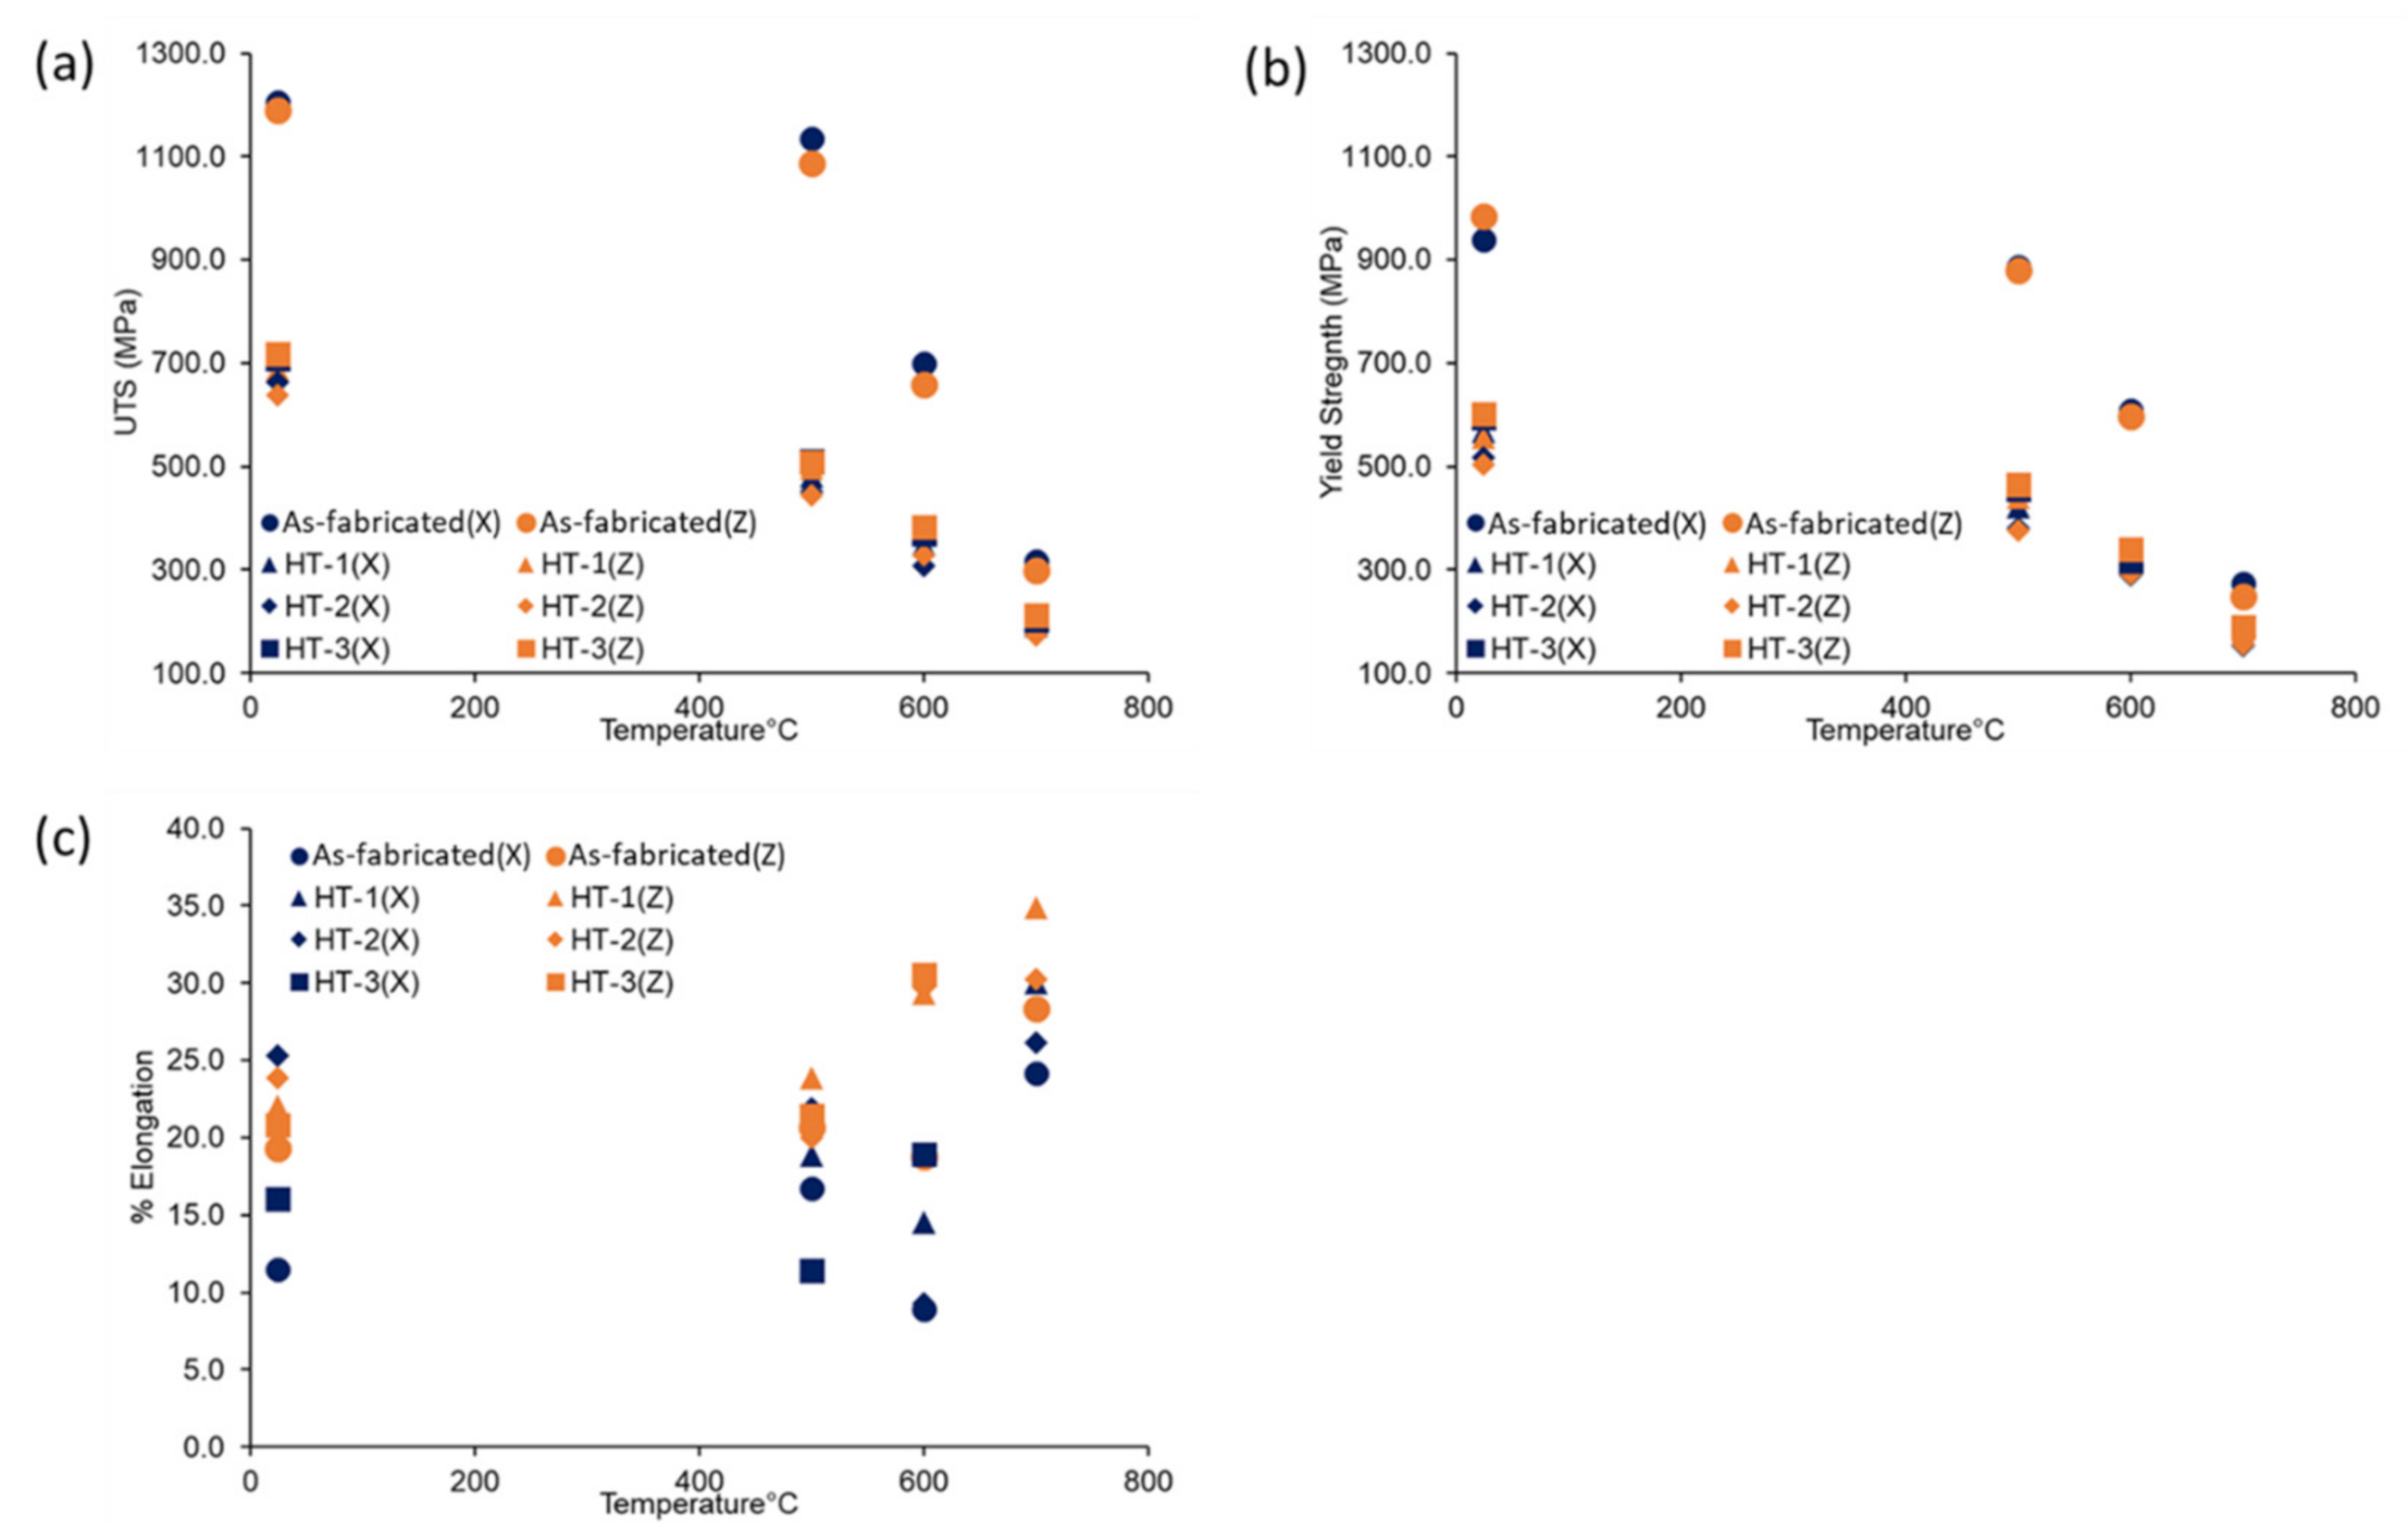
3.2. Mechanical Properties

The ultimate tensile strength, yield strength and total elongation for all the samples are shown in Figure 16. For the samples tested at RT, the extent of heterogeneity in the samples was only marginal. The samples extracted perpendicular to the build direction (shown in blue) exhibited a reduction in ductility for the as-fabricated samples in comparison to their wrought counterparts. The results clearly demonstrate that the samples in the as-built state have a significantly higher strength and lower elongation. That indicates a martensitic structure with a high dislocation density, as shown in Figure 5. However, during testing at higher temperatures, the directionality of the specimens becomes prominent where the samples extracted perpendicular to the build direction always show a higher elongation compared to the ones extracted parallel to the build direction. This dependence on directionality and testing temperature could be a result of the variance of critical defects along the build direction or due to the difference in operating deformation mechanisms.
As expected, the addition of a heat treatment served to reduce the mechanical strength and increase the ductility. While the heat treatments corresponding to HT-1 and HT-2 did reduce the extent of heterogeneity in the samples, the samples subject to HT-3 still demonstrated significant heterogeneity during testing at all temperatures. This could be due to the decreased tempering time provided to the sample. Another important point is that the samples were machined out of different locations within each sample, due to stacked positions, as shown in Figure 1. For the tensile tests, this point was not further evaluated and potentially has an impact on the deviation within each batch. Therefore, the here shown values should only be observed as reference points, due to the potential large deviation and the small sample sizes. However, previous work has demonstrated that plastic anisotropy exists in the samples along the build direction while normalizing and tempering treatments did serve to reduce the extent of anisotropy [2]. The current study indicates that tempering time could also be a variable influencing the extent of anisotropy in the builds. To rationalize these effects and to understand the effects of processing on the performance, detailed multiscale characterizations of the builds were performed.
The anisotropy in mechanical properties could result from two contributing factors: microstructural heterogeneity and porosities and other defects [36]. Therefore, a detailed characterization was undertaken to quantify the extent of micro porosities in the samples. Several locations were imaged at different magnifications using the same accelerating voltage and probe current to ensure similar brightness and contrast. The void sizes of several images, such as the one shown on the left side of Figure 17, were calculated using Image J software at different magnifications and are plotted for each sample condition on the right-hand side of the figure.
A total of 10, 25, 75 and 90% quantiles are shown together with the mean and median values to represent the distribution of void sizes. All those values show no significant changes, which means that the average sizes and the void size distribution do not change significantly during any heat treatment. Only the HT-2 sample shows a higher number of small voids and a larger spread of void sizes, while the median and mean values remain close to the reference as-built condition. The observed distribution of discontinuities is not sufficient to explain the observed heterogeneity in mechanical properties; therefore, the differences could be attributed to different cooling rates during the AM process, which applies to the sample location of each individual sample. Therefore, a larger spread in values was expected for the mechanical property values shown in Figure 16 due to the different positions from which each sample has been machined. In addition, while the extent of discontinuities is similar for all samples, it is pertinent to point the readers to the drastic reduction in heterogeneity after heat treatments, which suggests a strong influence of the microstructure on tensile properties.

4. Discussion

The microstructure in the as-fabricated condition consists primarily of martensite and delta ferrite. The formation of delta ferrite has been documented extensively by Onoro et al. [43,44]. Detailed Scheil solidification simulations performed for these alloys indicate that delta ferrite is the first phase to solidify at ~1500 °C and solidification is complete at 1426 °C. After 1426 °C, the delta ferrite starts to transform to austenite until the temperature reaches 1200 °C [7]. However, this transformation is strongly dependent on the cooling rate and could potentially be suppressed at faster cooling rates. The propensity for delta ferrite formation is a strong function of the Cr and Ni equivalent in the steel. It has been reported that when the Cr equivalent exceeds 10.5 the propensity for delta ferrite formation is high. Potentially, delta ferrite in addition to solidification could also form during the reheating cycles. Wang et al. have performed several elegant experiments on the subject material using thermomechanical simulators to simulate welding thermal cycles. They noticed delta ferrite formation when the temperature during reheating was between 1200–1300 °C. The results on delta ferrite of the study conducted here were documented and summarized in comparison with as-build conditions and other heat treatments in Table 3. It was also observed that the delta ferrite formed at higher temperature does not transform to austenite during cooling and persists in the microstructure [16].
As discussed in the Introduction, the primary purpose of using additive manufacturing for fusion energy is to leverage the effects of multiple thermal cycles to produce a tempered martensitic structure with a high density of nanostructured carbides and carbo-nitrides. Therefore, in addition to the formation of delta ferrite in the as-fabricated condition, the role of thermal cycles on tempering the previous passes also need to be studied.
The results clearly demonstrate the absence of precipitates in the as-fabricated structure. This is in stark contrast to previously reported studies, where a high density of nanostructured carbides was reported during the additive manufacturing of HT9 [1,49]. The authors reported that a higher normalizing temperature would result in a finer precipitate size and resulted in an increased number density of precipitates during additive manufacturing of HT9. These differences were driven primarily by the differences in the as-fabricated structure. In the as-fabricated state, the microstructure had a high number of MX precipitates that coarsened when normalized and tempered at lower temperature. In contrast, when normalized and tempered at higher temperatures, the MX precipitates in the as-fabricated state dissolved and reprecipitated. Therefore, it is necessary to discuss the absence of carbides in the as-fabricated structure in this case. In this study, precipitates were found for all heat-treated conditions, with higher normalization temperatures resulting in smaller precipitates similar to the precipitates reported for HT-9.
To rationalize this, the effects of thermal cycles on carbides during welding are reviewed to provide some context to the reader. Precipitates dissolve or coarsen depending on the peak temperature during the layer-wise deposition of the AM process. The carbides and carbo-nitrides begin dissolving at around 900 °C, and complete dissolution occurs at around 1100 °C. Therefore, when the peak temperature of the thermal cycle is below 850 °C, the carbides only coarsen [55,56].
Filachioni et al. demonstrated the presence of a range of different carbides in the as-welded structure of a similar (RAF) steel [57]. Specifically, there are five different types of carbides: Cr-rich M7C3 and M23C6, along with W2C, V2C and Fe6W6C in the as-welded state. It was also documented that the volume fraction of M7C3 and M23C6 depends on the cooling rate. The volume fraction of M7C3 was higher for GTAW welds compared to EB welds. Several other studies document the presence of needle-like M3C carbides in single-pass welds due to auto tempering and M7C3 and M23C6 carbides during multipass welding [57]. However, the EDS maps shown in this study do not demonstrate any evidence for the formation of the precipitates after AM. The absence of precipitates could only be explained by the fact that TEM foil was extracted from a local region, where precipitation did not occur, or the presence of W, which could increase the resistance of the alloy to tempering. Therefore, more studies are warranted in this area.
We now move to the discussion of the microstructure evolution during post-processing heat treatments. From the previous section, it is clear that after post-processing treatments, the microstructure typically exhibits a reduction in delta ferrite content and demonstrates recovery of martensite sub-structure and an increase in the number density of precipitates. These results are summarized in Figure 18. Here, it is obvious from Figure 18a that extended tempering duration coarsen M23C6 precipitates, displayed by the color of the circles, while the tempering times barely have an impact on the martensite lath size. However, all heat treatments were successful in reducing the delta ferrite. Figure 18b distinguishes between M23C6 and MX precipitates and highlights the impact of the heat treatments on those precipitates. All heat treatments have a similar impact on M23C6 by tripling the number density, but HT-2 and HT-3 demonstrate that the higher normalization temperatures have a positive influence on the size and number density of MX precipitates, which function as sinks for dislocations and defects created under neutron irradiation. A shorter tempering time, as in HT-3, demonstrates the lowest coarsening of M23C6.
However, there are subtle differences in precipitation, which need to be qualitatively and quantitatively assessed. For example, additive manufacturing could lead to local fluctuations in compositions that could drive different responses during post-processing. For instance, it has been reported that N and C segregation during the welding of 9–12% Cr steels could lead to re-austenitization during tempering and consequently reduce toughness in welds [7]. In another observation, the authors clearly document a difference in the inter- and intra-granular precipitation of carbides driving the chemical heterogeneity driven due to the welding process [58,59]. For that reason, it is necessary to understand whether the tempering responses lead to similar precipitation sequences to those reported in wrought steels and dictated by thermodynamic equilibrium.
To evaluate the effects of post-processing on the fine structure of the precipitates, the EDS maps were quantified to quantitatively assess the distribution of different elements in different precipitates, which are presented in Table 4. In addition, the information is graphically presented in Figure 19, which shows the distribution of Cr, V and W in MX and M23C6, respectively. The data obtained in the present study are contrasted with those from the literature. Fe was not stripped during the EDS quantification, as it is also an element inside M23C6 and MX precipitates, as shown in Table 4.
Due to the surrounding matrix being mostly Fe and to a lower extent Cr, the measured Fe and Cr values of any precipitate are assumed to be higher than their actual content. Despite that, the data indicate significant super saturations of Cr experimentally measured chemistries in the MX precipitates (between 10.5 and 12 percent) compared to the theoretical calculations from CALPHAD for all three heat treatments. This could be due to the low tempering temperatures that the samples were subjected to. It has been previously demonstrated that under conditions of rapid cooling from the normalizing temperatures the carbides nucleate without any partitioning of substitutional alloying elements by a para-equilibrium mechanism [61,62]. With the increase in tempering time/temperature, substitutional elements (Cr,V) partition into the carbides [50,62]. Therefore, Cr partitioning to M23C6 and V partitioning in MX occurs with increase in the tempering time/temperature. In addition, despite the different normalizing temperatures, the samples after HT-1 and HT-2 do not show any significant difference in chemistry, though the size distributions are different. While HT-1 and HT-2 are tempered at 120 and 60 min, respectively, HT-3 was tempered for 30 min. However, the difference in the Cr content in M23C6 between these precipitates is ~10 wt.%, indicating that Cr partitioning is nearly complete in all cases. Therefore, as observed in wrought materials, nucleation of the precipitates occurs via a para-equilibrium mechanism and growth by a local equilibrium mechanism. The Cr content also falls in the range reported for wrought variants of similar RAF steels that were subject to similar heat treatment [60]. A similar trend is also observed for V partitioning. However, the CALPHAD results demonstrate a higher Cr and V concentration compared to what was experimentally observed. This is presumably due to the fact that CALPHAD assumes chemistries dictated by thermodynamic equilibrium, which may not always be the case or was not achieved after the here used short heat treatment times. In general, precipitate formation and growth during tempering are similar to mechanisms reported in wrought materials. That indicates that theories used to design heat treatments for wrought steels could be used to tailor the microstructure of RAF steels fabricated using AM.
The present research attempts to set the stage for future research activities in this area. While reasonable progress in understanding the ability to process these materials has been made, the following challenges remain:
  • Parameter optimization: The goal of tailoring the process parameters (laser power, travel speed and hatch spacing, in particular) should be geared towards not just eliminating defects, but also to move towards the paradigm of temper bead deposition. Temper bead deposition techniques could ensure that the as-fabricated part can be readily used without the need for any post-processing treatments;
  • Alloy design: This is perhaps the greatest challenge for additive manufacturing of these materials. All these materials are designed to be processed using conventional manufacturing. However, far from being equilibrium manufacturing processes, such as AM, they lead complex spatial and temporal changes in the thermal cycles leading to different responses in these conventional alloys. In particular, alloys that can lend themselves to being amenable to temper bead deposition techniques, have low residual stresses by tuning the Ms temperature, and are capable of forming a high density of stable carbo-nitride precipitates, need to be developed and investigated.

5. Conclusions

This study demonstrates the feasibility of fabricating RAF steels using blown powder additive manufacturing. Three different normalizing and tempering treatments were evaluated. Two are traditionally utilized for EUROFER97 and CNA materials. The third heat treatment was an experimental short normalization and tempering process.
The mechanical testing results clearly demonstrated that the samples fabricated using AM showed similar strength levels and elongations to those reported in their wrought counterparts, despite the presence of minor discontinuities. The presence of these discontinuities seemed to cause a scatter in the tensile elongation disproportionately compared [33] to the other properties. Detailed characterization over different length scales demonstrated that the as-fabricated structure had a significant presence of delta ferrite. The delta ferrite grains were predominantly oriented along the <100> direction, suggesting that these are remnants from the solidification structure. All conducted post-processing heat treatments (normalizing) resulted in the significant reduction in the amount of delta ferrite in the microstructure from 9.2 to 3.4, 5.2 and 5.4 percent for HT-1, HT-2 and HT-3, respectively. However, as HT-2 and HT-3 show a higher delta fraction, it can be assumed that the temperature during normalization was high enough to locally form delta ferrite.
The normalized and tempered structure resulted in a refined dispersion of both MX and M23C6. HT-2 and HT-3—with their higher normalization temperature—exhibited a 10-fold increase of MX precipitate numbers in comparison to HT-1, while similarly keeping the M23C6 numbers. Detailed composition measurements of all the precipitates were compared with those reported in the literature. Similar to what was documented for wrought alloys, the precipitation sequence for the steel fabricated using AM was also driven by para-equilibrium mechanisms. The results demonstrate that post-processing treatments for RAF steel parts fabricated using AM could be developed by using concepts that are used to guide heat treatment design for wrought materials. This study has helped identify gaps that the RAF steel community could focus on by printing parts using AM that are “born qualified”.

Author Contributions

Conceptualization, N.S. and T.G.; methodology, T.G.; validation, N.S. and T.G.; formal analysis, T.G.; investigation, T.G.; data curation, T.G. and N.S.; writing—original draft preparation, N.S. and T.G.; writing—review and editing, T.G. and N.S.; visualization, T.G.; supervision, N.S.; project administration, T.G. and N.S.; funding acquisition, N.S. All authors have read and agreed to the published version of the manuscript.

Funding

This manuscript has been authored by UT-Battelle, LLC, under contract DE-AC05-00OR22725 with the US Department Funding: of Energy (DOE). The publisher, by accepting the article for publication, acknowledges that the US government retains a nonexclusive, paid-up, irrevocable, worldwide license to publish or reproduce the published form of this manuscript, or allow others to do so, for US government purposes. DOE will provide public access to these results of federally sponsored research in accordance with the DOE Public Access Plan (http://energy.gov/downloads/doe-public-access-plan, accessed on 26 December 2021). This research was supported by the US Department of Energy, Office of Science, Office of Fusion Energy Sciences.

Institutional Review Board Statement

Not applicable.

Informed Consent Statement

Not applicable.

Data Availability Statement

The data presented in this study are available on request from the corresponding author. The data are not publicly available due to ongoing research in this area.

Acknowledgments

The authors gratefully acknowledge the numerous discussions with Kevin G. Field and the valuable insights offered by Arunodaya Bhattacharya. The help of Ying Yang is also acknowledged for creating the simulated phase diagrams. We want to acknowledge John Echols for editing and proofreading the document. The authors would also like to acknowledge Tom Geer and Eric T. Manneschmidt for the metallography and generating the tensile test data. We gratefully acknowledge the US Department of Energy, Office of Science, Fusion Energy Sciences program for funding this work. The FEI (now Thermo Fisher Scientific) Talos F200X instrument used in this work was provided by the Department of Energy, Office of Nuclear Energy, Fuel Cycle R&D Program and the Nuclear Science User Facilities.

Conflicts of Interest

The authors declare no conflict of interest.

References

  1. Sridharan, N.; Field, K. A Road Map for the Advanced Manufacturing of Ferritic-Martensitic Steels. Fusion Sci. Technol. 2019, 75, 264–274. [Google Scholar] [CrossRef]
  2. Sridharan, N.; Field, K.G. Preliminary Characterization and Mechanical Performance of Additively Manufactured HT9; ORNL: Oak Ridge, TN, USA, 2018. [Google Scholar] [CrossRef]
  3. Zhong, W.; Sridharan, N.; Isheim, D.; Field, K.G.; Yang, Y.; Terrani, K.; Tan, L. Microstructures and Mechanical Properties of a Modified 9Cr Ferritic-Martensitic Steel in the as-Built Condition after Additive Manufacturing. J. Nucl. Mater. 2020, 545, 152742. [Google Scholar] [CrossRef]
  4. Klueh, R.; Nelson, A. Ferritic/Martensitic Steels for Next-Generation Reactors. J. Nucl. Mater. 2007, 371, 37–52. [Google Scholar] [CrossRef]
  5. Klueh, R.L. Elevated Temperature Ferritic and Martensitic Steels and Their Application to Future Nuclear Reactors. Int. Mater. Rev. 2005, 50, 287–310. [Google Scholar] [CrossRef] [Green Version]
  6. Klueh, R.L.; Harris, D.R. High-Chromium Ferritic and Martensitic Steels for Nuclear Applications; ASTM: Conshohocken, PA, USA, 2001. [Google Scholar]
  7. David, S.A.; Siefert, J.A.; Feng, Z. Welding and Weldability of Candidate Ferritic Alloys for Future Advanced Ultrasupercritical Fossil Power Plants. Sci. Technol. Weld. Join. 2013, 18, 631–651. [Google Scholar] [CrossRef]
  8. Klueh, R.; Gelles, D.; Lechtenberg, T. Development of Ferritic Steels for Reduced Activation: The US Program. J. Nucl. Mater. 1986, 141–143, 1081–1087. [Google Scholar] [CrossRef] [Green Version]
  9. Danon, C.A.; Servant, C. Thermodynamic Modeling in Reduced Activation Steels. ISIJ Int. 2005, 45, 903–912. [Google Scholar] [CrossRef] [Green Version]
  10. Puype, A.; Bonny, G.; Malerba, L.; Petrov, R.; Sietsma, J. Design of Reduced Activation Ferritic/Martensitic Steels with Improved Creep Resistance by Thermodynamic Modelling. SSRN Electron. J. 2018. [Google Scholar] [CrossRef]
  11. Hishinuma, A.; Kohyama, A.; Klueh, R.; Gelles, D.; Dietz, W.; Ehrlich, K. Current Status and Future R&D for Reduced-Activation Ferritic/Martensitic Steels. J. Nucl. Mater. 1998, 258–263, 193–204. [Google Scholar] [CrossRef]
  12. Klueh, R.; Gelles, D.; Jitsukawa, S.; Kimura, A.; Odette, G.; van der Schaaf, B.; Victoria, M. Ferritic/Martensitic Steels—Overview of Recent Results. J. Nucl. Mater. 2002, 307–311, 455–465. [Google Scholar] [CrossRef]
  13. Kurtz, R.; Alamo, A.; Lucon, E.; Huang, Q.; Jitsukawa, S.; Kimura, A.; Klueh, R.; Odette, G.; Petersen, C.; Sokolov, M.; et al. Recent Progress toward Development of Reduced Activation Ferritic/Martensitic Steels for Fusion Structural Applications. J. Nucl. Mater. 2009, 386–388, 411–417. [Google Scholar] [CrossRef]
  14. Song, M.; Sun, C.; Fan, Z.; Chen, Y.; Zhu, R.; Yu, K.; Hartwig, K.; Wang, H.; Zhang, X. A Roadmap for Tailoring the Strength and Ductility of Ferritic/Martensitic T91 Steel via Thermo-Mechanical Treatment. Acta Mater. 2016, 112, 361–377. [Google Scholar] [CrossRef] [Green Version]
  15. Vitek, J.M.; Klueh, R.L. Precipitation Reactions during the Heat Treatment of Ferritic Steels. Metall. Mater. Trans. A 1983, 14, 1047–1055. [Google Scholar] [CrossRef]
  16. Wang, L.; Felicelli, S.D.; Pratt, P. Residual Stresses in LENS-Deposited AISI 410 Stainless Steel Plates. Mater. Sci. Eng. A 2008, 496, 234–241. [Google Scholar] [CrossRef]
  17. Klueh, R.L.; King, J.F. Austenitic Stainless Steel-Ferritic Steel Weld Joint Failures. Weld. J. 1982, 61, 302. [Google Scholar]
  18. Rieth, M.; Rey, J. Specific Welds for Test Blanket Modules. J. Nucl. Mater. 2009, 386–388, 471–474. [Google Scholar] [CrossRef]
  19. Allen, T.R.; Busby, J.; Klueh, R.L.; Maloy, S.; Toloczko, M.B. Cladding and Duct Materials for Advanced Nuclear Recycle Reactors. JOM 2008, 60, 15–23. [Google Scholar] [CrossRef]
  20. Dragunov, V.K.; Sliva, A.P.; Goncharov, A.L.; Zhmurko, I.E.; Terent’Ev, E.V.; Sysoev, A.G.; Marchenkov, A.Y. Specific Features of Electron-Beam Welding of ITER Blanket First Wall Components. Therm. Eng. 2020, 67, 387–395. [Google Scholar] [CrossRef]
  21. Boccaccini, L.V.; Meyder, R.; Fischer, U. Test Strategy for the European HCPB Test Blanket Module in ITER. Fusion Sci. Technol. 2005, 47, 1015–1022. [Google Scholar] [CrossRef]
  22. Cardella, A.; Rigal, E.; Bedel, L.; Bucci, P.; Fiek, J.; Forest, L.; Boccaccini, L.; Diegele, E.; Giancarli, L.; Hermsmeyer, S.; et al. The Manufacturing Technologies of the European Breeding Blankets. J. Nucl. Mater. 2004, 329–333, 133–140. [Google Scholar] [CrossRef]
  23. Forest, L.; Aktaa, J.; Boccaccini, L.V.; Emmerich, T.; Eugen-Ghidersa, B.; Fondant, G.; Froio, A.; Puma, A.L.; Namburi, H.; Neuberger, H.; et al. Status of the EU DEMO Breeding Blanket Manufacturing R&D Activities. Fusion Eng. Des. 2020, 152, 111420. [Google Scholar] [CrossRef]
  24. Manugula, V.L.; Rajulapati, K.V.; Reddy, G.M.; Rao, K.B.S. Role of Evolving Microstructure on the Mechanical Properties of Electron Beam Welded Ferritic-Martensitic Steel in the as-Welded and Post Weld Heat-Treated States. Mater. Sci. Eng. A 2017, 698, 36–45. [Google Scholar] [CrossRef]
  25. Arivazhagan, B.; Srinivasan, G.; Albert, S.; Bhaduri, A. A Study on Influence of Heat Input Variation on Microstructure of Reduced Activation Ferritic Martensitic Steel Weld Metal Produced by GTAW Process. Fusion Eng. Des. 2011, 86, 192–197. [Google Scholar] [CrossRef]
  26. Roy, S.; Shassere, B.; Yoder, J.; Nycz, A.; Noakes, M.; Narayanan, B.K.; Meyer, L.; Paul, J.; Sridharan, N. Mitigating Scatter in Mechanical Properties in AISI 410 Fabricated via Arc-Based Additive Manufacturing Process. Materials 2020, 13, 4855. [Google Scholar] [CrossRef]
  27. Lippold, J.C. Transformation and Tempering Behavior of 12Cr-1Mo-0.3V Martensitic Stainless Steel Weldments. J. Nucl. Mater. 1981, 104, 1127–1131. [Google Scholar] [CrossRef]
  28. Lippold, J.C. Welding Metallurgy and Weldability; John Wiley & Sons: Hoboken, NJ, USA, 2015. [Google Scholar] [CrossRef]
  29. Bhaduri, A.; Rai, S.; Gill, T.; Sujith, S.; Jayakumar, T. Evaluation of Repair Welding Procedures for 2.25Cr–1Mo and 9Cr–1Mo Steel Welds. Sci. Technol. Weld. Join. 2001, 6, 89–93. [Google Scholar] [CrossRef]
  30. Smith, B.; Ramirez, A.J.; McCracken, S.L.; Tate, S. Investigation of Relationship between Microhardness and Charpy Impact Energy for Temper Bead Welding Qualification: Part 1. In Proceedings of the ASME 2019 Pressure Vessels & Piping Conference, San Antonio, TX, USA, 14–19 July 2019. [Google Scholar] [CrossRef]
  31. Smith, B.; Ramirez, A.J.; McCracken, S.L.; Tate, S. Investigation of Relationship between Microhardness and Charpy Impact Energy for Temper Bead Welding Qualification: Part 2. In Proceedings of the ASME 2011 Pressure Vessels and Piping Conference: Volume 6, Parts A and B, Virtual, 3 August 2020. [Google Scholar] [CrossRef]
  32. Sridharan, N.; Chaudhary, A.; Nandwana, P.; Babu, S. Texture Evolution During Laser Direct Metal Deposition of Ti-6Al-4V. JOM 2016, 68, 772–777. [Google Scholar] [CrossRef]
  33. Sridharan, N.; Noakes, M.W.; Nycz, A.; Love, L.J.; Dehoff, R.R.; Babu, S. On the Toughness Scatter in Low Alloy C-Mn Steel Samples Fabricated Using Wire Arc Additive Manufacturing. Mater. Sci. Eng. A 2018, 713, 18–27. [Google Scholar] [CrossRef]
  34. Shassere, B.; Nycz, A.; Noakes, M.W.; Masuo, C.; Sridharan, N. Correlation of Microstructure and Mechanical Properties of Metal Big Area Additive Manufacturing. Appl. Sci. 2019, 9, 787. [Google Scholar] [CrossRef] [Green Version]
  35. Dehoff, R.; Kirka, M.M.; Sames, W.J.; Bilheux, H.; Tremsin, A.; Lowe, L.E.; Babu, S. Site Specific Control of Crystallographic Grain Orientation through Electron Beam Additive Manufacturing. Mater. Sci. Technol. 2015, 31, 931–938. [Google Scholar] [CrossRef]
  36. Sames, W.J.; List, F.A.; Pannala, S.; Dehoff, R.; Babu, S. The Metallurgy and Processing Science of Metal Additive Manufacturing. Int. Mater. Rev. 2016, 61, 315–360. [Google Scholar] [CrossRef]
  37. Panda, B.; Shankhwar, K.; Garg, A.; Savalani, M.M. Evaluation of Genetic Programming-Based Models for Simulating Bead Dimensions in Wire and Arc Additive Manufacturing. J. Intell. Manuf. 2019, 30, 809–820. [Google Scholar] [CrossRef]
  38. Kulkarni, J.D.; Goka, S.B.; Parchuri, P.K.; Yamamoto, H.; Ito, K.; Simhambhatla, S. Microstructure Evolution along Build Direction for Thin-Wall Components Fabricated with Wire-Direct Energy Deposition. Rapid Prototyp. J. 2021, 27, 1289–1301. [Google Scholar] [CrossRef]
  39. Chaturvedi, M.; Scutelnicu, E.; Rusu, C.; Mistodie, L.; Mihailescu, D.; Subbiah, A. Wire Arc Additive Manufacturing: Review on Recent Findings and Challenges in Industrial Applications and Materials Characterization. Metals 2021, 11, 939. [Google Scholar] [CrossRef]
  40. Blakey-Milner, B.; Gradl, P.; Snedden, G.; Brooks, M.; Pitot, J.; Lopez, E.; Leary, M.; Berto, F.; du Plessis, A. Metal Additive Manufacturing in Aerospace: A Review. Mater. Des. 2021, 209, 110008. [Google Scholar] [CrossRef]
  41. Plotkowski, A.; Ferguson, J.; Stump, B.; Halsey, W.; Paquit, V.; Joslin, C.; Babu, S.; Rossy, A.M.; Kirka, M.; Dehoff, R. A Stochastic Scan Strategy for Grain Structure Control in Complex Geometries Using Electron Beam Powder Bed Fusion. Addit. Manuf. 2021, 46, 102092. [Google Scholar] [CrossRef]
  42. Zhong, W.; Yang, Y.; Field, K.G.; Sridharan, N.; Terrani, K.; Tan, L. Microstructure and Mechanical Properties of High Mn-Containing Ferritic-Martensitic Alloys Exposed to Cyclical Thermal Treatment. Mater. Sci. Eng. A 2021, 813, 141143. [Google Scholar] [CrossRef]
  43. Oñoro, J. Martensite Microstructure of 9–12% Cr Steels Weld Metals. J. Mater. Process. Technol. 2006, 180, 137–142. [Google Scholar] [CrossRef]
  44. Oñoro, J. Weld Metal Microstructure Analysis of 9–12% Cr steels. Int. J. Press. Vessel. Pip. 2006, 83, 540–545. [Google Scholar] [CrossRef]
  45. Rieth, M.; Schirra, M.; Falkenstein, A.; Graf, P.; Heger, S.; Kempe, H.; Lindau, R.; Zimmermann, H. EUROFER 97. Tensile, Charpy, Creep and Structural Tests; FZKA-6911; KITopen: Karlsruhe, Germany, 2003. [Google Scholar] [CrossRef]
  46. Schirra, M.; Adelhelm, C.; Graf, P.; Heger, S.; Kempe, H.; Zimmermann, H.; Fernandez, M.; Lapena, J. Arbeiten zur Grundcharakterisierung am Niedrigaktivierenden Stahl F82H-Mod im Vergleich zu OPTIFER; FZKA-6008; KITopen: Karlsruhe, Germany, 1997. [Google Scholar]
  47. Tan, L.; Katoh, Y.; Snead, L. Development of Castable Nanostructured Alloys as a New Generation RAFM Steels. J. Nucl. Mater. 2018, 511, 598–604. [Google Scholar] [CrossRef]
  48. Lippold, K.D.J.; John, C. Welding Metallurgy and Weldability of Stainless Steels; John Wiley & Sons: Hoboken, NJ, USA, 2005; Available online: https://app.knovel.com/hotlink/toc/id:kpWMWSS007/welding-metallurgy-weldability/welding-metallurgy-weldability (accessed on 26 December 2021).
  49. Sridharan, N.; Gussev, M.N.; Field, K.G. Performance of a Ferritic/Martensitic Steel for Nuclear Reactor Applications Fabricated Using Additive Manufacturing. J. Nucl. Mater. 2019, 521, 45–55. [Google Scholar] [CrossRef]
  50. Abe, F. Precipitate Design for Creep Strengthening of 9% Cr Tempered Martensitic Steel for Ultra-Supercritical Power Plants. Sci. Technol. Adv. Mater. 2008, 9, 013002. [Google Scholar] [CrossRef] [Green Version]
  51. Yang, Y.; Busby, J. Thermodynamic Modeling and Kinetics Simulation of Precipitate Phases in AISI 316 Stainless Steels. J. Nucl. Mater. 2014, 448, 282–293. [Google Scholar] [CrossRef]
  52. Sawada, K.; Taneike, M.; Kimura, K.; Abe, F. Effect of Nitrogen Content on Microstructural Aspects and Creep Behavior in Extremely Low Carbon 9Cr Heat-resistant Steel. ISIJ Int. 2004, 44, 1243–1249. [Google Scholar] [CrossRef] [Green Version]
  53. Tan, L.; Graening, T.; Hu, X.; Zhong, W.; Yang, Y.; Zinkle, S.; Katoh, Y. Effects of Carbonitrides and Carbides on Microstructure and Properties of Castable Nanostructured Alloys. J. Nucl. Mater. 2020, 540, 152376. [Google Scholar] [CrossRef]
  54. Song, M.; Sun, C.; Jang, J.; Han, C.; Kim, T.; Hartwig, K.; Zhang, X. Microstructure Refinement and Strengthening Mechanisms of a 12Cr ODS Steel Processed by Equal Channel Angular Extrusion. J. Alloy. Compd. 2013, 577, 247–256. [Google Scholar] [CrossRef]
  55. Moon, J.; Lee, C.-H.; Lee, T.-H.; Kim, H.C. Effect of Heat Input on Microstructure Evolution and Mechanical Properties in the Weld Heat-Affected Zone of 9Cr-2W-VTa Reduced Activation Ferritic-Martensitic Steel for Fusion Reactor. Met. Mater. Trans. A 2014, 46, 156–163. [Google Scholar] [CrossRef]
  56. Wang, J.; Lu, S.; Rong, L.; Li, D. Thermal Cycling, Microstructure and Mechanical Properties of 9Cr2WVTa Steel Welds. J. Mater. Process. Technol. 2015, 222, 434–443. [Google Scholar] [CrossRef]
  57. Filacchioni, G.; Montanari, R.; Tata, M.; Pilloni, L. Structural and Mechanical Properties of Welded Joints of Reduced Activation Martensitic Steels. J. Nucl. Mater. 2002, 307–311, 1563–1567. [Google Scholar] [CrossRef]
  58. Cai, G.-J.; Andrén, H.-O.; Svensson, L.-E. Effect of Cooling after Welding on Microstructure and Mechanical Properties of 12 Pct Cr Steel Weld Metals. Met. Mater. Trans. A 1997, 28, 1417–1428. [Google Scholar] [CrossRef]
  59. Cai, G.-J.; Lundin, L.; Andrén, H.-O.; Svensson, L.-E. Atom-Probe Investigation of Precipitation in 12% Cr Steel Weld Metals. Appl. Surf. Sci. 1994, 76–77, 248–254. [Google Scholar] [CrossRef]
  60. Jayaram, R.; Klueh, R.L. Microstructural Characterization of 5 to 9 pct Cr-2 pct W-V-Ta Martensitic Steels. Met. Mater. Trans. A 1998, 29, 1551–1558. [Google Scholar] [CrossRef]
  61. Babu, S.; Hono, K.; Sakurai, T. Atom Probe Field Ion Microscopy Study of the Partitioning of Substitutional Elements during Tempering of a Low-Alloy Steel Martensite. Met. Mater. Trans. A 1994, 25, 499–508. [Google Scholar] [CrossRef]
  62. Babu, S.S. Thermodynamic and Kinetic Models for Describing Microstructure Evolution during Joining of Metals and Alloys. Int. Mater. Rev. 2009, 54, 333–367. [Google Scholar] [CrossRef]
Figure 1. Locations where tensile test samples were extracted and three locations labeled “Side Bottom”, “Side Top” and “L-Top”, where microstructures were investigated.
Metals 12 00342 g001
Figure 2. Optical micrograph of the “Side Bottom” location of each condition with the build direction from bottom to top.
Metals 12 00342 g002
Figure 3. Grain sizes at three different center locations in as-fabricated conditions were determined and are plotted in the top left. IPF maps were taken from the center of each sample. The build direction is shown in a corner of each IPF map.
Metals 12 00342 g003
Figure 4. Mean diameter of three center areas for as-fabricated and heat-treated conditions. Full symbols represent the mean diameter, while corresponding open symbols represent the standard deviation.
Metals 12 00342 g004
Figure 5. Characterization of the “Bottom” sample in an as-fabricated state (a,b). Optical micrographs showing a martensitic structure with delta ferrite stringers with the build direction from right to left of the “Side-Bottom” region (c). Inverse pole figure with build direction from bottom to top (d). Kernel average misorientation maps clearly demonstrating the presence of delta ferrite.
Metals 12 00342 g005
Figure 6. STEM micrographs (ac) and EDS maps showing the absence of precipitates in the as-fabricated structure.
Metals 12 00342 g006
Figure 7. Results from Pandat calculations demonstrating the expected microstructure after heat treatments with different scales of the y-axis. Normalization temperatures are shown in (a) and tempering temperatures are shown in (b).
Metals 12 00342 g007
Figure 8. Characterization of the samples after PPHT (HT-1 treatment) (a). Optical micrographs showing a highly directional anisotropic tempered martensite structure (circles), (b) with sporadic delta ferrite stringers (c). Inverse pole figure (d). Kernel average misorientation maps clearly showing the presence of delta ferrite and abnormal growth in the top left corner of (d).
Metals 12 00342 g008
Figure 9. STEM EDS micrograph of the area displayed in (a) is showing that the structure is dominated by MX carbides after PPHT (HT-1). The elements Fe, Cr, W, V, and N are shown in (bf) respectively.
Metals 12 00342 g009
Figure 10. STEM micrograph (a) and associated EDS maps (bf) at high magnifications of HT-1 exhibit a low density of fine MX precipitates.
Metals 12 00342 g010
Figure 11. Characterization of the samples after PPHT (HT-2 treatment) (a,b). Optical micrographs showing a tempered martensitic structure with sporadic delta ferrite stringers (c). Inverse pole figure (d). Kernel average misorientation maps clearly show the presence of delta ferrite.
Metals 12 00342 g011
Figure 12. HAADF image of the microstructure after HT-2 (a). STEM EDS micrographs of area (b) are showing the presence of both M23C6 and MX carbides after PPHT (HT-2).
Metals 12 00342 g012
Figure 13. EDS map of Cr and V of HT-2 (A). HR TEM micrograph (B) of area B is shown with micrographs (C,D) displaying the FFT of the highlighted areas C and D. The corresponding EDS map (A) identifies V-rich regions as MX and Cr-rich regions as M23C6.
Metals 12 00342 g013
Figure 14. Characterization of the samples after PPHT (HT-3 treatment) (a,b). Optical micrographs showing a tempered martensitic structure with sporadic delta ferrite stringers (c). Inverse pole figure (d). Kernel average misorientation maps indicate the presence of delta ferrite.
Metals 12 00342 g014
Figure 15. HAADF image of the microstructure after HT-2 (a). STEM EDS micrographs of area (b) are showing the presence of both M23C6 and MX carbides after PPHT (HT-3).
Metals 12 00342 g015
Figure 16. Mechanical properties for tensile test samples at different temperatures in all conditions perpendicular to the build direction (X) and in-build direction (Z). Ultimate Tensile Strength (a), Yield Strength (b), and Elongation in % (c) were plotted against the test temperature.
Metals 12 00342 g016
Figure 17. Porosity distribution in samples in as-fabricated and heat-treated conditions.
Metals 12 00342 g017
Figure 18. (a) Delta ferrite area fraction, martensite lath size and M23C6 sizes plotted in relationship to the heat treatment; (b) particle number density and particle sizes of MX and M23C6 precipitates are plotted for all conditions.
Metals 12 00342 g018
Figure 19. Shows the distribution of elements in MX and M23C6 for all the PWHTs. Cr and W refer to the left y-axis, V refers to the right y-axis. Cr content in the matrix (around 8.4% to 8.8%) contributed to the higher amount of Cr measured using STEM EDS.
Metals 12 00342 g019
Table 1. Chemistry demonstrating the composition of the alloy used for fabrication determined using CNO-analyzer and inductively coupled plasma mass spectrometry (ICP-MS). The displayed values are in weight %.
ConditionFeCrWVTaCMnN
ORNL 9Cr-2W alloy (nominal)Bal9.02.00.250.070.100.400.025
Powder chemistryBal9.571.940.360.050.0760.360.041
Deposit chemistryBal9.611.980.300.030.0700.360.01
Table 2. Summary of chemistries for different FM steels [4,5]. The displayed values are in weight %.
ProgramSteelCSiMnCrWVTaNB
JapanF82H0.10.20.58.02.00.20.040.010.003
-JLF-10.10.080.459.02.00.200.070.05-
EuropeOPTIFER I0.10.060.509.301.00.250.070.0150.006
-OPTIFER II0.1250.040.509.40-0.25-0.0150.006
EUROFER 0.110.050.508.51.00.250.080.030.005
USAORNL9Cr-2WVTa0.100.300.49.02.00.250.07--
Table 3. Summary of microstructure features in as-built and heat-treated conditions.
Processing ConditionDelta Ferrite Area Fraction %Martensite Lath Size/nmM23C6 Size/nmM23C6 Number Density/m−3MX Size/nmMX Number Density/m−3
As-built9.2 ± 1.9284 ± 2263 ± 111–3 × 101928 ± 221–2 × 10¹⁹
HT-13.4 ± 0.4372 ± 1982 ± 432–5 × 101951 ± 382–7 × 10¹⁹
HT-25.2 ± 0.6332 ± 1577 ± 474–6 × 101924 ± 212–5 × 10²⁰
HT-35.4 ± 1.0341 ± 1664 ± 404–6 × 101918 ± 163–6 × 10²⁰
The first number is the mean value, followed by the standard deviation as a plus/minus value. The range for the number densities includes errors from TEM lamella thicknesses and variations measured in different areas.
Table 4. Chemistries quantified from the STEM EDS measurements.
HT-1: 980 °C Normalize for 30 min + Temper at 750 °C for 2 h
PhaseVolume %FeCrWTaVCN
wt.%M23C61.8542.9139.8612.260.311.113.290.23
Std. deviation 1.381.281.320.10.10.21
wt.%(V,Ta)(C,N)0.6346.56121.130.2132.880.646.5
Std. deviation 1.50.450.20.091.080.1
wt.%Ferrite98.0186.68.392.330.550.19--
Std. deviation 2.620.280.260.080.03-
HT-2: 1150 °C Normalization for 60 min + Temper at 750 °C for 1 h
wt.%M23C61.9534.5048.2510.650.061.115.43-
Std. deviation 1.131.541.160.060.100.29
wt.%(V,Ta)(C,N)0.1945.4710.991.010.0330.251.6810.51
Std. deviation 4.591.410.680.013.160.60
wt.%Ferrite97.8688.958.790.87-0.11--
Std. deviation 2.690.290.11 0.03-
HT-3: 1150 °C Normalization for 30 min + Temper at 750 °C for 30 min
wt.%M23C61.8144.0040.4610.010.321.173.670.26
Std. deviation 1.371.261.050.080.080.170.05
wt.%(V,Ta)(C,N)0.6855.5110.451.440.5922.740.727.40
Std. deviation 1.780.420.250.150.790.120.33
wt.%Ferrite97.5185.728.592.341.770.21--
Std. deviation 2.60.280.260.20.03--
CALPHAD simulations
Ferrite97.6889.568.151.82-0.13--
M23C62.07124.4655.6112.13-1.95.09-
(V,Ta)(C,N)0.2020.235.38-6.3369.822.5815.64
TaC0.044-0.141.688.143.346.620.16
Literature (9Cr-2WV) [60]
M23C6 -46.74.6-0.9--
(V,Ta)(C,N) -8.30.5-44.2--
Literature (9Cr-2WV-Ta) [60]
M23C6 -42.14.6-0.9--
(V,Ta)(C,N) -2.50.941.25.7--
Publisher’s Note: MDPI stays neutral with regard to jurisdictional claims in published maps and institutional affiliations.

