Article

Grain Scale Investigation of the Mechanical Anisotropic Behavior of Electron Beam Powder Bed Additively Manufactured Ti6Al4V Parts

1
School for Engineering of Matter, Transport and Energy, Ira A. Fulton Schools of Engineering, Arizona State University, Tempe, AZ 85281, USA
2
School of Sustainable Engineering and the Built Environment, Ira A. Fulton Schools of Engineering, Arizona State University, Tempe, AZ 85281, USA
*
Author to whom correspondence should be addressed.
Metals 2022, 12(1), 163; https://doi.org/10.3390/met12010163
Submission received: 1 December 2021 / Revised: 14 January 2022 / Accepted: 15 January 2022 / Published: 17 January 2022
(This article belongs to the Special Issue Optimization of Metal Additive Manufacturing Processes)

Abstract

:
Numerous factors, including variable grain structures and different inherent defects, impact the mechanical behavior of Ti6Al4V parts fabricated using metal Additive Manufacturing (AM) processes. This study focuses on an in-depth analysis of how different microstructural features, such as crystallographic texture, grain size, grain boundary misorientation angles, and inherent defects, as byproducts of the electron beam powder bed fusion (EB-PBF) AM process, impact its anisotropic mechanical behavior. Standard tensile testing, conducted on samples produced at different orientations relative to the build table, showed significant anisotropy in elastic-plastic constitutive characteristics. Furthermore, X-ray computed tomography (CT) and electron back-scattered diffraction (EBSD) analyses were conducted on as-built samples to assess the effects of inherent defects and microstructural anomalies on such behavior. The samples arranged vertically and parallel to build direction had an average porosity of 0.05%, while the horizontally built samples, which were perpendicular to the build direction, had an average porosity of 0.17%. Moreover, the vertical samples showed larger grain sizes, with an average of 6.6 µm, wider α lath sizes, a lower average misorientation angle, and subsequently lower strength values than the other two horizontal samples. Among the three strong preferred grain orientations of the α phases, <1 1   2 ¯ 1> and <1 1 2 ¯ 0> were dominant in the horizontally built samples, whereas the <0 0 0 1> orientation was dominant in vertically built samples. Finally, larger grain sizes and higher beta-phase volume ratios were observed in the areas located at distances further away from the build plate. This was possibly due to the change in thermal gradients, cooling rates, and some thermal annealing phenomena resultant from the elevated build chamber temperature.

1. Introduction

Ti6Al4V alloy is an α + β phase alloy, primarily used in the aerospace industry because of its high strength and lightweight. Additionally, properties like a high melting temperature and excellent corrosion resistance have made it an exceptional selection for numerous high-temperature applications, such as jet engines and heat exchangers [1,2,3,4]. Due to its poor machinability in conventional removal techniques, as well as its high melting temperatures that create problems during manufacturing using melting techniques such as casting and forging [5,6,7], powder bed fusion (PBF) additive manufacturing (AM) processes have proven to be excellent prospects for manufacturing near-net shape Ti6Al4V parts. However, powder bed fusion (PBF) AM-processed Ti6Al4V parts are known to possess a distinctive microstructure, significant mechanical anisotropy, and various unwanted inherent defects such as a lack of fusion (LOF) porosity, keyhole porosity, and high surface roughness [8,9,10]. Some of these inherent issues of PBF techniques are inhibiting them from being widely adopted in different manufacturing industries [11]. These intrinsic microstructural aspects of PBF processes are very crucial to the resultant mechanical behavior of AM parts, specifically under various high-temperature applications.
Electron beam melting (EBM) and selective laser melting (SLM) are the two most popular PBF processes, which are being analyzed extensively as alternative manufacturing techniques for the production of bulk components with complex geometries. Ti6Al4V parts produced by these two processes exhibit slightly different microstructural and mechanical properties from each other. The SLM-processed Ti6Al4V parts generally have a distinctive α′martensitic phase, whereas the EBM-processed counterparts have mainly α phases along with a small amount of prior β phases on the grain boundaries [9,12]. These phase variations in the microstructures are primarily due to the differences in processing conditions and cooling rates between these two methods [13]. The cooling rate during the formation of the hcp α phases from the allotropic transformation of the bcc β phases dictates the final microstructure of the various PBF parts [13,14,15]. In the SLM process, the thermal gradient is much higher, resulting in a higher cooling rate as compared to the EBM process, where the build chamber is kept at an elevated temperature, resulting in a lower thermal gradient [9]. During the initial solidification of the PBF process, when the temperature is still higher than the β-transus temperature (around 980 °C), the Ti6Al4V melt pool speedily solidifies into primary β grains. These primary/prior β grains, also known as β′, then transform into a martensitic α′ phase following a rapid cooling rate. In the EBM process, the martensitic α′ phase subsequently decomposes into α colony, α basketweave, and β phases during the solid phase transformation, because of a near-isothermal annealing process at the build temperature of around 650 °C [16]. However, in the SLM process, some of these martensitic α′ phases remain after the building process due to the absence of the isothermal annealing, since the build chamber is not maintained at a high temperature in this process as opposed to the EBM process. Consequently, the tensile and fatigue properties of Ti6Al4V parts built by these two PBF processes also differ because of these microstructural variations along with the changes in the preferred grain orientation and the textures of the α and β phases, which depend on the cooling rates during the solidification stage [9,12].
Moreover, the PBF-AM-built Ti6Al4V parts also show significant anisotropic behavior under tensile loading. This anisotropic mechanical behavior could result from several factors. Various internal defect distributions, variations of microstructure, and differences in slip plane activation directions are rendered as the key components for the anisotropy of PBF parts [17]. Usually, the columnar grain boundary grows along the build direction and the slip systems become active parallel to the α platelets [9,17,18]. Furthermore, various PBF-AM-process-built Ti6Al4V parts are known to have various internal defects, such as a lack-of-fusion (LOF) porosity, keyhole porosity, and entrapped gas porosity [10,19,20,21,22]. LOF porosity occurs due to insufficient energy density, whereas keyhole porosity builds up along the scanning path because of excessive energy density [19]. A non-uniform supply of the powder layer and deviation of the process parameters from the desired ones, caused by a change of the power source and scanning system, are two of the reasons for these porosities [23]. The gas porosity could originate from the trapped argon in powder feedstock during the atomization process and from the water vapor on the powder surface as hydrogen pores [20]. All of these porosities are detrimental to the mechanical performance of the PBF parts. X-ray tomography has been an excellent tool in non-destructively analyzing these inherent defects of various metal AM parts.
The microstructural variation of the as-built and heat-treated EBM-built Ti6Al4V alloys and their effect on the resultant mechanical properties were investigated by Formanoir et al. [14]. With the help of numerical reconstruction of the primary β phases, they have shown that the prior β grain grows along the build direction following a columnar morphology during the solidification phase of the melt pool. They have also observed that the vertically built samples have a lower yield strength than the horizontally built samples. The sub-transus temperature heat treatment produced a modest microstructural variation along with a very low mechanical property shift from the as-built sample. Whereas, the super-transus heat treatment resulted in a very different microstructure with a rapid β grain growth and a transformation of a columnar morphology into an equiaxed one, as normally noticed in isotropic materials. The microstructure and property variations resulting from the processing build chamber temperature of the EBM Ti6Al4V parts have been analyzed by Al-bermani et al. [15]. That study again confirms that the initial columnar β grain transforms to the diffusional alternate α/β microstructure from the transitional martensitic structure, after the completion of the build process of the EBM Ti6Al4V component. The build temperature variation was found to have a significant effect on the resulting microstructure and mechanical properties. They have observed that increasing the build temperature above 678 °C resulted in a significant decrease in the mechanical properties due to the coarsening of the microstructure in the as-printed condition.
Finally, though the anisotropic mechanical behavior and underlying microstructural variation inherent to PBF-AM-built Ti6Al4V parts have been analyzed by various researchers, most of these studies are either inconclusive or had conflicting observations. Moreover, a comprehensive analysis, including various microstructural features such as intrinsic defects, grain sizes, crystallographic texture, preferred grain orientation, and their effects on the mechanical anisotropic behaviors, was felt highly necessary by the authors to provide further insight and precaution for the users of EBM Ti6Al4V in various critical applications. Therefore, in this current study, an in-depth analysis of the variation of inherent defects, along with microstructural aspects and their contribution to the observed mechanical behaviors, has been conducted with the help of an X-ray computed tomography (CT) and electron back-scattered diffraction (EBSD) analysis.

2. Sample Preparation

The standard sub-sized and dog-bone-shaped specimens for tensile testing were CAD modeled and manufactured, according to the ASTM E8/E8M [24] standard, using the Arcam® A2 EBM system [25]. All of the specimens were produced in a layer-by-layer fashion at three different orientations with respect to the build table, as shown in Figure 1. The focused electron beam, having a power density of up to 100 kW/cm2, was produced by applying a voltage of 60 kV to the electron gun containing a tungsten filament for melting the powder layers. The cross-raster scanning strategy, with a hatching distance of 200 µm and incident beam size of 500 µm, was followed for melting the powder particles with a layer thickness of 70 µm. The scanning speed was between 0.5 m/s and 15 m/s, and the beam power was varied between 400 W and 100 W for the preheating and melting steps. The preheating was performed at a higher speed and lower power, while the melting was conducted at a slower speed and higher power. The powder bed was preheated and kept at a temperature of around 700 °C throughout the manufacturing process for minimizing the temperature gradient inside the build chamber. Further details of the EBM process parameters can be found elsewhere [26].
Samples printed in three different orientations are named flat-built, side-built, and top-built samples (Figure 1), where deposition layers are stacked along with the thickness, width, and longitudinal directions, respectively. The Z-axis implies the build direction and is always normal to the deposited layers. Tensile tests were conducted on the three types of samples to determine their respective mechanical properties. Test coupons for microstructural structural analysis were collected from all three samples along the XZ plane, parallel to the build direction, to make a direct comparison among them. Furthermore, another batch of test coupons was collected from the XY plane, perpendicular to the build direction, of the flat-built sample to observe the microstructural variations on two different planes of the same sample.
The crystallographic samples were prepared using a standard polishing process. The test coupons were polished gradually to the finer silicon carbide (SiC) grit sizes. The second stage of the polishing was performed on low-napped synthetic rayon polishing cloth using 1 µm, 0.25 µm, and 0.1 µm diamond suspensions, sequentially. Eventually, vibratory polishing was performed using 0.05 µm colloidal silica to get rid of the residual stresses and obtain a mirror surface finish. The samples were cleaned properly using soap solution and acetone between the steps to prevent the carriage of coarser particles to the next level. During the finer polishing steps, it is very difficult to remove the scratches from the previous steps. Therefore, before moving to the next step, all samples were cleaned using ultrasound sonication in acetone solution. Finally, after the vibratory polishing, all samples were further cleaned in an ultrasound sonicator using acetone, methanol, and isopropyl alcohol (IPA), sequentially, before conducting EBSD analysis on them.

3. Experimental Procedures

3.1. Mechanical Property Measurements

At each orientation, a total of 15 samples were printed for various mechanical, surface roughness, porosity, and microstructural analyses. The mechanical properties of the as-built EBM Ti6Al4V sample built in three different orientations were measured to examine their anisotropic behavior. The tensile test was conducted using an MTS Criterion® Electromechanical Universal Test System modeled as MTS C45 (MTS Systems Corp., Eden Prairie, MN, USA), on strain control mode and with a strain rate of 6.67 × 10⁻⁴ s−1. The load cell used was called MTS LPS.504, having a force capacity of 50 kN. The extension data was collected using an Epsilon® axial extensometer (Epsilon Technology Corp., Jackson, WY, USA) with a gauge length of 10 mm and modeled as 7642-010M-075M. Tensile tests were also performed at different high temperatures up to 600 °C to observe how the mechanical properties change with the temperature. The temperature inside the environmental chamber was controlled using Eurotherm® 2404 temperature controller (Eurotherm by Schneider Electric, Worthing, UK). The high-temperature mechanical behaviors and their underlying mechanisms analysis can be found elsewhere in further detail [26]. The hardness of the specimens was measured using an ACCO WILSON Rockwell hardness tester (Acco-Wilson, Inc., Santa Cruz, CA, USA). The micro-indentation for hardness measurement was done using a sphero-conical diamond indenter with a preliminary force of 10 kgf and a total applied force of 150 kgf.

3.2. Internal and External Defects Analysis

The surface texture and roughness of the as-built EBM Ti6Al4V parts were measured using a stylus profilometer named Ambios XP-200 (Ambios Technology, Inc., Milpitas, CA, USA) to analyze the potential variation in surface roughness with the build orientations. The stylus profilometer used had a scan length range of 50 mm, a vertical measuring range of 800 µm, and a radius of the stylus tip of 2.5 µm. A total scan length of 5 mm with a scan speed of 0.03 mm/s was used for obtaining the surface profile data. Profiles from different planes of the sample were extracted along the longitudinal direction and average surface roughness was calculated for the three types of samples. Further details can be found elsewhere [27].
In contrast, the porosity and internal defects of each of the three as-built Ti6Al4V samples have been evaluated using a 3D X-ray computed tomography (CT) modeled as Phoenix V|tome|x S240 from Waygate Technologies (Waygate Technologies, Hürth, Germany). Data acquisition and analysis of these samples were conducted using Datos ACQ 2.8.2 and Datos REC 2.8.2 software (Datos Inc., New York, NY, USA), respectively. A nano-focus tube was utilized with a tube voltage and current of 160 kV and 250 µA, respectively, for getting high resolution of defects. The resultant target power was 40 W. The number of images/total scan time utilized was 1000/33 min. The voxel size was 10 µm which helped to capture internal defects of diameter 10 microns or larger. The effect of the internal and external defect on the fatigue performance of the EBM Ti6Al4V parts has been analyzed and can be found elsewhere [27].

3.3. Crystallographic Sample Analysis

The electron backscatter diffraction (EBSD) analysis was conducted on the as-built samples to observe their crystallographic textures, grain orientations, grain sizes, and grain boundary misorientation angles. The EBSD scans were accomplished using a ZEISS FIB-SEM (Carl Zeiss AG, Oberkochen, Germany) instrument equipped with EDAX®|AMETEK® EBSD detector (EDAX-AMETEK Inc., Mahwah, NJ, USA). The source electron was emitted at the sample at 20 kV at high current mode using an aperture size of 120 µm. The focused electron beam from the SEM source was applied to the crystalline sample, which was tilted 70 degrees. The generated backscattered electrons were then directed towards the detector for capturing the EBSD Kikuchi bands. Both the 500× and 3000× magnifications were used for capturing EBSD images at two different scales. The scan area for 500× magnification was 175 µm × 175 µm with a step size of 0.1 µm. The scan area for 3000× magnification was 30 µm × 30 µm with a step size of 0.06 µm. The total dwell time for each of the scans lasted for around 3–4 h. Furthermore, the OIM Analysis v8 software (EDAX-AMETEK Inc., Mahwah, NJ, USA) was used for analyzing the scanned images and obtaining various grain maps and information.

4. Results and Discussion

4.1. Anisotropic Mechanical Behavior

The representative engineering stress-strain curves of the three types of EBM Ti6Al4V samples are presented in Figure 2. The flat-built sample displays superior mechanical behavior for all tensile properties except percent elongation. The flat-built sample also has an excellent modulus of elasticity, strength, and hardness values which are comparable to the conventionally wrought Ti6Al4V alloys [28,29]. On the contrary, it has very poor percent elongation. Although both the side-built and top-built samples have outstanding percent elongation values, their other properties are considerably lower than their traditionally wrought counterpart. Therefore, the anisotropic mechanical behavior of the as-built EBM Ti6Al4V parts is clearly apparent from the presented stress-strain curves. The flat-built sample has a 3.3% and 23.3% higher modulus of elasticity than the side-built and top-built samples, respectively. Both the flat-built and side-built samples have very similar moduli of elasticity. The flat-built samples have an excellent 0.2% yield strength, which is 4.2% and 35.2% greater than the side-built and top-built samples, respectively. Again, the flat-built sample has a high ultimate tensile strength, which is 9.4% and 31.1% larger than the latter two orientations, respectively. The Vickers hardness values display a similar trend as the strength properties. The Vickers hardness values of the flat-built, side-built, and top-built samples are 345 ± 7, 318 ± 6, and 294 ± 8 HV (kgf/mm2), respectively. The flat-built sample has a 17.34% larger Vickers hardness value than the top-built one. The flat-built sample, being very close to and sharing a higher cross-sectional area with the build table, has a lower thermal gradient than the other two orientational samples. Therefore, the flat-built sample receives more time to convert a higher amount of the primary soft beta phases to the harder alpha phases. This low percentage of softer beta phases in flat-built samples makes them harder and less ductile than the side-built and top-built samples, respectively, as can be observed from both the tensile test and micro-hardness test results.

4.2. Analysis of Surface Roughness and Internal Defects

The average surface roughness parameter (Ra) was noticed to vary significantly among different sides of the same sample and also among three different build orientations of the Ti6Al4V samples. It ranges between 6 µm and 27 µm. The surfaces perpendicular to the build direction had the lowest surface roughness, as opposed to the surfaces parallel to the build direction for all three orientations. For example, the flat-built sample’s perpendicular top surface had an average surface roughness (Ra) value of 6.5 ± 1.4 µm, whereas the parallel surface had a value of 21 ± 1.9 µm. This is expected, as the surface perpendicular to the build orientation is a single-layer surface with perfect melting of the powders while the surfaces parallel to the build direction include multiple layers sandwiched on top of each other. In addition, the parallel surface contains round shapes, partially melted powder particles, and melt pools, which contribute to the high surface anomalies. To compare the average surface roughness parameters (Ra) among the three orientations, measurements were taken from both the parallel and perpendicular planes of the three samples at multiple locations, and average values were calculated. The average measurements data measured from the three as-built EBM Ti6Al4V samples of the three orientations are tabulated below in Table 1. The flat-built sample has a slightly lower Ra, since it has minimal numbers of layers compared to the other two orientations, and the majority of the surface area consists of a single layer. The top-built sample possesses a comparatively higher roughness because its surface area consists mostly of parallel planes, where a larger number of layers are combined to create the surface area. A complete report on surface roughness and its impact on long-term mechanical and fatigue behavior is provided elsewhere [27].
For the porosity measurements, a scanning volume of 332 mm3 to 393.54 mm3 was selected from the gauge section of the three types of samples. The flat-built sample revealed a very high porosity of 0.17%, whereas both the side-built and top-built samples demonstrated a similar porosity value of around 0.05%. The high porosity and lack-of-fusion (LOF) defects normally result from the insufficient melting of powder particles in between the subsequent layers, due to the deviation of the processing parameters from the desired ones caused by changes in either the power source or scanning system operation [23]. The scanning cross-section area being larger in the flat-built sample results in higher chances of accumulating LOF defects than the other two samples. The various porosity and internal defects data acquired from the 3D X-ray CT analysis of the three EBM Ti64 samples are presented in Table 2.
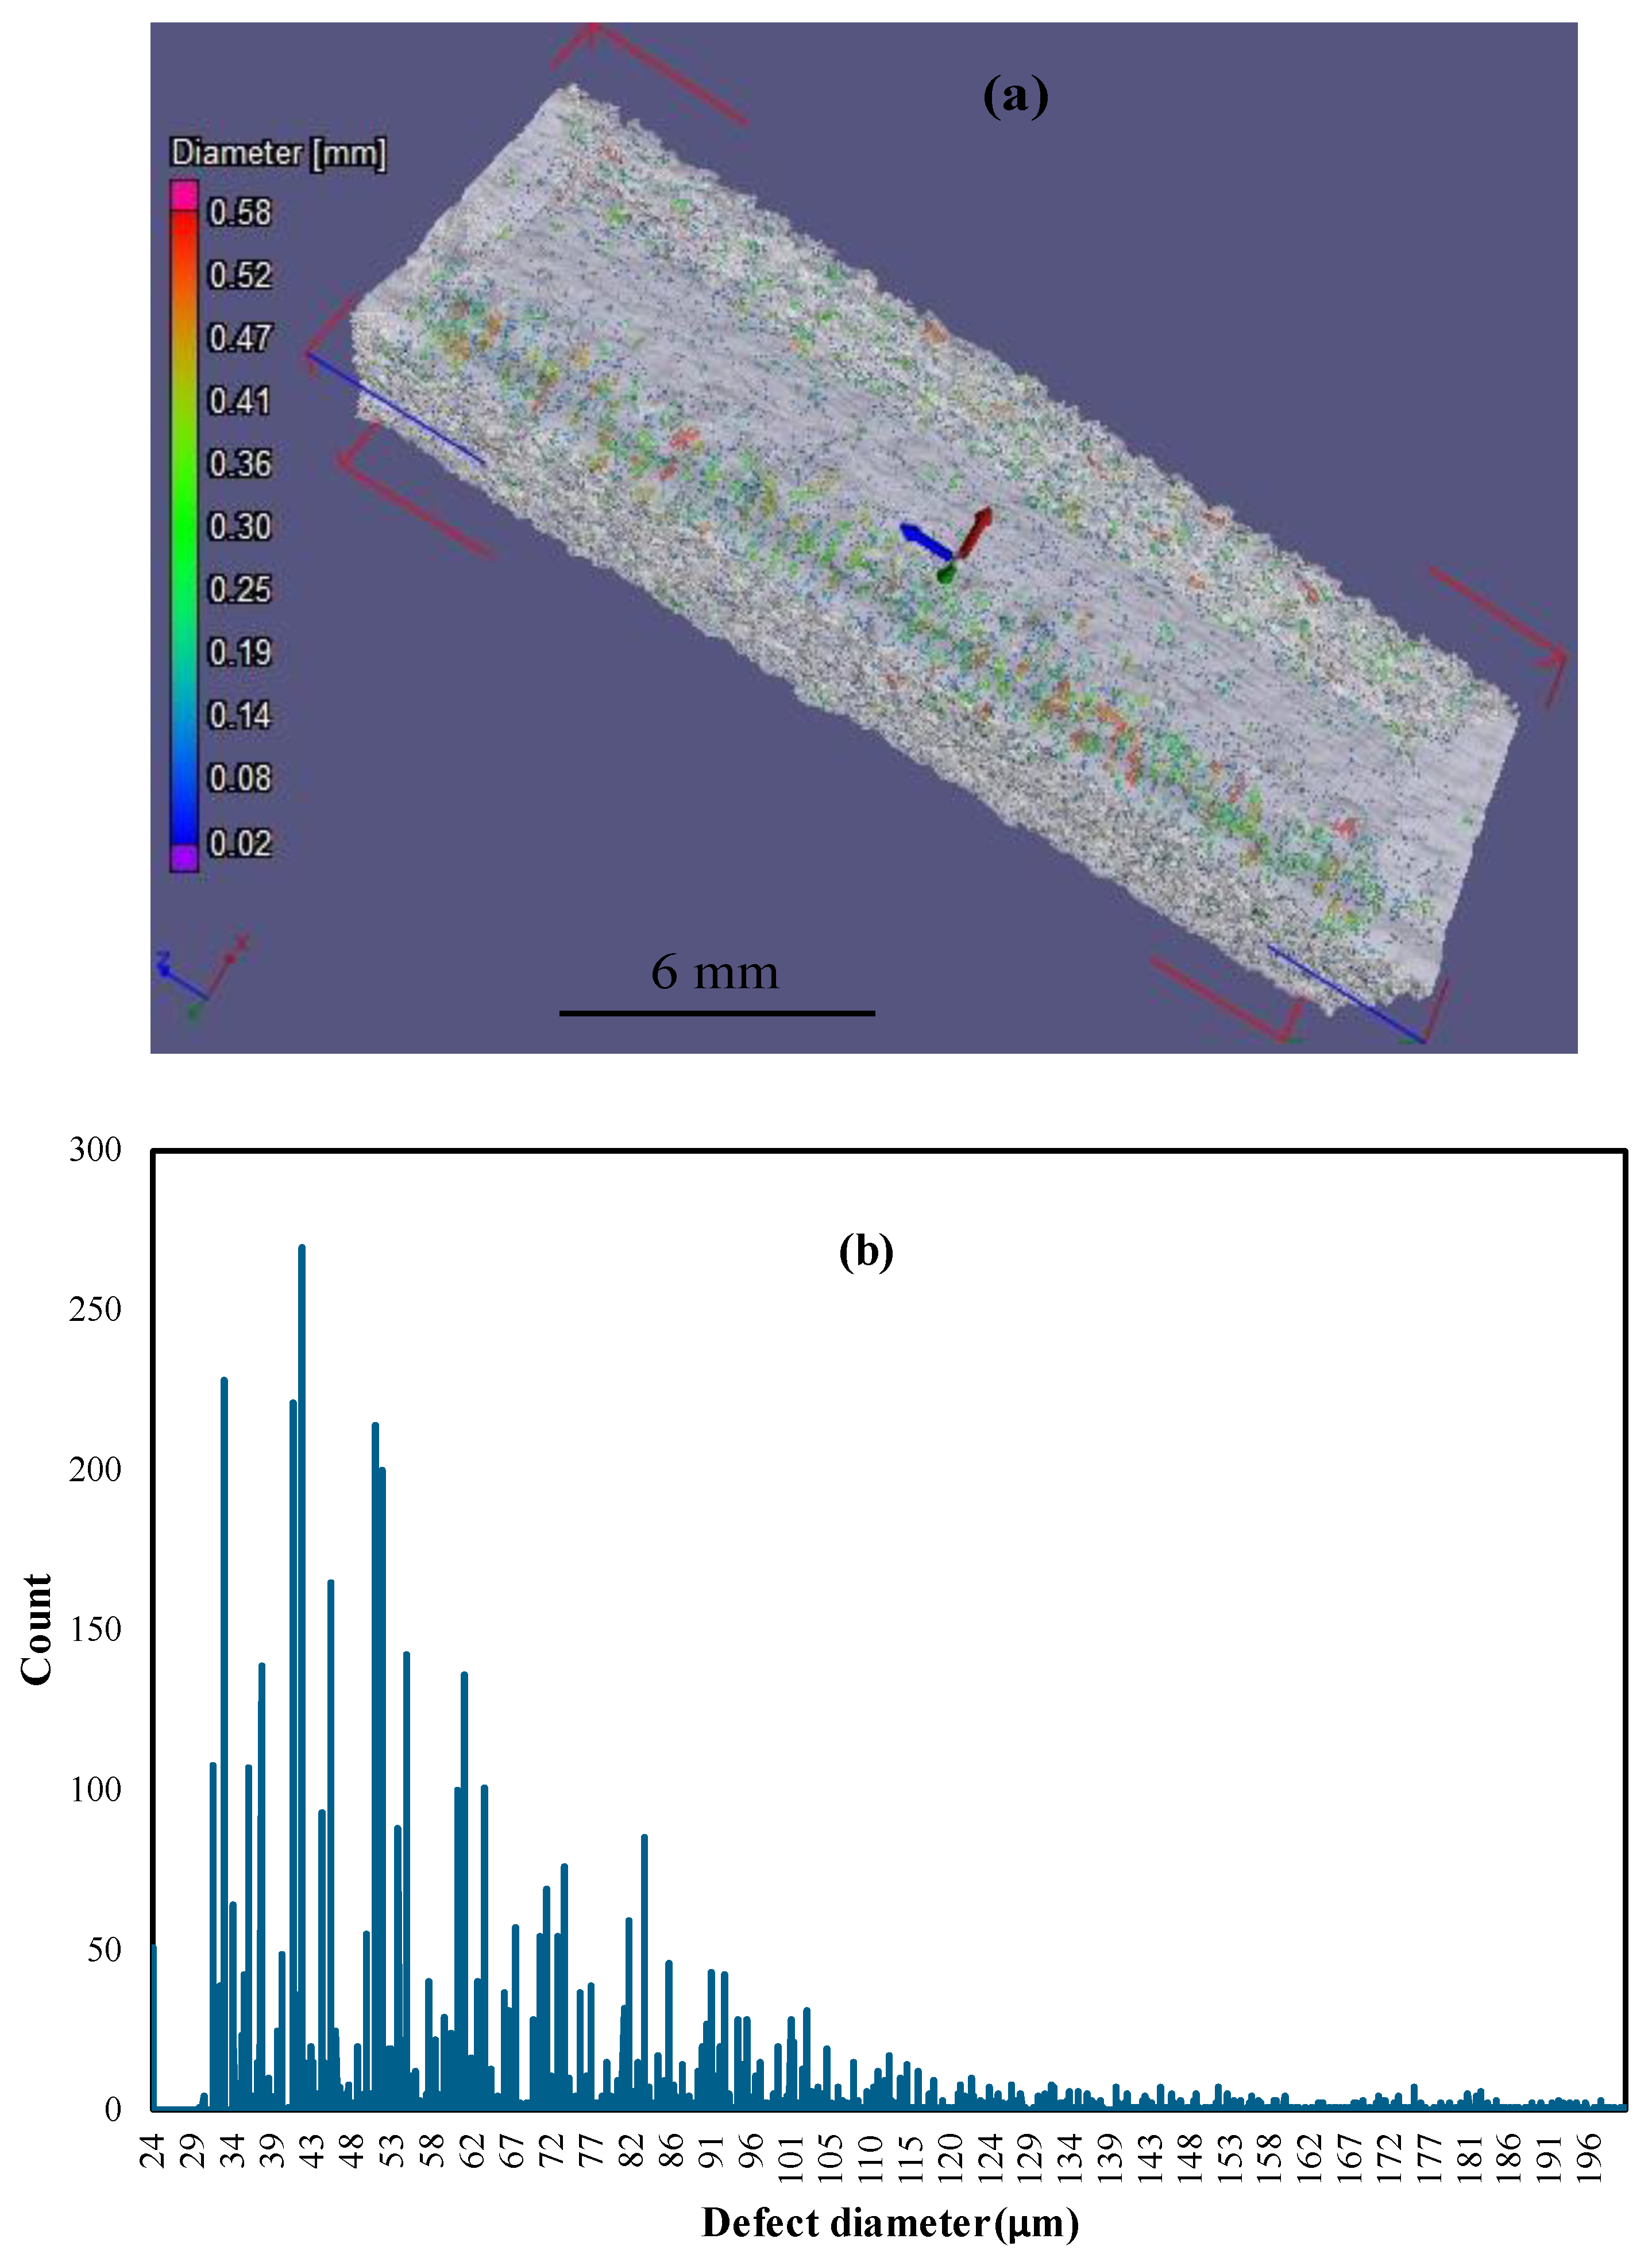
In the flat-built sample, the un-melted powder particle regions are found to be distributed along the scanning length in the longitudinal direction, and also extending to the depth of the sample, as can be observed from Figure 3a. The growth of this un-melted region was parallel to the build direction. This lack of melting defects is mainly caused by inadequate energy density delivery, as a result of a deviation of the scanning parameters from the desired ones, mainly due to variation either in the power source, scanning system maneuver, or from an intervention coming from other factors such as electromagnetic interference [23,
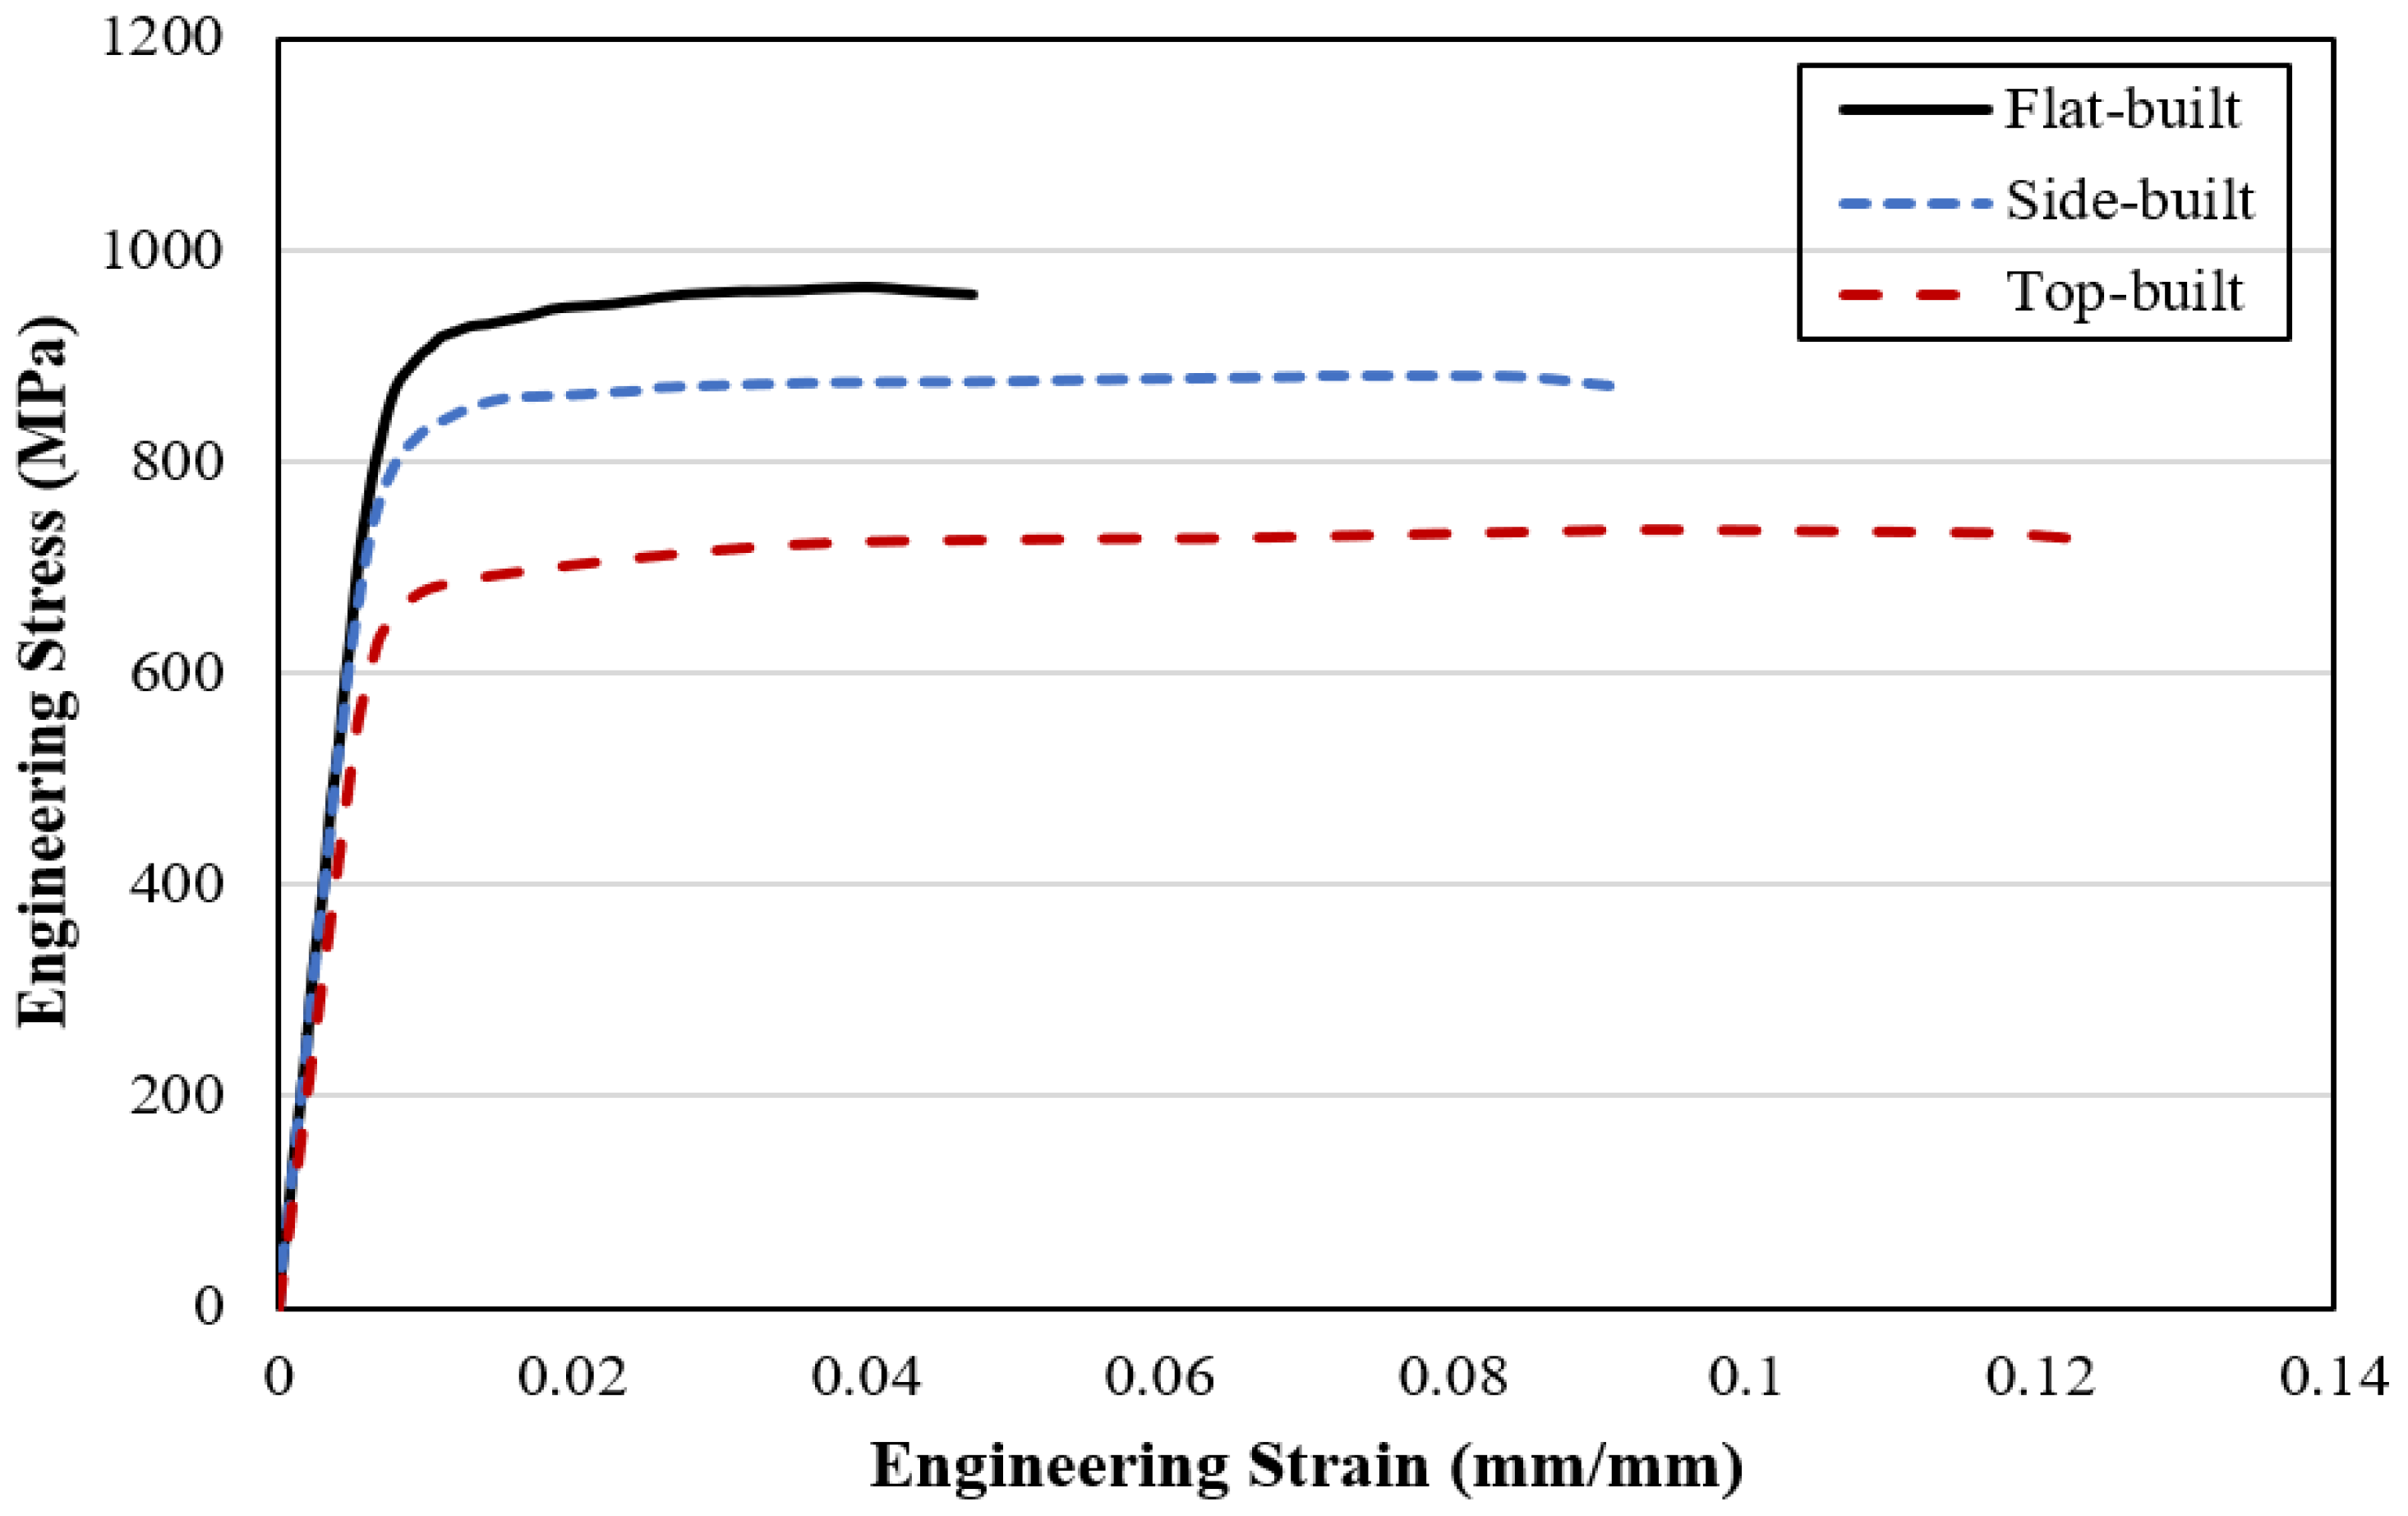
30]. The electron beam scanning direction being along the longitudinal and tensile loading direction, the defects which are distributed along the scanning path and produced by this inadequate energy delivery have hardly any effect on the tensile strength properties, as could be noticed from the earlier mechanical property measurements discussion. Figure 3b shows the frequencies of the distributed defects inside the flat-built sample. In this sample, 95% of the defects were observed to be in the diameter range of 20 µm to 150 µm, with a mean defect diameter of around 70 µm. Furthermore, the bulk of the defects, with a significant number of counts, is situated below 120 µm. Most of the defects are entrapped gas porosity, which is uniform in shape. There are several larger, non-uniform, un-melted, or partially melted region defects, which could be very critical to the performance of the final parts and need to be taken care of through process parameter optimization or other techniques.
However, Figure 4 and 
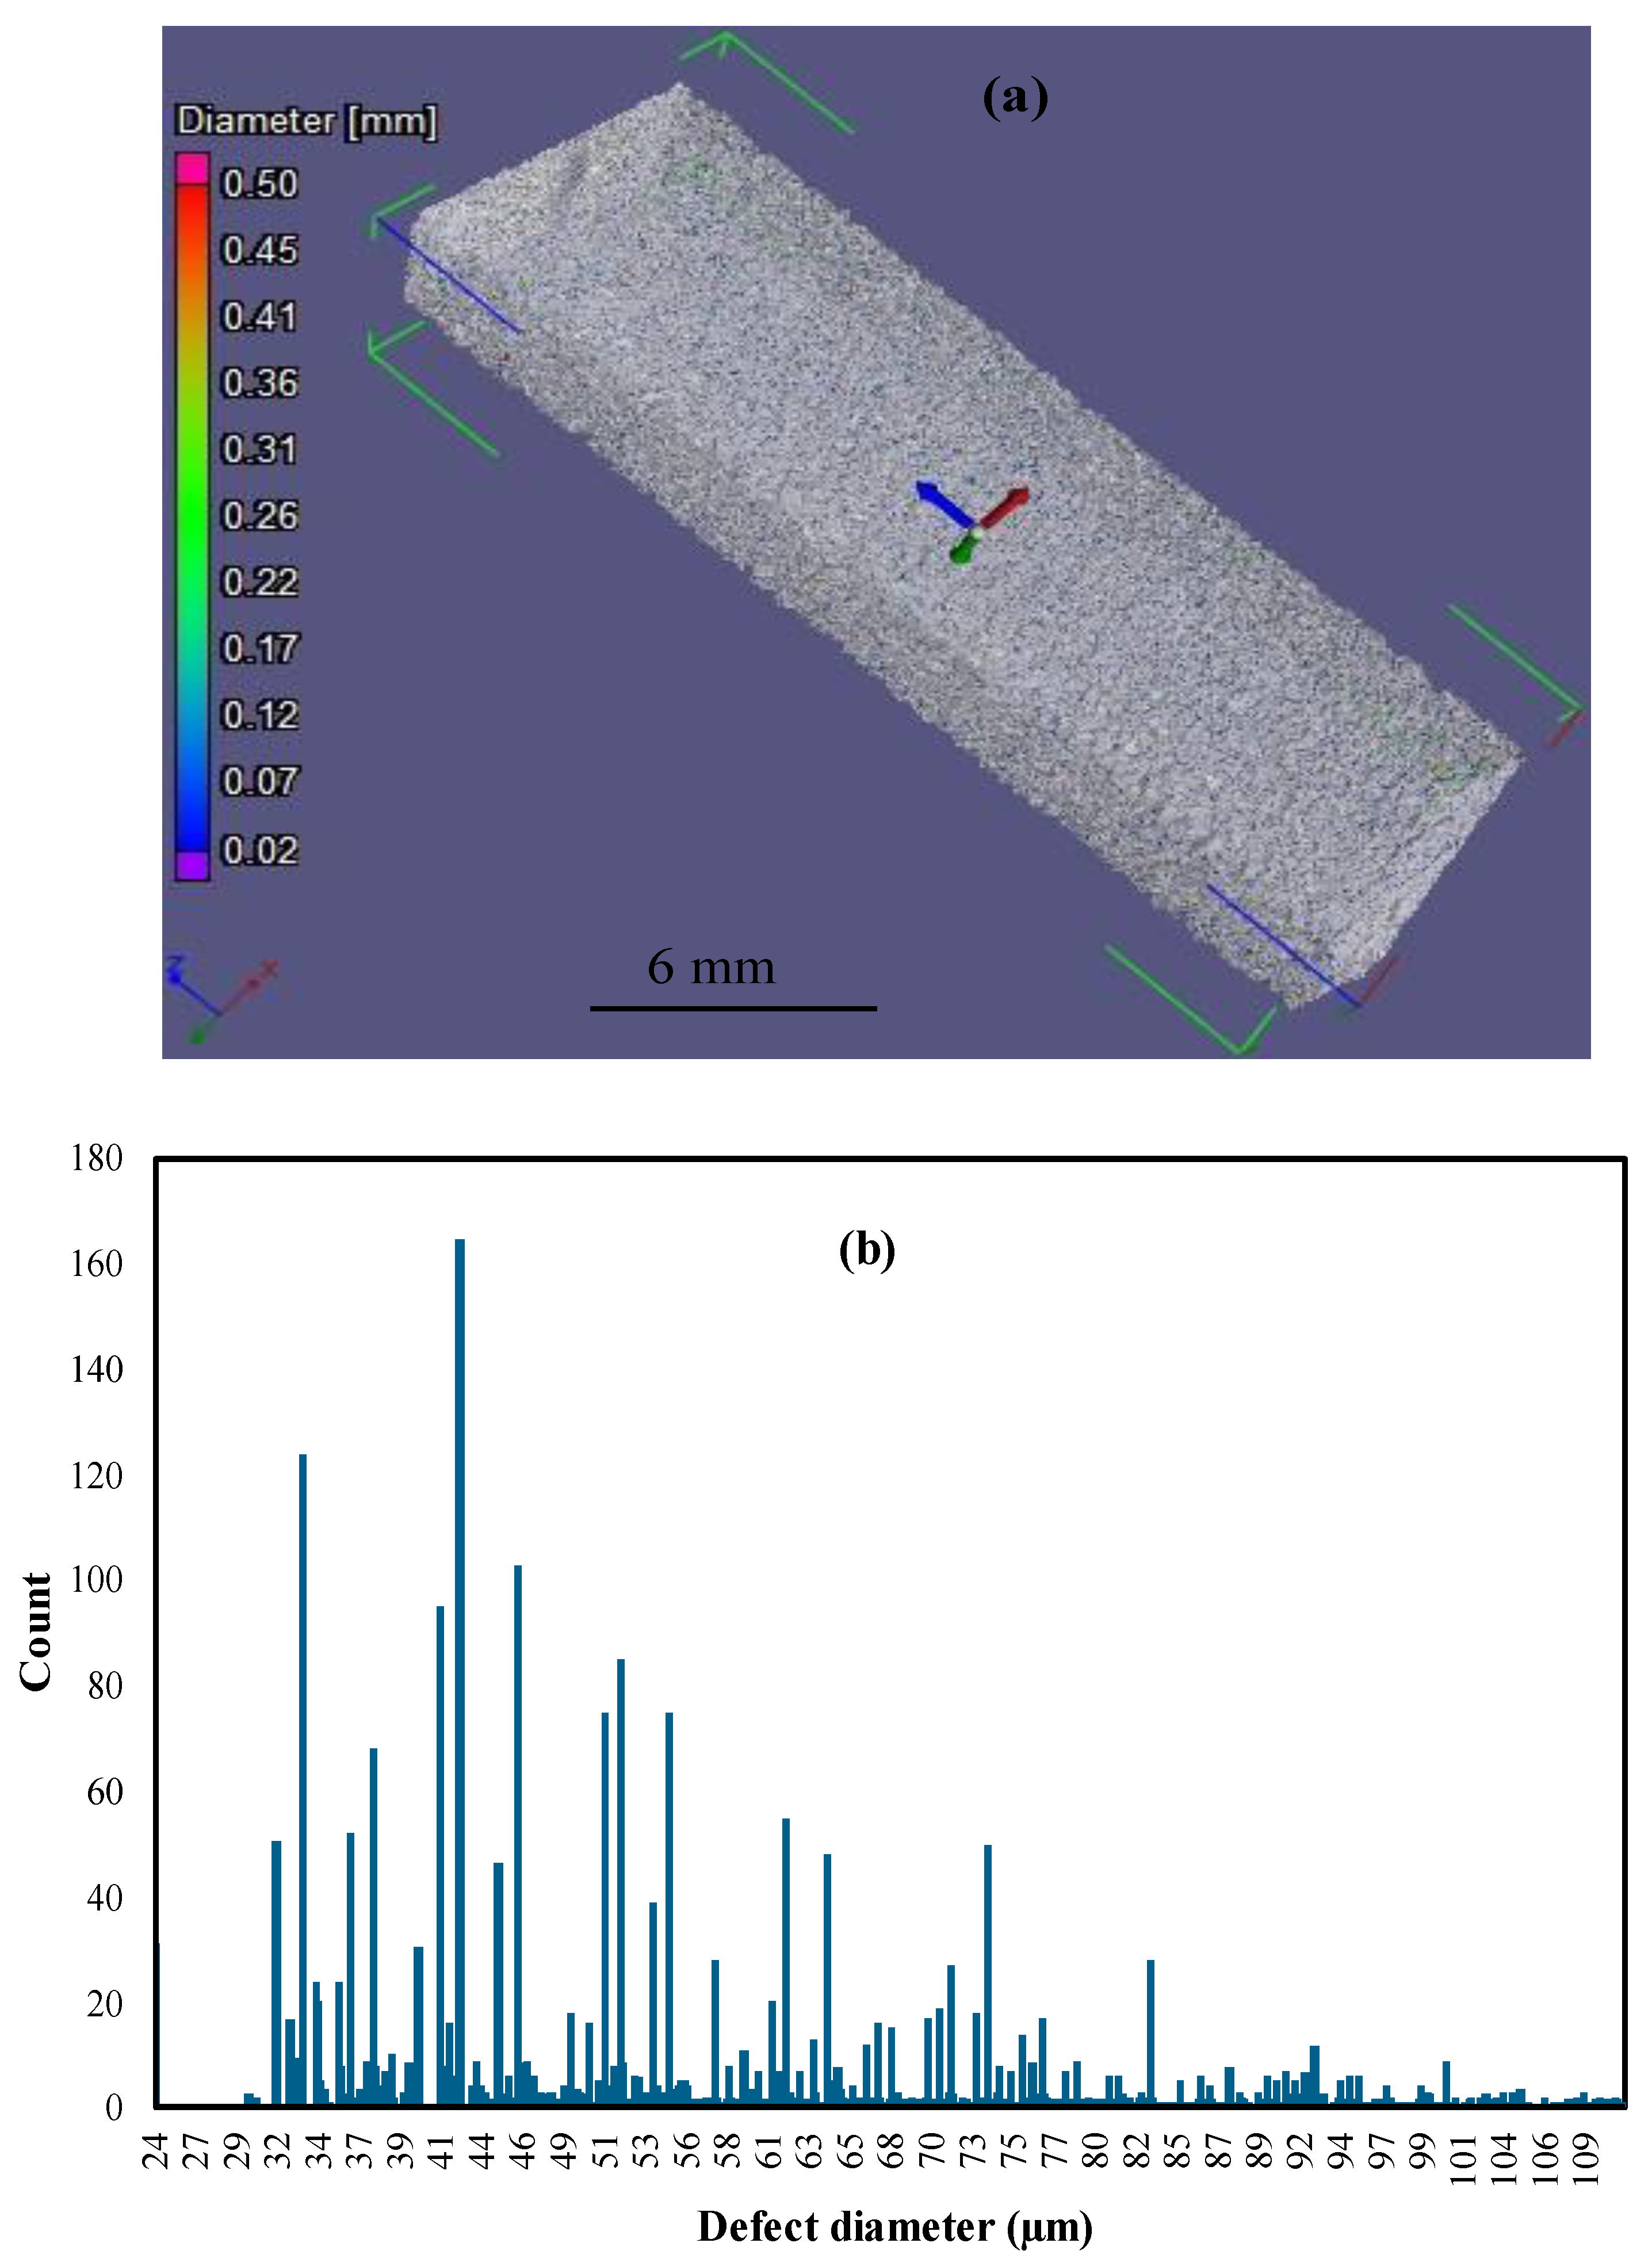
Figure 5 show that both the side-built and top-built samples have a similar kind of defect distribution inside them. In these two samples, the severity and intensity of the defects’ formation and distribution are much lower compared to the case of the flat-built samples (Figure 3). In the side-built and top-built samples, the porosity and other internal defects are distributed very homogeneously, where a majority (95%) of the defects are found to be in the diameter range of 20 µm to 110 µm, with a mean defect diameter of around 60 µm. In the side-built sample, most of the defects with a significant number of counts are below the diameter of 80 µm, and this figure is below 70 µm in the top-built sample. Although there are hardly any long un-melted or partially melted powder particle regions in these two samples as opposed to the flat-built sample, there are still some smaller un-melted or partially melted regions that could be detrimental to their fatigue performances.
Furthermore, the morphology of the defect distribution has been analyzed to observe how it changes with the defect diameter. The morphology of various available defects can be realized by the sphericity parameter (S), which is defined as Equation (1) [10]. Here, the V and A are the volume and surface area of the defect, respectively. The sphericity (S) ranges between the values of 0 and 1. A smaller S means an irregular or flatter shape defect. The defect has a more spherical or regular shape as the sphericity value grows larger and closer to 1.
S = π 1 3 ( 6 V ) 2 3 A
The sphericity of defects inside the flat-built sample spreads between 0.35 and 0.75 and decreases with an increasing defect diameter, which could be as high as 210 µm, as presented in Figure 6a. This further confirms that the flat-built sample has a large number of irregular-shaped defects with low defect sphericity and high diameter. The porosity, which generates from the lack-of-fusion (LOF) defect, normally has a very irregular shape and large diameter, as observed in this case [20]. The scattering length of the sphericity becomes narrower with an increasing defect diameter in flat-built samples. However, the sphericity of defects for side-built and top-built samples scatter between 0.42 and 0.73 (Figure 6b,c), while most of the defects have sphericity greater than 0.45. The defect diameters are also constrained below 120 µm in these two cases. Therefore, the regularity of the defects in these two samples is much better than the flat-built sample.
The width of the scatter in sphericity grows larger with an increasing defect diameter in both the side-built and top-built samples, as opposed to the case of a flat-built sample. This further indicates that the severity of the defects in side-built and top-built samples is lower than in the flat-built ones. Furthermore, the comparison of the trendlines of the sphericity distribution with defect diameter among the three samples is presented in Figure 6d. All three lines meet at a defect diameter of around 43 µm. The flat-built sample has higher sphericity below this intersection point and lower sphericity beyond that, as compared to the other two samples. Again, the flat-built sample has significantly low sphericity of the defects with a very large diameter, which could make it highly susceptible to faster failure under fatigue critical applications. Although both the side-built and top-built samples have similar trendlines, the latter has slightly lower sphericity in the larger defect region. All of the internal defects having highly irregular morphology, lower sphericity, and larger defect diameters might be very crucial as potential crack initiation and propagation sites under fatigue loading. Therefore, although surface defects are more crucial to the fatigue performance, the internal porosity defects with sharp morphology, as created due to lack of melting, might also adversely affect the performance of the as-built metal AM parts under different quasi-static and cyclic loading, leading to premature failure.
Finally, although the flat-built sample has a very poor porosity value with a lower sphericity of defects as opposed to the side-built and top-built samples, it also possesses overall better mechanical properties under tensile loading. Again, the external surface roughness defects demonstrate the opposite trend as internal defects, where the flat-built sample has a better surface finish than the other two samples. Still, the variation of average surface roughness, as calculated from different sides of the samples, is not that significant among the different orientations. Therefore, the effect of porosity and surface roughness on the anisotropic mechanical strength behavior of EB-PBF Ti6Al4V parts might not be that significant. This may also indicate that another underlying reason could be the cause of the significant anisotropy that is observed in the mechanical properties of the different build orientations. Previous studies have shown that the variation in columnar grain growth observed in different build orientations, along with microstructural variation, could be responsible for the anisotropic behaviors [17]. This variation in microstructure occurs due to several different factors, including variation in cooling rates and thermal gradients, and impacts the grain formation and growth during the process. However, further microstructural analysis is needed to make a definitive conclusion. Hence, the microstructural orientation and texture changes are further analyzed below to understand their effect on the apparent anisotropy among the various EBM Ti6Al4V parts built in different orientations with respect to the build table.

4.3. Microstructural EBSD Analysis

A microstructural analysis on EBM Ti6Al4V samples built in three different orientations was conducted using EBSD as discussed below. Initially, the two surfaces, as located on the planes which are parallel and perpendicular to the build direction of the flat-built sample, were analyzed to observe their microstructural changes, as presented in Figure 7. The inverse pole figure (IPF) of the parallel XZ plane (Figure 7a) shows grains distributed in the preferred orientation with α platelets and α colonies. On the contrary, the IPF of the XY plane, which is perpendicular to the build direction (Figure 7b), displays equiaxed and randomly orientated grains. The alpha pole figure of harmonic texture (Figure 7c,d) shows more α variants, with various grain colors on the XY plane and with a maximum texture intensity of 7.386, as compared to the XZ plane, which has a maximum texture intensity of 8.989. On both planes, the grain orientations of the α phases are in three preferred orientations of ˂0 0 0 1>, ˂1 1 2 ¯ 0>, and ˂1 1 2 ¯ 1>, whereas the beta pole figure of harmonic texture (Figure 7e,f) indicates more beta variants on the XY plane with a maximum texture intensity of 2.598, as opposed to the XZ plane where the maximum texture intensity is 2.348.
Furthermore, the XY plane also contains a greater fraction of the beta phases than the XZ plane (Figure 7g,h). The former plane has 21% beta phases while the latter plane has only 5%. The higher fraction of the beta phases on the XY plane compared to the XZ plane could be due to several reasons. For instance, during the building process, the layers further away from the build table have higher temperature gradients and higher cooling rates than the layers closer to the build table. Bottom layers face a greater number of subsequent melting and solidification steps than the top layers that are further away from the build table. Therefore, the location of the XY plane, being distant from the build table, causes phases on them to get less time to transform from prior beta phases to alpha phases, and thus the XY plane possesses a higher percentage of beta phases than the XZ plane. Again, the columnar grain growth along the building direction of the XZ plane, which is parallel to the building direction, has elongated α platelets which form several α colonies with similar preferred grain orientations possessing similar grain colors. The columnar grain growth stratifications can be observed in Figure 7a, as opposed to the randomly distributed grains with different grain colors on the plane perpendicular to the build direction (Figure 7b).
The inverse pole figures of the XZ plane of flat-built, side-built, and top-built samples (Figure 8) again confirm the columnar grain growth along the build direction. This columnar grain can typically be several millimeters long and its orientation and growth direction are dictated by the largest temperature gradient towards the build plate during the rapid cooling process [12,14,15]. The IPF maps further show that the grains in the microstructure consist mainly of α colony, α basketweave, and prior β phases, which are distributed among the alpha phases and can be seen in Figure 8a–c. The α colonies are made of the α platelets which have parallel grain orientation and belong to the same grain category of the Burger relationship. In the basket weave, the alpha grain classification has α platelets with different α categories and with different preferred grain orientations, as distinguished by various grain colors.
Furthermore, the variation in the microstructure formation and preferred grain orientations in the three samples with three build orientations can also be observed in Figure 8. The flat-built, side-built, and top-built samples display significant distinctive grains in different preferred orientations, as is also highlighted by phase color maps along with IPF maps. The organization of grains in different preferred orientations is dictated by the higher thermal gradient direction during the solidification and cooling of the molten powder layers [13,14]. Both the flat-built and side-built samples have alpha grains preferably orientated in the <1 1 2 ¯ 1> and <1 1 2 ¯ 0> directions, while the preferred orientation in the top-built samples is more inclined towards the <0 0 0 1> direction, along with a significant number of grains orientated in the <1 0 1 ¯ 0> direction. The top-built sample has slightly thicker and larger α platelets than both the flat-built and side-built samples. These variations in preferred orientation and grain sizes could be mainly due to the variation of the geometry of the three samples and subsequent changes in the thermal gradient and cooling rates [13]. Since the side-built sample shares a smaller cross-sectional area with the build plate than the flat-built sample, the former has a lower cooling rate in the building direction than the latter one. Besides, the side-built sample might transport some more heat to the sounding powders because of its narrower shape than the flat-built one. This phenomenon could contribute to the larger α platelets in the side-built sample as compared to the flat-built one. Thus, the side-built sample has a wider grain diameter size distribution than the flat-built sample.
In contrast, the top-built sample, being orientated vertically along the build direction, shares a very small cross-section with the build table. It is located further away from the build table. Consequently, it has very high cooling rates into the surrounding powder environment along with the build direction, as opposed to the flat-built and side-built samples. Therefore, the top-built sample displays slightly thicker α platelets as elongated towards the X direction. The IPF maps taken at a high magnification, as shown in Figure 8a–c, also indicate that the top-built sample has slightly larger grains, with a considerably different preferred grain orientation than the other two samples. They also reveal the elongated grain boundary, alpha colonies, and alpha basket weave platelets in various EBM-built Ti6Al4V samples. The phase maps in Figure 8d–f also indicate that all three samples consist mainly of α phases, with a very small fraction of β phases in between the grain boundaries. The size of the β grains is also very small compared to the α laths. The β laths are normally in the range of 50–60 nm and are typically very difficult to detect. The flat-built samples are found to have around 3.3% β phases and 96.7% α phases on the scanned area. The β phase percentages have increased to 5.1% and 9.0% for the side-built sample and top-built samples, respectively. The higher percentage of the comparatively softer β phases makes the top-built sample softer and more ductile than the other two samples.
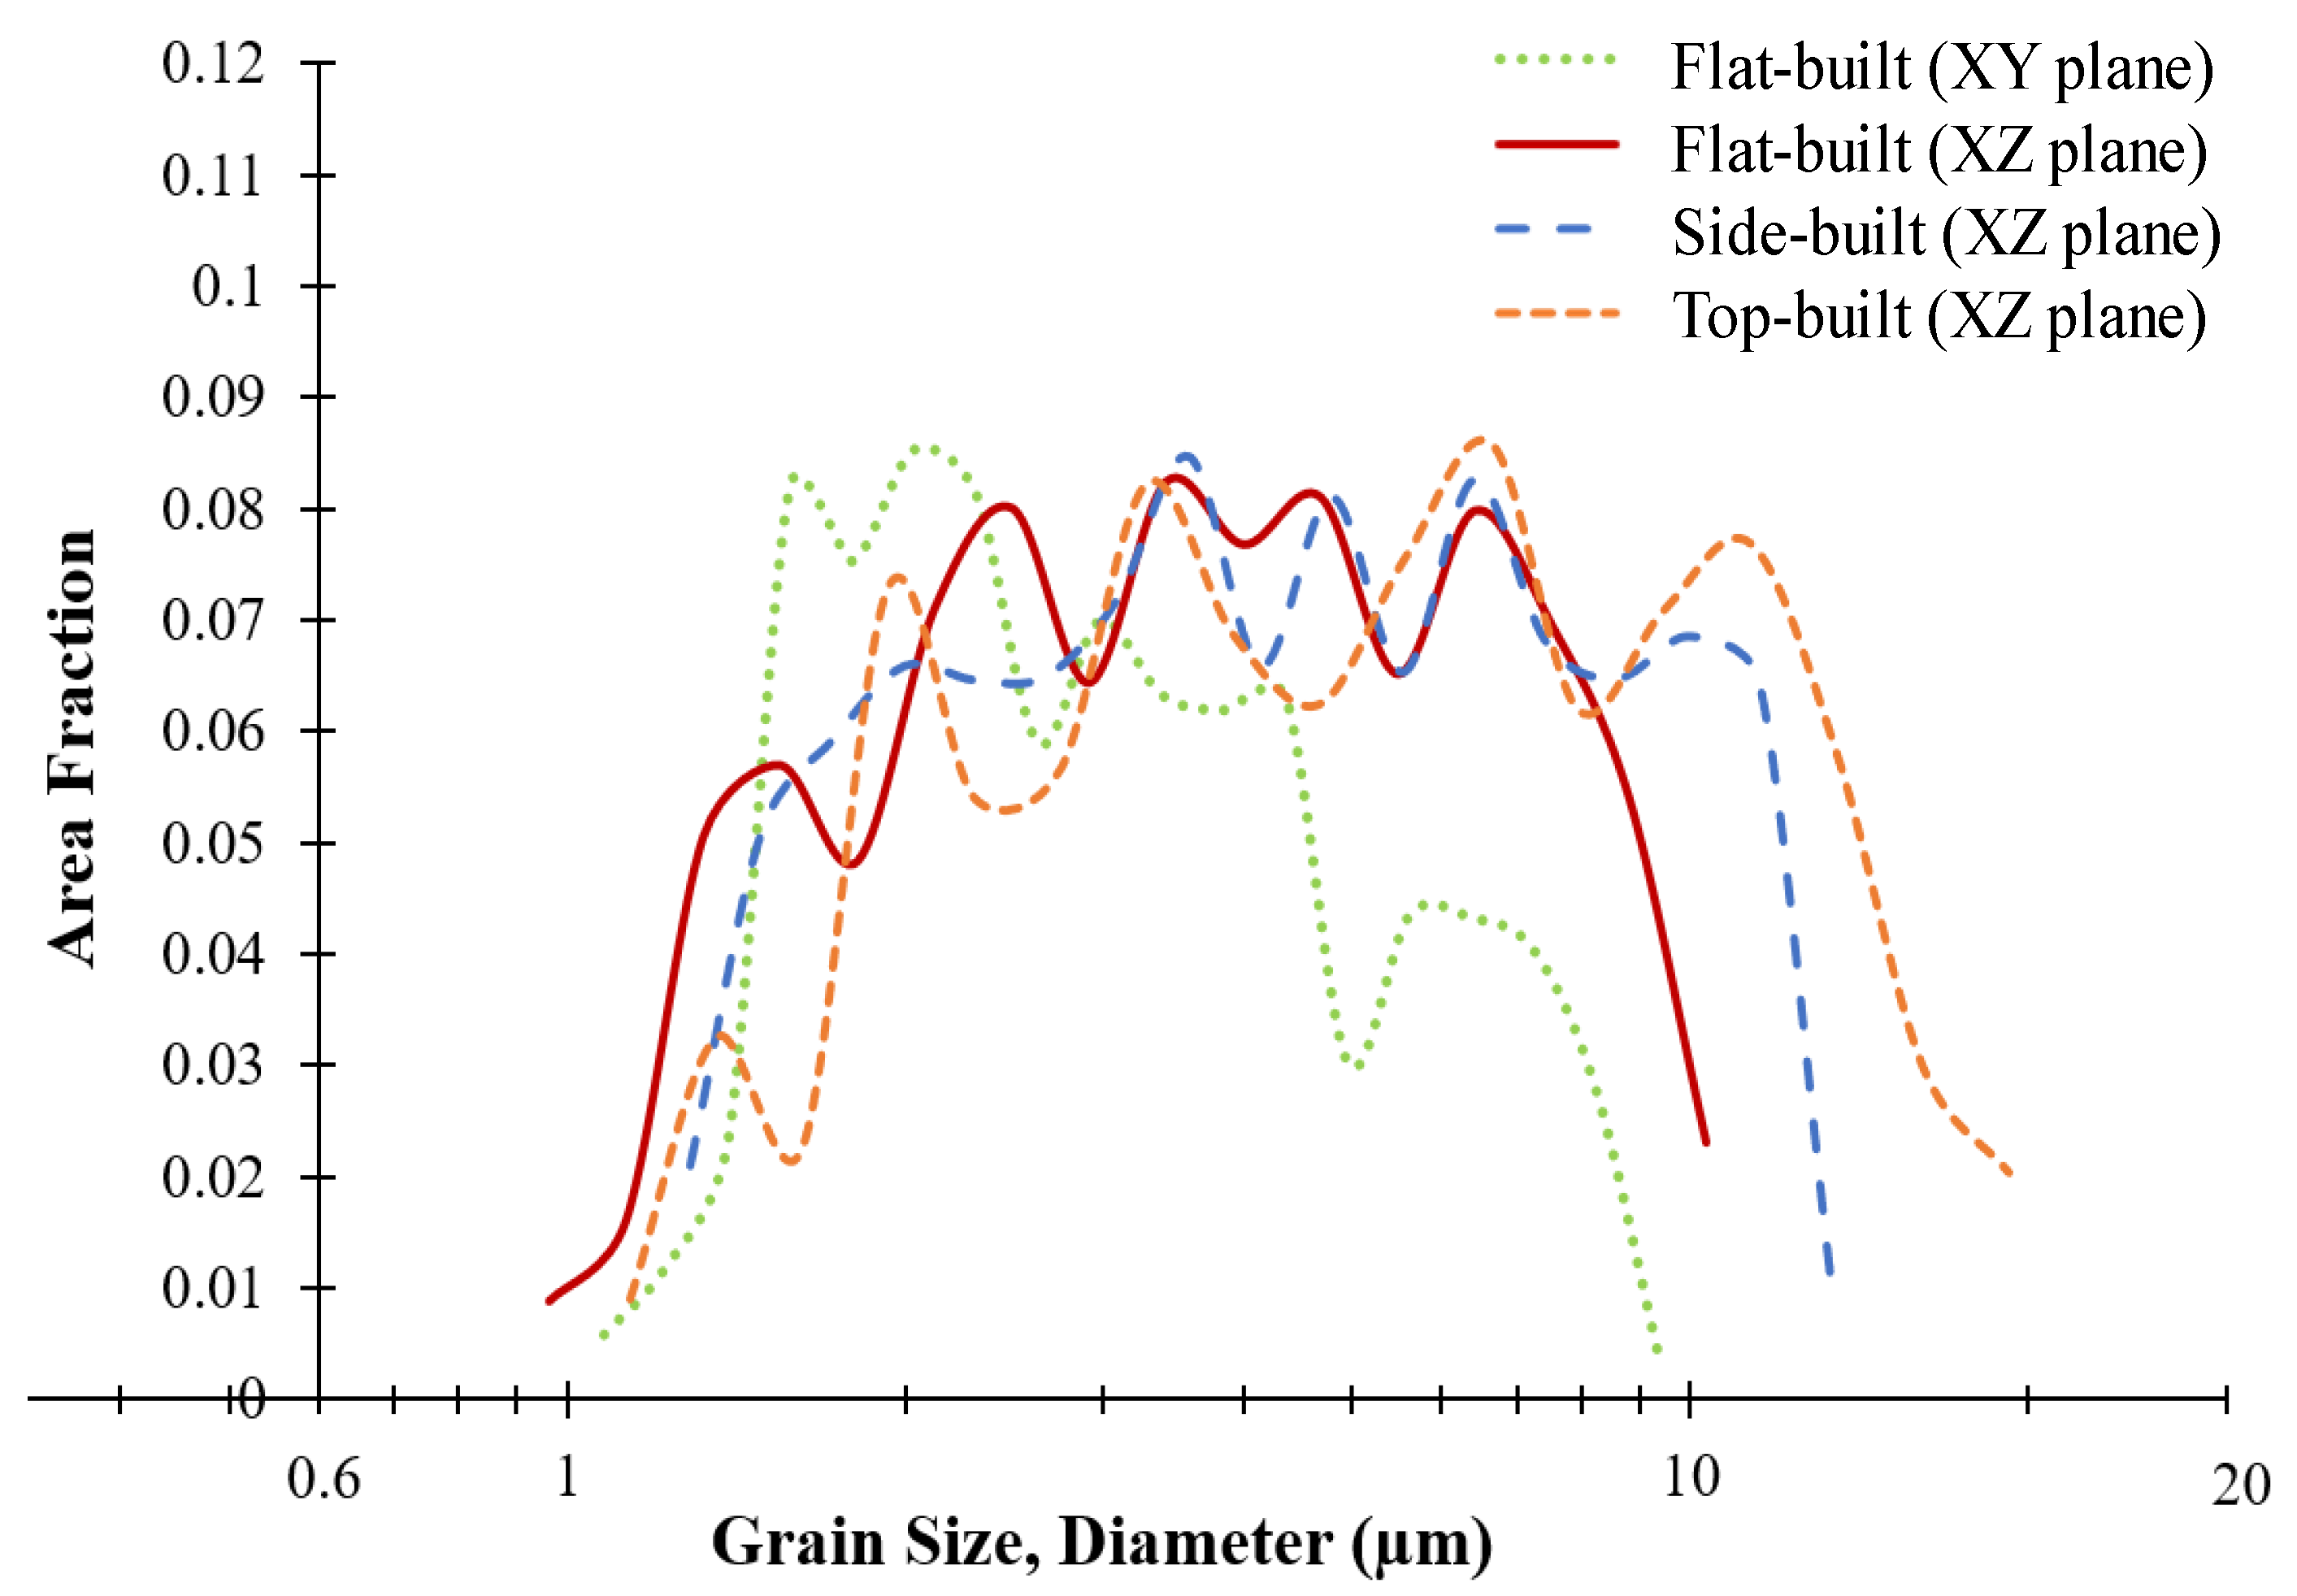
Most of the grains are concentrated towards the 2 microns size in the XY plane of flat-built samples, with an average grain size of 2.8 microns (Figure 9). On the contrary, the XZ plane of the flat-built samples has grains well distributed around an average size of 4.1 microns. The grain boundary misorientation angles are also higher in the XY plane than the XZ plane. The former has an average angle of 30.7 degrees whereas the latter plane has 25.7 degrees (Figure 10). For the side-built samples, the grains are coarser than flat-built samples and distributed between 1–13 microns, with an average size of 5.3 µm. In contrast, the flat-built sample has a comparatively finer grain size distribution between 1–10 microns, with an average size of 4.1 µm. The top-built sample being orientated in the Z direction and possessing a very small cross-section in the XY plane (plane perpendicular to the build direction) thus displays a higher number of elongated grains in the X-direction. The distance from the build plate also plays a significant role in this regard. The top-built sample is taken from the middle of the sample, which has a significantly larger distance from the build plate. This sample has a lower thermal gradient in the build (Z) direction as opposed to the other two orientations. The overall slow cooling rate in the longitudinal direction for this sample produces very coarse grains with very different preferred grain orientations from the other two samples. The grain sizes for the top-built sample could be as high as 20 microns with an average of 6.6 µm, as can be seen from Figure 9.
The variation in grain size and preferred orientation of the grains contributed mainly to the anisotropic mechanical behavior of the EBM-built samples. The flat-built sample displays the highest strength, modulus of elasticity, and hardness among the three orientations as a result of having the finest grain size. Conversely, the top-built samples have the lowest values of the above-mentioned properties because of their coarser grains due to slower cooling compared to the other two samples. On the contrary, the top-built sample has superior ductility to the other two samples, partly because it has a higher percentage of prior β phases (Figure 8f), and also due to its larger grain sizes. The flat-built (XZ plane) sample has an average misorientation angle of 25.7 degrees, while the side-built (XZ plane) and top-built (XZ plane) samples have average misorientation angles of 23.2 degrees and 22.9 degrees, respectively (Figure 10). The higher average misorientation angle contributes to the higher dislocation defects and, eventually, higher strength and lower ductility [31]. Therefore, in the flat-built samples, the grain boundary strengthening mechanism, where the high volumetric density of the grain boundaries inhibits the dislocation movements and thus strengthens the materials [32], is stronger than the other two samples. As the average misorientation angles decrease, so do the dislocation defects, which eventually increase the ductility while losing some strength. For that reason, the top-built sample potentially exhibits the lowest strength and highest percent elongation as compared to the other two samples.
The presence of a higher fraction of β phases with a strong ˂001> texture direction can also be seen from the beta pole figure in Figure 11, and can potentially contribute to the greater ductility for the top-built sample [13,33,34]. However, the flat-built sample has the lowest maximum intensity of the beta phases, resulting in very poor ductility as opposed to the side-built and top-built samples. Similarly, the harmonic texture of the α pole figure (Figure 11) shows the texture intensities of the various types of α phases with different preferred grain orientations, as generated from the parent β phases [14,15]. The maximum texture intensity of the α phases is the lowest (8.99) in the flat-built sample, indicating that it has more distinct types of α phases, possessing different preferred grain orientations resulting from the primary β phases during the β→α transformation, following the Burgers relationship. The higher number of different α variants gives it more strength and hardness than the other two samples. In contrast, the maximum texture intensity of the α phases is 11.65 and 14.94 for side-built and top-built samples, respectively. The highest maximum texture intensity in top-built samples indicates a smaller number of distinct α phases, as opposed to the other two orientational samples. Consequently, the top-built sample is the weakest in terms of strength and hardness among the three samples. Therefore, the dissimilarity in microstructural grain sizes, preferred grain orientation, grain boundary misorientation angles, and harmonic texture in different EBM-built Ti6Al4V samples, heavily contributed to the anisotropic mechanical behavior among the samples built in different orientations with respect to the build table.

5. Conclusions

The EB-PBF-AM-built Ti6Al4V samples showed significant anisotropic behavior with distinct tensile flow stress properties for the three samples built in different orientations with respect to the build table. The horizontally orientated flat-built sample displayed either similar or better mechanical properties compared to the conventionally wrought Ti6Al4V alloy. However, both the side-built and top-built samples showed lower properties in the case of all tensile properties except percent elongation. The flat-built sample has excellent tensile and hardness properties, with moduli of elasticity and yield strength and an ultimate tensile strength greater than both the side-built and top-built sample. However, the flat-built sample possesses a slightly lower surface roughness and higher internal porosity than the other two orientations. However, the effects of the inherent average surface roughness and internal defects are more crucial to fatigue performance than the anisotropic mechanical properties of PBF-AM-built metal parts.
The EBSD analysis revealed that the microstructures of the EBM-built Ti6Al4V parts consist mainly of α colony, α basket-weave platelets along with a small amount of β phases distributed along the grain boundaries of the alpha phases. However, the variation in preferred grain orientation, grain size, the intensity of harmonic grain texture, grain boundary misorientation angles, microstructural formation, and the number of potential α variants, as possibly dictated by the variation of the thermal gradient in the build direction, subsequent cooling rates, and thermal annealing phenomena due to an elevated build chamber temperature, are mainly responsible for these anisotropic mechanical behaviors. For the horizontally built sample, positioned perpendicular to build direction, being closer and sharing a larger cross-section to the build table should result in higher heat flow towards the build direction than the surrounding powders, as opposed to the vertical sample positioned parallel to the build direction during the solidification process. These phenomena of variations of heat flow direction and subsequent cooling rates potentially lead to the observed variation in the preferred grain orientation, microstructure formation, and grain distribution among the three different samples.
The vertical sample, being further away from the build plate, has higher grain sizes with a considerably different preferred grain orientation compared to the other two horizontal samples, due to the assumedly considerable change in the thermal gradients, cooling rates, and thermal annealing phenomena. The horizontal sample, which shares a larger area with the build table, also showed a higher average grain boundary misorientation angle than the other two orientations. The maximum intensities of the alpha and beta pole-figure harmonic textures also change with the build orientations of the samples. The higher percentage of the softer β phases in the vertically built sample contributed to its higher ductility versus the other two orientations. Thus, the strong microstructural variation, as observed among EBM Ti6Al4V samples built in different orientations, mainly dictates the component performance and results in the anisotropic mechanical behaviors among different metal AM-built samples. However, the effect of the various inherent defects on the mechanical behavior is not that significant compared to their detrimental effect on various fatigue-critical applications.

Author Contributions

Conceptualization, L.L., J.R. and M.J.M.; methodology, L.L. and M.J.M.; software, M.J.M.; validation, L.L., J.R. and M.J.M.; formal analysis, M.J.M.; investigation, M.J.M.; resources, L.L. and J.R.; data curation, M.J.M. and L.L.; writing—original draft preparation, M.J.M.; writing—review and editing, L.L. and M.J.M.; visualization, L.L., J.R. and M.J.M.; supervision, L.L. and J.R.; project administration, L.L. and J.R.; funding acquisition, L.L. and J.R. All authors have read and agreed to the published version of the manuscript.

Funding

This research received no external funding.

Data Availability Statement

Additional supporting data can be provided upon request.

Acknowledgments

We acknowledge the use of facilities within the Eyring Materials Center at Arizona State University supported in part by NNCI-ECCS-2025490. We also acknowledge the technical support of Bill Hayes from Waygate Technologies with the porosity measurements of the specimens using a 3D X-ray computed tomography (CT).

Conflicts of Interest

The authors declare no conflict of interest.

References

  1. Liu, S.; Shin, Y.C. Additive manufacturing of Ti6Al4V alloy: A review. Mater. Des. 2019, 164, 107552. [Google Scholar] [CrossRef]
  2. Najmon, J.C.; Raeisi, S.; Tovar, A. Review of additive manufacturing technologies and applications in the aerospace industry. Addit. Manuf. Aerosp. Ind. 2019, 2, 7–31. [Google Scholar] [CrossRef]
  3. Ladani, L. Additive Manufacturing of Metals Materials, Processes, Tests, and Standards, (n.d.). Available online: https://www.destechpub.com/product/additive-manufacturing-metals/ (accessed on 31 October 2021).
  4. Ladani, L.; Sadeghilaridjani, M. Review of powder bed fusion additive manufacturing for metals. Metals 2021, 11, 1391. [Google Scholar] [CrossRef]
  5. Nandwana, P.; Lee, Y. Influence of scan strategy on porosity and microstructure of Ti-6Al-4V fabricated by electron beam powder bed fusion. Mater. Today Commun. 2020, 24, 100962. [Google Scholar] [CrossRef]
  6. Shanmugasundaram, S.A.; Razmi, J.; Mian, M.J.; Ladani, L. Mechanical Anisotropy and Surface Roughness in Additively Manufactured Parts Fabricated by Stereolithography (SLA) Using Statistical Analysis. Materials 2020, 13, 2496. [Google Scholar] [CrossRef] [PubMed]
  7. Ahsan, F.; Ladani, L. Temperature Profile, Bead Geometry, and Elemental Evaporation in Laser Powder Bed Fusion Additive Manufacturing Process. Jom 2020, 72, 429–439. [Google Scholar] [CrossRef]
  8. Ladani, L.; Razmi, J.; Choudhury, S.F. Mechanical anisotropy and strain rate dependency behavior of Ti6Al4V produced using E-beam additive fabrication. J. Eng. Mater. Technol. 2014, 136. [Google Scholar] [CrossRef]
  9. Rafi, H.K.; Karthik, N.V.; Gong, H.; Starr, T.L.; Stucker, B.E. Microstructures and mechanical properties of Ti6Al4V parts fabricated by selective laser melting and electron beam melting. J. Mater. Eng. Perform. 2013, 22, 3872–3883. [Google Scholar] [CrossRef]
  10. Zhou, X.; Dai, N.; Chu, M.; Wang, L.; Li, D.; Zhou, L.; Cheng, X. X-ray CT analysis of the influence of process on defect in Ti-6Al-4V parts produced with Selective Laser Melting technology. Int. J. Adv. Manuf. Technol. 2020, 106, 3–14. [Google Scholar] [CrossRef]
  11. Chastand, V.; Quaegebeur, P.; Maia, W.; Charkaluk, E. Comparative study of fatigue properties of Ti-6Al-4V specimens built by electron beam melting (EBM) and selective laser melting (SLM). Mater. Charact. 2018, 143, 76–81. [Google Scholar] [CrossRef]
  12. Wang, X.; Chou, K. EBSD study of beam speed effects on Ti-6Al-4V alloy by powder bed electron beam additive manufacturing. J. Alloys Compd. 2018, 748, 236–244. [Google Scholar] [CrossRef]
  13. Antonysamy, A.A.; Meyer, J.; Prangnell, P.B. Effect of build geometry on the β-grain structure and texture in additive manufacture of Ti6Al4V by selective electron beam melting. Mater. Charact. 2013, 84, 153–168. [Google Scholar] [CrossRef]
  14. De Formanoir, C.; Michotte, S.; Rigo, O.; Germain, L.; Godet, S. Electron beam melted Ti-6Al-4V: Microstructure, texture and mechanical behavior of the as-built and heat-treated material. Mater. Sci. Eng. A 2016, 652, 105–119. [Google Scholar] [CrossRef]
  15. Al-Bermani, S.S.; Blackmore, M.L.; Zhang, W.; Todd, I. The origin of microstructural diversity, texture, and mechanical properties in electron beam melted Ti-6Al-4V. Metall. Mater. Trans. A Phys. Metall. Mater. Sci. 2010, 41, 3422–3434. [Google Scholar] [CrossRef]
  16. Tan, X.; Kok, Y.; Tan, Y.J.; Vastola, G.; Pei, Q.X.; Zhang, G.; Zhang, Y.W.; Tor, S.B.; Leong, K.F.; Chua, C.K. An experimental and simulation study on build thickness dependent microstructure for electron beam melted Ti-6Al-4V. J. Alloys Compd. 2015, 646, 303–309. [Google Scholar] [CrossRef]
  17. Ladani, L. Local and Global Mechanical Behavior and Microstructure of Ti6Al4V Parts Built Using Electron Beam Melting Technology. Metall. Mater. Trans. A Phys. Metall. Mater. Sci. 2015, 46, 3835–3841. [Google Scholar] [CrossRef]
  18. Carroll, B.E.; Palmer, T.A.; Beese, A.M. Anisotropic tensile behavior of Ti-6Al-4V components fabricated with directed energy deposition additive manufacturing. Acta Mater. 2015, 87, 309–320. [Google Scholar] [CrossRef]
  19. Martínez-Pellitero, S.; Castro, M.A.; Fernández-Abia, A.I.; González, S.; Cuesta, E. Analysis of influence factors on part quality in micro-SLA technology. Procedia Manuf. 2017, 13, 856–863. [Google Scholar] [CrossRef]
  20. Du Plessis, A. Effects of process parameters on porosity in laser powder bed fusion revealed by X-ray tomography. Addit. Manuf. 2019, 30, 100871. [Google Scholar] [CrossRef]
  21. Lee, Y.S.; Kirka, M.M.; Dinwiddie, R.B.; Raghavan, N.; Turner, J.; Dehoff, R.R.; Babu, S.S. Role of scan strategies on thermal gradient and solidification rate in electron beam powder bed fusion. Addit. Manuf. 2018, 22, 516–527. [Google Scholar] [CrossRef]
  22. Vastola, G.; Pei, Q.X.; Zhang, Y.W. Predictive model for porosity in powder-bed fusion additive manufacturing at high beam energy regime. Addit. Manuf. 2018, 22, 817–822. [Google Scholar] [CrossRef]
  23. Du Plessis, A.; Yadroitsava, I.; Yadroitsev, I. Effects of defects on mechanical properties in metal additive manufacturing: A review focusing on X-ray tomography insights. Mater. Des. 2020, 187, 108385. [Google Scholar] [CrossRef]
  24. ASTM International E8/E8M-16ae1; Standard Test Methods for Tension Testing of Metallic Materials. ASTM International: West Conshohocken, PA, USA, 2016. [CrossRef]
  25. Arcam, A.B. Electron Beam Melting—EBM Process, Additive Manufacturing | Arcam AB, ArcamEBM. 2017. Available online: http://www.arcam.com/technology/electron-beam-melting/ (accessed on 19 September 2019).
  26. Mian, M.J.; Razmi, J.; Ladani, L. Mechanical behavior of electron beam powder bed fusion additively manufactured Ti6Al4V parts at elevated temperatures. J. Manuf. Sci. Eng. Trans. ASME 2021, 143, 1–12. [Google Scholar] [CrossRef]
  27. Mian, M.J.; Razmi, J.; Ladani, L. Defect analysis and fatigue strength prediction of as-built Ti6Al4V parts, produced using electron beam melting (EBM) AM technology. Materialia 2021, 16, 101041. [Google Scholar] [CrossRef]
  28. Shunmugavel, M.; Polishetty, A.; Littlefair, G. Microstructure and Mechanical Properties of Wrought and Additive Manufactured Ti-6Al-4V Cylindrical Bars. Procedia Technol. 2015, 20, 231–236. [Google Scholar] [CrossRef] [Green Version]
  29. Lampman, S.A.S.M. International, Wrought Titanium and Titanium Alloys. Prop. Sel. Nonferrous Alloy. Spec. Mater. 2018, 2, 592–633. [Google Scholar] [CrossRef]
  30. Galarraga, H.; Lados, D.A.; Dehoff, R.R.; Kirka, M.M.; Nandwana, P. Effects of the microstructure and porosity on properties of Ti-6Al-4V ELI alloy fabricated by electron beam melting (EBM). Addit. Manuf. 2016, 10, 47–57. [Google Scholar] [CrossRef] [Green Version]
  31. Pelcastre, L. Microstructural Evolution of Ti-6Al-4V Alloy. Master’s Thesis, Luleå University of Technology, Luleå Sweden, 2008. [Google Scholar]
  32. Ma, K.; Wen, H.; Hu, T.; Topping, T.D.; Isheim, D.; Seidman, D.N.; Lavernia, E.J.; Schoenung, J.M. Mechanical behavior and strengthening mechanisms in ultrafine grain precipitation-strengthened aluminum alloy. Acta Mater. 2014, 62, 141–155. [Google Scholar] [CrossRef]
  33. Junker, D.; Hentschel, O.; Schmidt, M.; Merklein, M. Tailor-made forging tools by Laser Metal Deposition. Key Eng. Mater. 2015, 651, 707–712. [Google Scholar] [CrossRef]
  34. Moat, R.J.; Pinkerton, A.J.; Li, L.; Withers, P.J.; Preuss, M. Crystallographic texture and microstructure of pulsed diode laser-deposited Waspaloy. Acta Mater. 2009, 57, 1220–1229. [Google Scholar] [CrossRef]
Figure 1. CAD design with dimensions (inserted image) of the sub-sized Ti6Al4V tensile specimens for the EBM process with samples organized in three orientations with respect to the build table. Test coupons extracted for microstructural evaluation are marked with white boxes.
Metals 12 00163 g001
Figure 2. Engineering stress-strain curves of EBM Ti6Al4V parts from three different orientations (flat-built, side-built, and top-built) showing anisotropic flow stress properties.
Metals 12 00163 g002
Figure 3. Defect distribution on the flat-built sample, obtained from X-ray CT analysis: (a) 3D defect distribution inside the sample, and (b) frequencies of the distributed defects.
Metals 12 00163 g003
Figure 4. Defect distribution on the side-built sample, obtained from X-ray CT analysis: (a) 3D defect distribution inside the sample, and (b) frequencies of the distributed defects.
Metals 12 00163 g004
Figure 5. Defect distribution on the top-built sample, obtained from X-ray CT analysis: (a) 3D defect distribution inside the sample, and (b) frequencies of the distributed defects.
Metals 12 00163 g005
Figure 6. The scatter distribution of sphericity with increasing defect diameters of (a) flat-built, (b) side-built, and (c) top-built samples, along with (d) the comparison of the trendlines of the sphericity distribution among the three samples.
Metals 12 00163 g006aMetals 12 00163 g006b
Figure 7. Inverse pole figure (IPF) of the flat-built sample: (a) XZ plane showing grains distributed with preferred orientations; (b) XY plane showing randomly oriented equiaxed grains, along with alpha pole figure of the harmonic texture of (c) XZ plane and (d) XY plane; beta pole figure of the harmonic texture of (e) XZ plane and (f) XY plane, and phase maps (g,h) of the two planes.
Metals 12 00163 g007aMetals 12 00163 g007b
Figure 8. Various EBSD maps of the three Ti6Al4V samples. The top three inverse pole figure (IPF) maps show different preferred grain orientations on the three samples. IPF maps at higher magnification display (a) elongated grain boundary, (b) alpha colonies, (c) alpha basketweave platelets, while phase maps (df) show prior beta phases in between the alpha grain boundaries of flat-built, side-built, and top-built samples, respectively.
Metals 12 00163 g008
Figure 9. Grain size (diameter) distribution curves including average grain sizes of the flat-built, side-built, and top-built samples.
Metals 12 00163 g009
Figure 10. Misorientation angle distributions of (a) flat-built (XZ plane), (b) flat-built (XY plane), (c) side-built (XZ plane), and (d) top-built (XZ plane).
Metals 12 00163 g010
Figure 11. The harmonic texture of the three samples on the XZ plane, showing maximum texture intensity: (a) beta pole figure and (b) alpha pole figure.
Metals 12 00163 g011
Table 1. Average surface roughness parameter (Ra) data were measured from the three as-built EBM Ti6Al4V samples built in different orientations.
Sample OrientationAverage Roughness Value (µm)Standard Deviation (µm)
Flat-built201.89
Side-built211.69
Top-built251.36
Table 2. 3D X-ray computed tomography (CT) analysis data of the three as-built EBM Ti6Al4V samples built in different orientations.
Sample OrientationMean Defect Diameter (mm)Scanned Volume of Material
(mm3)
Defect Volume (mm3)Porosity (%)
Flat-built0.07394.540.690.17
Side-built0.06332.000.160.05
Top-built0.06332.960.160.05
Publisher’s Note: MDPI stays neutral with regard to jurisdictional claims in published maps and institutional affiliations.

