Article

Effect of Fe2O3 on the Crystallization Behavior of Glass-Ceramics Produced from Secondary Nickel Slag

1
School of Metallurgical Engineering, Xi’an University of Architecture and Technology, Xi’an 710055, China
2
Shaanxi Steel Group Hanzhong Iron and Steel Co., Ltd., Hanzhong 724200, China
*
Authors to whom correspondence should be addressed.
Metals 2022, 12(1), 164; https://doi.org/10.3390/met12010164
Submission received: 13 December 2021 / Revised: 12 January 2022 / Accepted: 13 January 2022 / Published: 17 January 2022
(This article belongs to the Special Issue Advances in Slag Metallurgy)

Abstract

:
In this paper, glass-ceramics were prepared from secondary nickel slag by the melting method. The effects of Fe2O3 on the crystallization behavior of glass-ceramics were investigated by differential thermal analysis, X-ray diffraction, and scanning electron microscopy. The properties of glass-ceramics such as Vickers hardness, bending strength, and acid and alkali resistance were systematically discussed. The results indicate that the crystallization temperature (Tc) and transition temperature (Tg) of the glass show a trend of decreasing and then increasing with the increase in Fe2O3 content. The precipitation and refinement of the crystalline phase were promoted significantly when the Fe2O3 content was lower (≤9.32 wt%), while the crystallinity decreased slightly when the Fe2O3 content increased to 12.42 wt%. The promotion of crystal precipitation led to the depolymerization of the glass network. When the Fe2O3 content was 9.32 wt%, the sample exhibited the best crystallization ability, consisting of uniformly distributed anorthite, ferrobustamite and glass phases, while the Vickers hardness and bending strength were 11.42 GPa and 121 MPa, respectively.

Graphical Abstract

1. Introduction

Glass-ceramics are inorganic, non-metallic materials prepared by the controlled crystallization of glasses via different processing methods [1]. They have excellent physicochemical properties and are widely used in decoration, biomedicine and construction [2]. Due to the similarity in composition, industrial solid wastes can be used as raw materials for the preparation of glass-ceramics so as to realize resource utilization [3], which not only eliminates a large quantity of waste, but also reduces the production cost of glass-ceramics [4]. Currently, the preparation of glass-ceramics using ceramic substitutes of solid wastes such as granite waste [5], molybdenum tailings [6], yellow phosphorus slag [7] and furnace slag [8,9] has become a notable research topic in the area of solid-waste recycling.
Nickel slag discharged during nickel smelting in flash furnaces or oxygen-rich top-blowing furnaces is also an important solid waste, requiring resource utilization. Scholars have mainly focused on the extraction of valuable metals [10], underground filling materials [11] and the preparation of glass-ceramics [12]. From the perspective of resource value, nickel slag reduction for iron extraction is considered as a resource utilization approach with high economic value. However, it is difficult and costly to extract iron adequately [13]. Therefore, the residual fraction of iron oxides in the secondary nickel slag is unavoidable. It is of research significance to control the appropriate amount of residual iron oxide and to consider the resource utilization of secondary nickel slag. Many studies have investigated the use of nickel slag for the preparation of glass-ceramics, but all of them have used iron-free secondary nickel slag as raw material. For example, Ma et al. [14] studied the changes in the crystalline phase and microstructure of glass-ceramics. Wang et al. [12] studied the effect of different nucleating agents on the crystallization of the glass-ceramics and found that the main crystalline phase was closely related to the nucleating agent. Previous studies have ignored the iron oxides that inevitably remain in the secondary nickel slag. Therefore, the effect of iron oxides on the crystallization of nickel slag glass-ceramics has not been clarified.
The effect of iron oxide on glass crystallization is related to the type of glass-ceramics system and the content of iron oxide. In the high basicity (30.45 wt% SiO2-47.98 wt% CaO-2.89 wt% Al2O3) glass-ceramics system, the crystallization activation energy increased and then decreased with increasing Fe2O3 content, and the samples containing Fe2O3 exhibited better acid–base resistance and water absorption in comparison [7]. In a CaO-Al2O3-MgO-P2O5 glass-ceramics system, it was found that the introduction of 5 wt% Fe2O3 as the nucleation agent could improve the mechanical properties and density [15]. In a low Mg/Al ratio (45 wt% SiO2-15 wt% CaO-11 wt% Al2O3-9 wt% MgO) glass-ceramics system, Fe2O3 facilitated the formation of spinel, but inhibited the precipitation of pyroxene, with a dual influence mechanism [16]. Therefore, the effect of Fe2O3 on the crystallization of glass-ceramics is complex. Fewer glass-ceramics with low basicity and high MgO content systems have been prepared from nickel slag, and the effect of Fe2O3 on crystallization is not known.
In this paper, the aim was to explore the effect of residual Fe2O3 content in secondary nickel slag on the crystallization and properties of glass-ceramics. Secondary nickel slag with different reduction levels was used as raw material and compounded with blast furnace slag to prepare glass-ceramics. The effects of Fe2O3 on the crystallization behavior, microstructure and properties of nickel slag glass-ceramics were investigated in detail, which will provide a theoretical basis for the cooperative utilization of nickel slag and glass-ceramics.

2. Experiment

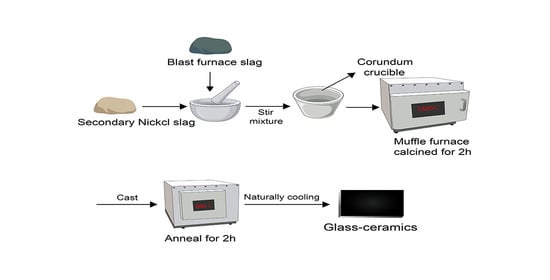
2.1. Glass Preparation

The oxide composition of the nickel slag treated in this work was obtained by X-ray fluorescence (XRF) spectroscopy (S4 Explorer, Bruker, Karlsruhe, Germany), as shown in Table 1. It was found that the total iron (TFe) content of the nickel slag was 36.24 wt%. Simulated nickel slag was prepared using analytical reagents for the subsequent study. The base batch for the glass-ceramics was determined by controlling the five reduction levels of nickel slag, which were 60%, 70%, 80%, 90% and 100%, respectively. The blast furnace slag containing 41.13 wt% CaO was the main calcium source for glass-ceramics. The formulation designs of the samples and their labels are shown in Table 2. The designs of glass-ceramics showed low basicity and high MgO content.
The powdered oxides were mixed well and then held at 1500 °C for 2 h in the muffle furnace within a Pt crucible. To better reduce the internal stress, the cast and treated samples of the base glass were first annealed at 600 °C for 2 h and then naturally cooled to room temperature.

2.2. Characterizations

Approximately 10 mg water-quenched glass powders were measured by differential scanning calorimetry (DSC131, SETARAM, Lyon, France). The samples were heated from 20 °C to 1200 °C at the rate of 10 °C/min under the air atmosphere and the air flow rate through the sample pan was kept constant at 100 mL/min. The phases of the glass-ceramics were analyzed by X-ray diffraction (D8 ADVANCE, Bruker, Karlsruhe, German). The diffraction patterns were recorded in the 2θ range from 10° to 90° at a scan rate of 4°/min. The microstructure of the sample was examined by scanning electron microscopy (VEGA II-XMU, TESCAN, s.r.o., Brno, Czech Republic) after etching with 5 wt% HF solution for 30 s. Fourier transform infrared (Nicolet Antaris II, Thermo Fisher Scientific, Waltham, MA, USA) spectra of the water-quenched samples were collected in the range of 400 cm−1–1400 cm−1.
The glass-ceramics powders with particle size 0.5 mm~1.0 mm were etched in 20 mol% H2SO4 and NaOH solution at 95 °C for 1 h, respectively, and the experiment was repeated five times. The chemical resistance was evaluated by the weight loss percentage: (m0−m1)/m0 × 100%, where m0 and m1 were the weights of the samples before and after corrosion, respectively. Meanwhile, the Vickers indentation method was used to measure Vickers hardness under 0.5 kg load for 10 s (401MVD, Beijing Shidai Shanfeng Technology Co., Ltd. (Beijing, China)). Each data point represents an average value obtained by testing ten specimens. The flexural strength assessments of samples were measured by a three-point bending method with the Material Testing System (WDW300, Jinan Wance Co., Ltd. (Jinan, China) at a sample size of 3 mm × 4 mm × 40 mm, span of 25 mm and loading speed of 0.5 mm/min. The bending strength was calculated as R = (3F∗L)/(2b∗h∗h), where F is the breaking load, L is the span, b is the width, and h is the thickness, and the bending strength test was repeated five times.

3. Results and Discussion

3.1. Thermal Behavior of the Base Glass

The crystallization behavior of the base glass after quenching was measured by DSC to determine whether it was reasonable and reliable [17]. Figure 1 shows the DSC curves of five samples containing different Fe2O3 contents. It was found that the transition temperature (Tg) of the parent glass is about 822–875 °C, and the crystallization temperature (Tc) of the main crystalline phase occurs at 1002–1058 °C. Therefore, the nucleation temperature of the samples is 900 °C, since the optimal nucleation temperature is usually 50–100 °C higher than the Tg of the glass [18]. Then, the samples were kept at nucleation temperature and the corresponding crystallization temperature for 1.5 h to obtain glass-ceramics. With the increase in Fe2O3 content, the values of Tg and Tc show a tendency to decrease and then increase, and when the Fe2O3 content is 9.32 wt%, the nucleation temperature and crystallization temperature of the glass can be reduced most effectively. When the glass contains a small amount of Fe2O3, Fe3+ exists mainly as octahedral coordination, which reduces the viscosity of the glass and facilitates the diffusion of atoms and ions, leading to a reduction in the nucleation and crystallization temperatures of the matrix glass. When the content of Fe2O3 is 12.42 wt%, the nucleation and crystallization temperatures start to increase, probably because the Fe2O3 content exceeds the appropriate range and part of the Fe3+ is present in the form of a tetrahedral coordination [19,20].
The intensity of the crystallization peak at Tc became sharp, suggesting that Fe2O3 promotes the crystallization precipitation. When the Fe2O3 content exceeds 9.32 wt%, a relatively weak exothermic peak appears near 950 °C, showing the precipitation of different crystalline phases. The results here are consistent with the subsequent analysis in XRD.

3.2. Crystalline Phase and Morphological Structures Analysis

The glass-ceramics powder was ground and then analyzed by XRD to determine the phase composition. The XRD results are shown in Figure 2. It can be seen that the broad diffraction peaks between 25°and 35°are generally considered to be the amorphous glass phase. As the Fe2O3 content increases, a large amount of anorthite (Ca(Al2Si2O8)) precipitates as the main crystalline phase. The other samples also precipitate the secondary crystalline ferrobustamite ((CaFe)SiO3) compared with the samples with 0 wt% Fe2O3 content. Notably, the peak intensity of the crystalline phase increases with increasing Fe2O3 below 9.32 wt%, but then decreases.
The average grain size of glass-ceramics was evaluated using the Scherrer equation, which is widely used to determine the size of crystalline particles in powders, as presented in Equation (1):
D = Kλ/(β∗cosθ)
where D is the average grain size of the crystalline domains, K is a dimensionless shape factor with a typical value of 0.89, λ is the wavelength of the X-rays (0.15406 nm in this case), β is the full width at half-maximum (FWHM), and θ is the Bragg angle.
The crystallinity of glass-ceramics was evaluated using the Rietveld method [21,22]. The Rietveld method is a refinement of the raw XRD spectrum, and the crystallinity was calculated based on the refinement results using TOPAS 4.2 software. The refinement spectrum is shown in Figure 3. The residual factors represented by Rwp are all below 10%, and the fitted optimized values represented by χ2 are all below 4. Therefore, the fitting effect is better and the calculation of crystallinity is more accurate. Figure 4 shows the values of crystallinity and crystallite size of glass-ceramics with different contents of Fe2O3. As the Fe2O3 content increases from 0 wt% to 12.42 wt%, the crystallinity of the glass increases monotonically and then decreases, while the crystallite size is reversed. It can be seen that the appropriate amount of Fe2O3 facilitates the precipitation and refines the crystalline phase. When the Fe2O3 content is 9.32 wt%, the glass-ceramics show the maximum crystallinity, and the characteristic peaks of the glass phase disappear, while the diffraction peaks of anorthite and ferrobustamite are more intense. However, with further increase in the content, the type of the main crystalline phase did not change, but the crystallinity decreased slightly, which shows that the excess Fe2O3 has no positive effect on the crystallization process.
Figure 5 shows the surface and interior microstructure of glass-ceramics with an Fe2O3 content of 9.32 wt%. It can be seen that the surface and internal structural forms are similar, but the amount of crystal on the surface is more uniform and dense, which is due to the fact that the crystallization process grows from the sample surface to the interior region, and the holding time on the surface is relatively longer. Therefore, macroscopically, the crystallization can be considered to be homogeneous and uniform.
The corresponding microstructure images of glass-ceramics bulks are shown in Figure 6. It can be seen that the samples (a–c) precipitated only a small amount of crystals with an average diameter of 2.00–2.90 μm. The size of the crystals in the glass-ceramics becomes smaller as the Fe2O3 content increases. When the Fe2O3 content reaches 9.32 wt% and 12.42 wt%, the crystals become dense and homogeneous. Thus, Fe2O3 can promote the refinement of crystals and the denseness of glass-ceramics.

3.3. Analysis of the Glass Network Structure

The crystallization ability of the glass correlates strongly with the structure of the glass network. To evaluate the structure of precursor samples containing different amounts of Fe2O3, infrared spectra were investigated. Figure 7 shows the FTIR spectra of the samples in the wave number range of 400–1400 cm−1. It can be seen that the variation around 800 cm−1 first shifts from higher to lower frequencies and then recovers, which confirms that the degree of network connectivity of the silicate framework may first decrease and then increase. All spectra contain typical features of the aluminosilicate glasses and consist of three components in the range of 1400–400 cm−1. The strongest absorption band is located at 1200–800 cm−1, which is generated by the antisymmetric stretching vibrations of Si-O-T (T = Si, Fe, Al) tetrahedra with different amounts of bridging oxygen (BO), and symmetric stretching vibrations of non-bridging oxygen (NBO) in O-Si-O connections linkage [23]. The weakest bond, located at 800–600 cm−1, is derived from symmetric stretching vibrations of [AlO4] tetrahedra. The absorption band located at 600–400 cm−1 is the bending vibration of BO in Si-O-T (T = Fe, Al) [24]. The trough depth of Si-O-T (T = Si, Fe, Al) tetrahedra units becomes more shallow with the appropriate increase in Fe2O3, which suggests that the complex silicate structure is simplified by Fe2O3. At high temperatures, part Fe3+ is reduced to Fe2+ [25]. Thus, Fe2+ and Fe3+ usually coexist in glasses when Fe2O3 is present in the glass system. The Fe2+ is located in octahedral coordination, while Fe3+ ions exist in both tetrahedral coordination and octahedral coordination, with the tetrahedral coordination corresponding to the replacement of Si4+, occupying the network modifying position, and the octahedral occupying the network destruction position [26]. When the Fe2O3 content is low, octahedral coordination dominates and disrupts the network structure, while the opposite is true when the content is high [27].
The degree of network connectivity can reflect the crystallization tendency of glass, and is usually estimated by the relative content of Qn (n = 0, 1, 2, 3, 4, representing the number of bridged oxygens of [SiO4]) [28]. Q1 and Q2 are monomeric and chain-like units, which can depolymerize the glass network. Q3 denotes layered units that can make the glass network harder. The band frequencies of the Qn-species tetrahedron are determined based on the analysis reported in the literature [29], as shown in Table 3. To quantitatively identify the glass structure, deconvolution of the FTIR spectra is performed in the range of 800–1200 cm−1. Figure 8 shows the assignment results of the characteristic peaks. The spectral band is divided into five individual absorption peaks, which can be assigned to Q0, Q1, Q2, Q3 and Q4, respectively. The content of the non-bridging oxygen bond to the total oxygen (NBO/T) reflects the network connectivity degree of the network structure, as shown in Equation (2) [27,28]:
NBO/T = 4 × Q1 + 3 × Q2 + 2 × Q3 + Q4
The calculation results of NBO/T are shown in Figure 9. With the increase in Fe2O3 content, the NBO/T in the precursor first increases and then decreases, reaching a maximum at an Fe2O3 content of 9.32 wt%. It can be seen that the degree of crystal network connectivity shows a trend of decreasing and then increasing. According to the network connectivity–depolymerization reaction, shown in Equation (3):
2O = O0 + O2
The increase in Fe2O3 to 9.32 wt% promotes the reaction to the left, leading to the conversion of bridging oxygen to non-bridging oxygen in the glass. The Fe2O3 content has a strong depolymerizing effect on the glass network, which makes the structure loose. This change forms more ion channels, making it easier for isolated ions such as Mg2+ and Fe3+, which have smaller ionic radii, to diffuse in the melt. Thus, the precipitation of the anorthite and ferrobustamite phase is promoted. By further increasing Fe2O3, the reaction proceeds to the right, which means that non-bridging oxygen is converted to bridging oxygen [30]. The transition reveals that Fe2O3 can not only promote the depolymerization of the glass structure but also polymerize to some extent. The loose glass network structure always favors the nucleation of the precursor [31]. Therefore, Fe2O3 can promote the depolymerization of glass network structure and drive the precipitation of the anorthite and ferrobustamite phase from the glass phase. However, the nucleation of the glass-ceramics is likely to be inhibited with high Fe2O3 content.

3.4. Physicochemical Properties of Glass-Ceramics

Glass-ceramics have the dual characteristics of glass and ceramics, with good mechanical and chemical properties. Figure 10 shows the effect of Fe2O3 content on the physicochemical properties of glass-ceramics. The Vickers hardness and bending strength gradually increase with increasing Fe2O3, mainly because of the higher crystallinity and dense structure. Glass-ceramics with high crystallinity exhibit crack–crystal interactions, which significantly strengthen the glass-ceramics [32]. Therefore, Vickers hardness and bending strength are significantly increased at high crystallinity. The mechanical properties are more suitable when the Fe2O3 is 9.32 wt%, which is due to the high crystallinity and the fine and dense microstructure of the crystalline phase. The Vickers hardness, bending strength, acid resistance and alkali resistance of this sample are 11.42 GPa and 121 MPa, 99.81% and 99.70%, respectively, which meet the performance requirements of industrial glass-ceramic plates (JC/T 2097-2011).
The increase in crystal bulk density improves the bending strength and chemical resistance of glass-ceramics. However, excessive nucleation and crystallization can reduce the proportion of glass phases, resulting in compromised connectivity between crystalline and crystalline phases, which reduces the bending strength. Therefore, a further increase in Fe2O3 weakens the properties of glass-ceramics.

4. Conclusions

In the secondary nickel slag glass-ceramics system with low basicity and high MgO content, Fe2O3 promotes the precipitation of crystals and changes the value of NBO/T in the precursor glass, leading to a more open network structure. When the Fe2O3 content was 9.32 wt%, the NBO/T reached a maximum value of 1.40. After heat treatment, the glass-ceramics were well crystallized and effectively reduced in size.
(1)
With the increase in Fe2O3 content, the crystallization temperature of glass-ceramics first decreases and then increases. Fe2O3 can effectively reduce the crystallization temperature and improve the crystallization capacity.
(2)
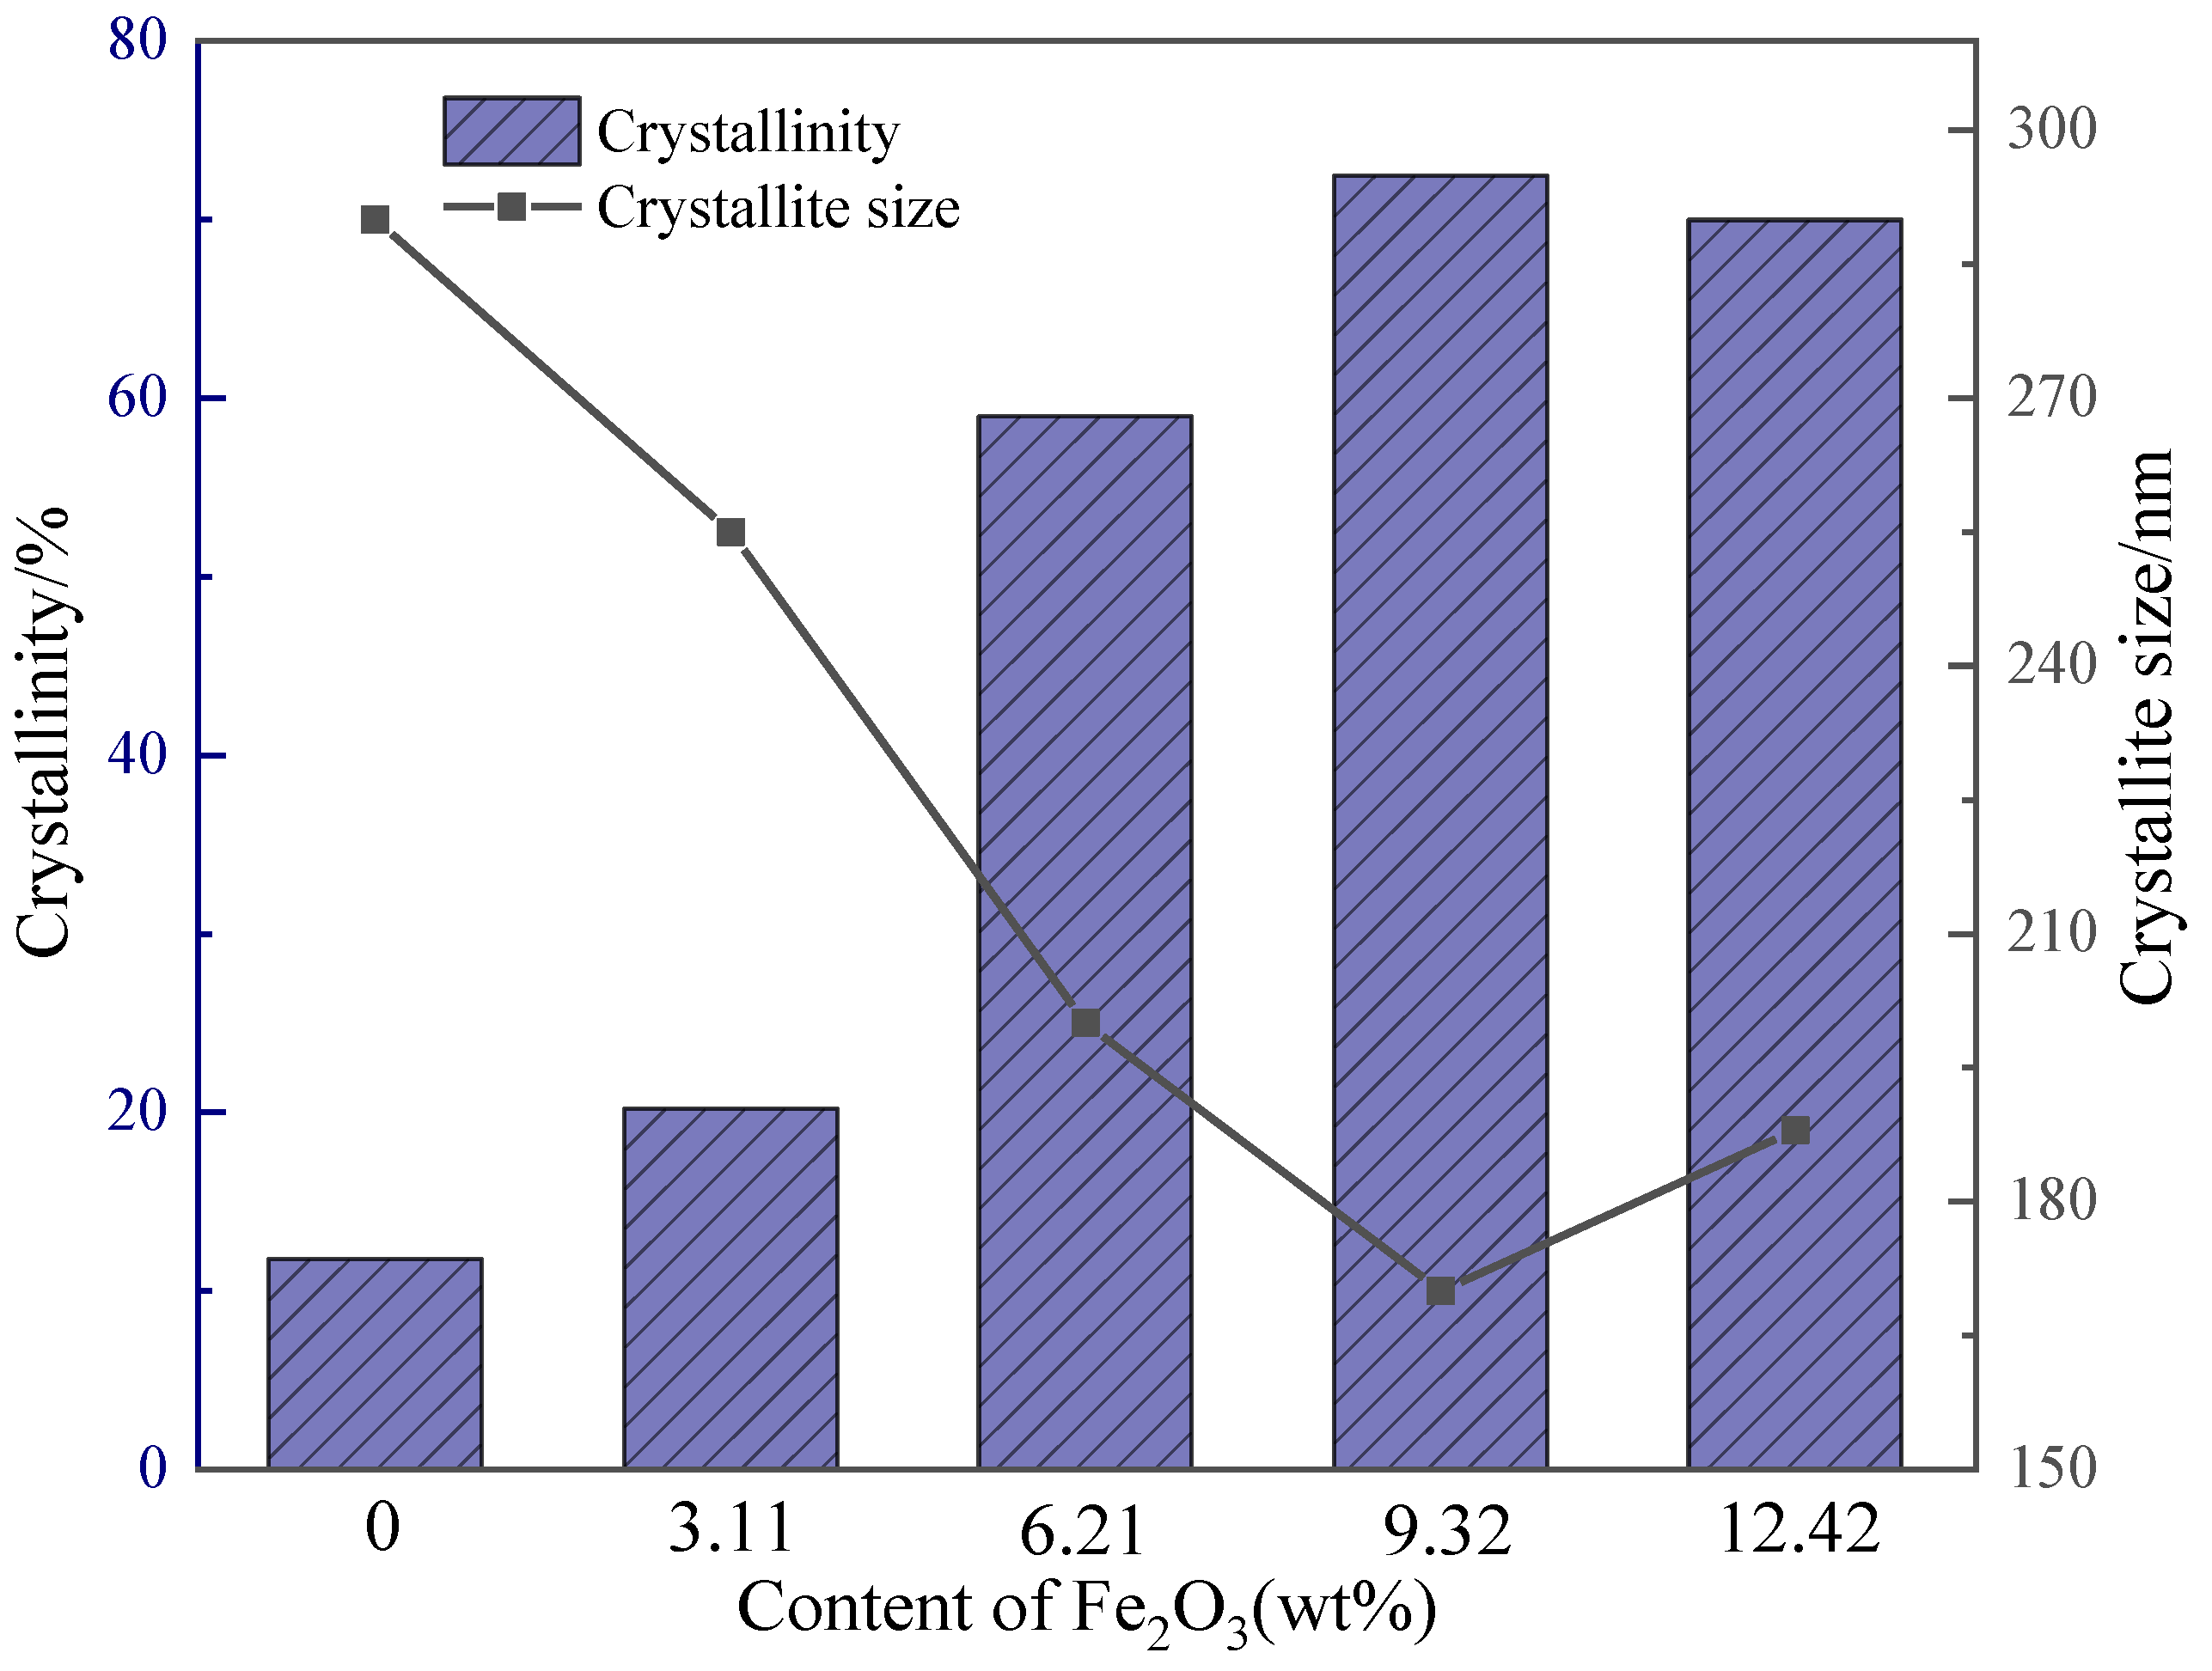
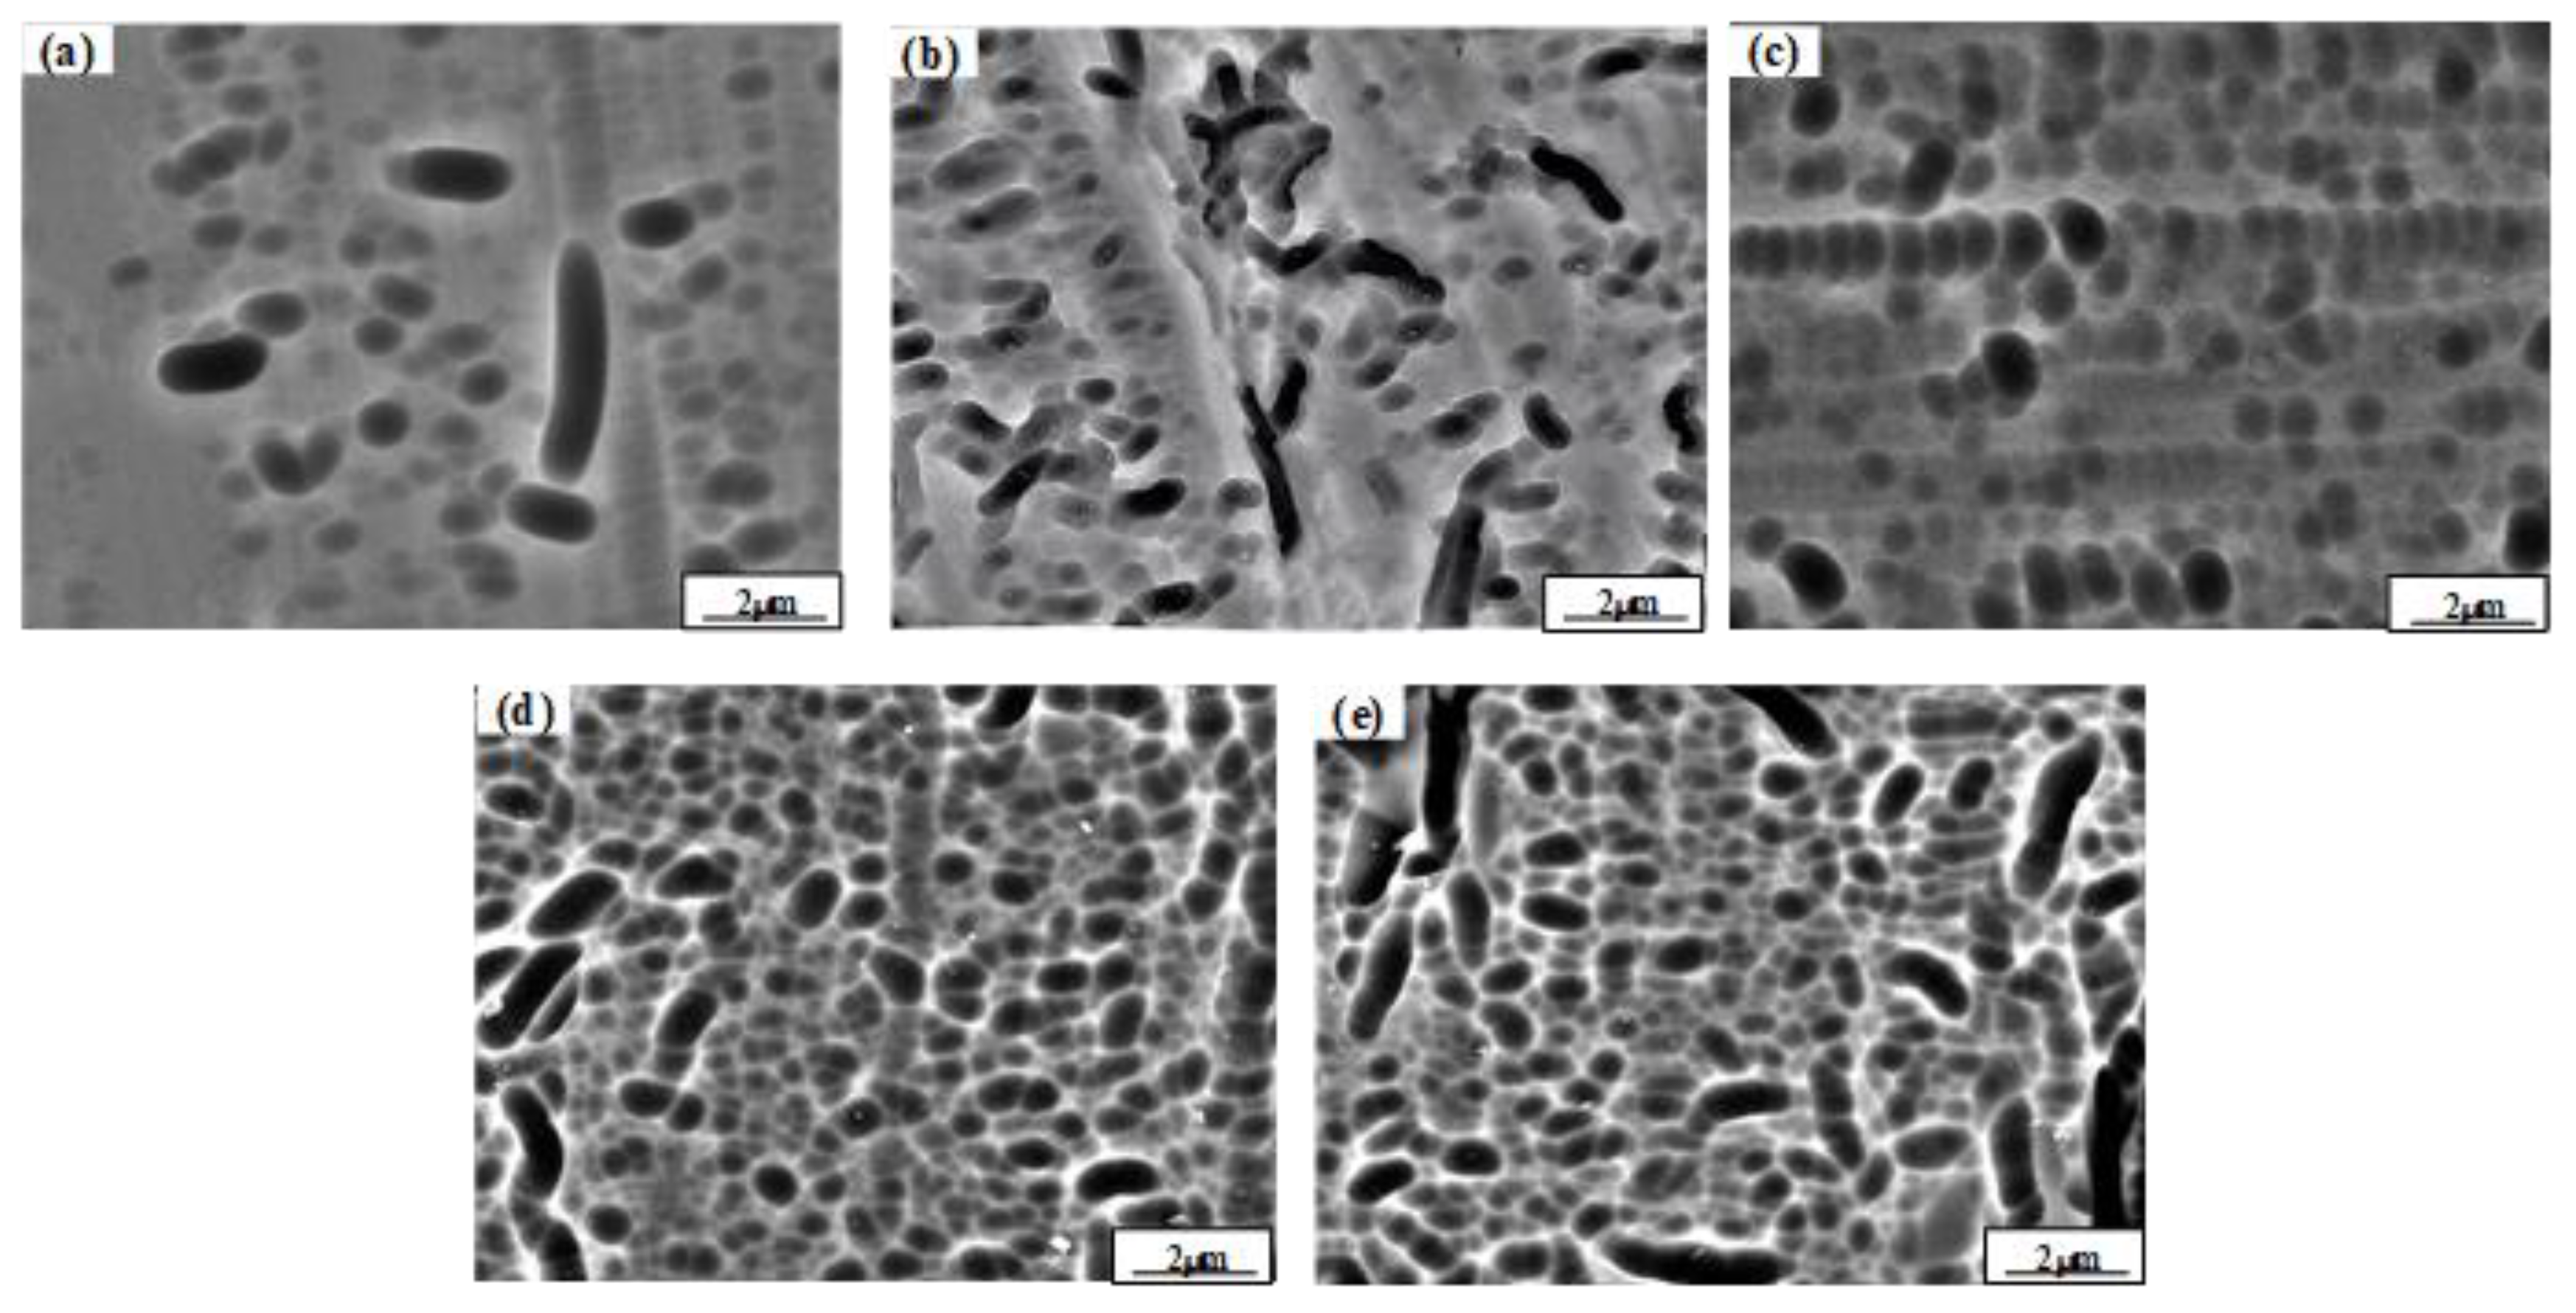
The crystal phases precipitated are anorthite and ferrobustamite, and crystallinity reaches a maximum of 72.45% with Fe2O3 content of 9.32 wt%. The microstructure of glass-ceramics becomes dense with the increase in Fe2O3.
(3)
Fe2O3 changes the value of NBO/T in the glass, increasing first and then decreasing. Excessive Fe2O3 will weaken the depolymerization of the [SiO4] tetrahedral structure, as when Fe2O3 reaches 12.42 wt%.
(4)
When the content of Fe2O3 is 9.32 wt%, the Vickers hardness, bending strength, acid resistance and alkali resistance of this sample are 11.42 GPa and 121 MPa, 99.81% and 99.70%. The performances meet the requirements of industrial glass-ceramic plates (JC/T 2097-2011).

Author Contributions

Conceptualization, X.L., X.X. and X.Z.; Methodology, X.L., X.X. and X.Z.; Software, J.L. and Y.M.; Validation, X.X. and X.Z.; Formal analysis, X.L. and T.L.; Investigation, X.L. and X.X.; Resources, J.L., Y.M. and T.L.; Data curation, X.X. and X.Z.; Writing—original draft preparation, X.L. and X.Z.; Writing—review and editing, X.L. and X.X.; Visualization, X.X.; Supervision, X.L.; Project administration, X.L.; Funding acquisition, X.L. All authors have read and agreed to the published version of the manuscript.

Funding

This research was supported by the National Natural Science Foundation of China (No. 51774224) and the Natural Science Basic Research Plan in Shaanxi Province of China (No. 2019JLM-35).

Data Availability Statement

Not applicable.

Acknowledgments

This work was supported by technology from the Analysis and Test Center of Xi’an University of Architecture and Technology.

Conflicts of Interest

The authors declare no conflict of interest.

References

  1. Deubener, J.; Allix, M.; Davis, M.J. Updated definition of glass-ceramics. J. Non-Cryst. Solids 2018, 501, 3–10. [Google Scholar] [CrossRef]
  2. Zhang, Q.L.; Tao, J.; Yang, Z.X. Influence of different activators on microstructure and strength of alkali-activated nickel slag cementitious materials. Constr. Build. Mater. 2020, 235, 117449. [Google Scholar] [CrossRef]
  3. Boudchicha, M.R.; Rubio, F.; Achour, S. Synthesis of glass ceramics from kaolin and dolomite mixture. Int. J. Miner. Metall. Mater. 2017, 24, 194–201. [Google Scholar] [CrossRef]
  4. Molla, A.R.; Basu, B. Microstructure, mechanical, and in vitro properties of mica glass-ceramics with varying fluorine content. J. Mater. Sci. Mater. Med. 2009, 20, 869–882. [Google Scholar] [CrossRef] [PubMed]
  5. Xue, J.W.; Zhong, J.W.; Mao, Y.R. Effect of CuO on crystallisation and properties of red R2O–CaO–MgO–Al2O3–SiO2 glass-ceramics from granite wastes. Ceram. Int. 2020, 46, 23186–23193. [Google Scholar] [CrossRef]
  6. Shi, J.; He, F.; Ye, C.Q. Preparation and characterization of CaO–Al2O3–SiO2 glass-ceramics from molybdenum tailings. Mater. Chem. Phys. 2017, 197, 57–64. [Google Scholar] [CrossRef]
  7. Liu, H.P.; Huang, X.F.; Ma, L.P. Effect of Fe2O3 on the crystallization behavior of glass-ceramics produced from naturally cooled yellow phosphorus furnace slag. Int. J. Miner. Metall. Mater. 2017, 24, 316–323. [Google Scholar] [CrossRef]
  8. Lei, G.; Zhang, C.X.; Zhou, J.C. Continuous cooling crystallization kinetics of a molten blast furnace slag. J. Non-Cryst. Solids 2012, 358, 20–24. [Google Scholar]
  9. Zhao, Y.; Chen, D.F.; Bi, Y.Y. Preparation of low cost glass–ceramics from molten blast furnace slag. Ceram. Int. 2012, 38, 2495–2500. [Google Scholar] [CrossRef]
  10. Jian, P.; Zheng, G.L.; Zhu, D.Q. Utilization of nickel slag using selective reduction followed by magnetic separation. Trans. Nonferr. Met. Soc. China 2013, 23, 3421–3427. [Google Scholar]
  11. Li, X.M.; Zhang, X.Y.; Li, Y. Isothermal oxidation kinetics and oxidation behavior of nickel slag. Metall. Res. Technol. 2020, 117, 603. [Google Scholar] [CrossRef]
  12. Wang, Y.L.; Wang, L.J.; Ma, M.S. Effect of Nucleating Agents on Crystallization Glass Ceramics Produced from Nickel Slag. Adv. Mat. Res. 2010, 915, 773–777. [Google Scholar] [CrossRef]
  13. Li, X.M.; Zhang, X.Y.; Zang, X.Y. Structure and Phase Changes of Nickel Slag in Oxidation Treatment. Minerals 2020, 10, 313. [Google Scholar] [CrossRef] [Green Version]
  14. Rezvani, M.; Eftekhari, Y.B.; Solati, H.M. Effect of Cr2O3, Fe2O3 and TiO2 nucleants on the crystallization behaviour of SiO2–Al2O3–CaO–MgO(R2O) glass-ceramics. Ceram. Int. 2004, 31, 75–80. [Google Scholar] [CrossRef]
  15. Zhao, M.Z.; Cao, J.W.; Wang, Z. Insight into the dual effect of Fe2O3 addition on the crystallization of CaO–MgO–Al2O3–SiO2 glass-ceramics. J. Non-Cryst. Solids 2019, 513, 144–151. [Google Scholar] [CrossRef]
  16. Pei, F.J.; Zhu, G.H.; Li, P. Effects of CaF2 on the sintering and crystallisation of CaO–MgO–Al2O3–SiO2 glass-ceramics. Ceram. Int. 2020, 46, 17825–17835. [Google Scholar] [CrossRef]
  17. Reben, M.; Kosmal, M.; Ziąbka, P. The influence of TiO2 and ZrO2 on microstructure and crystallization behavior of CRT glass. J. Non-Cryst. Solids 2015, 425, 118–123. [Google Scholar] [CrossRef]
  18. Maeyer, E.D.; Verbeeck, R.; Vercruysse, C. Infrared spectrometric study of acid-degradable glasses. J. Dent. Res. 2002, 81, 552–555. [Google Scholar] [CrossRef]
  19. Yang, Z.H.; Lin, Q.; Lu, S.C. Effect of CaO/SiO2 ratio on the preparation and crystallization of glass-ceramics from copper slag. Ceram. Int. 2014, 40, 7297–7305. [Google Scholar] [CrossRef]
  20. Tomohiro, T.; Aiko, N.; Yoshikazu, K. Glass-ceramics prepared from sludge generated by a water purification plant. Ceram. Int. 2007, 33, 573–577. [Google Scholar]
  21. Wang, W.W.; Liu, C.; Shi, L. Effects of Li2O–B2O3–SiO2–CaO–Al2O3 glass addition on the sintering behavior and microwave dielectric properties of Li3Mg2NbO6 ceramics. Appl. Phys. 2019, 125, 602. [Google Scholar] [CrossRef]
  22. Cannas, C.; Musinu, A.; Piccaluga, G. Advances in the structure and microstructure determination of yttrium silicates using the Rietveld method. J. Solid State Chem. 2005, 178, 1526–1532. [Google Scholar] [CrossRef]
  23. Zou, C.M.; Cao, J.W.; Zhao, M.Z. Combined sodium and fluorine promote diopside continuous growth to achieve one-step crystallization in CaO–Al2O3–SiO2–Fe2O3 glass-ceramics. J. Eur. Ceram. Soc. 2019, 39, 4979–4987. [Google Scholar] [CrossRef]
  24. Zhao, S.Z.; Liu, B.; Ding, Y.J. Study on glass-ceramics made from MSWI fly ash, pickling sludge and waste glass by one-step process. J. Clean. Prod. 2020, 271, 122674. [Google Scholar] [CrossRef]
  25. Alizadeh, P.; Yekta, B.E. Effect of Fe2O3 addition on the sinterability and machinability of glass-ceramics in the system MgO–CaO–SiO2–P2O5. J. Eur. Ceram. Soc. 2004, 24, 3529–3533. [Google Scholar] [CrossRef]
  26. Noelio, O.; Walter, E.; Anielle, C.A. Effect of Fe2O3 concentration on the structure of the SiO2–Na2O–Al2O3–B2O3 glass system. Spectrochim. Acta Part A Mol. Biomol. Spectrosc. 2011, 81, 140–143. [Google Scholar]
  27. Nagarjuna, G.; Enkatramaiah, N.; Satyanarayana, P.V.V. Fe2O3-induced crystallization and the physical properties of lead arsenate glass system. J. Alloys Compd. 2009, 468, 466–476. [Google Scholar] [CrossRef]
  28. Jeff, K.; Merete, T.; Gabriella, T. A Raman Spectroscopic Study of the Structural Modifications Associated with the Addition of Calcium Oxide and Boron Oxide to Silica. Metall. Mater. Trans. B 2015, 46, 62–73. [Google Scholar]
  29. Molla, A.R.; Kesavulu, C.R.; Chakradhar, R. Microstructure, mechanical, thermal, EPR, and optical properties of MgAl2O4:Cr3+ spinel glass–ceramic nanocomposites. J. Alloys Compd. 2014, 583, 498–509. [Google Scholar] [CrossRef]
  30. Xing, X.D.; Du, Y.L.; Zheng, J.L. Isothermal Carbothermal Reduction of FeTiO3 Doped with MgO. JOM 2021, 73, 1328–1336. [Google Scholar] [CrossRef]
  31. Kang, J.F.; Chen, Z.Y.; Zhu, X.G. Effect of replacement of Na2O by Fe2O3 on the crystallization behavior and acid resistance of MgO–Al2O3–SiO2 glass-ceramics. J. Non-Cryst. Solids 2018, 503–504, 1–6. [Google Scholar]
  32. Anusavice, K.J.; Zhang, N.Z. Effect of Crystallinity on Strength and Fracture Toughness of Li2O–Al2O3–CaO–SiO2 Glass-Ceramics. J. Am. Ceram. Soc. 2010, 80, 1353–1358. [Google Scholar] [CrossRef]
Figure 1. DSC curves of the glass samples with the heating rate of 10 °C/min in air.
Metals 12 00164 g001
Figure 2. XRD patterns of glass-ceramics with different Fe2O3 contents.
Metals 12 00164 g002
Figure 3. XRD refinement patterns of glass-ceramics with different Fe2O3 contents: (a) 0 wt% Fe2O3; (b) 3.11 wt% Fe2O3; (c) 6.21 wt% Fe2O3; (d) 9.32 wt% Fe2O3; (e) 12.42 wt% Fe2O3.
Metals 12 00164 g003
Figure 4. Crystallinity and crystallite size of glass-ceramics.
Metals 12 00164 g004
Figure 5. SEM pattern of glass-ceramics: (a) surface; (b) interior.
Metals 12 00164 g005
Figure 6. SEM patterns of glass-ceramics with different Fe2O3 contents: (a) 0 wt% Fe2O3; (b) 3.11 wt% Fe2O3; (c) 6.21 wt% Fe2O3; (d) 9.32 wt% Fe2O3; (e) 12.42 wt% Fe2O3.
Metals 12 00164 g006
Figure 7. FTIR vibrational spectra of the samples: (a) 0 wt% Fe2O3; (b) 3.11 wt% Fe2O3; (c) 6.21 wt% Fe2O3; (d) 9.32 wt% Fe2O3; (e) 12.42 wt% Fe2O3.
Metals 12 00164 g007
Figure 8. Deconvoluted spectra of the glasses using Gaussian function: (a) 0 wt% Fe2O3; (b) 3.11 wt% Fe2O3; (c) 6.21 wt% Fe2O3; (d) 9.32 wt% Fe2O3; (e) 12.42 wt% Fe2O3.
Metals 12 00164 g008
Figure 9. NBO/T as a function of Fe2O3 content.
Metals 12 00164 g009
Figure 10. The physical and chemical properties of the samples: (a) mechanical properties; (b) chemical properties.
Metals 12 00164 g010
Table 1. Raw material compositions of nickel slag and blast furnace slag (wt%).
TFeCaOSiO2MgOAl2O3Na2OK2OOther
Nickel slag36.243.3528.329.862.520.560.253.37
Blast furnace slag-41.1339.178.009.50--2.20
Note: TFe is the total content of elemental iron.
Table 2. Compositions of the base glasses (wt%).
CaOSiO2MgOAl2O3Fe2O3The Reduction Rate (%)
21.3954.5916.707.320100
21.3954.5916.707.323.1190
21.3954.5916.707.326.2180
21.3954.5916.707.329.3270
21.3954.5916.707.3212.4260
Table 3. Attribution of the Qn-species structure unit in infrared spectra.
Structural UnitsOnbQnIR Band (cm−1)
[SiO4]4−4Q0840–890
[Si2O7]6−3Q1900–950
[SiO3]2−2Q2960–1130
[Si2O5]2−1Q31050–1100
[SiO2]00Q41160–1190
Publisher’s Note: MDPI stays neutral with regard to jurisdictional claims in published maps and institutional affiliations.

