Article

Prediction of Green Properties of Flux Pellets Based on Improved Generalized Regression Neural Network

1
Hebei Engineering Research Center for the Intelligentization of Iron Ore Optimization and Ironmaking Raw Materials Preparation Processes, North China University of Science and Technology, Tangshan 063210, China
2
Hebei Key Laboratory of Data Science and Application, North China University of Science and Technology, Tangshan 063210, China
3
The Key Laboratory of Engineering Computing in Tangshan City, North China University of Science and Technology, Tangshan 063210, China
4
Tangshan Intelligent Industry and Image Processing Technology Innovation Center, North China University of Science and Technology, Tangshan 063210, China
5
College of Metallurgy and Energy, North China University of Science and Technology, Tangshan 063210, China
6
College of Science, North China University of Science and Technology, Tangshan 063210, China
*
Author to whom correspondence should be addressed.
Metals 2022, 12(11), 1840; https://doi.org/10.3390/met12111840
Submission received: 5 October 2022 / Revised: 24 October 2022 / Accepted: 25 October 2022 / Published: 28 October 2022
(This article belongs to the Special Issue Big Data of Steel and Low Carbon Intelligent Smelting)

Abstract

:
In order to improve the quality of magnesia flux pellets and meet the production needs of the iron and steel industry, a pellet formation experiment was carried out. The effects of alkalinity R, SiO2 mass fraction, MgO mass fraction on the green pellets’ burst temperature, compressive strength, and falling strength were studied. The results showed that with the increase in alkalinity, the bursting temperature of green pellets decreases, but has no obvious effect on the compressive strength or drop strength; with the increase in SiO2 content, the bursting temperature of green pellets decreases gradually, and the green pellets’ strength also decreases slightly; with the increase in MgO content, the compressive strength of green pellets shows an upward trend, while the falling strength gradually decreases, and the burst temperature of green pellets shows a trend of rising first and then decreasing. The change trend is coupled with the software test data amplification method algorithm, based on the search algorithm of longicorn (MBAS), to expand a small amount of experimental data. Through data analysis and algorithm comparison, an improved generalized regression neural network (CFA-GRNN), based on culture firefly, was proposed to establish an optimization model for green pellet performance prediction. CFA uses the weights in the input layer and hidden layer of GRNN, the weights in the hidden layer and output layer, the threshold of the hidden layer and the threshold of the output layer as codes for optimization. The evolutionary goal is to obtain the most appropriate and optimal neural network structure. The results show that the MBAS algorithm, combined with the experimental research, can expand the effective data to 1000 pieces. Secondly, the green pellets’ burst temperature, compressive strength and falling strength predicted by the improved generalized regression neural network are in good agreement with the real values, and the average relative errors were 1.88%, 3.18% and 3.62%, respectively. The error analysis shows that the improved model algorithm has higher accuracy, meets the classification of pellets, and can be used to guide the production of pellets.

1. Introduction

Flux pellets, also known as self-fluxing pellets or alkaline pellets, refer to the addition of flux during the batching process of pellets to improve their performance, which is an important direction for the future development of pelletizing technology. Pelletizing is the first process in pellet production, and green pellet performance is the key factor that affects the smooth production of pellets [1]. In order to further improve the quality of flux pellets, many scholars have carried out extensive research on the properties of pellets. Li Jie [2] et al. studied the effect of MgO content on the properties of magnesia flux pellets. The results show that increasing MgO content is beneficial to increase the compressive strength of green pellets, but has little effect on the burst temperature, while the falling strength of green pellets decreases. Zhang Linlin [3] and others studied the effect of alkalinity on the properties of green pellets, and found that with the increase in alkalinity, the falling strength and bursting temperature of green pellets tended to increase, but the compressive strength of green pellets did not change significantly. Xin Zicheng [4] studied the effect of SiO2 content on the green properties of flux pellets. The results showed that with the increase in SiO2 content, the compressive strength and falling strength of green pellets decreased, and the burst temperature decreased. Zhuan Sun Yunxi [5] used the generalized regression neural network prediction model to predict the compressive strength of pellets with an error range of 5N, and the compressive strength of pellets increased by a maximum of 30.04% under the pellet batching optimization model. Jiang Tianyu [6] and others compared the advantages and disadvantages of different algorithms for pellet quality prediction, and summarized how to improve the time lag and redundancy of factory data.
Improving the green performance of flux pellets is a key breakthrough barrier for iron and steel enterprises during the "14th Five-Year Plan" period. However, at present, most of the methods for characterizing green pellets’ properties and optimizing the raw material ratio of pellets are still based on the metallurgical mechanism and manual adjustment. These experimental methods not only have the characteristics of long-time consumption and poor direct control, but also their degree of accurate still needs to be improved [7]. Therefore, it is very important to construct a prediction model for the green properties of flux pellets.
The influencing factors of green pellets’ performance interact with each other and are not a simple linear relationship. The traditional regression prediction model is used to fit and establish the relationship between them. The prediction of pellet performance results in large errors and low accuracy, and it is difficult to meet the production requirements. However, generalized regression neural networks have good nonlinear mapping abilities and learning speed. Compared with other neural networks, the generalized regression neural network has a strong generalization ability, fast convergence speed, and fast training process with a very simple topology design. It is widely used in system identification, prediction and signal processing. Xue Han [8] et al. proposed a generalized regression neural network optimized by the culture firefly algorithm to predict and analyze ship traffic flow. The results show that CFA-GRNN has better generalization performance and higher prediction accuracy than GRNN and firefly optimized neural network. Wang Xin [9] et al. combined the cultural firefly algorithm with a generalized regression neural network and proposed a variable weight short-term photovoltaic power generation combined prediction model. Simulation experiments confirmed the effectiveness of the model. Using an artificial intelligence neural network to build a mathematical model that combines green pellet performance and its influencing factors can achieve accurate prediction of green pellet performance. Therefore, this paper studies the effects of alkalinity, SiO2 content, and MgO content on the burst temperature, compressive strength, and falling strength of green pellets through the pellet formation test. In addition, the optimization prediction model of influencing factors and green pellet performance is built with the aid of a neural network mathematical model, and the threshold and smoothing parameters in the generalized regression neural network are adjusted with a new algorithm to improve the learning speed of the neural network, so that the prediction result error is small and the accuracy is high, and the accurate prediction of the green pellet performance of flux pellets is realized to meet the production requirements.

2. Raw Material Analysis and Experiment Methods

2.1. Analysis of Raw Materials

The mineral powder used in the experiment was taken from the raw material reserve for pellet production in a steel plant. The main chemical components of iron powder, flux and binder are shown in Table 1, and the physical properties of bentonite are shown in Table 2.
It can be observed from Table 1 and Table 2 that the iron content of the four kinds of mineral powders is relatively high, all above 63%, and the highest iron content is reported for the Yanshan powder (66.45%). The SiO2 content of Anhui powder and Yanshan powder is relatively high, reaching 5.01% and 6.32%, and the SiO2 content of PMC mineral powder is 1.06%, which can be used to adjust the mass fraction of the overall SiO2 during the pelletizing process. The contents of colloid and montmorillonite in the bentonite used in this experiment are relatively high, which is a high-quality binder.
It can be observed from Table 3 that the particle size distribution of mineral powders, PMC ore powder, Anhui powder, Shahe powder and Yanshan powder accounted for 31.33%, 24.14%, 29.12% and 78.78%, respectively, with a particle size below 0.074 mm. In this range, the Yanshan powder reaches 78.78%, and its particle size is relatively fine, which is conducive to pelletizing. The particle size of limestone flux is mainly distributed in the range of 0.15 mm~0.074 mm, accounting for up to 80.60%. The particle size of dolomite is mainly concentrated in the range of 0.074 mm~0.045 mm; the proportion of bentonite with a particle size below 0.045 mm is 72.42%, both of which are fine-grained fluxes, which are beneficial to improve spheroidization.
The spheroidization index of mineral powders is closely related to its specific surface area. The smaller the particle size of mineral powders, the rougher the surface. In addition, the larger the specific surface area of mineral powders, the better the spheroidization of mineral powders [10]. Among the above four kinds of mineral powders, the Yanshan powder has the smallest particle size; therefore, its specific surface area is large, and the rate of spheroidization is good. In the process of ore blending, an appropriate amount of Yanshan powder can be added.

2.2. Experimental Methods

2.2.1. Pelletizing Experiment

We weighed the calculated mineral powder, limestone, dolomite, bentonite and water, and added the ingredients and mixed as required. We put the weighed material into a 500 mm × 150 mm disc pelletizer (Tianjin Xieshun Reducer Factory, Tianjin, China) for the pelletizing experiment, set the linear speed to 0.98 m/s, and the inclination angle to 48. After pelletizing, the green pellets were taken out from the disc and sieved, and the green pellets with a particle size of 10–12.5 mm were screened out for the green pellet performance index test.

2.2.2. Experiment for Measuring the Falling Strength of Green Pellets

Twenty-two green pellets with a diameter of 10–12.5 mm were selected for the falling strength test, and they fell freely on a steel plate with a thickness of 10 mm from a height of 0.5 m, and the unbroken times of each green pellet were recorded. In order to reduce the experimental error, the maximum and minimum values in the data were removed, and the arithmetic mean of the total falling times of the remaining 20 green pellets was taken as the drop strength index (times/ball) of the green pellets in this group.

2.2.3. Experiment for Measuring the Compressive Strength of Green Pellets

Twenty-two green pellets with a diameter of 10–12.5 mm were selected for the compressive strength test. The compressive strength of the pellets is determined by measuring the pressure when each green pellet breaks using the pressure testing machine. In order to reduce the experimental error, the maximum and minimum values in the data were removed, and the arithmetic mean of the compressive strengths of the remaining 20 green pellets was taken as the compressive strength index (N/ball) of the green pellets in this group.

2.2.4. Experiment for Measuring the Burst Temperature of Green Pellets

The green pellet burst temperature test was performed in a resistance wire furnace. After raising the temperature of the heating furnace to the set temperature, using an air compressor to introduce gas with a flow rate of 1 L/min and keeping the furnace temperature constant, we selected 50 raw pellets with a diameter of 10~12.5 mm and put them in the hanging basket, then put the hanging basket into the heating tube. We observed whether the test pellets had burst every 5 min. If they had not burst, we raised the temperature by 25 °C until at least 2 of the 50 green pellets had burst, that is, the burst temperature of the green pellets was obtained.

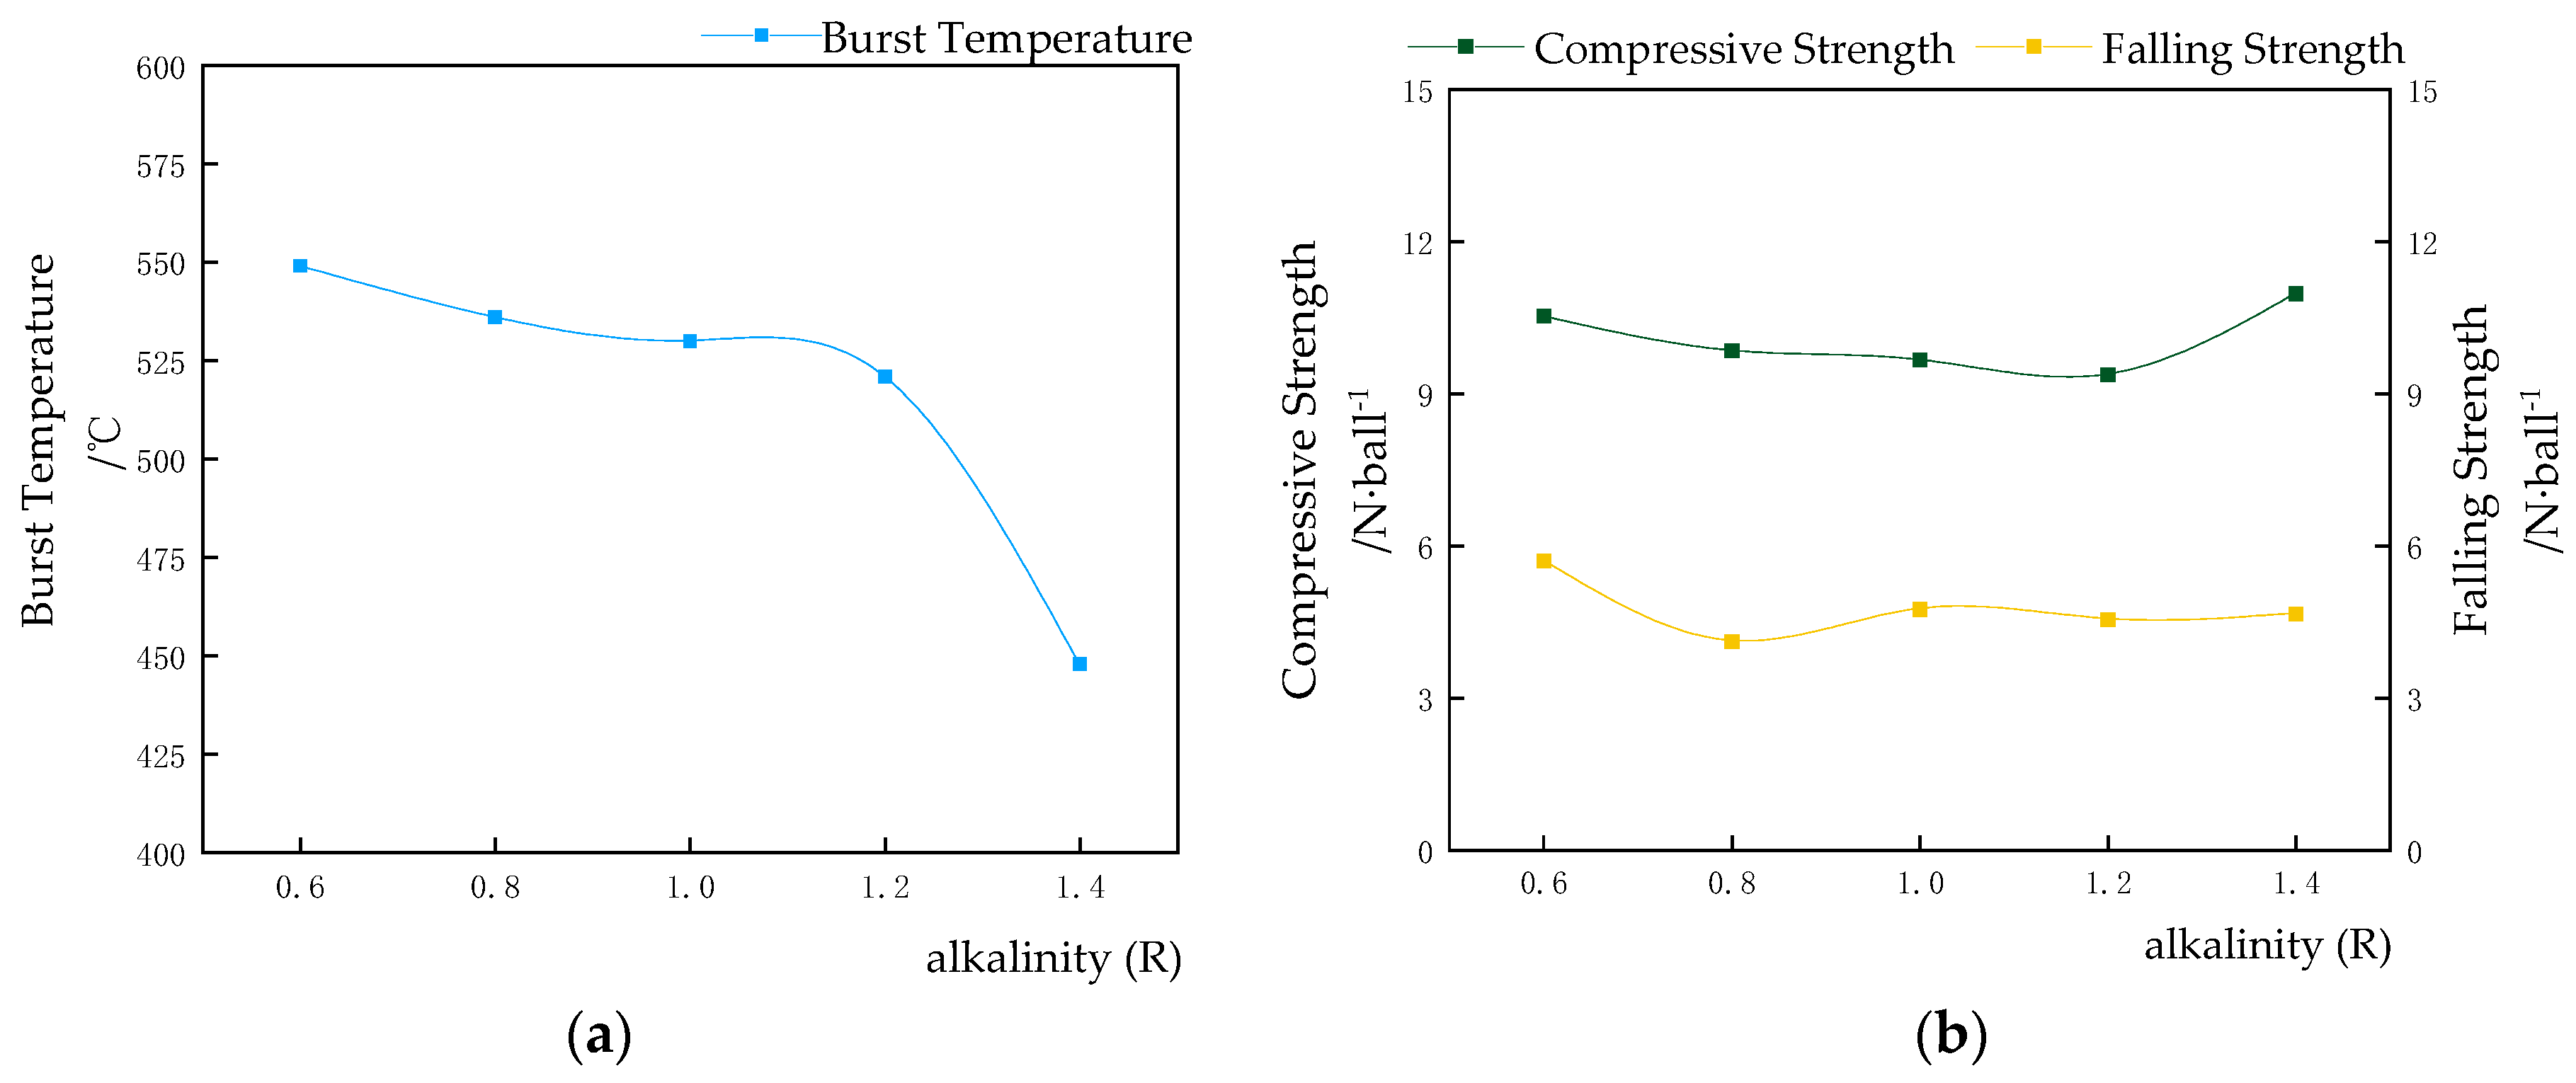
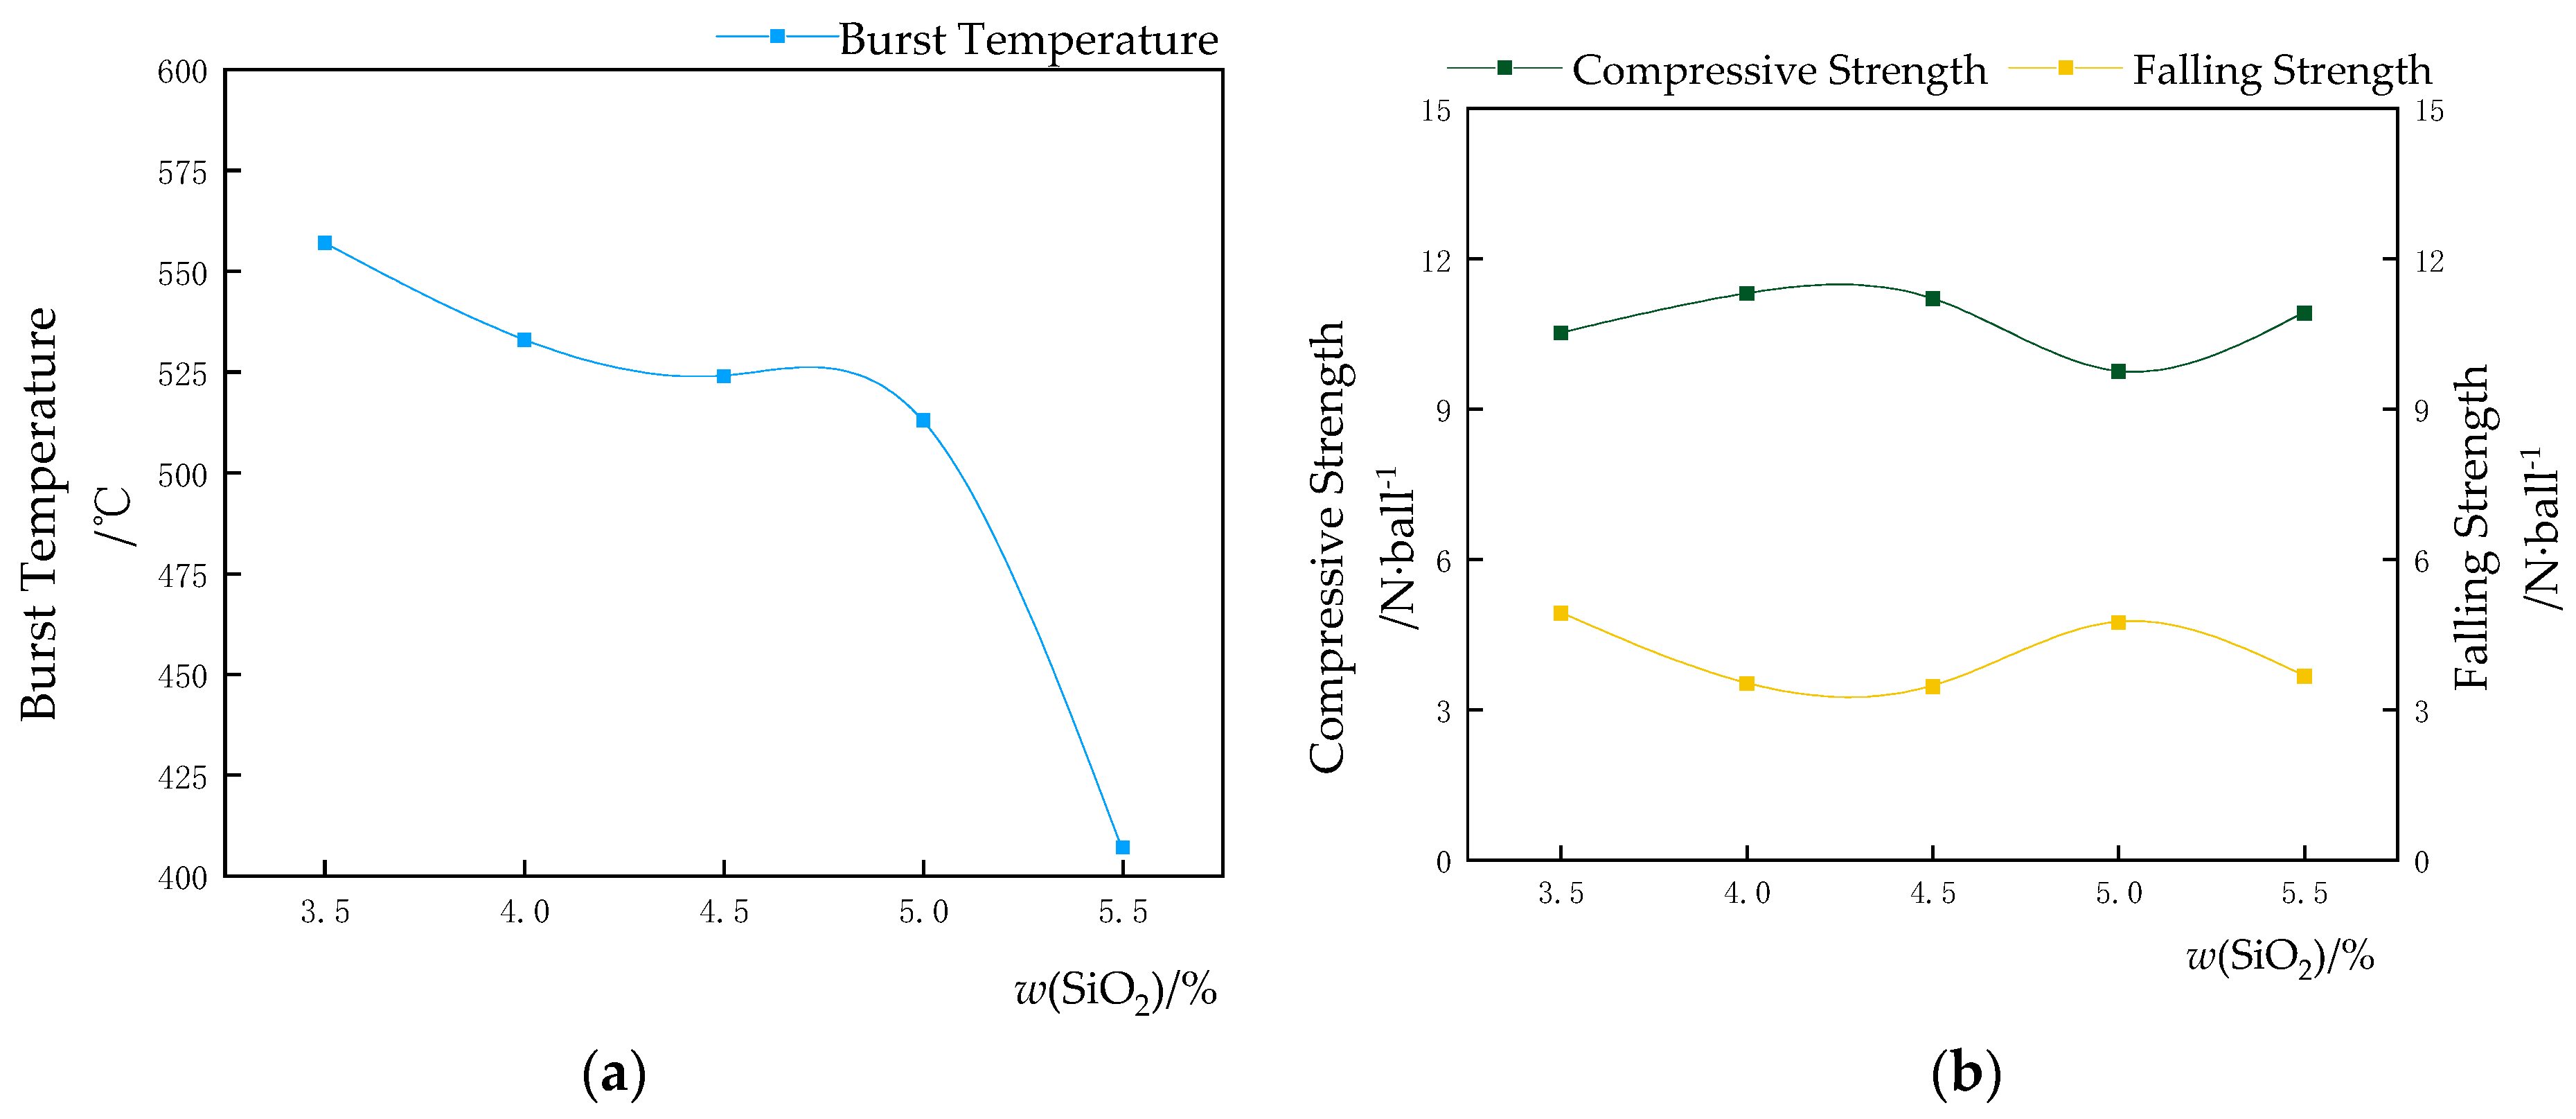
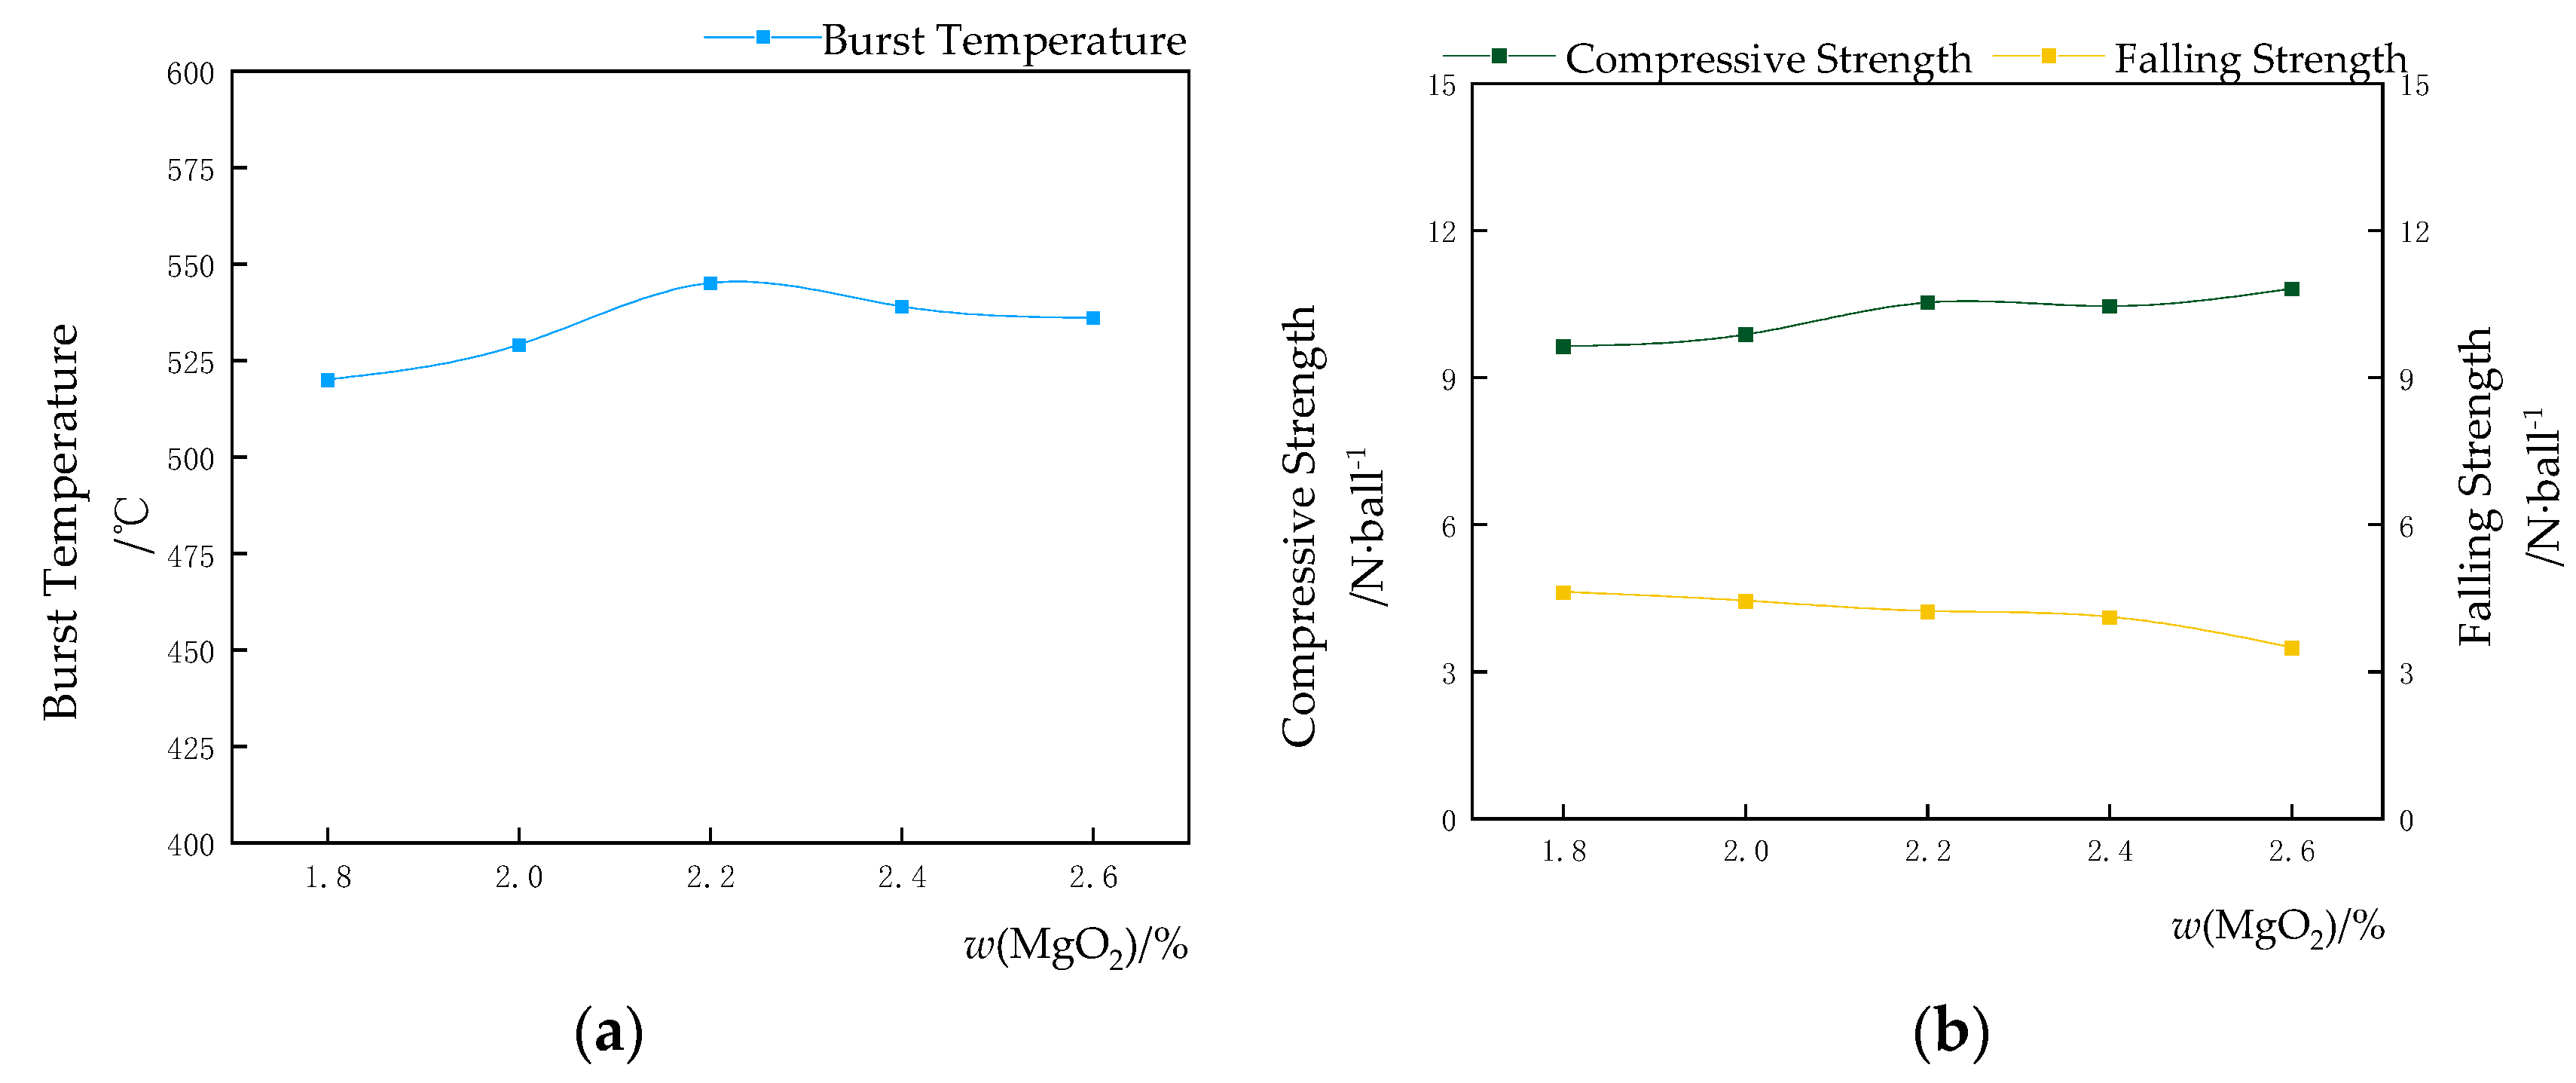
2.3. Ingredient Plan and Experimental Results

According to the raw material conditions and physical and chemical properties, the fixed grinding powder content was recorded as 20.00% and the bentonite content was 0.70%. We adjusted the alkalinity of the green pellet mixture by changing the limestone content. The SiO2 content of the raw pellet mixture was adjusted by changing the ratio of Shahe powder and Anhui powder. We adjusted the MgO content of the green pellet mixture by changing the content of light-burned magnesium powder. Table 4, Table 5 and Table 6 show the ore blending scheme.
We carried out the batching and mixing processes according to the above ore blending plan. We used a disc pelletizing machine to conduct the pelletizing experiments, then selected 10~12.5 mm green pellets to measure their burst temperature, compressive strength, falling strength and other green pellet properties. The results are shown in the Table 7 and the performance change trend is shown in Figure 1, Figure 2 and Figure 3.
As shown in Figure 1, with the increase in alkalinity, the burst temperature of green pellets showed a decreasing trend as a whole. When the alkalinity was between 0.60 and 1.20, the burst temperature gradually decreased, and the temperature dropped from 557 °C to 521 °C. When the alkalinity was further increased to 1.2, the burst temperature decreased significantly, and the temperature dropped from 521 °C to 448 °C. The main reason is that with the increase in alkalinity, the limestone content in the mixture increases, and the capillary force and cohesive force of limestone are not as high as for bentonite, and the water absorption is poor. When heated, the capillary water evaporates rapidly, which causes the pellets to rupture, thereby causing the burst temperature to reduce. The green pellets’ strength was not affected much, and the compressive strength and falling strength were recorded as 9.38 N·ball−1~10.97 N·ball−1 and 4.12 N·ball−1~5.71 N·ball−1, respectively.
As shown in Figure 2, with the increase in SiO2 content, the green pellets’ burst temperature gradually decreased, and the range was 557~407 °C. The main reason is that with the increase in SiO2 content, the content of PMC mineral powder in the mixture decreases and the content of Anhui powder increases. From the particle size distribution of the raw materials, it can be observed that the overall particle size of the mixture becomes smaller, and the green pellets’ density increases, which in turn leads to a decrease in the bursting temperature. The green pellets’ strength decreased slightly, but the overall effect was not significant. The green pellets’ compressive strength ranged from 9.76 N·ball−1 to 11.31 N·ball−1, and the green pellets’ falling strength ranged from 3.52 N·ball−1 to 4.93 N·ball−1.
As shown in Figure 3, with the increase in MgO content, the compressive strength of green pellets showed an upward trend, and the variation range was between 9.63 N·ball−1 and 10.80 N·ball−1. The falling strength of green pellets gradually decreased, and the range was between 3.48 N·ball−1 and 4.61 N·ball−1. Combined with the composition of raw material particle size, it can be observed that with the gradual increase in MgO content, the increase in PMC mineral powder made the overall fine particle size of the mixture coarser, the capillary water migration rate became smaller and the molecular cohesion inside the mixture during pelleting was reduced, resulting in a loosening of the pellets and a reduction in the falling strength of the green pellets. The green pellets’ burst temperature showed a trend of first increasing and then decreasing, ranging from 520 °C to 539 °C, reaching a maximum of 539 °C when the MgO content was 5.50%, and then the burst temperature began to decrease, mainly due to the increase in MgO content, and the content of light-burned magnesium powder increased. From the analysis of raw materials, it can be observed that the particle size of light-burned magnesium powder is small, filling the voids of pellets, reducing the porosity of green pellets, and increasing the internal pressure of green pellets during the heating process, resulting in a reduction in the burst temperature.

3. Data Processing

3.1. Data Expansion

In the process of network modeling and model training, a large number of training sets and test sets are required to improve the accuracy of the prediction model. Data expansion is a technology that generates more equivalent data from limited data by manually expanding the data set. This method can improve the scale and quality of the training data set, and is an effective way to solve the lack of training data. The software test data augmentation method (MBAS), based on the long beetle search algorithm, has obvious performance advantages in test data augmentation efficiency and stability [11]. The changing trend of the influence of the three factors of alkalinity, SiO2 content and MgO content on the green pellets’ burst temperature, compressive strength and falling strength is coupled with the MBAS algorithm to realize the amplification of a small amount of experimental data. After data augmentation, a total of 1000 sets of data were used for model analysis, and the augmented data (parts) are shown in Table 8.

3.2. Eliminate Abnormal Data

We used a clustering algorithm to remove outlier data. Clustering is used to divide a data set that contains a large amount of data into multiple data subsets, and these data subsets do not intersect with each other. One subset is one cluster. Through analysis, it can be observed that outliers are characterized by normal values. Therefore, if the data does not belong to any subset, the point is an outlier, and the outlier will not belong to any subset. If the data are also far away from their nearest subset, the point is also an outlier point [12].
After cluster analysis of the data, it was found that the number of outliers was small, so the operation of direct deletion was adopted to ensure the accuracy of model training.

4. Algorithms and Network Models

According to the data, a generalized regression neural network (GRNN) has good nonlinear mapping ability and learning speed, but with the diversification of sample data, its shortcomings of high computational complexity and high space complexity are exposed. Therefore, an improved generalized regression neural network based on the culture firefly algorithm is proposed.

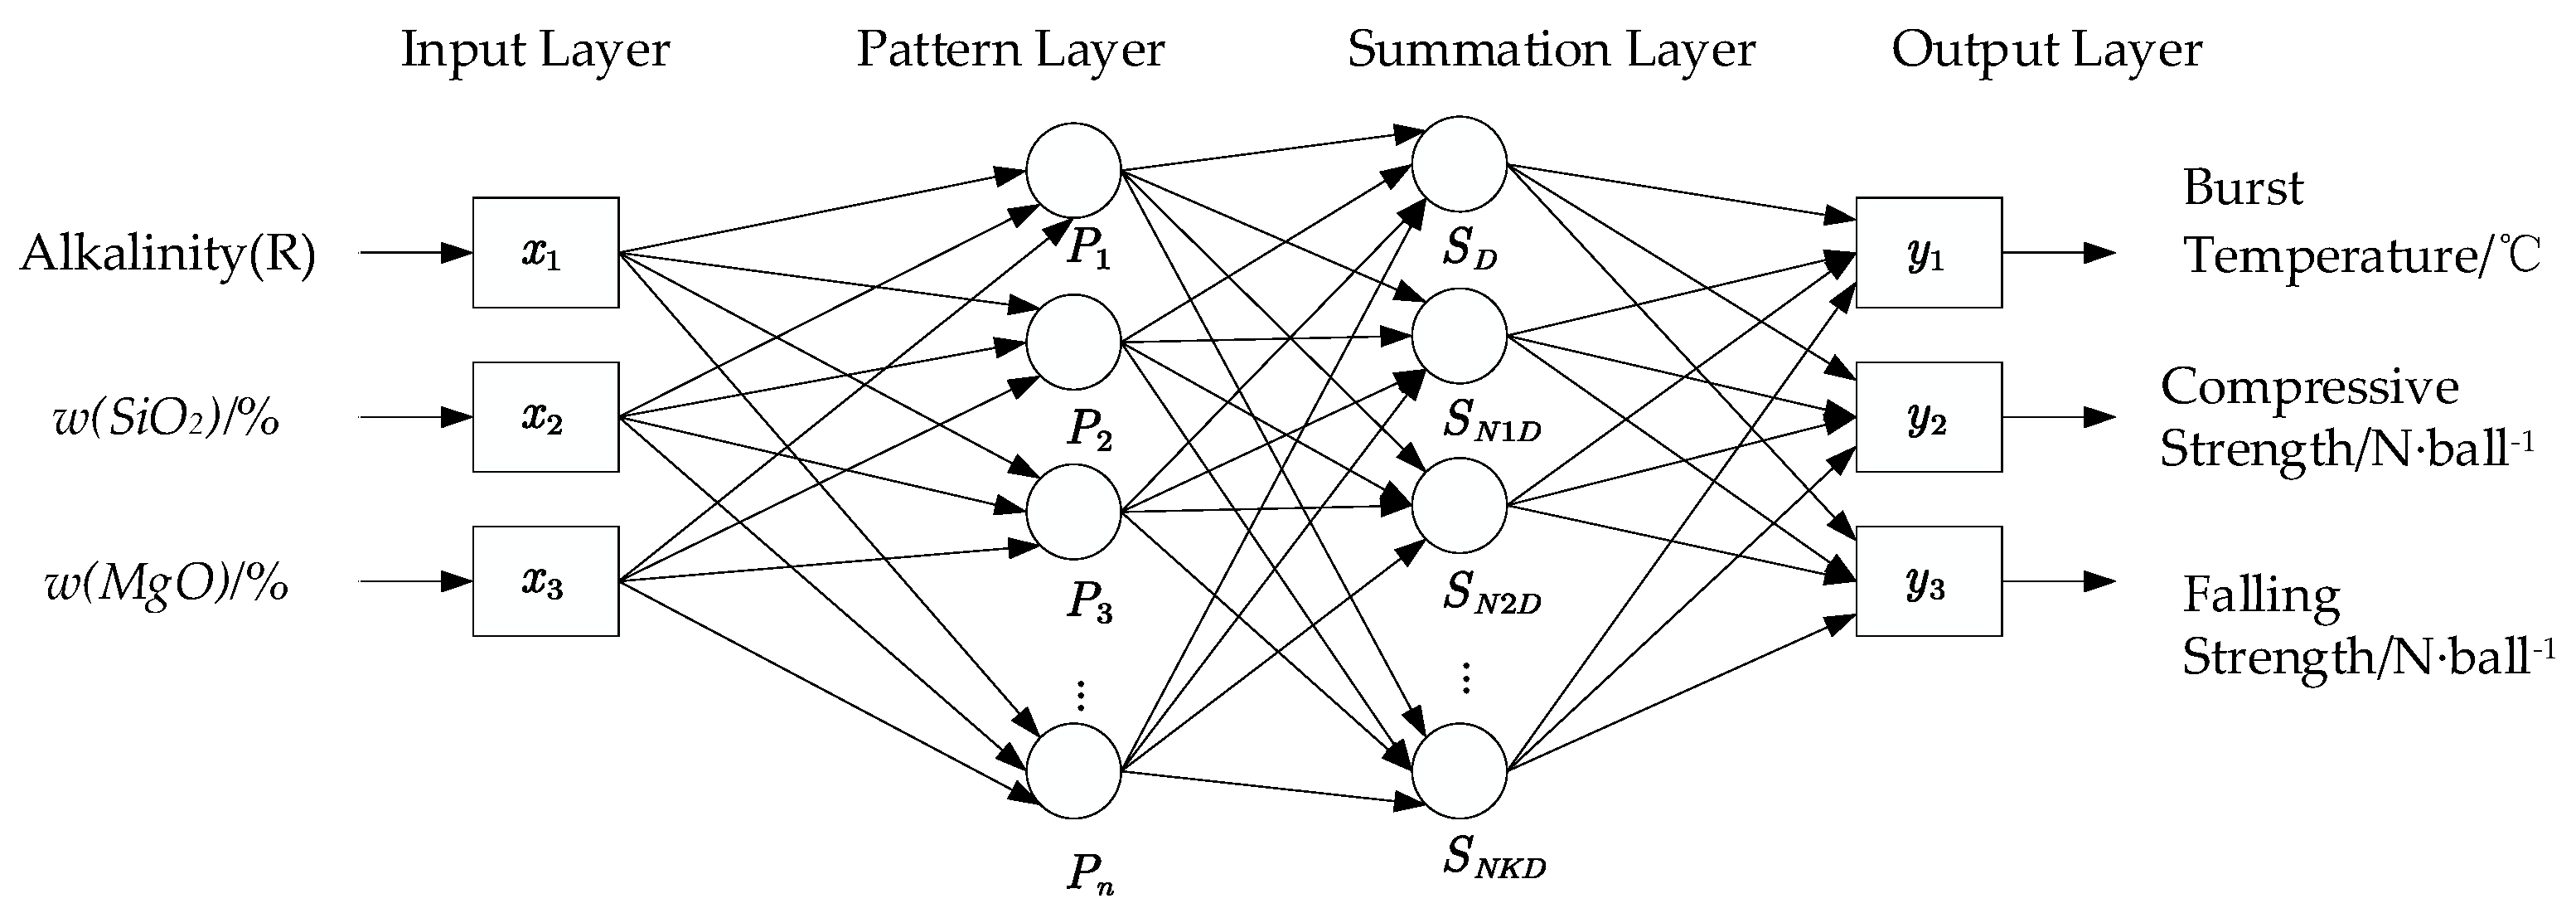
4.1. Generalized Regression Neural Network

Neural networks have proposed a new class of computing systems inspired by the biological structure of the human brain. A distinguishing feature of a neural network is its ability to generalize, which enables an approximately accurate description of the relationship between input and output data in very small subsets based on all possible data. Researchers have developed a large number of neural network types and different learning algorithms, of which feedforward neural networks are the most widely used; however, this type of neural network can only allow a static relationship between the input and output. To successfully approximate the dynamic or temporal relationship between the input and the output, a generalized regression neural network can be used [13].
A generalized regression neural network (GRNN) is another variant of the radial basis network. It is based on nonparametric regression, takes data samples as posterior conditions, and calculates network output according to the principle of maximum probability, and has a good nonlinear approximation function [7]. Compared with the radial basis network, a generalized regression neural network is more convenient to train. It can handle the situation of few training samples well, and can be widely used in the fields of system identification, prediction and control [14].
GRNN is usually trained using backpropagation through time. Backpropagation through time (BPTT) deals with GRNN in an unfolded manner, in which GRNN is no longer a recurrent network but a deep feed-forward neural network [15]. Errors at any one time point can be propagated back to the first time point, and after all errors are propagated back, the parameters are updated simultaneously, where the gradient of a particular parameter is the sum of the partial gradients of the errors at all time points relative to that parameter [16]. The actual modification to the initial BPTT is the truncated back-propagation transit time (TBPTT), which fixes the maximum number of time steps that any error is allowed to propagate back, mitigating the vanishing or steep gradient problems that BPTT suffers from [17].
Therefore, a generalized regression neural network was used to establish a mathematical model for the prediction of green pellet performance to achieve accurate prediction of green pellet performance. The model consists of four layers of mathematical structures, namely the input layer, pattern layer, summation layer and output layer.
  • Input layer
The number of neurons in the input layer is the dimension of the input phasor in the learning sample. In the expanded sample set, the spheroid alkalinity R, the mass fraction of SiO2, and the mass fraction of MgO form the training set, and the dimension of the input phasor is 3. Neurons act as simple distribution units to pass input variables to the pattern layer.
  • Pattern layer
The number of neurons in the pattern layer is equal to the number n of learning samples, and the training set is used as an 800 * 3 input matrix; therefore, the number of neurons in the pattern layer is 800, and the neurons and the learning samples correspond one-to-one. The transfer function formula of the neurons in the pattern layer is as follows:
P i = exp [ ( X X i ) T ( X X i ) 2 σ 2 ] i = 1 , 2 , , n
The output of neuron i is the exponential form of the squared Euclidean distance D i 2 = ( X X i ) T ( X X i ) between the input variable and its corresponding sample X, where x is the network input variable, which is the alkalinity R, SiO2 mass fraction and MgO mass fraction. xi is the learning sample that corresponds to the ith neuron.
  • Summation layer
Two types of neuron summation processes are performed in the summation layer. The number of columns of its phasor is equal to the output phasor dimension plus 1, and the output phasor dimension in the training sample is 3; therefore, the number of columns in the summation layer is 4, and the 0th column is the sum of the Gaussian values of each test sample. The first type involves the arithmetic sum of the outputs of all neurons in the mode layer, as shown in formula (2); the connection weight between the mode layer and each neuron is 1, and the transfer function is shown by Formula (3).
i = 1 n exp [ ( X X i ) T ( X X i ) 2 σ 2 ] i = 1 , 2 , , n
S D = i = 1 n P i
The other type is the weighted summation of neurons in all pattern layers, as shown in Formula (4), and the transfer function formula is shown by Formula (5).
i = 1 n Y i exp [ ( X X i ) T ( X X i ) 2 σ 2 ] i = 1 , 2 , , n
S N i = i = 1 n y i j P i j = 1 , 2 , , k
  • Output layer
The number of neurons in the output layer is equal to the dimension (k) of the output phasor in the learning sample. The dimension of the training set as the output phasor in the expanded sample set is 3. Each neuron divides the summed output, and the output of the neuron corresponds to the jth element of the estimated result Y, as shown in Formula (6).
y i = S N i S D i = 1 , 2 , , k
The generalized regression neural network uses the ideas of nonlinear and regression analysis. Regression analysis involves the prediction value of the dependent variable relative to the input value of the independent variable. In fact, the output variable represents the maximum probability value. For the regression analysis of dependent variable Y and independent variable X, the output variable Y is calculated, which represents the maximum probability value. Let the joint probability density function of random variable X and Y be f(X,Y), and Y is regressed with respect to X, and the conditional mean value is as follows:
Y = E [ Y | X ] = + Y f ( X , Y ) d y + f ( X , Y ) d y
The unknown probability density function f(X,Y) can be calculated by nonparametric estimation of X and Y observation samples, as shown below.
Y ( X , Y ) = 1 ( 2 π ) m + 1 2 σ m + 1 n × i = 1 n exp [ D i 2 2 σ 2 ] exp [ ( Y Y i ) 2 σ 2 ]
Y ( X ) = i = 1 n [ exp ( D i 2 2 σ 2 ) ] + Y i exp [ ( Y Y i ) 2 σ 2 ] d y j = 1 n [ exp ( D j 2 2 σ 2 ) ] + Y j exp [ ( Y Y j ) 2 σ 2 ] d y
Due to the integral + x e x 2 d x = 0 , if the parameter variable z = YYi is assumed, the molecular part in the formula can be simplified as
+ Y i exp ( Y Y i 2 σ 2 ) d y = Y i + exp ( z 2 2 σ 2 ) d z
The denominator is simplified as
+ exp ( Y Y i 2 σ 2 ) d y = i = 1 n [ exp ( D i 2 2 σ 2 ) ] + Y i exp [ ( Y Y i ) 2 σ 2 ] d y j = 1 n [ exp ( D j 2 2 σ 2 ) ] + Y j exp [ ( Y Y j ) 2 σ 2 ] d y = i = 1 n [ exp ( D i 2 2 σ 2 ) ] j = 1 n [ exp ( D j 2 2 σ 2 ) ]
For the generalized regression neural network algorithm, when the input training samples are determined, the training of the neural network is essentially the process of determining the smoothing parameters. Compared with the traditional back-propagation algorithm (back-propagation, BP), the training process of the generalized regression neural network does not need to adjust the connection weights between neurons, but only needs to adjust the smoothing parameters to change the transfer function, and through the calculation formula, one can obtain the regression estimates [18]. The prediction performance of the generalized regression neural network is closely related to the value of the smoothing parameter. It can be observed from the calculation formula of the model that when the smoothing parameter approaches infinity, the estimated value Y(X) is the average value of all training samples; on the contrary, when the smoothing parameter approaches 0, the estimated value is close to the training sample. Therefore, choosing an appropriate smoothing parameter is very important for the result prediction [19].

4.2. Model Construction

For the determination of input variables, it can be observed from the discussion in Section 2.3 that the alkalinity R, SiO2 mass fraction and MgO mass fraction have a great influence on the metallurgical properties of green pellets. Secondly, the content of SiO2 in Chinese mineral powder is high. When adding CaO to produce flux pellets, excess liquid phase is easily generated, and the phenomenon of pellet sticking easily occurs during the roasting process, which limits the application of flux pellets in China. Acid pellets have poor high-temperature metallurgical properties, especially their low softening start temperature and narrow softening interval, which seriously affect the permeability of blast furnaces. Therefore, researchers have added flux to improve various defects of pellets and MgO is the most widely used material, which can not only improve the metallurgical properties of pellets, but also improve the fluidity of slag. The common acid pellets currently used have poor metallurgical properties, such as a high reduction expansion ratio and low softening temperature, which limit the ratio of pellets in the charge structure and have an adverse effect on the forward run of the blast furnace [20]. The research shows that increasing the alkalinity of the pellets can effectively improve the metallurgical properties of the pellets, such as the reduction expansion rate, reflow performance and burst temperature, thereby increasing the ratio of pellets in the furnace [21].
Therefore, in the research process, the effects of alkalinity R, SiO2 mass fraction and MgO mass fraction on the compressive strength, falling strength and burst temperature of green pellets were analyzed. We defined the independent variable alkalinity R as x1, SiO2 mass fraction as x2, MgO mass fraction as x3, dependent variable output burst temperature as y1, compressive strength as y2, and falling strength as y3; the model structure is shown in Figure 4.

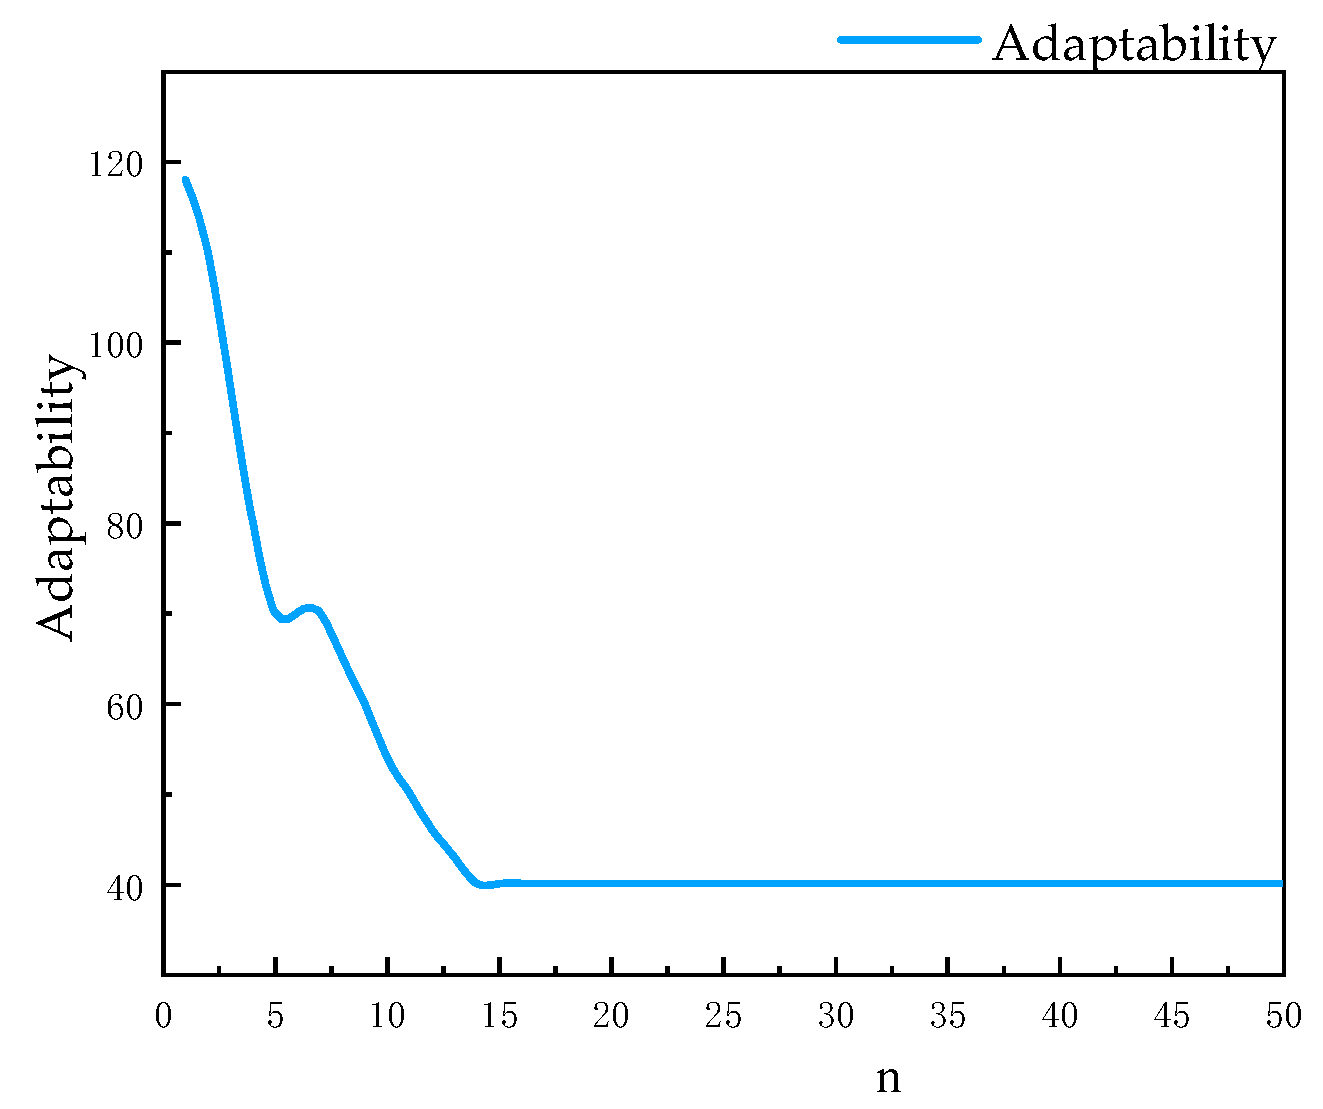
4.3. Cultural Firefly Algorithm

Combining the advantages of the culture algorithm and the firefly algorithm, the normative knowledge in the belief space can be used to adaptively adjust the search range of the algorithm, and random selection can be used to perform perturbation operations to increase the diversity of the population. At the same time, when the algorithm falls into a local optimum, the population space is adaptively updated. It avoids the shortcomings of the algorithm, such as the premature phenomenon and low population diversity, and improves the convergence speed and exploration ability of the algorithm; to avoid the problem of slow convergence in the global optimization process and issue of easily falling into the local optimum, a firefly optimization algorithm (CFA), based on the culture algorithm, is proposed [22].
The fluorescence brightness of firefly individual i relative to individual j is
I i = I 0 i e γ r i j
In the formula, I0i is the maximum fluorescence brightness of individual i, which is related to its objective function. In the green pellet performance prediction model, the fitting curve of independent variables’ basicity R is x1, SiO2 mass fraction is x2, MgO mass fraction is x3, burst temperature is y1, compressive strength is y2 and drop strength is y3. The better the objective function, the higher the brightness, and the larger the value of I0i. In the following equation, Y is the light intensity absorption coefficient; rij is the Cartesian distance between any two individual fireflies i and j:
r i j = k = 1 d ( x i k x j k ) 2
In the formula, d is the dimension of the problem, and xik is the kth dimension component of the i-th firefly, that is, the components of the independent variables’ alkalinity, SiO2 mass fraction, and MgO mass fraction in the matrix. The attractive force between firefly individuals i and j is as follows:
β = β 0 e γ r i j 2
In the formula, β 0 is the maximum attractive force of the individual; the attraction between fireflies decreases exponentially as the distance increases. If the brightness of the individual j is higher than the brightness of the individual i, then the individual j encourages the individual i to move in its own direction, The relative positions of the independent variables’ alkalinity R, SiO2 mass fraction, and MgO mass fraction approach the optimal fitting curve, and the updated formula of its position x is as follows:
x i ( t + 1 ) = x i ( t ) + β [ x j ( t ) x i ( t ) ] + α [ r a n d ( 0 , 1 ) 0.5 ]
In the formula, t is the time and α is the step size, where the first term is the current position of a firefly, the second term is used for considering a firefly’s attractiveness to the light intensity observed by adjacent fireflies, and the third term is used for the random movement of a firefly in case there are not any brighter light sources. The coefficient α is a randomization parameter determined by the problem of interest, while rand is a random number generator uniformly distributed in the space [0,1].
The belief space is composed of the experience and knowledge acquired in the evolution process. It is updated according to the existing population experience, and the knowledge b of the belief space is updated with the current optimal individual xbest. The formula is as follows:
b ( t + 1 ) = { x b e s t ( t ) , f ( x b e s t ( t ) ) < f ( b ( t ) ) b ( t ) , o t h e r s
The belief space affects the population space through the following rules:
x i k ( t + 1 ) = { x i k ( t ) + | e i N ( 0 , 1 ) | , x i k ( t ) < b j ( t ) x i k ( t ) | e i N ( 0 , 1 ) | , x i k ( t ) > b j ( t ) x i k ( t ) + e i N ( 0 , 1 ) , x i k ( t ) = b j ( t )
In the formula, xik(t) is the k-th dimension component of the i-th individual in the t-th iteration; ei is the length of the adjustable interval of the variable i in the belief space; N(0,1) is a random number that obeys the standard normal distribution.
The pseudo code of the algorithm is as follows:
Requirement: algorithm parameters β0, γ, λ
1: Output: global extremum, optimal individual
2: Initialize the population space, such as the location of fireflies
3: Calculate the fitness of each firefly as its maximum brightness I0
4: Initialize belief space
5: For t = 1 to t = maximum do
6: Formula (12) calculates the relative brightness of firefly I
7: Formula (14) calculate the attraction of fireflies β
8: Formula (15) update the position of fireflies
9: Recalculate the brightness of fireflies
10: Formula (16) update belief space
11: Formula (17) for the use of space affecting population
12: t = t + 1
13: End
Using the culture firefly algorithm, the smoothing parameters in the generalized regression neural network can be determined, so that the independent variables’ alkalinity R is x1, SiO2 mass fraction is x2, MgO mass fraction is x3, burst temperature is y1, compressive strength is y2, falling strength is y3 and the degree of integration is optimal.

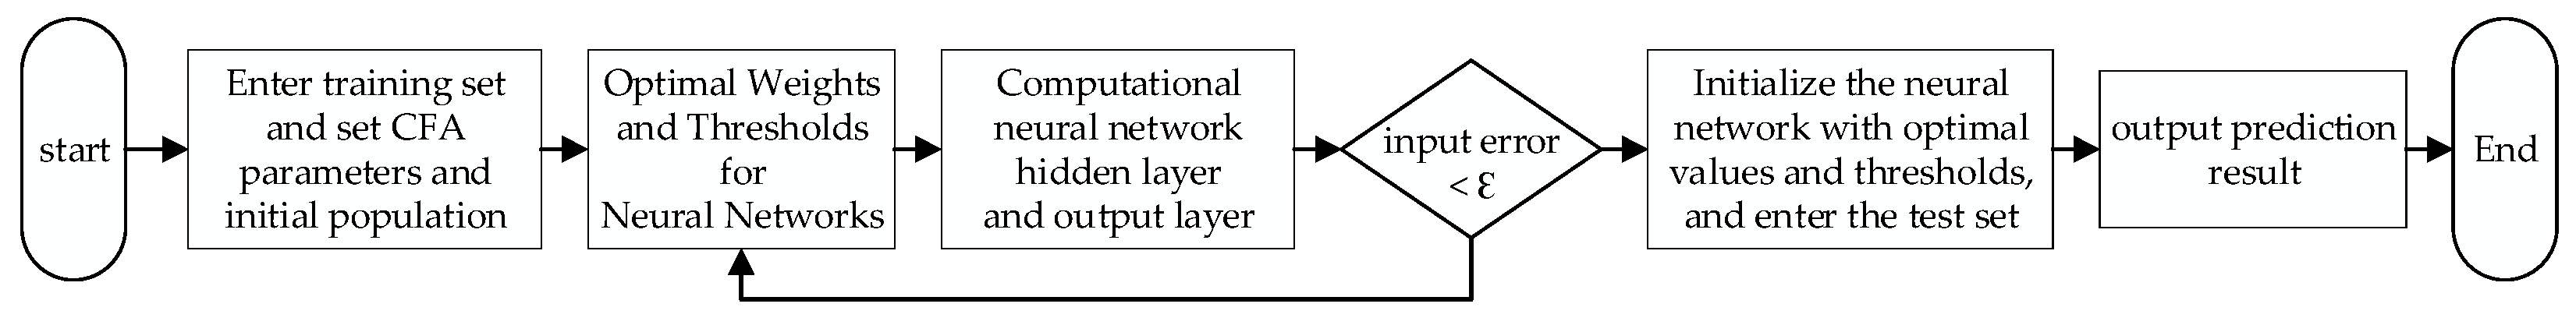
4.4. A Neural Network Prediction Model Based on CFA

CFA takes the output mean square error of the neural network as the fitness function, and takes the weights in the input layer and the hidden layer of the neural network, the weights in the hidden value and the output layer, the threshold of the hidden layer and the threshold of the output layer as the coding function, which optimizes the neural network, and the evolution goal is to achieve the most suitable neural network structure. Before the neural network is used for prediction, the best parameters should be trained. In the sample set of 800 sets of training sets, the optimal smoothing parameters are obtained through continuous iterative optimization of the optimization algorithm. The prediction flow chart is shown in Figure 5.

5. Error Analysis Method

For the prediction model inspection step, the following three error analysis methods are used to analyze the model prediction results.

5.1. Relative Error, RE

The relative error is the ratio of the absolute value error to the true value of the measurand multiplied by 100%. Compared with the absolute error, the relative error can better reflect the reliability of the measured value, and the calculation formula is as follows.
R E = | y i y i y i | × 100 %
Mean relative error (MRE) is the average value of the relative error, which is used to measure the relative error degree of the overall data. The calculation formula is as follows.
M R E = 1 n | y i y i y i | × 100 %

5.2. Root Mean Squared Error, RMSE

In the accuracy test of the generalized regression neural network, the root mean square error was selected as the standard for the overall error test of the green pellet performance model. The formula is as follows.
R M S E = 1 n i = 1 n ( y i y i ) 2

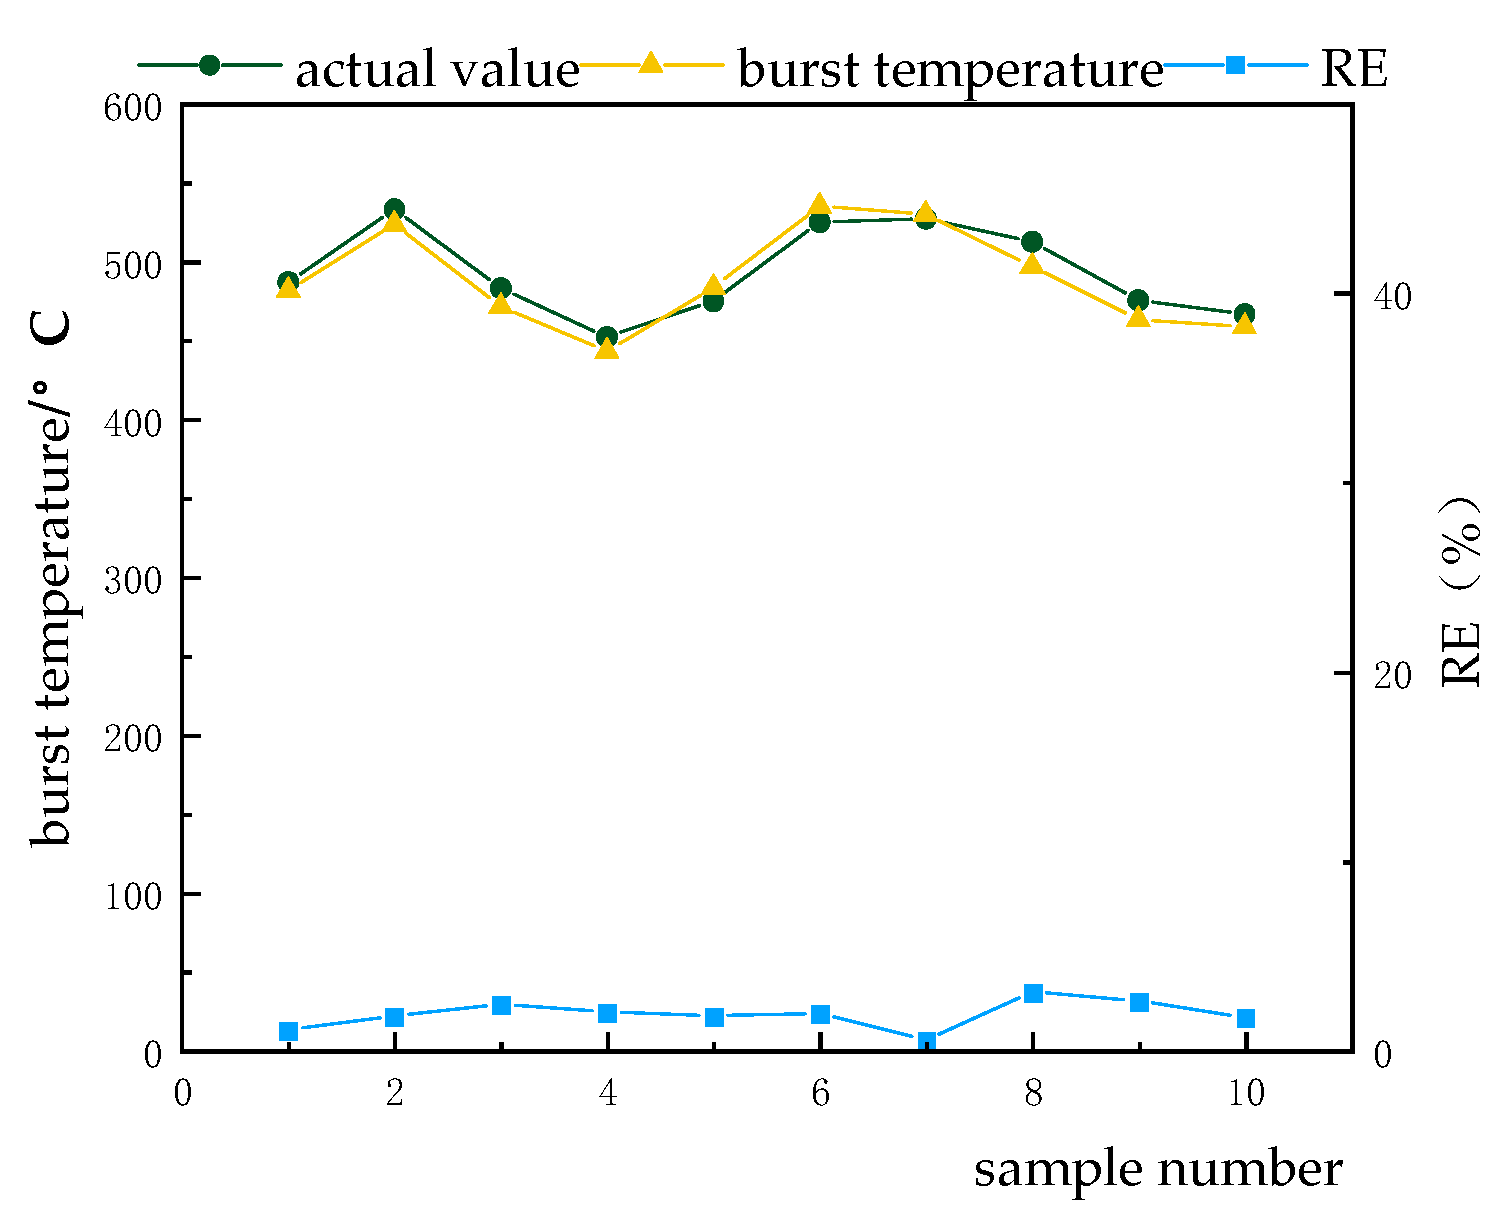
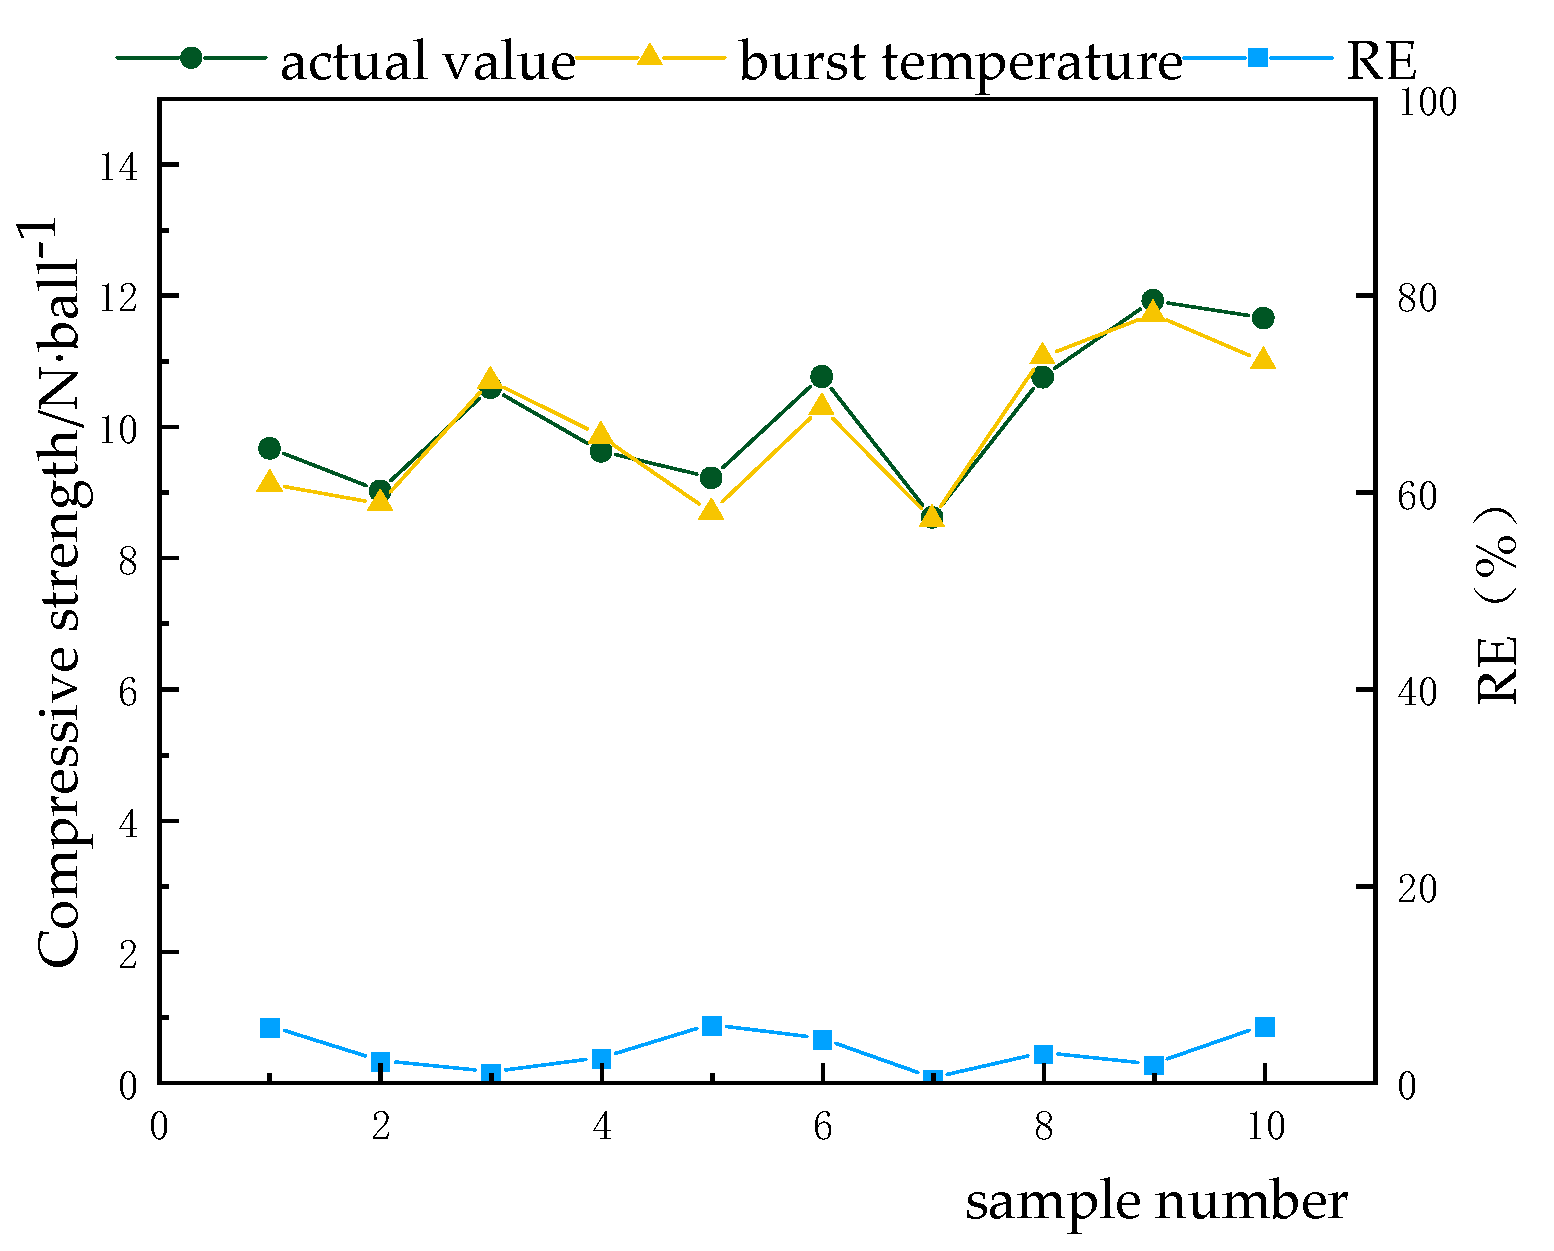
6. Model Prediction Results and Analysis

The CFA algorithm was used to optimize the GRNN network structure. The CFA population size was set to 30, and the number of iterations was n = 50, which was the fitness value. The evolution convergence curve is shown in Figure 6.
The generalized regression neural network algorithm was used to predict the burst temperature of pellets, the falling strength of green pellets and the compressive strength of green pellets. The 800 sets of data in the sample set were used as the training set, 50 sets of data were used as the test set, and finally, 10 sets of data in the sample set were used to verify the prediction results of the model. In the generalized regression neural network, the accuracy of the prediction model mainly depends on the setting of the smoothing parameters [23]. The culture firefly algorithm is used to determine the smoothing parameters in the generalized regression neural network. The optimal smoothing parameters of alkalinity R, SiO2 mass fraction and MgO mass fraction with regard to burst temperature y1, compressive strength y2 and drop strength y3 are 0.58, 0.11 and 0.27, respectively. The 10 sets of verification data were brought into the trained model algorithm, and the predicted values of burst temperature, compressive strength and green pellet drop strength, predicted by alkalinity, SiO2 content and MgO content, were obtained.
In the burst temperature prediction model, the smoothing coefficient of the output of the cultural firefly algorithm is 0.58. It can be observed from Table 9 that the relative error of the 10 groups of validation sets of the burst temperature prediction model is between 0.51% and 2.58%, the average relative error is 1.88%, and the root mean square error is 9.88%, all within the acceptable range. Figure 7 shows the error trend of the burst temperature prediction model. The actual value is highly consistent with the predicted value change curve, and the relative error fluctuates little, which is always maintained at a low level. It shows that the established prediction model has very good robustness, and the prediction results are accurate and reliable.
In the compressive strength prediction model, the smoothing coefficient of the cultural firefly algorithm output is 0.23. It can be observed from Table 10 that the relative error of the 10 sets of validation sets of the compressive strength prediction model are between 0.35% and 5.59%, the average relative error is 3.18%, and the root mean square error is 0.38%, all within the acceptable range. The variation trend of the error of the compression prediction model is shown in Figure 8. The actual value is highly consistent with the variation curve of the predicted value, and the relative error fluctuates little, which is always maintained at a low level, and the prediction results are accurate and reliable.
In the falling strength prediction model, the smoothing coefficient of the cultural firefly algorithm output is 0.11. It can be observed from Table 11 that the relative errors of the 10 sets of validation sets of the drop strength prediction model are between 2.84% and 5.10%, the average relative error is 3.62%, and the root mean square error is 0.16%, all within the acceptable range. The variation trend of the error of the falling intensity prediction model is shown in Figure 9. The actual value is highly consistent with the variation curve of the predicted value, and the relative error fluctuates little, which is always maintained at a low level. It shows that the established prediction model has very good robustness, and the prediction result is accurate and reliable.
Table 12 shows the comparison of the prediction results of the green pellets’ burst temperature, compressive strength and drop strength using two different algorithms. The algorithms are the original GRNN without optimization and the improved GRNN based on CFA (CFA-GRNN).
The results show that the error generated by the GRNN algorithm is large and does not have practical predictive significance. After the neural network is optimized by CFA, the learning speed and prediction accuracy of GRNN are improved, and it does not easily fall into local optimum, meaning that it meets the pellet classifications and can be applied to pellet production [24].

7. Conclusions

(1) The effects of alkalinity, SiO2 content and MgO content on green pellets’ burst temperature, compressive strength and falling strength were studied by pelletizing experiments. The results show that the burst temperature, compressive strength and falling strength of green pellets are greatly affected by the composition of raw materials, mainly the degree of fine particle size and moisture, etc., which lead to changes in the burst temperature and strength of green pellets.
(2) With the increase in MgO content, the compressive strength of green pellets showed an upward trend, and the falling strength decreased gradually. The green pellets’ burst temperature showed a trend of increasing first and then decreasing. The main reason for the decrease was that with the further increase in MgO content, the content of light-burned magnesium powder increased, and its particle size was smaller, which increased the density of green pellets and decreased the porosity. During the heating process, the internal pressure of the green pellet increased, resulting in a decrease in the burst temperature. With the increase in alkalinity, the burst temperature of green pellets showed a decreasing trend as a whole, while the effect of compressive strength and falling strength was not obvious. With the increase in SiO2 content, the green pellets’ burst temperature gradually decreased, and the green pellets’ strength also decreased slightly.
(3) A new cultural firefly algorithm was designed, which can effectively improve the weights and thresholds of GRNN, has good generalization performance, does not easily fall into local optimum, and improves the accuracy of prediction.
(4) Based on the generalized regression neural network improved by the culture firefly algorithm, a green pellet performance prediction model was established. After training, the green pellets’ burst temperature, compressive strength and falling strength predicted by the model were in good agreement with the real values, and the error fluctuation range was small. Their average relative errors were 1.88%, 3.18% and 3.62%, respectively. The error analysis proves that the improved model algorithm has higher accuracy and has practical guiding significance.

Author Contributions

Conceptualization, Z.X. and Z.W.; methodology, Z.X. and X.Q.; software, B.B. and J.Z.; validation, Z.X., Z.W. and X.Q.; formal analysis, Z.X.; investigation, Z.X., Z.W. and B.B.; resources, X.Q.; data curation, Z.X.; writing—original draft preparation, Z.X.; writing—review and editing, Z.X.; visualization, Z.X. and J.Z.; supervision, X.Q.; project administration, Z.X.; funding acquisition, X.Q. All authors have read and agreed to the published version of the manuscript.

Funding

This research was funded by the National Natural Science Foundation of China (NO.52074126), Hebei Outstanding Youth Fund Project (NO.E2020209082), and Hebei Natural Science Foundation Project (NO.E2022209110).

Institutional Review Board Statement

Not applicable.

Informed Consent Statement

Not applicable.

Data Availability Statement

Not applicable.

Acknowledgments

Thanks are given to the Hebei Engineering Research Center for the Intelligentization of Iron Ore Optimization and Ironmaking Raw Materials Preparation Processes for their help with training. Thanks are given to Aimin Yang for his careful guidance. In addition, thanks are given to the authors’ colleagues for their companionship. Thanks are also given to Zezheng Li for his help with the writing of the manuscript.

Conflicts of Interest

The authors declare no conflict of interest.

References

  1. Zhang, H.Q. Production and development of fluxed pellet. China Min. Mag. 2009, 18, 89–92. [Google Scholar]
  2. Li, J.; Han, C.C.; Yang, A.M.; Liu, W.X.; Zhang, Y.Z.; Liu, L.J.; Xiao, H. Effect of MgO on the performance of magnesian fluxed pellets. Sinter. Pelletizing 2017, 42, 31–37. [Google Scholar]
  3. Zhang, L.L.; Fu, G.H.; Guo, Y.F.; Chen, F.; Zheng, F.Q. Effect of basicity on quality of green fluxed pellets. Iron Steel 2019, 54, 14–18. [Google Scholar]
  4. Xin, Z.C. Liquid Phase Formation Behavior and Mineral Phase Regulation Mechanism of Magnesia Fluxed Pellet. Master’s Thesis, North China University of Science and Technology, Tangshan, China, 2018. [Google Scholar]
  5. Zhuansun, Y.X. Research on Prediction and Optimization Model for Intelligent Recommendation of Pelletizing Ingredients. Master’s Thesis, North China University of Science and Technology, Tangshan, China, 2021. [Google Scholar]
  6. Jiang, T.Y.; Xue, T.; Li, Z.Z.; Yang, A.M.; Li, J.; Zhang, Z.Q. Application of intelligent algorithms in pellet manufacturing process. China Metall. 2022, 32, 25–32. [Google Scholar]
  7. Zhao, Y.L. Application of Improved Generalized Regression Neural Network in Power and Signal Integrity of High-Speed Circuit. Master’s Thesis, Anhui University, Hefei, China, 2021. [Google Scholar]
  8. Xue, H.; Shao, Z.P.; Pan, J.C.; Zhang, F. Vessel traffic flow prediction based on CFA-GRNN algorithm. J. Shanghai Jiao Tong Univ. 2020, 54, 421–429. [Google Scholar]
  9. Wang, X.; Huang, K.; Zheng, Y.H.; Li, L.X.; Shao, F.P.; Jia, L.K.; Xu, Q.S. Combined PV power forecast based on firefly algorithm generalized regression neural network. Power Syst. Technol. 2017, 41, 455–461. [Google Scholar]
  10. Yan, Z.Z. Study on Pellet Quality Optimization of Hansteel. Master’s Thesis, North China University of Science and Technology, Tangshan, China, 2018. [Google Scholar]
  11. Wang, S.Y.; Hu, Q.H.; Sun, J.Z. Software test data augmentation method based on beetle antennae search. Comput. Eng. 2021, 47, 191–196. [Google Scholar]
  12. Guo, C. Hot Strip Thickness Prediction Based on General Regression Neural Network. Master’s Thesis, Automation Research and Design Institute of Metallurgical Industry, Beijing, China, 2021. [Google Scholar]
  13. Gabrijel, I.; Dobnikar, A. On-line identification and reconstruction of finite automata with generalized recurrent neural networks. Neural Netw. 2003, 16, 101–120. [Google Scholar] [CrossRef]
  14. Liu, W.; Liu, H. High voltage direct current transmission lines fault identification method based on improved VMD-MPE and general regression neural network. Sci. Technol. Eng. 2022, 22, 211–219. [Google Scholar]
  15. Lipton, Z.C.; Berkowitz, J.; Elkan, C. A critical review of recurrent neural networks for sequence learning. arXiv 2015, arXiv:1506.00019. [Google Scholar]
  16. Wang, Y.; Wang, Y.; Lui, Y.W. Generalized recurrent neural network accommodating dynamic causal modeling for functional MRI analysis. NeuroImage 2018, 178, 385–402. [Google Scholar] [CrossRef]
  17. Hajihosseini, A.; Maleki, F.; Lamooki, G.R.R. Bifurcation analysis on a generalized recurrent neural network with two interconnected three-neuron components. Chaos Solitons Fractals 2011, 44, 1004–1019. [Google Scholar] [CrossRef]
  18. Asante-Okyere, S.; Xu, Q.; Mensah, R.A.; Jin, C.; Ziggah, Y.Y. Generalized regression and feed forward back propagation neural networks in modelling flammability characteristics of polymethyl methacrylate (PMMA). Thermochim. Acta 2018, 667, 79–92. [Google Scholar] [CrossRef]
  19. Shang, Y.J. Study on Photovoltaic Power Short-Term Forecast Based on Improved GRNN. Master’s Thesis, Nanjing University of Posts and Telecommunications, Nanjing, China, 2018. [Google Scholar]
  20. Semberg, P.; Andersson, C.; Bjorkman, B. Interaction between iron oxides and olivine in magnetite pellets during reduction at 500°–1300 °C. Min. Metall. Explor. 2014, 31, 126–135. [Google Scholar]
  21. Zhou, M.S.; Shen, F.M.; Zhai, L.W.; Liu, J.; Zhang, H. Influence of MgO adding method on improving metallurgical properties of pellet. Iron Steel 2012, 47, 14–18. [Google Scholar]
  22. Xue, H.; Shao, Z.P.; Pan, J.C.; Fang, Q.L. Cultural firefly algorithm for dynamic path planning of soccer robot. Control Decis. 2018, 33, 2015–2020. [Google Scholar]
  23. Chen, H.D.; Zhou, D.Y.; Xiao, X.H. Research on ventilation forecast of metro platform screen door based on generalized regression neural network. China-Arab States Sci. Technol. Forum 2021, 9, 101–103. [Google Scholar]
  24. Liu, W.Q. Study on the Mechanism of Magnesium Flux Pellet Mineral Phase Regulation. Master’s Thesis, North China University of Science and Technology, Tangshan, China, 2021. [Google Scholar]
Figure 1. Effect of alkalinity on green pellet performance. (a) Burst temperature trend chart, (b) Compressive strength and falling strength trend chart.
Metals 12 01840 g001
Figure 2. Effect of SiO2 content on green pellet performance. (a) Burst temperature trend chart, (b) Compressive strength and falling strength trend chart.
Metals 12 01840 g002
Figure 3. Effect of MgO content on green pellet performance. (a) Burst temperature trend chart, (b) Compressive strength and falling strength trend chart.
Metals 12 01840 g003
Figure 4. Prediction model of green pellet performance.
Metals 12 01840 g004
Figure 5. Flowchart of the prediction model.
Metals 12 01840 g005
Figure 6. Convergence curve of GRNN structure optimized by CFA.
Metals 12 01840 g006
Figure 7. Variation trend of errors of burst temperature prediction model.
Metals 12 01840 g007
Figure 8. Variation trend of errors of compressive strength prediction model.
Metals 12 01840 g008
Figure 9. Variation trend of the error of the falling intensity prediction model.
Metals 12 01840 g009
Table 1. Main chemical compositions of mineral powders (%).
SampleTFeFeOSiO2CaOMgOAl2O3S
PMC mineral powder64.3026.621.060.753.56--
Anhui powder65.2624.985.010.410.450.520.027
Shahe powder63.2625.684.121.920.770.760.23
Yanshan powder66.4524.566.320.170.300.830.25
Limestone--3.2350.620.381.35-
Light-burned magnesium powder--5.961.7984.320.98-
Bentonite--57.324.472.5512.26-
Table 2. Physical properties of bentonite.
SampleColloidal Value/%Expansion Capacity MultipleBlue Absorption Power/gMontmorillonite Content/%
Bentonite285.0017.5326.3263.21
Table 3. Particle size distribution of mineral powders.
Sample>0.15 mm0.15 mm~
0.074 mm
0.074 mm~
0.045 mm
<0.045 mm<0.074 mm
PMC mineral powder28.4440.2321.389.9531.33
Anhui powder10.5450.3224.6214.5239.14
Shahe powder52.2618.6214.3214.8029.12
Yanshan powder0.4620.7659.3119.4778.78
Limestone1.5680.6014.263.5817.84
Light-burned magnesium powder0.1041.148.89.758.5
Bentonite0.005.7321.8572.4294.27
Table 4. Adjustment of alkalinity content and ore blending scheme.
SampleR = 0.6R = 0.8R = 1.0R = 1.2R = 1.4
PMC mineral powder19.3219.4119.6319.5519.74
Anhui powder45.3244.2842.0940.2038.35
Shahe powder5.165.295.335.485.66
Yanshan powder20.0020.0020.0020.0020.00
Limestone5.377.629.4310.6012.74
Light-burned magnesium powder0.900.880.860.840.82
Bentonite0.700.700.700.700.70
Table 5. Adjustment of Si content and ore blending scheme (%).
Samplew(Si) = 3.5w(Si) = 4.0w(Si) = 4.5w(Si) = 5.0w(Si) = 5.5
PMC mineral powder55.3245.8632.5219.4713.32
Anhui powder17.5227.1338.6249.4660.09
Shahe powder5.235.946.406.747.11
Yanshan powder20.0020.0020.0020.0020.00
Limestone5.726.487.888.659.81
Light-burned magnesium powder0.000.110.520.681.22
Bentonite0.700.700.700.700.70
Table 6. Adjustment of Mg content and ore blending scheme (%).
Samplew(Mg) = 1.8w(Mg) = 2.0w(Mg) = 2.2w(Mg) = 2.4w(Mg) = 2.6
PMC mineral powder19.2319.3719.4419.5119.66
Anhui powder41.0640.8840.5940.3240.17
Shahe powder6.535.815.755.565.48
Yanshan powder20.0020.0020.0020.0020.00
Limestone9.119.239.379.459.59
Light-burned magnesium powder0.911.231.411.651.82
Bentonite0.700.700.700.700.70
Table 7. Experimental conditions and green pellet performance data.
Alkalinity (R)w(SiO2)/%w(MgO2)/%Burst Temperature
/°C
Compressive Strength
/N·ball−1
Falling Strength
/N·ball−1
0.605.501.8054910.535.71
0.805.501.805369.854.12
1.005.501.805309.674.75
1.205.501.805219.384.55
1.405.501.8044810.974.66
1.003.501.8055710.524.93
1.004.001.8053311.313.52
1.004.501.8052411.213.46
1.005.001.805139.764.74
1.005.501.8040710.923.67
1.005.501.805209.634.61
1.005.502.005299.874.43
1.005.502.2054510.524.22
1.005.502.4053910.454.10
1.005.502.6053610.803.48
Table 8. Partially expanded data.
Alkalinity (R)w(SiO2)/%w(MgO2)/%Burst Temperature
/°C
Compressive Strength
/N·ball−1
Falling Strength
/N·ball−1
0.505.281.70492.3311.535.71
0.505.311.75521.5611.854.12
0.505.351.83518.7210.674.75
0.555.511.84521.4110.384.55
0.555.571.84448.6211.974.66
0.555.641.82557.1912.134.93
············
1.485.781.90524.3711.213.46
1.515.211.86453.6910.874.74
1.535.891.85387.0511.923.67
Table 9. Comparison of burst temperature prediction results.
Burst Temperature/℃
Actual Value487.33533.61483.45452.61475.23525.49527.70513.01475.89466.97
Predictive value482.17524.13471.84443.50483.72535.57530.38497.33463.63458.98
RE (%)1.061.782.402.011.791.920.513.062.581.71
MRE (%)1.88RMRE (%)9.88
Table 10. Comparison of compressive strength prediction results.
Compressive Strength/N·ball−1
Actual Value9.669.0110.599.629.2110.768.6110.7511.9211.65
Predictive value9.128.8210.699.858.6810.298.5811.0611.7110.99
RE (%)5.592.110.942.395.754.370.352.881.765.67
MRE (%)3.18RMRE (%)0.38
Table 11. Comparison of falling strength prediction results.
Falling Strength/N·ball−1
Actual value4.374.823.684.124.484.934.114.473.584.28
Predictive value4.50 5.023.583.914.635.073.974.653.454.45
RE (%)2.97 4.15 2.72 5.10 3.35 2.84 3.41 4.03 3.63 3.97
MRE (%)3.62RMRE (%)0.16
Table 12. Error analysis.
Model ErrorBurst TemperatureCompressive StrengthFalling Strength
GRNN-MRE (%)12.4615.7320.04
GRNN-RMSE (%)15.741.332.65
CFA-GRNN-MRE (%)1.883.183.62
CFA-GRNN-RMSE (%)9.880.380.16
Publisher’s Note: MDPI stays neutral with regard to jurisdictional claims in published maps and institutional affiliations.

