Article

Characterization of the Fatigue Behaviour of Low Carbon Steels by Means of Temperature and Micromagnetic Measurements

by
Haoran Wu
1,2,*,
Srinivasa Raghavan Raghuraman
1,
Jonas Anton Ziman
1,2,
Fabian Weber
1,2,
Torsten Hielscher
3 and
Peter Starke
1,2
1
Department of Materials Science and Materials Testing, Institute QM3, University of Applied Sciences Kaiserslautern, D-67659 Kaiserslautern, Germany
2
Faculty of Natural Sciences and Technology, Saarland University, D-66123 Saarbrücken, Germany
3
Department of Manufacturing, Institute QM3, University of Applied Sciences Kaiserslautern, D-67659 Kaiserslautern, Germany
*
Author to whom correspondence should be addressed.
Metals 2022, 12(11), 1838; https://doi.org/10.3390/met12111838
Submission received: 7 October 2022 / Revised: 20 October 2022 / Accepted: 26 October 2022 / Published: 28 October 2022

Abstract

:
Investigations on low carbon (non- and low-alloy) steels were conducted in form of load increase tests (LIT) and constant amplitude tests (CAT) to find the correlation among material behaviour, mechanical load, and the type of NDT method. With the help of preprogrammed load-free sequences, the thermal impact on magnetic Barkhausen noise (MBN) measurement can be avoided, so that the cyclic deformation properties of material responses can be interpreted more precisely. The results indicate differences between the change in temperature and the MBN-derived variable during LITs and CATs regarding the demonstration of the incubation stage and the cyclic hardening behaviour.

1. Introduction

The relationship between load amplitude and fatigue life is usually expressed in terms of S-N or Wöhler curves, the determination of which usually requires a large number of fatigue tests. For stress/force-controlled fatigue tests, a power law relationship according to Basquin [1] is often used for the mathematical description of these curves. For strain-controlled tests, however, the Coffin-Manson relationship is used to describe the low-cycle fatigue (LCF) regime [2,3], while in the high-cycle fatigue (HCF) regime, the total strain-life curve (εa,t-Nf) is separated into a plastic portion (εa,p) described via the Coffin-Manson relationship and an elastic portion (εa,e) related to Basquin’s equation.
The LCF, HCF, and very high cycle fatigue (VHCF) ranges have specific damage characteristics. For a comprehensive characterization of the fatigue behaviour, it is advantageous to use different measurement techniques besides the mechanical stress-strain hysteresis measurement in order to record and, if necessary, separate different mechanisms occurring in the material during the fatigue process.
For example, information regarding the defect density in bulk materials can be obtained via electrical resistance measurement [4,5] and subsurface changes can be sensed via magnetic field sensors [6,7], resulting in a gain in information. It should be noted that numerous developments have been made in sensor technology, whereby physical parameters associated with very localised fatigue damage can also be recorded with high resolution. The detection of non-linear damage accumulation processes in fatigue-loaded materials enables a more detailed understanding of the fatigue behaviour of specimens, components, and structures, which goes far beyond conventional mechanical stress-strain hysteresis measurements [4,5].
Various researchers [8,9,10] have known for a long time that the cyclic deformation in metals leads to heat dissipation by means of thermometry. In addition to thermocouples, thermal imaging infrared (IR) camera systems have been already used for temperature measurement since the 1970s [11], which is now much more widely applied due to the continuous innovation in technology. Regarding the use in fatigue evaluation, damage indicators have been defined to describe the fatigue state of different kinds of materials by means of temperature variables from direct and indirect measurements, which are used to estimate the fatigue strength of metallic materials [5,10,12,13,14,15,16,17,18,19,20,21,22,23,24] and fatigue damage analysis of composite materials [25,26].
In addition to thermometric methods, micromagnetic-based methods can be used as well in this context, such as eddy current testing, incremental permeability, Fourier analysis of the tangential magnetic field, and magnetic Barkhausen noise (MBN) [27]. The material parameters acquired by these methods require further material-physical and mathematical interpretations. Up to now, methods based on magnetics have mainly been used to characterize the state of damage [28]. Seeger [29] was already able to demonstrate the interaction between dislocations and domain walls within ferromagnetic materials in the 1960s by using TEM investigations and described it quantitatively in part. Taylor et al. [30] observed with the Lorentz microscopy method that the interaction of the domains depends on both the dislocation density and structure. In the 1970s, Rastogi [31] studied the influence of alloying elements on the texture and magnetic properties of anisotropic steels and the proposed effects of Mn and S on permeability. Ranjan and Jiles [32] showed that the carbon content as well as external and internal stress fields influence magnetic hysteresis. This phenomenon can also be proved by the MBN signals, as shown in [33,34,35]. The load influence on the measured MBN signal was presented, whereby the material condition in particular plays a role [36]. The authors found that the MBN signal can very sensitively reflect influences due to the dislocation structure and the grain size. The strain dependence of the MBN signal was investigated in [37]. Karjalainen and Moilanen introduced the cyclic deformation curves of cyclic bending tests under different constant deflections with Barkhausen noise amplitude (BNA) in terms of the signal amplitude of parallelly or transversely magnetized measurements [38,39]. In addition, variables based on micromagnetic measurands, e.g., the RMS (root mean square) value of the MBN signal, could be correlated with microstructural changes (especially dislocation reactions) observed by using TEM as well as with hardness or residual stress values. Compared to residual stress values determined by X-ray diffraction, the micromagnetic parameters derived from MBN measurements, according to [40], are more sensitive, which allows an even more qualitative characterization of the residual stress evolution in the early fatigue stage and can thus reveal the subsurface fatigue damage state. Sagar et al. [41] reported a three-stage development of the MBN signal as a function of the fatigue state in low-carbon steels and could attribute this to dislocation structure changes and micro-crack formation. Palma [42] was able to further confirm these observations. Baak et al. [43,44] investigated the MBN response of deep-drilled 42CrMo4 steel during fatigue tests in terms of coercive field strength and max. MBN amplitude, and found the tests difficult to correlate with other material responses.
In this paper, results of different stress-controlled fatigue tests with inserted load-free sequences are shown for two normalized low-carbon steels. Balanced and comparable thermal conditions for different MBN measurements during fatigue tests are guaranteed in this way without disturbing the IR measurement obviously. Moreover, the test duration was not significantly extended in comparison to conventionally continuously conducted tests. Different material responses to fatigue loads are shown and discussed in detail. A mathematical description of the cyclic deformation curve formed by MBN data points is proposed.

2. Materials and Methods

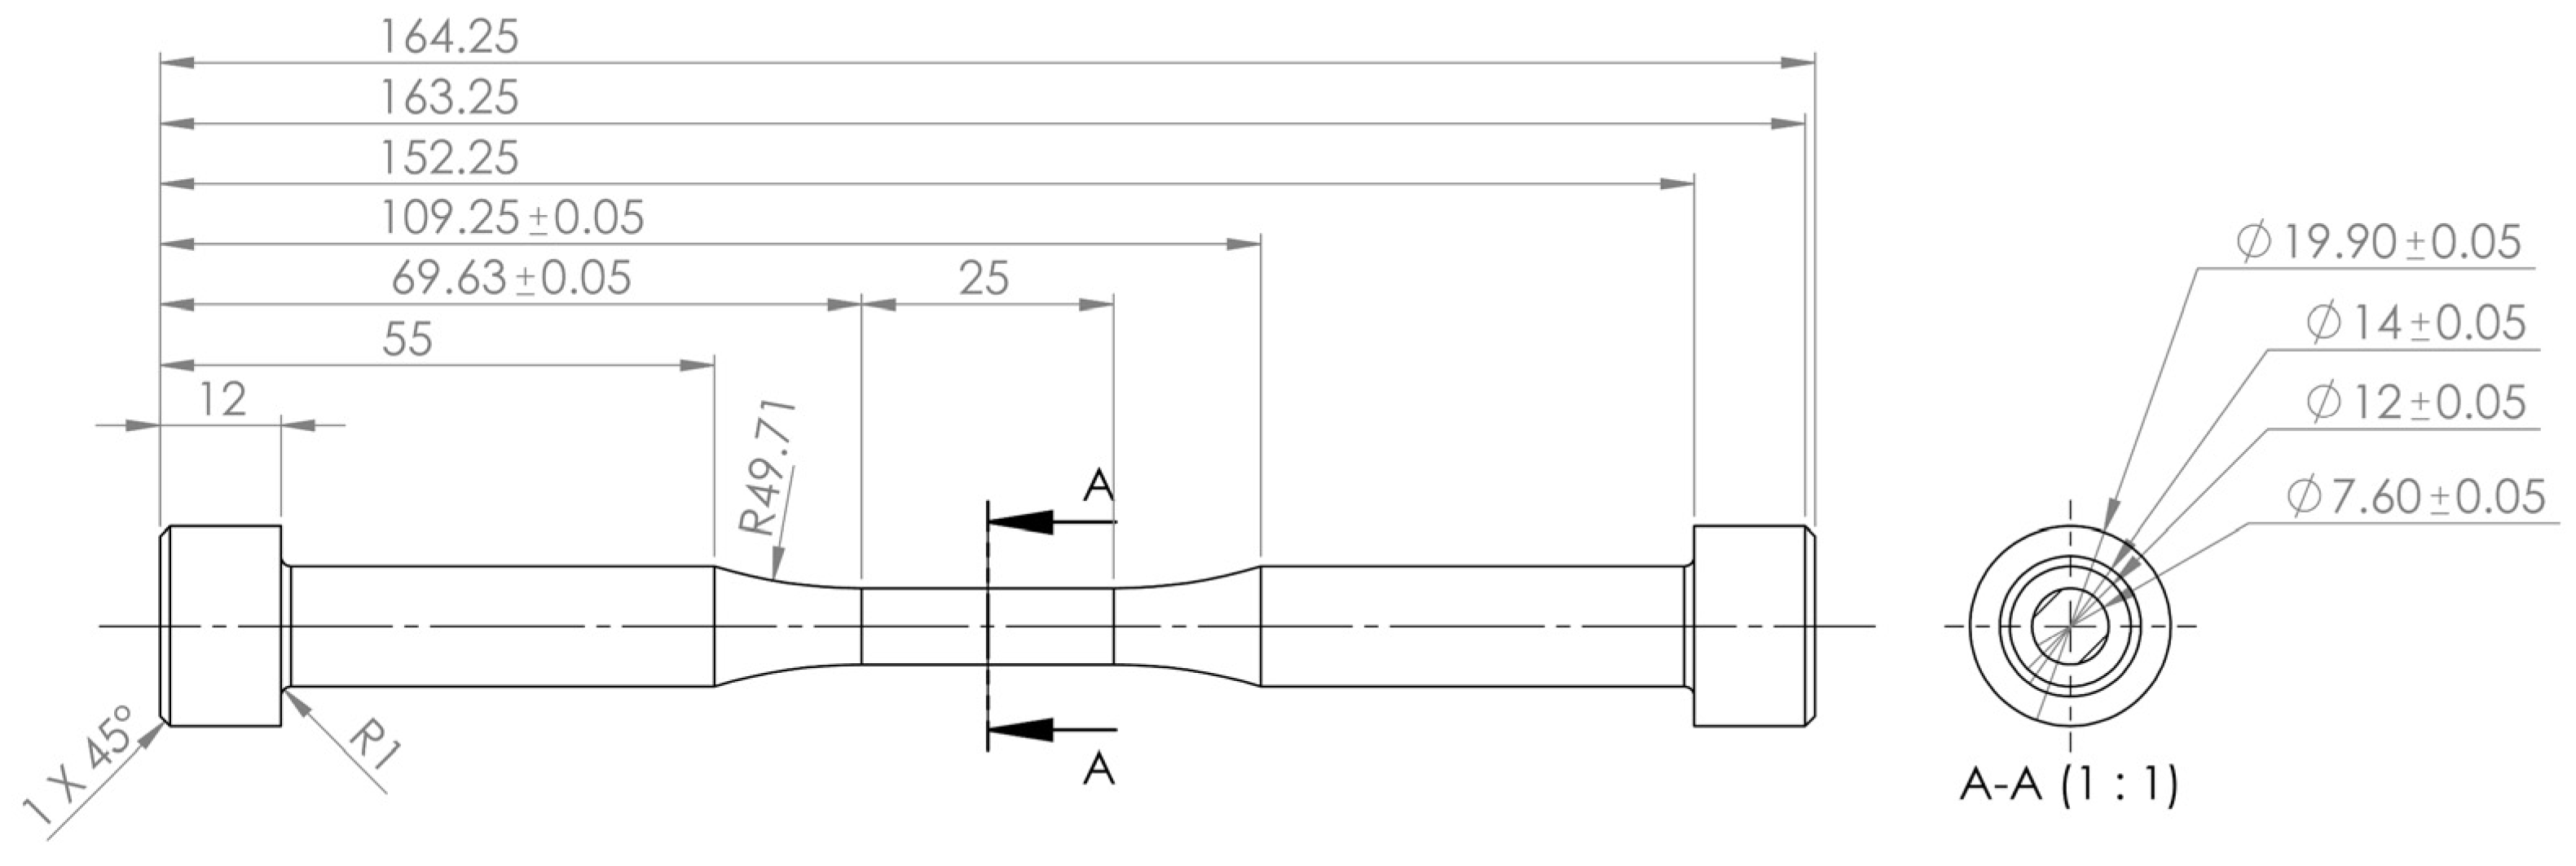
2.1. Material and Machining of Specimens

The tests were carried out on specimens of SAE 1020 (1.1149, C22R) and SAE 5120 (1.7149, 20MnCrS5) steels. The chemical compositions for both materials are summarised in Table 1 according to the manufacturer’s specifications and own measurements, along with the specified limit values according to DIN EN 10083-2 and DIN EN 10084.
Within the framework of the research project (DFG STA 1133/10), the specimens were tested in the normalized condition (SAE 1020: Taust. = 860 °C, SAE 5120: Taust. = 840 °C) and in two quenched and tempered conditions (Ttemp. = 250 °C and 650 °C, ttemp. = 60 min). Within this paper, only results from the normalized condition are introduced. Micrographs of the normalized condition of both steels taken by an OLYMPUS DSX 1000 (EVIDENT Europe GmbH, Hamburg, Germany) digital microscope are given in Figure 1.
Fatigue specimens were manufactured on a WEILER 160 CNC lathe (WEILER Werkzeugmaschinen GmbH, Emskirchen/Mausdorf, Germany) after the mechanical drawing shown in Figure 2. The bar material was cut off with a cold saw and manually centred to facilitate clamping in the three-jaw chuck and the centre of rotation of the lathe. The basic contour of the specimen was generated by five roughing operations with cutting speed vc = 80 m⋅min−1, feed rate f = 0.2 mm⋅rev−1, and depth of cut ap = 0.8 mm.
The cutting parameters for the finishing operations were set up as: cutting speed vc = 80 m⋅min−1, feed rate f = 0.1 mm × rev−1, and depth of cut ap = 0.8 mm.
For both turning operations, a TiAlN/TiN coated cermet insert was used. External cooling was realized with an oil-water emulsion.
The turning process was followed by a half-automated mechanical polishing process using a felt polishing wheel with grinding and polishing paste. Due to the standardized machining processes and constant process parameters, the reproducibility of specimens is guaranteed.

2.2. Test Setup

Stress(force)-controlled constant amplitude tests (CAT), as well as load increase tests (LIT), were carried out uniaxially without mean stress (R = −1) at ambient temperature with a load frequency of 5 Hz and a sinusoidal load-time function on a servohydraulic testing system type EHF-U by Shimadzu (Shimadzu Europa GmbH, Duisburg, DE). The complete experimental setup is shown in Figure 3.
LITs and CATs are conducted basically after the same principles as described in [4,5,45,46]. A CAT (Figure 4a) is the conventional way of conducting a fatigue test with unchanged stress amplitude throughout the whole test until a certain stopping criterion is fulfilled. A LIT (Figure 4b), instead, can be seen as a combination of sequentially conducted CATs, where the stress amplitude increases by an identical value, whenever a certain number of load cycles is reached.
In order to make the most of the signal characteristics of the micromagnetics and to separate thermal side-effects from the mechanical influence, test procedures of CATs and LITs were updated with inserted load-free sequences. The emblematic load-time(cycle) functions of both cases are shown schematically in Figure 4c,d. In the present case, each sequence has a duration of 360 s, while sequences with a duration of only 5 s were also applied for early experiments. After the first 104 load cycles, load-free sequences are inserted after every 103 or 104 cycles for LIT or CAT, respectively, until the stopping criterion (a maximum number of cycles in a total of 2 × 10⁶ or specimen failure) is fulfilled. During the first 104 cycles, load-free sequences are inserted more frequently after the logarithmical principle whenever the number of cycles following this formula has been reached: j⋅10i − 1 (when i = 1, 2, 3: j = 1, 2, …, 9; when i = 4: j = 1).
To characterize the microstructure-based fatigue behaviour in detail, the plastic strain amplitude, the change in temperature, and the maximum MBN signal intensity were calculated from the measurands. Technical specifications of the tactile extensometer and the IR camera, as well as the preparation of the fatigue specimens, were already introduced in [5].
To ensure the acquisition of MBN signals, an MBN sensor type µmagnetic by QASS (QASS GmbH, Wetter (Ruhr), DE) was implemented into the test setup. The sensor head consists of an externally triggerable electromagnet for generating sinusoidal alternating magnetic fields, which could send a maximum magnetic flux density of 1200 mT, and a pickup coil to detect MBN in the specimen. A pre-amplifier is connected to the sensor head to amplify the detected signal. The measured MBN signals are amplified by a gain factor of 1000. The sensor head was mounted on an adapter made of copper fixed to a stable x/z-platform, in order to reach the test section in the middle of the vertically clamped fatigue specimen (Figure 3, right-hand side). The lift-off during every test has been kept constant. The intensity of the sinusoidal alternating magnetic field was set according to the producer to 955 mV in terms of the coil voltage and the exciting frequency is 10 Hz to assure a reasonable penetration depth into the subsurface of the specimen. The measurement was always triggered shortly before the end of every load-free sequence when the temperature of the specimen sinks down to a balanced status. Each measurement lasts 1000 ms, 500 ms of which is the window where the triggered magnetic excitation takes place.
The raw signal can be divided after an FFT analysis into frequency and time domains, which constitute together with the signal intensity of a spectrogram. Several signal processing and feature extraction techniques, such as denoising, band-pass filtering (120–500 kHz), smoothing (RMS, root mean square and LOWESS, locally weighted scatterplot smoothing) and time-domain alignment, were applied. The later extracted feature Imax is derived from the peak value of the pre-processed MBN signals in the time domain. It is the mean value calculated from three cycles in the middle of the excitation window.
For continuously recorded measurands, for examples, the change in temperature, the information during pauses would not be used for the evaluation at this moment, though some features, such as thermal conductivity, could be potentially characterized when the heat dissipation due to cyclic deformation stops.

3. Results and Discussion

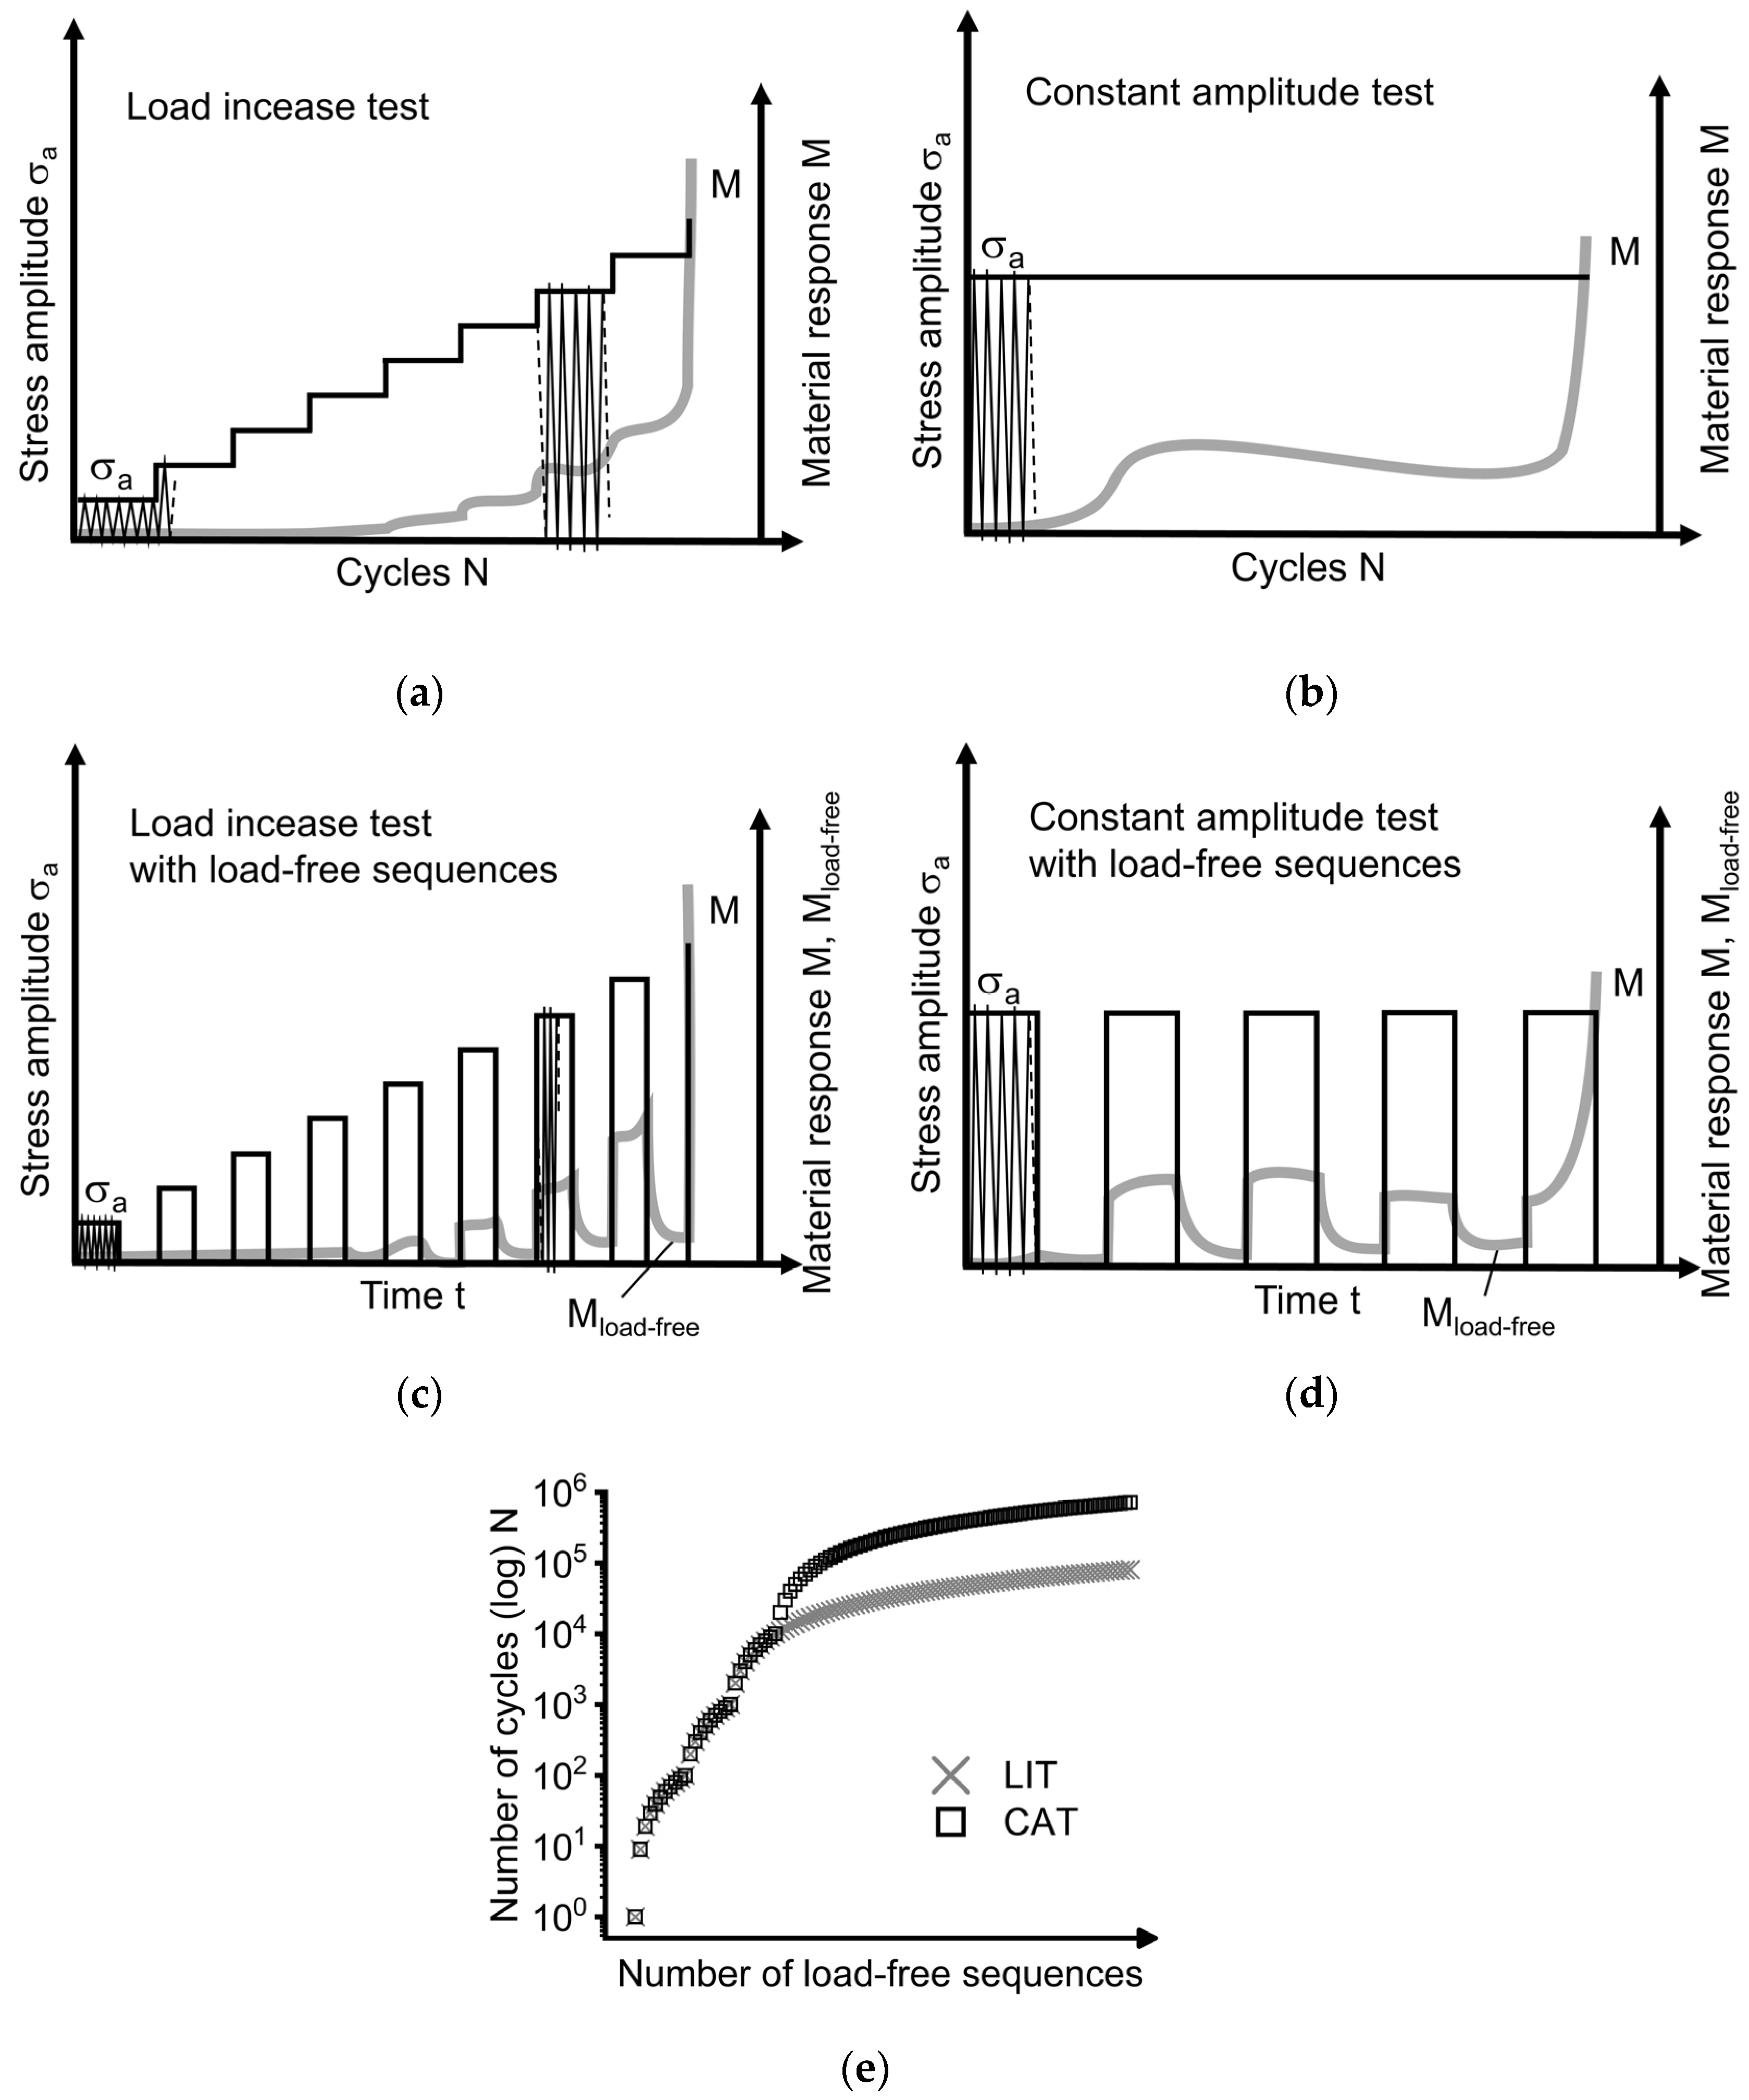
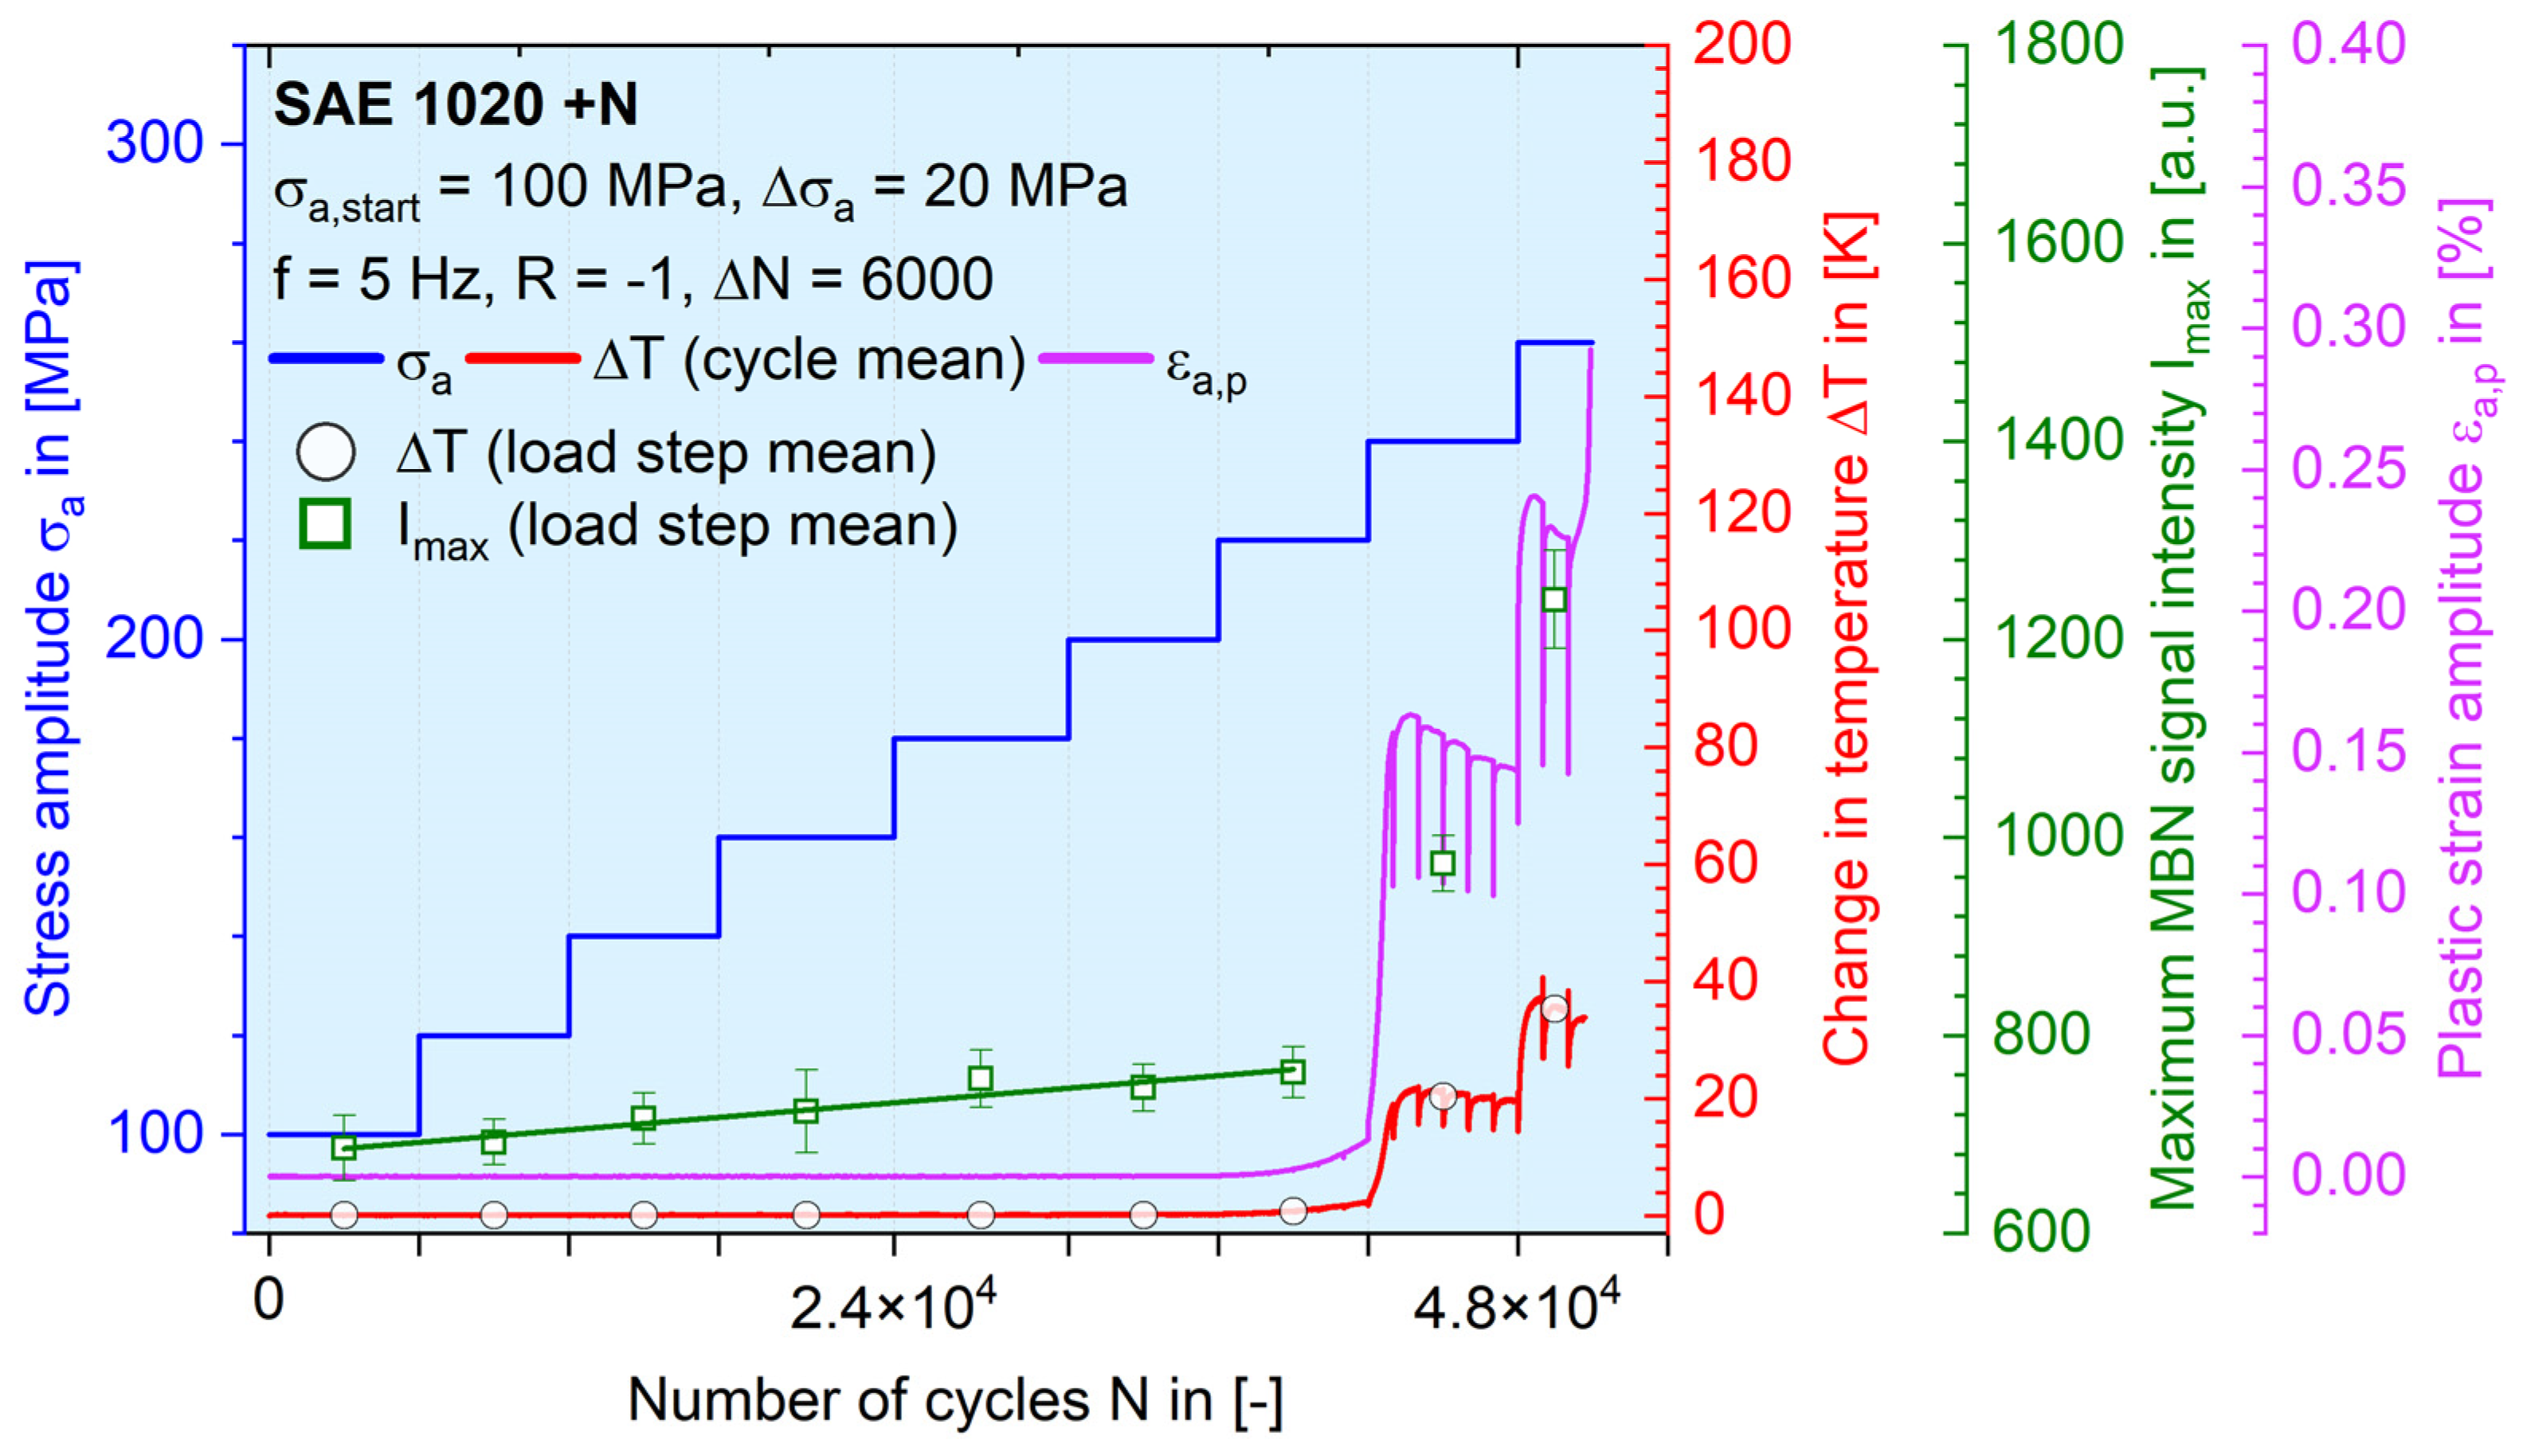
3.1. Load Increase Tests

At the beginning of the test series, load increase tests (LIT) were carried out in order to roughly estimate the fatigue strength as well as the elastic and elastic-plastic response to cyclic load at the same time. In the latter case, the accumulated damage from previous load steps must be taken into account when comparing to the material response from constant amplitude tests (CAT) at the same stress amplitude. In addition, the respective contribution of strain hardening is lower, as the stress amplitude reached a staircase shape. Nevertheless, the LIT is a convenient and less time-consuming tool for obtaining a “fingerprint” of the material behaviour under cyclic loading. Moreover, it is possible to quantify the pre-accumulated damage by using selected CATs, which have been a part of the StressLife S-N curve calculation method [47].
The results of two LITs conducted on SAE 1020 (Figure 5) and SAE 5120 (Figure 6) in normalized material condition are shown below separately. All calculated material responses derived from the three aforementioned measuring techniques are presented: the plastic strain amplitude εa,p, the change in temperature ΔT, and the maximum intensity of magnetic Barkhausen noise MBN signal Imax. As described in Section 2.1, the tests were not performed with continuous load (as shown in Figure 4a), but with inserted load-free sequences (Figure 4c). For this reason, vertical lines can be seen on the εa,p-N, and ΔT-N curves, which originate from the restart processes after each load-free sequence, the data of which has been excluded from the final evaluation. The duration of each sequence here was set as 5 s for SAE 1020 due to an earlier date of the experiment and 360 s for SAE 5120. The progresses of εa,p-N and ΔT-N curves are shown in a continuous way, while the mean values from each load step of ΔT and Imax are emphasized. A linear correlation between Imax and N in the elastic stage was shown with a grade line on each graph. The fit quality with R2 = 0.93 for SAE 1020 +N and 0.90 for SAE 5120 +N can be confirmed.
Especially when considering the ΔT-N curve, it can be seen that the inserted load-free sequences, as expected and already proven in previous investigations [4,5], do not really disturb the general progress in comparison with conventional pause-free tests, as the ΔT value always recovers to the former trend in the last load sequence again. This can also be seen in the CATs shown in Figure 7 and Figure 8 with the help of imaginary upper envelope curves.
It should be noted here, that εa,p is evaluated from a stress-strain hysteresis loop based on a distance of 25 mm between the two blades of the tactile extensometer. This information may be somewhat conservative, especially if the fracture zone is not directly in the middle of the test section or the fatigue tests are carried out, e.g., under consideration of superimposed mean stresses. Due to the high heat conduction of metallic materials, the recorded change in temperature of the specimen can represent the varying voluminal heat source, even though this information can only be extracted from the specimen’s surface by the thermographic technique. The MBN signal is limited to a small region in the middle of the specimen’s test section, due to the small size of the pickup coil.
In the purely elastic stage (until 3.6 × 10⁴ cycles in Figure 5 and 4.2 × 10⁴ cycles in Figure 6), as the number of load cycles grows, εa,p and ΔT stay close to zero while the mean values of Imax from each load step show a slight linear increase. At the transition to the elastic-plastic stage, where the applied stress amplitude is in the range of the fatigue strength, all material responses start to increase significantly. In the case of SAE 1020, εa,p as well as ΔT start to increase one load step earlier than the MBN signal intensity (σa = 220 MPa vs. 240 MPa), while for SAE 5120, the situation is reversed: Imax indicates the point of transition from elastic to elastic-plastic behaviour earlier than εa,p and ΔT (σa = 220 MPa vs. 240 MPa). Due to the compositional differences between SAE 1020 and SAE 5120, which are mainly related to the Cr and Mn content (Table 1), SAE 5120 shows a higher strain hardening potential in the normalized state, which is reflected by its larger number of cycles to failure as well as the higher load level at fracture by the end of the LIT (SAE 1020: σa = 260 MPa vs. SAE 5120: σa = 300 MPa).
In order to get a better idea of how Imax varies with an increasing number of load cycles, all butterfly curves for both LITs are given in Figure 9. The pre-processed MBN signal response was plotted against the alternating electromagnetic excitation regarding the coil voltage. From each load-free sequence, the three cycles used to calculate Imax are shown, which are accompanied by slight scattering. The differences between both material conditions can be compared side by side, which provides more details as a supplement to Figure 5 and Figure 6. It can be seen that the maximum peak height is under the influence of either the stress amplitude or the damage progress. Disregarding the curves recorded at sequence No. 72 from LIT on SAE 1020 (Figure 9a, highest curves in red color), which could be caused by a macroscopic crack, the shape of the rest butterfly curves for these both normalized material conditions are quite similar. The peak positions projected onto the x-axis locate mostly in the range between 500 to 600 mV, which is normally considered as a quantity correlated with the mechanical hardness. The peak height of SAE 5120 reaches always a higher position than that of SAE 1020, which indicates that the existance of higher concentrations of Mn and Cr changes the interaction between magnetic domain wall movement and the material defects, e.g., dislocation.

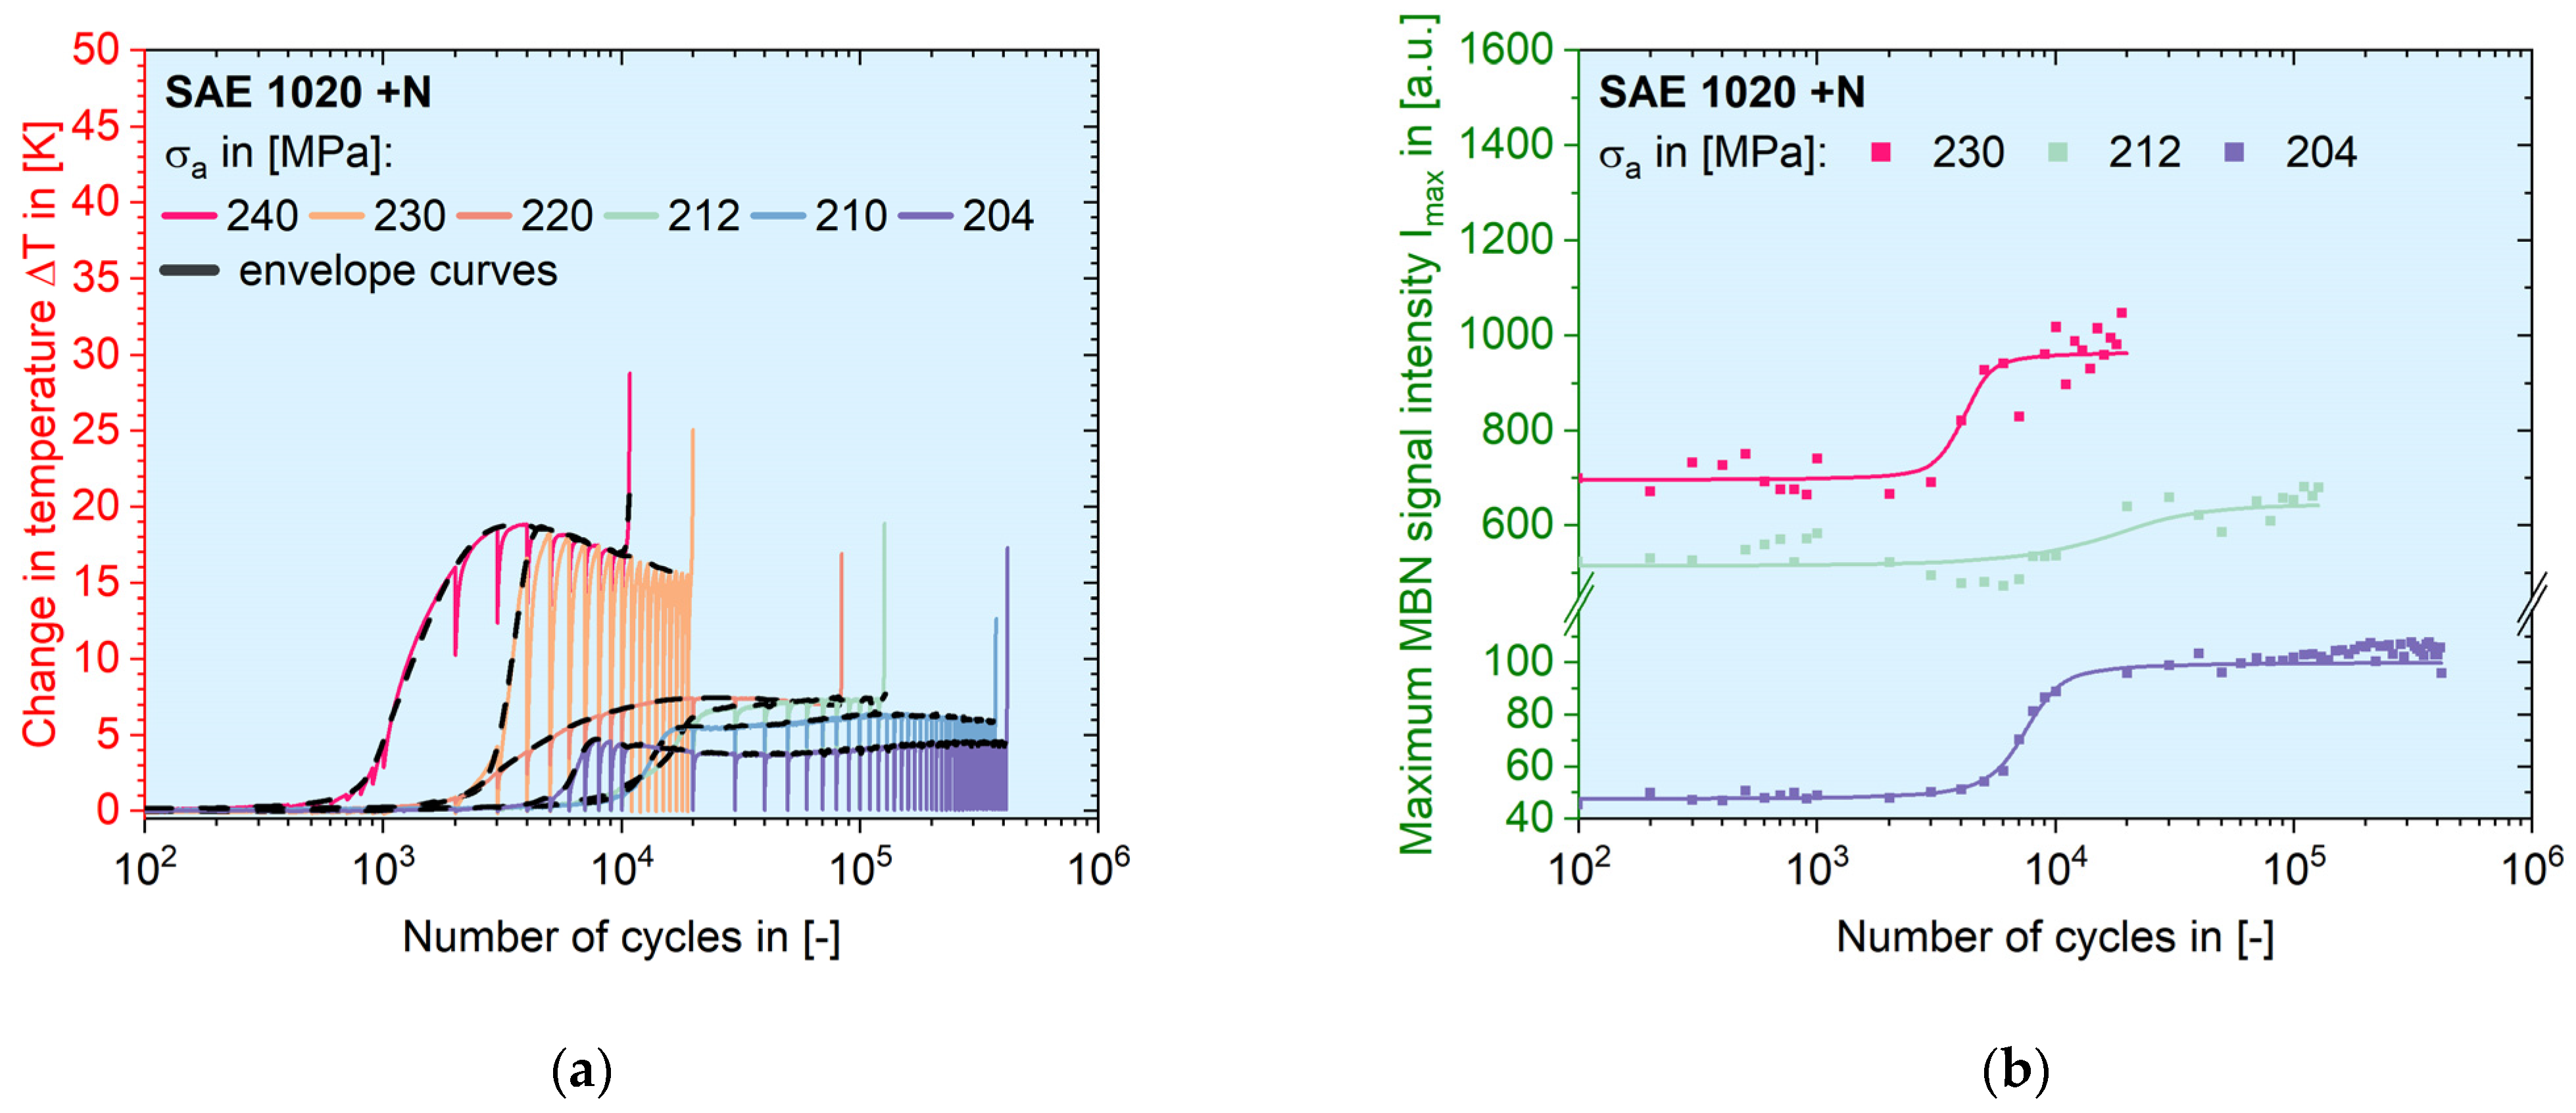
3.2. Constant Amplitude Tests

Following a similar experimental principle explained in Section 2.1, subsequently performed CATs were also carried out with inserted load-free sequences. Figure 7a and Figure 8a show the courses of the change in temperature of both aforementioned materials as a function of load cycle with imaginary envelope curves and the courses of Imax-N are demonstrated in Figure 7b and Figure 8b for selected stress amplitudes. It can be seen that the influence of stress amplitude on the development of material response can be separated more orderly regarding ΔT. As expected, the ΔT-N curves would start with a shorter incubation interval and end up resulting in a higher material response if the CAT is performed at a higher σa, which, in turn, results in a shorter fatigue life. The vertical lines indicate again the inserted load-free sequences, whereby the drop of material response, especially in the initial phase, becomes more obvious due to the logarithmic scaling. With the help of imaginary envelope curves (dashed line), the characteristic cyclic softening and hardening behaviour of the material is still easy to be identified, which is followed up by a fictitious secondary softening process (can only be seen in the ΔT results), characterized through macro-crack propagation and an associated reduction of the effective specimen cross-sectional area.
While the ΔT signal is affected by both processes occurring in the volume and at the surface, the MBN signal responses in particular to the surface-near microstructural processes. This is the reason why only slight differences in the MBN signal can be observed if N = 2–3 × 10³ is exceeded, when comparing the cyclic deformation curves for selected stress amplitudes shown in Figure 7b and Figure 8b. Due to the fact that the magnetic Barkhausen noise measurement reacts very sensitively to external influences, such as specimen surface geometry and lift-off, not every MBN result of the corresponding CAT shown in Figure 7a and Figure 8a could be used for a reliable evaluation. The trend curve in Figure 7b and Figure 8b are fit curves generated by a four-parameter modified Langevin function, with which the progress of MBN signal intensity could be satisfyingly represented by Equation (1):
a = y0 + C (coth((x − xc)/s)-s/(x − xc))
where y0 is the offset, C the amplitude, xc the centre position, and s the scale, with Equation (2):
coth(z) = (ez + e−z)/(ez − e−z)
It can be argued, that for each MBN measurement result, both the features of the applied sensor system (e.g., the penetration depth of the magnetic field) and the fatigue mechanism of the specimen result together in a similar incubation stage to those of εa,p and ΔT curves shown before. In particular, the initiation of cyclic softening processes (where the incubation stage is exceeded), as well as the change from cyclic softening to cyclic hardening, is indicated very accurately by this measurement technique, especially until the end of the first cyclic softening, which means up to approx. 25% of the fatigue life, even if the quantity of sampling is affected by the frequency of the inserted load-free sequences as shown in Figure 4e. The phase of cyclic hardening is approximated in terms of a plateau-like range which barely changes according to the modified Langevin function, disregarding the scattering.
Here the strong cyclic hardening in the form of obvious reduction of ΔT, which is observed by thermometry, was not found in micromagnetic measurement. Noticing that the Imax values are extracted from load-free and thermal balanced status, this phenomenon purely reflects the accumulated change in microscopic structure considering the interactions between magnetic domains and defects, such as dislocations. The accumulated fatigue damage keeps growing while the number of load cycles is getting higher. The plastic strain amplitude would shrink due to cyclic hardening, providing less heat dissipation that results in temperature drop. In contrast to the both phenomena mentioned above, the activity of magnetic domain movement due to alternating magnetization would be saturated, if there are too many obstacles to be overcome.
When comparing both kinds of steels investigated here, it can be clearly seen that SAE 5120 has a fatigue strength of approx. 20% higher than that of SAE 1020 (240 MPa vs. 200 MPa) in the same normalized condition, which can be attributed to the higher proportion of solid solution strengthening caused by the higher concentration of certain alloy elements.

4. Discussion

By conducting fatigue tests in terms of LIT and CAT with inserted load-free sequences combining non-destructive testing methods, such as thermography and micromagnetics, it is expected that different mechanics of material responses to fatigue load can be separated through the elimination of load and temperature influences on the measured signals of MBN in those load-free sequences. Studies have shown that no significant side effects would be introduced by inserting load-free sequences into continuously conducted conventional fatigue tests [4,5,44]. This is fundamental before further conclusions are dropped. The authors have experimentally explored an optimum duration of the load-free sequences. The earlier trials with 5 s could deliver satisfying results and save considerable experimental effort, but for higher heat dissipation, it would not be sufficient to let the specimen cool down to a complete thermal balance state. A load-free sequence of 360 s was therefore selected, and it suits the thermal conductivity of both pieces of steel investigated quite well, so that by the end of each pause, no matter how high the previous temperature has reached, the ΔT-N curve would end up with a nearly flat bottom.
With the help of imaginary envelope curves, the feature of a recoverable ΔT-N course after each pause is revealed. In comparison with continuously conducted CATs [48], a CAT with pauses of only 5 s duration results in a tiny change of the envelope curve, which means it recovers more quickly than those with 360 s (Figure 7a, 240 MPa vs. 230 MPa). Due to the logarithmical growing interval of load cycles between two load-free sequences as introduced in Figure 4e, the material response could reach a slightly higher level even during clear cyclic hardening progress (e.g., Figure 8a, 270 MPa after 104 cycles). Therefore, it can be assumed, that shorter load sequences (in other words more frequently inserted load-free sequences) could result in a somewhat exaggerated higher effect of cyclic hardening in terms of the obvious reduction in the measured material responses when the difference is significant (103 vs. 104 cycles). The true degree of cyclic hardening, if taking the continuously conducted tests as references, could be achieved by deploying a halfway number of ~5000 cycles in each load sequence. Considering the possibility of a continuous data acquisition with an IR camera, the calculated ΔT is still advantageous to the MBN signal for characterizing CATs and LITs in a holistic view.
When reviewing the acquired MBN data by means of the micromagnetic technique, it is common to generate butterfly curves or profile curves [27] by plotting the MBN signal intensity against the applied alternating field strength with a unit of [A/cm] or [mT]. In the frame of this work, the possibility is limited to the coil voltage in [mV] (Figure 9). It would affect the accuracy when the interpretation of peak position on the x-axis is wished, which is normally correlated with mechanical hardness. Since the MBN signal reacts very sensitively to either external or internal mechanical conditions as well as to temperature, the unwished noise and disturbing fake peaks would reduce the quality of smoothing mentioned in Section 2.1, even though the measurements were always only triggered during load-free sequences.
Nevertheless, without the insertion of such pauses, it is hardly possible to separate load and temperature influences from the factual accumulated microstructural changes, which govern the change in the MBN signal intensity. This method could therefore provide a clear added value for the interpretation of the results. It became clear from the results, that the MBN signal responds differently to the damage mechanisms than the temperature because the generated alternating electromagnetic field only influences a limited surface-near area on the detected specimen, of which the information gained is also limited in return. This could be a double-edged sword, since on the one hand, near or sub-surface material degradation are of the most interest for the HCF regime, especially regarding early-stage diagnosis. On the other hand, when it comes to the VHCF regime where the fatigue crack would initiate from the inside of the specimen, the subsurface-sensitive technique could be less useful.
The shape and the intensity of the MBN butterfly curves can be correlated with cyclic softening and hardening, providing very detailed information on material behaviour under cyclic loading, if the feature extraction method is appropriate. In the frame of this paper, Imax is the chosen quantity, which has shown its potential to describe material responses during LITs and CATs, and moreover, to indicate differences in the chemical compositions of the materials investigated. For describing the Imax-N relationship, a four-parameter modified Langevin function was used to deliver a good fit curve in the logarithmical scale which has this special “S” shape. The feature of the S-shape trend curve is contained in the four parameters, which could be used to extract further parameters for describing any single CAT and feed this into fatigue life calculation. While the S-shape curves of Imax describe the CATs for SAE 1020 in good conformity with the ΔT-N curves regarding the inflection points after incubation phases, they seem to have a “delay” of the increase for SAE 5120. Perhaps the better-dispersed perlites (Figure 1b) have offered more obstacles that could pin the domain walls more easily and thus inhibit the detection of MBN signals. This assumption still needs to be examined by more statistical experiments.
Regarding the description of the cyclic deformation behaviour of CATs, the Imax-N results look different from those reported in [38,39]. One possible reason is, that the previous results were acquired from strain-controlled cyclic bending tests, which cannot be directly compared with the results from stress-controlled tests as shown in this paper. The reported 3-stage-development of MBN-N curves in [41] cannot be verified, too, even if the materials in the reference and in this paper have a comparable composition and the type of fatigue tests conducted were also stress-controlled CATs. Since it was not clearly described if the MBN measurements were conducted under any thermal influence, it can be only assumed that the smaller number of data points could have led to such variation. The same assumption can also be made to explain the different results shown in [42], which claimed that the MBN response during CAT would decrease after the first significant increase and then stay constant. However, the data there were sampled with an interval of approx. 2 × 10⁵ cycles, which is enormous. The explanation for the plateau-like phase after the cyclic softening considering plastic deformation can be confirmed by this reference. Since the experimental method applied is similar to what has been shown in [44], the contrast in results could be attributed to the material properties. The normalized (non- and low-alloy) low carbon steels investigated here should have totally different levels of residual stress as quenched and tempered 42CrMo4 (with more C and alloying elements), let alone followed by a deep-drill process. Moreover, the load-free sequences were inserted more frequently in the first 104 load cycles in this paper than in [44], which provides a significantly better resolution during the first cyclic softening.

5. Conclusions

Within the framework of the present research, it was shown that NDT techniques regarding quantitative thermography and micromagnetics are capable of characterizing the cyclic deformation behaviour from LITs and CATs on low-carbon steels. It can be summarized that:
  • In contrast to conventional fatigue tests, an improved test strategy combining pre-programmed load-free sequences with adequate duration can improve the reliability of the acquired magnetic Barkhausen noise signals, so that the calculated feature Imax is purely correlated to the accumulated microstructural interaction.
  • The inserted load-free sequences have led to noticeable changes in the ΔT-N courses in comparison to the results of continuously conducted tests, but still in a reasonable range, thus that the results obtained by this measuring technique are seen as reliable references for MBN results.
  • The variable ΔT, determined thermometrically by an IR camera, responds to the fatigue load in good accordance with the conventional cyclic deformation curves characterized by plastic strain amplitude εa,p.
  • The measuring principle and the material responses recorded by means of micromagnetics are different from those of temperature and mechanical stress-strain measurements. The variable Imax, which is determined by complicated processing methods of the measured MBN signals, demonstrates a higher sensitivity to load increase in particular in the earlier stage during LITs before the first significant material response. A good incremental linear correlation between Imax and the load cycle (i.e., the stress amplitude) in the purely elastic phase can be confirmed with R2 ≥ 0.90 for both investigated materials.
  • Imax could describe the cyclic deformation behaviour of CATs satisfyingly by a modified four-parameter Langevin function, especially until the end of the first cyclic softening, which means up to approx. 25% of the fatigue life. This can be attributed to the surface-near way of data acquisition which makes the extracted information strongly affected by fatigue-induced changes and relaxation of residual stresses.
  • Imax has its limitation in interpreting cyclic hardening behaviour.
It is our goal to improve the hardware system as well as the data processing method in the future, in order to get a more robust process of dealing with the higher amount of data and to make the most of the derived butterfly curves, which offer the possibility of describing the entire fatigue life by means of magnetic Barkhausen noise. In addition to round specimens, flat specimens could also be investigated to make the best use of the features of MBN.

Author Contributions

Conceptualization, H.W. and P.S.; methodology, H.W. and S.R.R.; software, H.W. and S.R.R.; validation, H.W., J.A.Z., F.W.; formal analysis, H.W. and S.R.R.; investigation, J.A.Z. and S.R.R.; resources, T.H. and P.S.; data curation, H.W. and S.R.R.; writing—original draft preparation, H.W.; writing—review and editing, H.W., F.W., P.S., T.H.; visualization, H.W., F.W., J.A.Z.; supervision, P.S.; project administration, H.W.; funding acquisition, P.S. All authors have read and agreed to the published version of the manuscript.

Funding

This research was funded by German Research Foundation (Deutsche Forschungsgemeinschaft, DFG), grant number STA 1133/10-1).

Institutional Review Board Statement

Not applicable.

Informed Consent Statement

Not applicable.

Data Availability Statement

Not applicable.

Acknowledgments

The authors from the Department of Materials Science and Materials Testing (WWHK) would like to thank the German Research Foundation (Deutsche Forschungsgemeinschaft DFG) for the financial support of this research project (STA 1133/10-1). We also like to thank the University of Applied Sciences Kaiserslautern for providing financial support for the procurement of laboratory equipment (mechanical testing, Barkhausen noise, and microscopy) from internal university funds (Budget für Forschung und Innovation, BFI). Shimadzu Europe/Germany (tensile and fatigue testing devices) and EVIDENT Europe (digital and laser microscopes) supported the work by providing technical equipment.

Conflicts of Interest

The authors declare no conflict of interest.

References

  1. Basquin, O.H. The Exponential Law on Endurance Tests. ASTM Proc. 1910, 10, 625–630. [Google Scholar]
  2. Coffin, L.F. A Study of the Effects of Cyclic Thermal Stresses on a Ductile Metal. J. Fluids Eng. 1954, 76, 931–949. [Google Scholar] [CrossRef]
  3. Manson, S.S. Behavior of Materials under Conditions of Thermal Stress; Lewis Flight Propulsion Laboratory: Cleveland, OH, USA, 1953. [Google Scholar]
  4. Starke, P.; Walther, F.; Eifler, D. Model-Based Correlation between Change of Electrical Resistance and Change of Dislocation Density of Fatigued-Loaded ICE R7 Wheel Steel Specimens. Mater. Test. 2018, 60, 669–677. [Google Scholar] [CrossRef] [Green Version]
  5. Wu, H.; Bill, T.; Teng, Z.J.; Pramanik, S.; Hoyer, K.-P.; Schaper, M.; Starke, P. Characterization of the Fatigue Behaviour for SAE 1045 Steel without and with Load-Free Sequences Based on Non-Destructive, X-ray Diffraction and Transmission Electron Microscopic Investigations. Mater. Sci. Eng. A 2020, 794, 139597. [Google Scholar] [CrossRef]
  6. Klein, M.; Starke, P.; Nowak, D.; Boller, C.; Walther, F. Separation of Surface, Subsurface and Volume Fatigue Damage Effects in AISI 348 Steel for Power Plant Applications. Mater. Test. 2016, 58, 601–607. [Google Scholar] [CrossRef] [Green Version]
  7. Heckmann, K.; Sievers, J.; Schopf, T.; Lücker, L.; Schmiedt-Kalenborn, A.; Walther, F.; Starke, P.; Acosta, R.; Boller, C. Correlation of Load Drop and Crack Initiation Criteria in Fatigue Life Experiments of Metallic Materials. Eng. Fract. Mech. 2021, 251, 107785. [Google Scholar] [CrossRef]
  8. Stromeyer, C.E. The Determination of Fatigue Limits under Alternating Stress Conditions. Proc. R. Soc. London. Ser. A Contain. Pap. A Math. Phys. Character 1914, 90, 411–425. [Google Scholar] [CrossRef]
  9. Moore, H.F.; Kommers, J.B. An Investigation of the Fatigue of Metals. Univ. Illinois Bull. 1921, 19, 1–186. [Google Scholar]
  10. Morrow, J. Cyclic Plastic Strain Energy and Fatigue of Metals. In A Symposium Presented at the Sixty-Seventh Annual Meeting American Society for Testing and Materials, STP 378, Proceedings of the Sixty-seventh Annual Meeting American Society for Testing and Materials, Chicago, IL, USA, 21–26 June 1964; Lazan, B., Ed.; ASTM International: West Conshohocken, PA, USA, 1964; pp. 45–87. [Google Scholar]
  11. Reifsnider, K.L.; Williams, R.S. Determination of Fatigue-Related Heat Emission in Composite Materials. Exp. Mech. 1974, 14, 479–485. [Google Scholar] [CrossRef]
  12. Aeran, A.; Acosta, R.; Siriwardane, S.C.; Starke, P.; Mikkelsen, O.; Langen, I.; Walther, F. A Nonlinear Fatigue Damage Model: Comparison with Experimental Damage Evolution of S355 (SAE 1020) Structural Steel and Application to Offshore Jacket Structures. Int. J. Fatigue 2020, 135, 105568. [Google Scholar] [CrossRef]
  13. Starke, P.; Wu, H. Use of Non-Destructive Testing Methods in a New One-Specimen Test Strategy for the Estimation of Fatigue Data. Int. J. Fatigue 2018, 111, 177–185. [Google Scholar] [CrossRef]
  14. Schelp, M.; Eifler, D. Evaluation of the HCF-Behavior of 42CrMoS4 by Means of Strain, Temperature and Electrical Measurements. Mater. Sci. Eng. A 2001, 319–321, 652–656. [Google Scholar] [CrossRef]
  15. Fargione, G.; Geraci, A.; la Rosa, G.; Risitano, A. Rapid Determination of the Fatigue Curve by the Thermographic Method. Int. J. Fatigue 2002, 24, 11–19. [Google Scholar] [CrossRef]
  16. Doudard, C.; Calloch, S.; Hild, F.; Cugy, P.; Galtier, A. Identification of the Scatter in High Cycle Fatigue from Temperature Measurements. Comptes Rendus Mécanique 2004, 332, 795–801. [Google Scholar] [CrossRef] [Green Version]
  17. Eifler, D.; Piotrowski, A. Bewertung Zyklischer Verformungsvorgänge Metallischer Werkstoffe Mit Hilfe Mechanischer, Thermometrischer Und Elektrischer Meßverfahren Characterization of Cyclic Deformation Behaviour by Mechanical, Thermometrical and Electrical Methods. Mater. Werkst. 1995, 26, 121–127. [Google Scholar] [CrossRef]
  18. Dengel, D.; Harig, H. Estimation of The Fatigue Limit By Progressively-Increasing Load Tests. Fatigue Fract. Eng. Mater. Struct. 1980, 3, 113–128. [Google Scholar] [CrossRef]
  19. Teng, Z.; Wu, H.; Boller, C.; Starke, P. A Unified Fatigue Life Calculation Based on Intrinsic Thermal Dissipation and Microplasticity Evolution. Int. J. Fatigue 2020, 131, 105370. [Google Scholar] [CrossRef]
  20. Teng, Z.; Wu, H.; Boller, C.; Starke, P. Thermodynamic Entropy as a Marker of High-cycle Fatigue Damage Accumulation: Example for Normalized SAE 1045 Steel. Fatigue Fract. Eng. Mater. Struct. 2020, 43, 2854–2866. [Google Scholar] [CrossRef]
  21. Naderi, M.; Khonsari, M.M. An Experimental Approach to Low-Cycle Fatigue Damage Based on Thermodynamic Entropy. Int. J. Solids Struct. 2010, 47, 875–880. [Google Scholar] [CrossRef] [Green Version]
  22. Jang, J.Y.; Khonsari, M.M. On the Evaluation of Fracture Fatigue Entropy. Theor. Appl. Fract. Mech. 2018, 96, 351–361. [Google Scholar] [CrossRef]
  23. Corigliano, P.; Cucinotta, F.; Guglielmino, E.; Risitano, G.; Santonocito, D. Fatigue Assessment of a Marine Structural Steel and Comparison with Thermographic Method and Static Thermographic Method. Fatigue Fract. Eng. Mater. Struct. 2020, 43, 734–743. [Google Scholar] [CrossRef]
  24. Hayabusa, K.; Inaba, K.; Ikeda, H.; Kishimoto, K. Estimation of Fatigue Limits from Temperature Data Measured by IR Thermography. Exp. Mech. 2017, 57, 185–194. [Google Scholar] [CrossRef]
  25. De Finis, R.; Palumbo, D.; Galietti, U. Fatigue Damage Analysis of Composite Materials Using Thermography-Based Techniques. Procedia Struct. Integr. 2019, 18, 781–791. [Google Scholar] [CrossRef]
  26. Tuo, H.; Wu, T.; Lu, Z.; Ma, X. Evaluation of Damage Evolution of Impacted Composite Laminates under Fatigue Loadings by Infrared Thermography and Ultrasonic Methods. Polym. Test. 2021, 93, 106869. [Google Scholar] [CrossRef]
  27. Altpeter, I.; Becker, R.; Dobmann, G.; Kern, R.; Theiner, W.; Yashan, A. Robust Solutions of Inverse Problems in Electromagnetic Non-Destructive Evaluation. Inverse Probl. 2002, 18, 1907–1921. [Google Scholar] [CrossRef]
  28. Bjørheim, F.; Siriwardane, S.C.; Pavlou, D. A Review of Fatigue Damage Detection and Measurement Techniques. Int. J. Fatigue 2022, 154, 106556. [Google Scholar] [CrossRef]
  29. Seeger, A. The Effect of Dislocations on the Magnetization Curves of Ferromagnetic Crystals. J. Phys. Colloq. 1966, 27, 68–77. [Google Scholar] [CrossRef]
  30. Taylor, R.A.; Jakubovics, J.P.; Astié, B.; Degauque, J. Direct Observation of the Interaction between Magnetic Domain Walls and Dislocations in Iron. J. Magn. Magn. Mater. 1983, 31–34, 970–972. [Google Scholar] [CrossRef]
  31. Rastogi, P. Effect of Manganese and Sulfur on the Texture and Magnetic Properties of Non-Oriented Steel. IEEE Trans. Magn. 1977, 13, 1448–1450. [Google Scholar] [CrossRef]
  32. Ranjan, R.; Jiles, D.; Rastogi, P. Magnetic Properties of Decarburized Steels: An Investigation of the Effects of Grain Size and Carbon Content. IEEE Trans. Magn. 1987, 23, 1869–1876. [Google Scholar] [CrossRef]
  33. Batista, L.; Rabe, U.; Altpeter, I.; Hirsekorn, S.; Dobmann, G. On the Mechanism of Nondestructive Evaluation of Cementite Content in Steels Using a Combination of Magnetic Barkhausen Noise and Magnetic Force Microscopy Techniques. J. Magn. Magn. Mater. 2014, 354, 248–256. [Google Scholar] [CrossRef]
  34. Pérez-Benítez, J.A.; Espina-Hernández, J.H.; Martínez-Ortiz, P. Unwrapping the Influence of Multiple Parameters on the Magnetic Barkhausen Noise Signal Using Self-Organizing Maps. NDT E Int. 2013, 54, 166–170. [Google Scholar] [CrossRef]
  35. Sheikh Amiri, M.; Thielen, M.; Rabung, M.; Marx, M.; Szielasko, K.; Boller, C. On the Role of Crystal and Stress Anisotropy in Magnetic Barkhausen Noise. J. Magn. Magn. Mater. 2014, 372, 16–22. [Google Scholar] [CrossRef]
  36. Kasai, N.; Koshino, H.; Sekine, K.; Kihira, H.; Takahashi, M. Study on the Effect of Elastic Stress and Microstructure of Low Carbon Steels on Barkhausen Noise. J. Nondestr. Eval. 2013, 32, 277–285. [Google Scholar] [CrossRef]
  37. Pal’a, J.; Stupakov, O.; Bydžovský, J.; Tomáš, I.; Novák, V. Magnetic Behaviour of Low-Carbon Steel in Parallel and Perpendicular Directions to Tensile Deformation. J. Magn. Magn. Mater. 2007, 310, 57–62. [Google Scholar] [CrossRef]
  38. Karjalainen, L.P.; Moilanen, M. Detection of Plastic Deformation during Fatigue of Mild Steel by the Measurement of Barkhausen Noise. NDT Int. 1979, 12, 51–55. [Google Scholar] [CrossRef]
  39. Karjalainen, L.; Moilanen, M. Fatigue Softening and Hardening in Mild Steel Detected from Barkhausen Noise. IEEE Trans. Magn. 1980, 16, 514–517. [Google Scholar] [CrossRef]
  40. Lachmann, C.; Nitschke-Pagel, T.; Wohlfahrt, H. Charakterisierung Des Ermüdungszustandes in Zyklisch Beanspruchten Schweißverbindungen Durch Röntgenographische Und Mikromagnetische Kenngrößen. Mater. Werkst. 1998, 29, 686–693. [Google Scholar] [CrossRef]
  41. Sagar, S.; Parida, N.; Das, S.; Dobmann, G.; Bhattacharya, D. Magnetic Barkhausen Emission to Evaluate Fatigue Damage in a Low Carbon Structural Steel. Int. J. Fatigue 2005, 27, 317–322. [Google Scholar] [CrossRef]
  42. Palma, E.S.; Mansur, T.R.; Silva, S.F.; Alvarenga, A. Fatigue Damage Assessment in AISI 8620 Steel Using Barkhausen Noise. Int. J. Fatigue 2005, 27, 659–665. [Google Scholar] [CrossRef]
  43. Baak, N.; Schaldach, F.; Nickel, J.; Biermann, D.; Walther, F. Barkhausen Noise Assessment of the Surface Conditions Due to Deep Hole Drilling and Their Influence on the Fatigue Behaviour of AISI 4140. Metals 2018, 8, 720. [Google Scholar] [CrossRef] [Green Version]
  44. Baak, N.; Nickel, J.; Biermann, D.; Walther, F. Barkhausen Noise-Based Fatigue Life Prediction of Deep Drilled AISI 4140. Procedia Struct. Integr. 2019, 18, 274–279. [Google Scholar] [CrossRef]
  45. Starke, P.; Eifler, D. Fatigue Assessment and Fatigue Life Calculation of Metals on the Basis of Mechanical Hysteresis, Temperature, and Resistance Data. Mater. Test. 2009, 51, 261–268. [Google Scholar] [CrossRef]
  46. Weber, F.; Acosta, R.; Eyrisch, T.; Hielscher, T.; Magin, M.; Starke, P. Influence of Processing Parameters on the Fatigue Life Time of Specimens Made from Quenched and Tempered Steel SAE 4140H. Mater. Test. 2019, 61, 842–850. [Google Scholar] [CrossRef]
  47. Starke, P. StressLifetc—NDT-Related Assessment of the Fatigue Life of Metallic Materials. Mater. Test. 2019, 61, 297–303. [Google Scholar] [CrossRef]
  48. Wu, H.; Bäumchen, A.; Engel, A.; Acosta, R.; Boller, C.; Starke, P. SteBLife—A New Short-Time Procedure for the Evaluation of Fatigue Data. Int. J. Fatigue 2019, 124, 82–88. [Google Scholar] [CrossRef]
Figure 1. Micrographs of (a) SAE 1020 and (b) SAE 5120 in normalized condition.
Metals 12 01838 g001
Figure 2. Dimensions of the applied fatigue specimen.
Metals 12 01838 g002
Figure 3. The applied fatigue testing system with measuring techniques.
Metals 12 01838 g003
Figure 4. Schematic load-cycle procedures with an emblematic material response for continuously conducted (a) load increase test (LIT) and (b) constant amplitude test (CAT) as well as for tests with inserted load-free sequences: (c) LIT and (d) CAT, along with (e) the positions of the inserted load-free sequences.
Metals 12 01838 g004
Figure 5. Results of LIT on SAE 1020 steel in normalized conditions conducted with a starting stress amplitude of 100 MPa and a staircase-shaped increase of 20 MPa after every ΔN = 6000.
Metals 12 01838 g005
Figure 6. Results of LIT on SAE 5120 steel in normalized condition conducted with a starting stress amplitude of 100 MPa and a staircase-shaped increase of 20 MPa after every ΔN = 6000.
Metals 12 01838 g006
Figure 7. Cyclic deformation curves extracted from various CATs regarding (a) the change in temperature and (b) the maximum signal intensity of the magnetic Barkhausen noise at each load-free sequence for SAE 1020 in a normalized condition.
Metals 12 01838 g007
Figure 8. Cyclic deformation curves extracted from various CATs regarding (a) the change in temperature (2 × 270 MPa, 2 × 260 MPa, 2 × 252 MPa, 1 × 246 MPa) and (b) the maximum signal intensity of the magnetic Barkhausen noise at each pause for SAE 5120 in a normalized condition.
Metals 12 01838 g008
Figure 9. Development of the MBN butterfly curves during LITs on (a) SAE 1020 and (b) SAE 5120 in the normalized condition. The MBN signal intensity IMBN with an arbitrary unit is plotted against the excitation coil voltage in mV. For each load-free sequence shown here, a cluster of three butterfly curves overlapped.
Metals 12 01838 g009
Table 1. Chemical composition of SAE 1020 and SAE 5120: values according to DIN standards as benchmarks for producer’s information and own analysis.
Material CSiMnPSCrMoNi
SAE 1020DIN EN 10083-20.17–0.24≤0.40.40–0.70≤0.0300.020–0.040≤0.40≤0.10≤0.40
Producer0.210.240.460.0130.0230.120.0130.12
Own analysis (+N)0.2360.2870.4800.0140.0180.1180.0140.114
SAE 5120DIN EN 100840.17–0.22≤0.41.10–1.40≤0.0250.020–0.0401.00–1.30--
Producer0.180.241.230.0150.0261.050.0220.10
Own analysis (+N)0.1950.2731.3140.0160.0241.0600.0240.093
Publisher’s Note: MDPI stays neutral with regard to jurisdictional claims in published maps and institutional affiliations.

