Article

Heat Treatment Design for a QP Steel: Effect of Partitioning Temperature

1
Departament de Ciència i Enginyeria de Materials (CEM), EEBE, Campus Diagonal Besòs, Univesitat Politècnica de Catalunya, Av. Eduard Maristany 10-14, 08019 Barcelona, Spain
2
TERNIUM México, Av. Universidad 992 Nte., Col. Cuauhtémoc, San Nicolás de los Garza 66450, Mexico
*
Author to whom correspondence should be addressed.
Metals 2021, 11(7), 1136; https://doi.org/10.3390/met11071136
Submission received: 3 June 2021 / Revised: 8 July 2021 / Accepted: 13 July 2021 / Published: 19 July 2021
(This article belongs to the Special Issue Heat Treatment of Steels)

Abstract

:
Designing a new family of advanced high-strength steels (AHSSs) to develop automotive parts that cover early industry needs is the aim of many investigations. One of the candidates in the 3rd family of AHSS are the quenching and partitioning (QP) steels. These steels display an excellent relationship between strength and formability, making them able to fulfill the requirements of safety, while reducing automobile weight to enhance the performance during service. The main attribute of QP steels is the TRIP effect that retained austenite possesses, which allows a significant energy absorption during deformation. The present study is focused on evaluating some process parameters, especially the partitioning temperature, in the microstructures and mechanical properties attained during a QP process. An experimental steel (0.2C-3.5Mn-1.5Si (wt%)) was selected and heated according to the theoretical optimum quenching temperature. For this purpose, heat treatments in a quenching dilatometry and further microstructural and mechanical characterization were carried out by SEM, XRD, EBSD, and hardness and tensile tests, respectively. The samples showed a significant increment in the retained austenite at an increasing partitioning temperature, but with strong penalization on the final ductility due to the large amount of fresh martensite obtained as well.

1. Introduction

In order to improve automobile performance, the automotive industry is continuously developing new steels aiming at reducing the automobile’s weight while enhancing the passenger’s safety. Accordingly, new families of advanced high-strength steels (AHSSs) are constantly being proposed and analyzed. Very promising candidates are the so-called quenching and partitioning (QP) steels because they exhibit a good combination of strength and formability [1]. These steels are based on the QP process which was first proposed by Speer et al. [2,3]. They were developed to create thin steel sheets with different fractions of martensite and retained austenite. Basically, the process implies a partial or full austenitization treatment followed by a quenching step between the martensite start (Ms) and martensite finish (Mf) temperatures to control the fractions of untransformed austenite and martensite. The martensitic transformation is diffusionless, so the martensite has the same composition as its parent austenite. Subsequently, a sort of annealing (usually called partitioning) treatment is applied where the carbon in the supersaturated martensite starts to diffuse into the untransformed austenite. This step enhances carbon enrichment in the austenite which, in turn, might be stabilized at room temperature. In the subsequent quenching, fresh martensite and untransformed austenite can be obtained. Throughout the entire QP process (see Figure 1), and particularly during the partitioning treatment, the selection of an appropriate chemical composition is essential to avoid competing and undesirable reactions such as the formation of pearlite, bainitic structures, and carbide precipitation. On the other hand, the lack of carbon enrichment in the gamma phase may result in an unstable austenite that may promote the formation of too much fresh martensite during the final quenching step at the end of the process [4,5,6,7,8].
The final aim of the QP process is to obtain an appropriate combination of mechanical properties as a result of a controlled microstructure formed by tempered and fresh martensite and a carbon-enriched retained austenite, avoiding or minimizing the decomposition of austenite into other secondary microstructures during the final quenching step. In addition, ferrite can also be present in the QP process by partial austenization (austenitization at intercritical temperatures). Accordingly, plenty of microconstituents (ferrite, bainite, retained austenite, fresh martensite, tempered martensite) with their respective mechanical properties can be achieved at the end of this novel heat treatment. Particularly, the retained austenite in QP steels plays a major role as it provides a transformation-induced plasticity (TRIP) effect, associated with the transformation of the austenite into martensite as a result of local deformation, thus contributing to enhancing the formability and energy absorption of the steel [9,10,11,12,13].
Normally, different alloying elements are considered in the design of QP steels, although the most usual grades are based on the C-Si-Mn and C-Si-Mn-Al systems, with carbon being the main element [6]. Moreover, the addition of other alloying elements such as Si, Al, and P plays an important role by delaying the carbide formation [2,9,12]. On the other hand, several studies have reported the immobility of substitutional elements during the partitioning step as a result of typical low partitioning temperatures, in the range of 350–450 °C. Therefore, the diffusion of these elements through martensite and austenite can be considered negligible [14,15]. However, their role as alloying elements is more pronounced in the initial austenitization temperatures. It is well known, for example, that Mn additions may enhance the austenite stabilization while decreasing the Ms temperature [4,7,12,15,16,17,18,19,20,21,22].
The present work aims at designing an optimal QP process. For this purpose, a 0.2%C–1.5%Si steel was used with 3.5 wt% manganese. In order to design an optimal thermal cycle, the critical temperatures and continuous cooling transformation diagram of the steel were determined using a quenching dilatometry, which was also used to apply the designed QP cycles in the laboratory. The final microstructure for each condition was characterized by a scanning electron microscope (SEM), X-ray diffraction (XRD), and electron backscatter diffraction (EBSD). This was correlated with the mechanical properties in terms of hardness and tensile tests.

2. Materials and Methods

The chemical composition of the QP steel selected in this study is given in Table 1. The amount of Mn is expected to enhance the stabilization of austenite while retarding the formation of secondary microstructures at the quenching stage. The addition of Si is commonly used to avoid carbide precipitation during the partitioning treatment. A laboratory ingot was cast after vacuum induction melting. The ingot was subsequently homogenized and hot rolled to obtain an approximately 7 mm thick sheet, followed by air cooling to room temperature.
The austenite transformation temperatures, as well as the temperatures corresponding to the martensitic transformation, were obtained by dilatometry. For this purpose, cylindrical samples of 10 mm in length and 4 mm in diameter were machined parallel along the rolling direction of the steel plate and heat treated in a DIL 805A/D (TA Instruments, New Castle, DE, USA) quenching dilatometer. Samples were austenitized up to 1100 °C at a heating rate of 10 °C/s and held for 1 min to ensure a full homogenization. After austenitization, a direct quenching was applied at a cooling rate of 50 °C/s to room temperature.
Continuous cooling transformation (CCT) diagrams were also obtained by dilatometry using the previously mentioned cylindrical samples according to the following set of experiments: austenization at 920 °C at a heating rate of 10 °C/s and held for 1 min, followed by cooling down to room temperature at different cooling rates, namely: 100, 50, 20, 10, 5, 1, and 0.1 °C/s.
In order to design an appropriate QP process, the methodology developed by Speer et al. [2] was used to find the optimal quenching temperature, after which the maximum retained austenite could be attained. The theoretical model was based on the constrained carbon equilibrium, considering a full partitioning of carbon between martensite and austenite, ignoring the partitioning kinetics, and avoiding carbide precipitation or bainite formation. It was also assumed that substitutional atoms cannot diffuse at the partitioning temperatures [2,5,7,9,13,23,24,25,26].
The model predicts the fraction of martensite and untransformed austenite at the quenching temperature (QT) during an undercooling below Ms, based on the Koistinen–Marburger (K-M) [2,5,9,23,27] relationship:
F m = 1 e α ( M s QT ) ,
where Fm corresponds to the austenite fraction which transforms into martensite during a quenching treatment at QT, below the Ms temperature, and α corresponds to a rate parameter. For the present research, α and Ms (as-quenched martensite) were obtained by following the methodology reported in [28], with α being equal to −1.1 × 10⁻². A typical representative plot of the estimated variation in microstructure according to the theoretical model is shown in Figure 2. The bold solid line represents the maximum fraction of austenite as a function of QT and the optimal quenching temperature can be depicted as the QT for which the maximum austenite fraction can be obtained. The solid lines show the martensite (M) and austenite (γ) fraction during the first quenching temperature condition, as the dash-dotted line represents the fraction of martensite (as-quenched) that forms during the final quenching step, and the dashed line the estimated carbon content of the austenite [5].
In consequence, once the experimental critical temperatures are known, and the corresponding diagram of Figure 2 is obtained for a given steel, a physical simulation of the QP industrial process can be performed. The QP route designed here is illustrated in Figure 3. The heat treatments of this physical simulation were carried out by dilatometry in the cylindrical samples previously mentioned. First a full austenitization at 920 °C for 60 s was carried out and followed by quenching at 50 °C/s to the optimal temperature (as will be shown later, this temperature was 261 °C). Then, a partitioning treatment was applied at TP1 = Ms, TP2 = TP1 + 50 °C, and TP3 = TP2 + 50 °C for a partitioning time (tp) of 100 s, prior to a final quench to room temperature. The value of tp was selected as one closer to real industrial facilities. In consequence, the current study verified the effect of the partitioning temperature. Samples from this thermal cycle were named QP-x, where x stands for the TP involved.
The as-received samples, and those from the CTT experiments and physical simulation, were analyzed by SEM, (JEOL USA Inc., MA, USA), EBSD (Oxford instruments, Abingdon, UK), and XRD (Malvern Panalytical Ltf, Malvern, UK). EBSD (Oxford instruments, Abingdon, UK) and XRD were used in order to identify and measure the amount of retained austenite at the different Q&P conditions. For observation purposes, samples were mechanically ground with abrasive papers followed by a final precision polishing step until 1 μm. EBSD samples were further polished with a 0.03 µm colloidal silica suspension. Microstructure characterization by JEOL JSM-70001F scanning electron microscope (JEOL USA Inc., MA, USA) was carried out after nital (2% nitric acid and ethanol) etching. EBSD scans on the physical simulation samples were performed using a 30 nm step size and 20 kV in a JEOL JSM-70001F scanning electron microscope (JEOL USA Inc., MA, USA) and EBSD detector Oxford Instruments HKL Nordlys (Oxford instruments, Abingdon, UK) using HKL Channel 5 software (A/S 2007, Oxford Instruments HKL, Hobro, Denmark) for data processing. It has been reported that the size of retained austenite found between martensite blocks is around 20–100 nm, therefore the EBSD analysis cannot detect such small retained austenite particles, due to the technique’s limitations (spatial resolution of 0.08 µm). Instead, an alternative measurement by XRD was also performed [29,30]. XRD analyses were executed in a PANalytical X’Pert PRO MPD diffractometer (Malvern Panalytical Ltf, Malvern, UK) with CuKα, using a secondary graphite flat crystal monochromator operated at 45 kV and 40 mA. The 2 θ range was 30° to 125° with a step size of 0.017° and a measuring time of 125 s per step. The fraction of retained austenite in each condition was quantified using MAUD software and Rietveld analysis [31]. Finally, using the XRD spectra, the carbon content in austenite was calculated using the following expression [32]:
a γ = 3.555 + 0.044 x c ,
where a γ is the lattice parameter of austenite in Angstroms (Å) and xc is the average carbon amount in weight percentage. The average lattice parameter was obtained from the (220) and (311) austenite peaks of the XRD diagrams.
In order to measure the mechanical properties, tensile tests were performed in each QP condition. Tensile flat samples of 10 mm in gauge length and 5 mm in gauge width were subjected to each QP treatment in the quenching dilatometer. The tensile samples were used according to the standard. In addition, the fracture surface of each condition was analyzed by SEM after the tensile test. The tensile tests were carried out in an Instron 100kN 4507 universal testing machine frame (Instron, MA, USA) with hydraulic grips at room temperature with a cross-head speed of 2 mm/min. Deformation was recorded by a Basler Ace 5 MegaPixels camera and data were registered by Vic-Gauge 2D Digital Image Correlation software (V6, Correlated Solutions, SC, USA). Hardness measurements were taken in an Akashi MVK-HO Vickers (Mitutoyo, Kanagawa, JP) hardness tester with a 1 Kg applied load for 15 s. In doing so, 9 measurements were taken for each sample to obtain the average hardness.

3. Results and Discussion

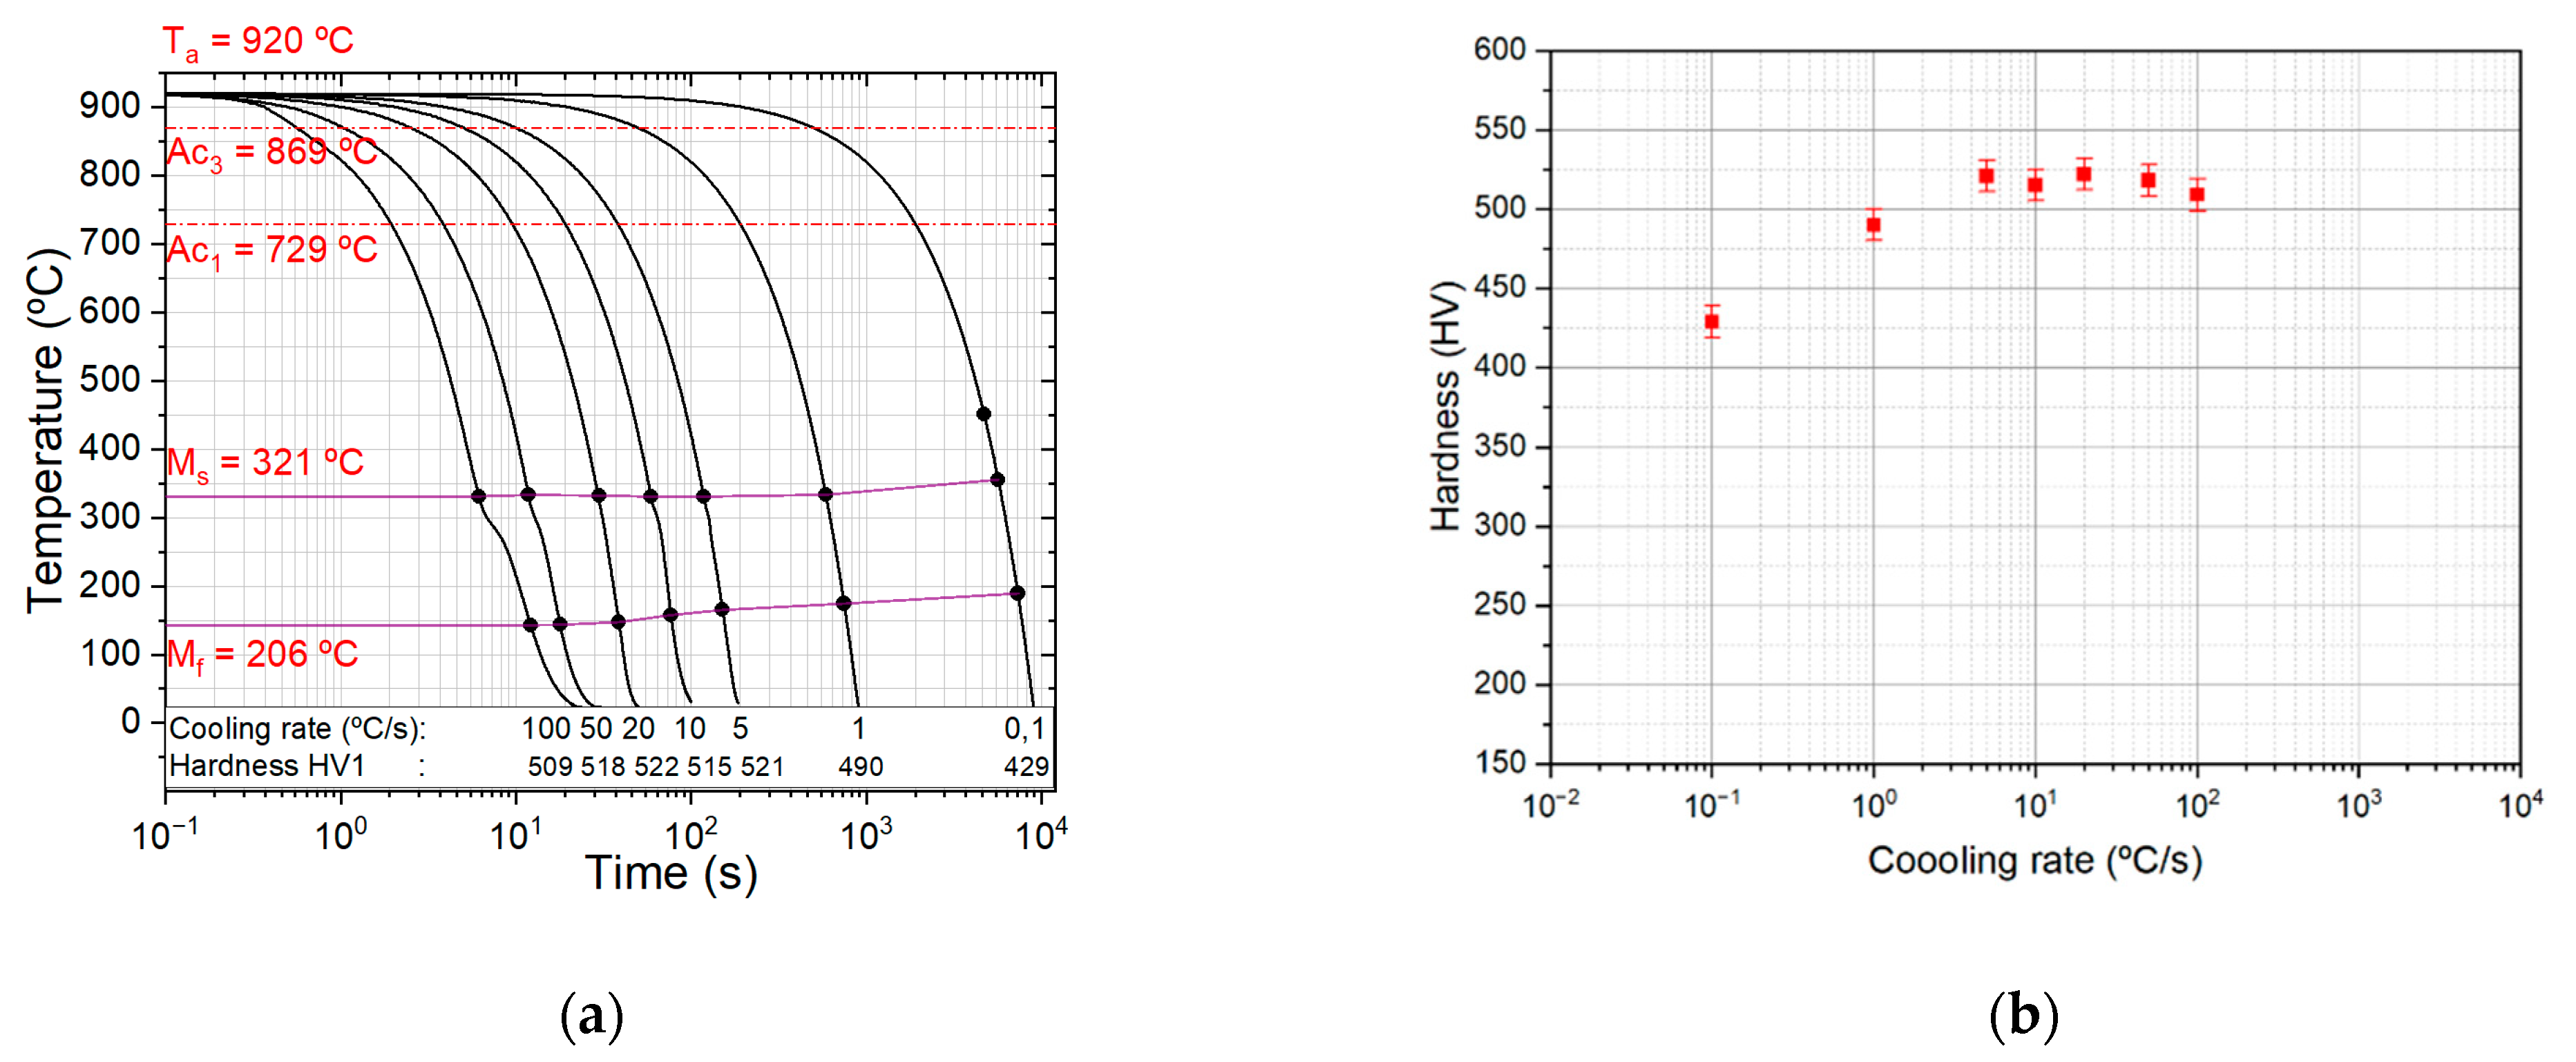
3.1. Dilatometric Study

The experimental critical transformation temperatures Ac1, Ac3, Ms, and Mf obtained by dilatometry are listed in Table 2. As expected, the addition of Mn significantly reduces the critical transformation temperatures, validating the stabilizing effect of this element on the austenitic phase [33]. According to the results, the experimental CCT diagram was constructed as illustrated in Figure 4. As shown in Figure 4a, a full martensitic microstructure is reached even at cooling rates as low as 5 °C/s due to the good hardenability, as a result of the addition of Mn that suppresses the formation of allotriomorphic ferrite and perlite [34]. However, the slowest cooling rate (0.1 °C/s) showed the presence of a secondary microstructure (e.g., bainite) at 450 °C [35]. On the other hand, the hardness measurements in the CCT conditions (Figure 4b) show that for cooling rates lower than 0.1 °C/s, a hardness of 429 HV can be achieved, while increasing the cooling rate enhanced the hardness and it reached a value of about 509 HV.

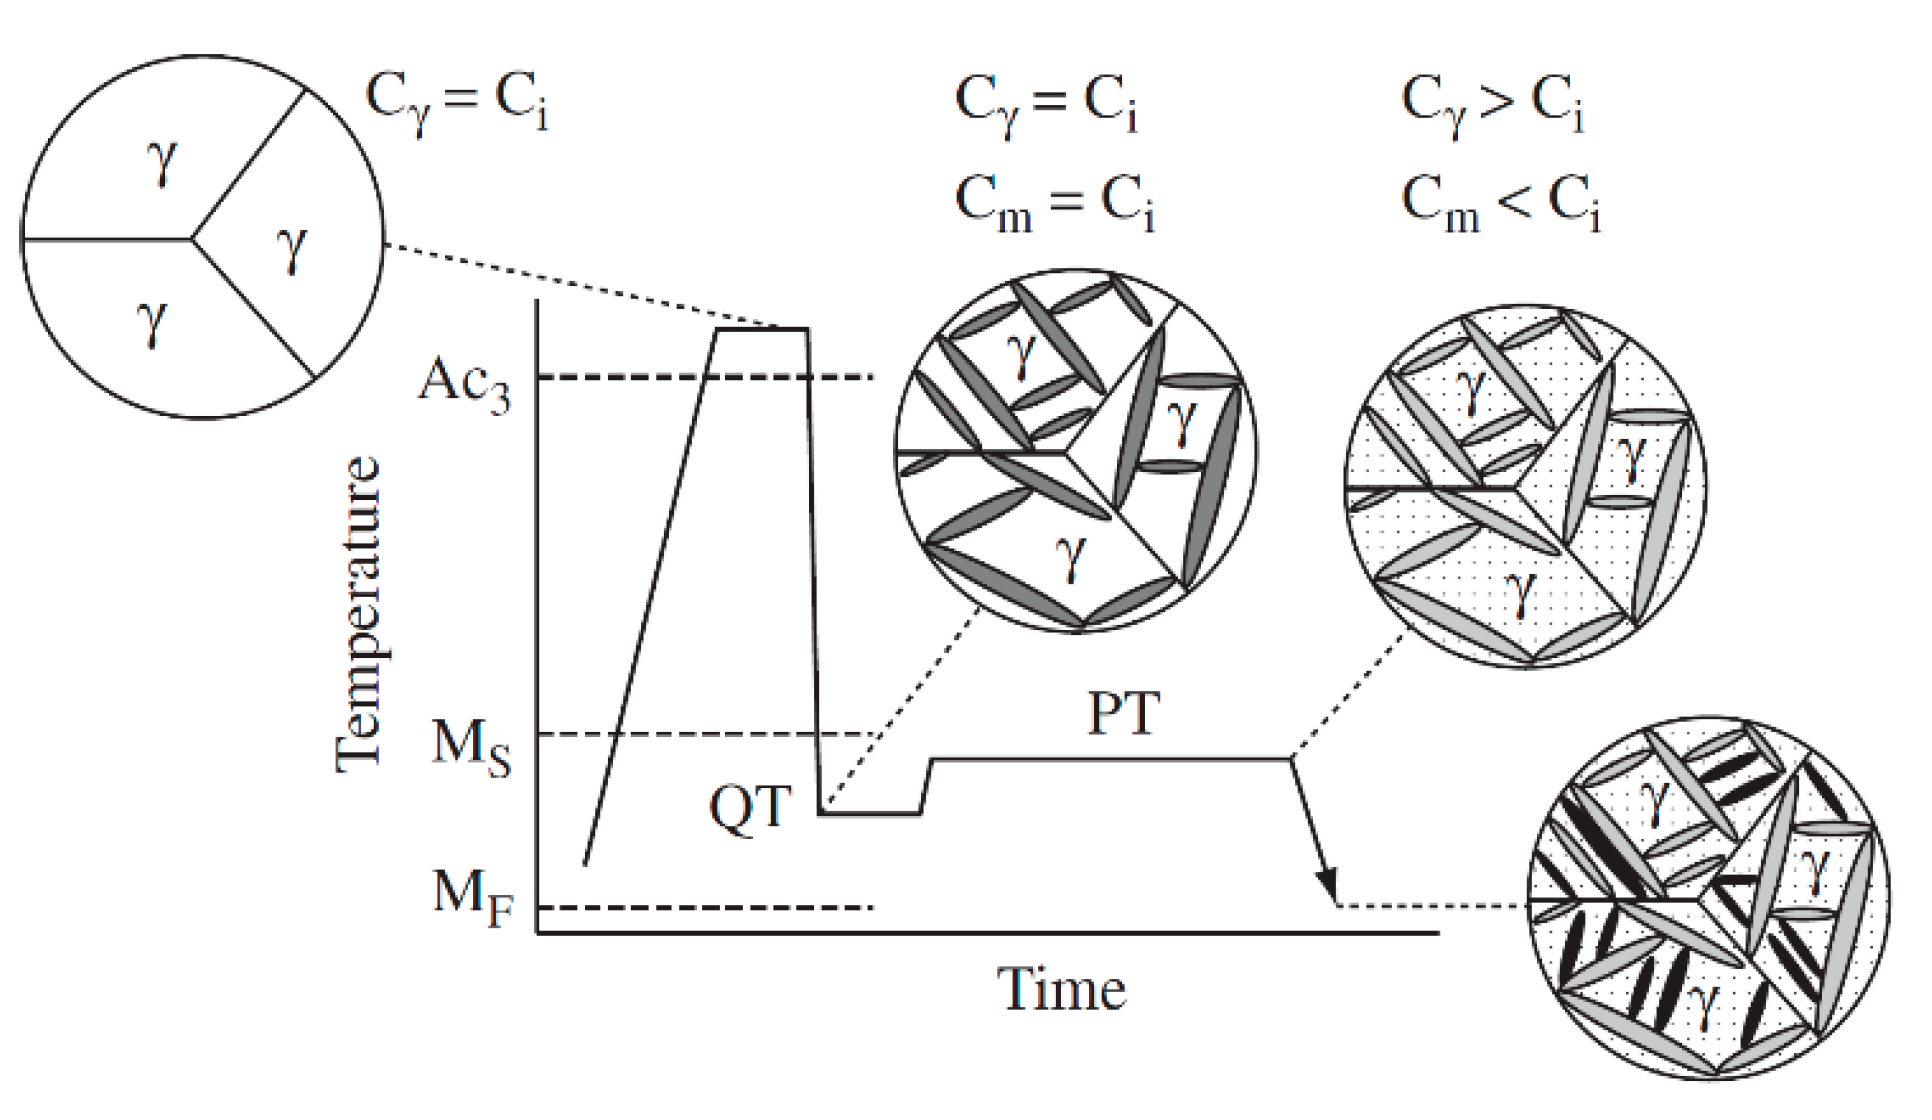
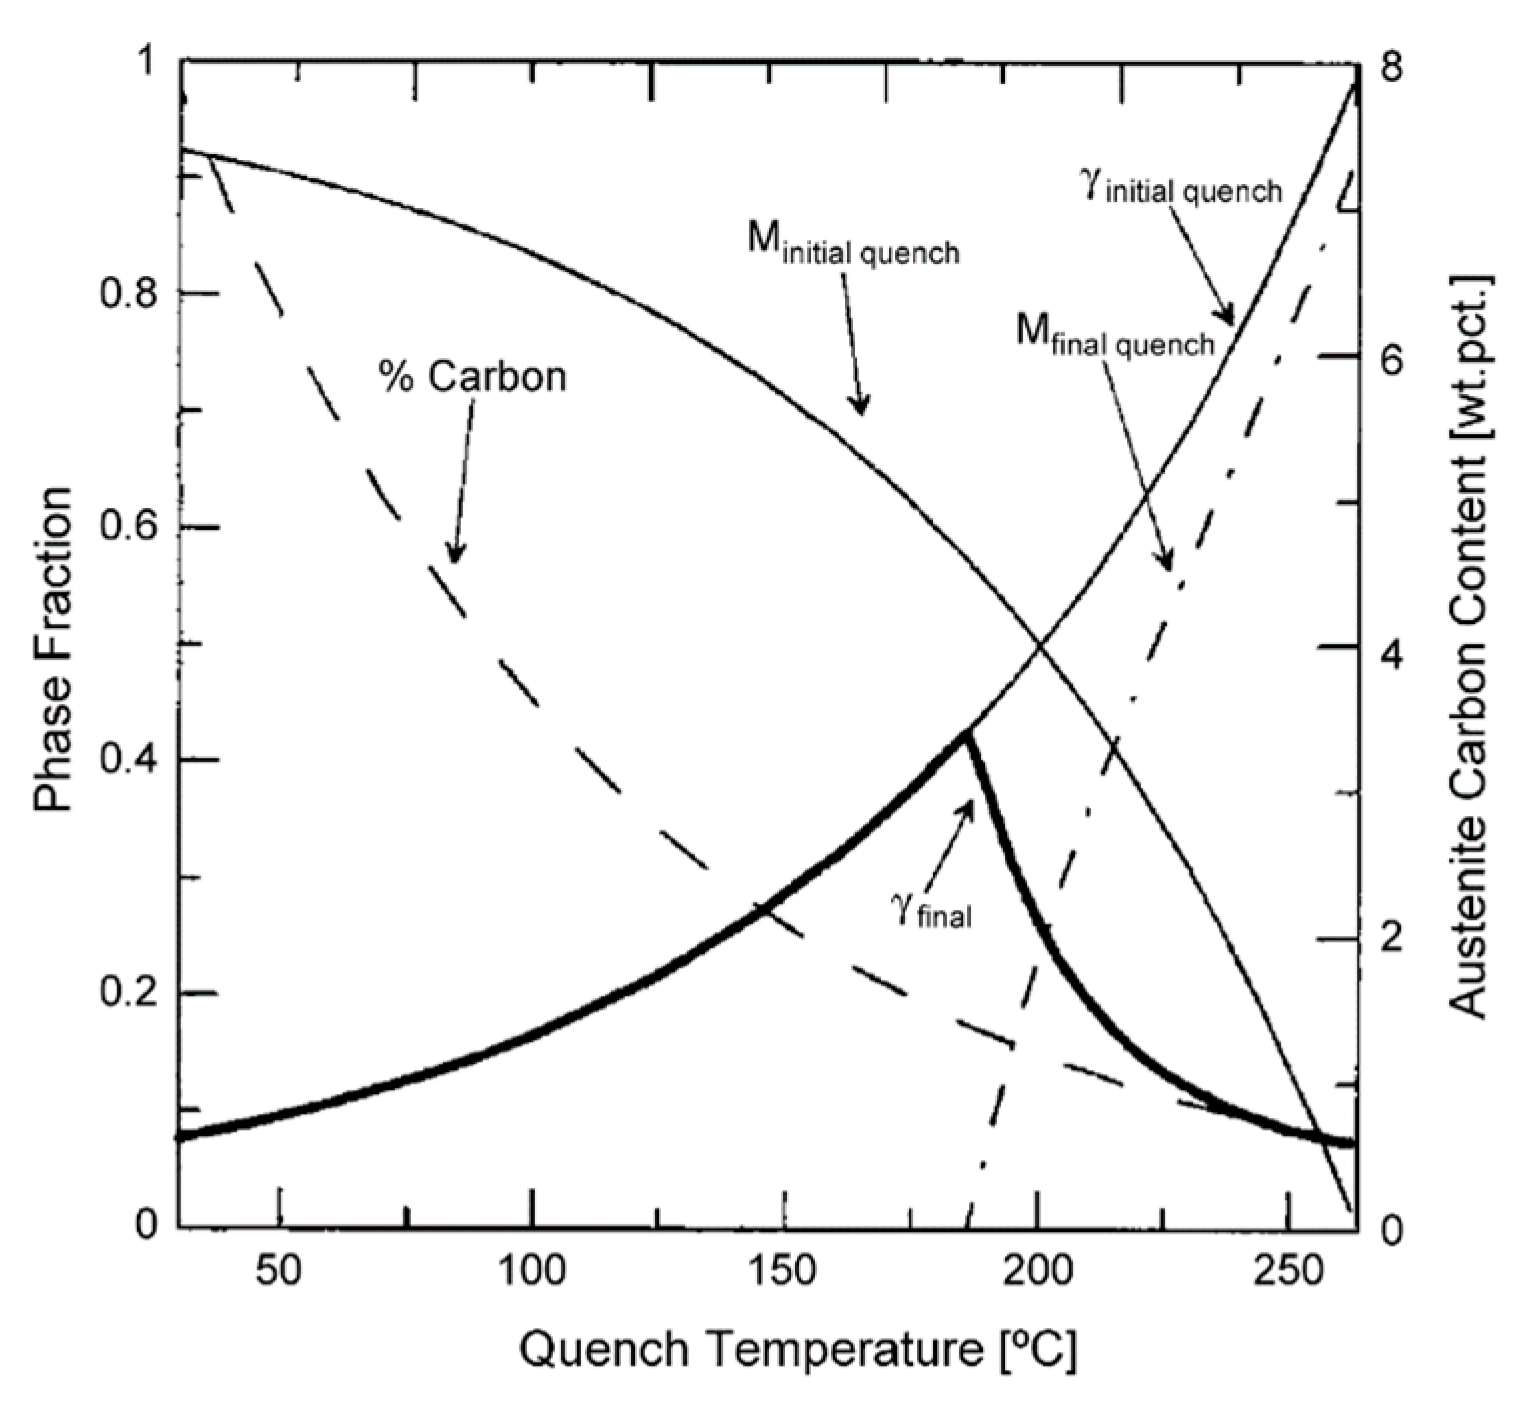
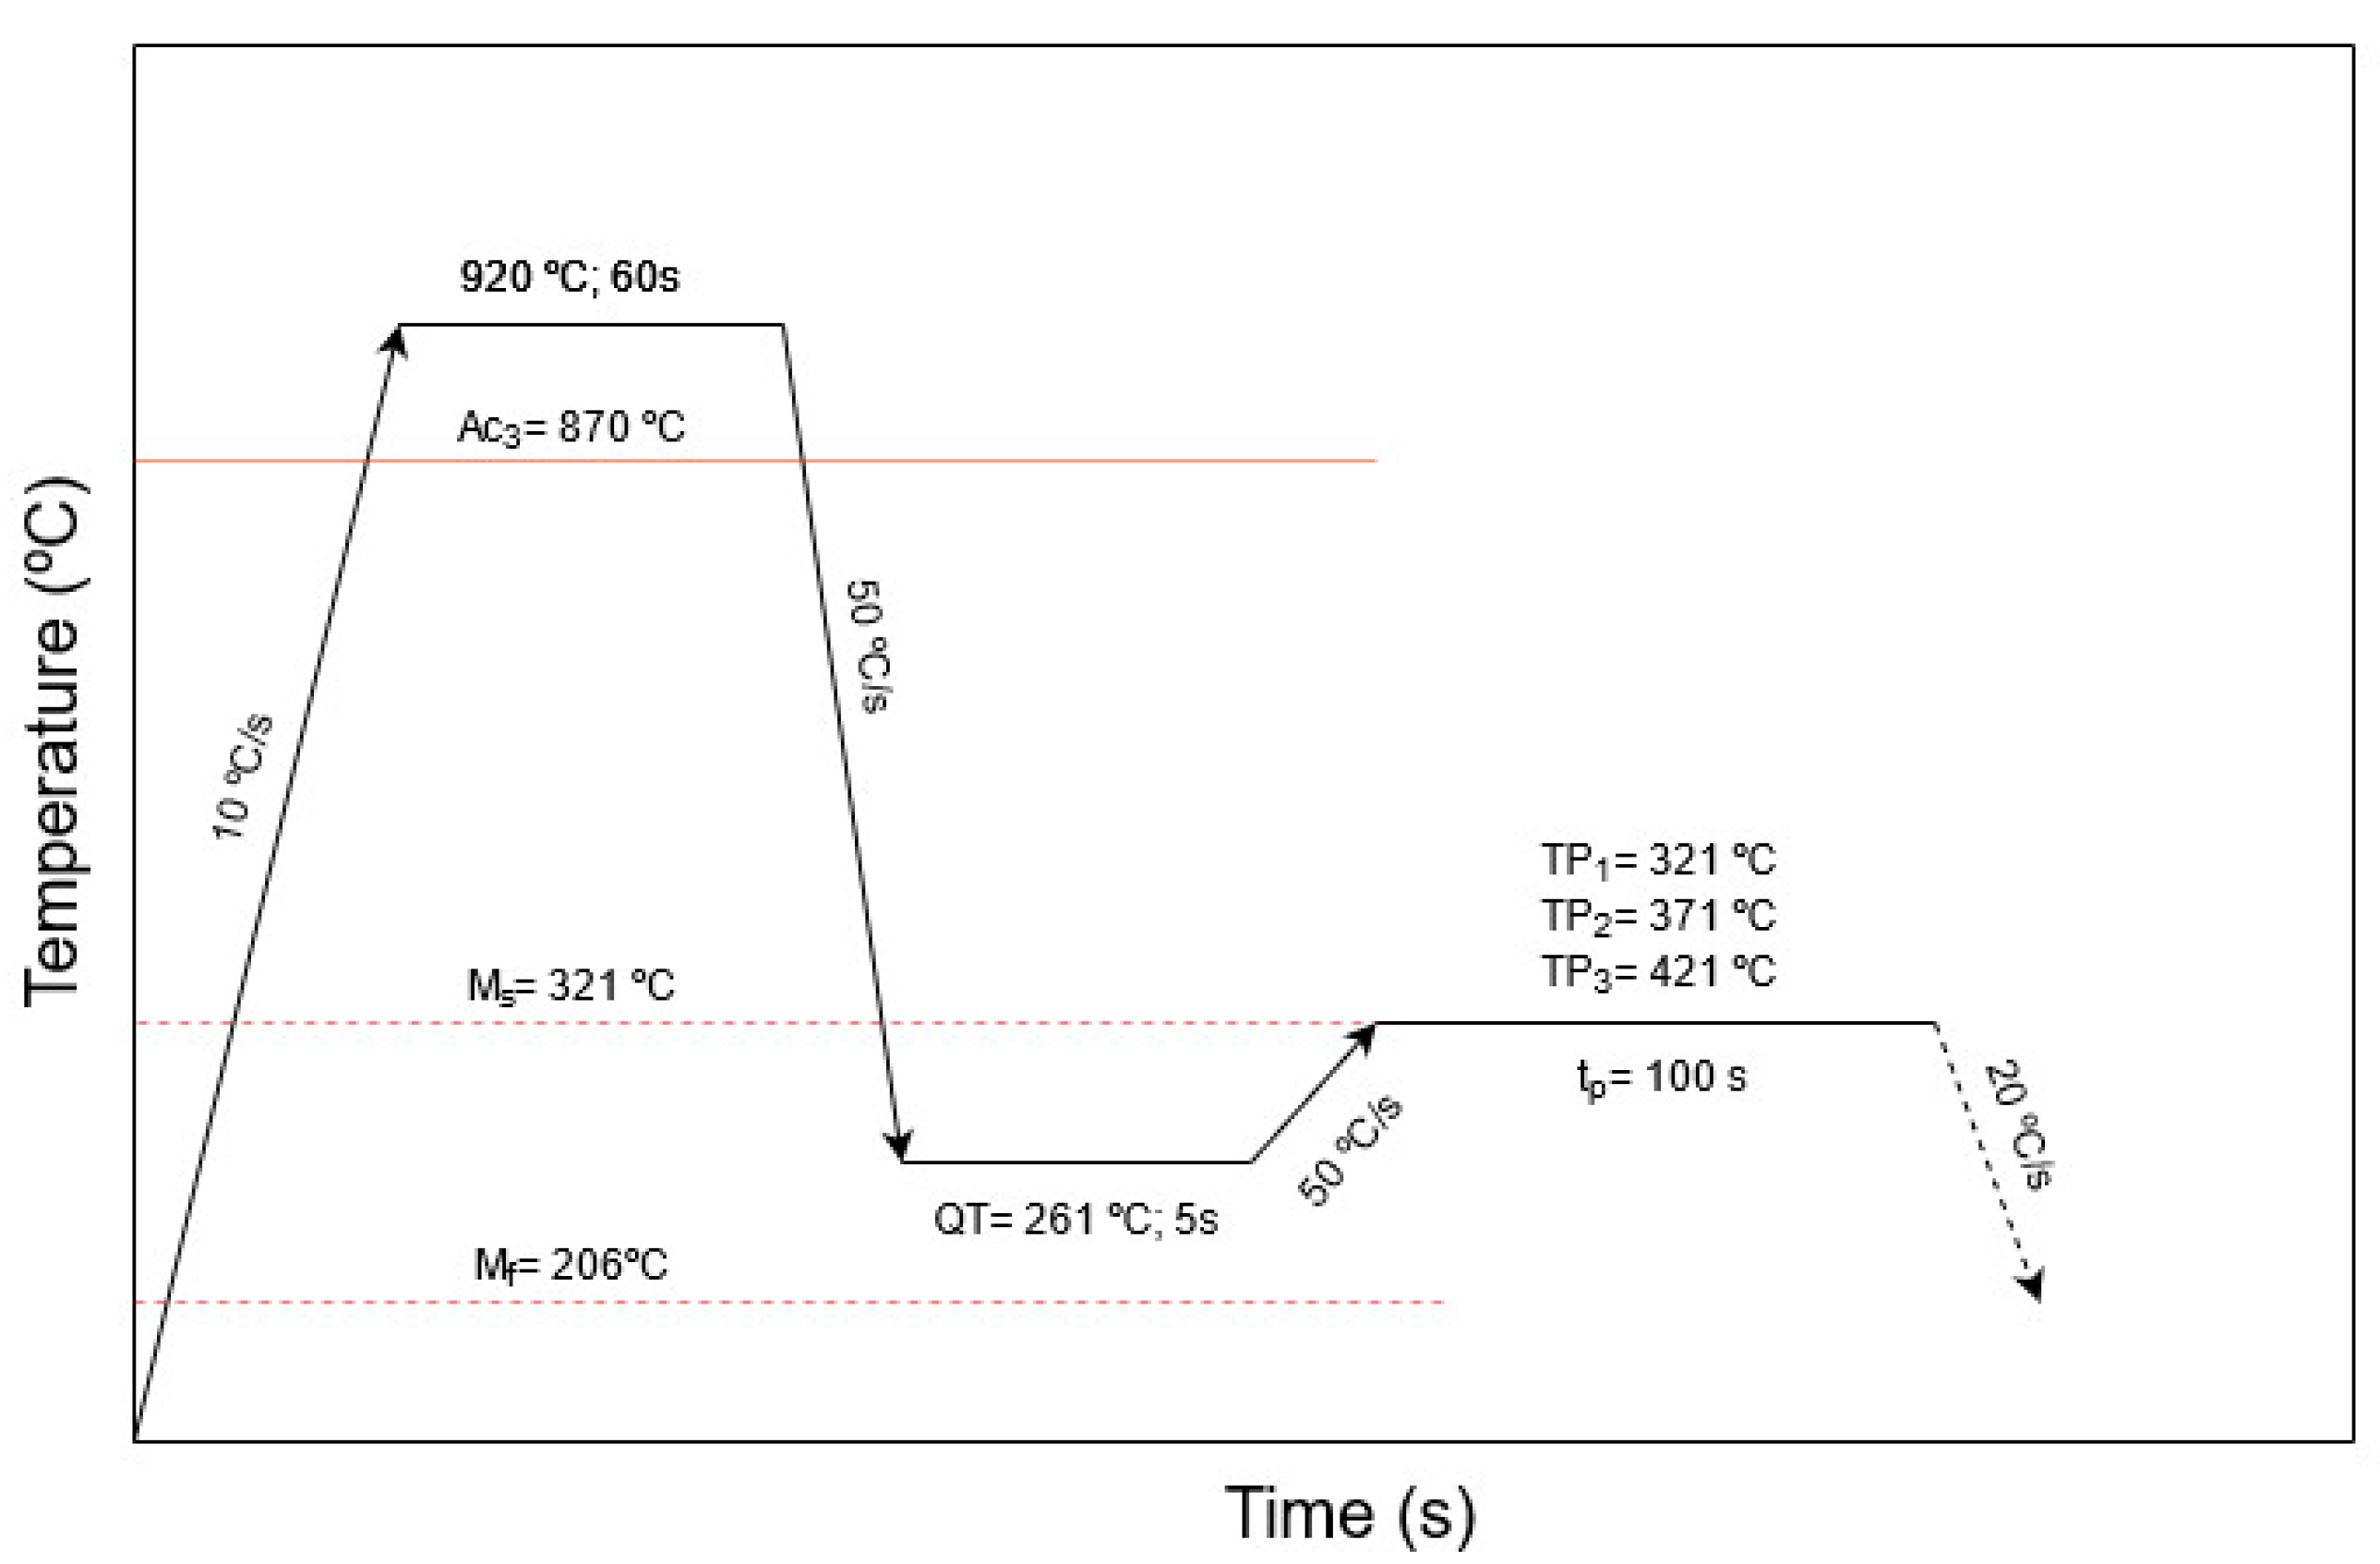
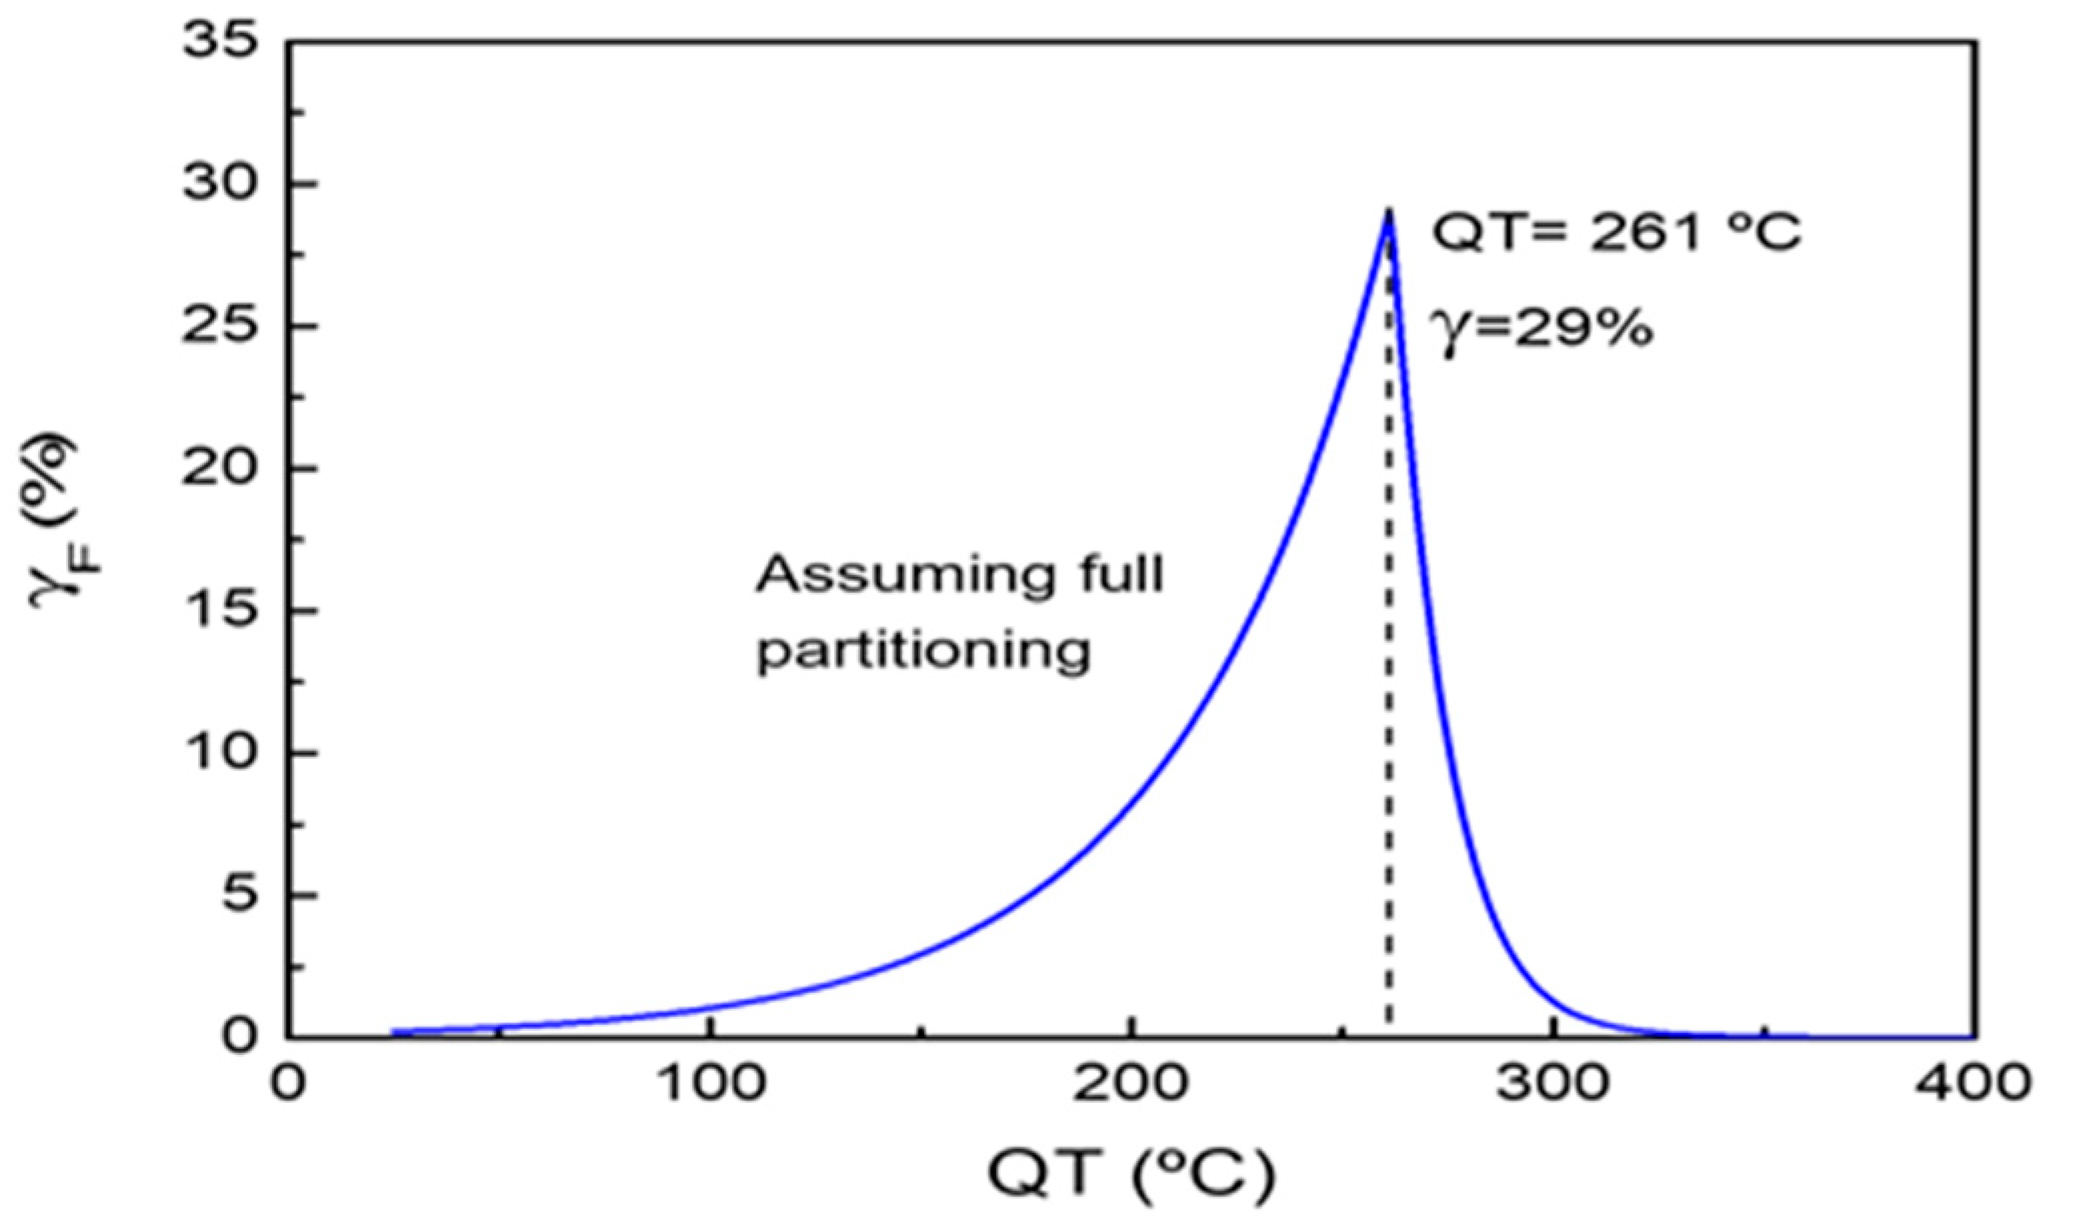
3.2. QP Model Simulation

The Speer model to predict the maximum retained austenite and the corresponding optimal quenching temperature after a QP process was applied to the present steel. The result when assuming a full austenitization condition is illustrated in Figure 5. Accordingly, the optimal quenching temperature is 261 °C. The predicted maximum amount of retained austenite (γF) at this quenching temperature was 29%, assuming full partitioning of carbon from martensite to austenite.

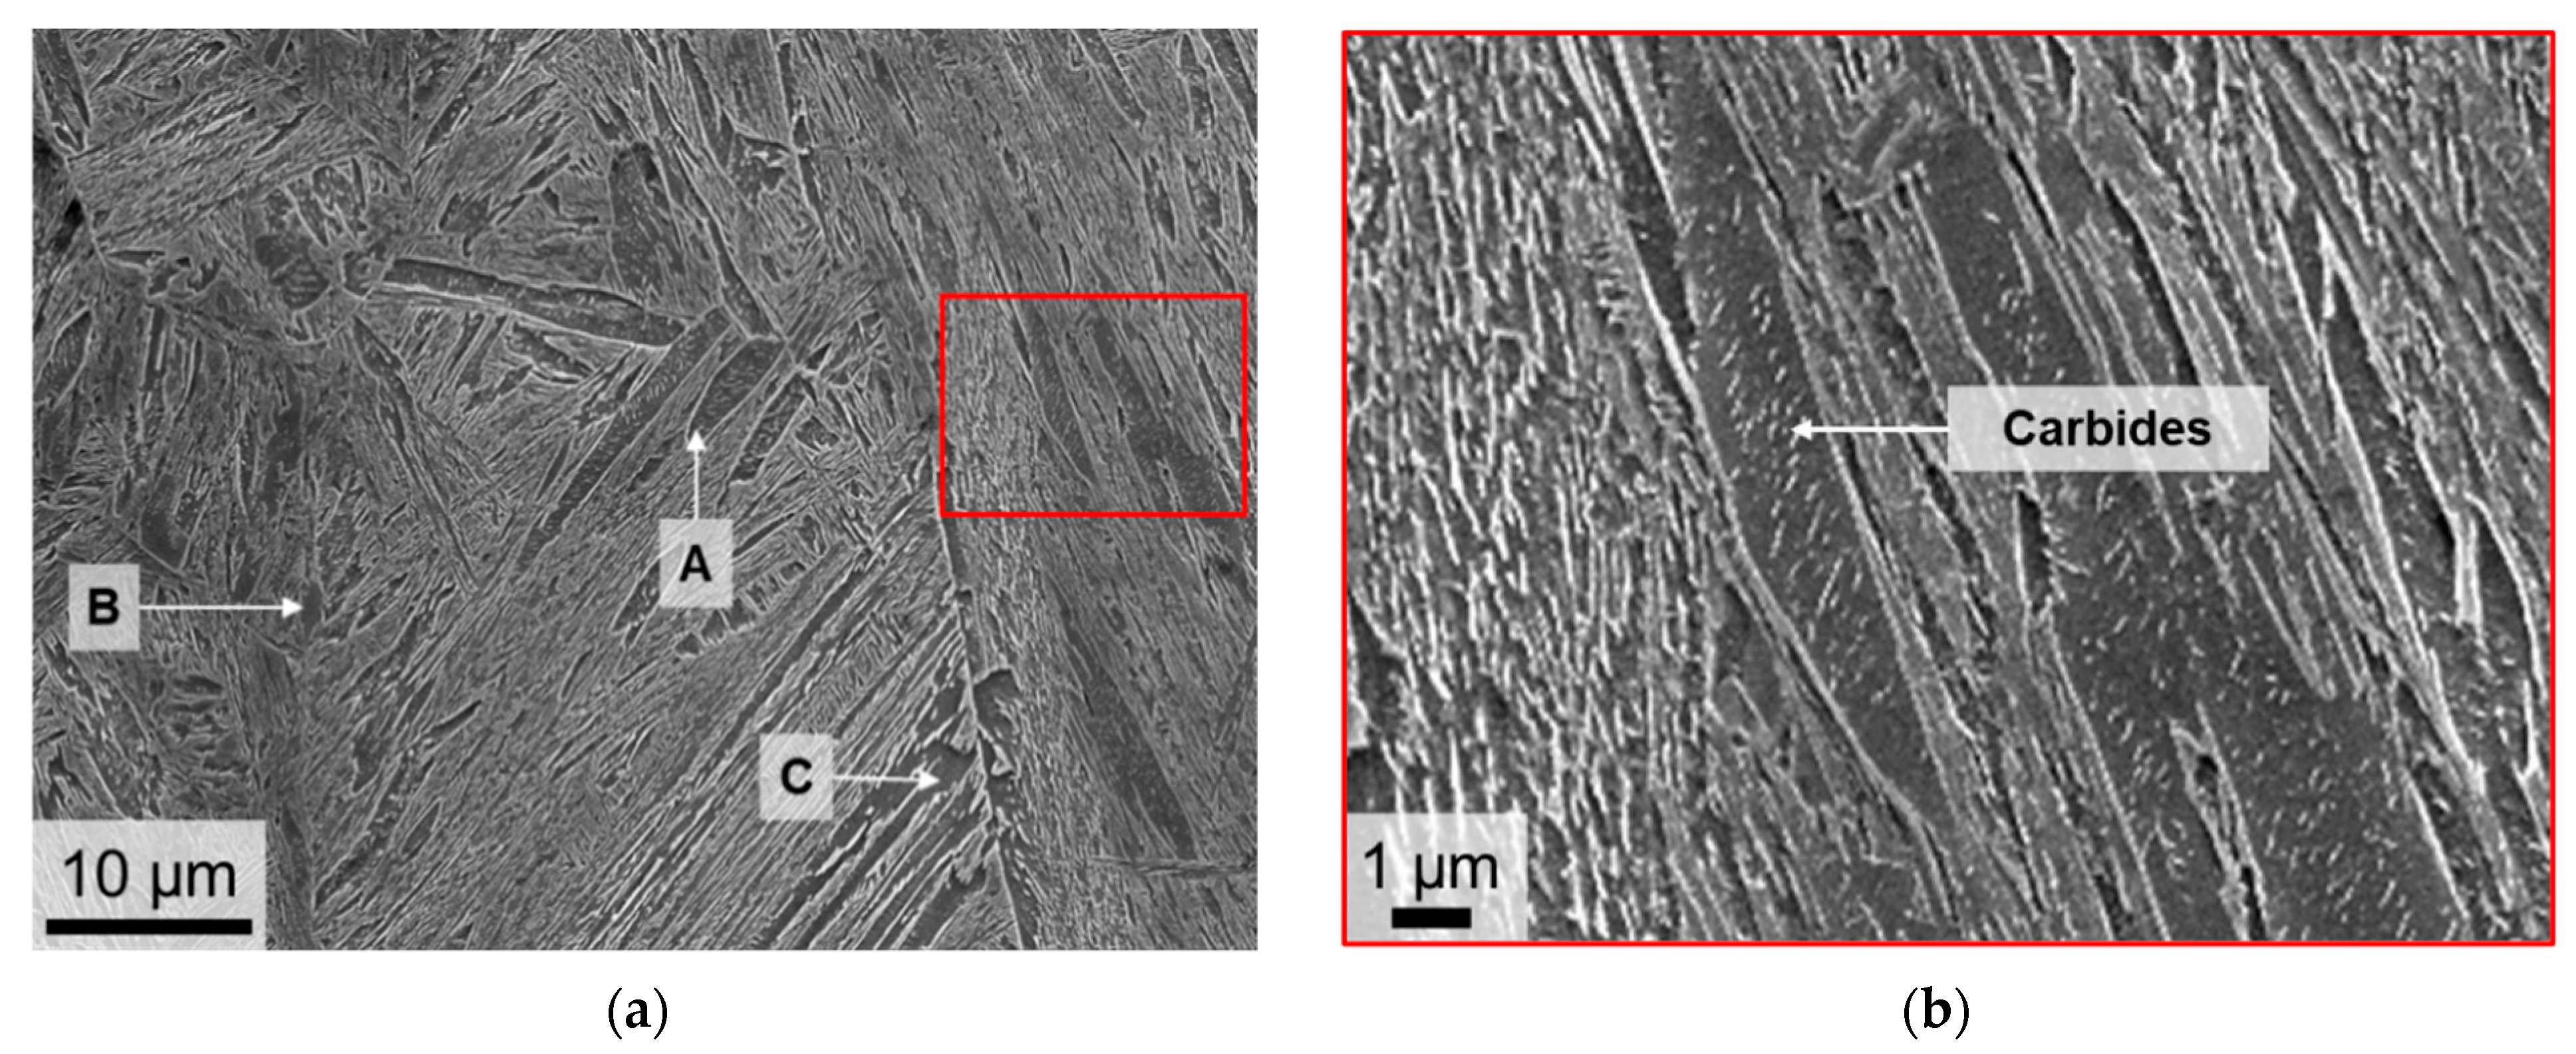
3.3. Microstructural Characterization of the As-Received Condition

The as-received microstructure of the current steel is shown in Figure 6. The micro-structure corresponds to an almost fully martensitic steel. However, some noticeable features can be seen. For instance, some carbide precipitation (Figure 6b) within coarse martensite regions (zone A) can be seen, suggesting a sort of self-tempering; this phenomenon may occur directly during cooling in steels with high Ms [36,37]. Moreover, zones of as-quenched martensite (B) were found throughout the microstructure. Nevertheless, a different morphology zone (C) was found in the microstructure. In Figure 4a, at the slowest cooling rate (0.1 °C/s), the presence of a secondary microstructure is shown, which can be suggested to be bainite. The formation of this microstructure under a slow cooling condition after steel processing has already been suggested. For instance, Navarro-López et al. [38] reported similar morphologies during an isothermal holding of 1 h at 300 °C or higher temperature in a 0.2C-3.51Mn-1.52Si-0.25Mo-0.04Al (wt%) steel.

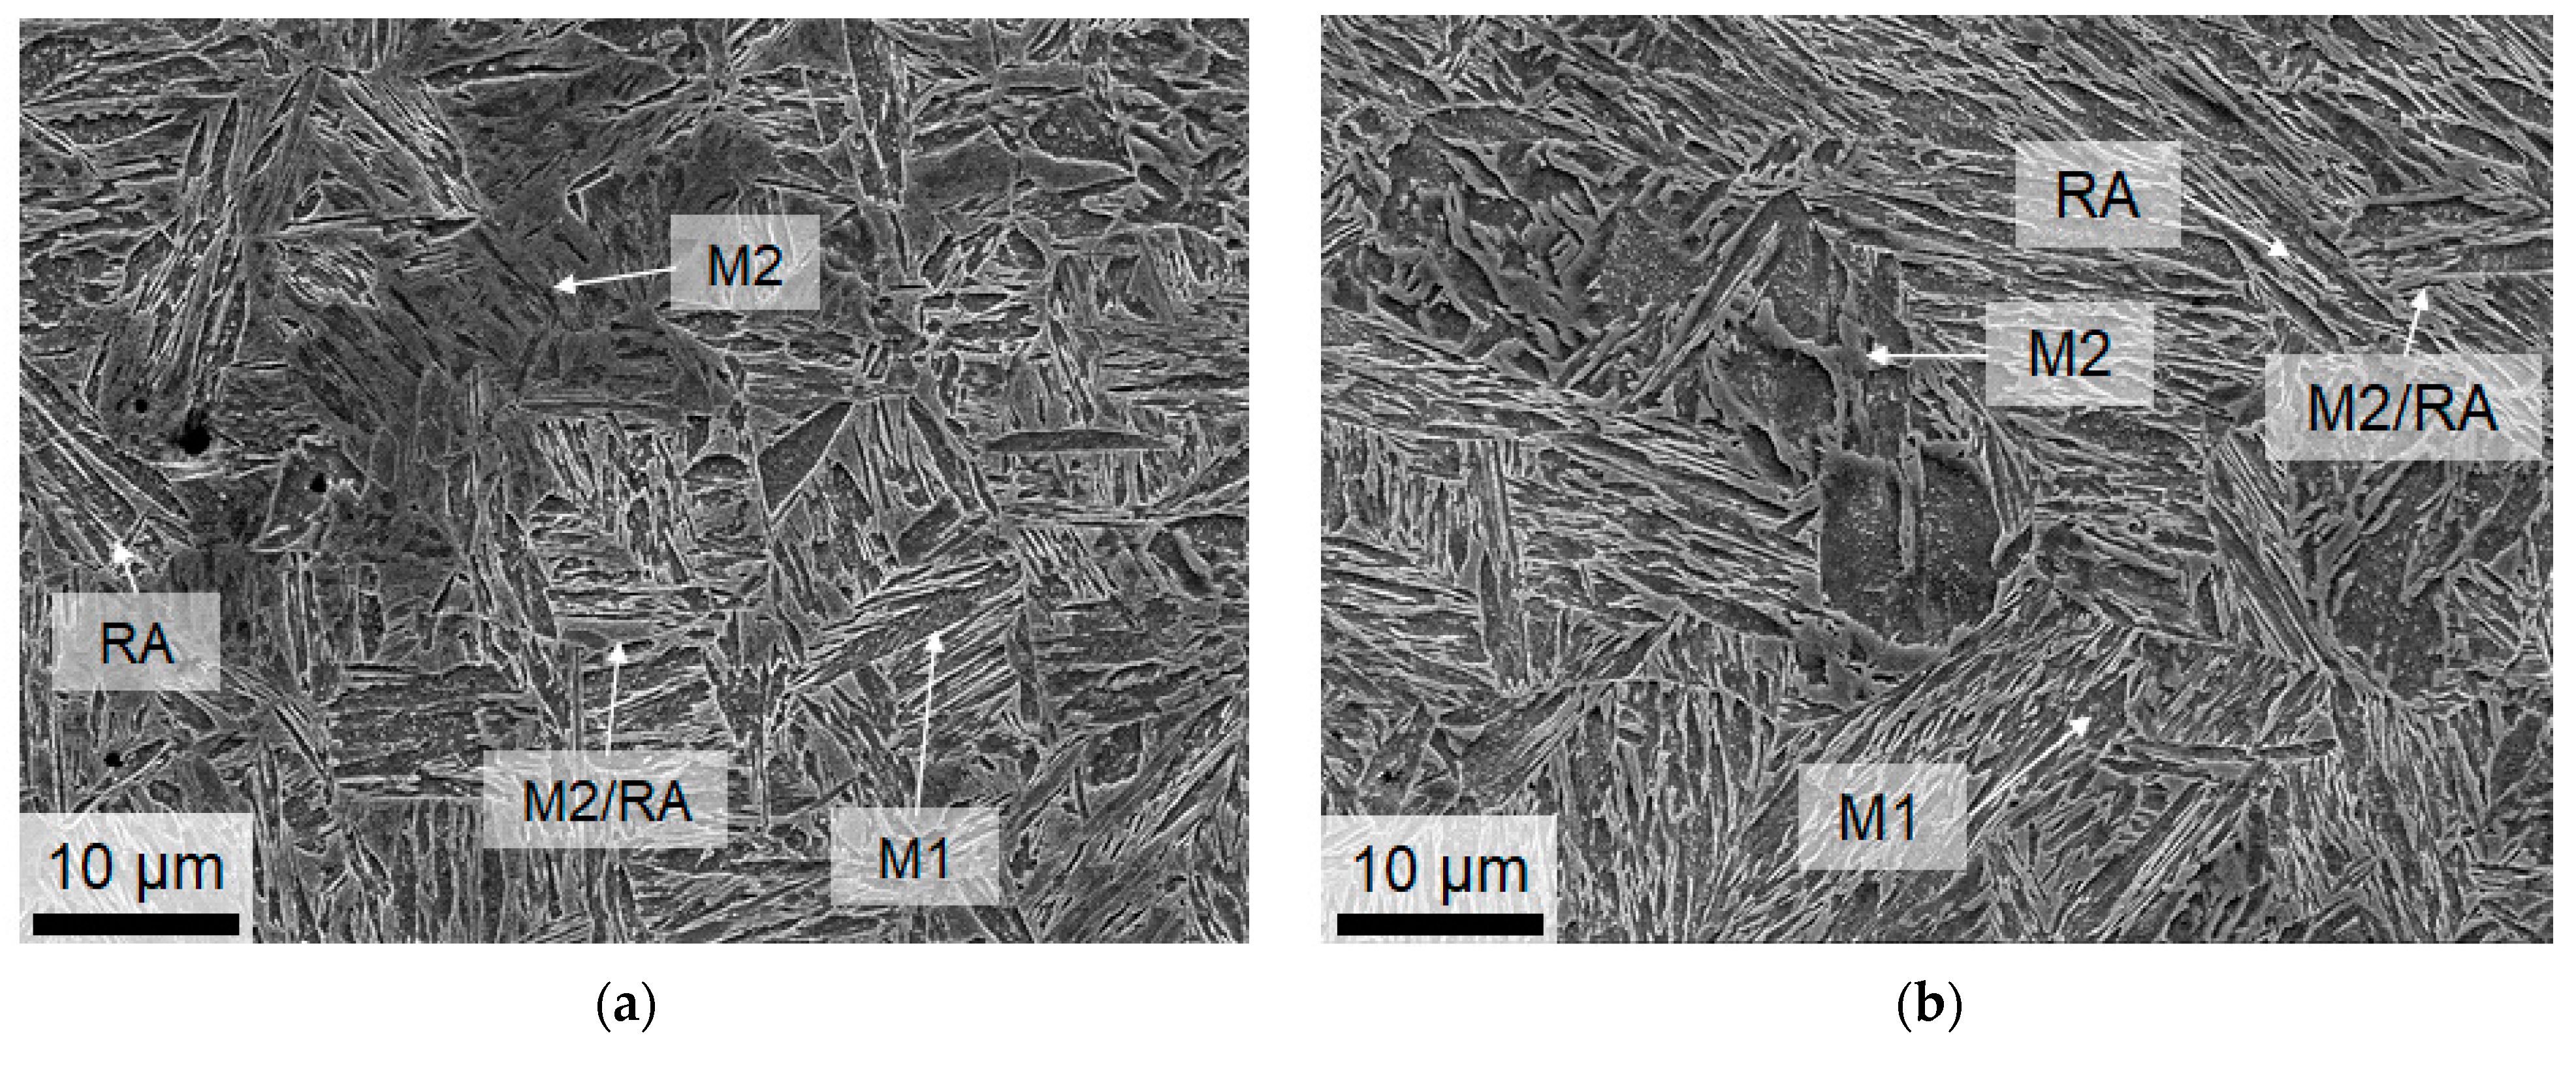
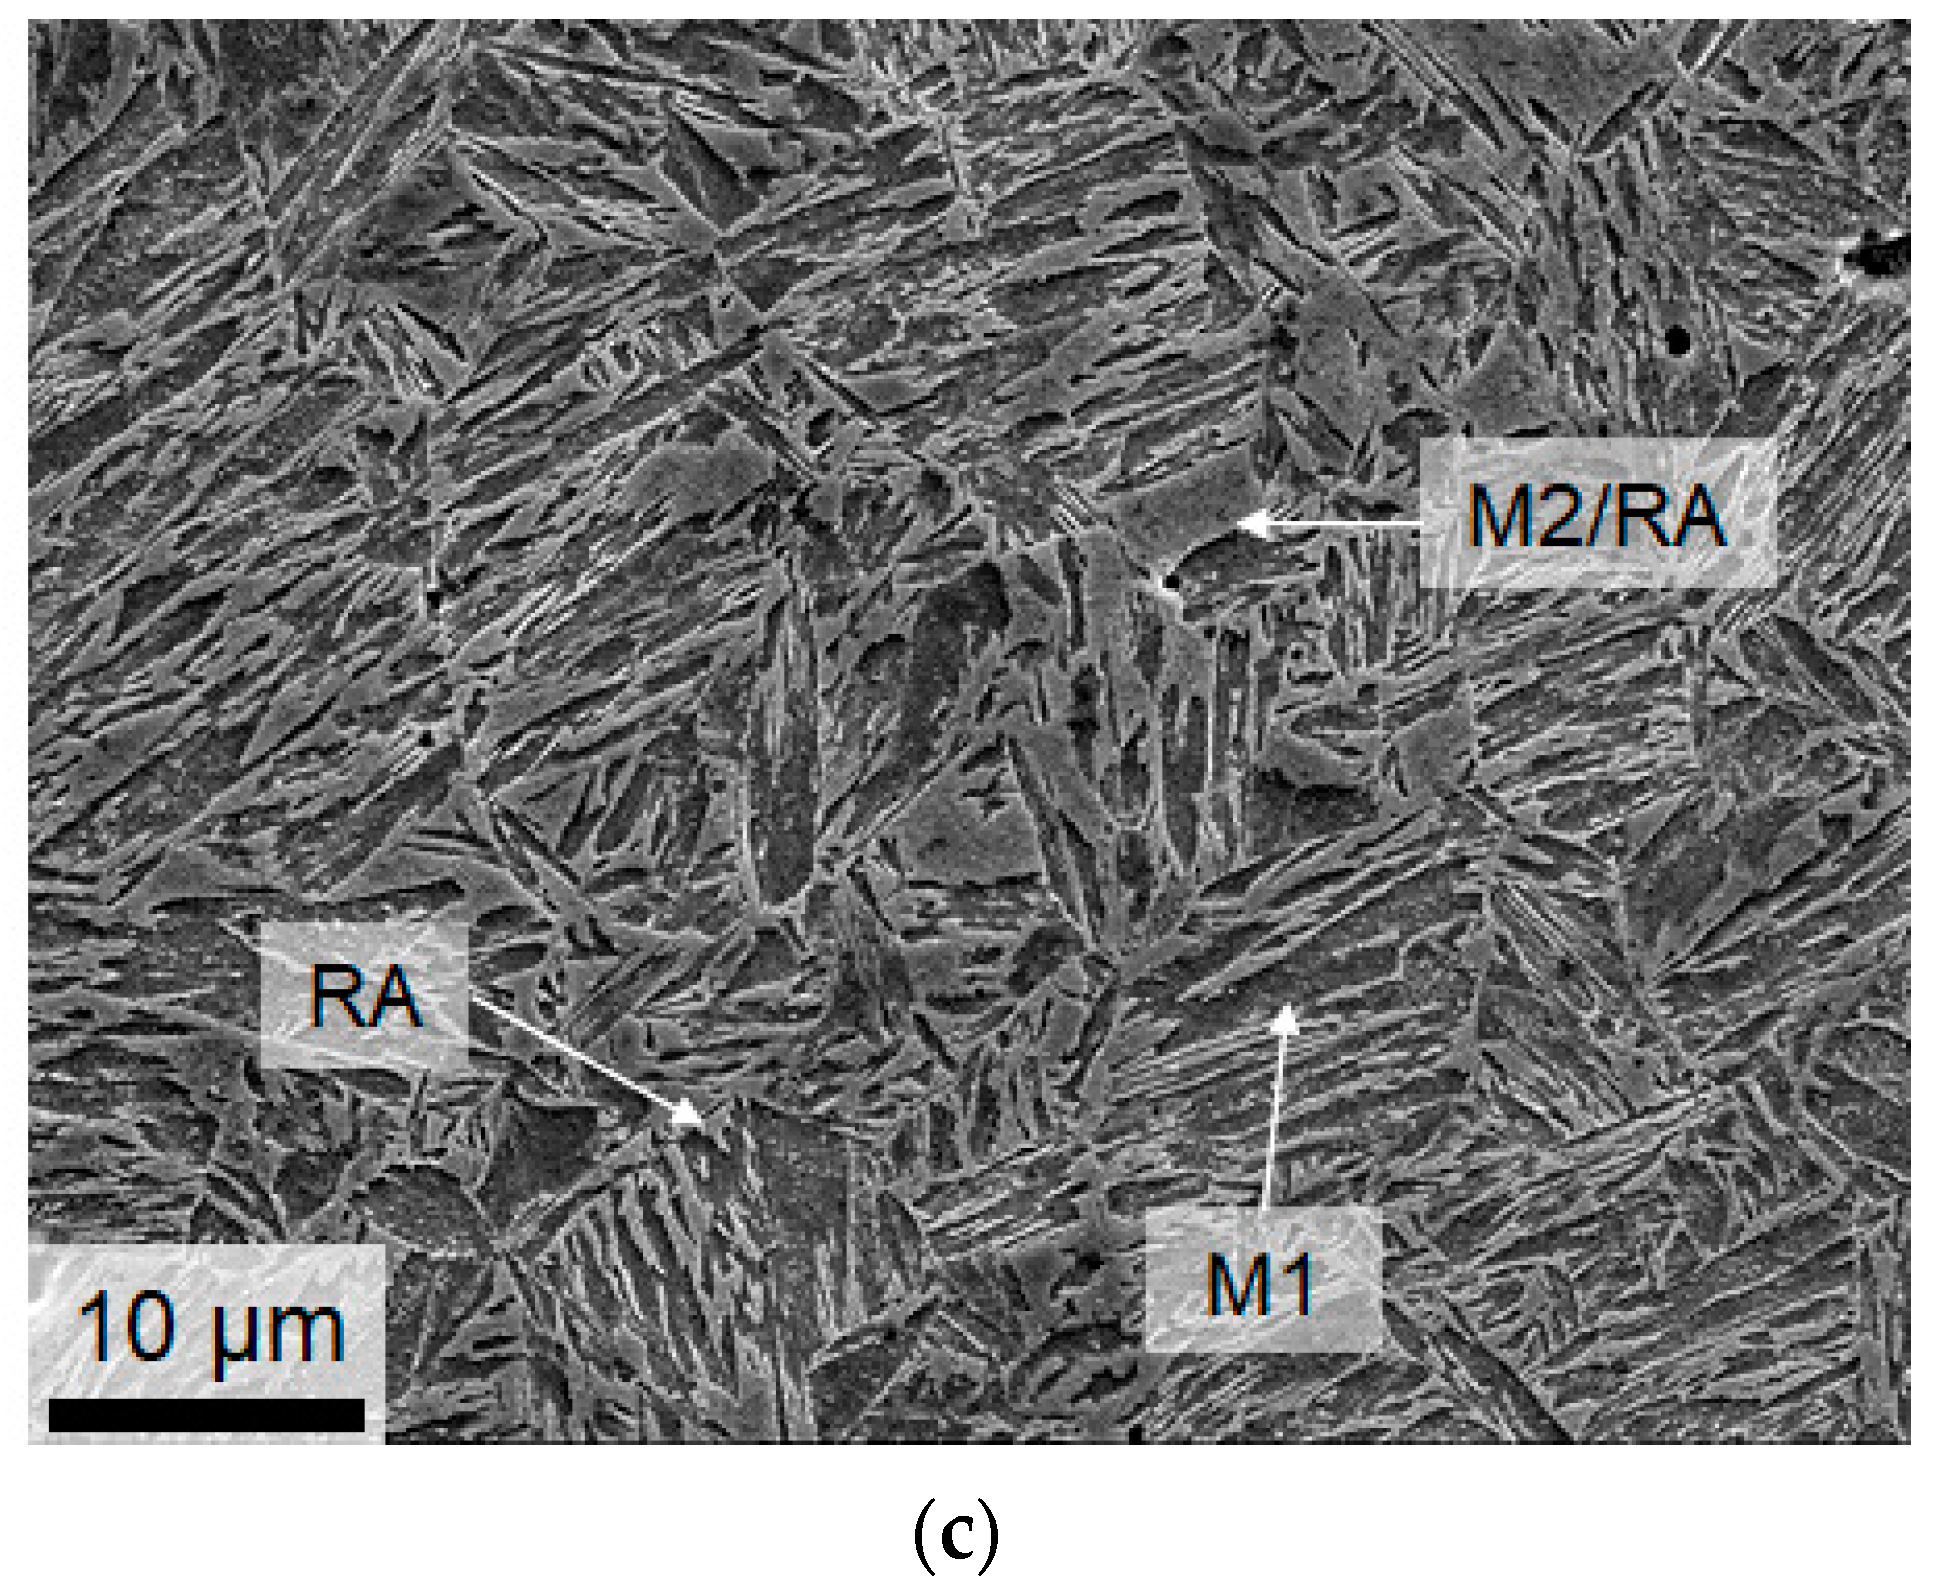
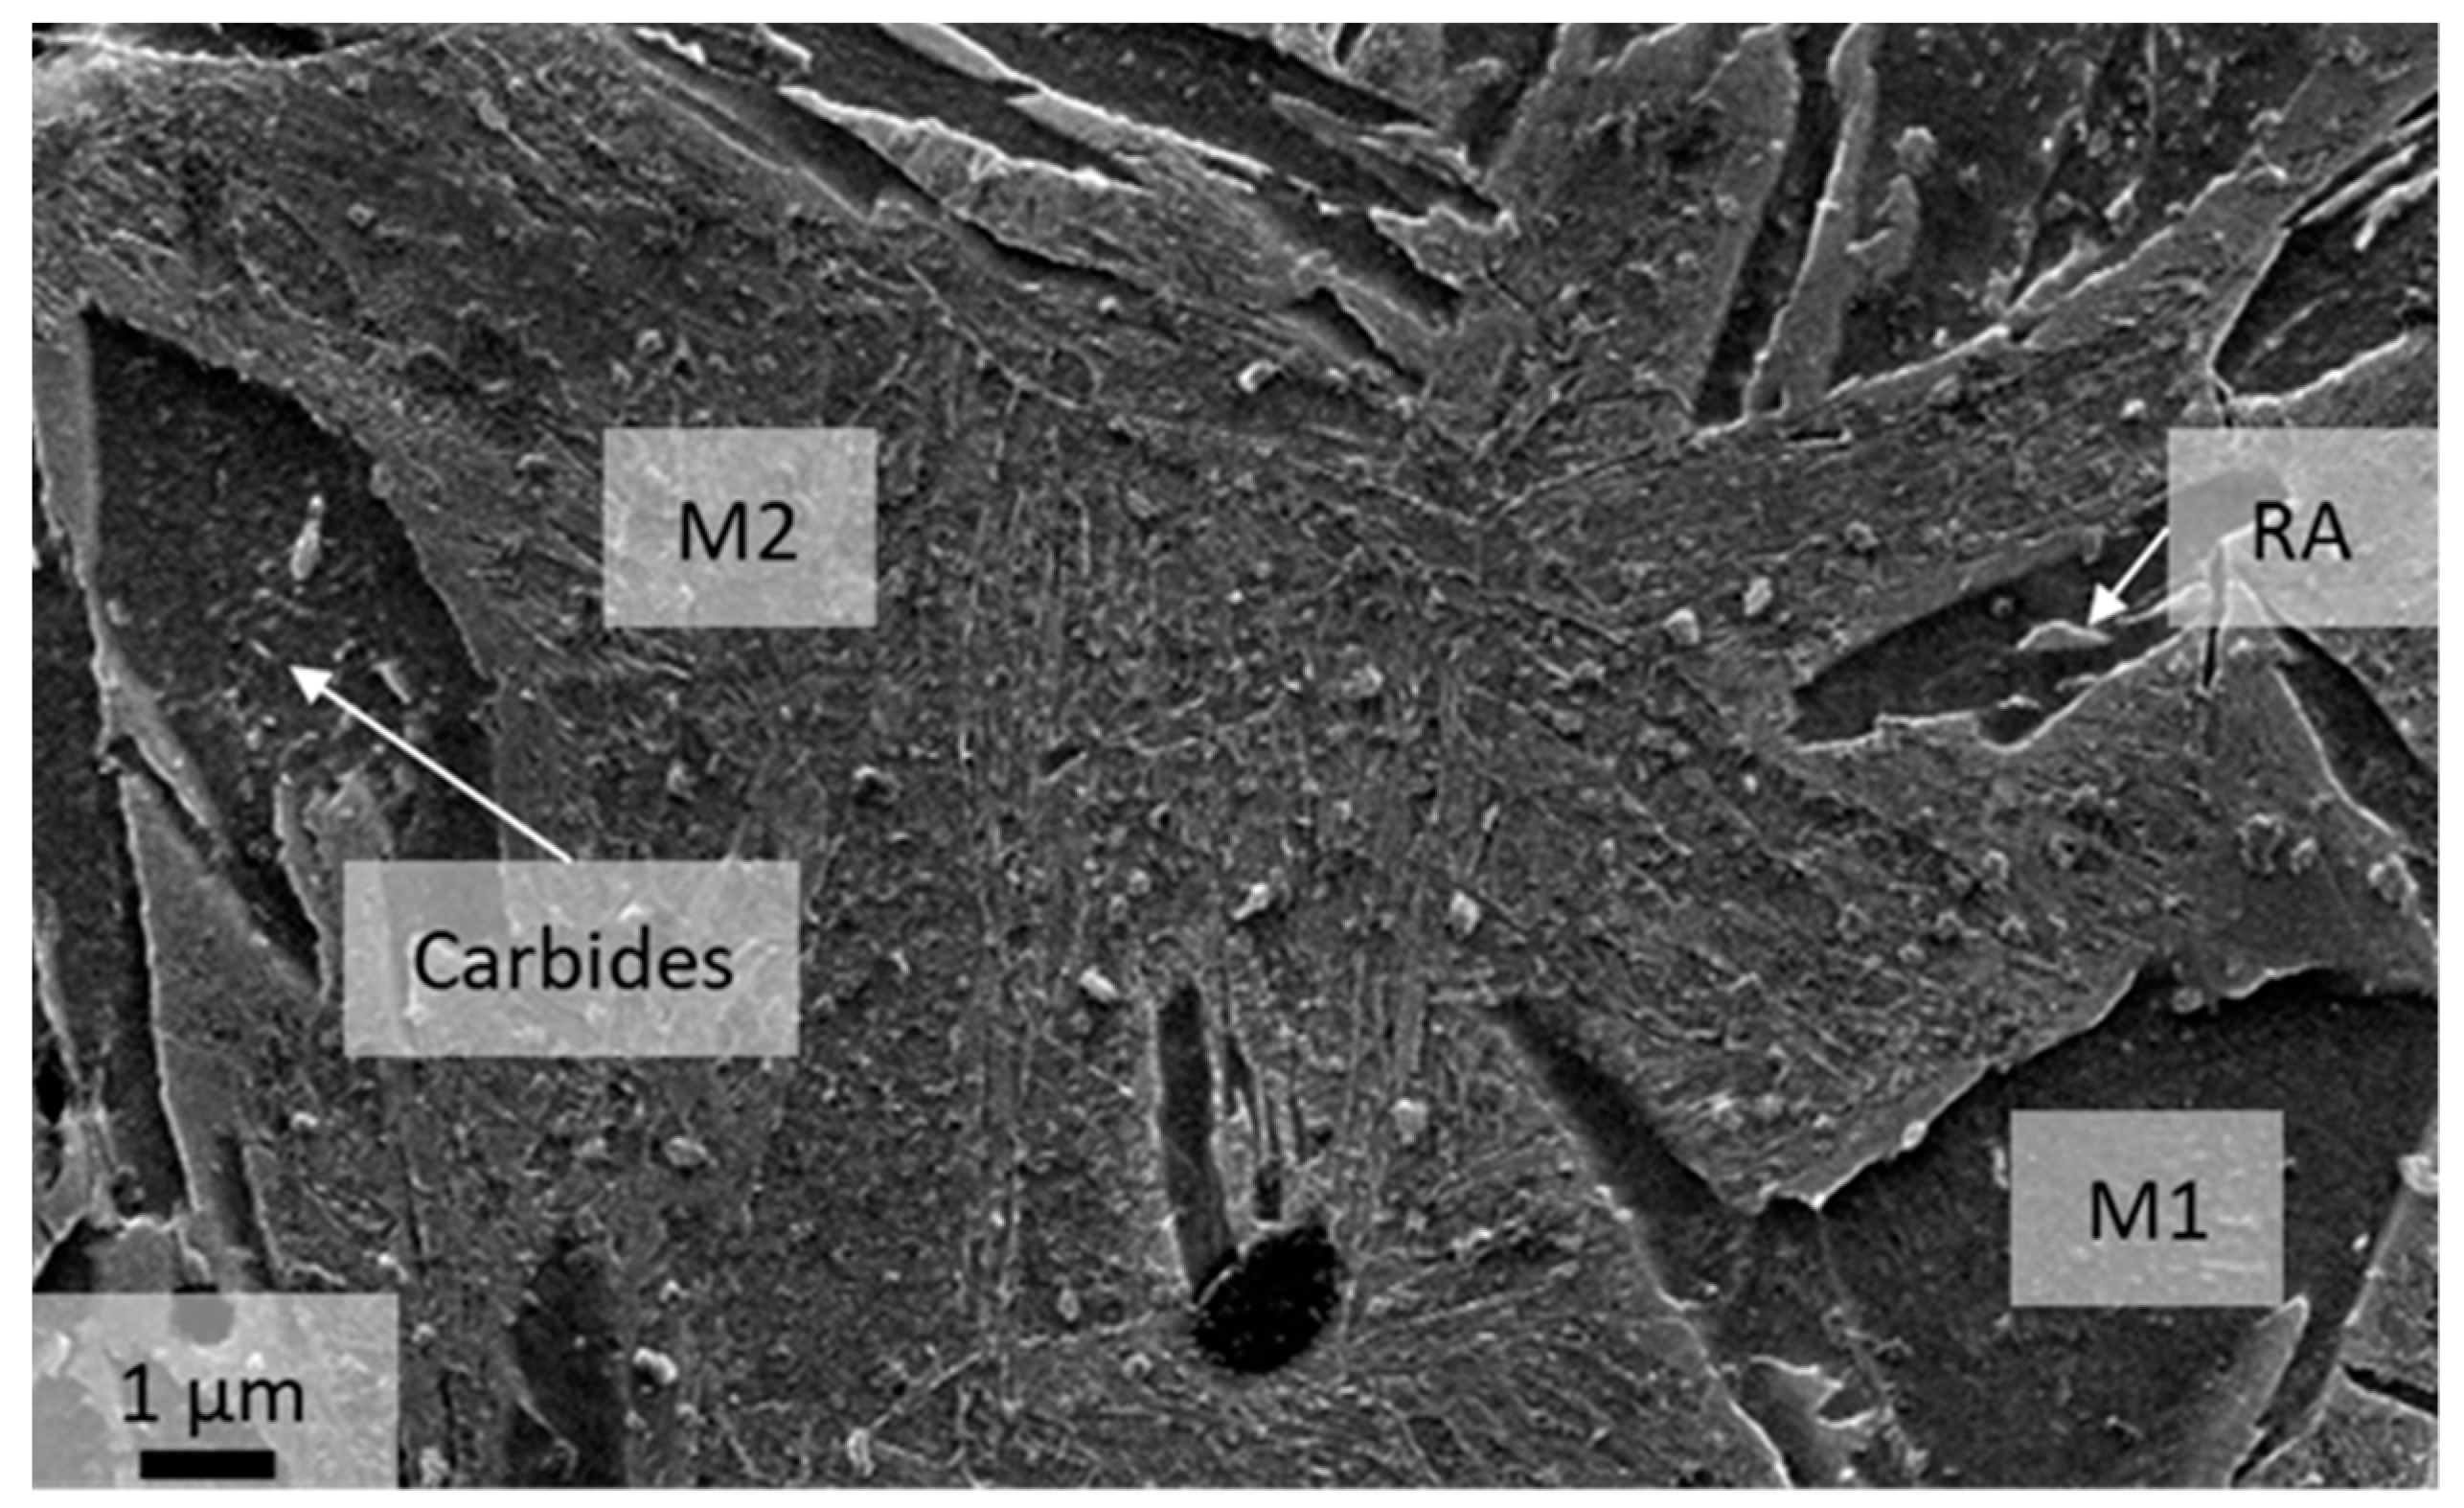
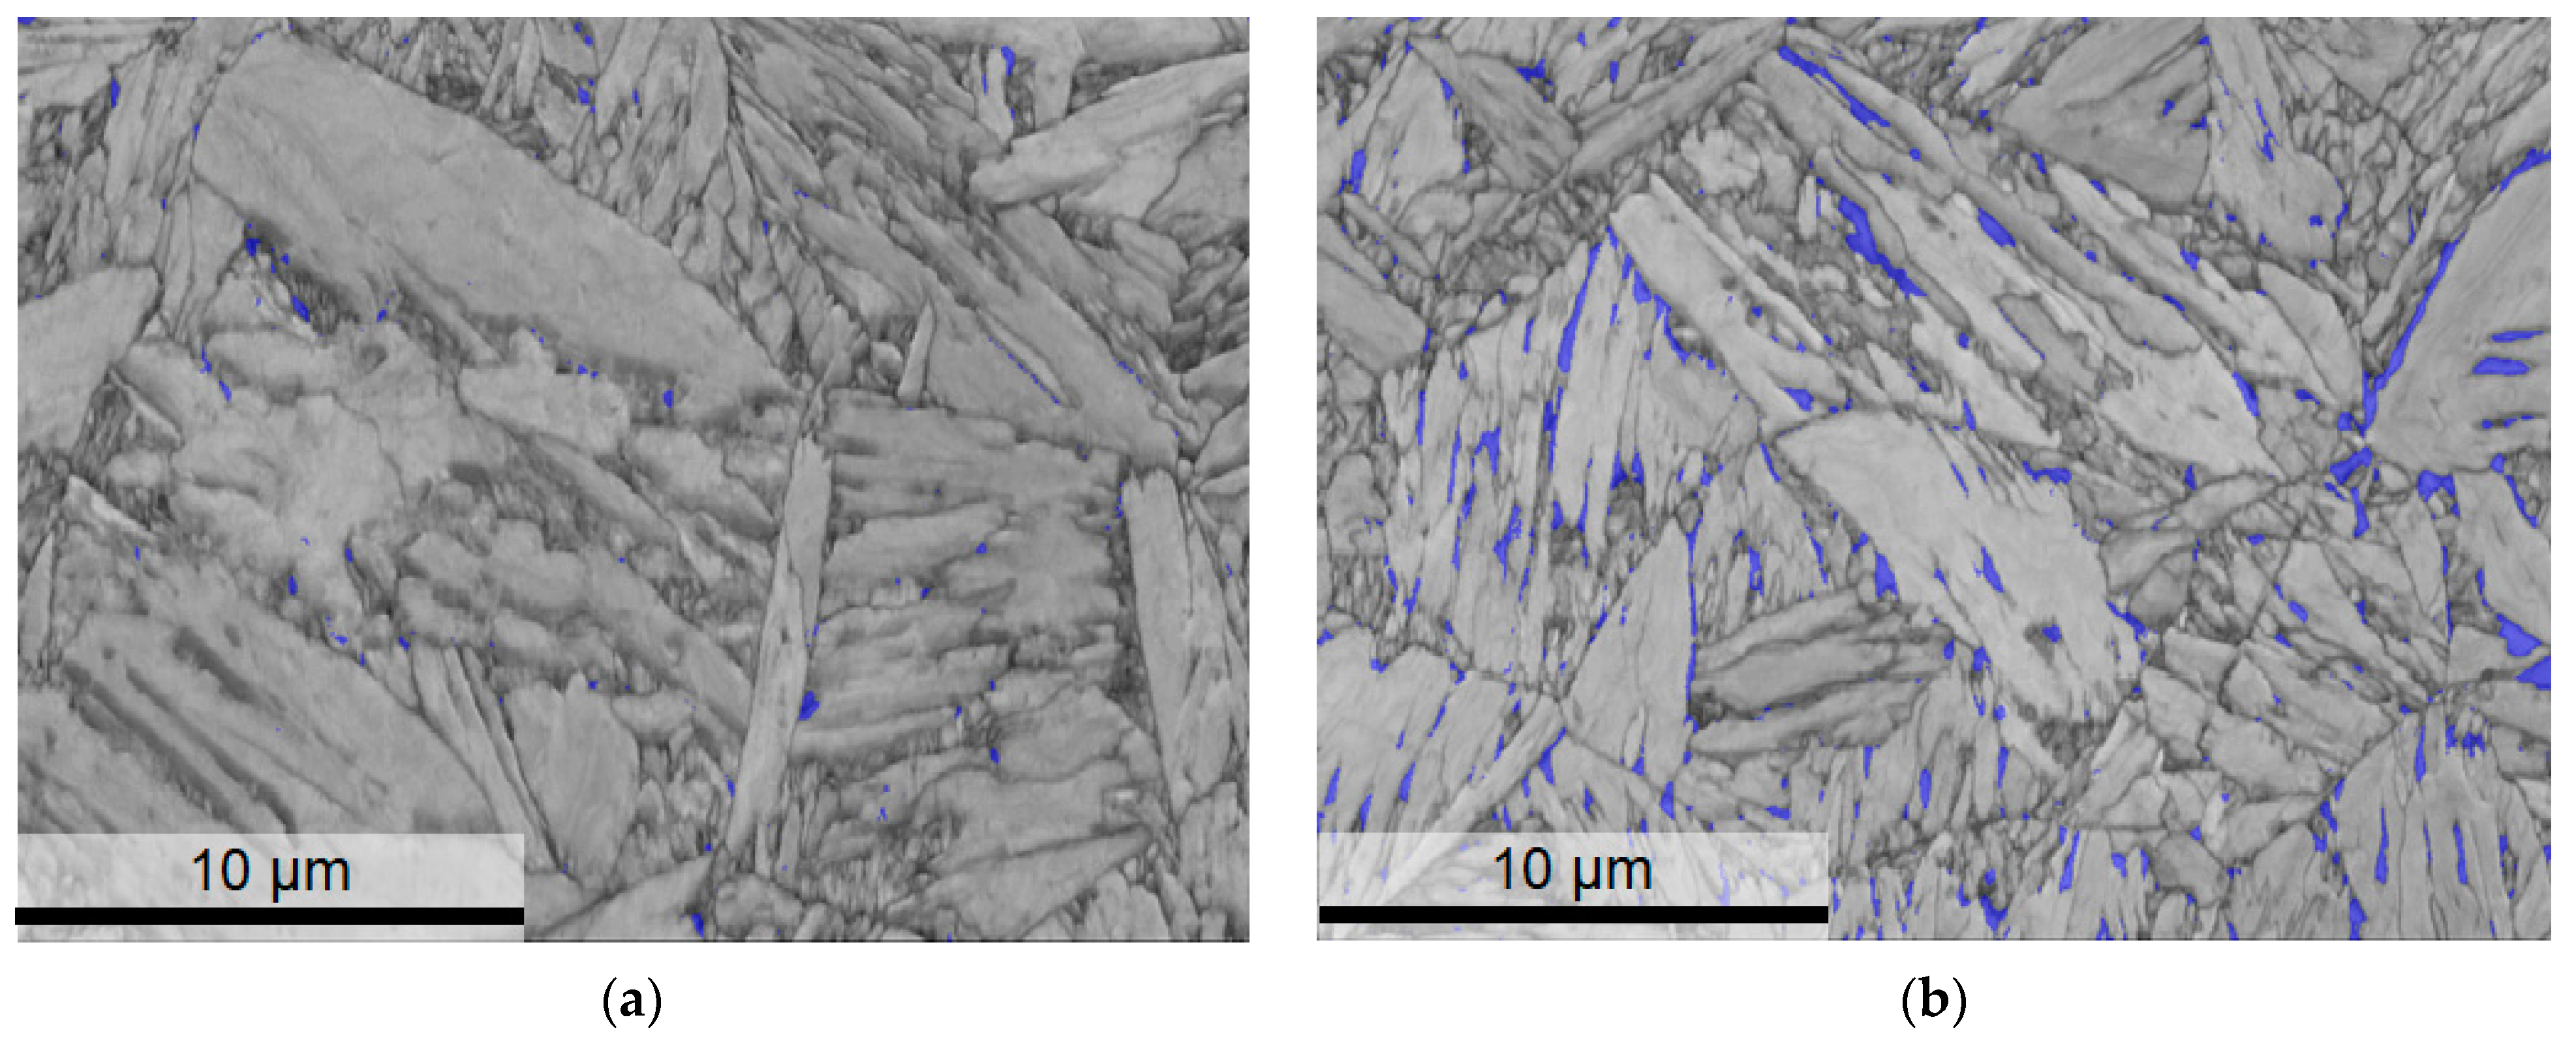
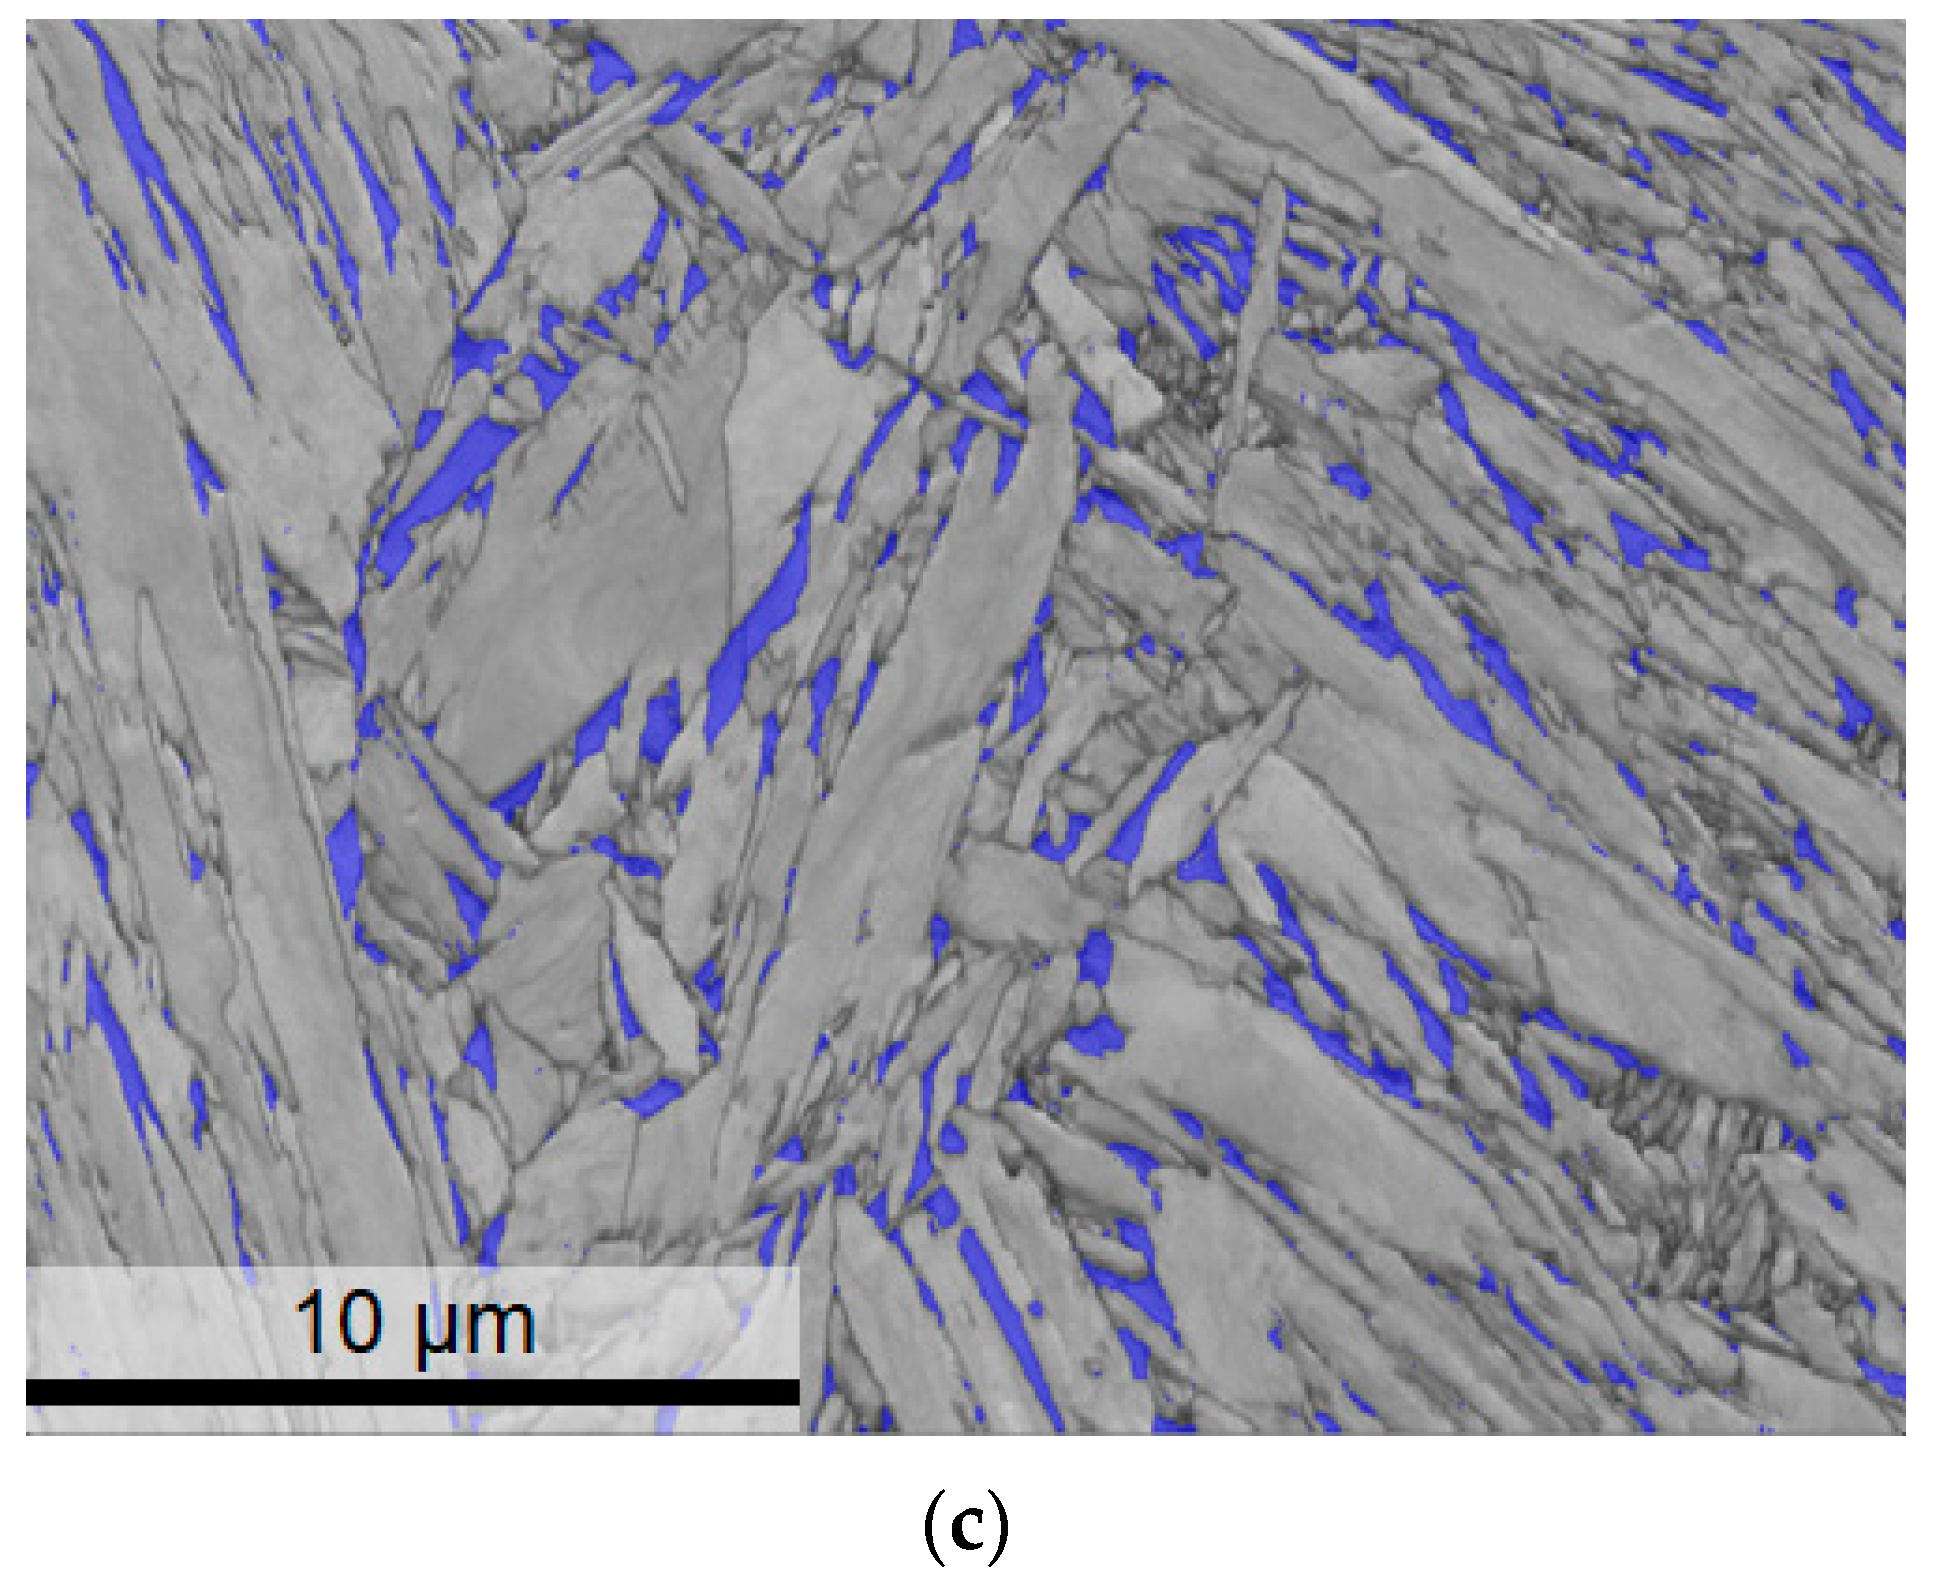
3.4. Microstructural Characterization after the QP Process

Figure 7 shows the resulting microstructure observed with SEM after the QP process where (a) QP-321, (b) QP-371, and (c) QP-421 refer to the partitioning treatment temperatures. Two types of martensitic regions can be observed. The heavily etched one consists in tempered martensite formed during the first quenching (M1) plus the partitioning, and the rest of the microstructure corresponds to as-quenched or fresh martensite (M2) with thin lath morphology surrounded by retained austenite (RA) forming M2/RA islands after the final quench [7,39]. According to Figure 7, M1 displays representative carbides inside the martensite blocks. On the other hand, M2 martensite can be identified as less etched zones in comparison with M1 as a result of carbon enrichment [12].
A first remark is the relatively homogeneous microstructure obtained at the QT partitioning temperatures, although the one corresponding to QP-371 has some isolated M2 areas. Primary or tempered martensite M1 displays a coarse blocky morphology and is defined by the presence of transitional needle-type carbides within the block structure [12,40]. This kind of martensite is observed in all samples, although in different amounts. Fresh martensite M2 presents a very thick morphology, and is more evident in treatments at a high partitioning temperature, i.e., in specimen QT-421, as shown in Figure 8.
On the other hand, retained austenite can be noticed as having two morphologies: a thin and film-like morphology that is found between laths of martensite M1, and a coarser block-like morphology that is observed next to the prior austenite grain boundaries or martensite packet boundaries [7,12]. Moreover, regions formed by M2/RA islands were observed in all samples (Figure 7a–c). These regions are developed by fresh martensite M2 and large grains of retained austenite RA with a ring-like shape [12]. It has been reported [41] that these islands appear in the microstructure when carbon is not homogeneously dispersed along the austenite grain during partitioning treatment. The number of these M2/RA islands also depends on the quenching temperature [39]. One possible source of these heterogenous microstructures may come from Mn segregation. Hidalgo et al. [12] have reported that Mn-rich and Mn-poor regions in 0.3C-4.5Mn-1.5Si steel can cause the fraction of tempered martensite M1 and fresh martensite M2 to change from Mn-rich zones to Mn-poor areas. This indicates the key role that Mn segregation can play in the heterogeneity of the microstructures.
The EBSD image quality (IQ) images overlapped with the phase maps are shown in Figure 9. Here, the RA fraction discriminated by the EBSD analysis is highlighted in blue. In correspondence with the SEM images, the microstructure is mainly formed by a mixture of tempered M1 and fresh M2 martensite. De Diego-Calderón et al. [29] reported that martensite M2 can be detected in the IQ and phase maps as a darker region next to RA grains which can help to discern the presence of these regions in all conditions, as shown in Figure 9. In any case, as already pointed out, the amount of retained austenite was estimated by (i) EBSD using Channel 5 software and by (ii) XRD. Results are listed in Table 3 and will be discussed later. Three RA morphologies were observed in the microstructure after the QP process, namely a film-like RA, blocky RA, and lamellar RA, in agreement with the literature [29]. According to the EBSD images, retained austenite (≤1%) is practically absent in the condition QP-321 (Figure 9a) in comparison with the conditions QP-371 (Figure 9b) and QP-421 (Figure 9c) that display 4.6% and 8.4%, respectively. This result shows the effect of increasing the partitioning temperature on increasing retained austenite. These values are also in agreement with literature reports indicating the relatively large amounts of RA evaluated by EBSD obtained at a partitioning temperature of 400 °C [29].
The amount of RA evaluated by XRD, listed in Table 3, is also shown in Figure 10. The same trends as those of the EBSD analysis can be seen, but with clearly larger amounts of RA found in all conditions. It is worth noticing the lower fraction of retained austenite measured by XRD than those predicted by the model proposed by Speer. The difference in measurements of retained austenite between both techniques is due to the limitation of EBSD to detect the smallest austenite laths next to martensite blocks. The size range of lath austenite is around 20–100 nm, which can be detectable by XRD [29]. This can be explained by an incomplete partitioning, formation of secondary phases, or carbide precipitation during the entire QP process [23,42]. The present amounts of RA agree with some authors. For instance, Zhao et al. [43] reported 19.3% retained austenite by XRD measurements in a nearly similar chemical composition of 0.28C-1.42Si-4.08Mn. On the other hand, De Diego-Calderon et al. [29] reported a proportion of 20.2% of RA in 0.25C–1.5Si–3Mn–0.023Al.
The estimated amount of carbon in the RA measured by XRD is shown in Figure 10. The evolution of the amount of carbon in the RA during the QP process is roughly similar in the different partitioning conditions. A larger amount was found at QP-321 with 1.05 wt%, whereas an increment in partitioning temperature showed a slight reduction in the amount of carbon of 0.98 wt% at QP-371 and another small increment at the highest partitioning temperature of 1.01 wt%. This slight change in carbon concentration can be explained by the presence of different RA morphologies. It has been reported that the amount of carbon in lath RA reduces the carbon mean value while the block RA increases this value [44]. However, a high carbon concentration (1.05%C) and low fraction of RA measured in the QP-321 condition can be explained as a result of a large amount of M1, in which the carbon enrichment from M1 to austenite exceeds that required to stabilize the untransformed austenite [41]. The large amount of carbon in the RA in comparison with the initial carbon concentration proved that enough carbon diffused to austenite during the partitioning step, enhancing the stability at room temperature [45]. As already mentioned, the martensitic transformation is diffusionless, so the carbon content of this RA should be the same (or similar) to the one of the fresh martensite. It is well known that the morphology of the martensite changes from a lath-like shape to a plate-like shape depending on carbon contents [46]. This transition is around 0.8–1%C. In consequence, the fresh martensites displayed in Figure 7 are in agreement with the carbon content evaluated by XRD.
The mechanical properties of the present steel are listed in Table 4 and plotted in Figure 11. The QP-321 condition shows the highest hardness value of 448 HV in comparison with QP-371 and QP-421 specimens that have values of 408 HV and 421 HV, respectively. It can be discerned that the high hardness of the QP-321 sample may be explained by the low fraction of retained austenite present in the microstructure. It is also remarkable that, except sample QP-321, the other samples present nearly the same hardness.
Figure 11 shows the engineering stress–strain graphs corresponding to the two thermal cycles selected in this work. The results from mechanical testing are also listed in Table 4. The as-received condition exhibits a YS of 1201 MPa, 1671 Mpa of UTS, total elongation (EL%) of 10.8% and n-value of 0.10. On the other hand, the uniform elongation (Ag) presents the same trend as El% in which the QP-421 condition exhibits a low work-hardening behavior. Interestingly, one can notice that the total elongation is, in general, below 5%, except in the QP-321 and QP-371 conditions. Indeed, the flow curves with the largest hardening exponents correspond, surprisingly, to the lower elongation values. The large work hardening exponents agree with the larger amount of retained austenite displayed in these conditions, as expected. However, the lack of ductility in terms of elongation must be associated with the heterogeneous microstructure, so although the RA fraction is larger, the big islands of fresh (brittle) martensite are heterogeneously dispersed, and, consequently, they can promote early necking and even failure, i.e., local brittleness. The low elongation found in the QP-421 condition which displays 18.3% of RA and 1.01%C proves that RA does not fully help during the work-hardening step. Hidalgo et al. [12] reported the same behavior in 0.3C–4.5Mn–1.5Si (wt%). They attributed the low elongation due to low stability of RA in regions with a small amount of carbon during deformation. The fast transformation into a harder martensite inhibits the work-hardening behavior of the soft untransformed RA. Accordingly, although the n-value can be initially large, the total final elongation can be low.
The surface fracture analysis of different QP conditions is shown in Figure 12. The fracture surface of the QP-321 sample (Figure 12a) displays a large density of dimples and elongated dimple zones representative of ductile fracture. A mixture of dimple zones and intergranular fracture was observed in the QP-371 condition (Figure 12b) that, in turn, decreases the elongation percentage in comparison with sample QP-321. On the other hand, small regions of microdimples and dominant regions of intergranular fracture were found along the fracture surface in the QP-421 condition (Figure 12c) as a result of a brittle fracture [47]. According to Figure 11, the QP-321 condition reached 11.1% of elongation while QP-371 and QP-421 conditions reached 8.3% and 3%, respectively. This behavior shows that the increment in partitioning temperature decreases the elongation percentage. The low elongation found in the QP-421 sample can be explained as a result of brittle fracture. The amount of retained austenite does not enhance the work hardening in this condition, and it instead transforms into hard and brittle martensite, promoting an overall brittle behavior [12].
On the other hand, the increment in the n-exponent found in QP-421 can be explained by the austenite’s transformation into martensite during the deformation. This transformation behavior depletes part of the strain energy and a softening phase transformation is reached. However, new martensite blocks the dislocation movement and affects the work hardening [48]. In addition, the same results were reported by Kozłowska and Grajcar for a hot-rolled Si-Al-alloyed 0.24C–1.5Mn-0.87Si in which there was found an increment of work-hardening exponent with the gradual transformation of retained austenite into martensite [49].

4. Conclusions

The present study showed the designing process of a QP heat treatment route of a given steel in an optimal condition. The following conclusions can be drawn:
  • Low fractions of retained austenite were measured at QP in all conditions in comparison with the one estimated by the theoretical model. This difference is explained in terms of the formation of secondary phases and carbide precipitation.
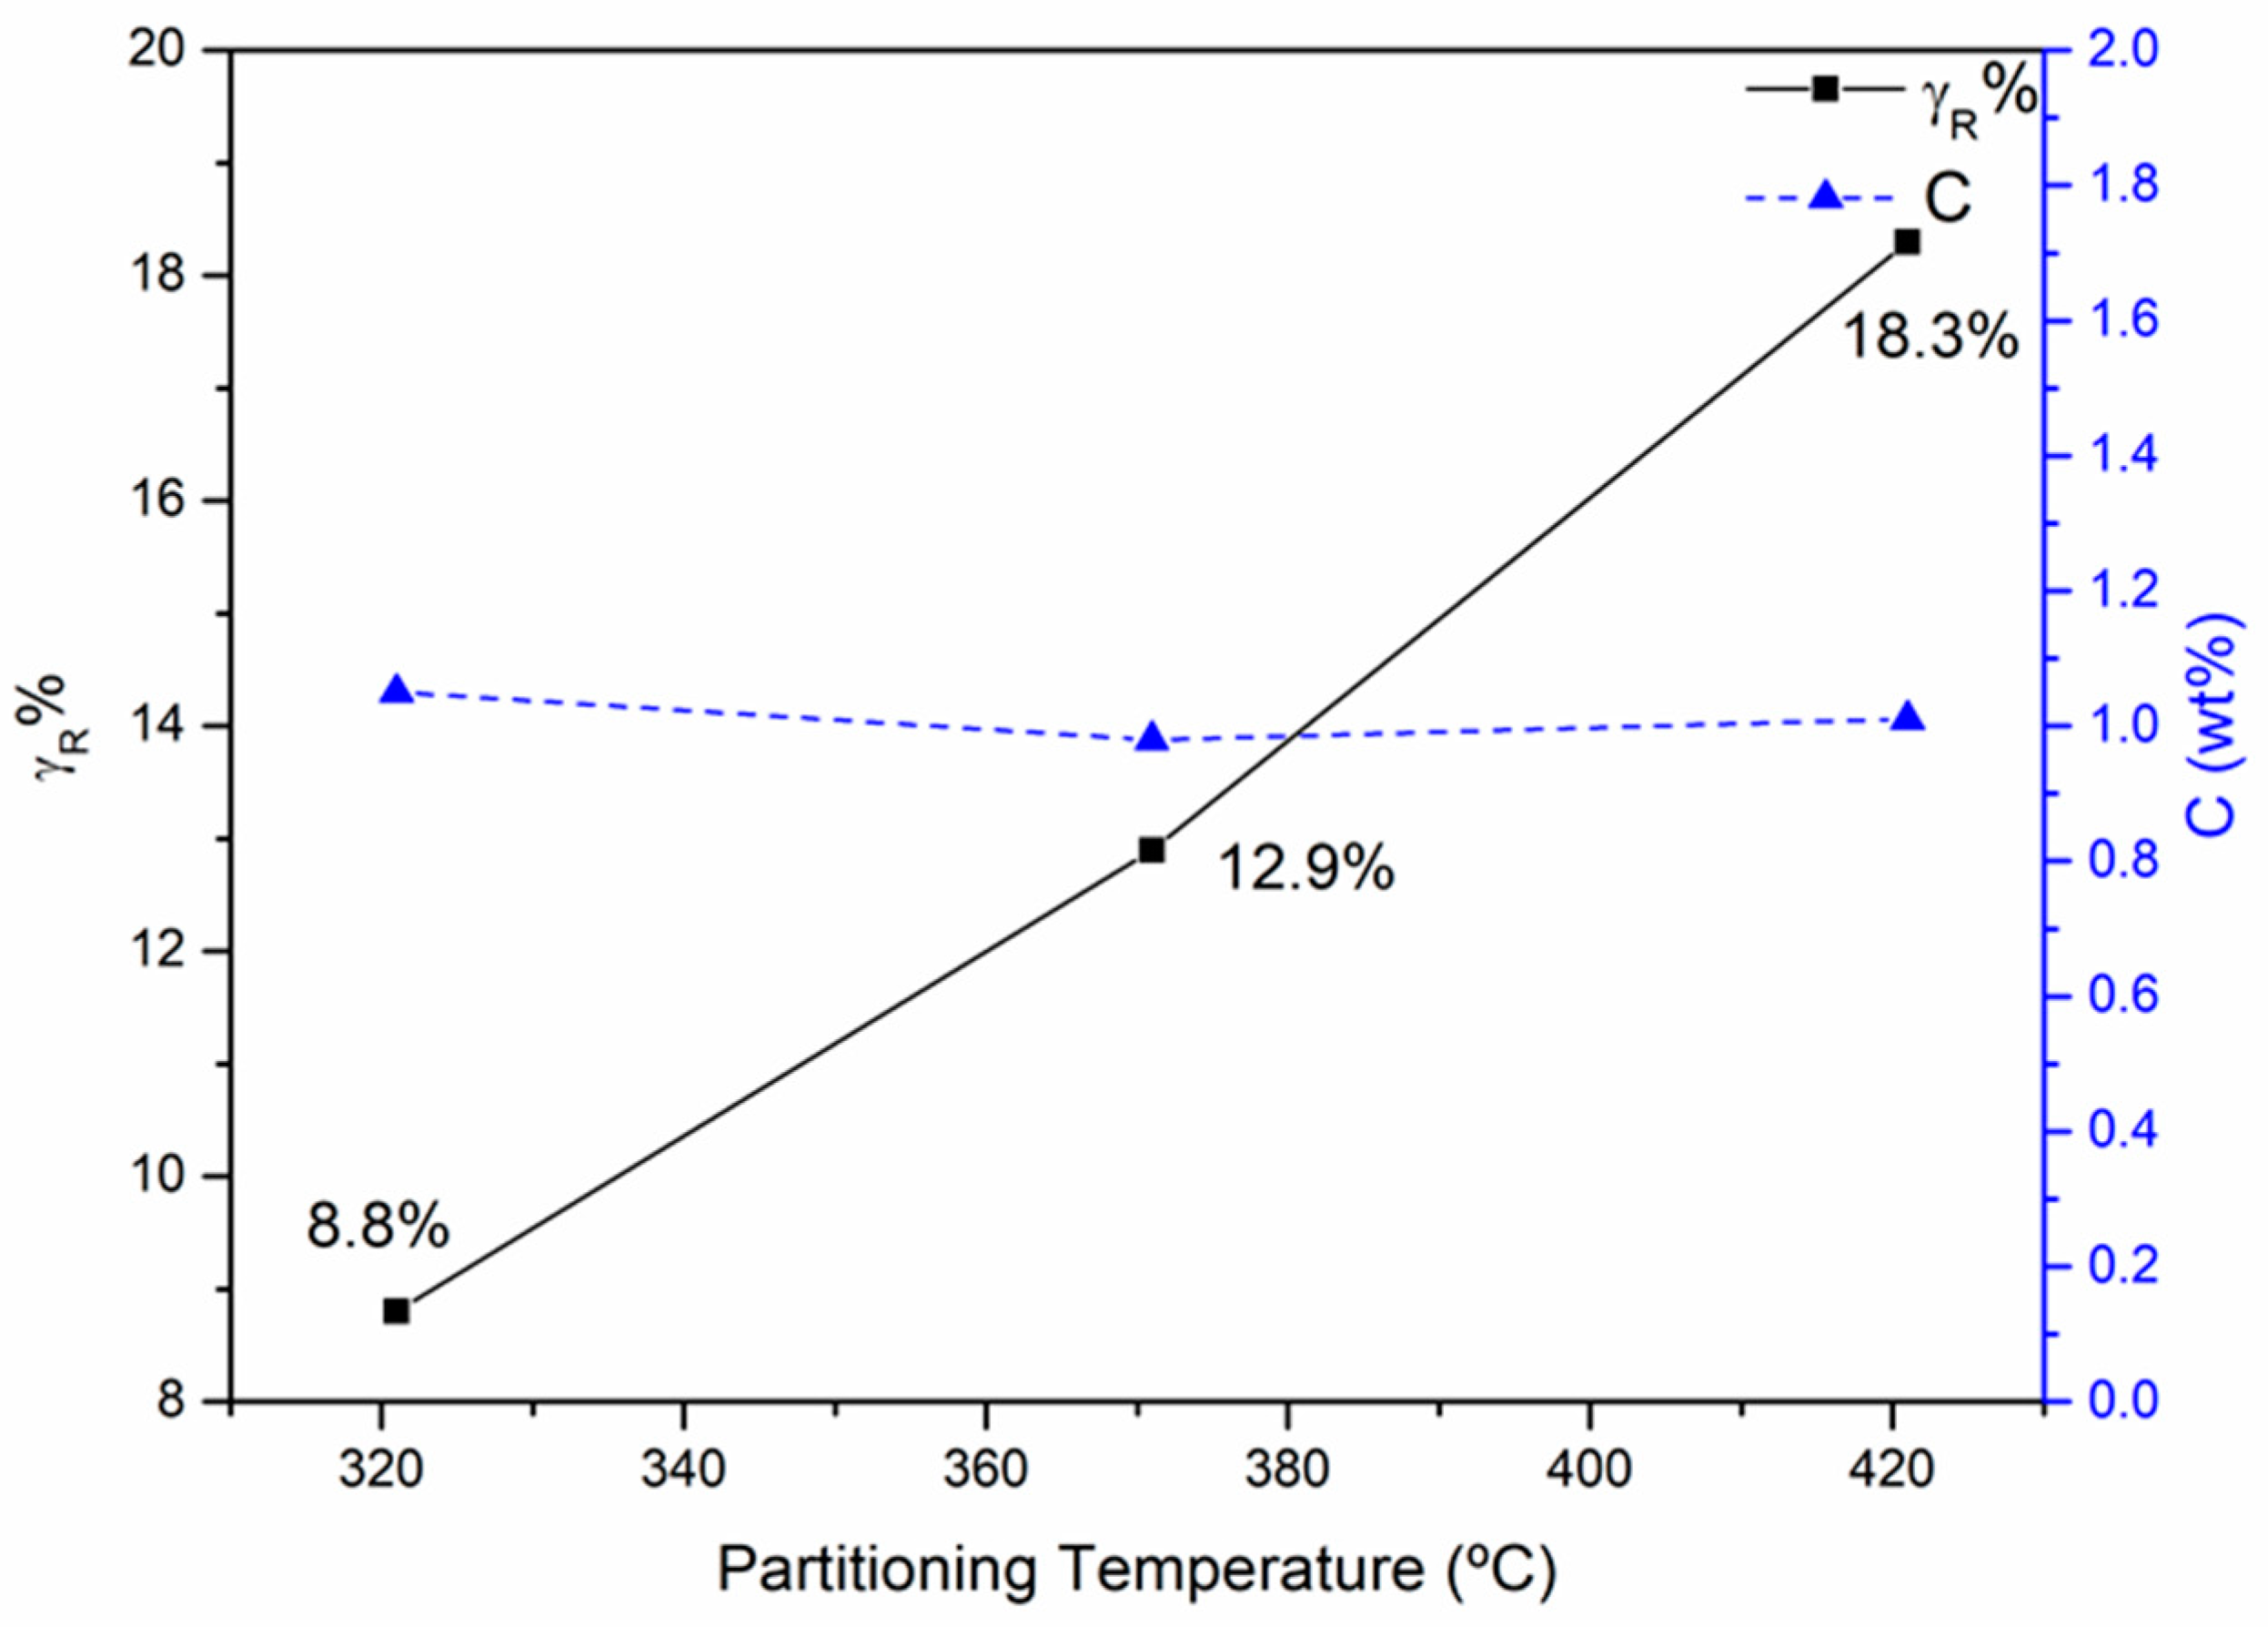
  • QP-421 displays the highest fraction of retained austenite of 18.3%. These results are still below the estimated RA by the Speers model (29%).
  • The increment in partitioning temperature shows a significant increment in RA, from 8.8 to 18.3%, in the QP process measured by XRD.
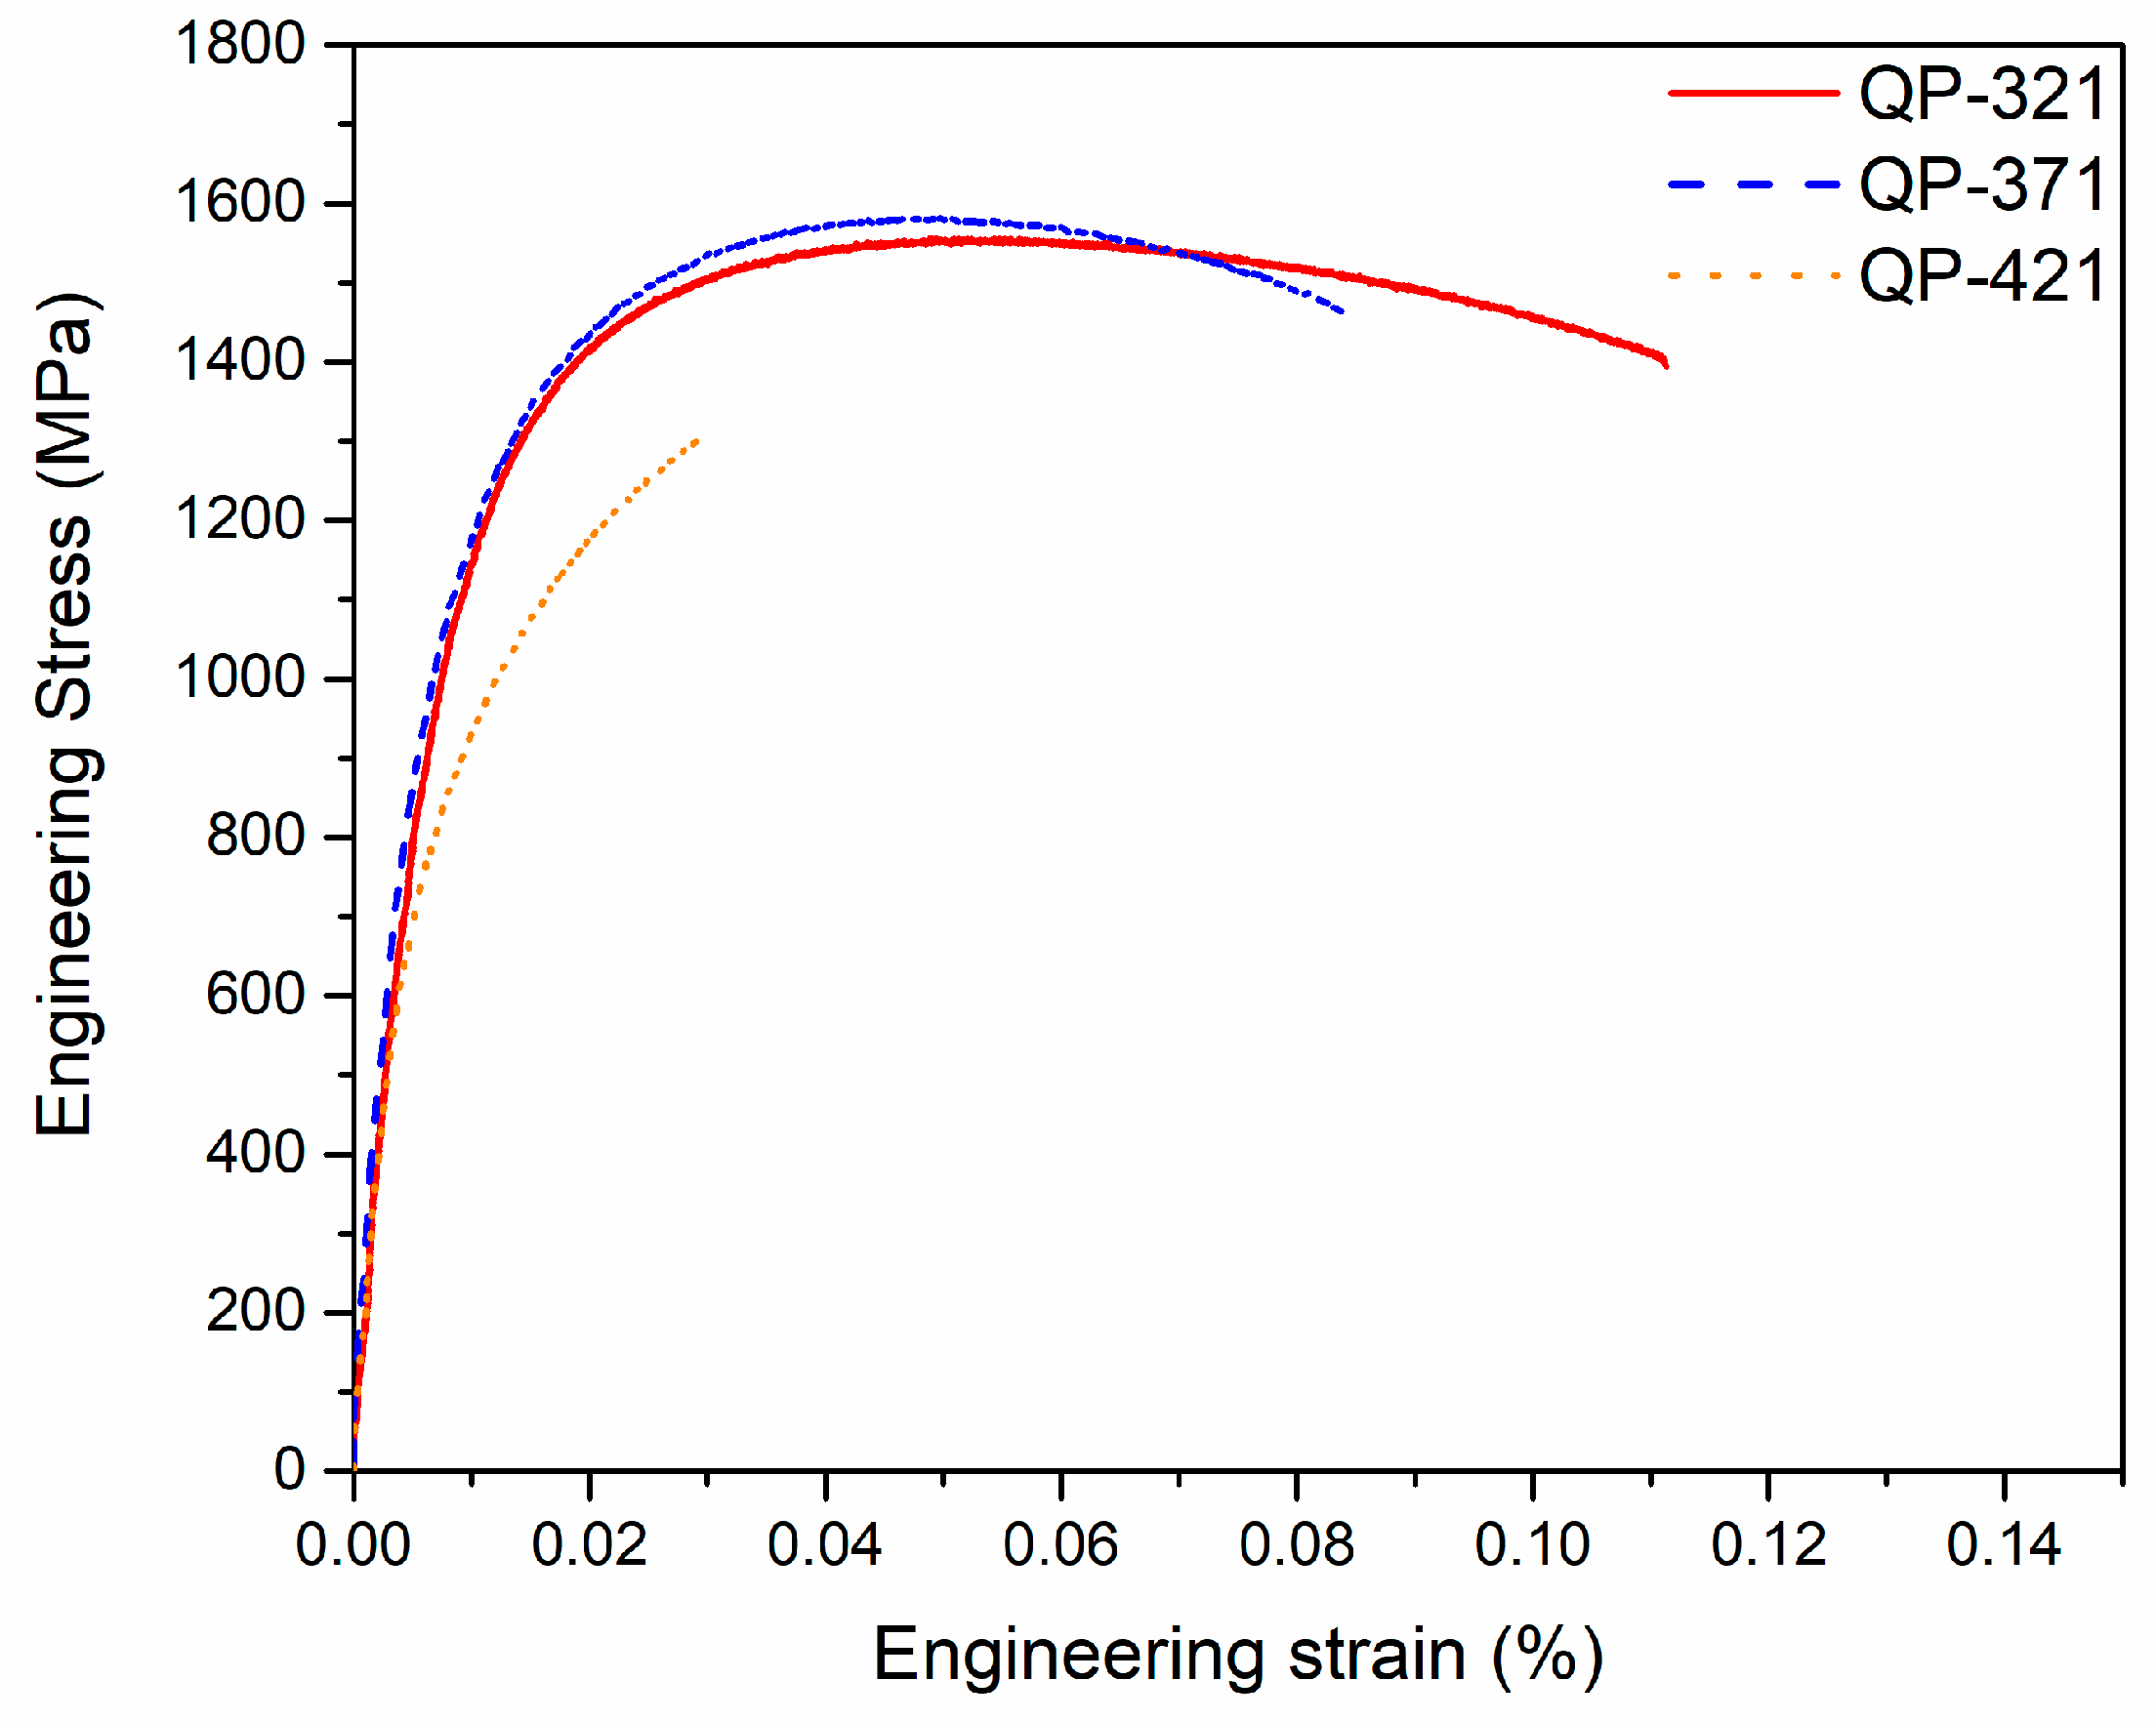
  • High mechanical properties were observed due to the presence of tempered and fresh martensite. The work-hardening exponent increased in conditions with a higher RA fraction. However, improvement in ductility in terms of elongation was not evidenced at increasing RA fractions. In other words, although RA increments are in principle beneficial for formability, elongation is penalized with a large amount of fresh martensite. According to the results, the optimum QP treatment would correspond to the QP-321 condition that shows a more homogeneous microstructure, with a total amount of finely distributed RA close to 8.8% (after XRD measurements).

Author Contributions

Conceptualization, J.M.C. and O.G.; methodology, M.C.; validation, M.C., O.G., J.P.P. and J.C.; formal analysis, M.C. and J.M.C.; investigation, M.C.; resources, O.G., J.P.P. and J.M.C.; writing—original draft preparation, M.C.; writing—review and editing, J.M.C., O.G., J.C. and J.P.P.; visualization, M.C.; supervision, J.M.C. and J.C.; project administration, J.M.C. and O.G.; funding acquisition, O.G. and J.P.P. All authors have read and agreed to the published version of the manuscript.

Funding

This research received no external funding.

Institutional Review Board Statement

Not applicable.

Informed Consent Statement

Not applicable.

Data Availability Statement

Data can be provided upon request.

Acknowledgments

M.C. acknowledges his scholarship funded by CONACYT México.

Conflicts of Interest

The authors declare no conflict of interest.

References

  1. Fonstein, N. Advanced high strength sheet steels. In Advanced High Strength Sheet Steels; Springer: Berlin/Heidelberg, Germany, 2015; pp. 12–16. [Google Scholar]
  2. Speer, J.G.; Streicher, A.M.; Matlock, D.K.; Rizzo, F.; Krauss, G. Quenching and partitioning: A fundamentally new process to create high strength trip sheet microstructures. In Proceedings of the A Symposium on the Thermodynamics, Kinetics, Characterization and Modeling of Austenite Formation and Decomposition Held at the Materials Science & Technology, Chicago, IL, USA, 9–12 November 2003; pp. 505–522. [Google Scholar]
  3. Speer, J.G.; De Moor, E.; Findley, K.; Matlock, D.K.; De Cooman, B.C.; Edmonds, D.V. Analysis of Microstructure Evolution in Quenching and Partitioning Automotive Sheet Steel. Met. Mater. Trans. A 2011, 42, 3591–3601. [Google Scholar] [CrossRef]
  4. Ayenampudi, S.; Celada-Casero, C.; Sietsma, J.; Santofimia, M. Microstructure evolution during high-temperature partitioning of a medium-Mn quenching and partitioning steel. Materials 2019, 8, 100492. [Google Scholar] [CrossRef]
  5. Edmonds, D.; He, K.; Rizzo, F.; De Cooman, B.; Matlock, D.; Speer, J. Quenching and partitioning martensite—A novel steel heat treatment. Mater. Sci. Eng. A 2006, 438–440, 25–34. [Google Scholar] [CrossRef]
  6. Wang, L.; Speer, J.G. Quenching and Partitioning Steel Heat Treatment. Met. Microstruct. Anal. 2013, 2, 268–281. [Google Scholar] [CrossRef] [Green Version]
  7. Santofimia, M.; Zhao, L.; Petrov, R.; Kwakernaak, C.; Sloof, W.; Sietsma, J. Microstructural development during the quenching and partitioning process in a newly designed low-carbon steel. Acta Mater. 2011, 59, 6059–6068. [Google Scholar] [CrossRef]
  8. Jiang, H.-T.; Zhuang, B.-T.; Duan, X.-G.; Wu, Y.-X.; Cai, Z.-X. Element distribution and diffusion behavior in Q&P steel during partitioning. Int. J. Miner. Met. Mater. 2013, 20, 1050–1059. [Google Scholar] [CrossRef]
  9. Speer, J.G.; Assunção, F.C.R.; Matlock, D.K.; Edmonds, D.V. The “quenching and partitioning” process: Background and recent progress. Mater. Res. 2005, 8, 417–423. [Google Scholar] [CrossRef] [Green Version]
  10. De Knijf, D.; Petrov, R.; Föjer, C.; Kestens, L.A. Effect of fresh martensite on the stability of retained austenite in quenching and partitioning steel. Mater. Sci. Eng. A 2014, 615, 107–115. [Google Scholar] [CrossRef]
  11. Tsuchiyama, T.; Tobata, J.; Tao, T.; Nakada, N.; Takaki, S. Quenching and partitioning treatment of a low-carbon martensitic stainless steel. Mater. Sci. Eng. A 2012, 532, 585–592. [Google Scholar] [CrossRef]
  12. Hidalgo, J.; Celada-Casero, C.; Santofimia, M. Fracture mechanisms and microstructure in a medium Mn quenching and partitioning steel exhibiting macrosegregation. Mater. Sci. Eng. A 2019, 754, 766–777. [Google Scholar] [CrossRef]
  13. De Avillez, R.R.; da Costa e Silva, A.L.V.; Martins, A.R.F.A.; Assunção, F.C.R. The effect of alloying elements on constrained carbon equilibrium due to a quench and partition process. Int. J. Mater. Res. 2008, 99, 1280–1284. [Google Scholar] [CrossRef]
  14. Seo, E.J.; Cho, L.; De Cooman, B.C. Kinetics of the partitioning of carbon and substitutional alloying elements during quenching and partitioning (Q&P) processing of medium Mn steel. Acta Mater. 2016, 107, 354–365. [Google Scholar] [CrossRef]
  15. Speer, J.; Matlock, D.K.; De Cooman, B.C.; Schroth, J.G. Carbon partitioning into austenite after martensite transformation. Acta Mater. 2003, 51, 2611–2622. [Google Scholar] [CrossRef]
  16. Hou, Z.R.; Zhao, X.M.; Zhang, W.; Liu, H.L.; Yi, H.L. A medium manganese steel designed for water quenching and partitioning. Mater. Sci. Technol. 2018, 34, 1168–1175. [Google Scholar] [CrossRef]
  17. Lee, S.; Lee, S.-J.; De Cooman, B.C. Austenite stability of ultrafine-grained transformation-induced plasticity steel with Mn partitioning. Scr. Mater. 2011, 65, 225–228. [Google Scholar] [CrossRef]
  18. De Moor, E.; Matlock, D.K.; Speer, J.G.; Merwin, M.J. Austenite stabilization through manganese enrichment. Scr. Mater. 2011, 64, 185–188. [Google Scholar] [CrossRef]
  19. De Moor, E.; Kang, S.; Speer, J.G.; Matlock, D.K. Manganese diffusion in third generation advanced high strength steels. In Proceedings of the International Conference on Mining, Materials and Metallurgical Engineering, Prague, Czech Republic, 11–12 August 2011; pp. 1–7. [Google Scholar]
  20. Lee, S.-J.; Lee, S.; De Cooman, B.C. Mn partitioning during the intercritical annealing of ultrafine-grained 6% Mn transformation-induced plasticity steel. Scr. Mater. 2011, 64, 649–652. [Google Scholar] [CrossRef]
  21. Lee, S.; De Cooman, B.C. On the Selection of the Optimal Intercritical Annealing Temperature for Medium Mn TRIP Steel. Met. Mater. Trans. A 2013, 44, 5018–5024. [Google Scholar] [CrossRef] [Green Version]
  22. Jirková, H.; Kučerová, L.; Mašek, B. Effect of Quenching and Partitioning Temperatures in the Q-P Process on the Properties of AHSS with Various Amounts of Manganese and Silicon. Mater. Sci. Forum 2012, 706–709, 2734–2739. [Google Scholar] [CrossRef] [Green Version]
  23. Sun, J.; Yu, H. Microstructure development and mechanical properties of quenching and partitioning (Q&P) steel and an incorporation of hot-dipping galvanization during Q&P process. Mater. Sci. Eng. A 2013, 586, 100–107. [Google Scholar] [CrossRef]
  24. Santofimia, M.; Zhao, L.; Sietsma, J. Model for the interaction between interface migration and carbon diffusion during annealing of martensite–austenite microstructures in steels. Scr. Mater. 2008, 59, 159–162. [Google Scholar] [CrossRef]
  25. Clarke, A.; Speer, J.; Matlock, D.; Rizzo, F.; Edmonds, D.; Santofimia, M. Influence of carbon partitioning kinetics on final austenite fraction during quenching and partitioning. Scr. Mater. 2009, 61, 149–152. [Google Scholar] [CrossRef] [Green Version]
  26. Clarke, A.; Speer, J.; Miller, M.; Hackenberg, R.; Edmonds, D.; Matlock, D.; Rizzo, F.; Clarke, K.; De Moor, E. Carbon partitioning to austenite from martensite or bainite during the quench and partition (Q&P) process: A critical assessment. Acta Mater. 2008, 56, 16–22. [Google Scholar] [CrossRef]
  27. Koistinen, D.; Marburger, R. A general equation prescribing the extent of the austenite-martensite transformation in pure iron-carbon alloys and plain carbon steels. Acta Met. 1959, 7, 59–60. [Google Scholar] [CrossRef]
  28. Van Bohemen, S.M.C. Bainite and martensite start temperature calculated with exponential carbon dependence. Mater. Sci. Technol. 2012, 28, 487–495. [Google Scholar] [CrossRef]
  29. De Diego-Calderón, I.; De Knijf, D.; Molina-Aldareguia, J.M.; Sabirov, I.; Föjer, C.; Petrov, R. Effect of Q&P parameters on microstructure development and mechanical behaviour of Q&P steels. Rev. Met. 2015, 51, e035. [Google Scholar] [CrossRef] [Green Version]
  30. Santofimia, M.; Zhao, L.; Petrov, R.; Sietsma, J. Characterization of the microstructure obtained by the quenching and partitioning process in a low-carbon steel. Mater. Charact. 2008, 59, 1758–1764. [Google Scholar] [CrossRef]
  31. Lutterotti, L.; Gialanella, S. X-ray diffraction characterization of heavily deformed metallic specimens. Acta Mater. 1998, 46, 101–110. [Google Scholar] [CrossRef]
  32. Cullity, B.D. Elements of X-ray Diffraction; Adison–Wesley Publishing: Boston, MA, USA, 1967. [Google Scholar]
  33. Lee, S.; De Cooman, B.C. Tensile Behavior of Intercritically Annealed 10 pct Mn Multi-phase Steel. Met. Mater. Trans. A 2013, 45, 709–716. [Google Scholar] [CrossRef] [Green Version]
  34. Fadel, A.; Gliŝić, D.; Radović, N.; Drobnjak, D. Influence of Cr, Mn and Mo Addition on Structure and Properties of V Microalloyed Medium Carbon Steels. J. Mater. Sci. Technol. 2012, 28, 1053–1058. [Google Scholar] [CrossRef]
  35. Caballero, F.; Santofimia, M.J.; Garcia-Mateo, C.; De Andrés, C.G. Time-Temperature-Transformation Diagram within the Bainitic Temperature Range in a Medium Carbon Steel. Mater. Trans. 2004, 45, 3272–3281. [Google Scholar] [CrossRef] [Green Version]
  36. Matsuda, H.; Mizuno, R.; Funakawa, Y.; Seto, K.; Matsuoka, S.; Tanaka, Y. Effects of auto-tempering behaviour of martensite on mechanical properties of ultra high strength steel sheets. J. Alloys Compd. 2013, 577, S661–S667. [Google Scholar] [CrossRef]
  37. Ramesh Babu, S.; Nyyssönen, T.; Jaskari, M.; Järvenpää, A.; Davis, T.P.; Pallaspuro, S.; Kömi, J.; Porter, D. Observations on the Relationship between Crystal Orientation and the Level of Auto-Tempering in an As-Quenched Martensitic Steel. Metals 2019, 9, 1255. [Google Scholar] [CrossRef] [Green Version]
  38. Navarro-López, A.; Hidalgo, J.; Sietsma, J.; Santofimia, M.J. Characterization of bainitic/martensitic structures formed in isothermal treatments below the Ms temperature. Mater. Charact. 2017, 128, 248–256. [Google Scholar] [CrossRef]
  39. Huyghe, P.; Malet, L.; Caruso, M.; Georges, C.; Godet, S. On the relationship between the multiphase microstructure and the mechanical properties of a 0.2C quenched and partitioned steel. Mater. Sci. Eng. A 2017, 701, 254–263. [Google Scholar] [CrossRef]
  40. HajyAkbary, F.; Sietsma, J.; Miyamoto, G.; Furuhara, T.; Santofimia, M.J. Interaction of carbon partitioning, carbide precipitation and bainite formation during the Q&P process in a low C steel. Acta Mater. 2016, 104, 72–83. [Google Scholar] [CrossRef]
  41. Celada-Casero, C.; Kwakernaak, C.; Sietsma, J.; Santofimia, M.J. The influence of the austenite grain size on the microstructural development during quenching and partitioning processing of a low-carbon steel. Mater. Des. 2019, 178, 107847. [Google Scholar] [CrossRef]
  42. HajyAkbary, F.; Sietsma, J.; Petrov, R.H.; Miyamoto, G.; Furuhara, T.; Santofimia, M.J. A quantitative investigation of the effect of Mn segregation on microstructural properties of quenching and partitioning steels. Scr. Mater. 2017, 137, 27–30. [Google Scholar] [CrossRef]
  43. Zhao, Z.Z.; Liang, J.H.; Zhao, A.M.; Liang, J.T.; Tang, D.; Gao, Y.P. Effects of the austenitizing temperature on the mechanical properties of cold-rolled medium-Mn steel system. J. Alloys Compd. 2017, 691, 51–59. [Google Scholar] [CrossRef] [Green Version]
  44. Li, Y.; Kang, J.; Zhang, W.; Liu, D.; Wang, X.; Yuan, G.; Misra, R.; Wang, G. A novel phase transition behavior during dynamic partitioning and analysis of retained austenite in quenched and partitioned steels. Mater. Sci. Eng. A 2018, 710, 181–191. [Google Scholar] [CrossRef]
  45. Liu, L.; He, B.B.; Cheng, G.J.; Yen, H.W.; Huang, M.X. Optimum properties of quenching and partitioning steels achieved by balancing fraction and stability of retained austenite. Scr. Mater 2018, 150, 1–6. [Google Scholar] [CrossRef]
  46. Krauss, G. Steels: Processing, Structure, and Performance, 2nd ed.; ASM International, Metals Park: Russell Township, OH, USA, 2015. [Google Scholar]
  47. Dong, B.; Hou, T.; Zhou, W.; Zhang, G.; Wu, K. The Role of Retained Austenite and Its Carbon Concentration on Elongation of Low Temperature Bainitic Steels at Different Austenitising Temperature. Metals 2018, 8, 931. [Google Scholar] [CrossRef] [Green Version]
  48. Zhang, L.; Wang, C.-Y.; Lu, H.-C.; Cao, W.-Q.; Wang, C.; Dong, H.; Chen, L. Austenite transformation and work hardening of medium manganese steel. J. Iron Steel Res. Int. 2018, 25, 1265–1269. [Google Scholar] [CrossRef]
  49. Kozłowska, A.; Grajcar, A. Effect of Elevated Deformation Temperatures on Microstructural and Tensile Behavior of Si-Al Alloyed TRIP-Aided Steel. Materials 2020, 13, 5284. [Google Scholar] [CrossRef] [PubMed]
Figure 1. Thermal process to develop QP steels. QT and PT correspond to quenching and partitioning temperatures [5]. Copyright obtained from Elsevier. Ci, Cγ, and Cm are the carbon contents of the initial alloy, austenite, and martensite, respectively. Reproduced with permission of the editor.
Metals 11 01136 g001
Figure 2. Predicted phase fractions of the microstructure after the QP process [5]. Copyright obtained from Elsevier. The solid bold line corresponds to the final austenite fraction at room temperature. Solid lines illustrate the austenite (γ) and martensite (M) fraction at the first quenching temperature, and the dash-dotted line represents the as-quenched or fresh martensite that forms during the final quench. Reproduced with permission of the editor.
Metals 11 01136 g002
Figure 3. Schematic of the heat treatments applied to the present steel.
Metals 11 01136 g003
Figure 4. (a) Continuous cooling transformation (CCT) diagram of the present steel, (b) hardness values in each CCT condition.
Metals 11 01136 g004
Figure 5. Estimated austenite fraction after the QP process in a full austenitization condition for the current steel. Derivation of the optimal quenching temperature.
Metals 11 01136 g005
Figure 6. SEM micrograph of the as-received microstructure of the present steel. (a) General view, (b) magnification of red area in (a).
Metals 11 01136 g006
Figure 7. SEM micrographs after the QP process at (a) QP-321, (b) QP-371, (c) QP-421 s. M1 stands for tempered martensite, M2 for fresh martensite, and RA for retained austenite.
Metals 11 01136 g007aMetals 11 01136 g007b
Figure 8. SEM micrograph of sample QP-421. M1 stands for tempered martensite, M2 for fresh martensite, RA for retained austenite and carbides of M1.
Metals 11 01136 g008
Figure 9. EBSD image quality (IQ) and phase maps after the current QP process. (a) QP-321, (b) QP-371, (c) QP-421. Blue corresponds to areas identified as retained austenite (RA).
Metals 11 01136 g009aMetals 11 01136 g009b
Figure 10. Retained austenite volume fraction and carbon amount in wt% obtained by XRD.
Metals 11 01136 g010
Figure 11. Tensile properties of the studied steel QP-x.
Metals 11 01136 g011
Figure 12. Fracture surface of tensile samples. (a) QP-321, (b) QP-371, (c) QP-421.
Metals 11 01136 g012aMetals 11 01136 g012b
Table 1. Chemical composition (wt%) of the present steel.
CMnSi
0.23.51.5
Table 2. Critical transformation temperatures measured by dilatometry.
Ac1Ac3MsMf
729 °C869 °C321 °C206 °C
Table 3. Volume fraction of retained austenite measured by EBSD and XRD.
SampleRetained Austenite by EBSDRetained Austenite by XRD
QP-3211.1%8.8%
QP-3714.6%12.9%
QP-4218.4%18.3%
Table 4. Results of mechanical properties of studied steel.
SampleHardness (HV)Ys (MPa)UTS (MPa)El (%)(n)Ag (MPa)
QP-3214481190155611.10.129.68
QP-371408114015838.30.137.15
QP-421404832130530.32.20
Publisher’s Note: MDPI stays neutral with regard to jurisdictional claims in published maps and institutional affiliations.

