
Non-Isothermal Reduction Kinetics of Iron Ore Fines with Carbon-Bearing Materials

 , and
, and
Abstract
:1. Introduction
2. Theoretical Kinetic Analysis
3. Materials and Experimental Technique
3.1. Raw Materials
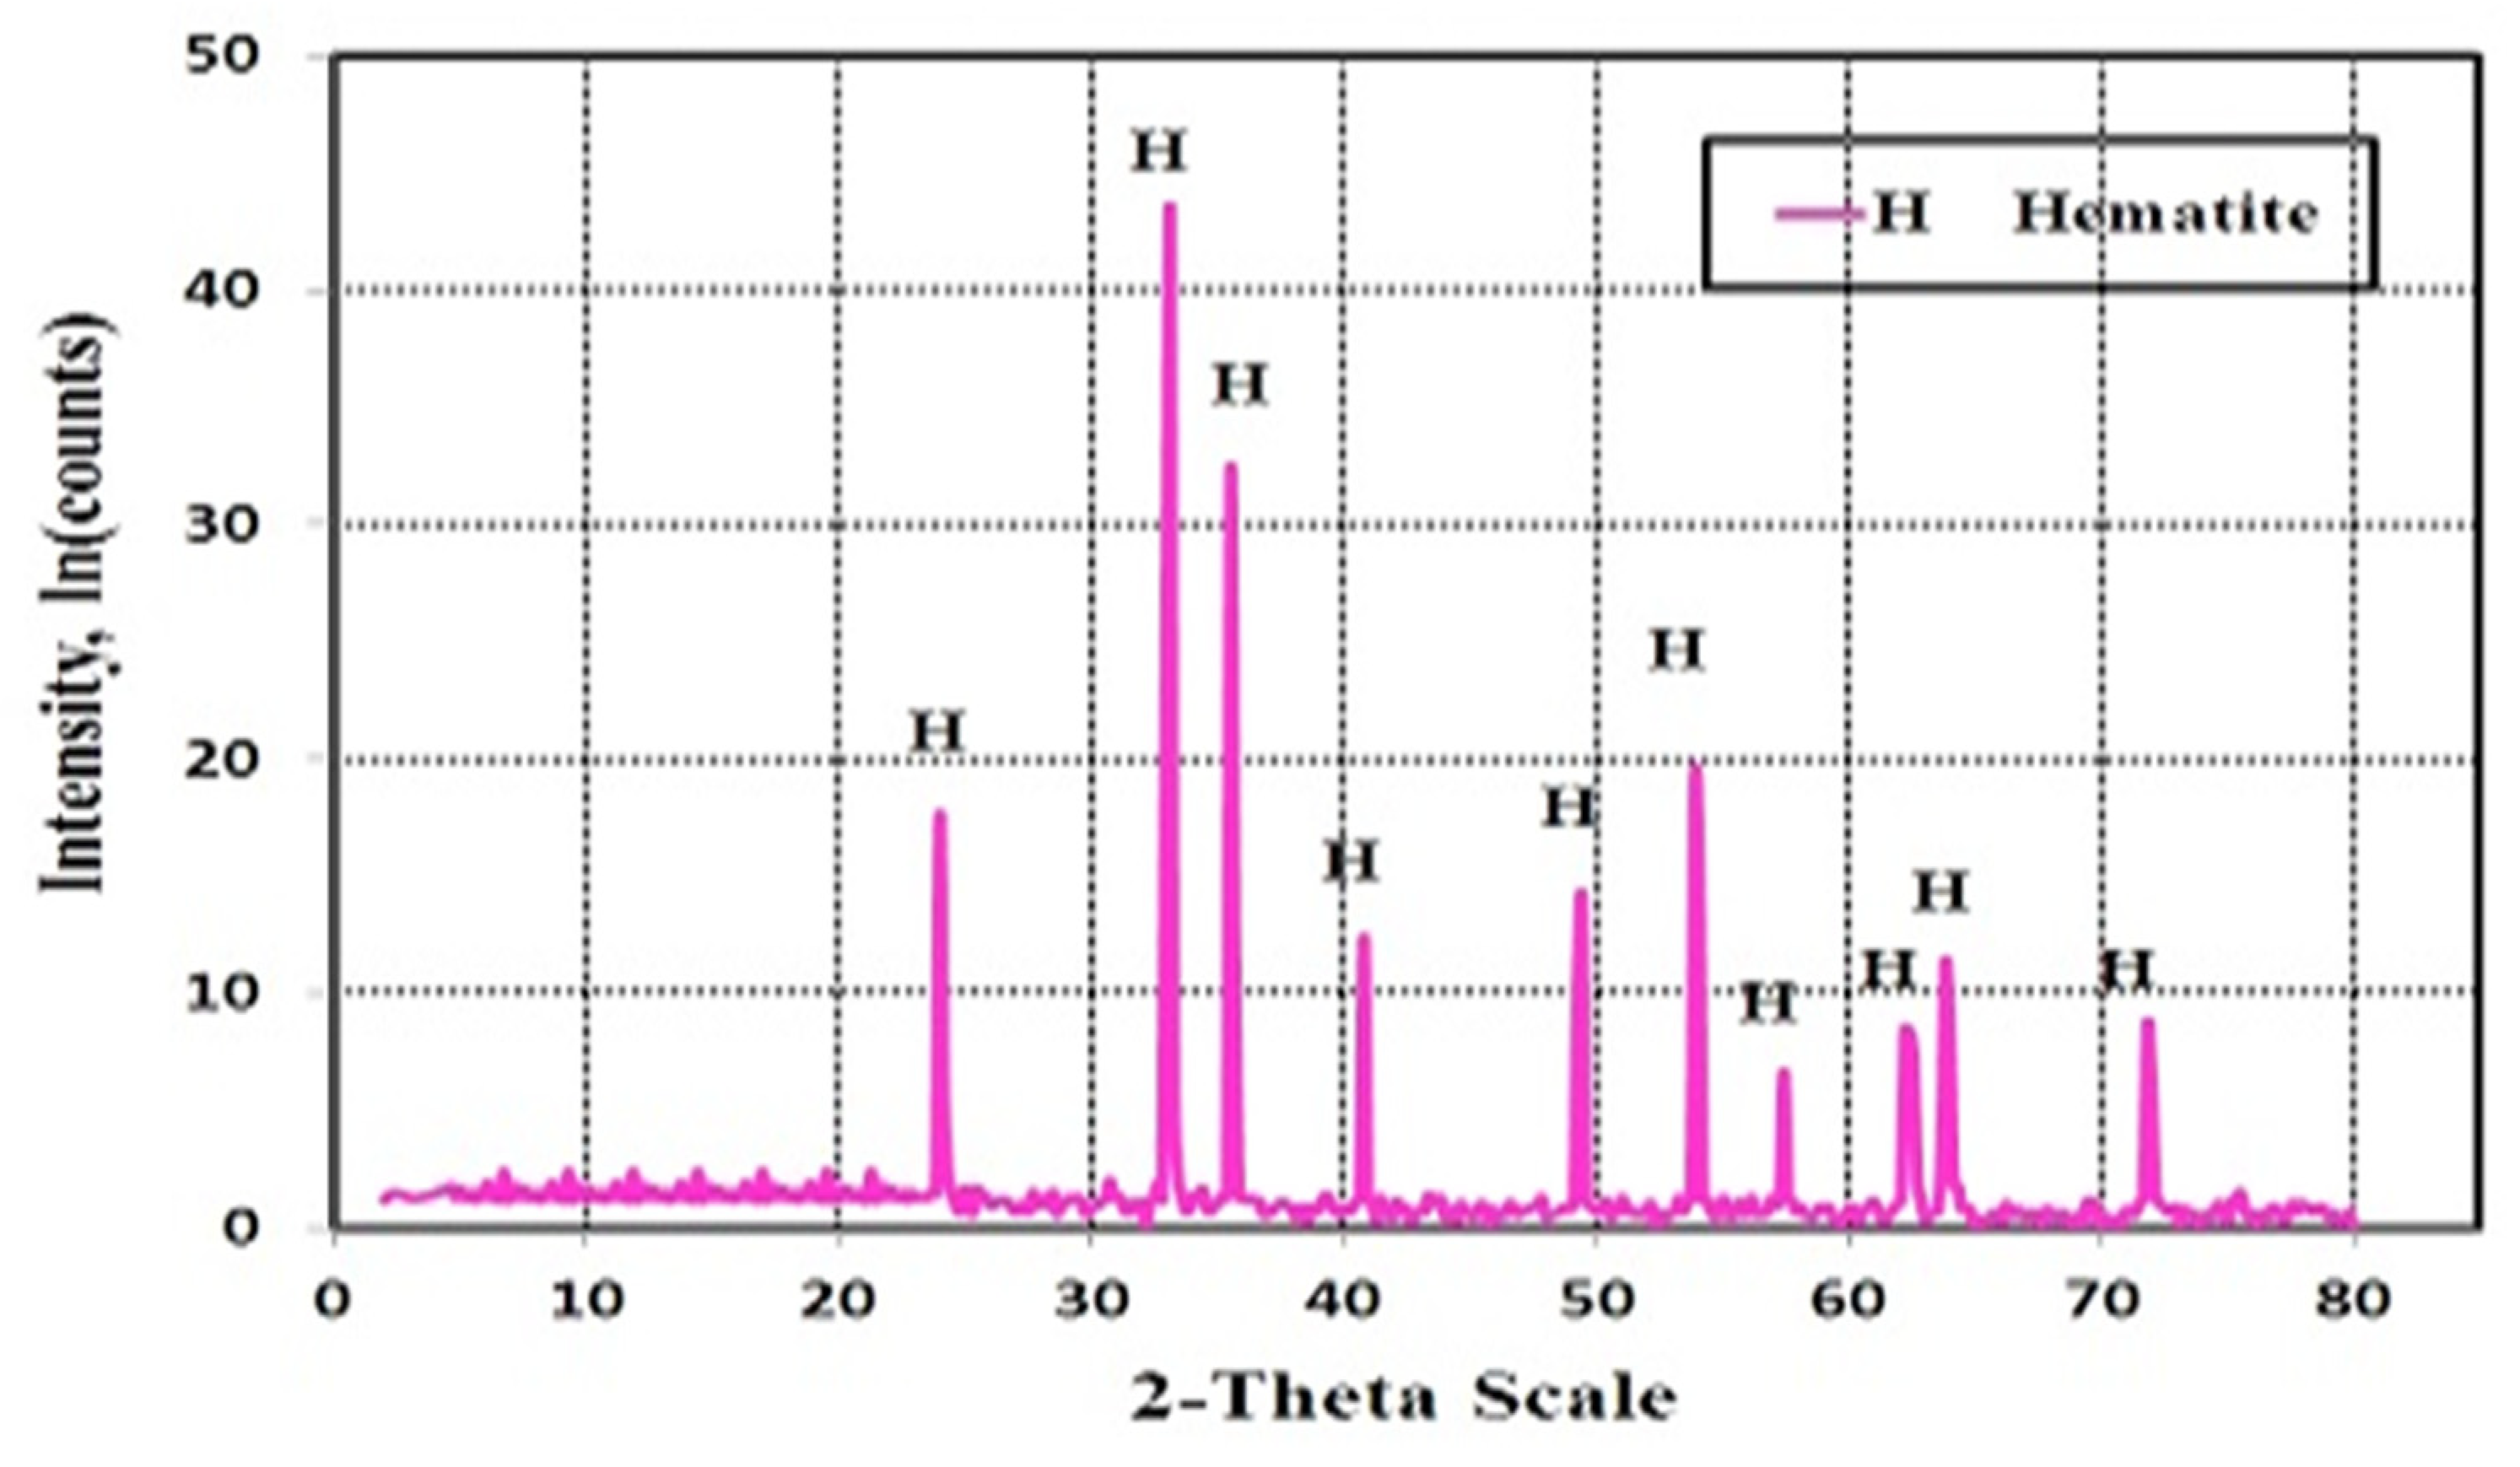
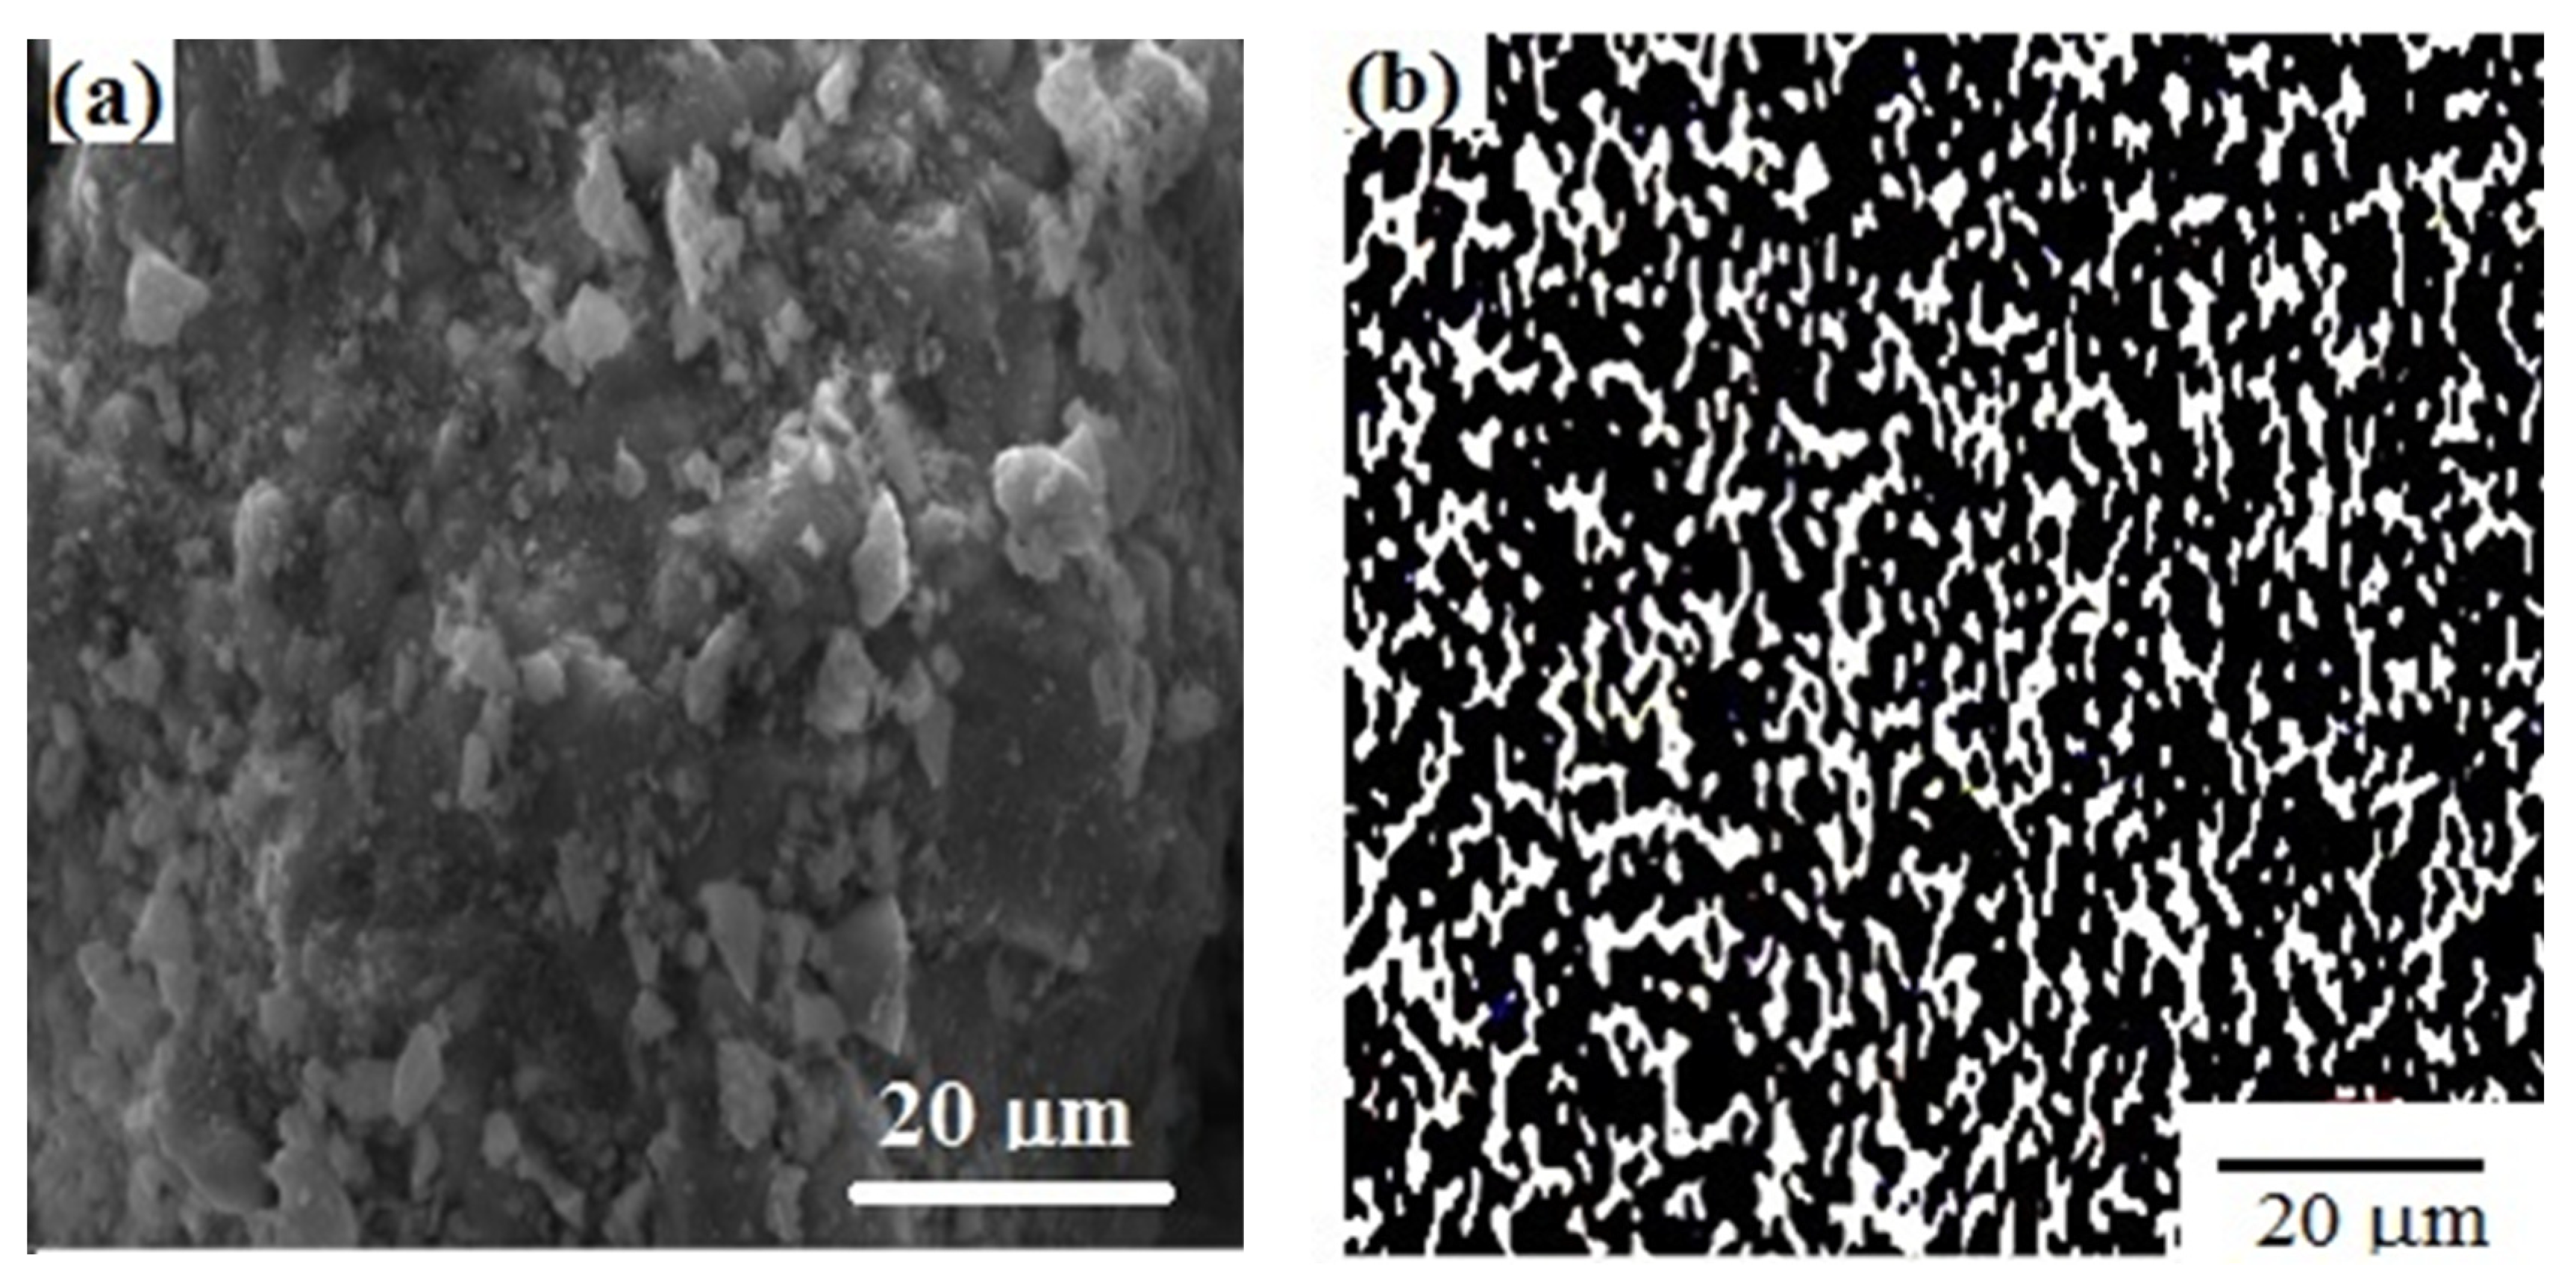
3.1.1. Iron Ore Fines
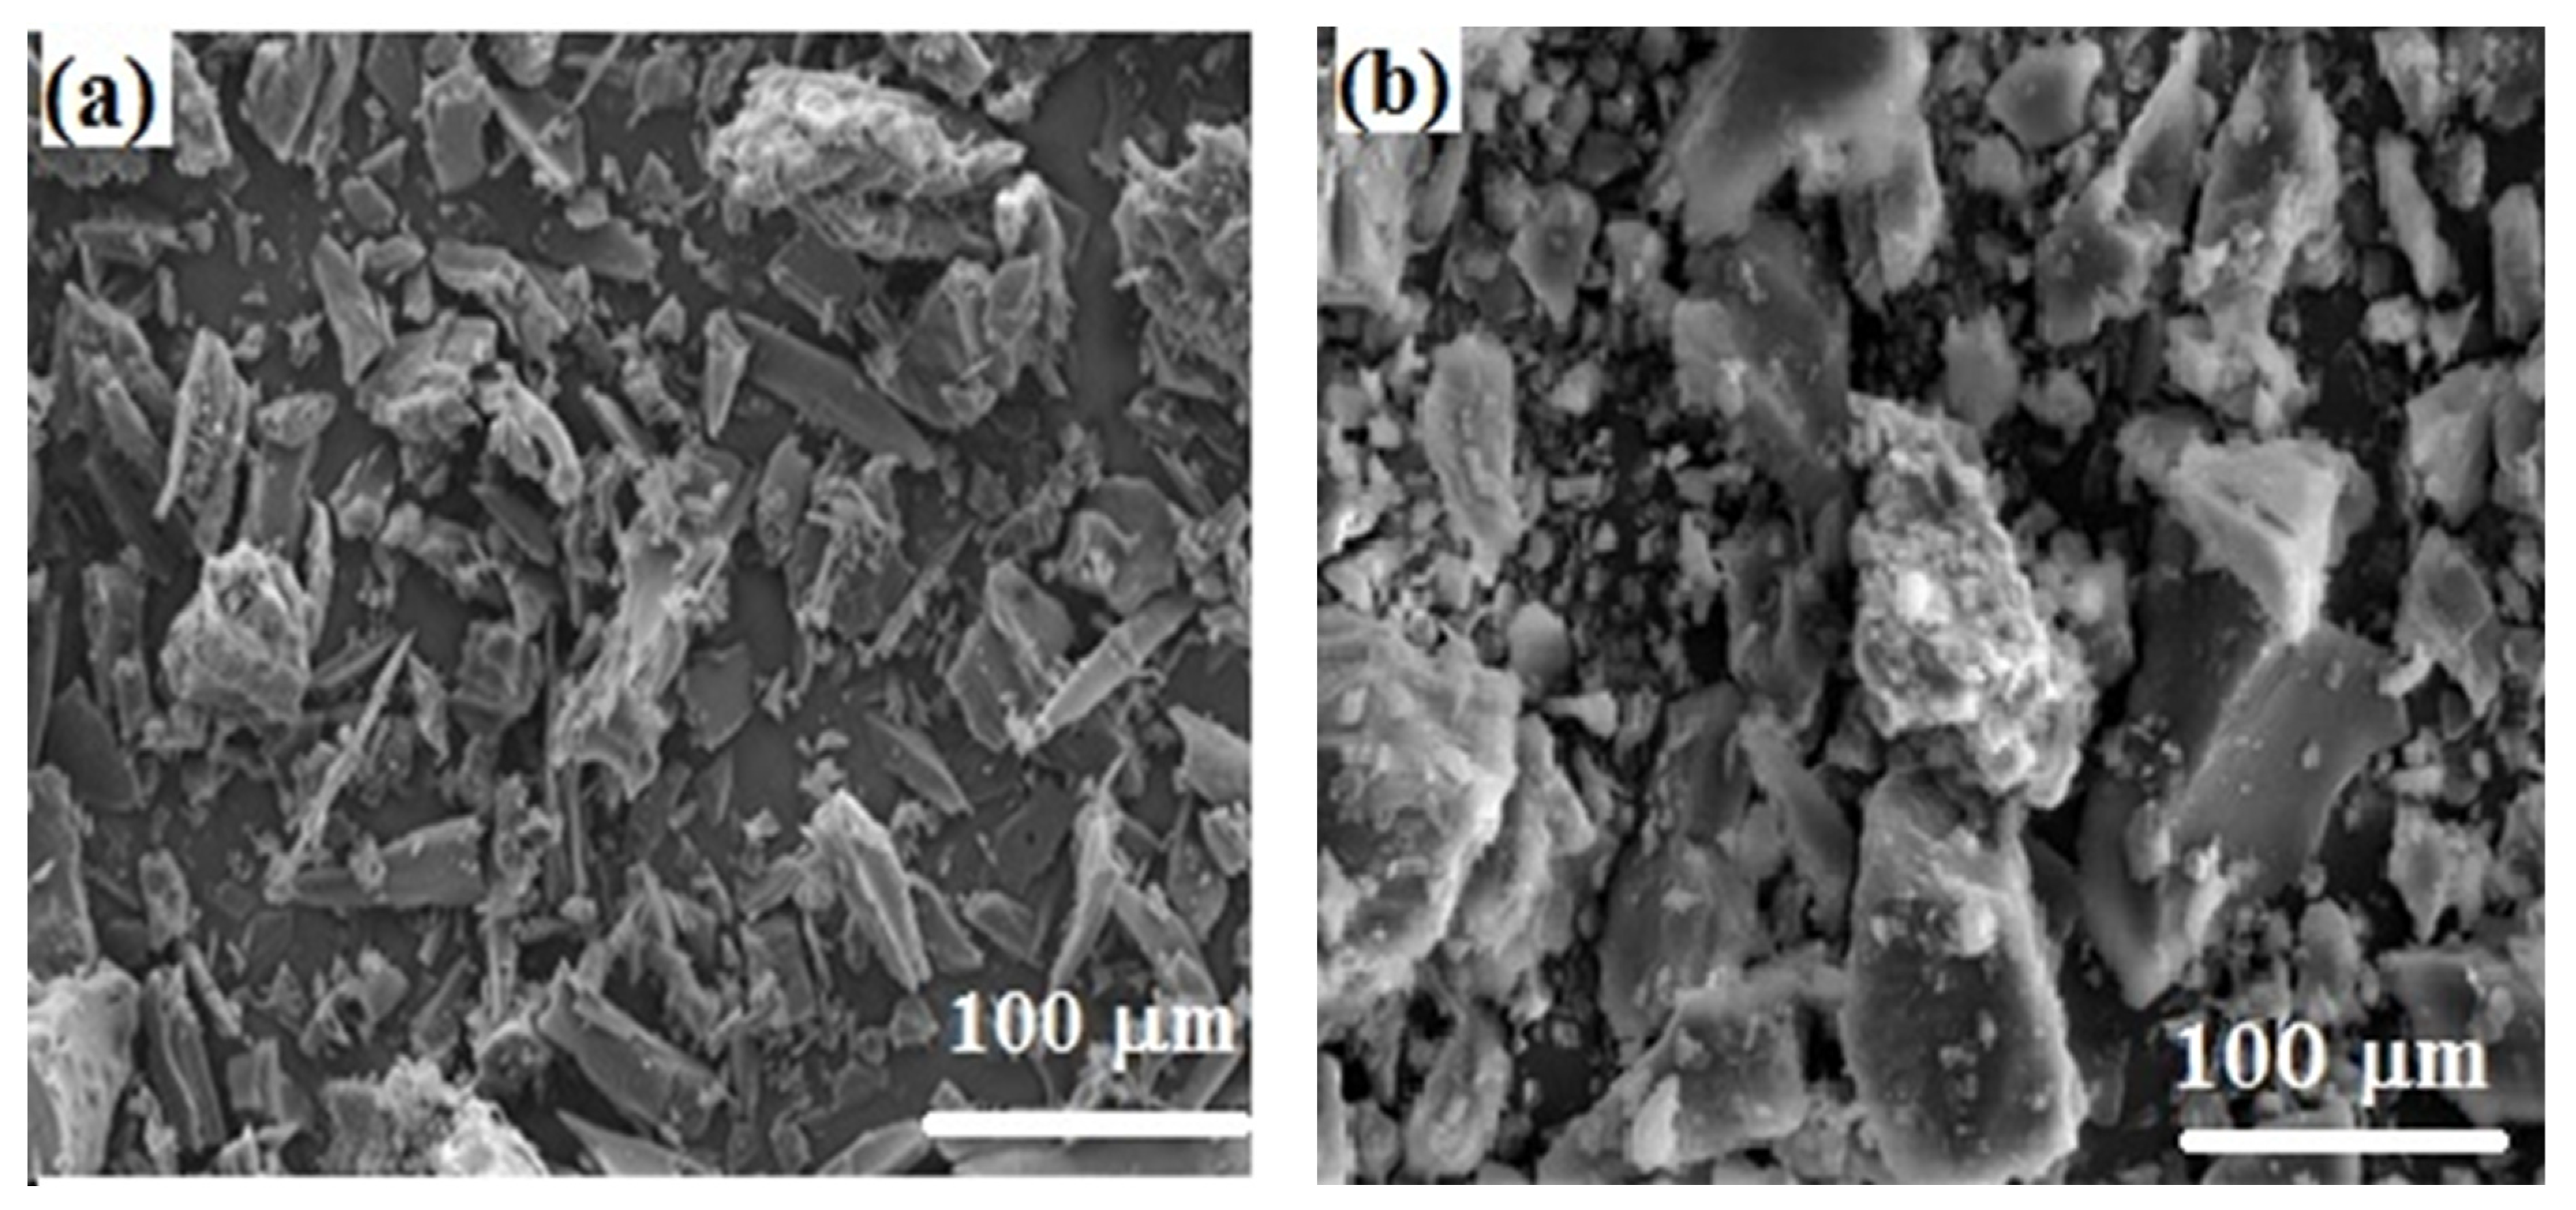
3.1.2. Carbon-Bearing Materials
3.2. Composite Preparation
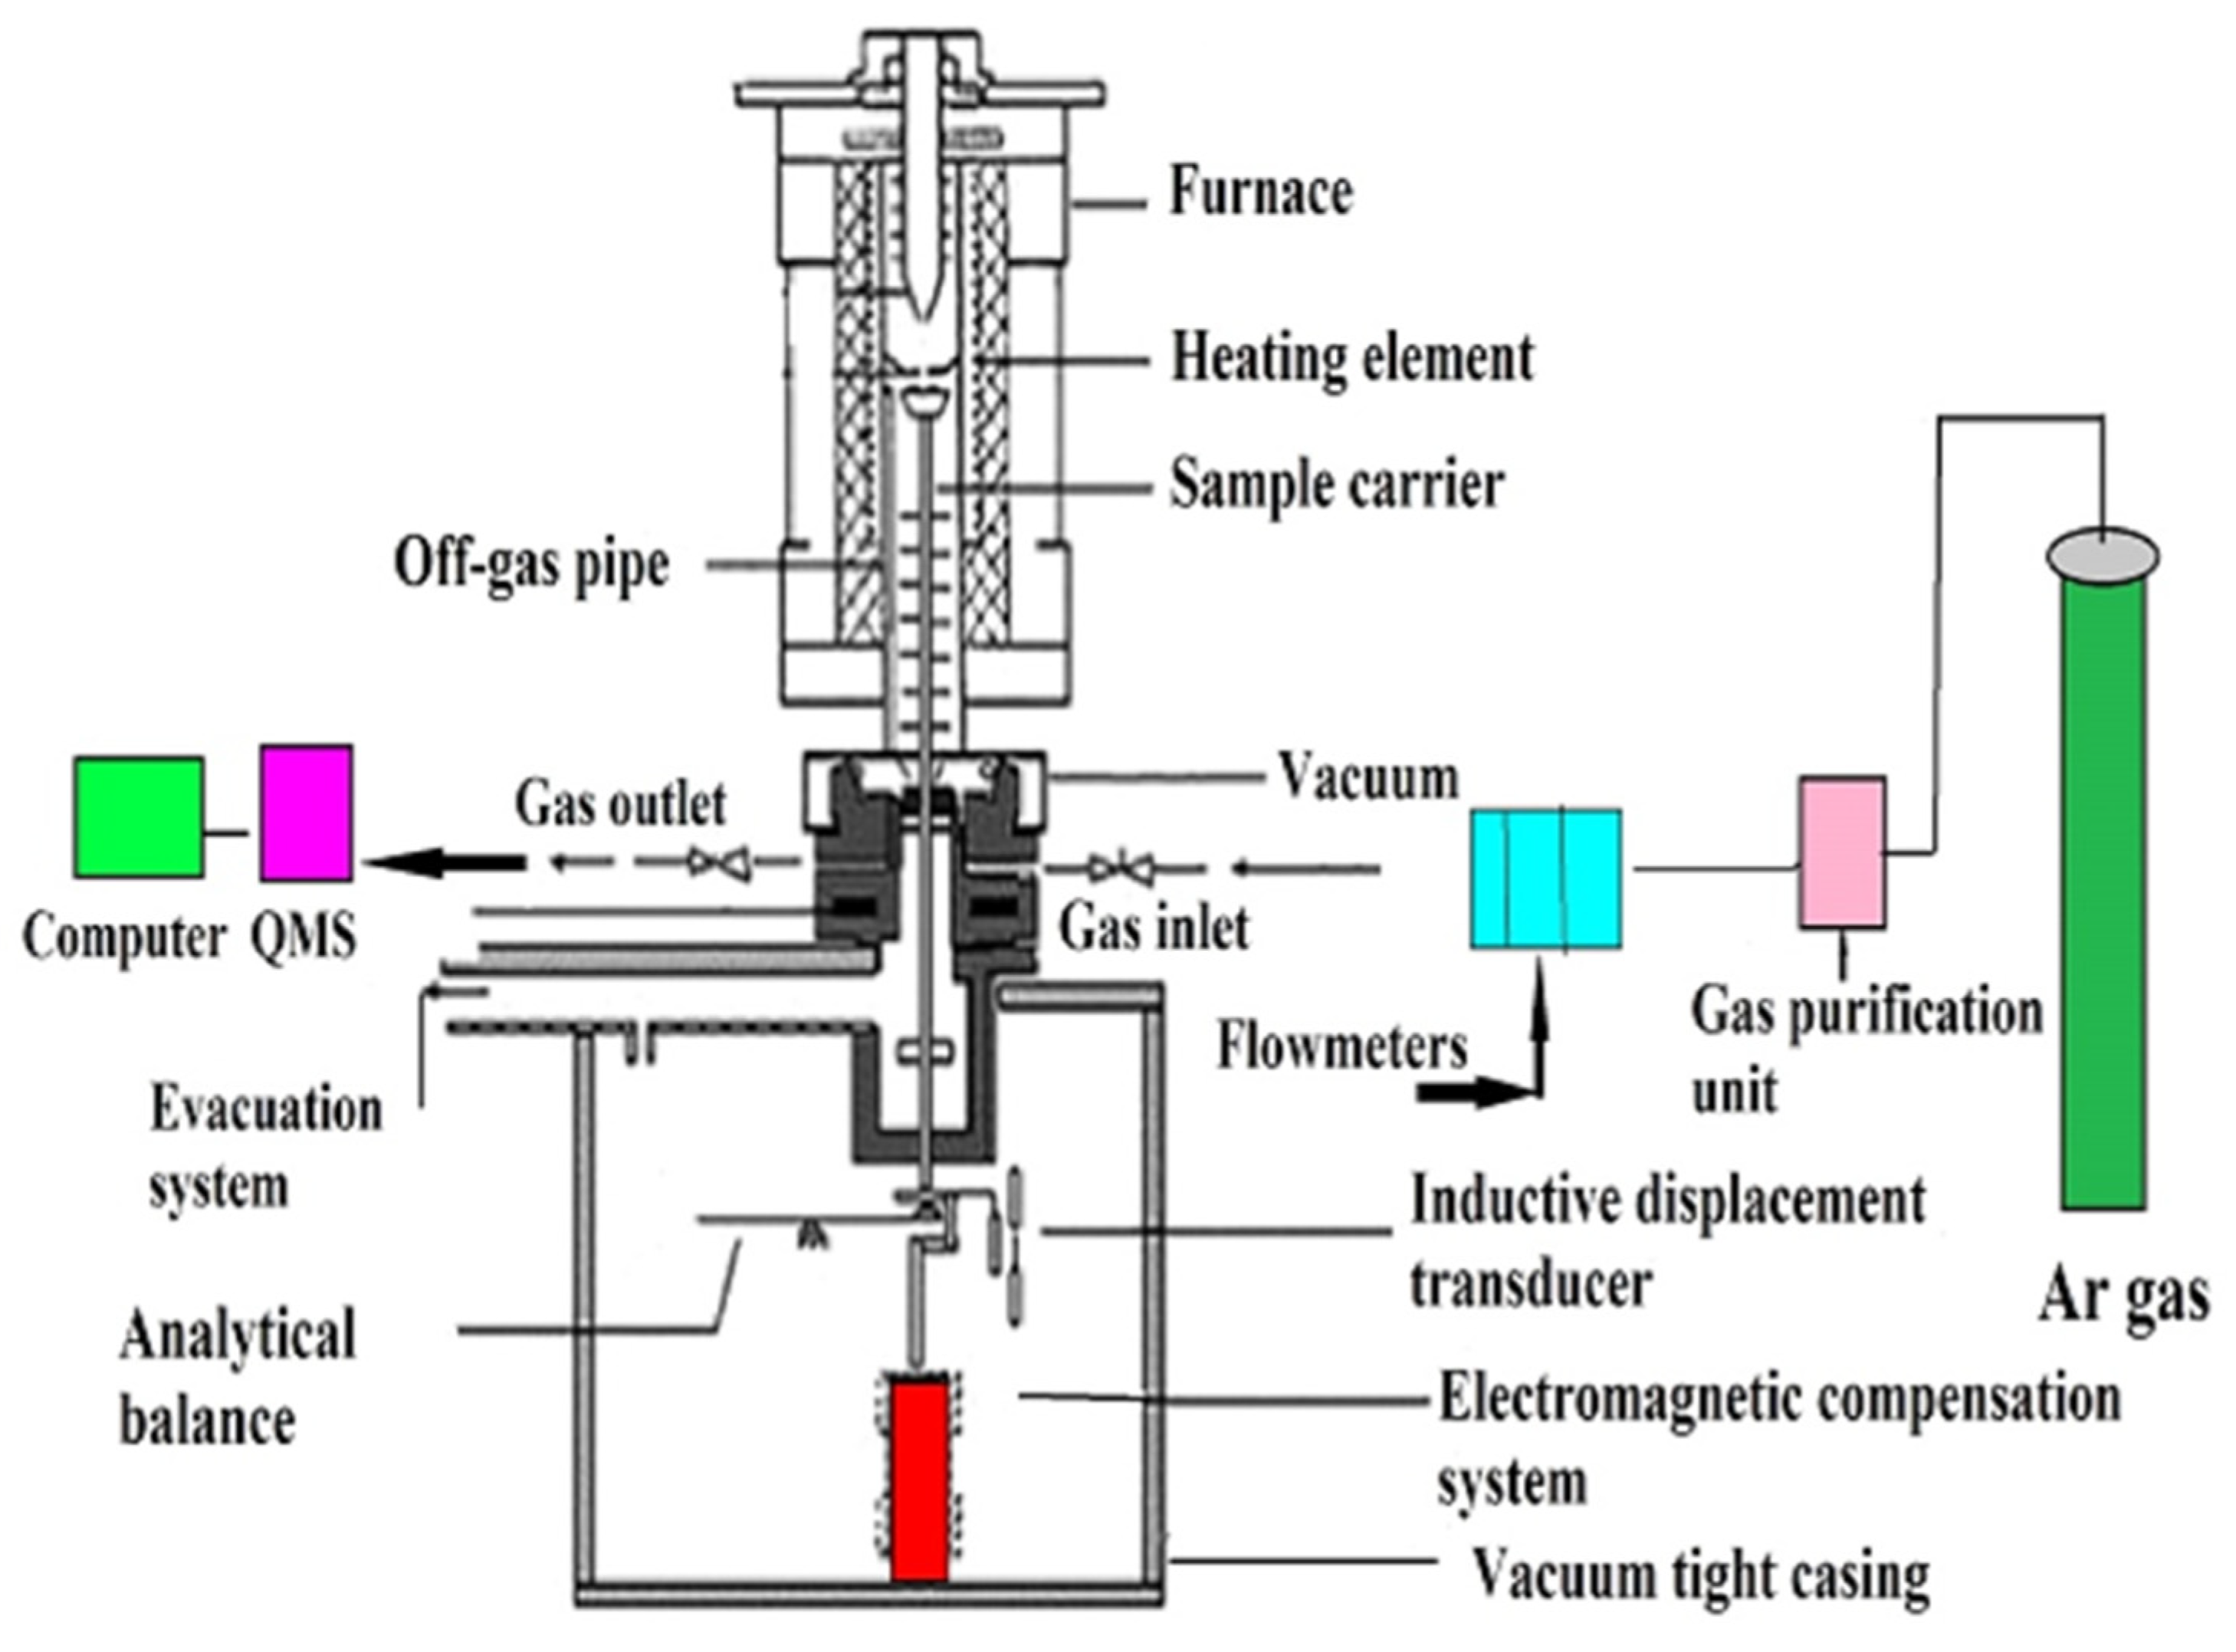
3.3. Reduction System and Procedure
4. Results and Discussion
4.1. Reduction of Iron Ore-Coal (Composites I)
4.2. Reduction of Iron Ore-Charcoal (Composites II)
4.3. Reduction Kinetics and Mechanism
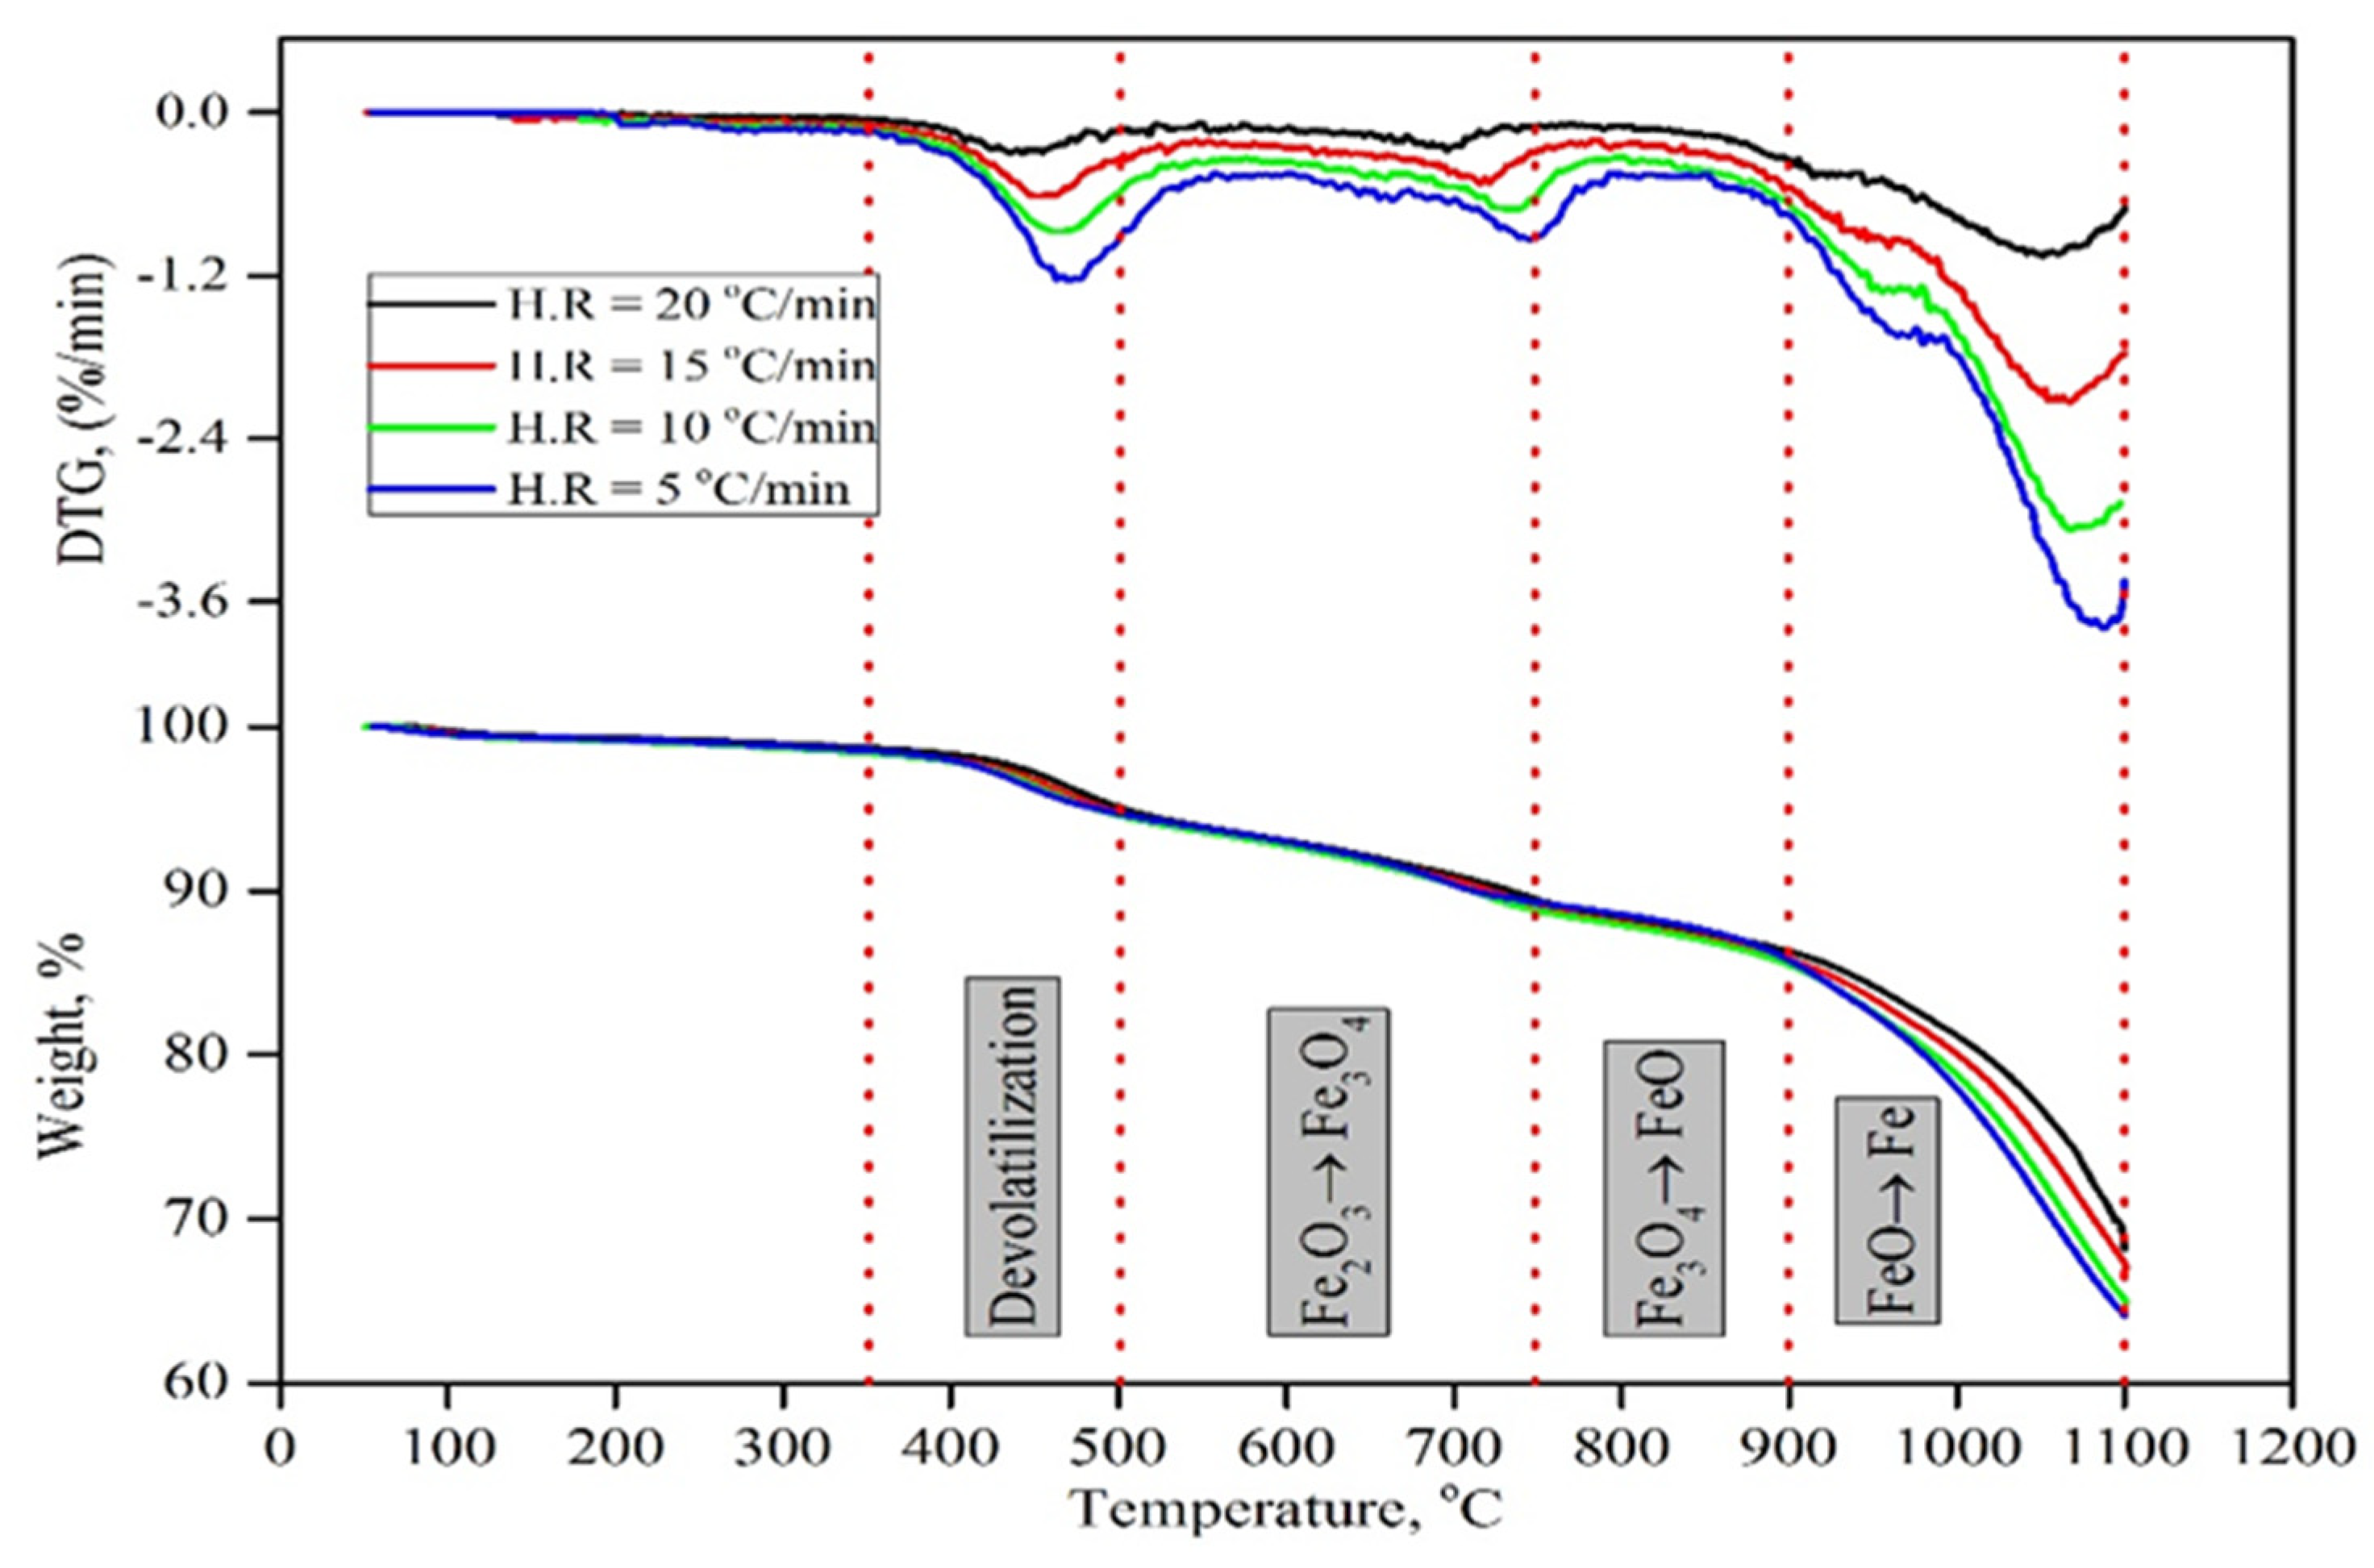
4.3.1. Reduction of Iron Ore Fines-Coal
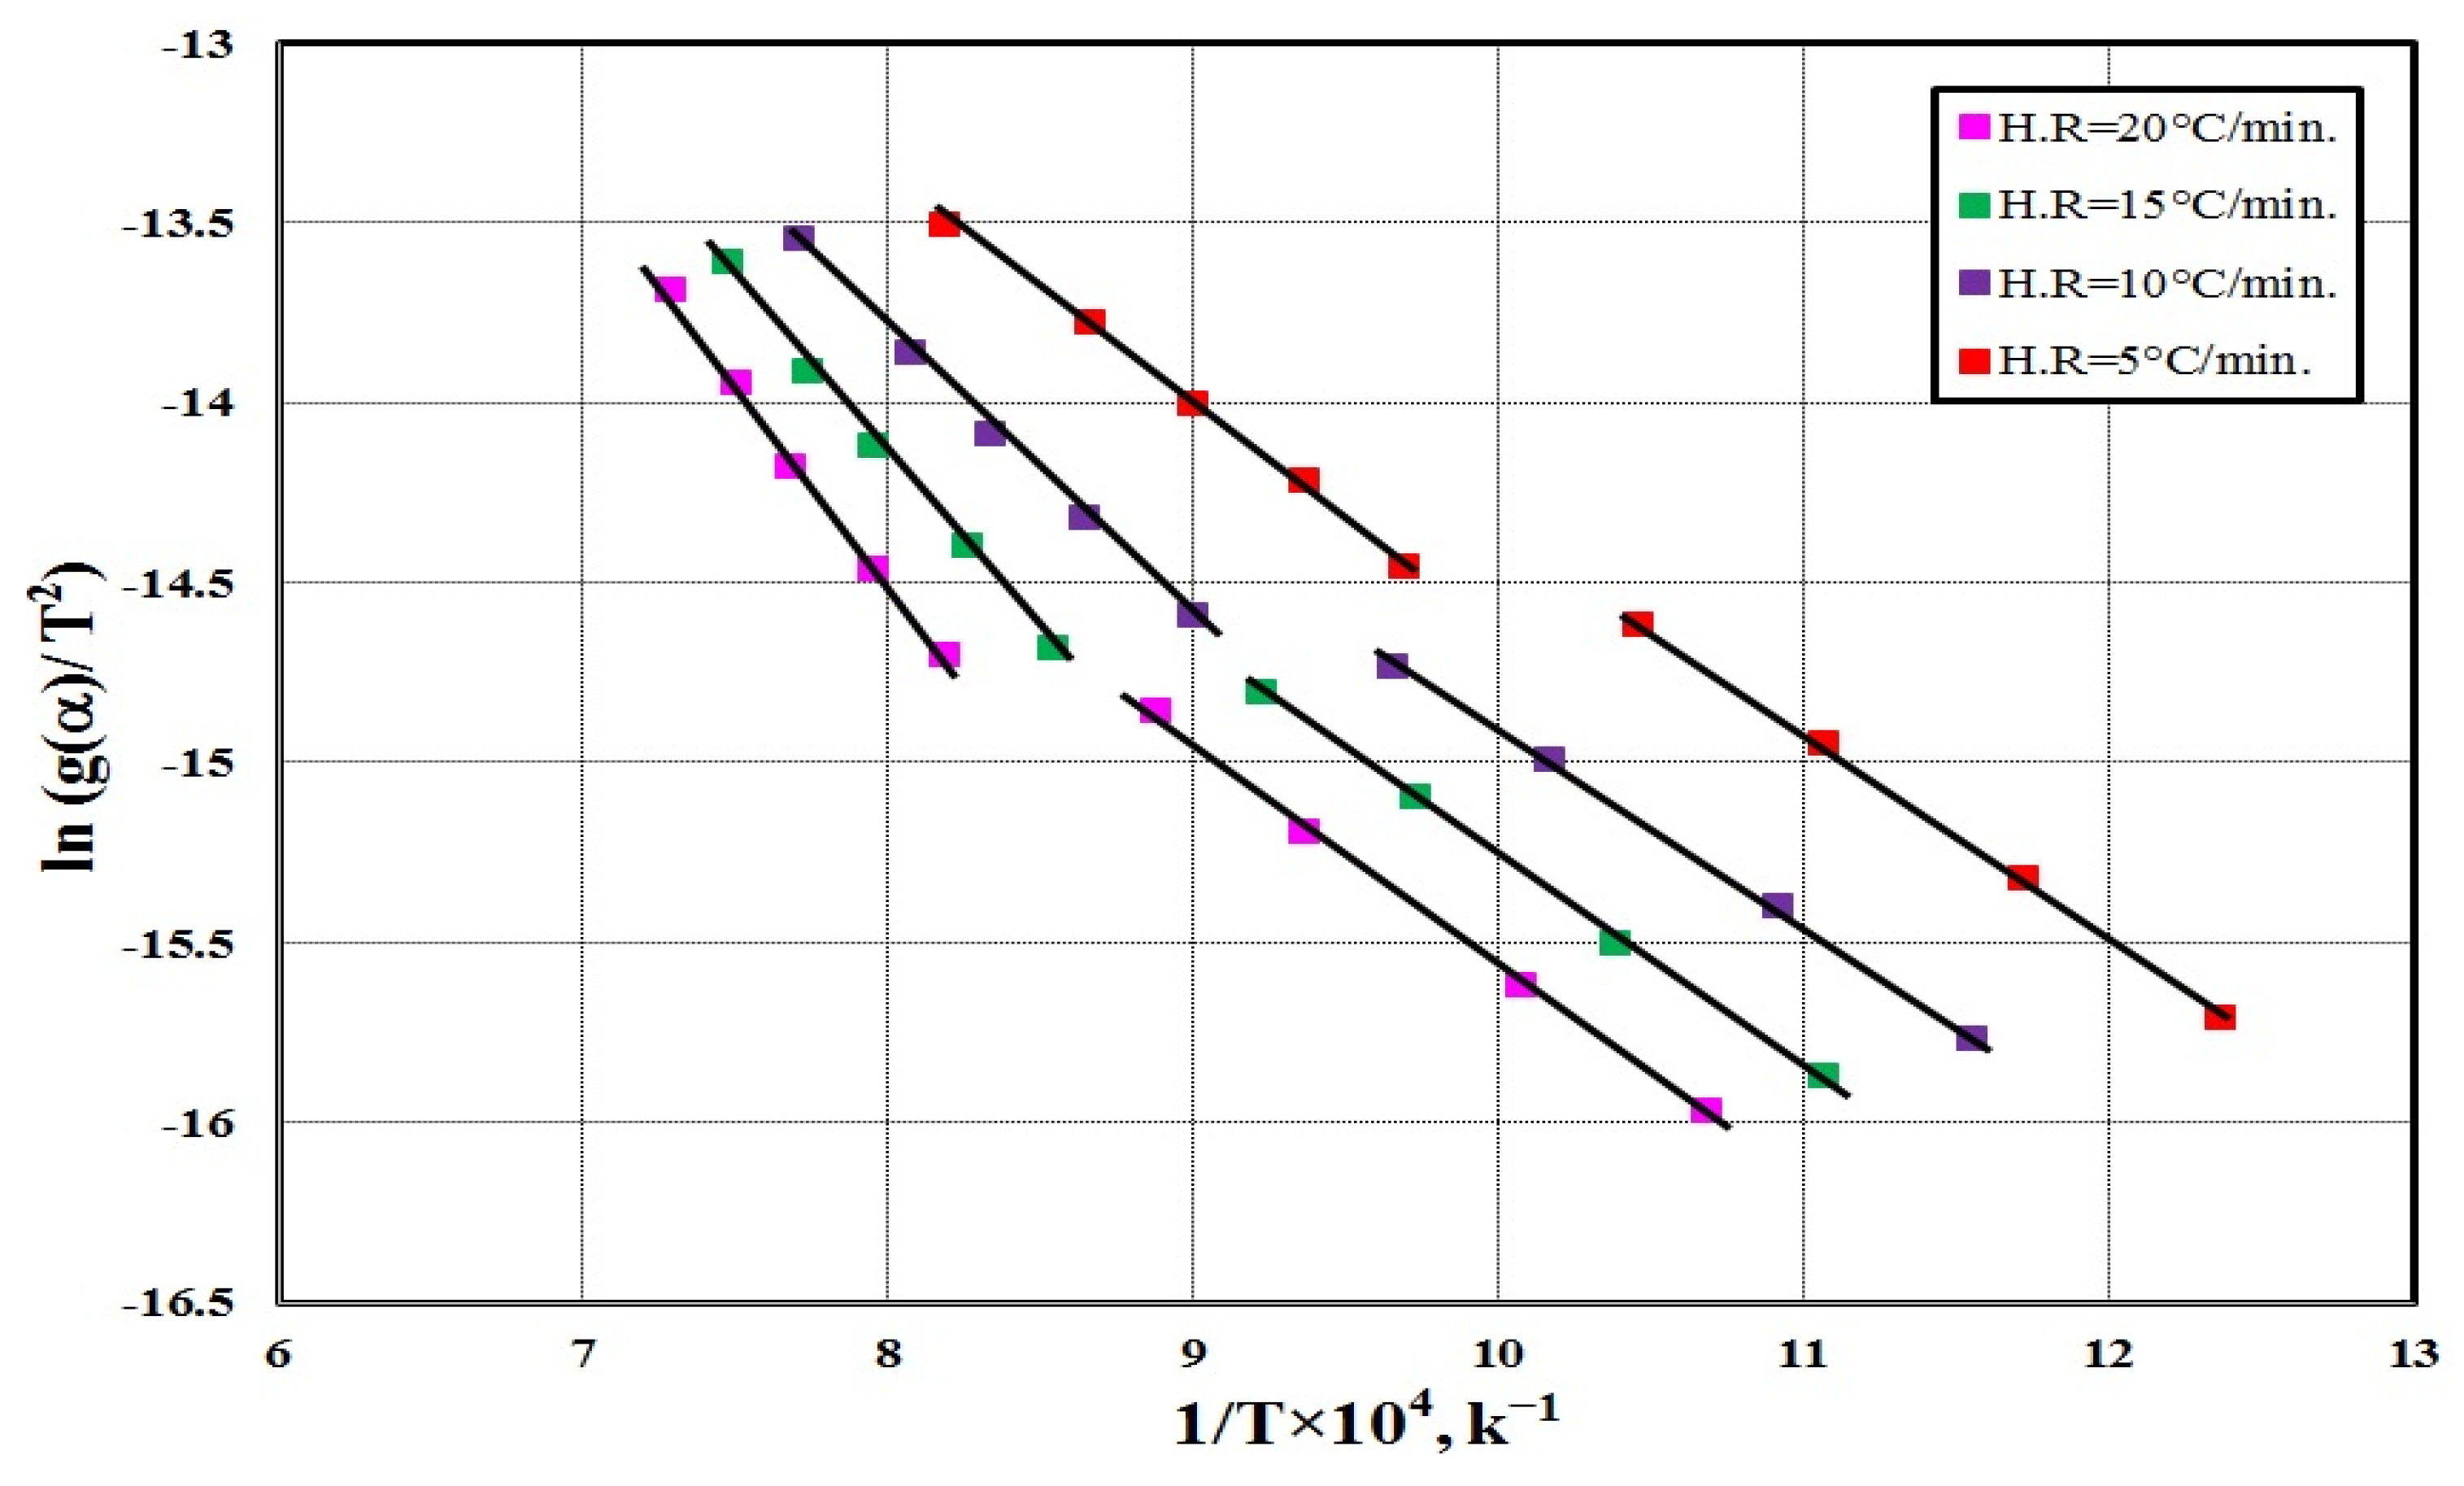
Model-Fitting (CR) Method
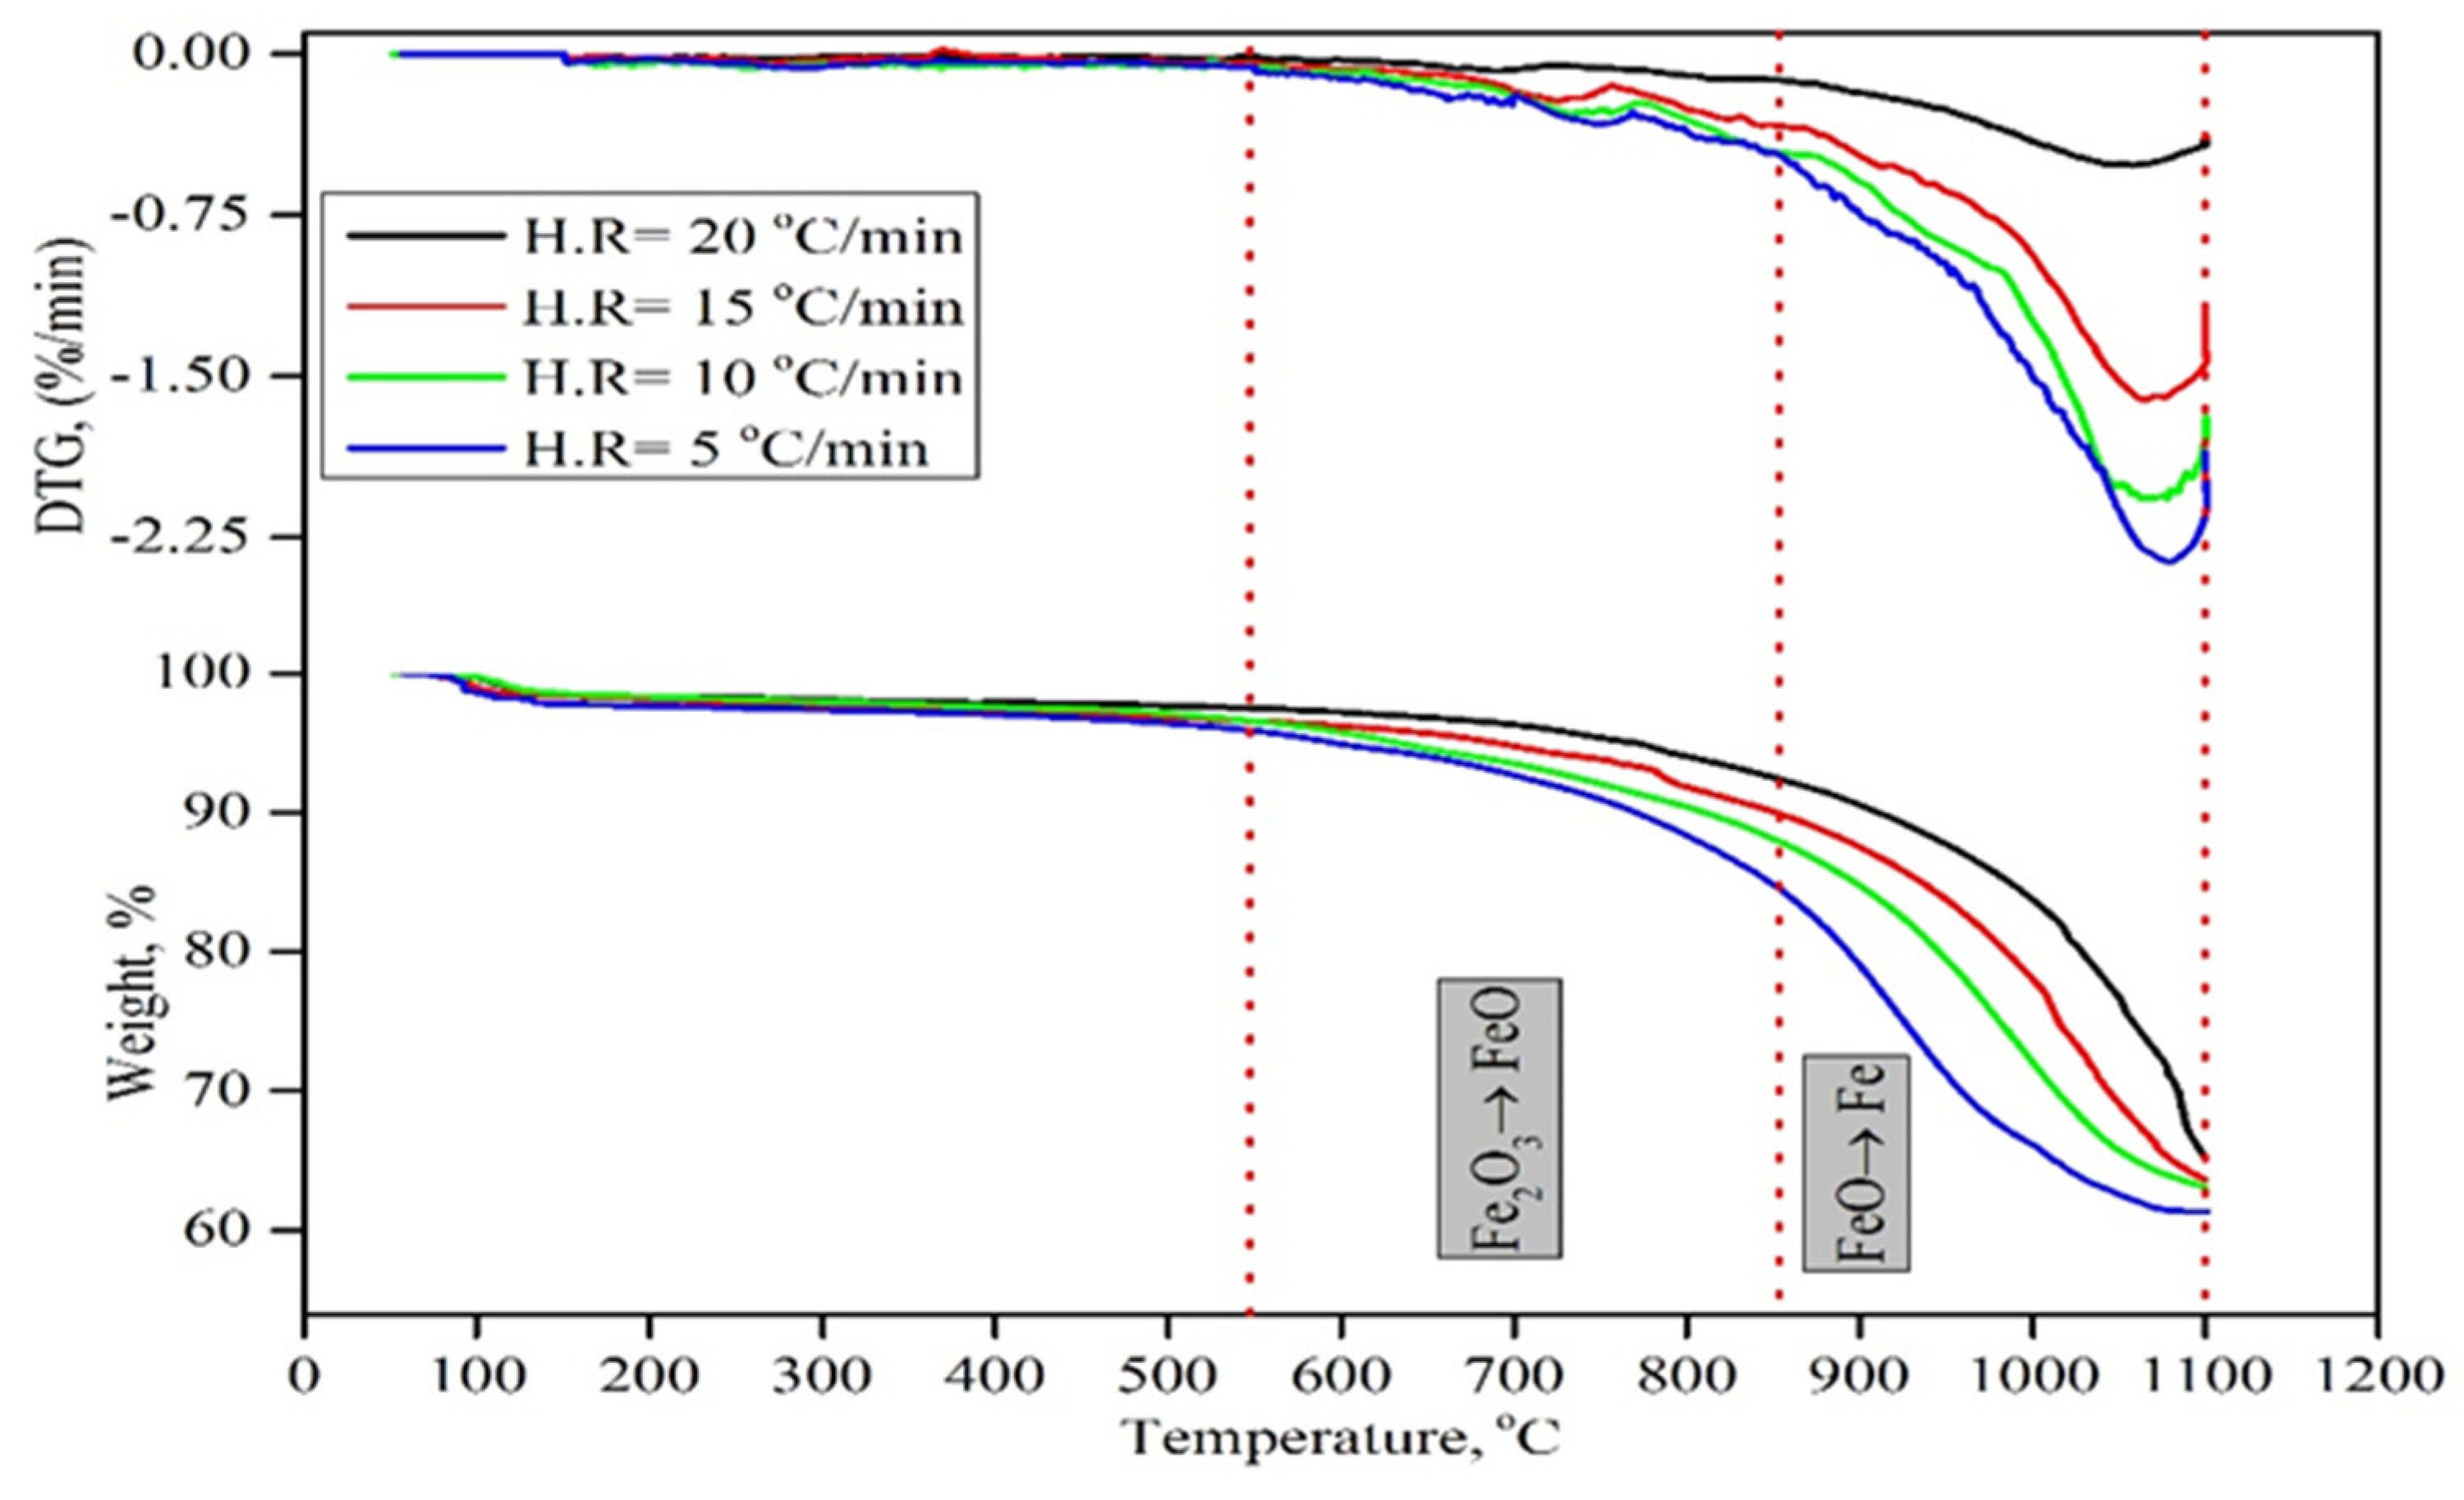
4.3.2. Reduction of Iron-Ore-Fines-Charcoal
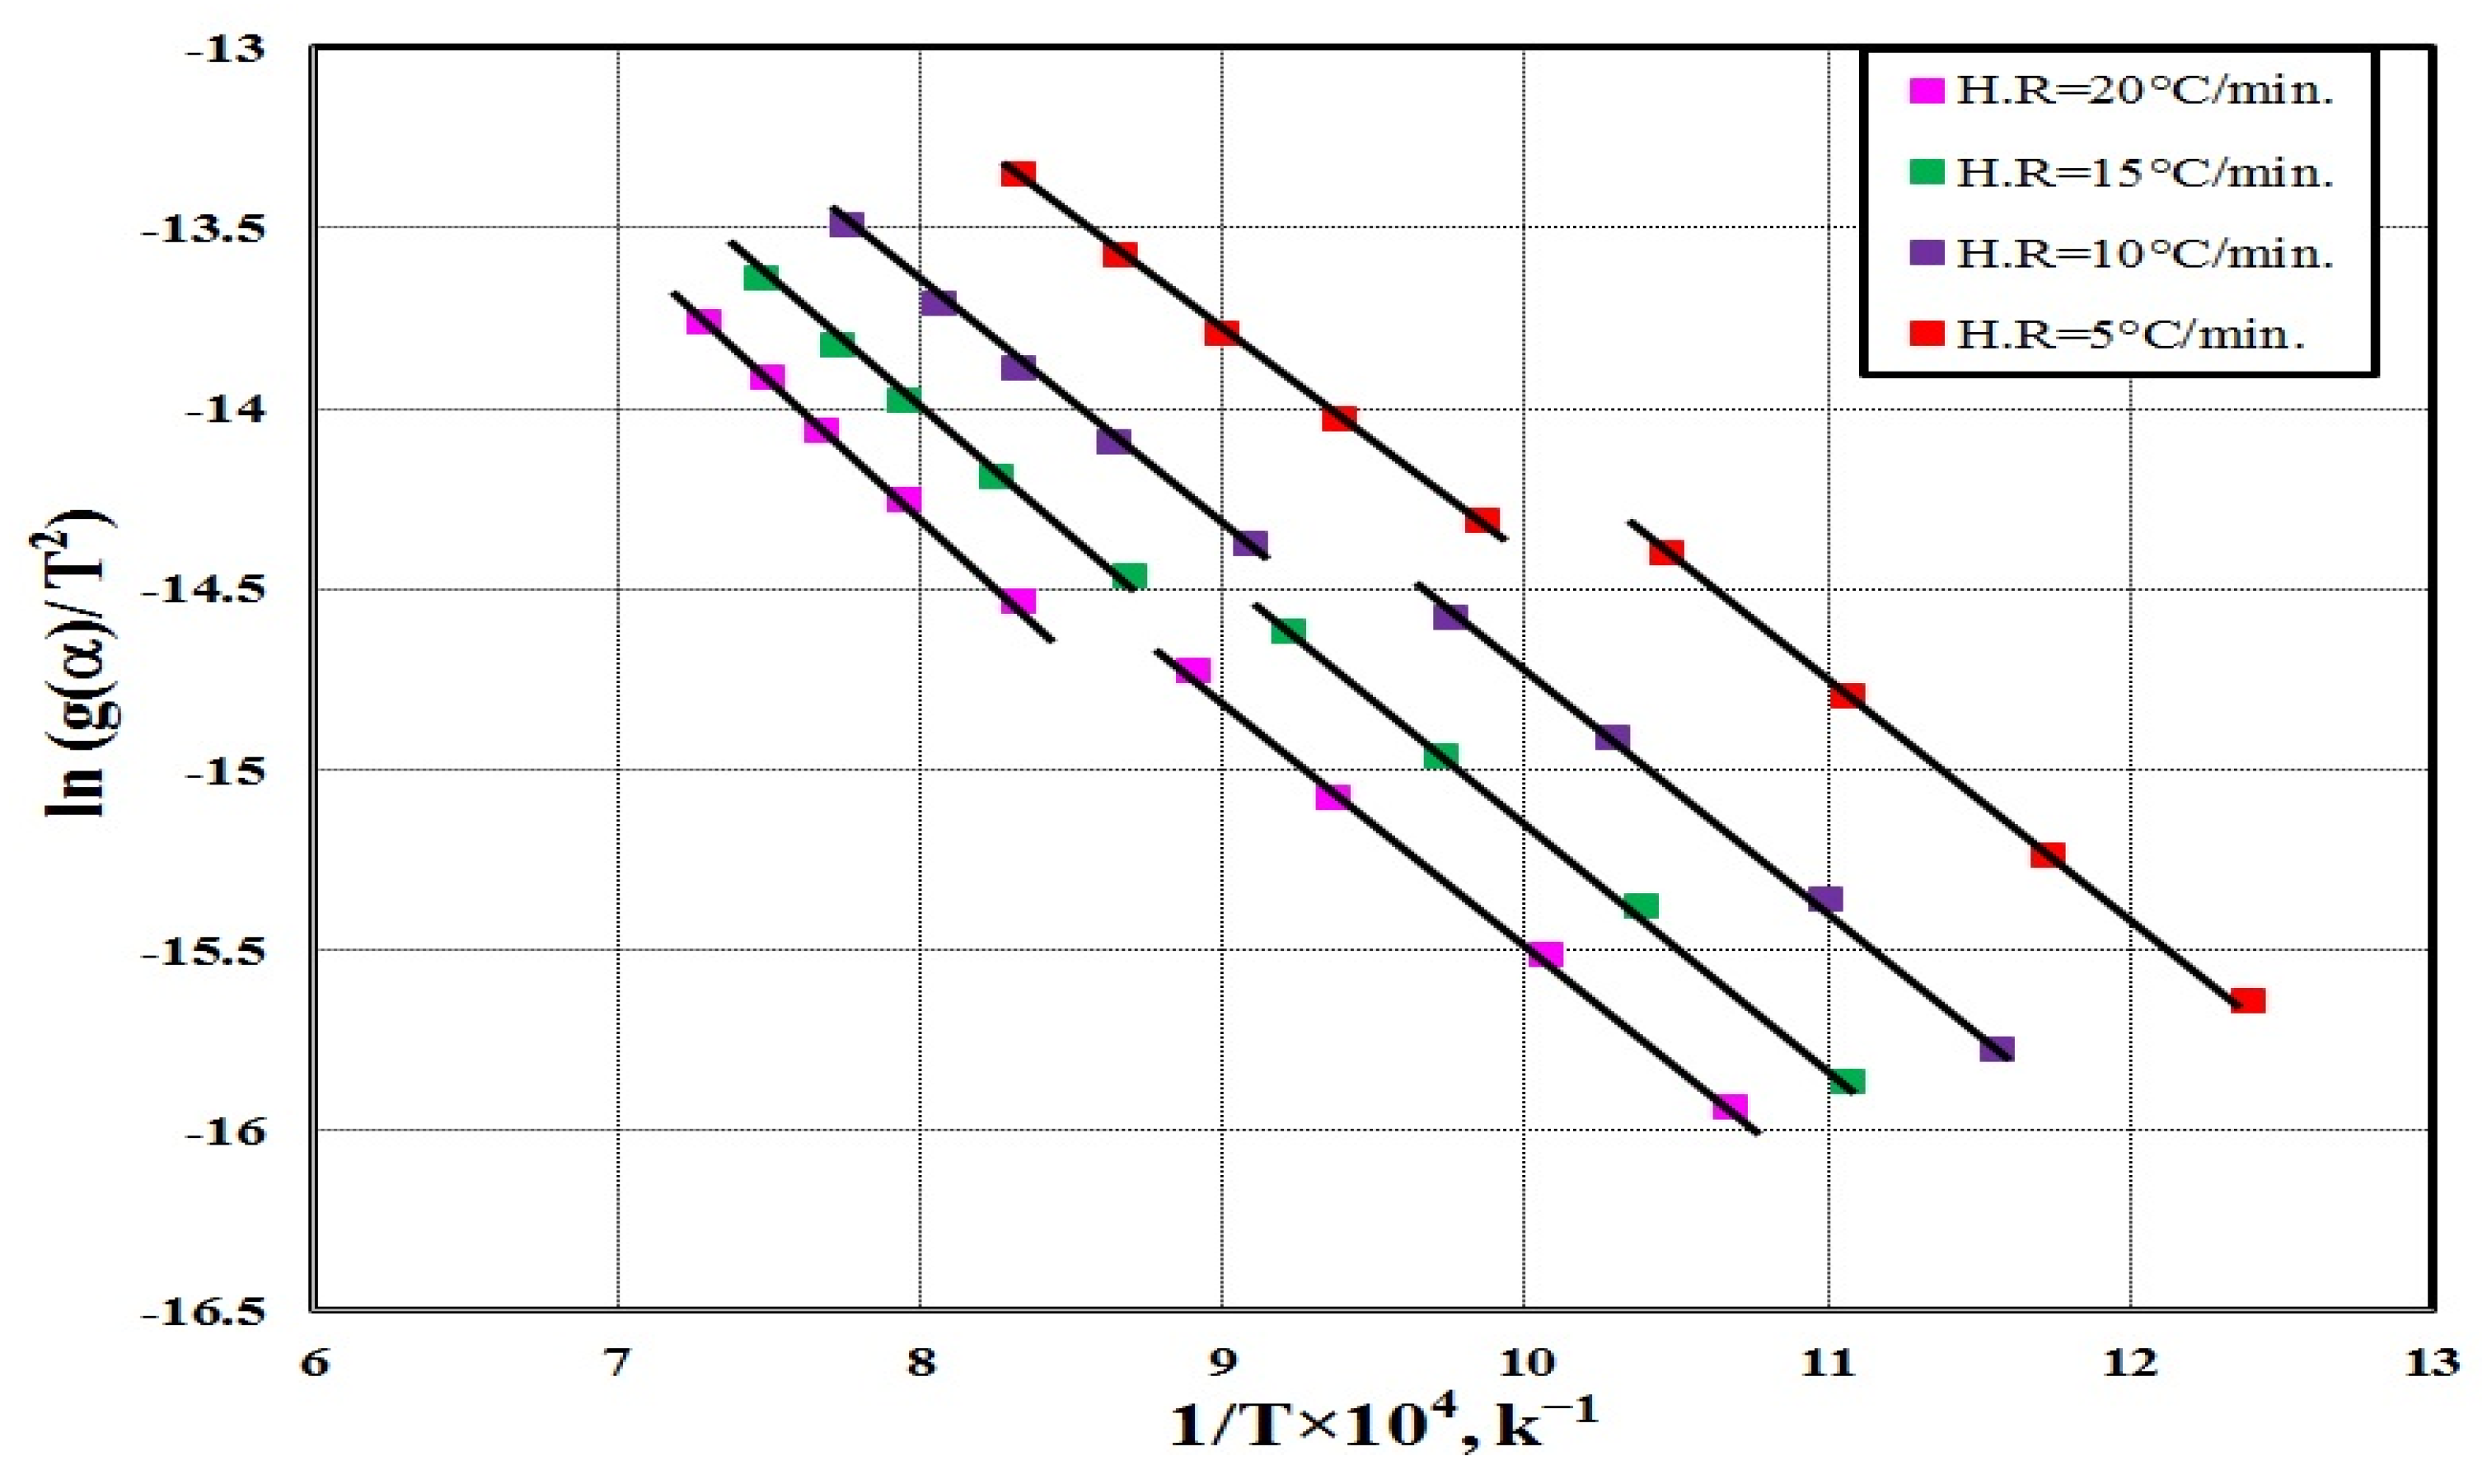
Model-Fitting (CR) Method
5. Conclusions
- The heating rate had a considerable impact on the rate of reduction and reduction conversion. At the same heating rate, the reduction degree is higher with charcoal than with coal.
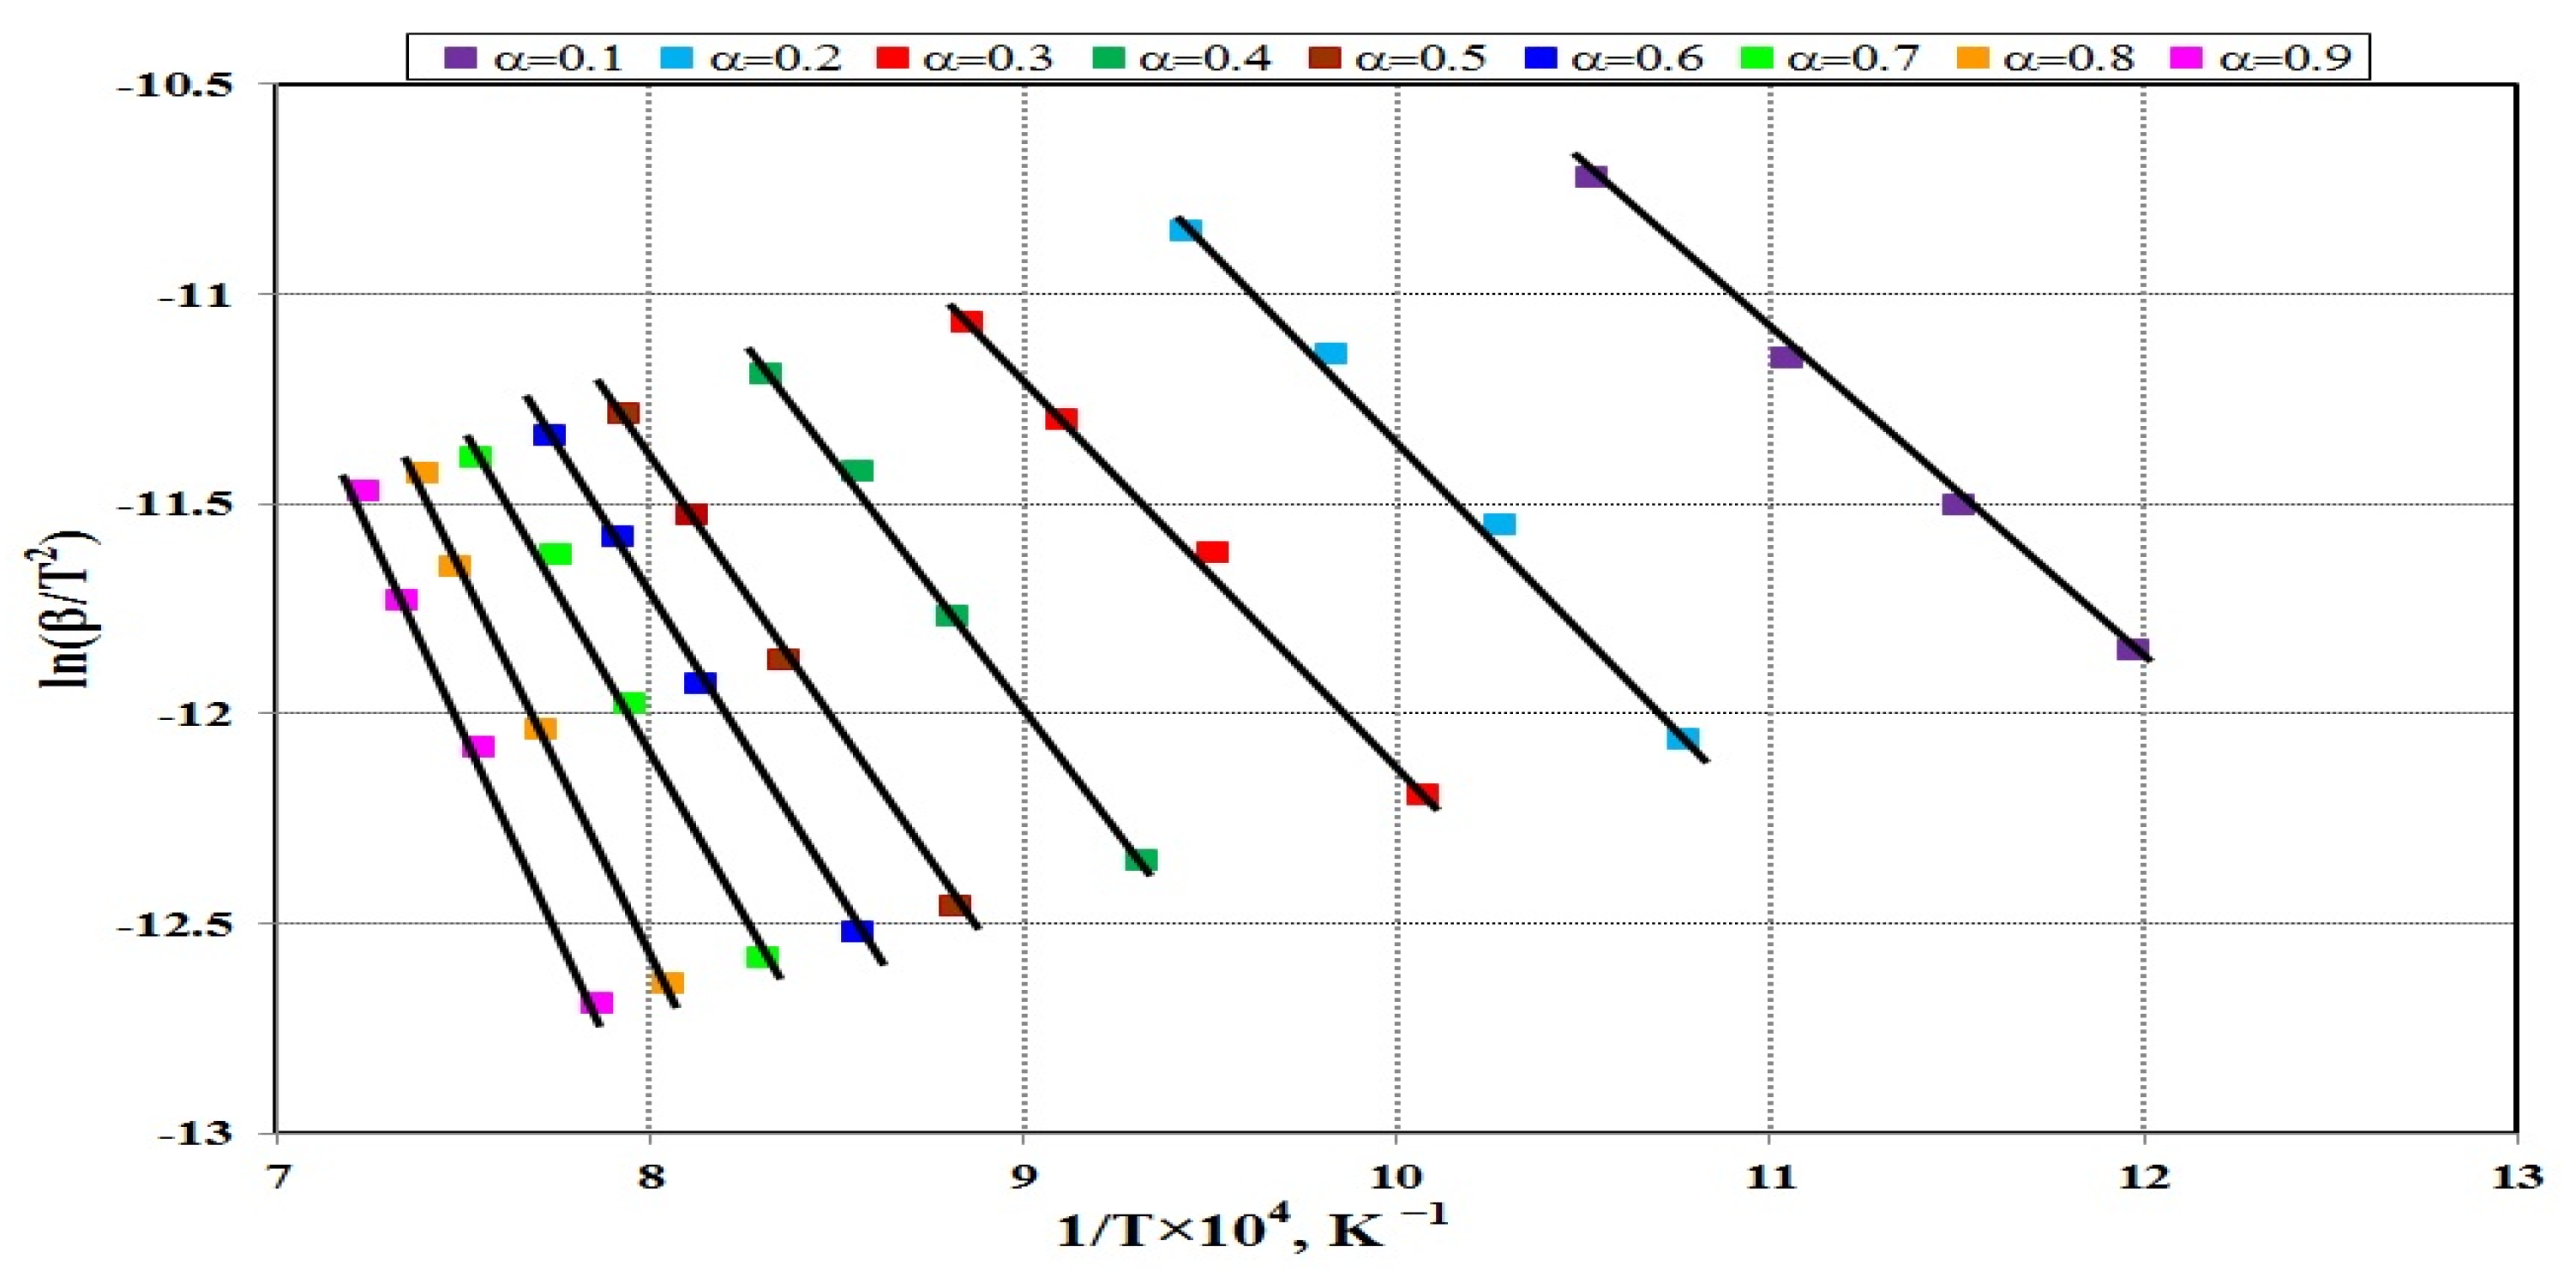
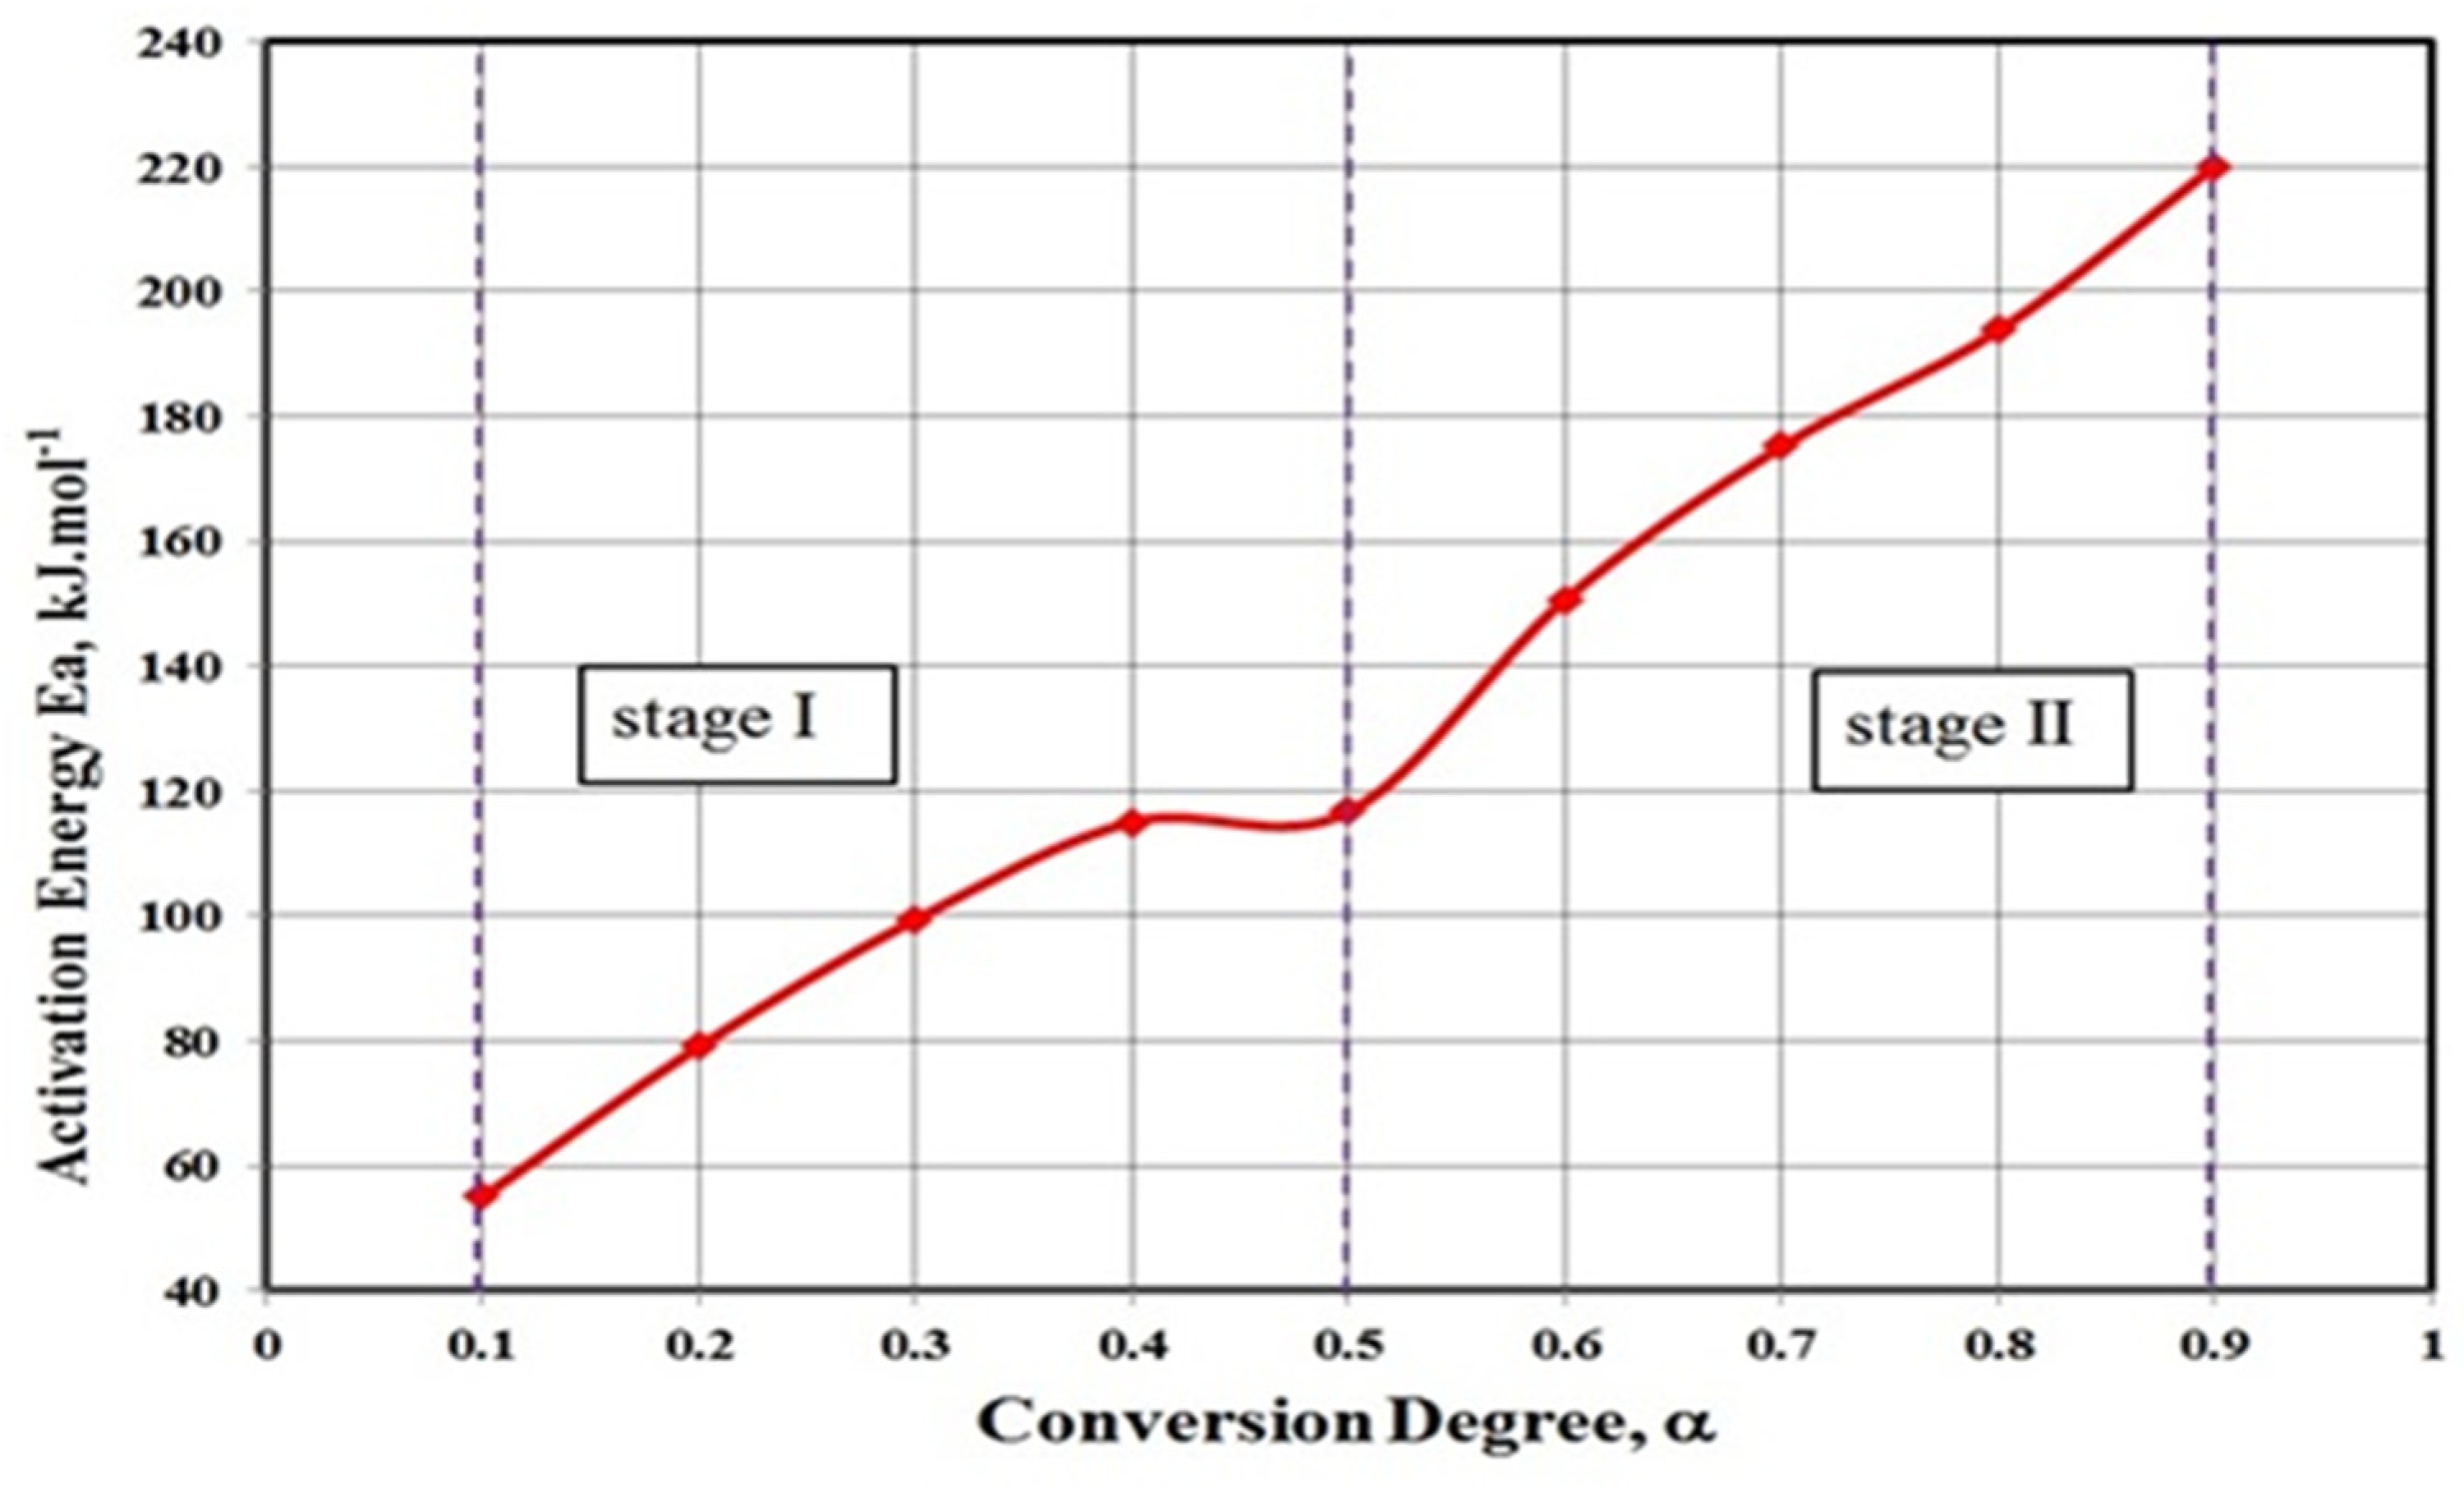
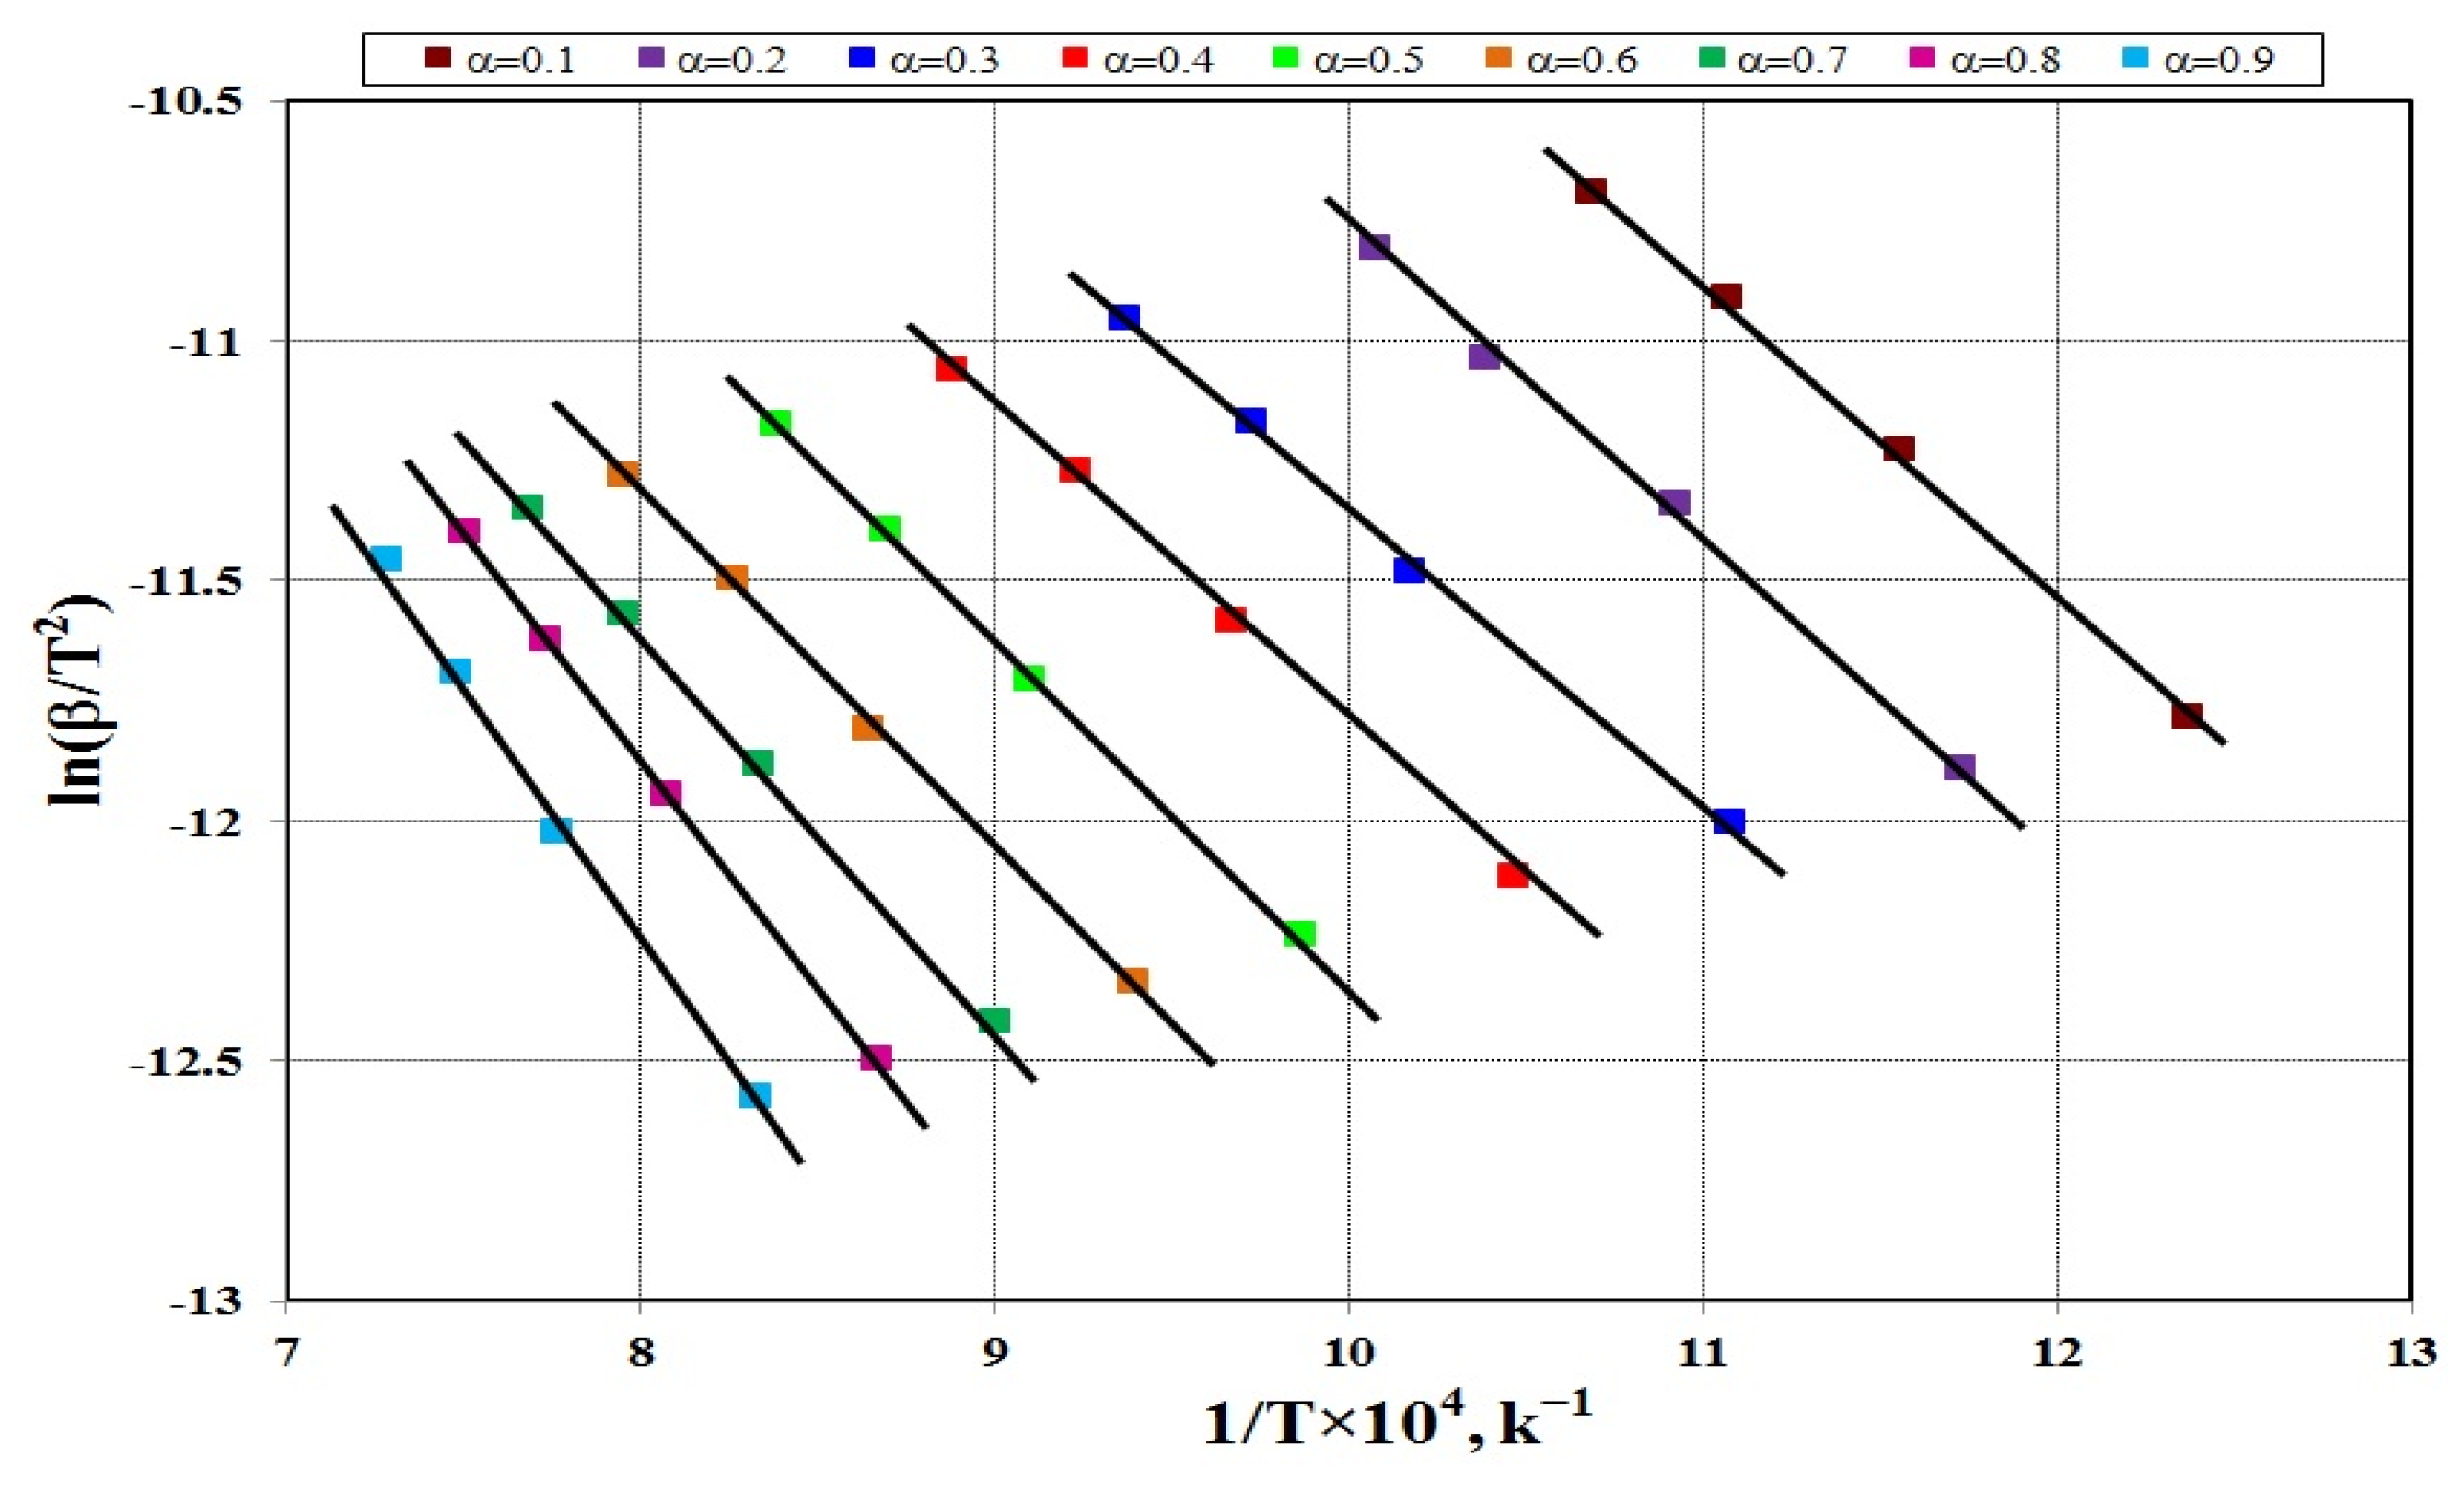
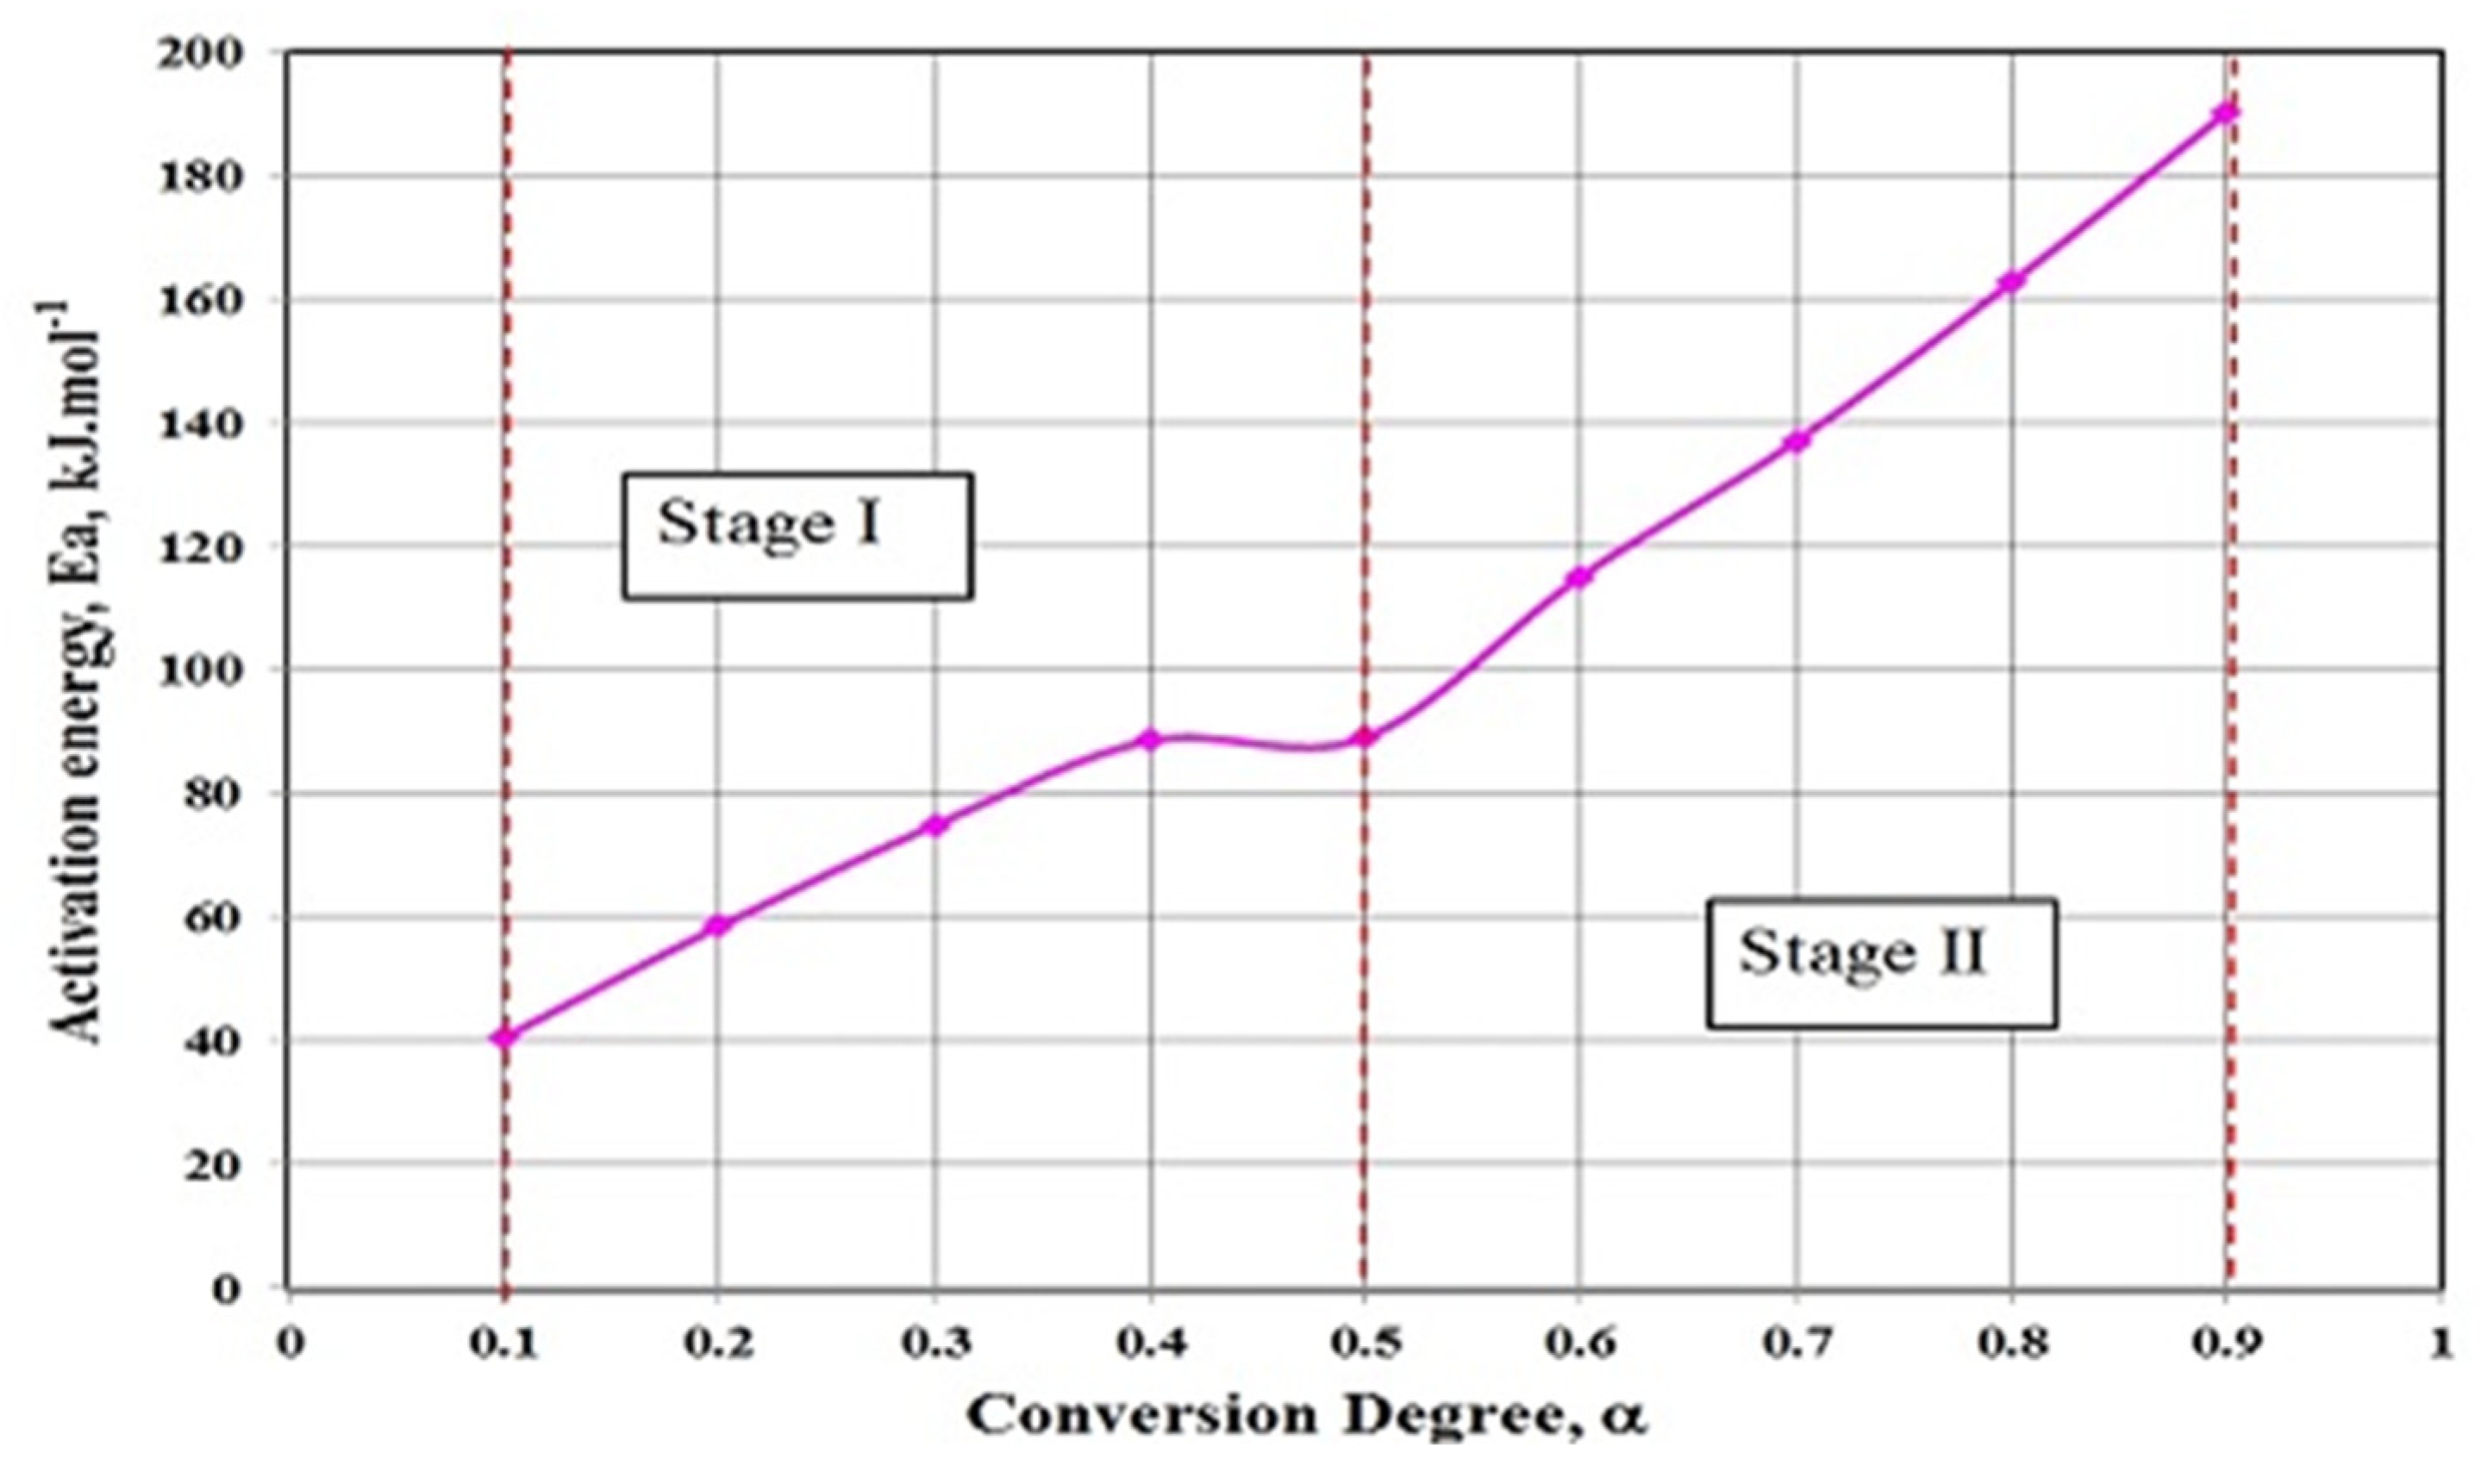
- The computed Ea values for the reduction of iron-ore-fines-charcoal composites range from 40.50 to 190.12 kJ/mol while the Ea values for the reduction of iron ore fines/coal range from 55.02 to 220.12 kJ/mol.
- By the CR approach, the reduction reaction was controlled by the gas diffusion model at the initial stage, while at the final stages, the nucleation (Avrami-Erofeev) model was the controlling mechanism.
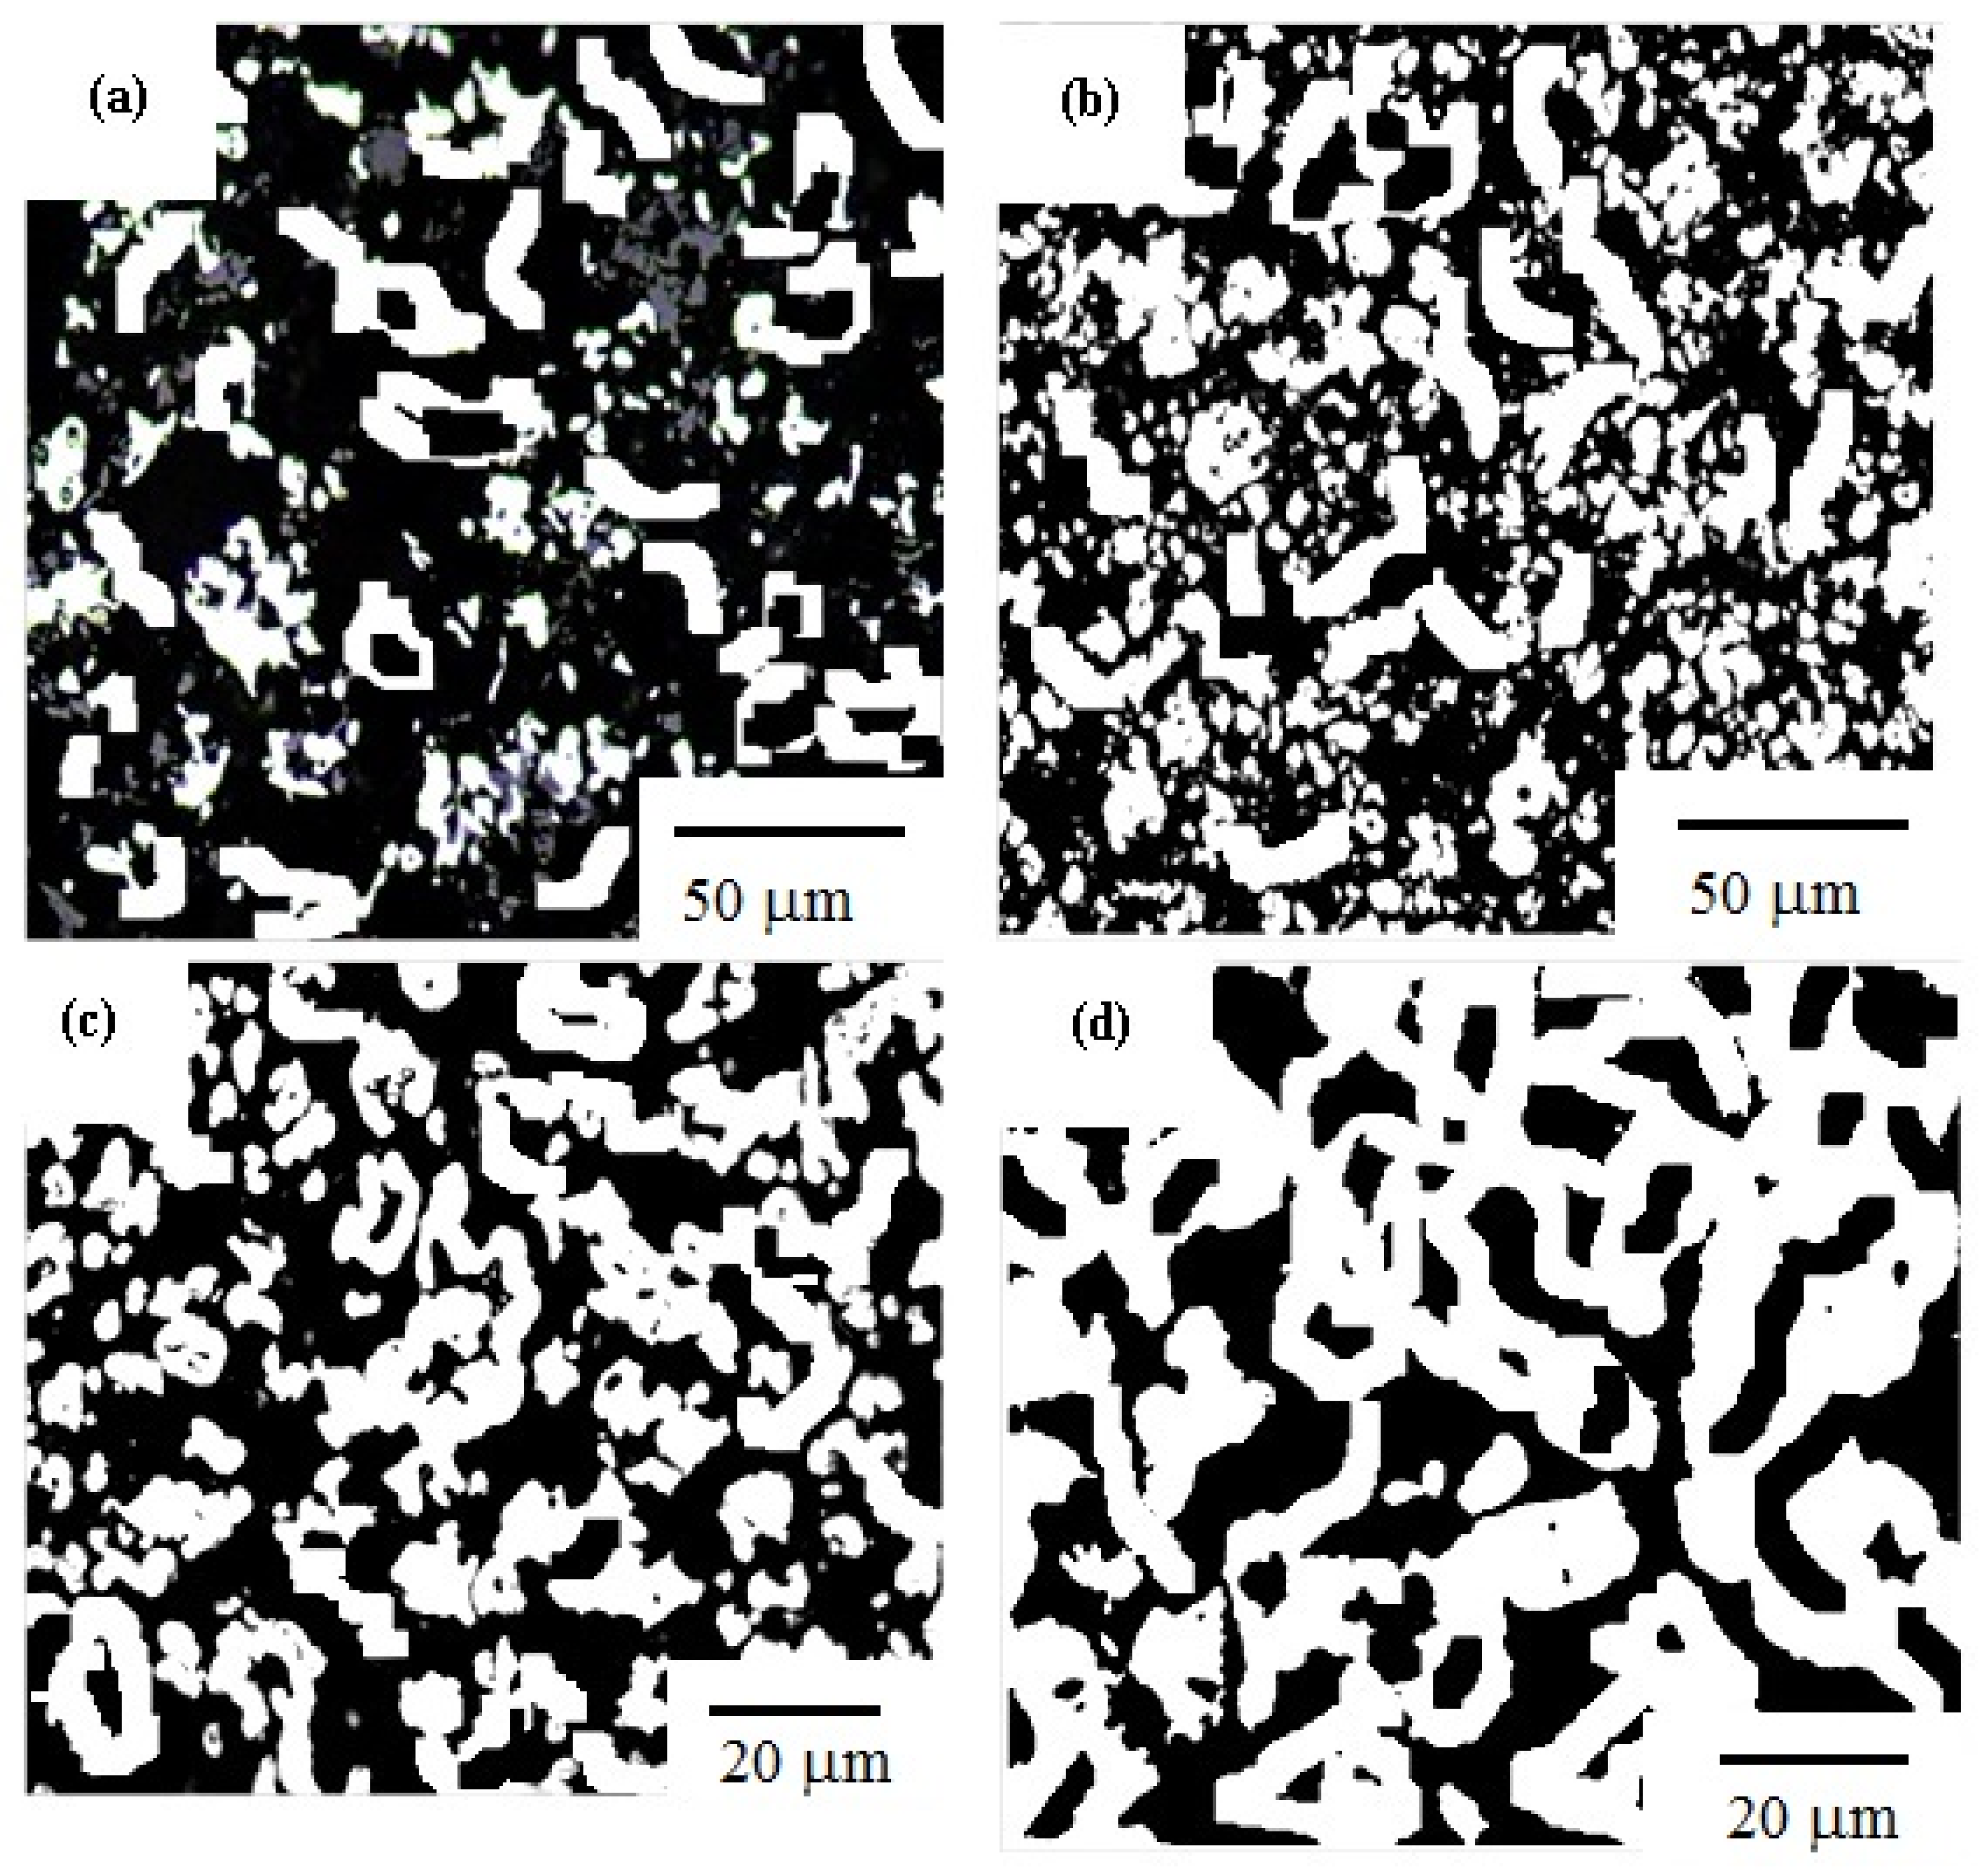
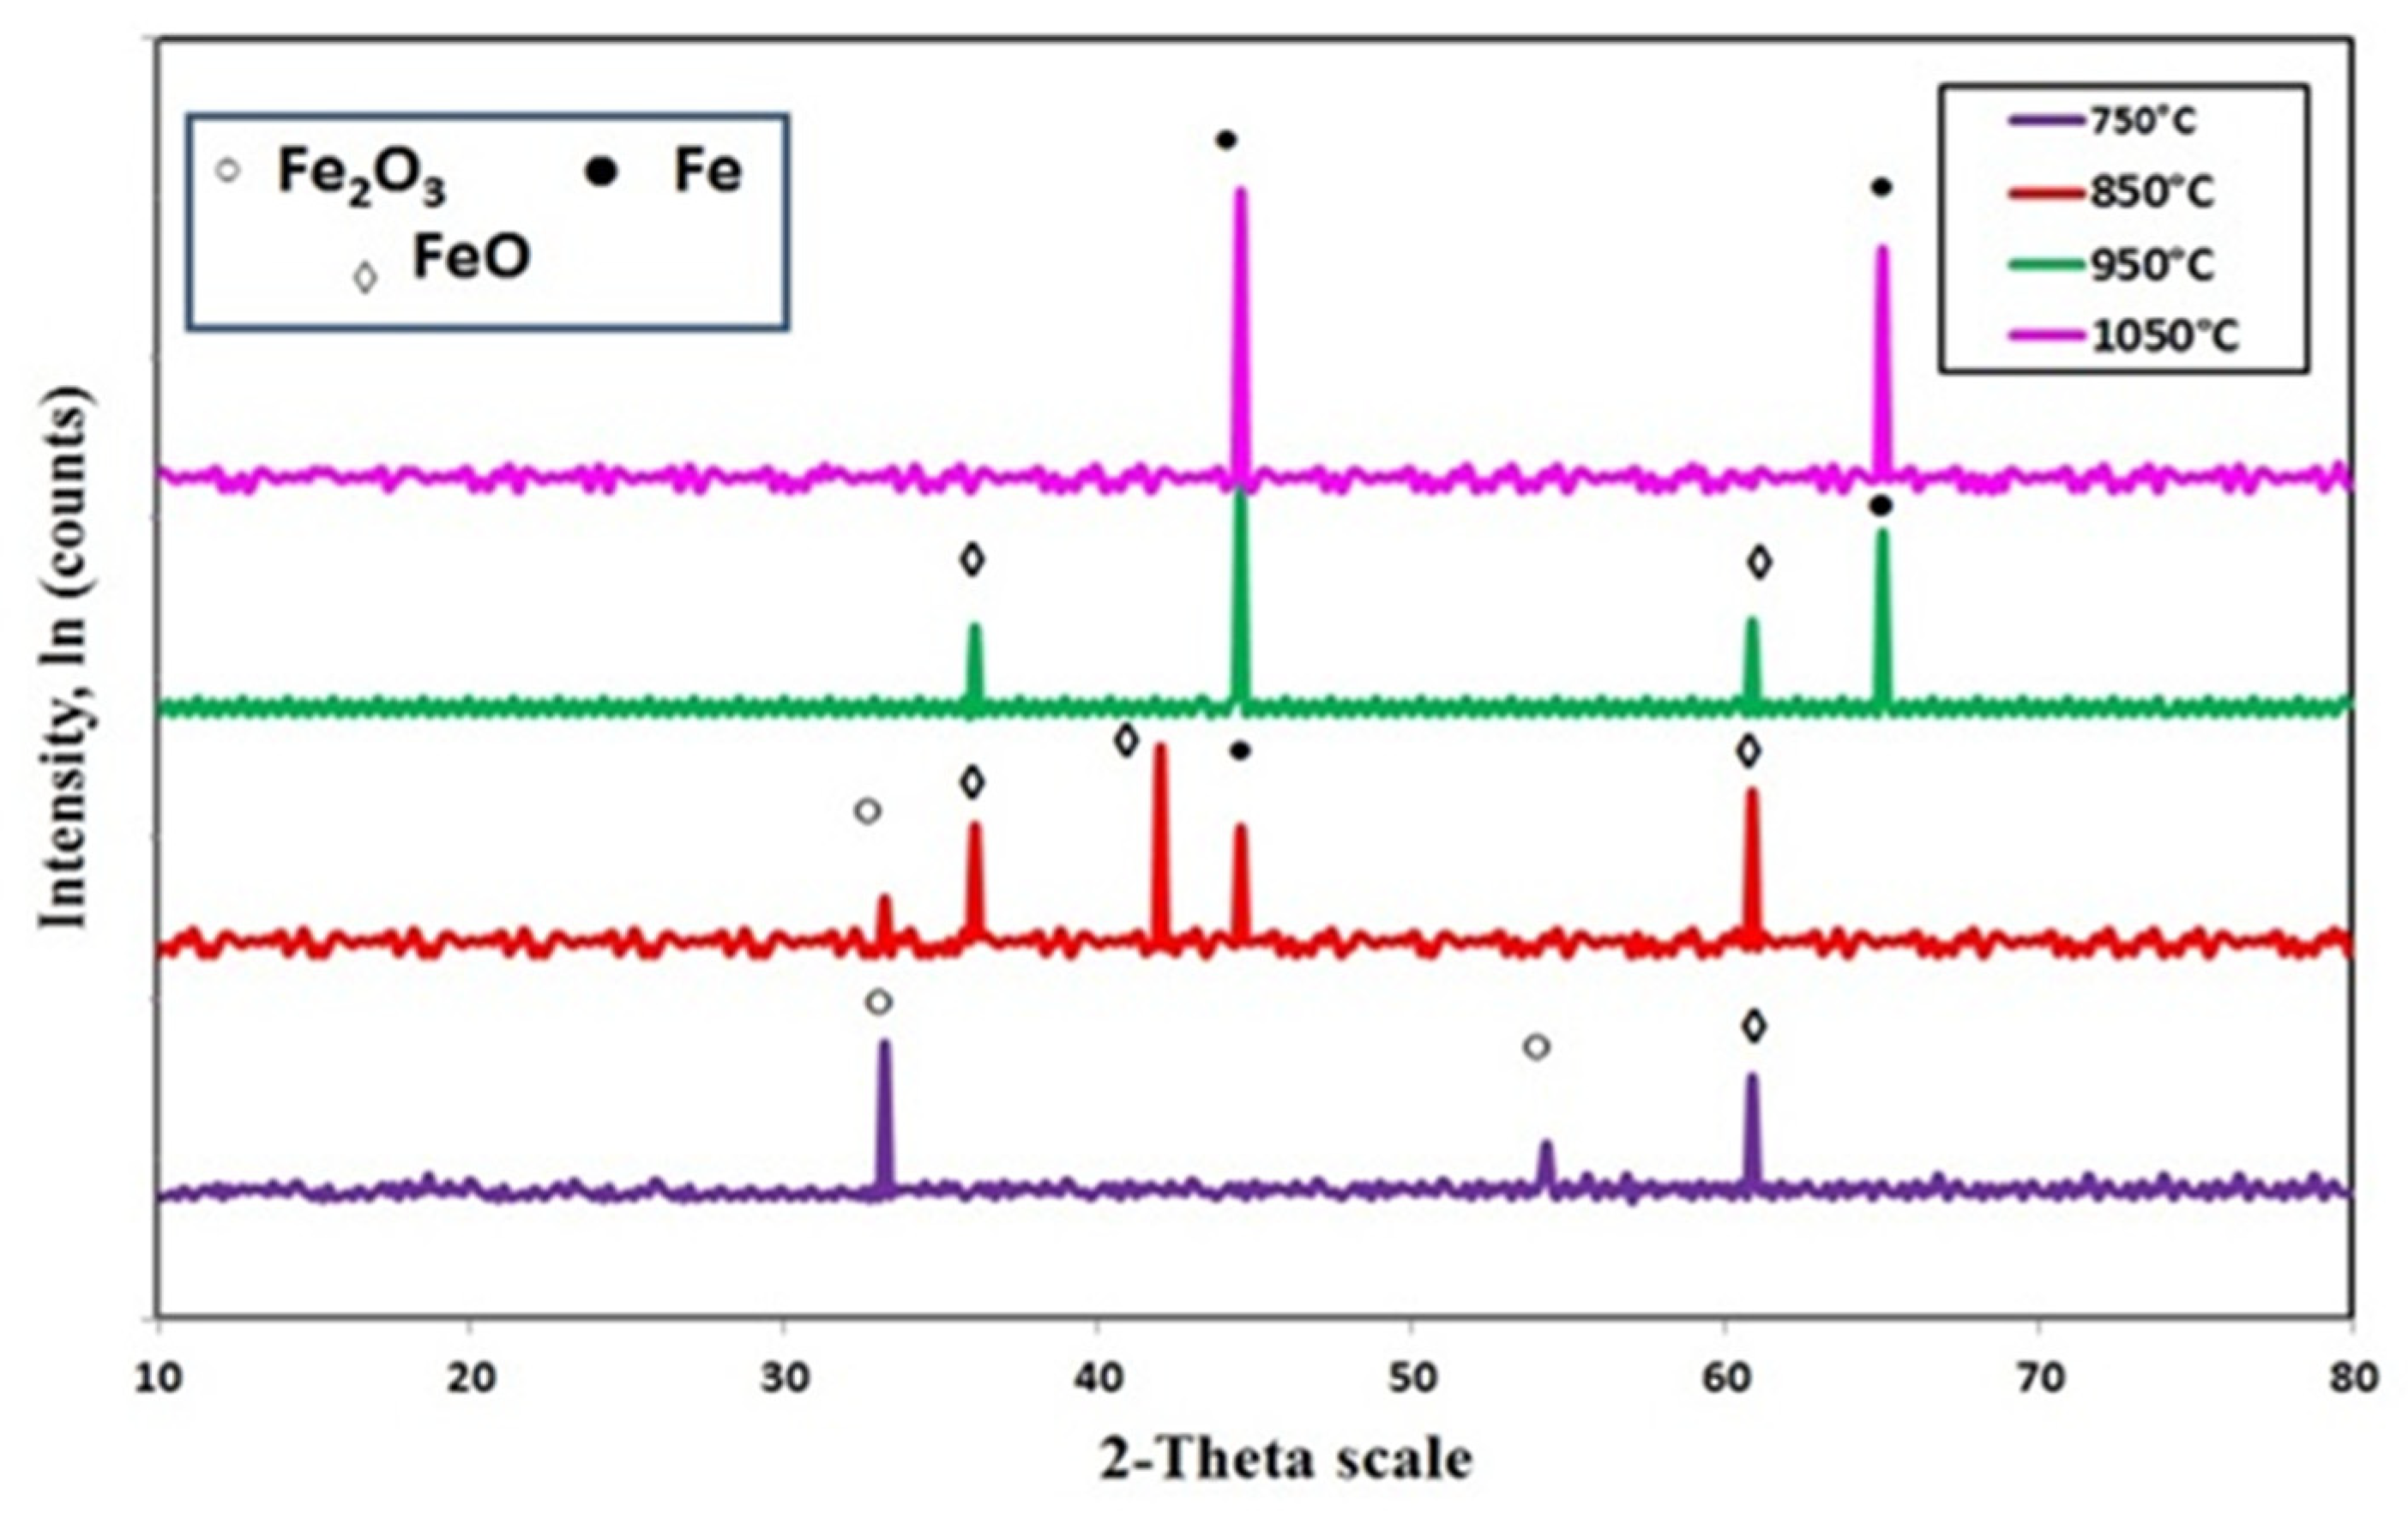
- The reduction process of iron-ore-fines-charcoal was found to proceed step wisely as follows: Fe2O3 → FeO → Fe.
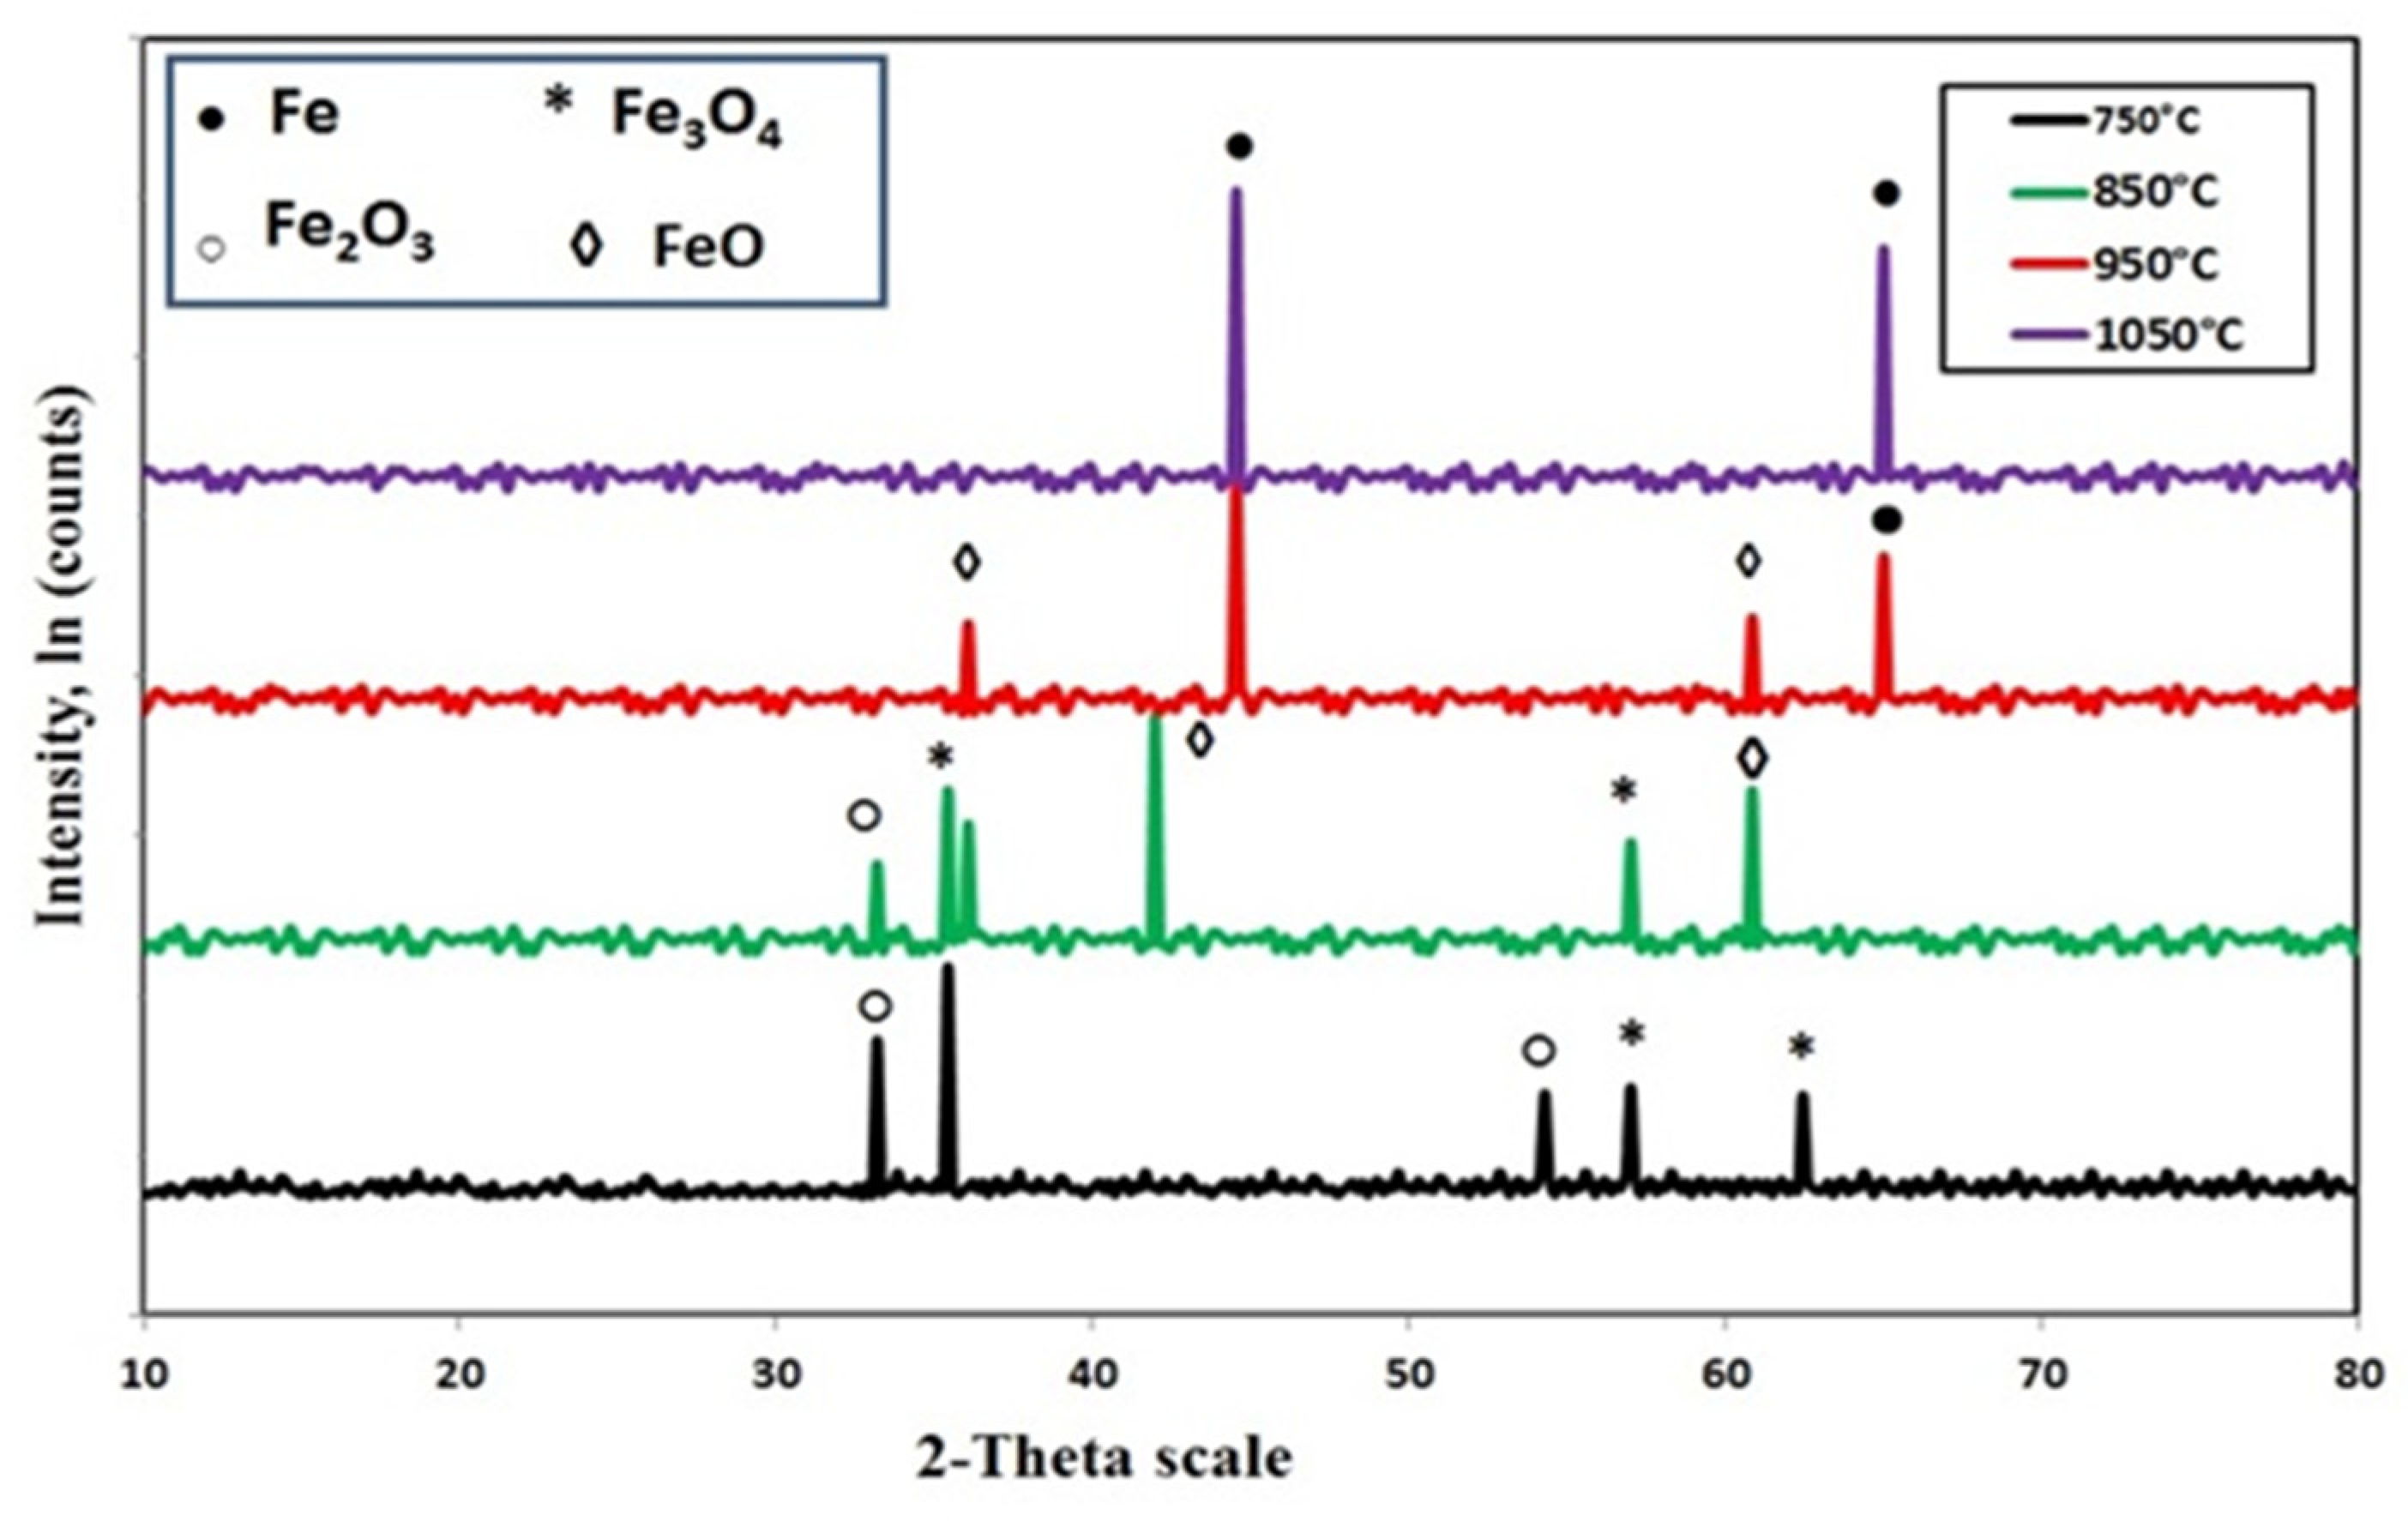
- The reduction process of iron-ore-fines-coal was found to proceed step wisely as follows: Fe2O3 → Fe3O4 → FeO → Fe.
Author Contributions
Funding
Data Availability Statement
Acknowledgments
Conflicts of Interest
References
- Pardo, N.; Moya, J.A. Prospective scenarios on energy efficiency and CO2 emissions in the European Iron & Steel industry. Energy 2013, 54, 113–128. [Google Scholar] [CrossRef]
- Mousa, E.; Wang, C.; Riesbeck, J.; Larsson, M. Biomass applications in iron and steel industry: An overview of challenges and opportunities. Renew. Sustain. Energy Rev. 2016, 65, 1247–1266. [Google Scholar] [CrossRef]
- Ahmed, H. New trends in the application of carbon-bearing materials in blast furnace iron-making. Minerals 2018, 8, 561. [Google Scholar] [CrossRef] [Green Version]
- Gielen, D. Energy Technology Perspectives 2008: Scenarios and Strategies for CO2 Emissions Reduction. Int. J. Gas Turbine Propuls. Power Syst. 2010, 3, 1–9. [Google Scholar] [CrossRef]
- Wang, X.; Lin, B. How to reduce CO2 emissions in China‘s iron and steel industry. Renew. Sustain. Energy Rev. 2016, 57, 1496–1505. [Google Scholar] [CrossRef]
- Barella, S.; Bondi, E.; Di Cecca, C.; Ciuffini, A.F.; Gruttadauria, A.; Mapelli, C.; Mombelli, D. New perspectivein steelmaking activity to increase competitiveness and reduce environmental impact. La Metall. Ital. 2014, 16, 31–40. [Google Scholar]
- Sarkar, S.; Mazumder, D. Solid waste management in steel industry-challenges and opportunities.Eng.Technol. Int. J. Soc. Behav. Educ. Econ. Bus. Ind. Eng. 2015, 9, 978–981. [Google Scholar]
- Rieger, J.; Schenk, J.; Rieger, J.; Schenk, J. Residual processing in the European steel industry: A technological overview. J. Sustain. Met. 2019, 5, 295–309. [Google Scholar] [CrossRef]
- Branca, T.A.; Colla, V.; Algermissen, D.; Granbom, H.; Martini, U.; Morillon, A.; Pietruck, R.; Rosendahl, S. Reuse and recycling of by-products in the steel sector: Recent achievements paving the way to circular economy and industrial symbiosis in Europe. Metals 2020, 10, 345. [Google Scholar] [CrossRef] [Green Version]
- Kaushik, P.; Fruehan, R.J.; Kaushik, P.; Fruehan, R.J. Behavior of direct reduced iron and hot briquetted iron in the upper blast furnace shaft: Part I. Fundamentals of kinetics and mechanism of oxidation. Met. Mater. Trans. A 2006, 37, 715–725. [Google Scholar] [CrossRef]
- Sah, R.; Dutta, S.K. Kinetic studies of iron ore–coal composite pellet reduction by TG–DTA. Trans. Indian Inst. Met. 2011, 64, 583–591. [Google Scholar] [CrossRef]
- Liu, G.-S.; Strezov, V.; Lucas, J.; Wibberley, L.J. Thermal investigations of direct iron ore reduction with coal. Thermochim. Acta 2004, 410, 133–140. [Google Scholar] [CrossRef]
- Chatterjee, A. Beyond the Blast Furnace; CRC Press: Boca Raton, FL, USA, 1993. [Google Scholar]
- Ding, Y.L.; Warner, N.A. Reduction of carbon-chromite composite pellets with silica flux. Ironmak. Steelmak. 1997, 24, 283–287. [Google Scholar]
- van Duong, H.; Johnston, R.F. Kinetics of solid state silica fluxed reduction of chromite with coal. Ironmak. Steelmak. 2000, 27, 202–206. [Google Scholar] [CrossRef]
- Srivastava, U.; Kawatra, S.K. Strategies for processing low-grade iron ore minerals. Miner. Process. Extr. Metall. Rev. 2009, 30, 361–371. [Google Scholar] [CrossRef]
- Sun, Y.-S.; Han, Y.-X.; Gao, P.; Wang, Z.-H.; Ren, D.-Z. Recovery of iron from high phosphorus oolitic iron ore using coal-based reduction followed by magnetic separation. Int. J. Miner. Metall. Mater. 2013, 20, 411–419. [Google Scholar] [CrossRef]
- Yu, W.; Sun, T.; Kou, J.; Wei, Y.; Xu, C.; Liu, Z. The function of Ca (OH) 2 and Na2CO3 as additive on the reduction of high-phosphorus oolitic hematite-coal mixed pellets. ISIJ Int. 2013, 53, 427–433. [Google Scholar] [CrossRef] [Green Version]
- Yu, W.; Sun, T.; Liu, Z.; Kou, J.; Xu, C. Effects of particle sizes of iron ore and coal on the strength and reduction of high phosphorus oolitic hematite-coal composite briquettes. ISIJ Int. 2014, 54, 56–62. [Google Scholar] [CrossRef] [Green Version]
- Li, S.F.; Sun, Y.S.; Han, Y.X.; Shi, G.Q.; Gao, P. Fundamental research in utilization of an oolitic hematite by deep reduction. Adv. Mater. Res. 2010, 158, 106–112. [Google Scholar] [CrossRef]
- Li, K.-Q.; Ni, W.; Zhu, M.; Zheng, M.-J.; Li, Y. Iron extraction from oolitic iron ore by a deep reduction process. J. Iron Steel Res. Int. 2011, 18, 9–13. [Google Scholar] [CrossRef]
- El-Sadek, M.H.; Ahmed, H.M.; El-Barawy, K.; Morsi, M.B.; El-Didamony, H.; Björkman, B. Non-isothermal carbothermic reduction kinetics of mechanically activated ilmenite containing self-reducing mixtures. J. Therm. Anal. Calorim. 2017, 131, 2457–2465. [Google Scholar] [CrossRef]
- Hammam, A.; Li, Y.; Nie, H.; Zan, L.; Ding, W.; Ge, Y.; Li, M.; Omran, M.; Yu, Y. Isothermal and non-isothermal reduction behaviors of iron ore compacts in pure hydrogen atmosphere and kinetic analysis. Min. Metall. Explor. 2021, 38, 81–93. [Google Scholar] [CrossRef]
- Huang, B.-H.; Lu, W.-K. Kinetics and mechanisms of reactions in iron ore/coal composites. ISIJ Int. 1993, 33, 1055–1061. [Google Scholar] [CrossRef] [Green Version]
- Dutta, S.K.; Ghosh, A.; Dutta, S.K.; Ghosh, A. Study of nonisothermal reduction of iron ore-coal/char composite pellet. Metall. Mater. Trans. A 1994, 25, 15–26. [Google Scholar] [CrossRef]
- Sun, S.; Lu, W.-K. A theoretical investigation of kinetics and mechanisms of iron ore reduction in an ore/coal composite. ISIJ Int. 1999, 39, 123–129. [Google Scholar] [CrossRef] [Green Version]
- Sun, Y.S.; Han, Y.X.; Gao, P.; Li, G.F. Investigation of kinetics of coal based reduction of oolitic iron ore. Ironmak. Steelmak. 2014, 41, 763–768. [Google Scholar] [CrossRef]
- Sun, S.; Lu, W.-K. Building of a mathematical model for the reduction of iron ore in ore/coal composites. ISIJ Int. 1999, 39, 130–138. [Google Scholar] [CrossRef] [Green Version]
- Sbirrazzuoli, N.; Vincent, L.; Mija, A.; Guigo, N. Integral, differential and advanced isoconversional methods: Complex mechanisms and isothermal predicted conversion–time curves. Chemom. Intell. Lab. Syst. 2009, 96, 219–226. [Google Scholar] [CrossRef]
- Šimon, P. Isoconversional methods. J. Therm. Anal. Calorim. 2004, 76, 123–132. [Google Scholar] [CrossRef]
- Khawam, A.; Flanagan, D.R. Role of isoconversional methods in varying activation energies of solid-state kinetics: I. Isothermal kinetic studies. Thermochim. Acta 2005, 429, 93–102. [Google Scholar] [CrossRef]
- Khawam, A.; Flanagan, D.R. Role of isoconversional methods in varying activation energies of solid-state kinetics: II. Nonisothermal kinetic studies. Thermochim. Acta 2005, 436, 101–112. [Google Scholar] [CrossRef]
- Vyazovkin, S. Computational aspects of kinetic analysis.: Part C. The ICTAC Kinetics Project—The light at the end of the tunnel? Thermochim. Acta 2000, 355, 155–163. [Google Scholar] [CrossRef]
- Burnham, A.K. Computational aspects of kinetic analysis.: Part D: The ICTAC kinetics project—Multi-thermal–history model-fitting methods and their relation to isoconversional methods. Thermochim. Acta 2000, 355, 165–170. [Google Scholar] [CrossRef]
- Coats, A.W.; Redfern, J.P. Kinetic parameters from thermogravimetric data. Nat. Cell Biol. 1964, 201, 68–69. [Google Scholar] [CrossRef]
- Sun, Y.; Han, Y.; Wei, X.; Gao, P. Non-isothermal reduction kinetics of oolitic iron ore in ore/coal mixture. J. Therm. Anal. Calorim. 2016, 123, 703–715. [Google Scholar] [CrossRef]


| Component | Assay (%) | Component | Assay (%) |
|---|---|---|---|
| Fe2O3 | 96.18 | K2O | 0.024 |
| SiO2 | 1.62 | P2O5 | 0.039 |
| CaO | 0.977 | MnO | 0.093 |
| Al2O3 | 0.655 | V2O5 | 0.051 |
| MgO | 0.099 | Cr2O3 | 0.024 |
| TiO2 | 0.082 | SrO | 0.013 |
| SO3 | 0.054 | NiO | 0.018 |
| Na2O | 0.011 | Cl | 0.019 |
| Coal Type | Moisture | Ash | Volatiles | Fixed Carbon |
|---|---|---|---|---|
| Coal | 4.5 | 4 | 33.5 | 58 |
| Charcoal | 9 | 3 | 14 | 74 |
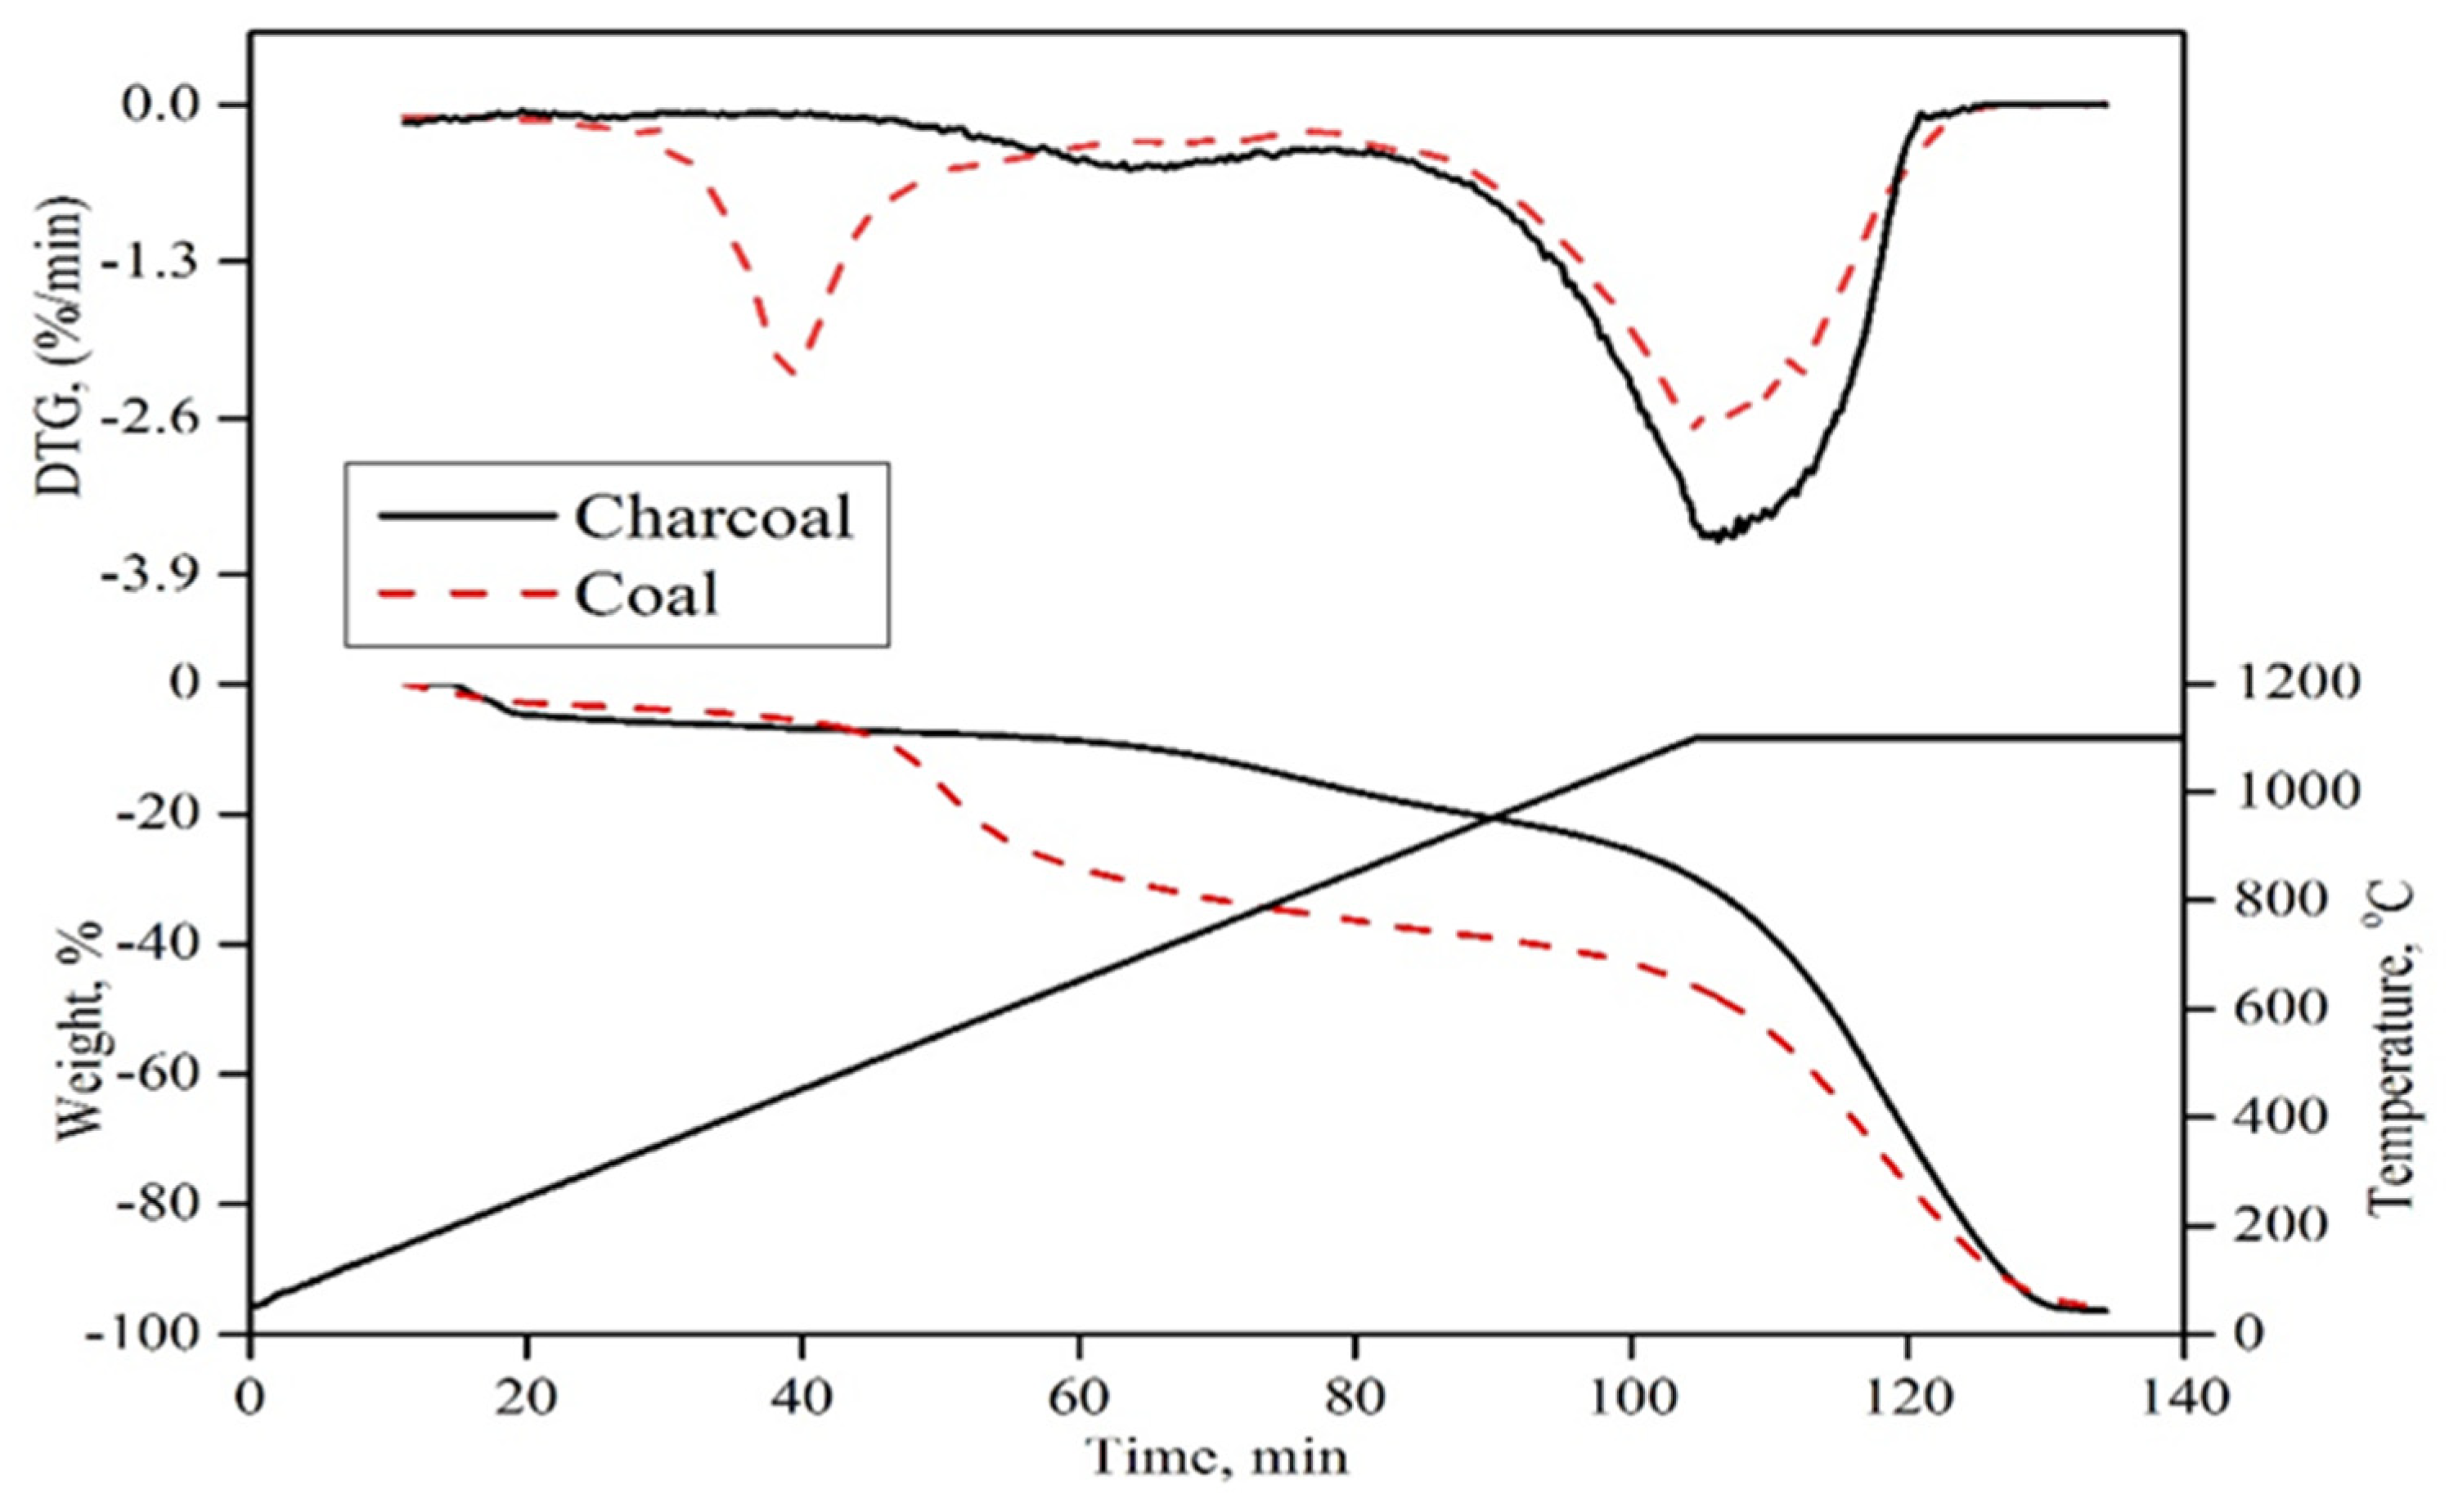
| Materials | De-Hydration 80–120 °C | De-Volatilization 430–520 °C | Gasification >700 °C |
|---|---|---|---|
| Coal | 5% | 35% | 57% |
| Charcoal | 10% | 15% | 72% |
| Conversion Degree (α) | 0.1 | 0.2 | 0.3 | 0.4 | 0.5 | 0.6 | 0.7 | 0.8 | 0.9 |
|---|---|---|---|---|---|---|---|---|---|
| Ea value | 55.02 | 79.12 | 99.47 | 115.07 | 116.72 | 150.73 | 175.22 | 193.803 | 220.12 |
| Conversion Degree (α) | 0.1 | 0.2 | 0.3 | 0.4 | 0.5 | 0.6 | 0.7 | 0.8 | 0.9 |
|---|---|---|---|---|---|---|---|---|---|
| Ea value | 40.50 | 58.52 | 74.85 | 88.85 | 89.05 | 115.05 | 136.94 | 162.61 | 190.12 |
Publisher’s Note: MDPI stays neutral with regard to jurisdictional claims in published maps and institutional affiliations. |
© 2021 by the authors. Licensee MDPI, Basel, Switzerland. This article is an open access article distributed under the terms and conditions of the Creative Commons Attribution (CC BY) license (https://creativecommons.org/licenses/by/4.0/).
Share and Cite
Hammam, A.; Cao, Y.; El-Geassy, A.-H.A.; El-Sadek, M.H.; Li, Y.; Wei, H.; Omran, M.; Yu, Y. Non-Isothermal Reduction Kinetics of Iron Ore Fines with Carbon-Bearing Materials. Metals 2021, 11, 1137. https://doi.org/10.3390/met11071137
Hammam A, Cao Y, El-Geassy A-HA, El-Sadek MH, Li Y, Wei H, Omran M, Yu Y. Non-Isothermal Reduction Kinetics of Iron Ore Fines with Carbon-Bearing Materials. Metals. 2021; 11(7):1137. https://doi.org/10.3390/met11071137
Chicago/Turabian StyleHammam, Abourehab, Yi Cao, Abdel-Hady A. El-Geassy, Mohamed H. El-Sadek, Ying Li, Han Wei, Mamdouh Omran, and Yaowei Yu. 2021. "Non-Isothermal Reduction Kinetics of Iron Ore Fines with Carbon-Bearing Materials" Metals 11, no. 7: 1137. https://doi.org/10.3390/met11071137