Article

Enhancement of Corrosion Properties of Fe-18Cr-9Mn-5.5Ni-0.3(C + N) Austenitic Stainless Steels by Carbon Alloying

1
Department of Materials Science and Engineering, Pusan National University, Busan 46241, Korea
2
Advanced Metals Division, Korea Institute of Materials Science, Changwon 51508, Korea
3
Materials Technology Development Team, Corporate Research and Development Institute, Doosan Heavy Industries and Construction Co. Ltd., Changwon 51711, Korea
*
Authors to whom correspondence should be addressed.
Metals 2021, 11(7), 1124; https://doi.org/10.3390/met11071124
Submission received: 20 June 2021 / Revised: 10 July 2021 / Accepted: 13 July 2021 / Published: 15 July 2021
(This article belongs to the Special Issue Corrosion and Protection of Stainless Steels)

Abstract

:
In this study, the resistance to pitting corrosion of Fe-18Cr-9Mn-5.5Ni-0.3(C + N) austenitic stainless steel γ-SSs (in wt%) with different C/(C + N) ratios (0.02, 0.29, and 0.60) was evaluated. It was found to be difficult to form a γ-matrix without precipitation, because the Cr23C6 precipitation rate in the γ-SSs with the C/(C + N) value of 0.60 was too fast. Thus, it was recommended to maintain the C/(C + N) ratio below 0.6 in Fe-18Cr-9Mn-5.5Ni-0.3(C + N) γ-SSs. As a result of the potentiodynamic polarization tests, the γ-SS with a C/(C + N) ratio of 0.29 showed the highest resistance to pitting corrosion, and the resistance level of this alloy was superior to that of the AISI 304 γ-SS. Analysis of the passive film and matrix dissolution rates revealed that a higher C/(C + N) ratio of γ-SS increased the protective ability of the passive film and decreased the growth rate of the pits. Therefore, it could be concluded that partial substitution of C for N was advantageous for improving the pitting corrosion resistance of Fe-18Cr-9Mn-5.5Ni-0.3(C + N) γ-SSs, as long as C and N existed in a solid solution state.

1. Introduction

FeCrNi austenitic stainless steel (γ-SS) occupies the largest demand in the stainless steel (SS) market. The representative commercial γ-SSs are AISI 304 and AISI 316L, which contain approximately 18 wt% Cr and 8–10 wt% Ni. Ni is an essential alloying element for stabilizing the γ phase, improving impact toughness, formability, and resistance to general (or uniform) corrosion [1]. However, Ni is expensive and has high price volatility. In addition, Ni causes allergic reactions in the human body and, moreover, Ni is suspected of being carcinogenic to humans [1,2,3,4]. Therefore, extensive studies have been conducted to find novel γ-SS with lower Ni content but similar performances to AISI 304 [1,2,3,4,5,6,7]. Reducing Ni in γ-SS is inevitably accompanied by an increase in the content of other γ-stabilizing elements, and the commonly used replacing element is Mn. In this case, the deterioration of corrosion resistance may be of more concern than other performances such as mechanical properties, because Mn, even in solid solution state, is known to reduce both general and localized corrosion resistance of SSs [8,9,10,11,12,13].
In the literature, various studies on Fe-(17–18)Cr-(5–5.5)Ni γ-SSs (in wt%, all of the alloy compositions in this section indicate wt%) containing Mn and N can be found [8,12,13,14,15,16,17,18]. A study of Fe-17Cr-(8–10)Mn-(5.2–5.3)Ni-(0.13–0.94)N SSs [16] shows that these alloys have better mechanical properties than AISI 304, even with only 0.2 wt% N. Fe-(16–18)Cr-(5.5–7.5)Mn-(3.5–5.5)Ni-0.25N SS is also reported to have higher tensile strength and similar elongation compared to AISI 304 [4]. However, corrosion resistance of Fe-(17–18)Cr-(5–5.5)Ni γ-SSs is slightly problematic. Shams El Din et al. [12,13], examined the corrosion resistance of Fe-17.2Cr-5.3Ni-xMn (x = 0.3–13.9 wt%) SSs and found that the resistance to uniform and pitting corrosion of Fe-17.2Cr-5.3Ni-5.6Mn SS was close to that of Fe-18Cr-9Ni (type AISI 304). Janik-Czachor et al. [14] investigated the corrosion resistance of Fe-18Cr-10Mn-5.5Ni-xN (x = 0.07–0.35 wt%) SSs and reported that Fe-18.2Cr-10.7Mn-5.4Ni-0.35N SS exhibited similar passive current density to that of AISI 304, but the pitting corrosion resistance of this alloy was lower than that of AISI 304. Calderón-Hernández et al. [18] also reported that Fe-17Cr-6Mn-4.6Ni-1.6Cu SS exhibited lower resistance to pitting corrosion than that of AISI 304. Many of the previous studies reported that the SSs with less Ni and more Mn than the AISI 304 generally possess lower resistance to pitting corrosion than AISI 304 [17].
The low resistance to pitting corrosion of Fe-(17–18)Cr-(5–5.5)Ni γ-SSs can be improved by adjusting the N and C contents. It is well known that N has a beneficial effect on the resistance to pitting corrosion resistance of SSs, as long as N remains in solid solution state [1,4,6,14,19,20]. Moreover, recent studies have shown that alloying C also can improve the resistance to pitting corrosion of SS [7,21,22,23,24,25,26,27,28,29,30,31]. For this reason, it can be expected that the resistance to pitting corrosion of Fe-(17–18)Cr-(5–5.5)Ni SS can be improved to the level of AISI 304 through proper alloying of N and C. To this end, finding the optimal composition of C + N and the ratio of C to N will be helpful in designing new lean γ-SSs. Therefore, in this paper, a series of Fe-18Cr-9Mn-5.5Ni-0.3(C + N) γ-SS with adjusted C/(C + N) ratio were fabricated, and the change in the resistance to pitting corrosion of the γ-SSs according to the C/(C + N) ratio was examined.

2. Materials and Methods

For this study, three kinds of Fe-18Cr-9Mn-5.5Ni γ-SSs containing different N and C contents were fabricated. The three alloys have similar C + N content, but different C/(C + N) ratios. The detailed chemical compositions of the γ-SSs are given in Table 1. The three alloys were named LC, MC, and HC (low, medium, and high C/(C + N) ratios, respectively) according to the C/(C + N) ratio. The detailed chemical compositions of the γ-SSs, denoted as LC, MC, and HC according to the C/(C + N) ratio, are given in Table 1. The chemical compositions were measured using optical emission spectroscopy (QSN 750-II, PANalytical, Almemo, The Netherlands).
Ingots (1 kg) were fabricated using a vacuum/pressure casting machine (VTC 200 V, Indutherm GmbH, Walzbachtal, Germany) under N2 atmosphere. By holding the ingot melt in an N2 atmosphere of 1 bar, it was possible to dissolve N up to about 0.3 wt% in Fe-18Cr-9Mn-5.5Ni, thus, the total content of interstitial alloying elements (C + N) in this study was determined to be approximately 0.3 wt%. In addition, the N concentration was controlled by adjusting the partial pressure of N2 during ingot melting. The ingots were homogenized at 1250 °C for 2 h in Ar gas, and then hot-rolled at a temperature above 1050 °C with a reduction ratio of 75%. The hot rolled plates were solution treated at 1100–1230 °C (Table 1) for 1–24 h, followed by quenching in water. The processing temperatures for the homogenization, hot-rolling, and solution treatment were determined based on the equilibrium phase fraction versus temperature diagram (Figure 1), which was calculated using Thermo-Calc software, version 2021a, database TCFE 10 (Thermocalc, Stockholm, Sweden).
The microstructures of the SSs were examined using a light optical microscope (LOM, Epiphot, Nikon, Minato, Japan) and scanning electron microscopy (SEM, IT-300, JEOL, Akishima, Japan) with both secondary electron (SE) and back-scattered electron (BSE) detectors. For the microstructural analysis, samples (10 × 15 × 2 mm3) were cut from the solution-treated plates and mechanically ground using SiC abrasive paper up to 2400-grit. Then, they were polished using suspension containing 1 μm-sized diamond particles. Polished samples were chemically etched in a mixed acid solution (40 mL HNO3 + 10 mL HCl + 50 mL deionized water) at 25 °C for 3–4 min, or electrochemically etched in an oxalic acid solution (10 g oxalic acid + 100 mL deionized water) at 25℃ by applying 7.5 V for 10–20 min. In addition, chemical composition of the non-metallic inclusions (NMIs) in the alloys were analyzed through energy dispersive X-ray spectroscopy (EDS) equipped in the SEM. Furthermore, the microstructure was precisely observed using transmission electron microscopy (TEM, JEM 2100 F, JEOL, Japan) with the acceleration voltage of 200 kV. For the TEM analysis, the samples were polished to about 100 μm thickness and then electrochemically etched using a twin-jet electrolytic polishing machine. The electrochemical etching was conducted in a mixed solution of 10% perchloric acid and 90% methanol by applying 10 V and 70 mA at −20 °C.
The resistance to pitting corrosion of the SSs was evaluated in a 3.5 wt% NaCl solution at 25 ± 1 °C through cyclic potentiodynamic polarization tests. Polarization tests were conducted in a three-electrode electrochemical cell consisting of a Pt counter electrode, a saturated calomel reference electrode (SCE), and a sample serving as a working electrode. The tests were controlled using a potentiostat (Reference600+, GAMRY, Warminster, PA, USA). The sample for the working electrode was mounted in cold epoxy resin and ground using SiC emery paper up to 2000-grit, and the exposed surface area for the polarization tests was adjusted to have a circle with a diameter of 0.5 cm, using electroplating tape. Prior to the anodic polarization, the sample (working electrode) was cathodically polarized for 300 s by applying −1 VSCE in order to remove an air-formed oxide film, and stabilized in the solution for 500 s. Then the sample was anodically polarized from −0.1 V versus corrosion potential (Ecorr) to the potential where the current density exceeded 0.15 mA cm−2, after which the potential was decreased to the repassivation potential (Erp) with a potential sweep rate of 0.167 mV s−1. The potential value at which an abrupt and irreversible increase in the current density began was determined as a stable pitting potential (Epit). Then, for the LC and MC samples, the uniform corrosion behavior was assessed through the polarization test in a 1 M HCl solution at 25 ± 1 °C. The experimental setup and method for this test were the same as described above, only the potential scanning range was different. After the 500 s stabilization in the 1 M HCl solution, the sample was anodically polarized from −0.1 V versus Ecorr to the potential where the current density exceeded 5 mA cm−2. Three test samples were prepared for each alloy, and for each sample and each condition, the polarization tests were repeated 2–4 times.
Pit morphologies were observed using the SEM. Pitting corrosion was induced on the samples by anodic polarization in the 3.5 wt% NaCl solution at 25 ± 1 °C, and the pits were grown until the anodic current reached 300 μA. For this observation, the samples were polished using a diamond suspension with a particle size of 1 μm.
For the LC and MC samples, the chemical composition depth profile of the passive film was obtained through X-ray photoelectron spectroscopy (XPS, PHI 5000 VersaProbe, ULVAC-PHI, Chigasaki, Japan) sputtering method on an analysis area of 100 μm × 100 μm. For the XPS analysis, the passive films were formed on the samples (10 × 15 × 2 mm3), which were polished using a suspension containing 1 μm-sized diamond particles, by immersion in the 3.5 wt% NaCl solution for 2 h at 25 ± 1 °C. A monochromatic Al Kα (1486.6 eV, 25 W, 15 kV) radiation source was used for photoelectron emission, and for depth profiling, the oxide surface of the specimens were etched using Ar ions of 2.0 kV. The background pressure was 2.0 × 10⁻⁷ Pa. An XPS analysis was performed 2–3 times per each passivated specimen.

3. Results and Discussion
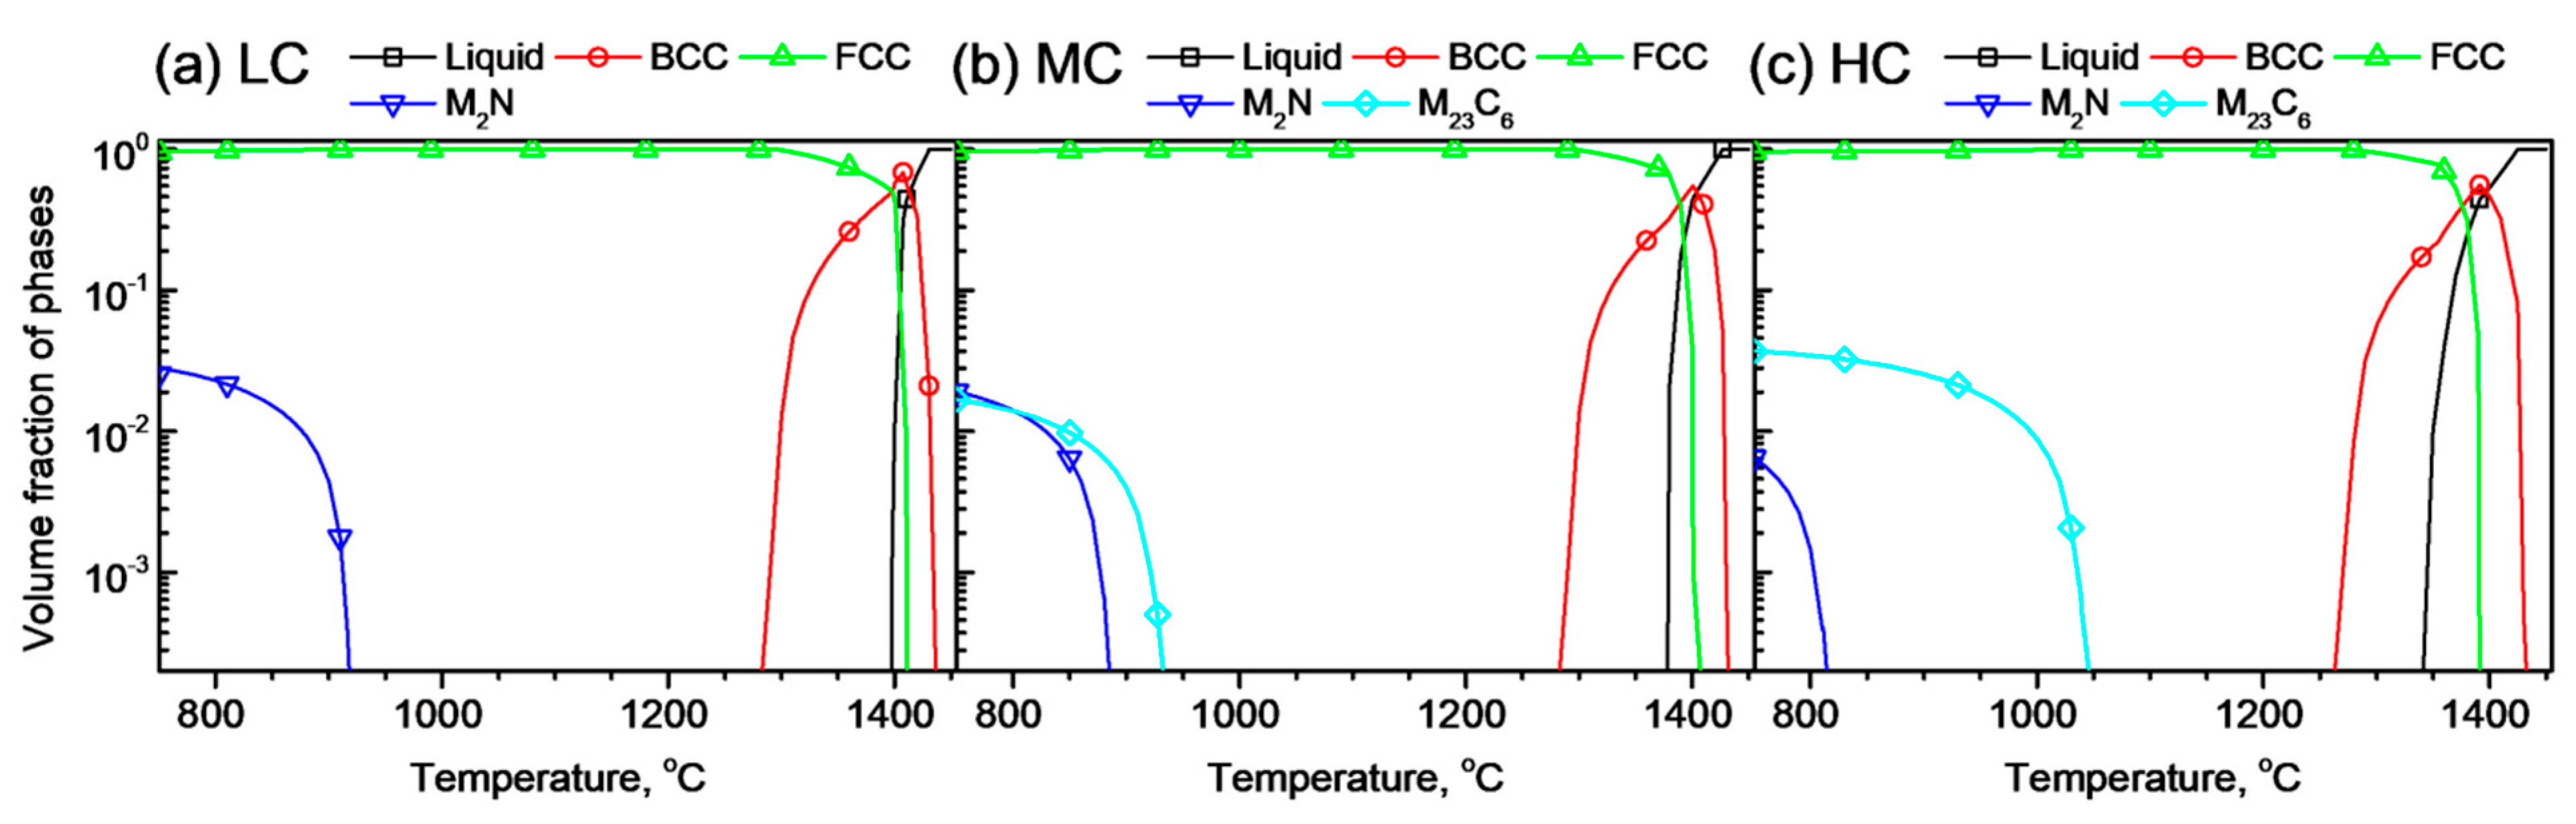
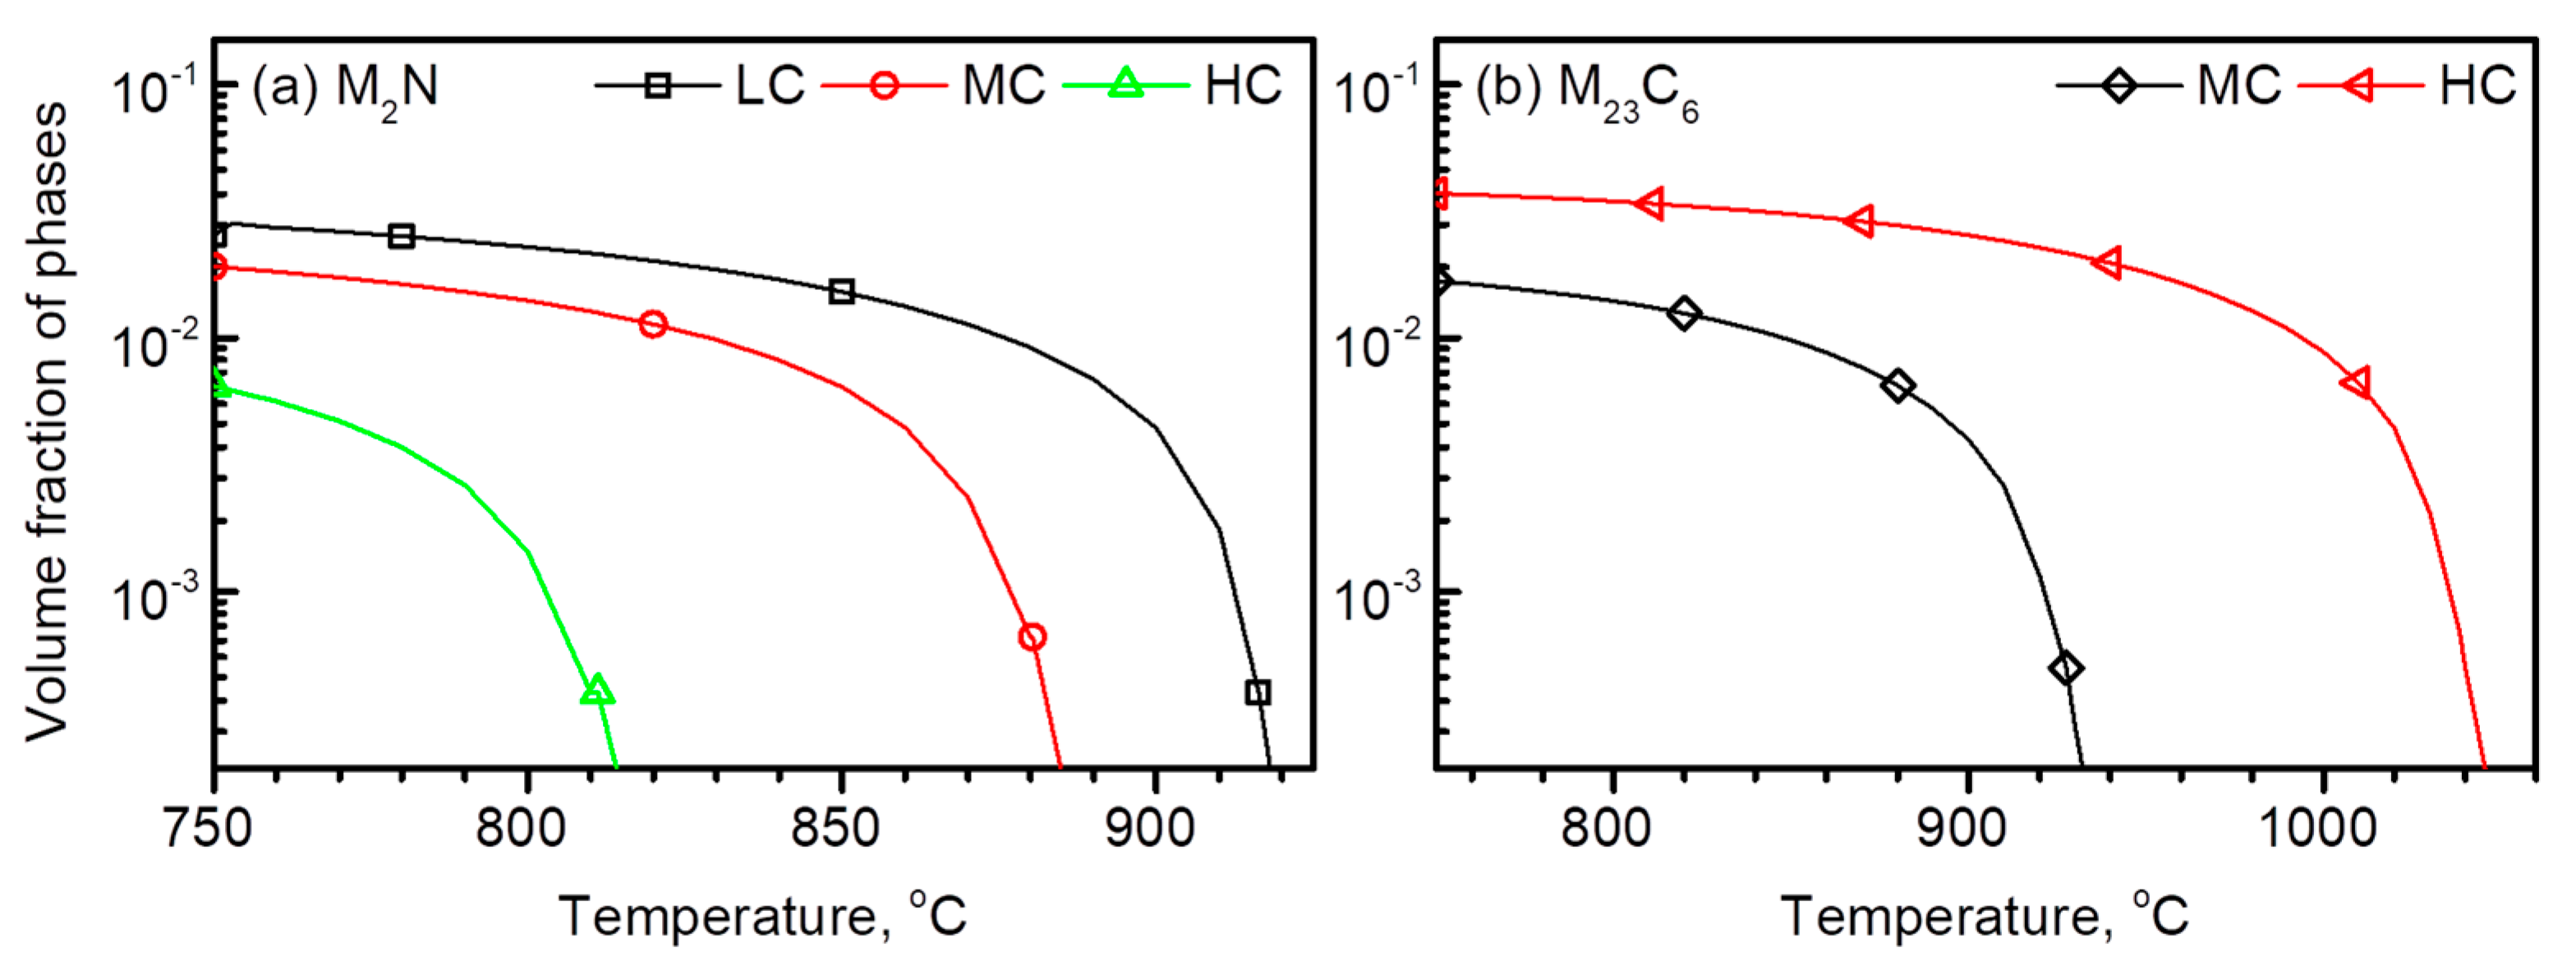
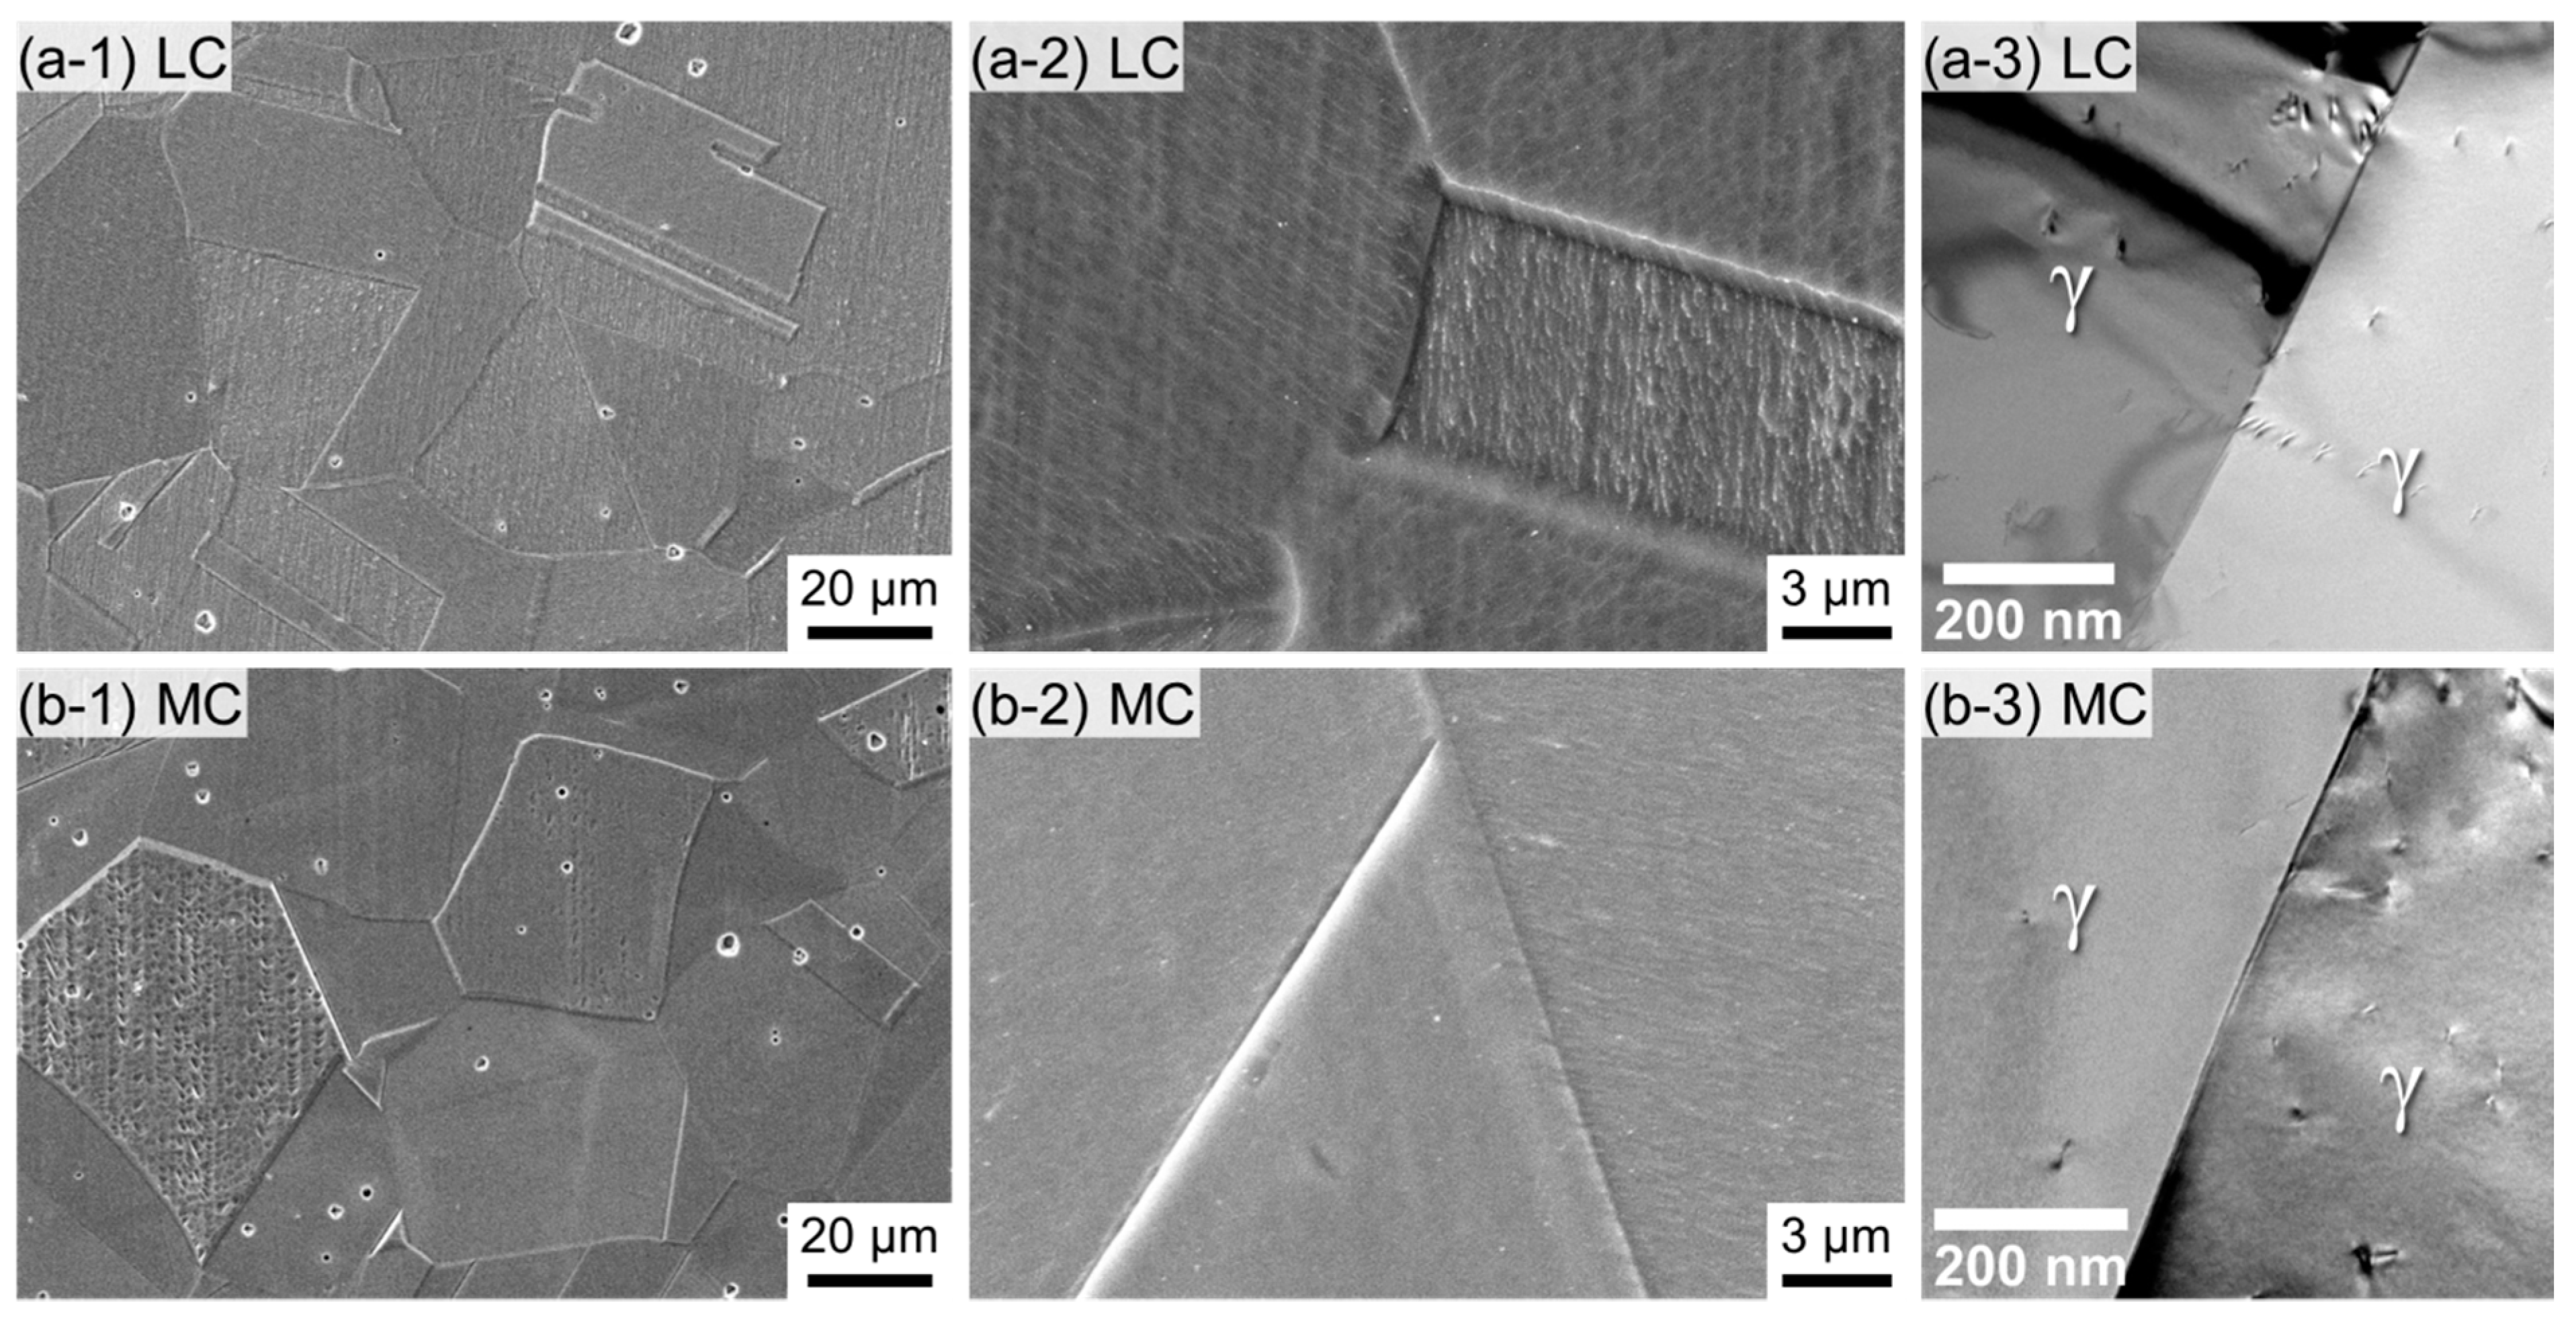
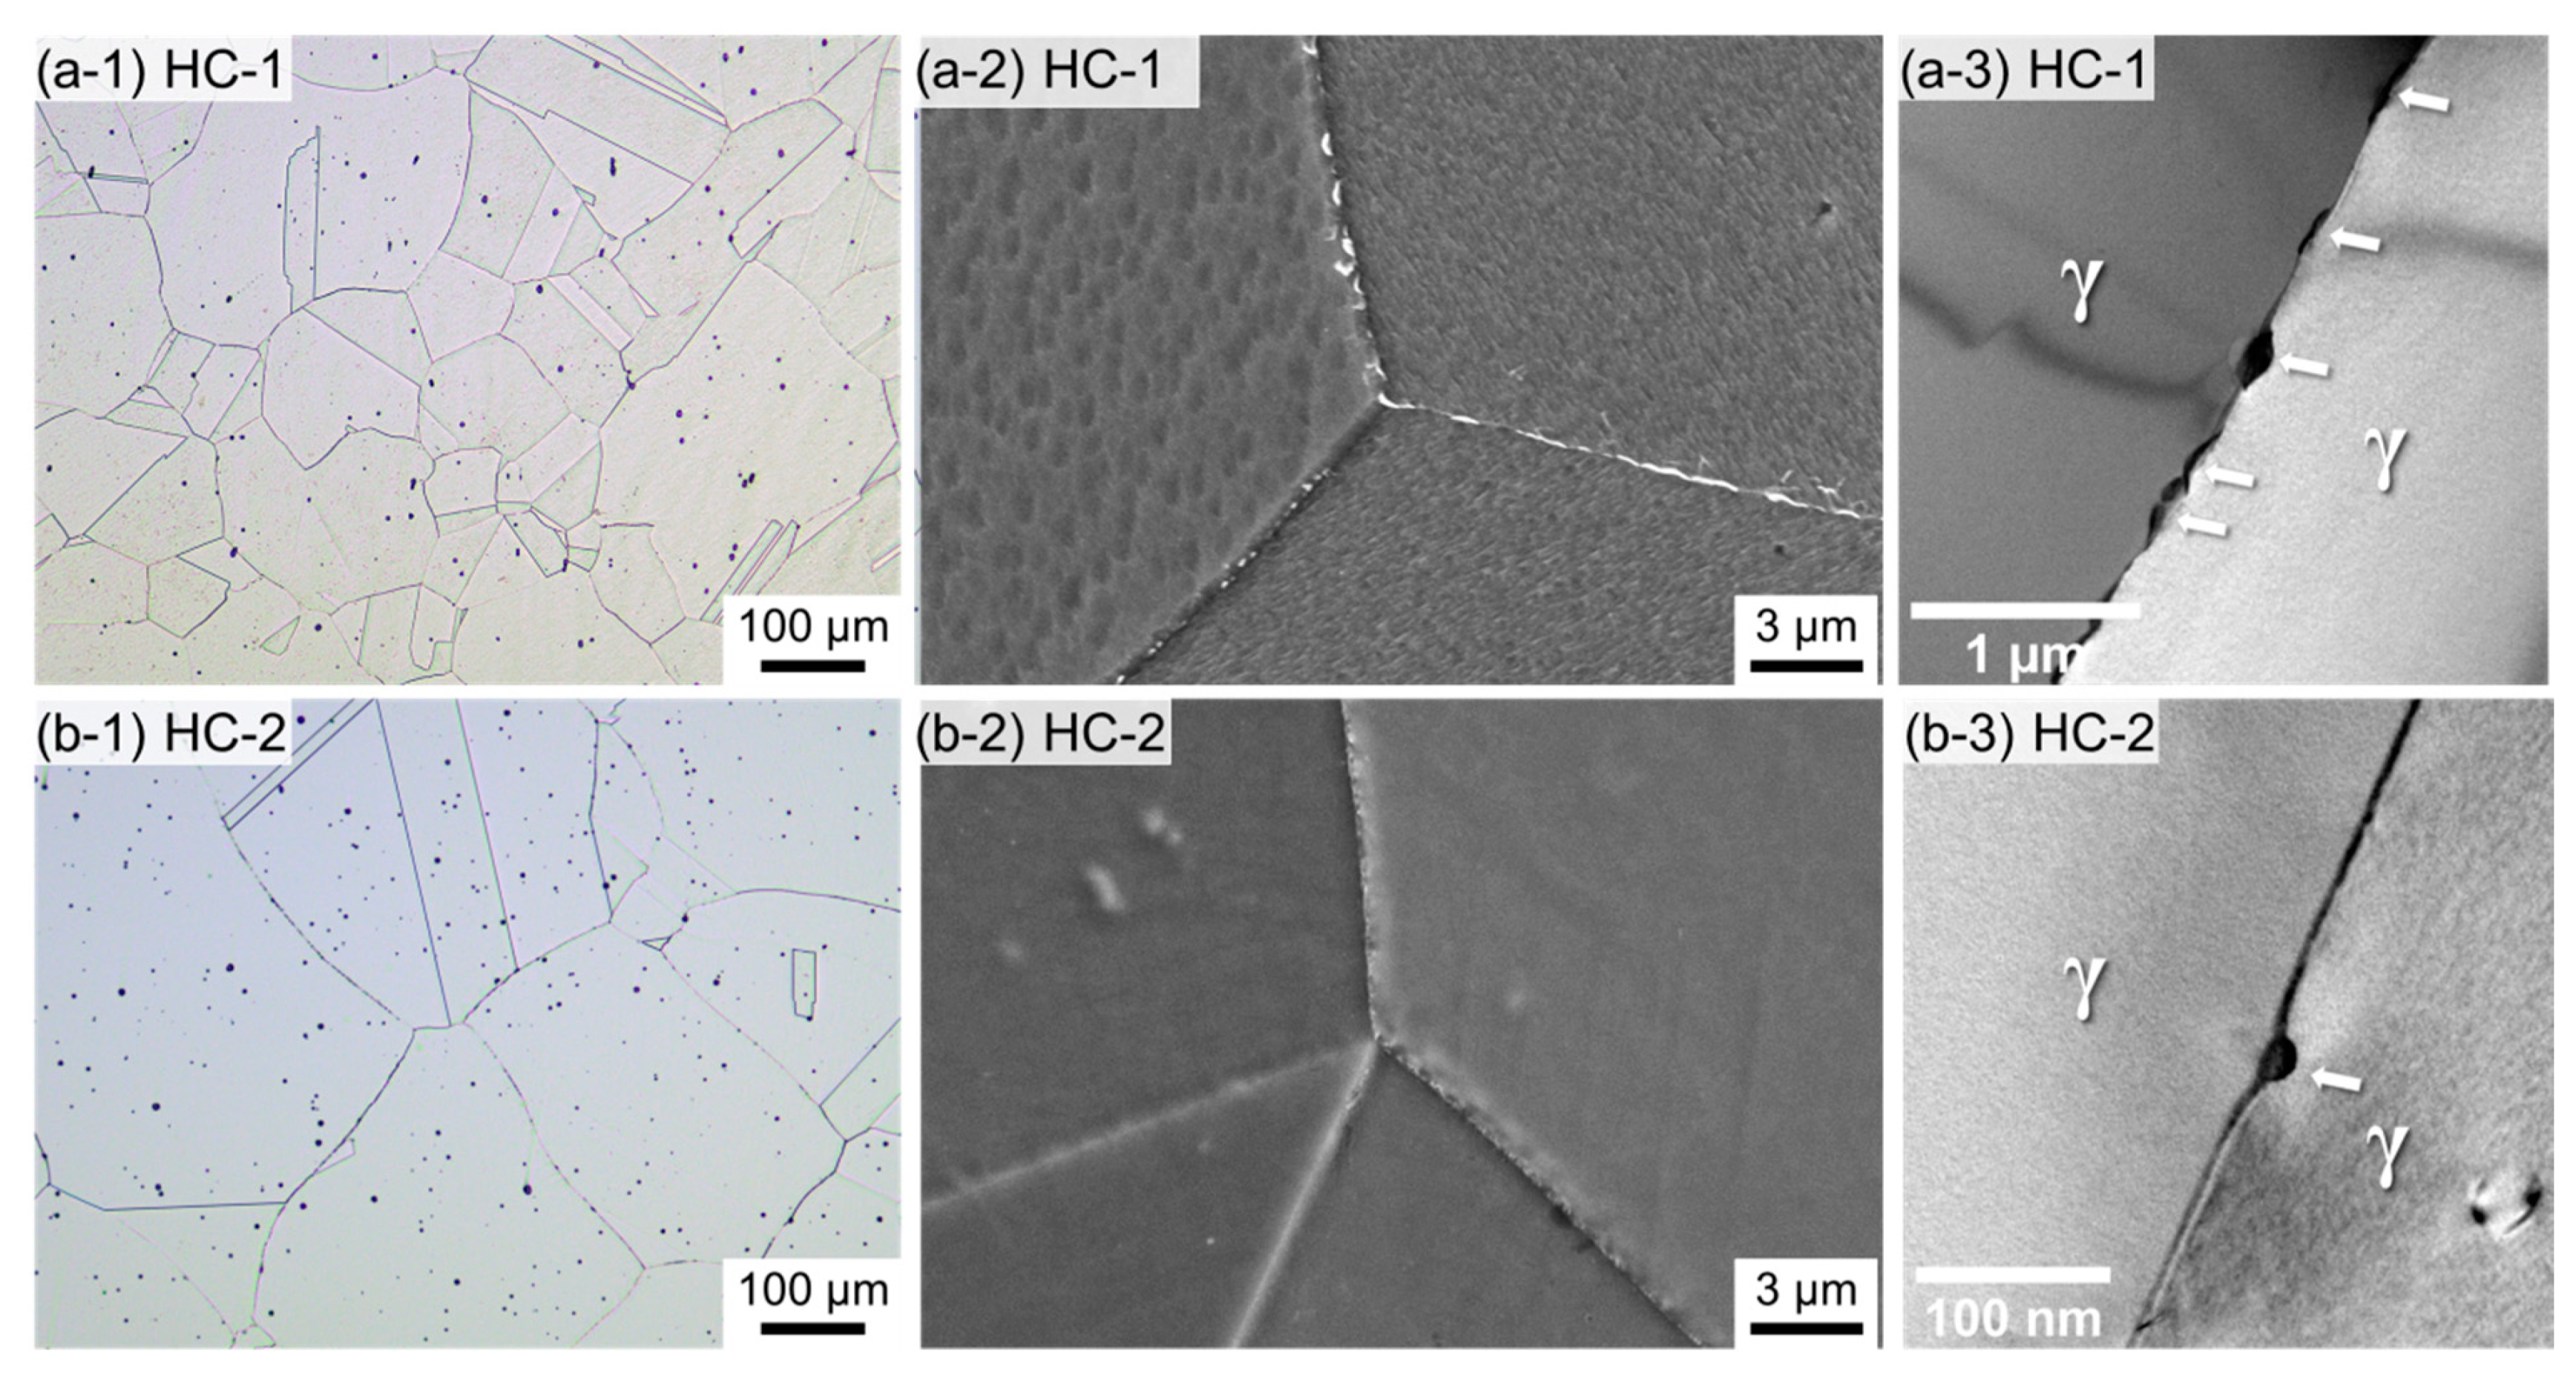
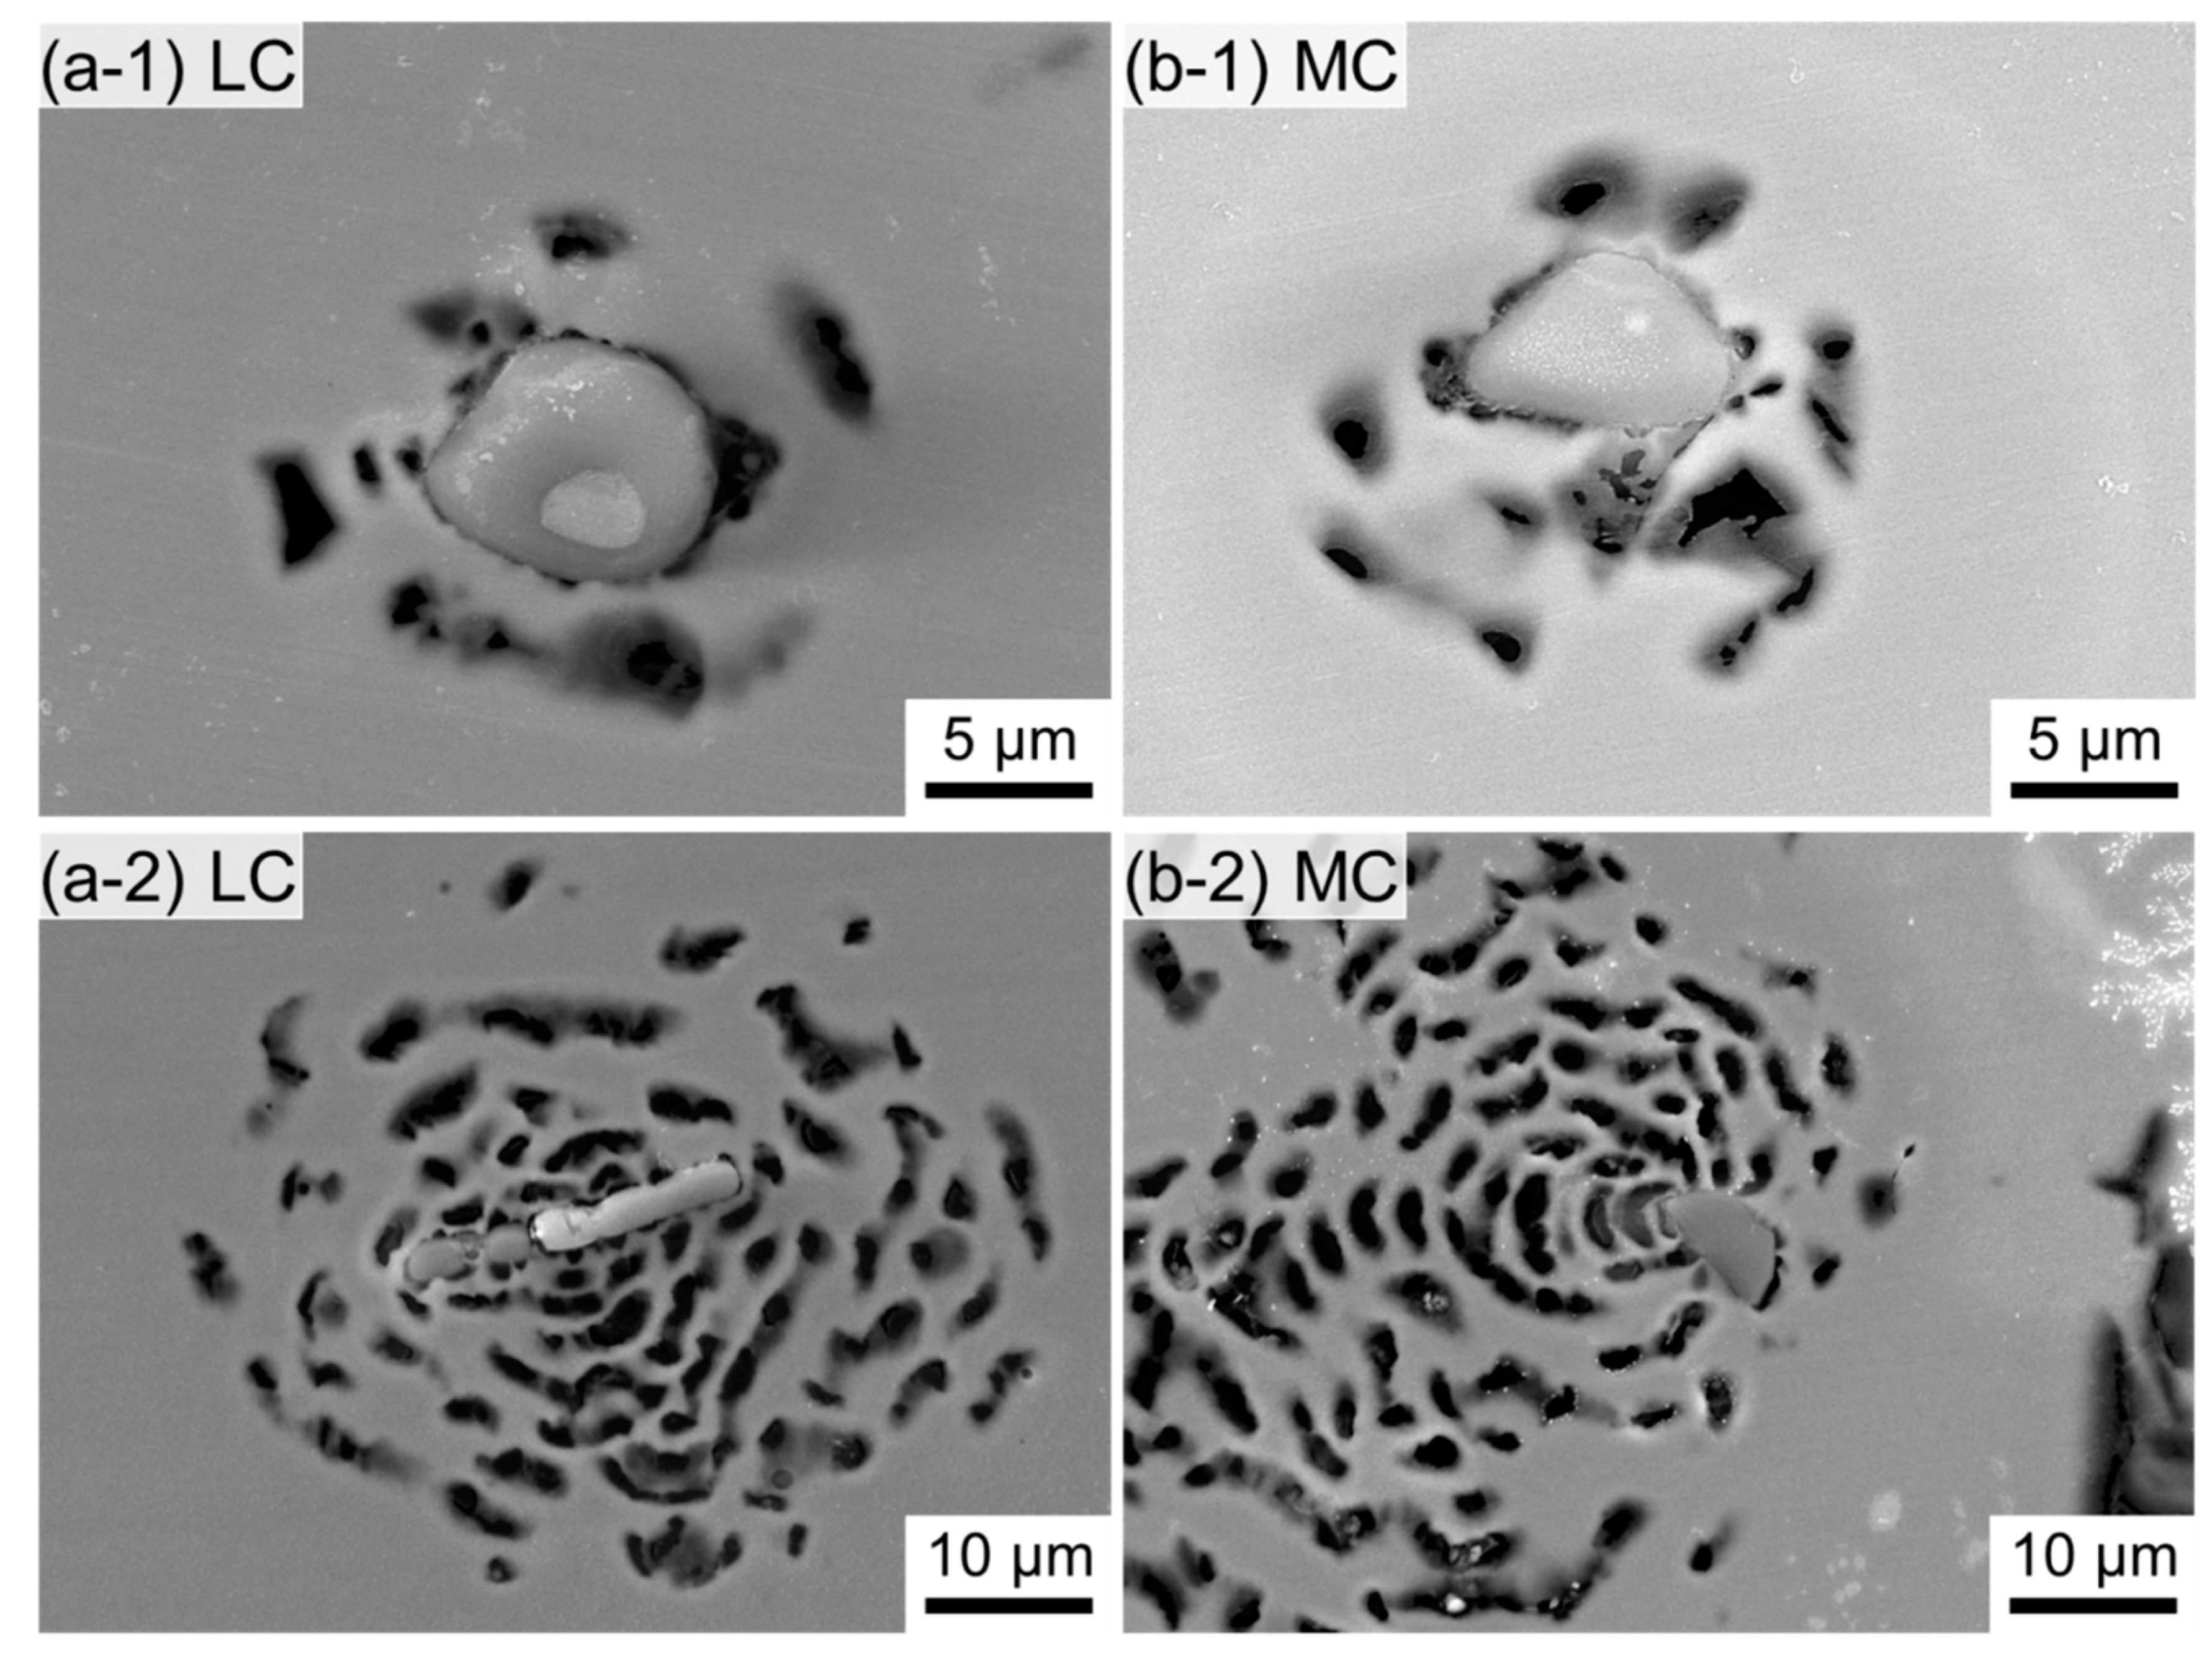
3.1. Microstructure

Figure 1 shows the equilibrium volume fractions of liquid, BCC (ferrite, α), FCC (γ), M2N, and M23C6 (M stands for metal), as a function of temperature in the LC, MC, and HC alloys. Figure 1 indicates that γ single phase can be obtained in all of the three alloys at temperatures below 1250 °C, and that further cooling to 900–1050 °C can lead to the formation of precipitates such as M2N and M23C6. The precipitation temperatures and phase fractions of M2N and M23C6 formed in the three alloys can be clearly compared in Figure 2. As C/(C + N) increases from 0.022 (LC alloy) to 0.595 (HC alloy), the upper limit of the temperature range for stable M2N decreases from 920 °C to 815 °C (Figure 2a). Conversely, the temperature range at which M23C6 is stable extends from 930 °C (MC alloy) to 1050 °C (HC alloy) (Figure 2b). In addition, M23C6 is not expected to form in the LC alloy above 800 °C. As described above, the solution treatment temperatures for the LC and MC alloys were determined to be 1100 °C, and that for the HC sample was determined to be a higher temperature (1150–1230 °C), based on Figure 1 and Figure 2.
Figure 3a,b show microstructures of the solution-treated LC and MC samples, respectively. Both samples had γ single structure with annealing twins, and their grain sizes were similar with a diameter of 50–57 μm on average as shown in Figure 3(a-1,b-1). In the magnified SEM images (Figure 3(a-2,b-2)), precipitates were not observed even at the grain boundaries. A close examination on the grain boundaries using the TEM confirmed that precipitate was not formed in both LC and MC samples, respectively, as shown in Figure 3(a-3,b-3).
The microstructures of the HC-1 and HC-2 samples are shown in Figure 4a,b, respectively. As with the LC and MC alloys, both solution-treated HC samples were composed of a γ single phase. But the HC samples were different from the LC and MC samples in grain size. Significant grain growth was observed in the HC samples because of the higher temperatures for solution treatments. The average grain size of the HC-1 sample was 120 μm and that of the HC-2 sample was 200 μm. Moreover, a close examination on the microstructures of the HC-1 and HC-2 samples showed that precipitates remained at the grain boundaries of both samples. In the HC-1 sample (Figure 4(a-2)), precipitation at the grain boundary was clearly shown, and in the HC-2 sample (Figure 4(b-2)), relatively small precipitates were observed at very few grain boundary. TEM analysis on the grain boundaries more clearly shows the precipitates of the two samples (Figure 4(a-3,b-3)). In Figure 4(a-3), it is confirmed that the precipitates with a maximum width of 140 nm were formed along the grain boundary of the HC-1 sample. In contrast, in the HC-2 sample, precipitates were found very rarely and were very small, about 25 mm in size (Figure 4(b-3)). For the HC-1 sample, a high-resolution (HR) TEM image of the γ-M23C6 interface and the corresponding fast-Fourier transformation (FFT) result are given in Figure 5a,b, respectively. The precipitates in the HC samples were revealed to be Cr23C6 (space group: Fm 3 ¯ m, lattice parameter: a = 1.060 nm).
As mentioned above, the HC-1 sample was solution treated at 1150 °C for 1 h, and the HC-2 sample was held at 1230 °C for 24 h. Figure 1 and Figure 2 indicate that the temperatures for the solution treatments were high enough to dissolve precipitates of the HC sample. Thus, it is reasonable to consider that the precipitates in the HC sample were formed during the cooling process.
Figure 6 shows the time-temperature-precipitation (TTP) curves for M23C6 and M2N phases in the MC and HC alloys, calculated by JMatPro Software, version 11 (Sente Software Ltd., Guildford, UK). The TTP curves for M2N of both alloys are almost the same, with a nose temperature of 800 °C. However, the precipitation behavior of M23C6 is significantly different between the two alloys. The nose temperature for M23C6 of the HC alloy was approximately 950 °C, while that of the MC alloy was much lowered to 850 °C. In addition, in order to achieve transformed fraction of 0.1% M23C6 in the γ matrix, it is predicted to take 0.46 h for the MC alloy, but only 0.027 h for the HC alloy. That is, the precipitation rate of M23C6 in the HC alloy at nose temperature is approximately 20 times faster than that of the MC alloy. Thus, Figure 6 suggests that faster quenching than even water quenching is required for the HC sample to prevent M23C6 precipitation.
In the micrographs of LC, MC, and HC alloys (Figure 3(a-1,b-1) and Figure 4(a-1,b-1)), NMIs were observed. BSE images in Figure 7(a-1,b-1,c-1) shows the distribution of the NMIs in the LC, MC, and HC-2 samples, respectively. Only micrographs of HC-2 were presented in Figure 7, because it was found that the HC-1 and HC-2 samples were similar in the NMI distribution and characteristics.
Table 2 shows the analysis results for NMIs in LC, MC, and HC-2 samples. In the three samples, the volume fraction of NMI was approximately equal to 0.19–0.20 vol%. The individual NMI was presented in lower line in Figure 7. The NMIs have a generally round shape, and the average diameter of NMIs was 4.25–4.40 μm. In addition, the chemical composition of the NMIs of the three alloys was measured to be 32O-43Cr-23Mn-2Fe (that is, 61O-25Cr-13Mn-1Fe, in at%) on average, indicating (Cr,Mn)2O3. Thus, it could be concluded that the three alloys investigated in this paper did not differ significantly in terms of the characteristics of the NMI.
The results from microstructural analysis can be summarized as follows:
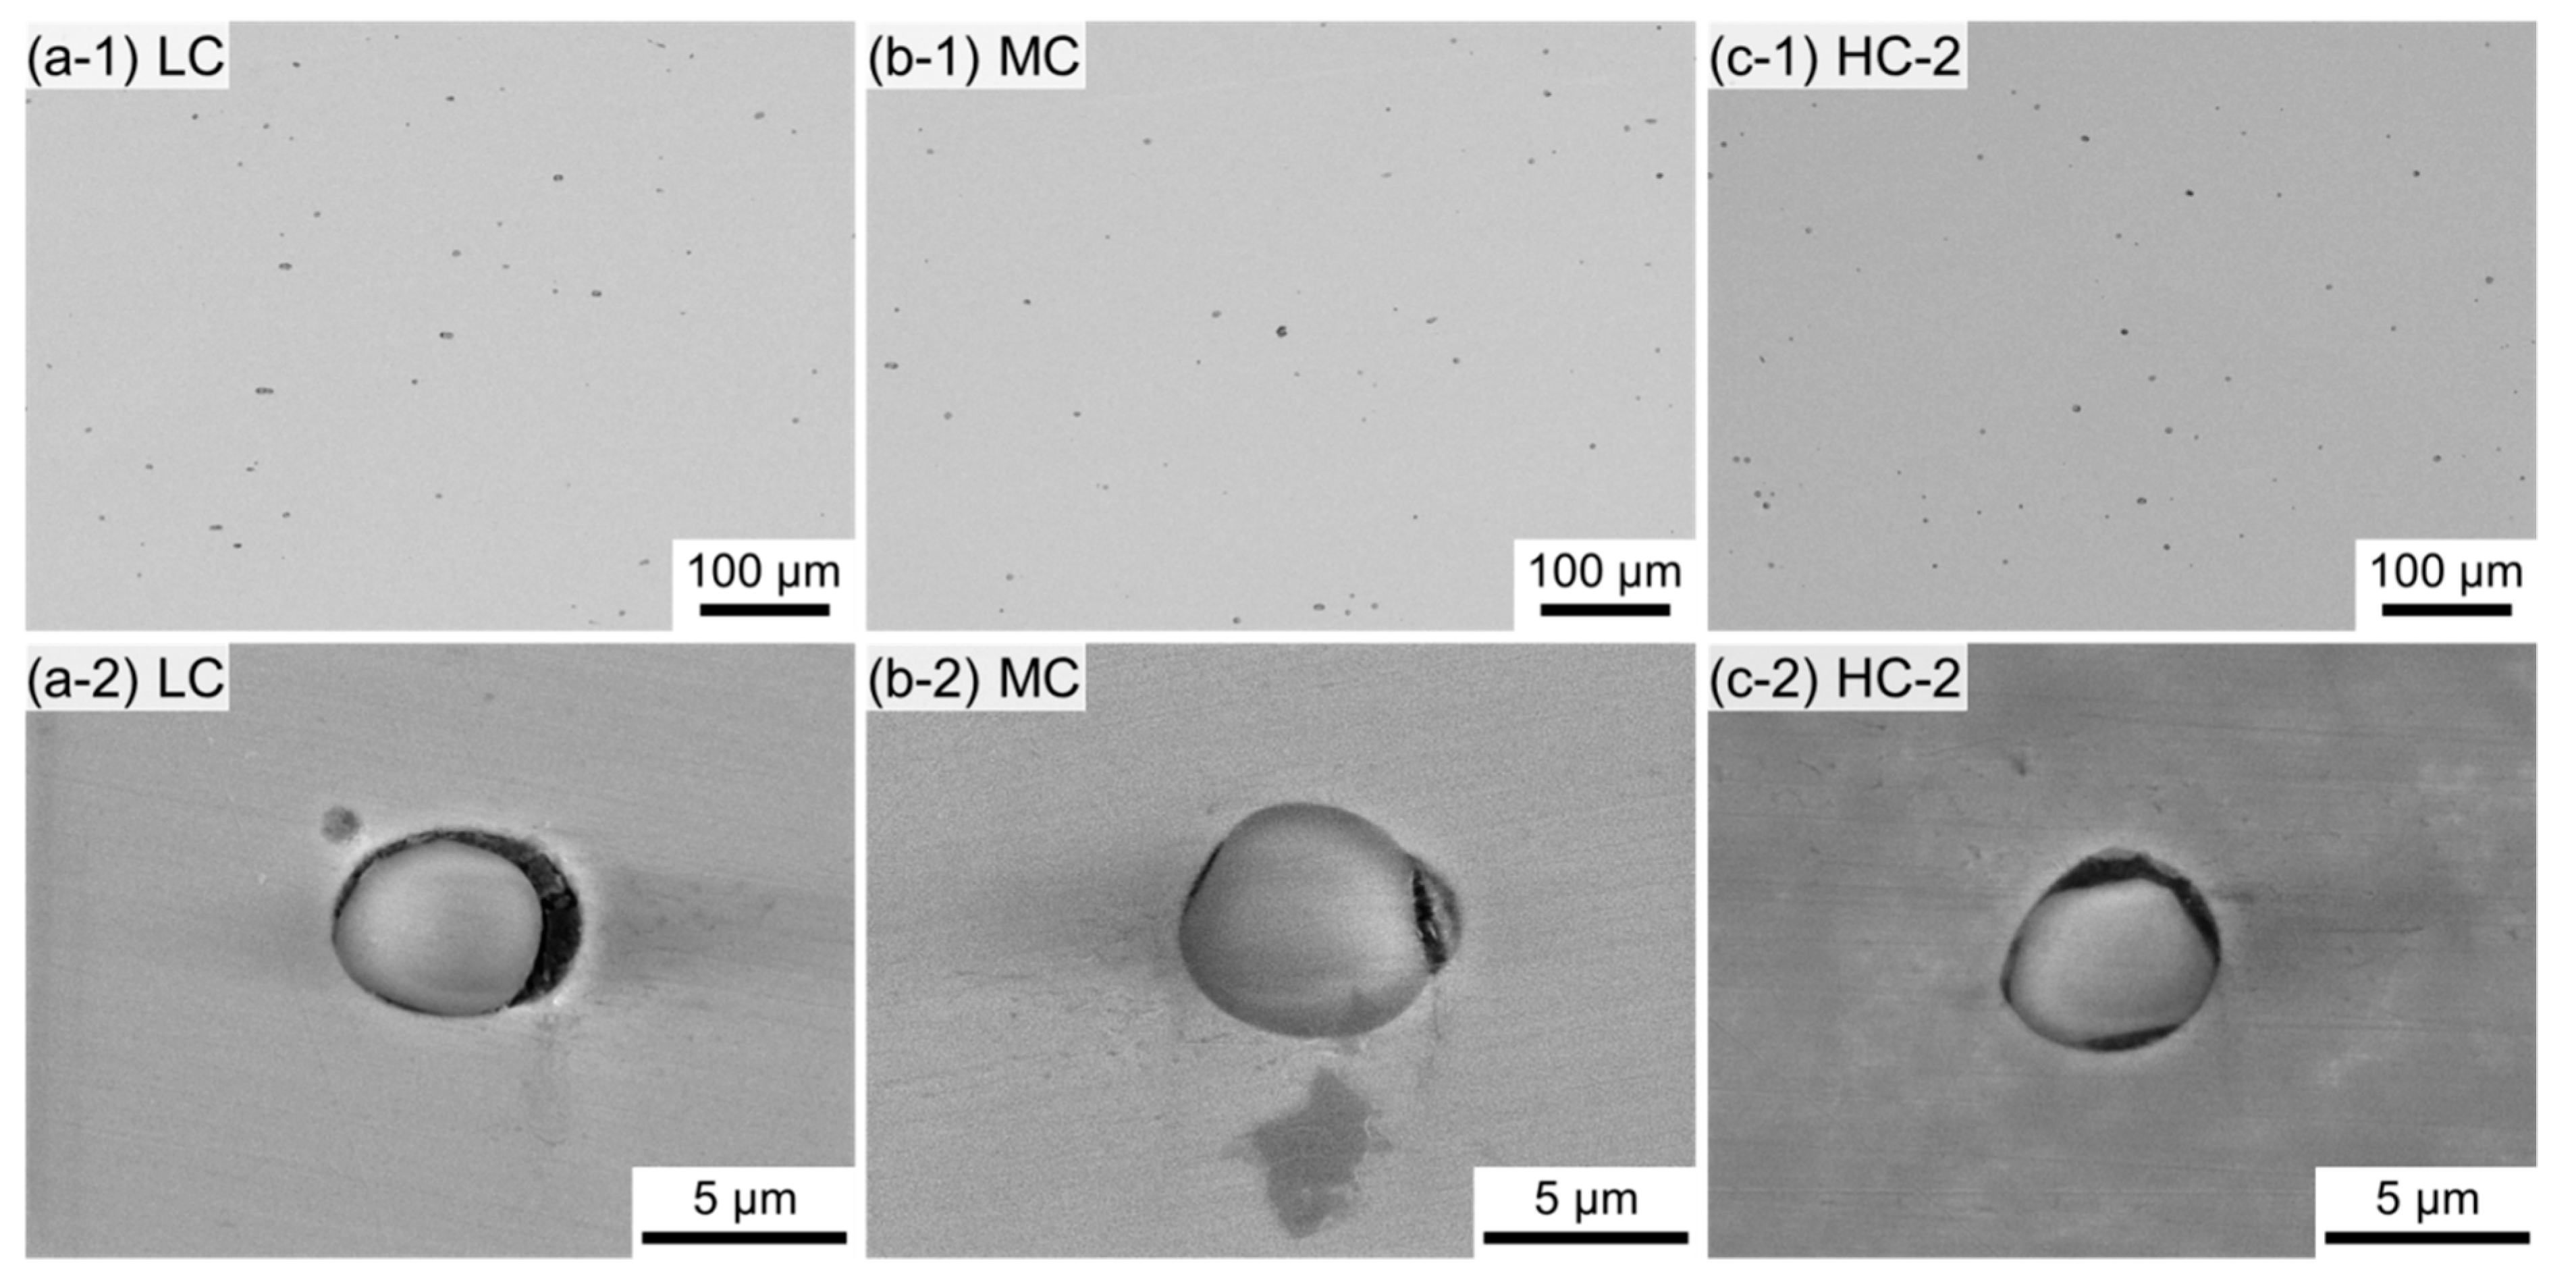
  • the LC, MC, and HC samples had a γ single phase with similar (Cr,Mn)2O3 volume fractions;
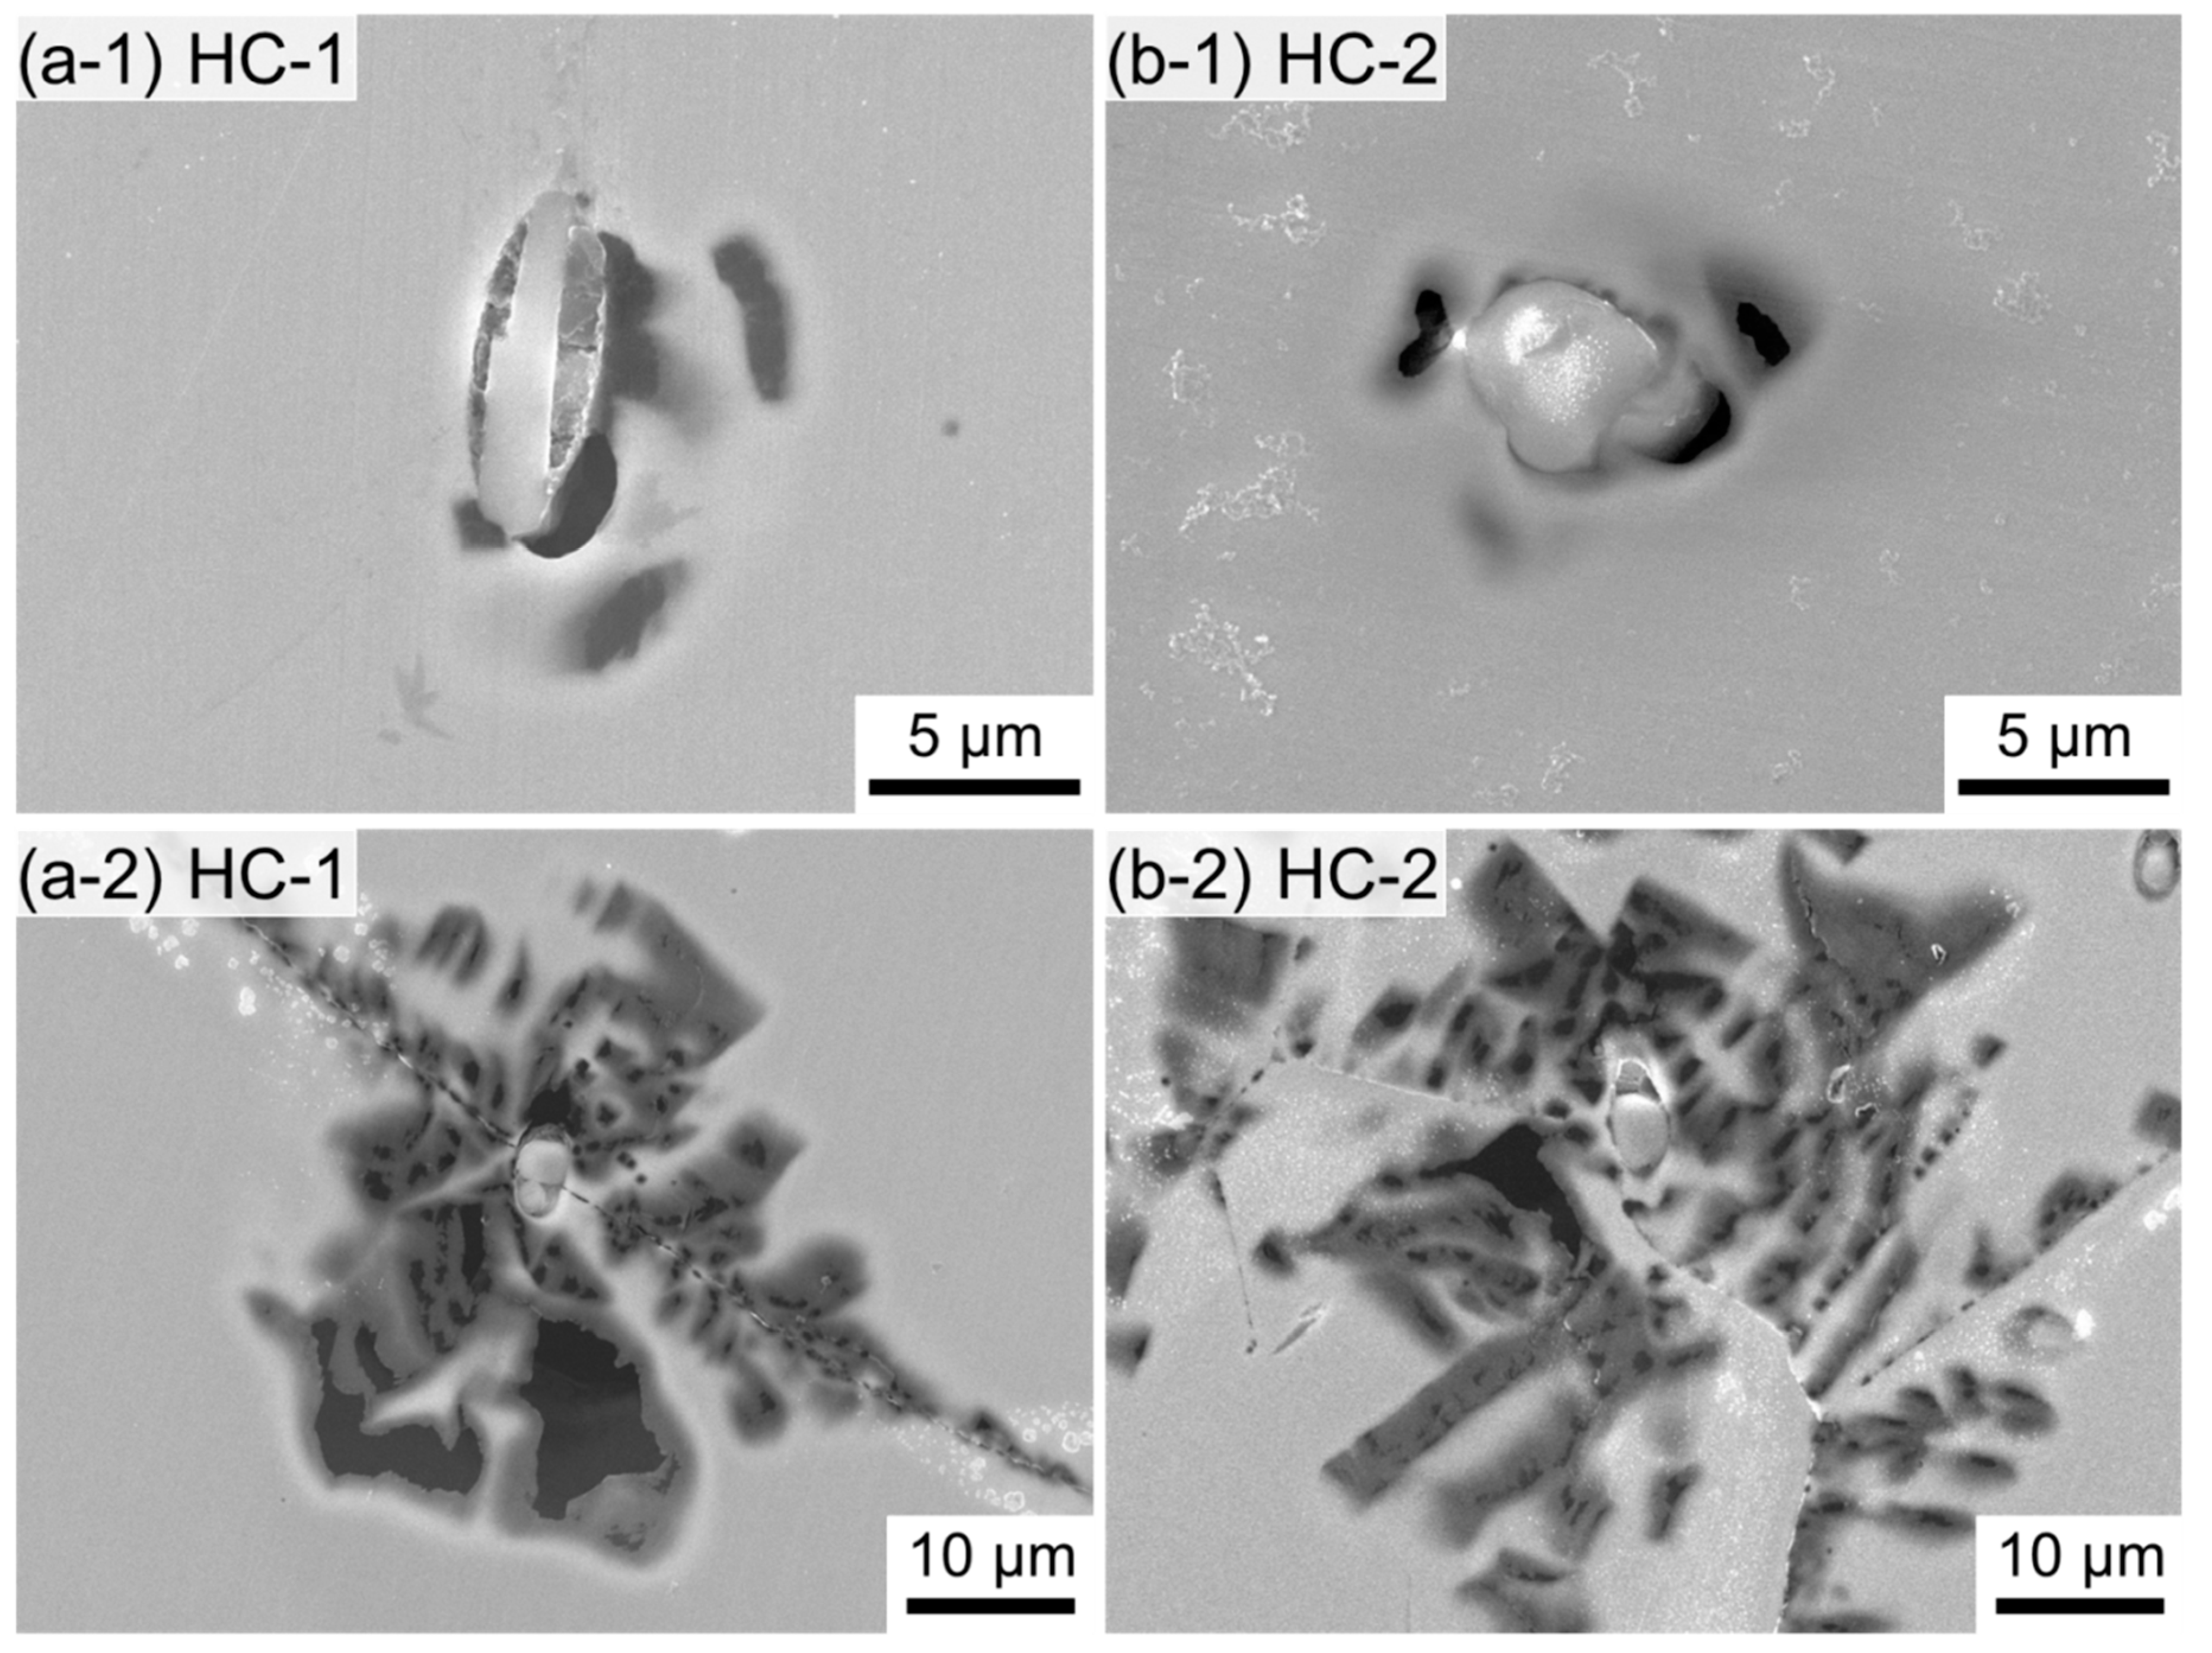
  • the LC and MC samples had similar grain sizes, but the HC sample had larger grains than the other samples;
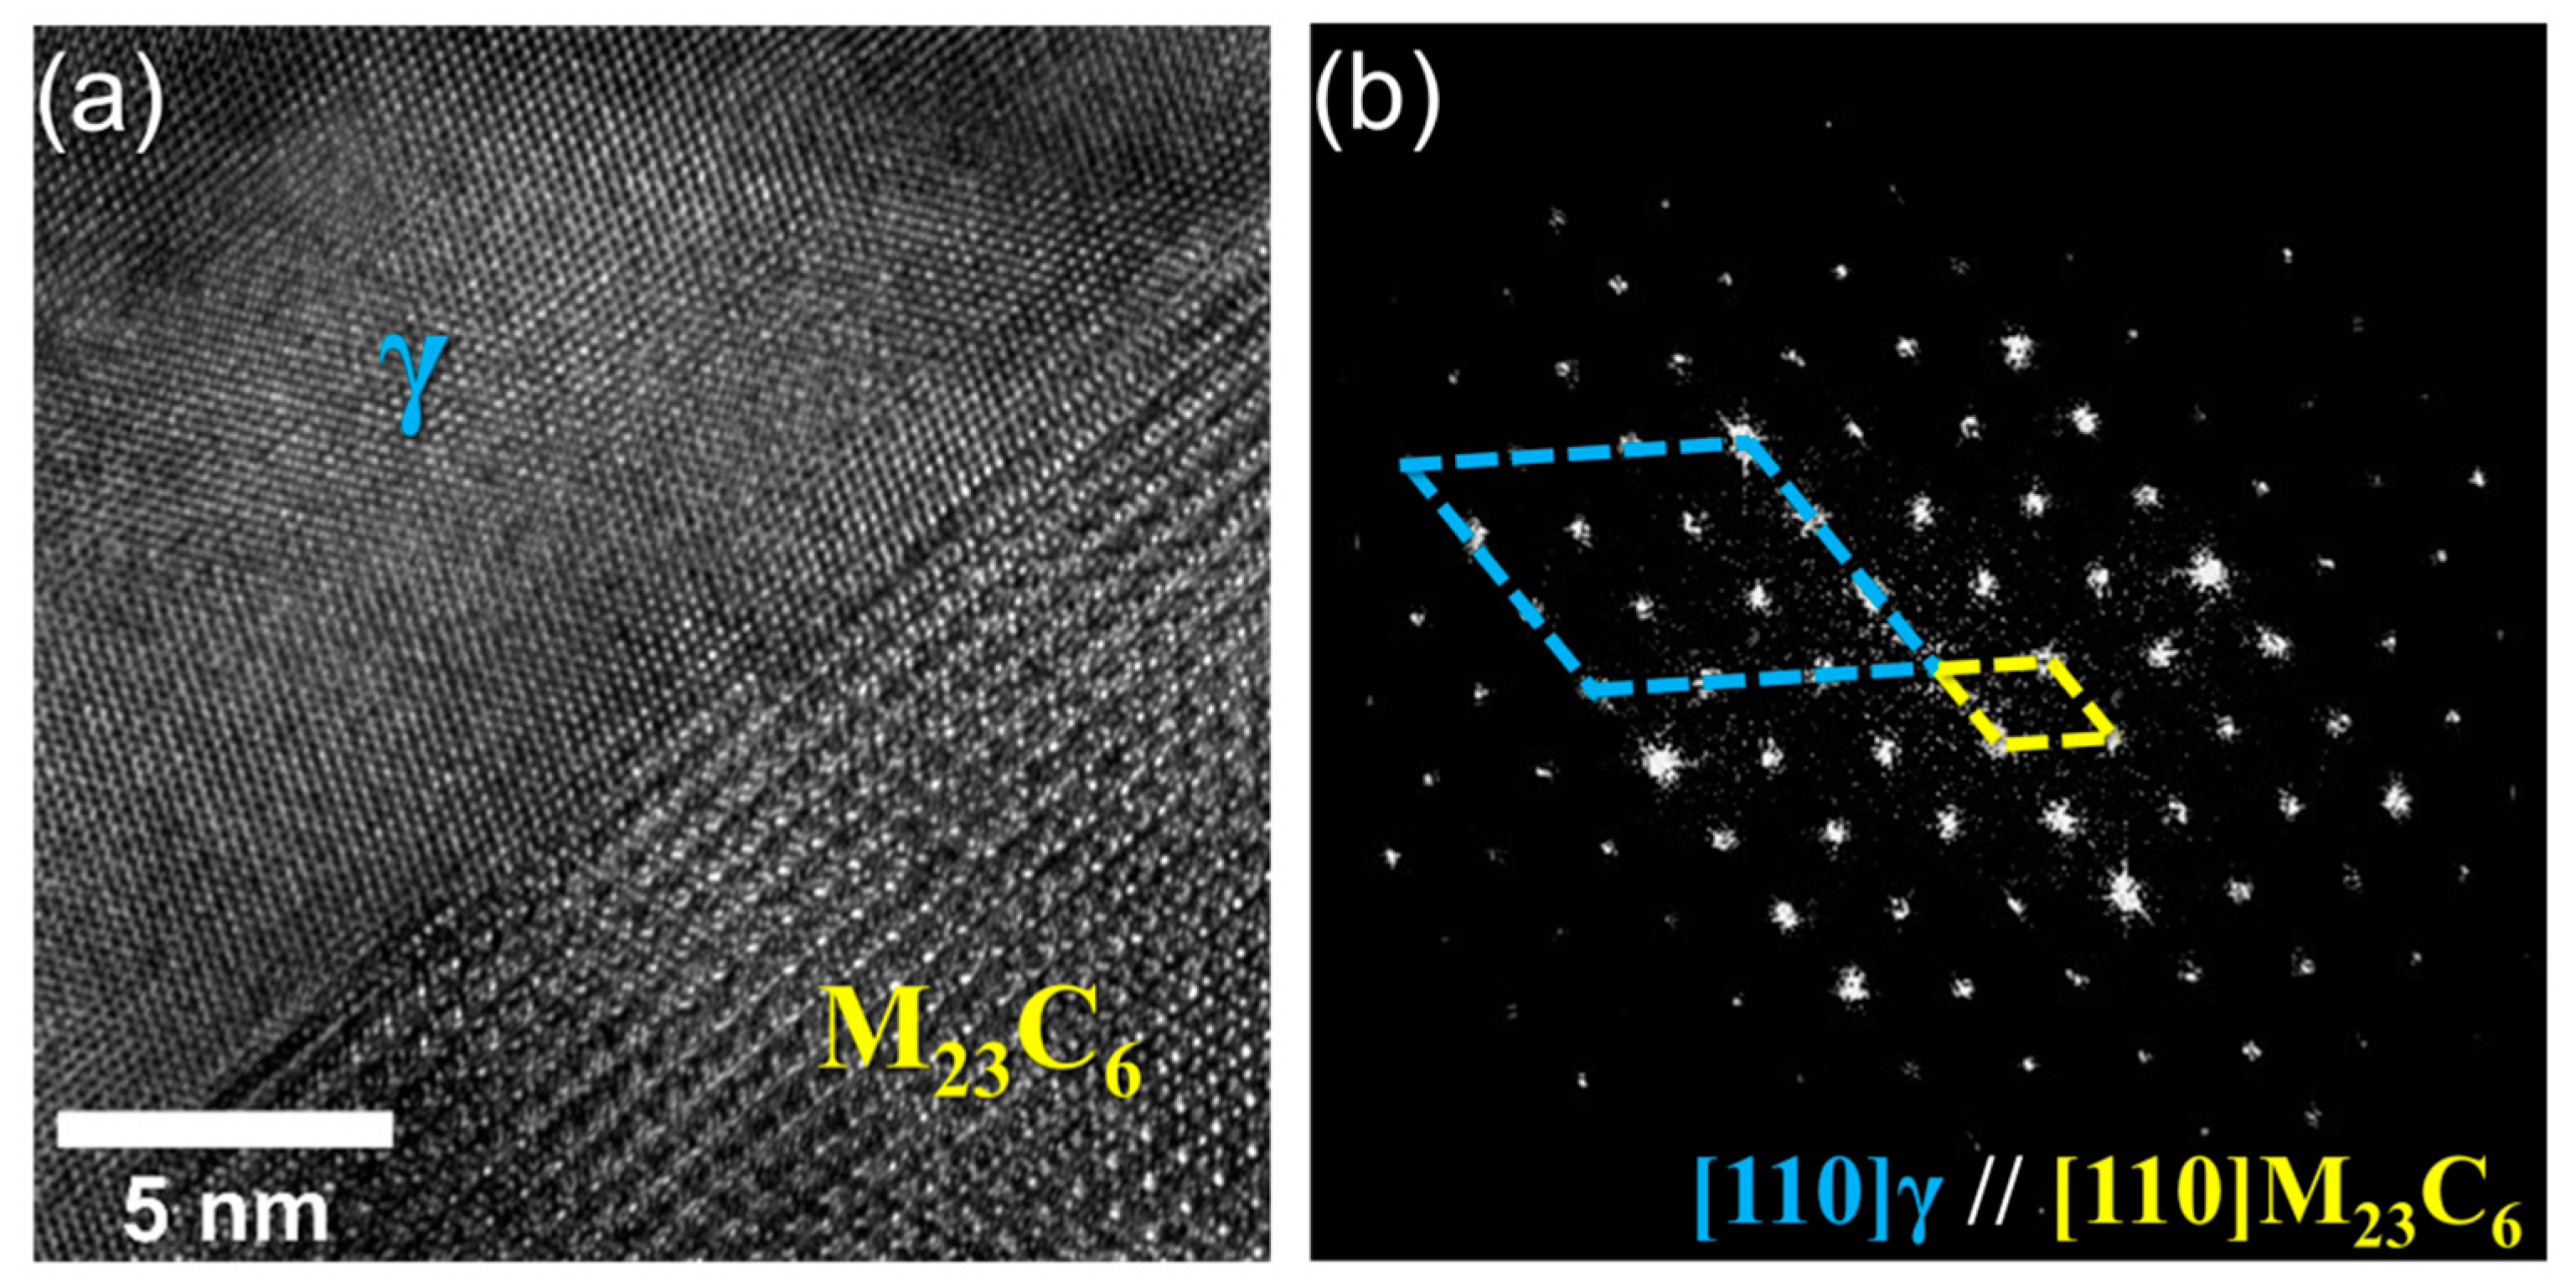
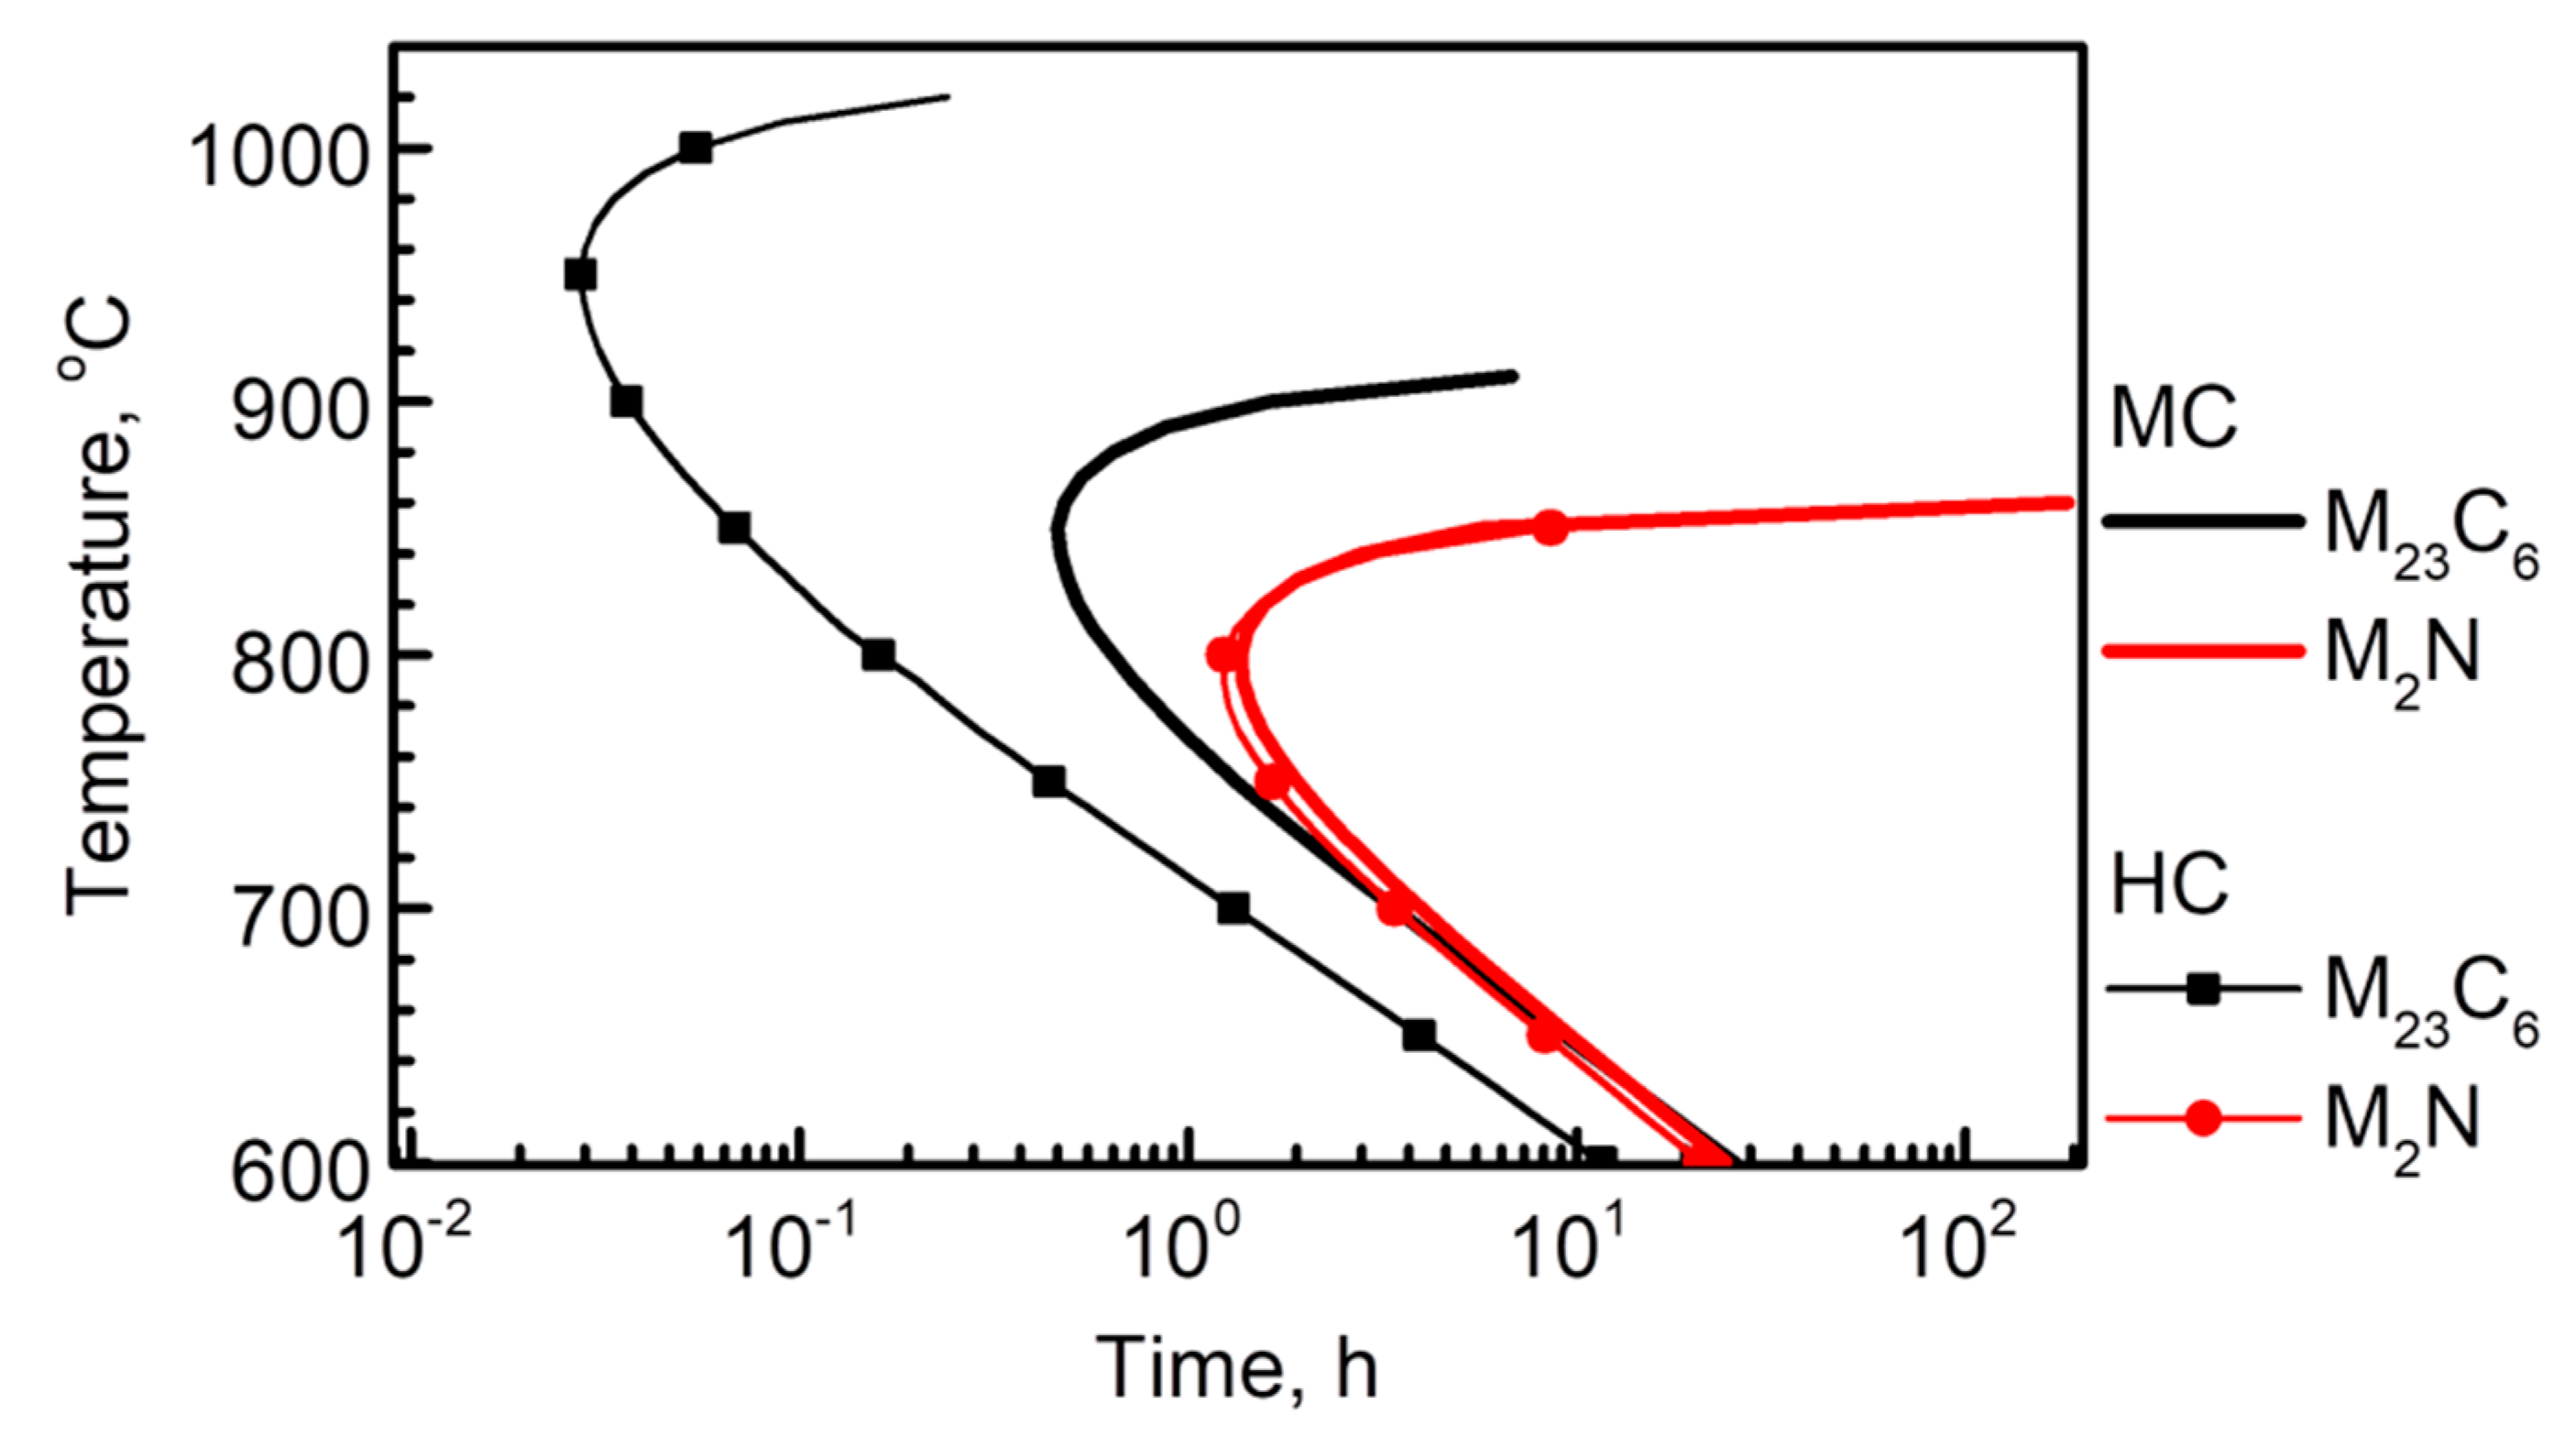
  • after the solution treatment, precipitate did not form in the LC and MC samples, but was observed at the grain boundary of the HC samples.

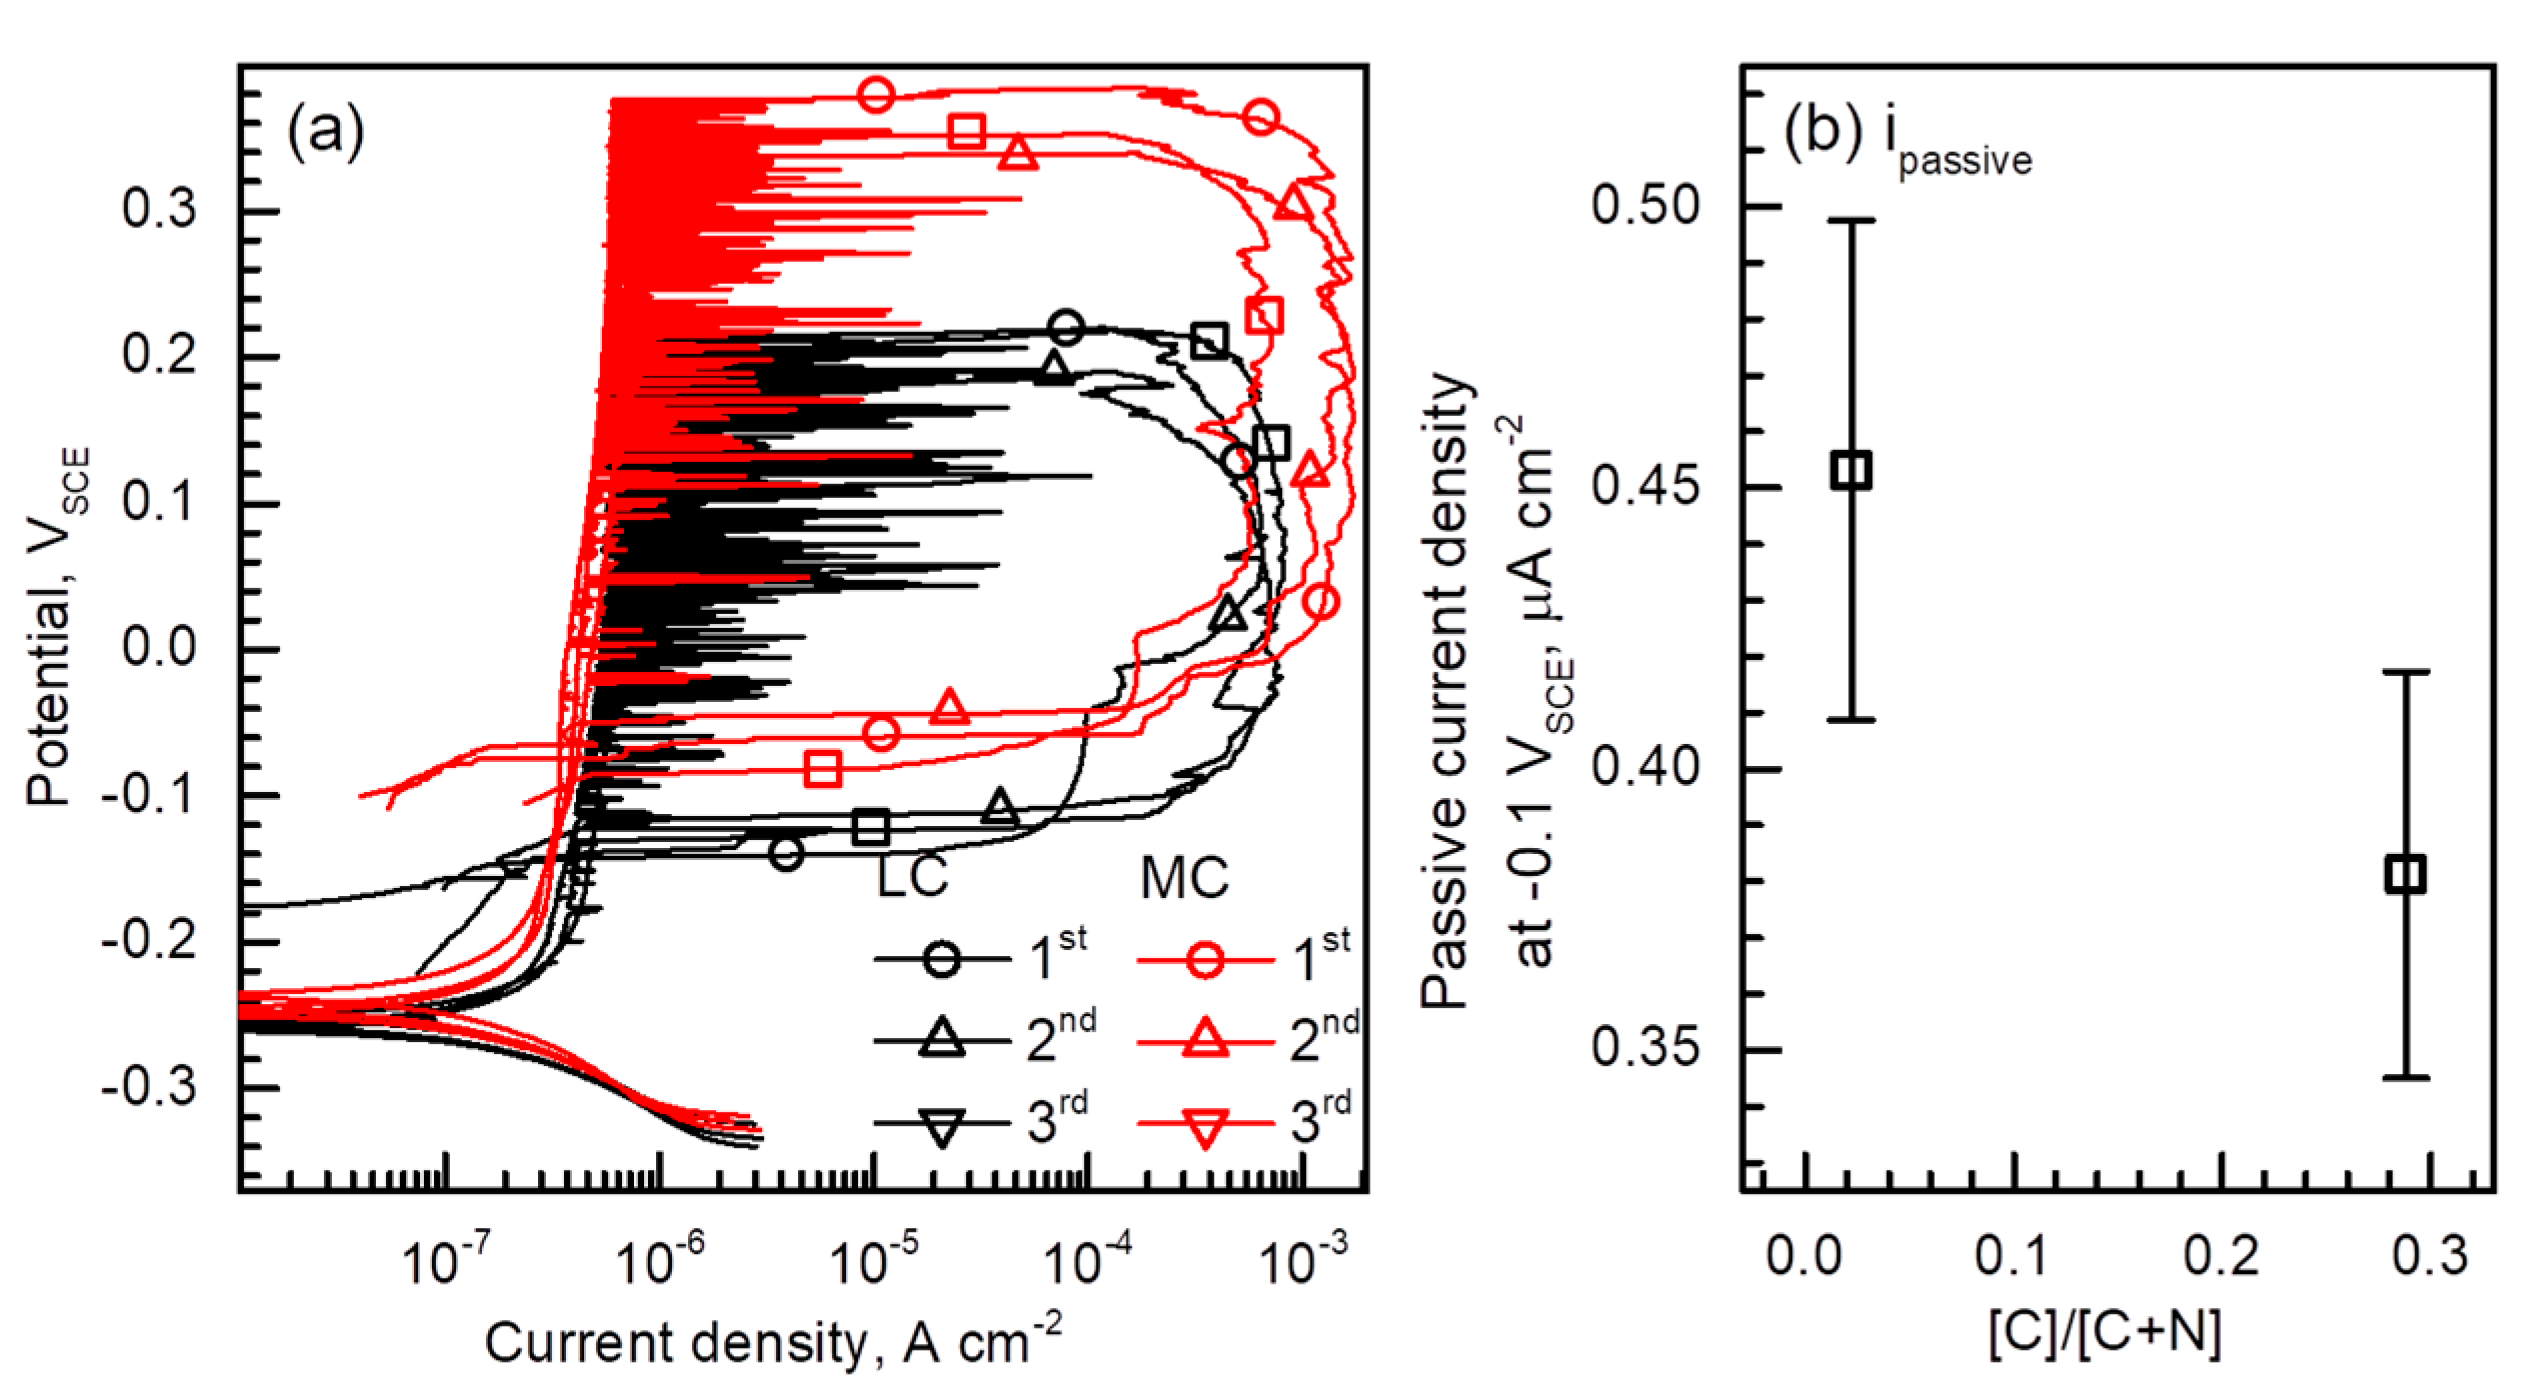
3.2. Pitting Corrosion Resistance

The resistance to pitting corrosion of the samples was evaluated through cyclic potentiodynamic polarization tests in a 3.5 wt% NaCl solution. For each sample, polarization tests were repeatedly conducted, and three of them were displayed in Figure 8, as a representative. As shown in Figure 8, the polarization behavior of the samples was highly reproducible. The polarization behavior of the four samples was quite similar. That is, the samples exhibited similar Ecorr of approximately −0.25 VSCE, and they were in passive state at Ecorr. In addition, current spikes were observed in the polarization curves of the three alloys, indicating the occurrence of metastable pitting corrosion, and at a potential higher than the metastable pitting corrosion potential region, stable pitting corrosion occurred in all samples.
The difference was found in Epit and Erp. Average Epit and Erp of the LC, MC and HC-2 samples were plotted in Figure 8e as a function of C/(C + N). The MC sample exhibited the highest Epit (0.353 VSCE on average) among the samples, and the average Epit of the LC sample was 0.194 VSCE. At this point, it is necessary to compare the level of resistance to pitting corrosion between the MC sample and the AISI 304. The polarization behavior of AISI 304 was also examined under the same condition, and as a result, the Epit of AISI 304 was found to be 0.282 VSCE on average. This result indicates that the MC sample has better resistance to pitting corrosion compared to the AISI 304. Therefore, it is worth noting that by controlling the N and C contents, the resistance to pitting corrosion of lean γ-SS (Fe-18Cr-9Mn-5.5Ni γ-SS) can be improved superior to the level of corrosion resistance of AISI 304.
Figure 9a,b show pit morphologies of the LC and MC samples, respectively. Figure 9(a-1,b-1) show the initial stage of pitting corrosion and Figure 9(a-2,b-2) show grown pits after the potentiodynamic polarization. In both samples, most of the pits began to occur in the matrix adjacent to the (Cr,Mn)2O3 NMIs (Figure 9(a-1,b-1)). At the beginning stage of the pitting corrosion, the morphology of the pit embryos in the two samples was almost similar. These pit embryos grew into large occluded pits with lacy metal covers, which are commonly found in SSs [32,33,34,35,36].
From Figure 8, the resistance to pitting corrosion of the HC-1 and HC-2 samples can also be compared. The HC-2 sample exhibited higher Epit (0.222 VSCE on average) than the HC-1 sample (0.160 VSCE on average), presumably because more precipitates were dissolved during the further solution treatment performed at higher temperature and for longer period of time, as shown in Figure 4.
The pit morphology of the HC-1 and HC-2 samples (Figure 10a,b, respectively) confirmed the presence of precipitates at grain boundaries. In the HC-1 and HC-2 samples, pitting corrosion was primarily initiated at the NMIs (Figure 10(a-1,b-1)), as in the cases of the LC and MC samples (Figure 9(a-1,b-1)). However, a noticeable difference is observed, in terms of pit propagating aspect, between the HC samples (Figure 10) and the other samples (Figure 9). The pits in the LC and MC samples grow in the form of concentric circles, whereas in the HC samples, pits preferentially propagate along the precipitates, which were formed at the grain boundary. As can be seen from the TEM analysis results (Figure 4), the precipitates of the HC-2 sample was much smaller than those of the HC-1 sample, but Figure 10 indicates that even very small precipitates of tens of nm in size can act as a preferential site for corrosion.
It is judged that the HC sample did not reach its intrinsic Epit due to the precipitates, and it is expected that a higher Epit will be obtained if the precipitate is completely dissolved. However, in industrial fields, it is practically difficult to cool large-scale ingots at a much faster rate than water quenching. In case of Fe-18Cr-9Mn-5.5Ni-0.3(C + N) γ-SSs, increasing the C/(C + N) value close to 0.6 inevitably causes the M23C6 precipitation problem, therefore, in the alloy system of interest, maintaining the C/(C + N) ratio of approximately 0.3 seems to be the best option practically.
Additional important information obtained from Figure 8 is Erp and passive current density (ipassive). The potential at which the polarization loop closes in the reverse scan was determined to be Erp, and the average Erp values of the LC, MC, and HC-2 alloy was plotted in Figure 8e, as a function of C/(C + N). Average Erp linearly increased from −0.135 VSCE to 0.024 VSCE as the C/(C + N) increased from 0.022 (LC sample) to 0.595 (HC sample). The increase in Erp with the C/(C + N) value means that the γ-SS with higher C/(C + N) can resist pit initiation until reaching a higher oxidation potential. This observation is supported by the fact that the potential at which the metastable pit initiates shifts to the higher potential as the C/(C + N) increased in the SSs (Figure 8a–d).
The ipassive value is also affected by C/(C + N). For an intuitive comparison of ipassive, Figure 8a,b are integrated into Figure 11. The HC samples were excluded from ipassive comparisons, because ipassive can be affected by precipitation. Figure 11a shows a small but clear difference in ipassive between the LC and MC samples. The average ipassive values of the LC and MC samples, which were measured at –0.1 VSCE, were presented in Figure 11b. The ipassive value of the LC sample was 0.453 μA cm−2, and that of the MC sample was 0.381 μA cm−2. Thus, it is obvious that the ipassive decreased as the C/(C + N) increased.
The polarization curves (Figure 8) showed that the increase in C/(C + N) of Fe-18Cr-9Mn-5.5Ni-0.3(C + N) γ-SS resulted in an elevation of Epit, as long as C and N were in solid solution state. In addition, among the LC, MC, and HC samples, the highest Epit was obtained in the MC sample. The high Epit of the MC sample is considered to be due to at least two factors. First, the protective ability of the passive film is enhanced by the increase in C/(C + N), which was confirmed by the decrease in ipassive (Figure 11). Second, an increase in the C/(C + N) value facilitates repassivation of the matrix, as shown in Figure 8e. Therefore in the following section, the reasons for the improved Epit by increase in C/(C + N) are discussed, considering the two aspects mentioned above.

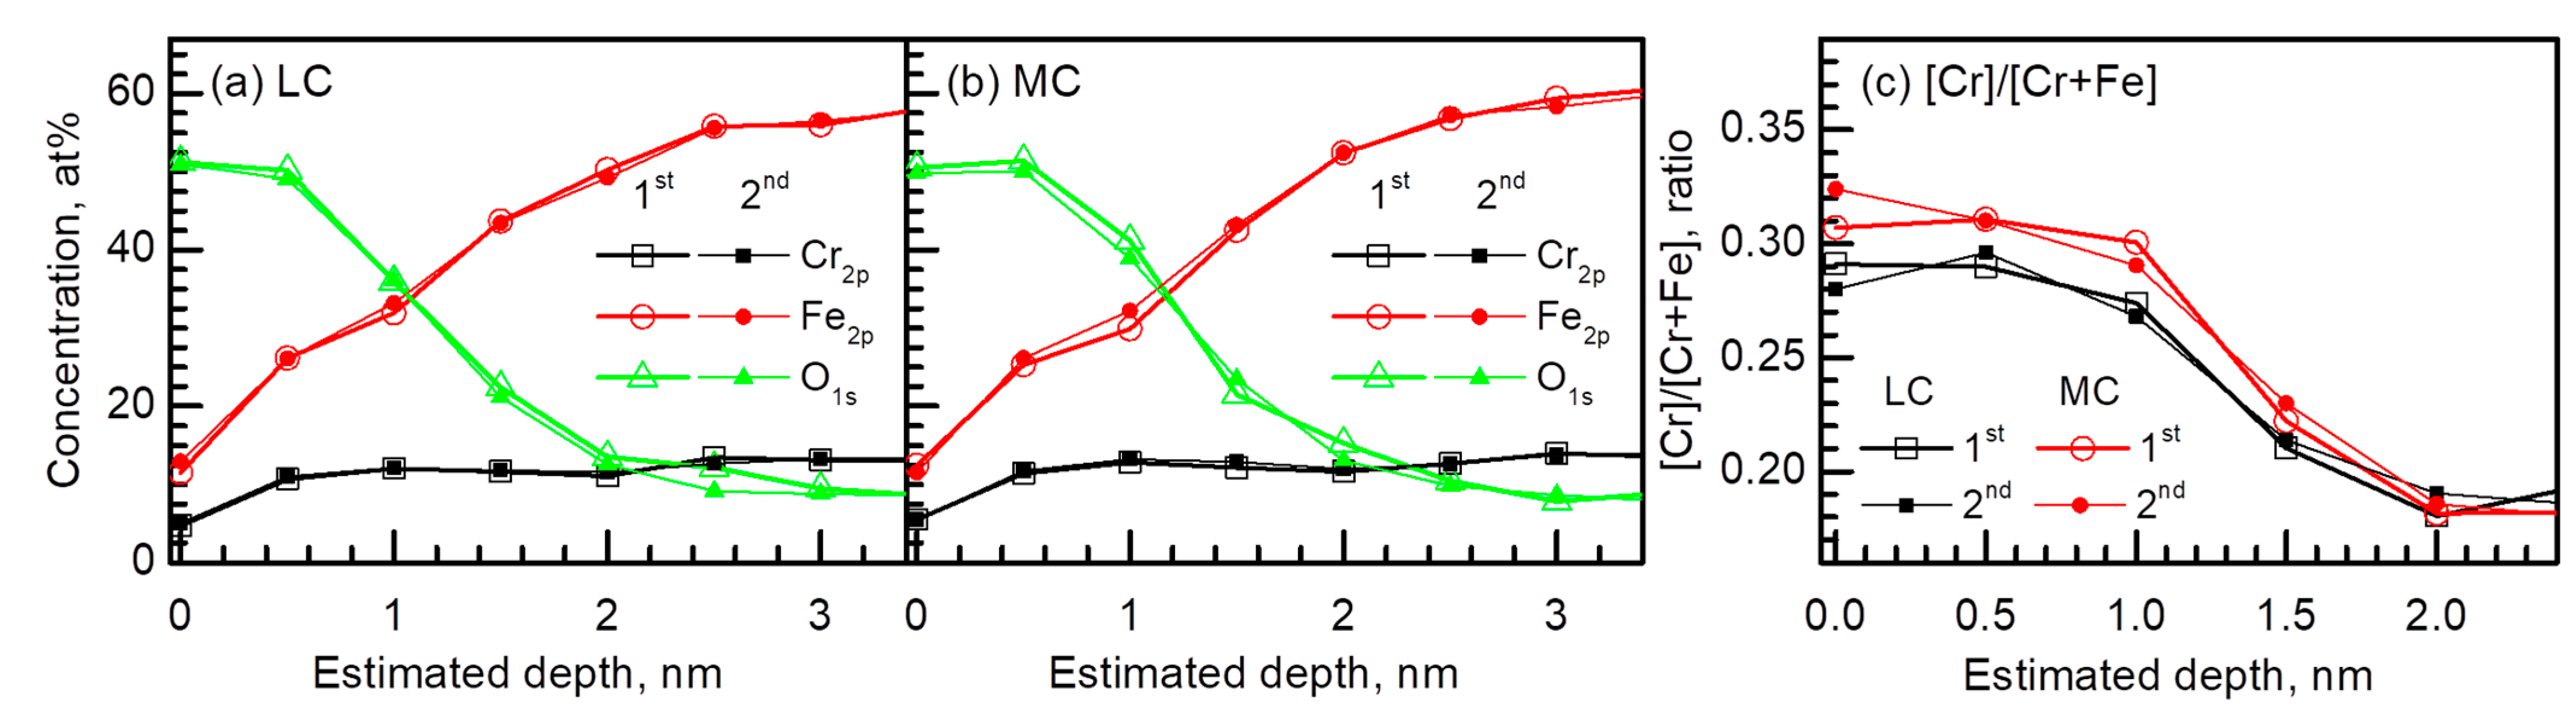
3.3. Passive Film Properties

Figure 12 shows the composition profiles of the passive films of the LC and MC samples, which were repeatedly measured by the XPS sputtering method. The passive films of both samples were similar in chemical composition, and consisted mainly of Fe, Cr, and O. The thickness of the passive film can be estimated from the concentration depth profile of O1s, by taking the depth from the surface at which 50% value of the O1s amplitude appears [37,38,39]. The passive film thicknesses of the LC and MC samples were almost similar, 1.36 and 1.45 nm, respectively.
Notable difference was found in the chemical compositions, particularly in the Cr fraction (Cr/(Cr + Fe)), between the LC and MC alloys (Figure 12). At the passive film surface, the Cr/(Cr + Fe) was 0.28–0.29 for the LC sample and 0.31–0.32 for the MC sample. Also inside the film, the Cr/(Cr + Fe) was higher in the MC sample than in the LC sample. Thus, from Figure 12, it is shown that the increase in C/(C + N) in the γ-SS matrix changed the passive layer to have more Cr, which supports the assertion that the passive film formed on the MC sample is more protective to pitting corrosion than the LC sample. Therefore, the reason why the metastable pit initiation potential increased and the ipassive decreased in the MC sample, compared to the LC sample, could be found in the improvement in the protective properties of the passive film.

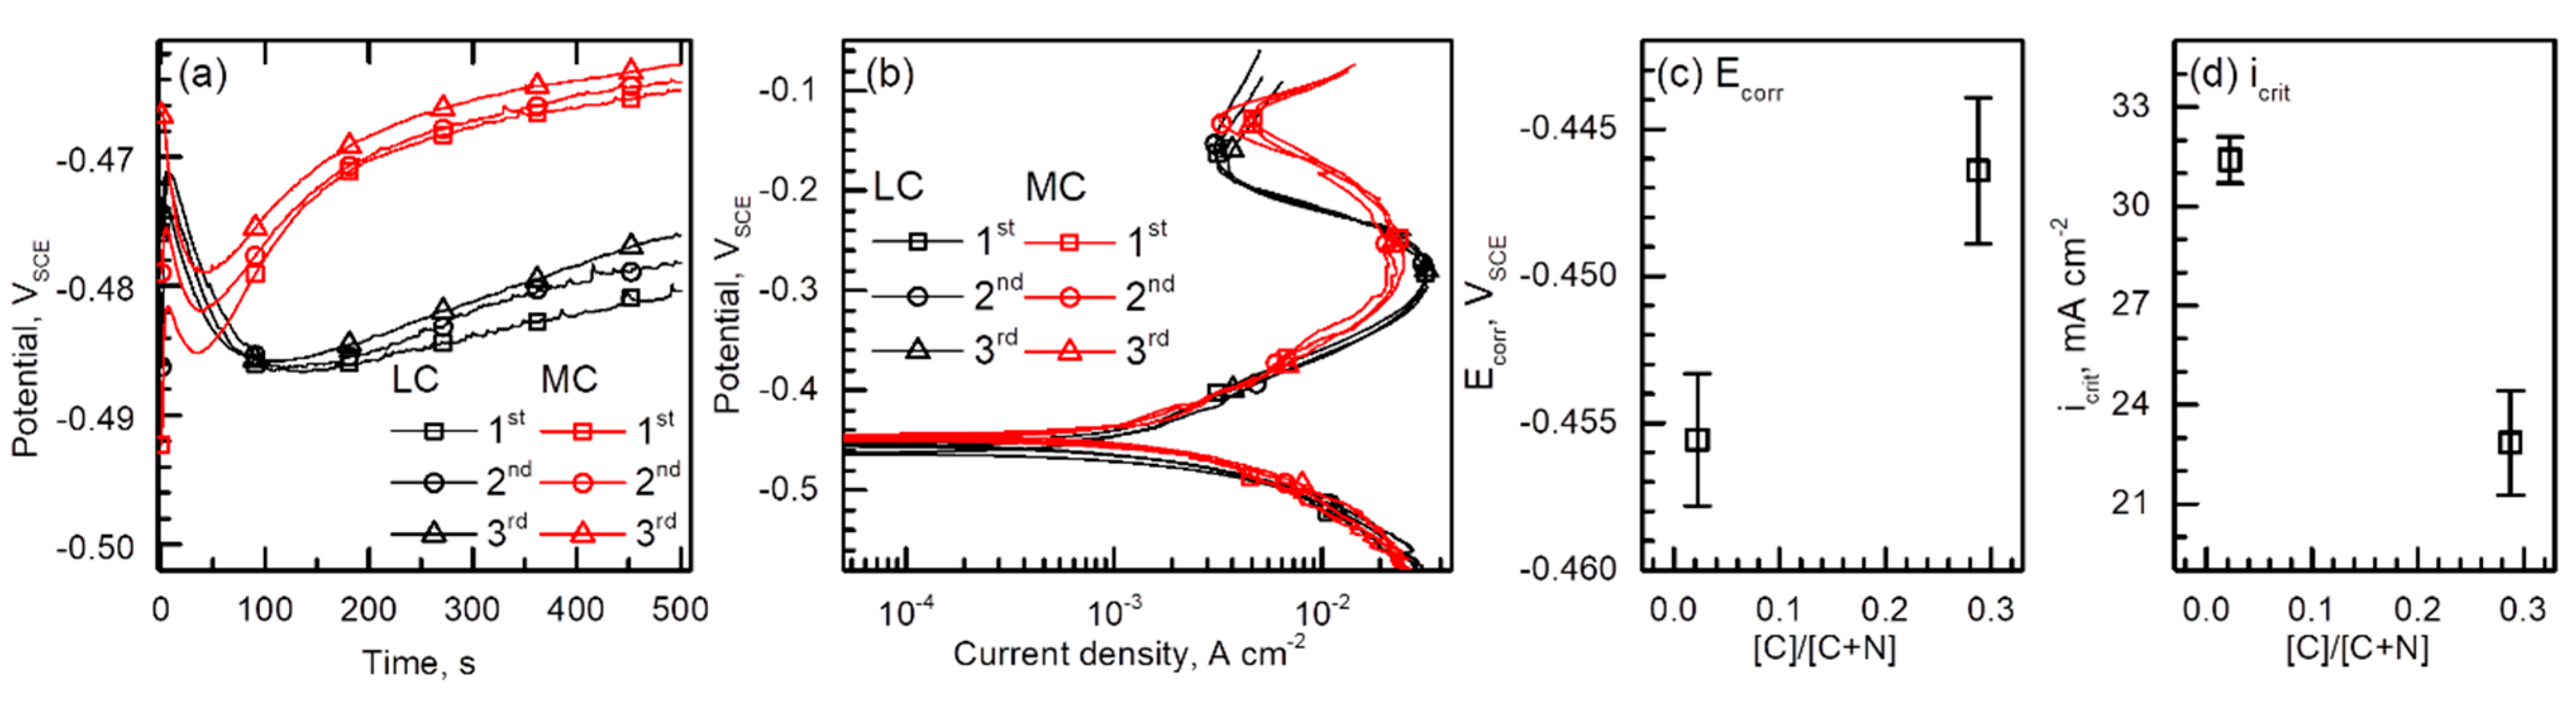
3.4. Dissolution Rate of Matrix

The dissolution rate of the SS matrix is related to the pit growth rate [11,40,41,42], the mechanism of which is as follows. When pitting corrosion occurs in a SS exposed to Cl solution, pits in a SS usually grow into a closed shape with a lace-like cover, as shown in Figure 9. The solution containing Cl confined inside the occluded pit becomes acidified by the hydrolysis reaction of the metal ions [40] and, inside the pit, the metal surface without a passive film is directly exposed to the acidified Cl solution. In this situation, uniform corrosion occurs on the matrix surface inside the pit cavity. Therefore, evaluating the uniform corrosion behavior of the matrix can help to understand the resistance to pit propagation, and the low dissolution rate of the matrix in the acidified Cl solution can be interpreted as the low pit growth rate. In this study, a strong acid such as 1 M HCl solution was used to evaluate the uniform corrosion behavior of the LC and MC alloys.
Figure 13a shows Ecorr versus time curves repeatedly recorded in the 1 M HCl solution for 500 s before the polarization tests. After 500 s immersion, the average Ecorr of the LC sample was −0.478 VSCE and that of the MC sample was −0.464 VSCE. As can be seen in Figure 13a, Ecorr was clearly affected by C/(C + N) in the γ-SSs and shifted to higher values with increasing C/(C + N).
After the Ecorr measurements, polarization curves were obtained in the same solution. As shown in Figure 13b, the polarization curves of both samples were highly reproducible. In this strong acid, a typical active-passive transition reaction was observed during anodic polarization. From the polarization curves, average Ecorr and average critical anodic current density (icrit) values were measured, and plotted as a function of the C/(C + N) in Figure 13c,d, respectively. Similar to the results in Figure 13a, the polarization curves confirmed again that the MC sample exhibited higher Ecorr than the LC sample. In addition, the MC sample exhibited lower icrit value compared to the LC sample. The average icrit values for the LC and MC samples were 31.40 and 22.85 mA cm−2, respectively. Thus, Figure 13 indicates that the partly substitution of C for N improved the resistance to uniform corrosion of Fe-18Cr-9Mn-5.5Ni-0.3(C + N) γ-SSs. For this reason, it can be concluded that pit propagation rate decreased and pit annihilation (repassivation) was accelerated as the C/(C + N) increased in the lean γ-SS.

4. Conclusions

In this paper, the resistance to pitting corrosion of three kinds of Fe-18Cr-9Mn-5.5Ni-0.3(C + N) γ-SSs (in wt%) with different C/(C + N) ratios (0.02, 0.29, and 0.60) was evaluated. As a result, the optimal C/(C + N) ratio for maximizing the resistance to pitting corrosion of the γ-SSs was found, and also, the reason why the resistance to pitting corrosion of the γ-SS was improved by increasing the C/(C + N) ratio was elucidated. The findings of this study are summarized below.
  • All of the three alloys had γ matrix and possessed similar NMI volume fractions. In the alloy with C/(C + N) of 0.60, it was difficult to obtain a precipitate-free matrix, because the Cr23C6 precipitation rate was too fast compared to the other alloys. Therefore, it was recommended to maintain the C/(C + N) ratio below 0.6 in Fe-18Cr-9Mn-5.5Ni-0.3(C + N) γ-SSs.
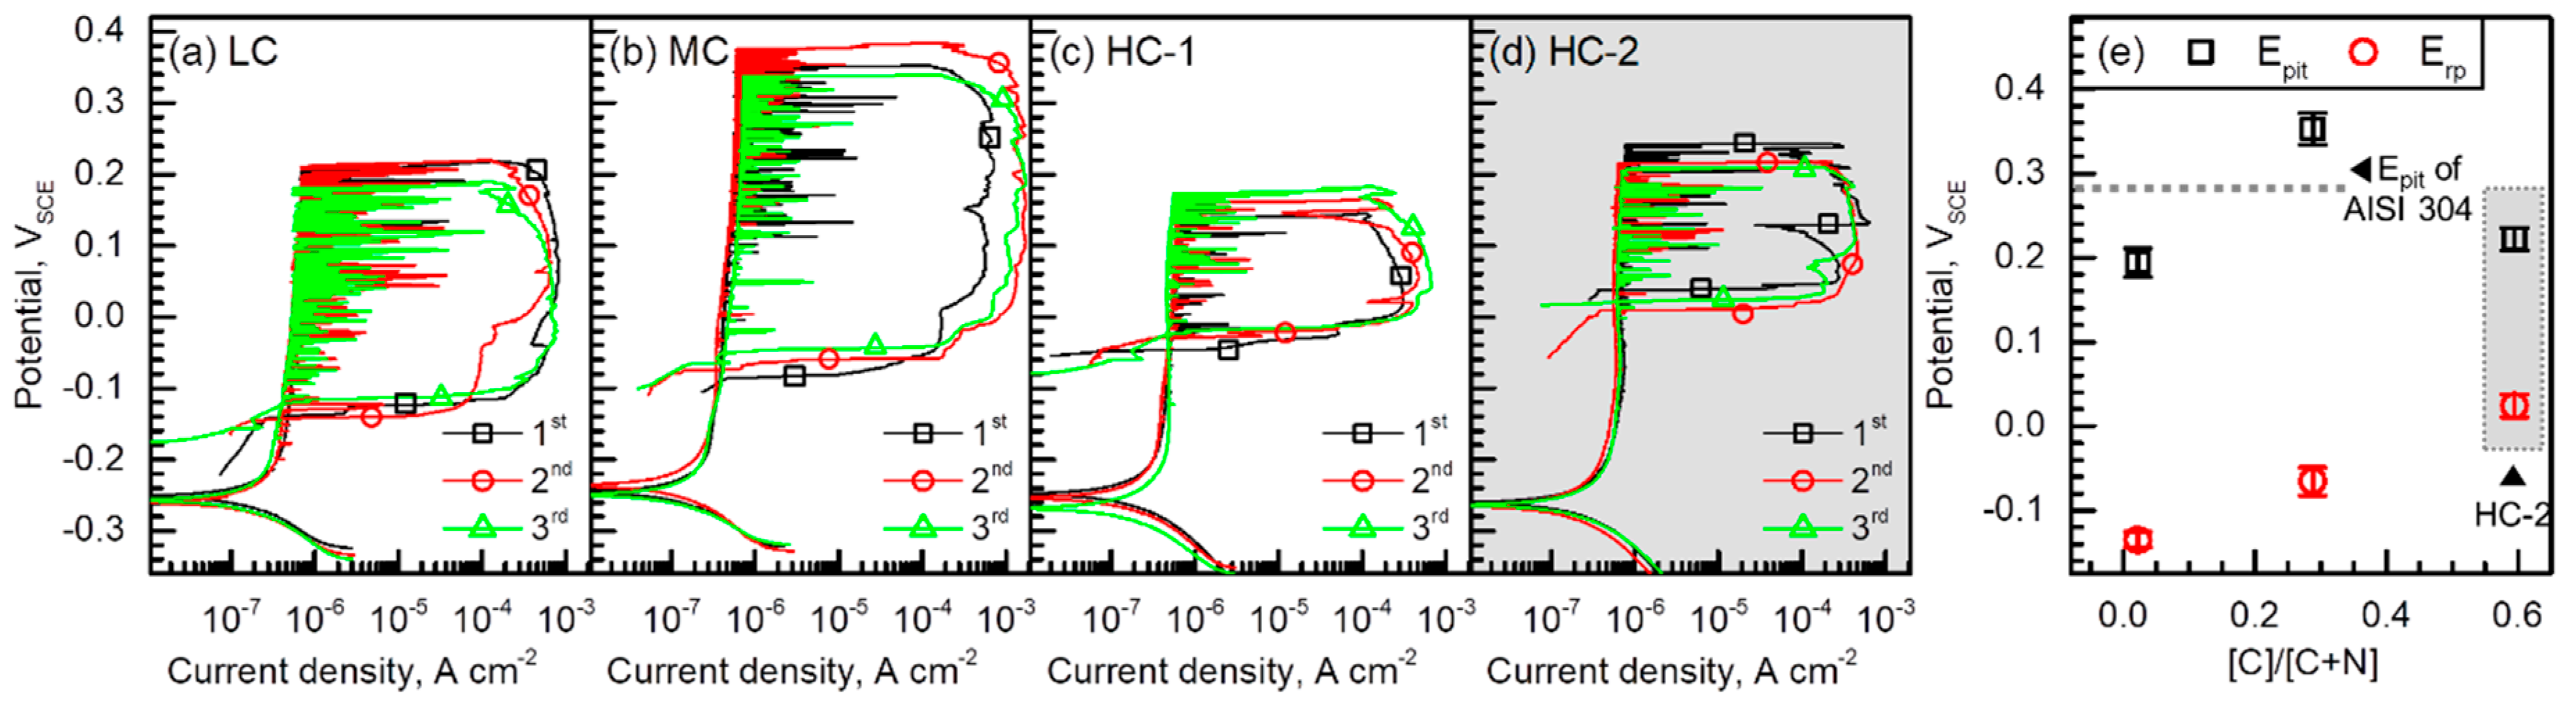
  • The resistance to pitting corrosion of the alloys was evaluated through potentiodynamic polarization tests in a 3.5 wt% NaCl solution. The γ-SS with a C/(C + N) ratio of 0.29 exhibited the highest resistance to pitting corrosion, and the resistance level of this alloy was superior to that of the AISI 304 γ-SS.
  • XPS analysis of the passive films of the γ-SS with C/(C + N) ratios of 0.022 and 0.288 showed that increasing C/(C + N) in the γ-SSs changed the passive layer to have more Cr fraction. Moreover, it was also found that increasing the C/(C + N) ratio improved the resistance to uniform corrosion of the γ-SS. That is, a higher C/(C + N) ratio in the γ-SS increased the protective ability of the passive film and decreased the growth rate of pits. Therefore, as long as C and N existed in a solid solution state, it could be concluded that partial substitution of C for N was advantageous for improving the pitting corrosion resistance of Fe-18Cr-9Mn-5.5Ni-0.3(C + N) γ-SSs.

Author Contributions

Conceptualization, H.-Y.H., T.-H.L., J.-H.S. and N.K.; Data curation, D.B., H.-Y.H., S.-D.K., H.-H.J., J.L. and J.H.J.; Formal analysis, T.-H.L.; Funding acquisition, T.-H.L.; Investigation, D.B., H.-Y.H., H.-H.J., J.L. and J.-H.S.; Methodology, H.-Y.H., S.-D.K. and J.-H.S.; Software, J.H.J.; Visualization, J.H.J., T.-H.L., J.-H.S. and N.K.; Writing—original draft, D.B., H.-Y.H. and S.-D.K.; Writing—review and editing, T.-H.L. and N.K. All authors have read and agreed to the published version of the manuscript.

Funding

This study was financially supported by Fundamental Research Program (grant number PNK7570) of the Korea Institute of Materials Science (KIMS). This study was also supported by the Basic Science Research Program of the National Research Foundation (NRF) funded by the Ministry of Science & ICT (NRF-2019R1C1C1010246).

Data Availability Statement

The raw/processed data required to reproduce these findings cannot be shared at this time as the data also forms part of an ongoing study.

Conflicts of Interest

The authors declare no conflict of interest.

References

  1. Lo, K.H.; Shek, C.H.; Lai, J.K.L. Recent developments in stainless steels. Mater. Sci. Eng. R 2009, 65, 39–104. [Google Scholar] [CrossRef]
  2. Jiang, L.-Z.; Zhang, W.; Wang, Z.-Y. Research and development of lean duplex stainless steels. J. Iron Steel Res. 2013, 25, 1–8. [Google Scholar] [CrossRef]
  3. Uggowitzer, P.J.; Magdowski, R.; Speidel, M.O. Nickel Free High Nitrogen Austenitic Steels. ISIJ Int. 1996, 36, 901–908. [Google Scholar] [CrossRef] [Green Version]
  4. Oshima, T.; Habara, Y.; Kuroda, K. Efforts to Save Nickel in Austenitic Stainless Steels. ISIJ Int. 2007, 47, 359–364. [Google Scholar] [CrossRef] [Green Version]
  5. Liljas, M.; Johansson, P.; Liu, H.-P.; Olsson, C.-O.A. Development of a Lean Duplex Stainless Steel. Steel Res. Int. 2008, 79, 466–473. [Google Scholar] [CrossRef]
  6. Simmons, J.W. Overview: High-nitrogen alloying of stainless steels. Mater. Sci. Eng. A 1996, 207, 159–169. [Google Scholar] [CrossRef]
  7. Ha, H.-Y.; Lee, T.-H.; Oh, C.-S.; Kim, S.-J. Effects of combined addition of carbon and nitrogen on pitting corrosion behavior of Fe–18Cr–10Mn alloys. Scripta Mater. 2009, 61, 121–124. [Google Scholar] [CrossRef]
  8. Lunarska, E.; Szklarska-Smialowska, Z.; Janik-Czachor, M. Susceptibility of Cr-Ni-Mn Stainless Steels to Pitting in Chloride Solutions. Corrosion 1975, 31, 231–234. [Google Scholar] [CrossRef]
  9. Pardo, A.; Merino, M.C.; Coy, A.E.; Viejo, F.; Arrabal, R.; Matykina, E. Pitting corrosion behaviour of austenitic stainless steels–Combining effects of Mn and Mo additions. Corros. Sci. 2008, 50, 1796–1806. [Google Scholar] [CrossRef]
  10. Pardo, A.; Merino, M.C.; Coy, A.E.; Viejo, F.; Arrabal, R.; Matykina, E. Effect of Mo and Mn additions on the corrosion behavior of AISI 304 and 316 stainless steels in H2SO4. Corros. Sci. 2008, 50, 780–794. [Google Scholar] [CrossRef]
  11. Ha, H.-Y.; Jang, M.-H.; Lee, T.-H. Influences of Mn in solid solution on the pitting corrosion behaviour of Fe-23 wt%Cr-based alloys. Electrochim. Acta 2016, 191, 864–875. [Google Scholar] [CrossRef]
  12. Shames El Din, A.M.; Badran, M.M.; Khalil, S.E. Corrosion Behaviour of Manganese-Containing Stainless Steels. II. Potentiodynamic Measurements in H2SO4 Solutions. Werkst. Korros. 1973, 24, 23–28. [Google Scholar] [CrossRef]
  13. Shames El Din, A.M.; Badran, M.M.; Khalil, S.E. Corrosion Behaviour of Manganese-Containing Stainless Steels. III. Their susceptibility towards pitting corrosion. Werkst. Korros. 1973, 24, 290–295. [Google Scholar] [CrossRef]
  14. Janik-Czachor, M.; Lunarska, E.; Szklarska-Smialowvka, Z. Effect of nitrogen content in a 18Cr-5Ni-10Mn stainless steel on the pitting susceptibility in chloride solutions. Corrosion 1975, 31, 394–398. [Google Scholar] [CrossRef]
  15. Simmons, J.W.; Covino, B.S., Jr.; Hawk, J.A.; Dunning, J.S. Effect of Nitride (Cr2N) Precipitation on the Mechanical, Corrosion, and Wear Properties of Austenitic Stainless Steel. ISIJ Int. 1996, 36, 846–854. [Google Scholar] [CrossRef] [Green Version]
  16. Simmons, J.W. Strain hardening and plastic flow properties of nitrogen-alloyed Fe-17Cr-(8–10) Mn-5Ni austenitic stainless steels. Acta Mater. 1997, 45, 2467–2475. [Google Scholar] [CrossRef]
  17. Du Toit, M.; Steyn, H.G. Comparing the Formability of AISI 304 and AISI 202 Stainless Steels. JMEPEG 2012, 21, 1491–1495. [Google Scholar] [CrossRef]
  18. Calderón-Hernández, J.W.; Hincapíe-Ladino, D.; Magnabosco, R.; Alonso-Falleiros, N. Effect of sulfate on the pitting potential of austenitic stainless steels 18Cr8Ni and 17Cr6Mn5Ni in chloride media. REM Int. Eng. J. 2019, 72, 97–103. [Google Scholar] [CrossRef] [Green Version]
  19. Ha, H.Y.; Jang, H.J.; Kwon, H.S.; Kim, S.J. Effects of nitrogen on the passivity of Fe–20Cr alloy. Electrochim. Acta 2009, 51, 48–53. [Google Scholar] [CrossRef]
  20. Ha, H.-Y.; Lee, T.-H.; Kim, S.-J. Role of nitrogen in the active–passive transition behavior of binary Fe–Cr alloy system. Electrochim. Acta 2012, 80, 432–439. [Google Scholar] [CrossRef]
  21. Ha, H.-Y.; Lee, T.-H.; Oh, C.-S.; Kim, S.-J. Effects of Carbon on the Corrosion Behaviour in Fe-18Cr-10Mn-N-C Stainless Steels. Steel. Res. Int. 2010, 80, 488–492. [Google Scholar]
  22. Ha, H.Y.; Lee, T.H.; Kim, S.J. Effect of C fraction on corrosion properties of high interstitial alloyed stainless steels. Metall. Mater. Trans. A 2012, 43, 2999–3005. [Google Scholar] [CrossRef]
  23. Lee, T.-H.; Shin, E.; Oh, C.-S.; Ha, H.-Y.; Kim, S.-J. Correlation between stacking fault energy and deformation microstructure in high-interstitial-alloyed austenitic steels. Acta Mater. 2010, 58, 3173–3186. [Google Scholar] [CrossRef]
  24. Lee, T.-H.; Ha, H.-Y.; Kim, S.-J. Precipitation of second phases in high-interstitial-alloyed austenitic steel. Metall. Mater. Trans. A 2011, 42, 3543–3548. [Google Scholar] [CrossRef] [Green Version]
  25. Hwang, B.; Lee, T.-H.; Kim, S.-J. Ductile-to-brittle transition behavior of high-interstitial Fe-Cr-Mn alloys. Philos. Mag. Lett. 2012, 92, 93–102. [Google Scholar] [CrossRef]
  26. Lee, T.-H.; Ha, H.-Y.; Hwang, B.; Kim, S.-J.; Shin, E. Effect of Carbon Fraction on Stacking Fault Energy of Austenitic Stainless. Metall. Mater. Trans A 2012, 43, 4455–4459. [Google Scholar] [CrossRef]
  27. Yoon, Y.-S.; Ha, H.-Y.; Lee, T.-H.; Kim, S. Effect of N and C on stress corrosion cracking susceptibility of austenitic Fe18Cr10Mn-based stainless steels. Corros. Sci. 2014, 80, 28–36. [Google Scholar] [CrossRef]
  28. Ha, H.-Y.; Seo, W.-G.; Park, J.Y.; Lee, T.-H.; Kim, S. Influences of Mo on stress corrosion cracking susceptibility of newly developed FeCrMnNiNC-based lean austenitic stainless steels. Mater. Charact. 2016, 119, 200–208. [Google Scholar] [CrossRef]
  29. Ha, H.-Y.; Lee, C.-H.; Lee, T.-H.; Kim, S. Effects of Nitrogen and Tensile Direction on Stress Corrosion Cracking Susceptibility of Ni-Free FeCrMnC-Based Duplex Stainless Steels. Materials 2017, 10, 294. [Google Scholar] [CrossRef] [PubMed] [Green Version]
  30. Yoon, H.; Ha, H.-Y.; Kim, S.-D.; Lee, T.-H.; Jang, J.H.; Moon, J.; Kang, N. Effects of carbon substitution for nitrogen on the pitting corrosion resistance of type UNS S32205 duplex stainless steel. Corrs. Sci. 2020, 164, 108308. [Google Scholar] [CrossRef]
  31. Yoon, H.; Ha, H.-Y.; Lee, T.-H.; Kim, S.-D.; Jang, J.H.; Moon, J.; Kang, N. Pitting Corrosion Resistance and Repassivation Behavior of C-Bearing Duplex Stainless Steel. Metals 2019, 9, 930. [Google Scholar] [CrossRef] [Green Version]
  32. Frankenthal, R.P.; Pickering, H.W. On the Mechanism of Localized Corrosion of Iron and Stainless Steel. J. Electrochem. Soc. 1972, 119, 1304–1310. [Google Scholar] [CrossRef]
  33. Tromans, D.; Sato, A. Halide pitting of type 316L stainless steel − effect of electron beam remelting. Corrosion 2001, 57, 126–133. [Google Scholar] [CrossRef]
  34. Abd El Meguid, E.A.; Abd El Latif, A.A. Critical pitting temperature for Type 254 SMO stainless steel in chloride solutions. Corros. Sci. 2007, 49, 263–275. [Google Scholar] [CrossRef]
  35. Dagbert, C.; Meylheuc, T.; Bellon-Fontaine, M.-N. Pit formation on stainless steel surfaces pre-treated with biosurfactants produced by Pseudomonas fluorescens. Electrochim. Acta 2008, 54, 35–40. [Google Scholar] [CrossRef]
  36. Ha, H.-Y.; Kim, S.-D.; Jang, J.H.; Lee, T.-H.; Lee, C.-H.; Moon, J. Pitting Corrosion and Passive Behavior of Type AISI 304-based Borated Stainless Steels in a Boric Acid Solution. J. Electrochem. Soc. 2020, 167, 101506. [Google Scholar] [CrossRef]
  37. Lee, C.-G.; Ha, H.-Y.; Lee, T.-H.; Cho, K.-M. Effects of Nb on Pitting Corrosion Resistance of Ni-Free FeCrMnCN-Based Stainless Steels. J. Electrochem. Soc. 2017, 164, C591–C597. [Google Scholar] [CrossRef]
  38. Hubschmid, C.; Landolt, D.; Mathieu, H.J. XPS and AES analysis of passive films on Fe-25Cr-X (X = Mo, V, Si and Nb) model alloys. Fresenius J. Anal. Chem. 1995, 353, 234–239. [Google Scholar] [CrossRef]
  39. Yang, M.Z.; Luo, J.L.; Yang, Q.; Qiao, L.J.; Qin, Z.Q.; Norton, P.R. Effects of Hydrogen on Semiconductivity of Passive Films and Corrosion Behavior of 310 Stainless Steel. J. Electrochem. Soc. 1999, 146, 2107–2112. [Google Scholar] [CrossRef]
  40. Frankel, G.S. Pitting Corrosion of Metals—A Review of the Critical Factors. J. Electrochem. Soc. 1998, 145, 2186–2198. [Google Scholar] [CrossRef]
  41. Newman, R.C. The dissolution and passivation kinetics of stainless alloys containing molybdenum—II. Dissolution kinetics in artificial pits. Corros. Sci. 1985, 25, 341–350. [Google Scholar] [CrossRef]
  42. Ha, H.-Y.; Lee, T.-H.; Bae, J.-H.; Chun, D.W. Molybdenum Effects on Pitting Corrosion Resistance of FeCrMnMoNC Austenitic Stainless Steels. Metals 2018, 8, 653. [Google Scholar] [CrossRef] [Green Version]
Figure 1. Equilibrium phase fractions of the (a) LC, (b) MC, and (c) HC alloys defined in Table 1 as a function of temperature calculated using Thermo-Calc software.
Metals 11 01124 g001
Figure 2. Equilibrium volume fractions of (a) M2N and (b) M23C6 in the LC, MC, and HC alloys as a function of temperature calculated using Thermo-Calc software.
Metals 11 01124 g002
Figure 3. Microstructures of the (a) LC and (b) MC samples: Scanning electron microscopy (SEM) images taken at (a-1,b-1) low and (a-2,b-2) high magnifications, and (a-3,b-3) bright field transmission electron microscopy (TEM) images of the grain boundaries.
Metals 11 01124 g003
Figure 4. Microstructures of the (a) HC-1 and (b) HC-2 samples: (a-1,b-1) light optical microscopy (LOM), (a-2,b-2) SEM, and (a-3,b-3) bright field TEM images of the precipitates formed at grain boundaries.
Metals 11 01124 g004
Figure 5. (a) High-resolution TEM images taken at the γ-M23C6 interface in the HC-1 sample and (b) corresponding fast-Fourier transformation results.
Metals 11 01124 g005
Figure 6. Time-temperature-precipitation diagram for M2N and M23C6 in the MC and HC alloys calculated by JMatPro Software.
Metals 11 01124 g006
Figure 7. Non-metallic inclusions (NMIs) of the (a) LC, (b) MC, and (c) HC-2 samples: (a-1,b-1,c-1) back-scattered electron (BSE) images showing the distribution of NMI and (a-2,b-2,c-2) secondary electron (SE) images for each NMI of the samples.
Metals 11 01124 g007
Figure 8. Cyclic potentiodynamic polarization curves of the (a) LC, (b) MC, (c) HC-1, and (d) HC-2 samples measured in a 3.5 wt% NaCl solution at 25 °C with a potential sweep rate of 0.167 mV s−1. (e) Average pitting potential (Epit) and repassivation potential (Erp) values of the samples, which were obtained from 8–10 repeated polarization tests.
Metals 11 01124 g008
Figure 9. SEM images for pits formed in the (a) LC and (b) MC samples after potentiodynamic polarization in a 3.5 wt% NaCl solution. (a-1,b-1) Initiation and (a-2,b-2) propagation of pitting corrosion.
Metals 11 01124 g009
Figure 10. SEM images for pits formed in the (a) HC-1 and (b) HC-2 samples after potentiodynamic polarization in a 3.5 wt% NaCl solution. (a-1,b-1) Initiation and (a-2,b-2) propagation of pitting corrosion.
Metals 11 01124 g010
Figure 11. (a) Cyclic potentiodynamic polarization curves of the LC and MC samples measured in a 3.5 wt% NaCl solution at 25 °C with a potential sweep rate of 0.167 mV s−1 (integration of Figure 8a,b). (b) Average ipassive measured at −0.1 VSCE from the polarization curves.
Metals 11 01124 g011
Figure 12. Chemical composition depth profiles of the passive films of the (a) LC and (b) MC samples analyzed through XPS. (c) Cation fraction of Cr (Cr/(Cr+Fe), in at%) in the passive films of the specimens.
Metals 11 01124 g012
Figure 13. (a) Corrosion potential (Ecorr) versus time curves of the LC and MC samples measured in a 1 M HCl solution at 25 °C. (b) Potentiodynamic polarization curves of the two samples measured in the same solution with a potential sweep rate of 0.167 mV s−1. Average (c) Ecorr and (d) Critical anodic current density (icrit) values of the samples, which were obtained from 8–10 repeated polarization tests.
Metals 11 01124 g013
Table 1. Chemical compositions (wt%) and solution treatment temperatures of the investigated FeCrNi austenitic stainless steels (γ-SSs)—with low (LC), medium (MC) and high (HC) C/(C + N) ratio.
AlloyCrMnNiCNC + NC/(C + N)Solution Treatment
Condition
LC18.208.995.500.0070.3150.3220.0221100 °C, 1 h
MC18.158.965.510.0940.2320.3260.2881100 °C, 1 h
HC-118.118.985.490.1850.1260.3110.5951150 °C, 1 h
HC-21230 °C, 24 h
Table 2. NMI analysis results: volume fraction, size, and chemical composition.
AlloyNonmetallic Inclusions
Volume Fraction (vol%)Diameter (μm)Chemical Composition (wt%)
LC0.192 ± 0.0214.25 ± 2.2832.5O-43.4Cr-22.8Mn-1.3Fe
MC0.201 ± 0.0164.40 ± 2.0031.8O-43.3Cr-23.0Mn-1.9Fe
HC-20.187 ± 0.0224.33 ± 1.8532.8O-43.1Cr-22.3Mn-1.8Fe
Publisher’s Note: MDPI stays neutral with regard to jurisdictional claims in published maps and institutional affiliations.

