Article

Influence of Pulsed Exposure Strategies on Overhang Structures in Powder Bed Fusion of Ti6Al4V Using Laser Beam

1
Professorship of Laser-based Additive Manufacturing, Department of Mechanical Engineering, School of Engineering & Design, Technical University of Munich, Boltzmannstraße 15, 85748 Garching, Germany
2
AMCM GmbH, Petersbrunner Straße 1b, 82319 Starnberg, Germany
*
Author to whom correspondence should be addressed.
Metals 2021, 11(7), 1125; https://doi.org/10.3390/met11071125
Submission received: 21 June 2021 / Revised: 8 July 2021 / Accepted: 12 July 2021 / Published: 15 July 2021
(This article belongs to the Special Issue Advances in Additive Manufacturing of Metals)

Abstract

:
Manufacturing structures with low overhang angles without support structures is a major challenge in powder bed fusion of metals using laser beam (PBF-LB/M). In the present work, various test specimens and parameter sets with continuous wave (cw) and pulsed exposure are used to investigate whether a reduction of downskin roughness and overhang angle can be achieved in PBF-LB/M of Ti6Al4V. Starting from cw exposure, the limits of overhang angle and surface roughness at the downskin surface are investigated as a reference. Subsequently, the influence of laser power, scanning speed, and hatch distance with fixed pulse duration (τpulse = 25 µs) and repetition rate (υrep = 20 kHz) on surface roughness Ra is investigated. Pulsed exposure strategies enable the manufacturing of flatter overhang angles (≤20° instead of ≥25°). Furthermore, a correlation between the introduced volume energy density and the downskin roughness can be observed for pulsed exposure. As the reduction in volume energy density causes an increase in porosity, the combination of pulsed downskin exposure and commercial cw infill exposure is investigated. The larger the gap in volume energy density between the infill area and downskin area, the more challenging it is combining the two parameter sets. By combining cw infill and pulsed downskin exposure, flatter overhang structures cannot be manufactured, and a reduction in roughness can be achieved.

1. Introduction

In laser-based powder bed fusion of metals (PBF-LB/M), continuous wave (cw) and vector-based exposure strategies are used as a standard exposure strategy nowadays. This cw exposure with high-line intensities implies high temperature gradients as well as cooling rates in and around the melt pool, which determines the process dynamic and resulting component microstructure. In the literature, the advantages of pulsed compared with cw exposure have been discussed for several materials over the past decades. Different beneficial aspects were addressed using pulsed exposure in PBF-LB/M:
  • Minimizing thermal distortion [1];
  • Increasing spatial resolution for thin structures [2,3];
  • Tailoring microstructure [1,3].
These advantageous changes result primarily from the more controlled energy input. In investigations on pulsed energy input in PBF-LB/M, low repetition rates in the field of Hz were applied and the aim was a reduction of top and side surface quality [4,5]. To sum up these investigations: with high repetition rates, increased overlap, and reduced scan speed, the top surface roughness is reduced, but at the same time, balling effects occur and thus side surface roughness is increased [4,5].
Modern fiber lasers, which are mainly used in PBF-LB/M, provide the possibly to apply fast power modulation, and can thus realize a pulsed energy input with pulse durations down to the range of microseconds and pulse repetition rates up to multiple kHz [6]. Recent investigations on continuous and pulsed energy input for different materials prove an increase of porosity and a decrease of dimensional accuracy for large parts [2]. If thin parts, like in lattice structures, should be manufactured, pulsed energy input shows great advantages [2]. Caprio et al. [7] have proven an increase in resolution, which goes along with a decrease in efficiency for stainless steel (316L). Laitinen et al. [8] investigated the influence of pulse duration in PBF-LB/M of stainless steel (316L). Shorter pulse durations result in narrower and shallower melt pools and, therefore, require larger overlap to produce continuous melt paths [8]. Karami et al. [3] analyzed the difference between continuous and pulsed PBF-LB/M and their effect on microstructure of Ti6Al4V lattice structures. The use of pulsed exposure strategies implies a more homogenous microstructure, and thus higher compressive mechanical properties and yield stress [3].
In addition, the use of pulsed energy input allows a tailoring of the resulting microstructure, demonstrated in [1] for AlSi12 and AlSi10Mg, in [9] for AlSi10Mg, and in [10] for IN738LC. Biffi et al. [9] investigated for AlSi10Mg a slightly finer microstructure using pulsed wave laser, while the melt pool track is larger for the continuous wave mode, which leads to higher mechanical properties.
The focus of the investigation was mostly on the analysis of the microstructure, the porosity, or the resolution when using pulsed exposure in the PBF-LB/M. The investigations presented aim at the manufacturing of flatter overhang structures in the PBF-LB/M. Overhang structures are especially challenging in PBF-LB/M because of heat accumulation and consequent distortion incurred [11]. In order to eliminate distortions, external support structures are usually used to reinforce the overhang structure during the PBF-LB/M process. The use of support structures leads to time-consuming post-processing. Investigations from Calignano [12] show that overhang structures of AlSi10Mg and Ti6Al4V up to an angle of 30° can be manufactured, although the surface roughness is negatively affected. Optimized support geometry leads to an improvement of part quality [12]. According to Han et al. [11], the melt pool in the dross zone is larger compared with the zone where the part is supported by underlying layers, which is caused by the lower thermal conductivity of the powder bed, and leads to higher distortion. Therefore, Han et al. [11] suggest an increased surface contact area between the part and the support structures to significantly reduce the distortion. Chen et al. [13] investigated the roughness on downskin surfaces in Ti6Al4V for angles ≥40°; the roughnesses became larger with decreasing overhang angles. For overhang angles of 40°, roughnesses of Ra ≥ 40 µm could be achieved.
It is hardly possible or impractical to avoid overhang structures in additive manufacturing. The support structures required for this in PBF-LB/M have to be removed with great effort. From an AM perspective, therefore, avoiding support structures for overhang structures is favorable as this eliminates the need for time-consuming post-processing. The state-of-the-art shows quite well that overhang structures tend to distortion owing to an unbalanced thermal budget. Investigation into the use of pulsed exposure strategies leads to control of thermal budget, which leads to the following question: How flat can overhang structures be manufactured without additional support structures by using pulsed energy input in PBF-LB/M?
Therefore, the objective of this study is to extend the limits of overhang angles with reduced roughness of downskin surfaces by reducing heat accumulated in the process zone through pulsed exposure strategies. Because a reduction in introduced energy implies an increase in porosity [14], double exposures are tested to reduce porosity. Finally, selected pulsed parameter sets as downskin parameter are combined with commercially available cw infill parameters to produce parts with the highest relative densities possible.

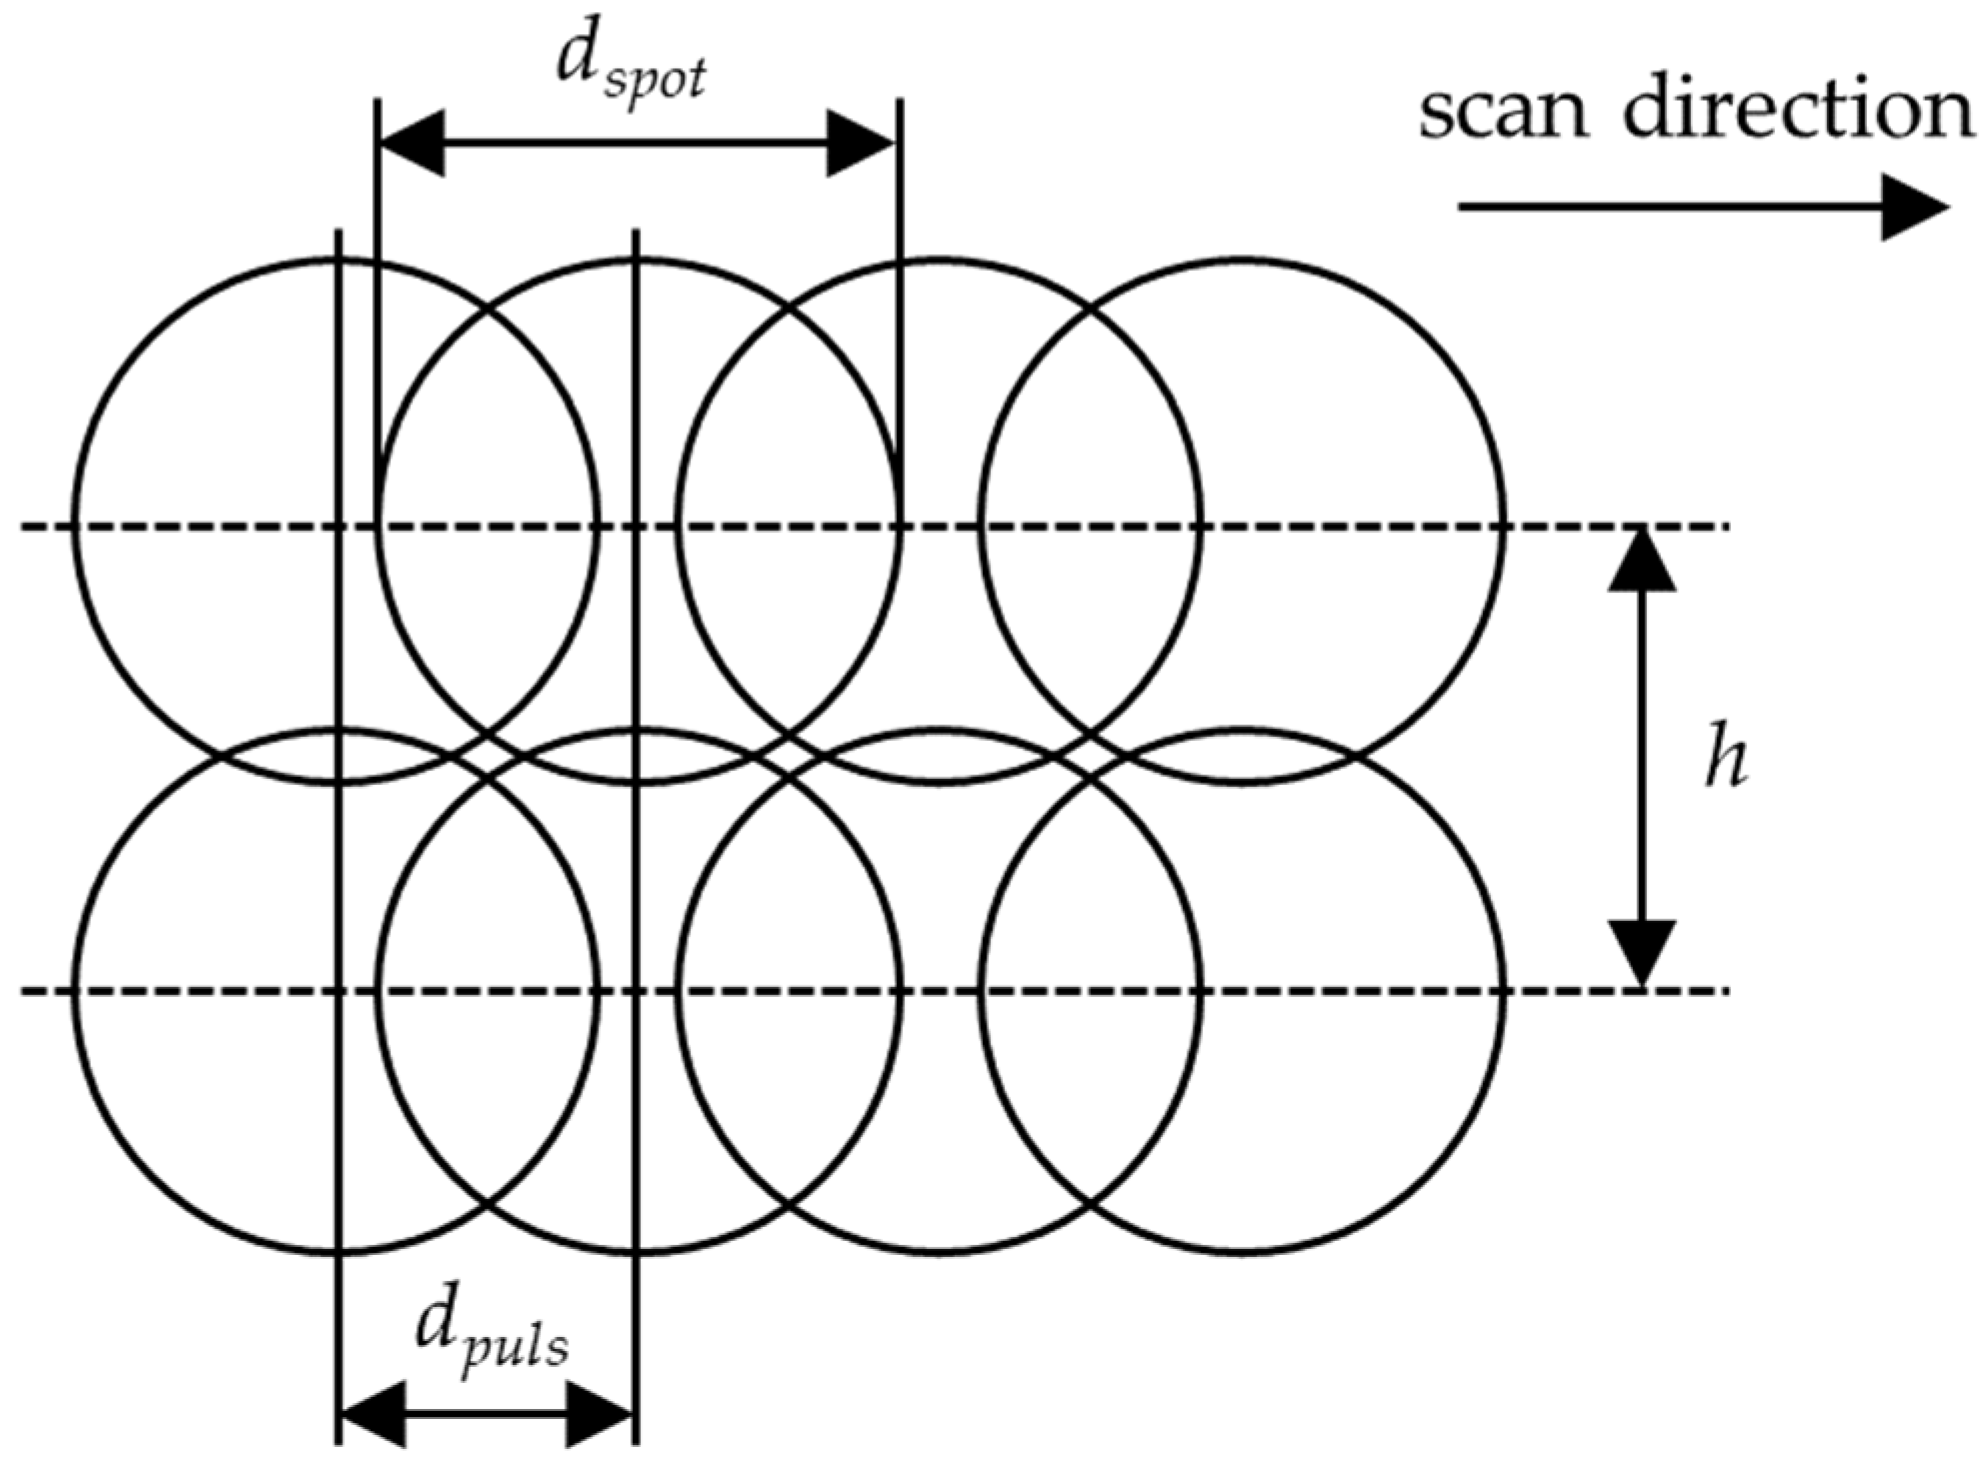
2. Theoretical Consideration

Exposure Parameters

State-of-the-art PBF-LB/M systems use fiber lasers as a beam source, which can be power modulated at a multiple of 10 kHz. In this study, power modulation is used for pulse generation. The pulses have a rectangle-like shape with pulse peak powers Ppeak corresponding to the set laser power. There is no power superelevation, as is the case with pulsed beam sources with Q-switch or modelocking. The energy delivered per pulse Epulse is determined by the pulse length τpulse and the laser peak power Ppeak according to
E p u l s e = P p e a k · τ p u l s e .
The average power Pavg is determined according to
P a v g = E p u l s e · υ r e p ,
where υrep is the pulse repetition rate. Two more important parameters for the process are the distance between two pulses dpulse (see Figure 1) and the volume energy density Ev, which describes the energy input per volume. The distance between two pulses dpulse is calculated as a product of the scan speed vscan and the laser off time
d p u l s e = v s c a n ·   ( 1 υ r e p τ p u l s e ) .
The volume energy density Ev is the quotient of the average power Pavg and the product of scan speed vscan, hatch distance h, and powder layer thickness tpowder:
E v = P a v g v s c a n · h · d p o w d e r = P p e a k · τ p u l s e · υ r e p v s c a n · h · t p o w d e r .
By combining the varied parameter, Ev helps to compare different parameter sets. All data and equations on energies or powers in this study refer to the power emitted by the laser. The energy absorbed by the material, and thus available in the process, is always dependent on the material and the surface properties of the irradiated area.

3. Materials and Methods

3.1. Feedstock Material
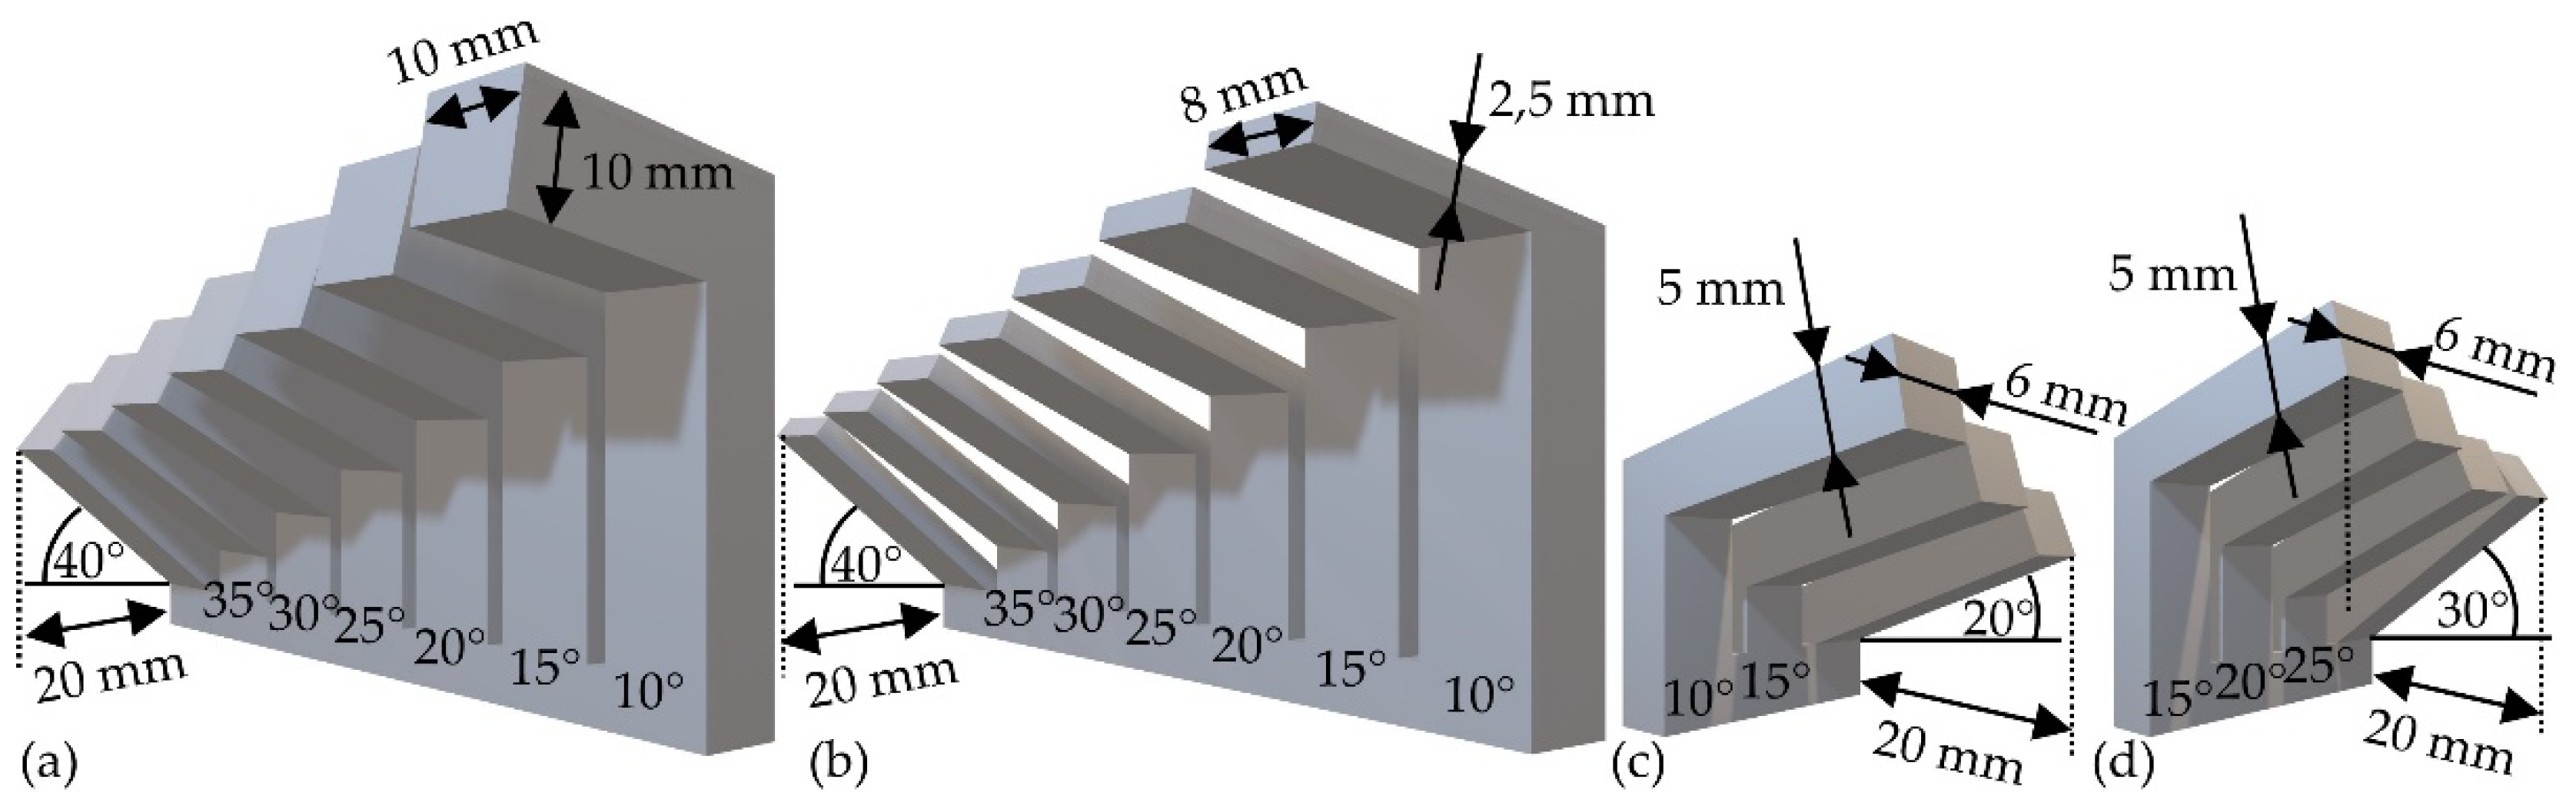
In this study, Ti6Al4V is used as feedstock material. This alloy is the most widely used titanium alloy with a market share of 75–85% [15]. The reason for this is its properties such as good strength, ductility, fracture toughness, and corrosion and temperature resistance with a low density of 4.43 g/cm³. These material properties make it particularly interesting for aerospace applications [16]. In these fields of application, the avoidance of support structures in favor of the manufacturability of complex components is in demand.
Regarding the absorption behavior of Ti6Al4V, Boley et al. [17] performed experiments on the absorption of different metal powders and substrates at a wavelength of λ ≈ 1 µm. For Ti6Al4V powder, they measured an absorption of 74% at a layer thickness of 100 µm. The absorption of a smooth substrate is estimated to be 39%. The absorption of a rough surface (e.g., a sandblasted substrate or a layer that has already been melted) is in between, depending on the surface properties.
Ti6Al4V (EOS Titanium Ti64; [18]) powder is provided by EOS GmbH (Krailling/Munich, Germany). The powder is produced by the gas atomization process. It has a particle size of D90,3 ≈ 50 µm. Before each process, the powder is sieved with a 63 μm sieve to ensure that the particle size distribution remains constant during the tests.

3.2. Test Specimens

In order to show geometry limits and the influence of the introduced energy as well as the influence of an extended layer time in cw processes, the test specimens in Figure 2a,b with overhang thicknesses of 2.5 mm and 10 mm are used. The test specimens consist of overhang structures with angles in the range of 10–40°, which are varied in steps of 5°. Flatter angles are arranged in higher z-positions to reduce interference in the manufacture of the various angles.
Based on the results of the first tests, the test specimen in Figure 2c is used for the investigation of pulsed exposure strategies. These include adjusted cross sections and angular increments with lower angles, as overhang structures up to an angle of 25° can be manufactured safely in the cw process.
For a final investigation of the combination of commercial cw parameters and qualified pulsed parameters, the test specimen in Figure 2d is used. This test specimen is extended by angles of 25° and 30°, whereby the angle with 10° is not considered further owing to insufficient manufacturability.

3.3. PBF-LB/M System with Optical Tomography

The test samples were fabricated on a customized PBF-LB/M system (M290, EOS GmbH, Krailling/Munich, Germany). The PBF-LB/M system was upgraded with a 1 kW fiber laser (YLR-1000-WC-Y14, IPG Photonics®, Oxford, MA, USA) with a wavelength of λ ≈ 1070 nm, a maximum pulse repetition rate of υrep = 50 kHz, and a minimum pulse duration of τpulse = 10 µs. The spot size on the base plate is dspot = 80 µm.
The system includes a camera-based optical tomography (OT) system (EOS GmbH, Krailling/Munich, Germany) consisting of a sCMOS camera (16-bit) placed above the process chamber and aligned to the base plate via a deflection mirror. During the manufacturing process, the OT records individual images with a narrowband filtered wavelength of ≈900 nm with exposure times of 100 ms. The individual images are combined to form one gray-scale image per slice. The signal qualitatively estimates the process temperature via the thermal emission at ≈900 nm. The data accrue as 16-bit images and are evaluated by averaging the detected data in desired areas and normalizing them. The results shown include the data of exposed cross sections from different z-coordinates. The z-coordinates and evaluated areas are selected depending on the test specimen and overhang angles in a way that the cross-sectional area is in comparable areas of the overhang. Table 1 summarizes the z-coordinates and areas used.

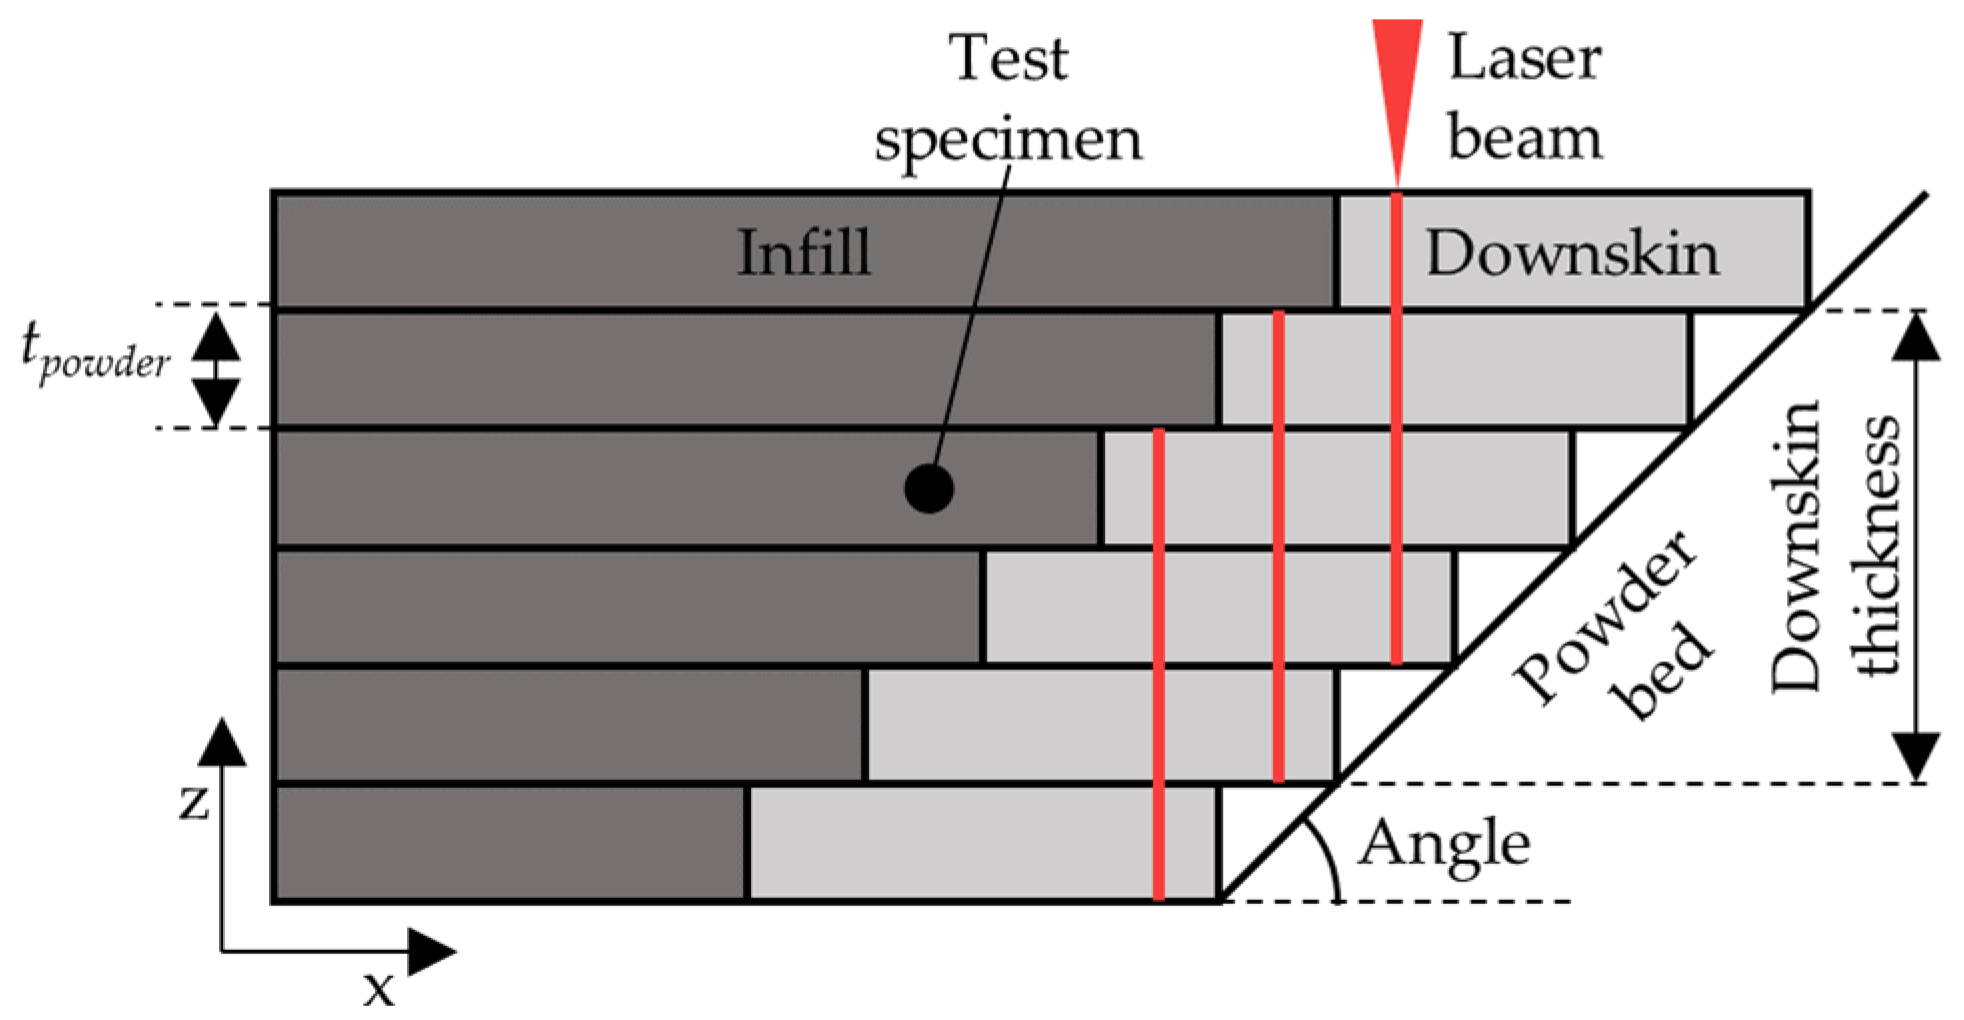
3.4. Process Parameters

The process parameter sets used can be categorized into three different test series: cw exposure, single-pulsed exposure, and double-pulsed exposure. The cw exposure test series is conducted with the commercial parameter set “Ti64_SpeedM291 1.10” of EOS GmbH (Krailling/Munich, Germany). For the overhang thicknesses of 10 mm, the layer time is additionally increased from tL10 mm ≈ 80 s to tML10 mm = 260 s. The layer time describes the time required by the PBF-LB/M for complete processing of one layer. It can be assumed that the time for heat dissipation of an exposed volume between two exposures corresponds on average to the layer time. The additional time allows a longer heat dissipation from the process zone, and thus reduces the average process temperature. The layer time of the manufacturing process with overhang thicknesses of 2.5 mm is tL2.5mm ≈ 50 s.
Besides cw exposure, all other experiments are carried out with pulsed laser radiation (single and double exposure). The investigated parameter sets of both strategies are summarized in Table 2. The experimental parameters are constant within the respective test specimen. There are no separate contour or downskin parameters. The single-pulsed exposure test series is a screening with a wide variation of laser power Ppeak = 140 … 640 W with ΔPpeak = 100 W and scan speed vscan = 750 … 4750 mm/s with Δvscan = 500 … 1000 mm/s at various hatch distance of h = 40, 60, 80, and 120 µm (total of 54 parameter sets). The design results in volume energy densities in the range Ev ≈ 4 … 73 J/mm³. Based on the results of the single-pulsed exposure, the parameters for the double exposure test series are derived. Restricted ranges of power Ppeak = 140 … 240 W with ΔPpeak = 20 W and scan speed vscan = 1000 … 2500 mm/s with Δvscan = 500 mm/s (total of 72 parameter sets) are chosen. The hatch distance is varied with h = 40, 50, and 60 µm. This series is designed full factorial. Owing to the double exposure, the design results in volume energy densities of Ev ≈ 16 … 100 J/mm³. The energy actually absorbed and thus available in the process is lower owing to the lower absorption of the already melted layer. For this reason, the volume energy densities between single and double exposure are not directly comparable.
All test samples are built with a pulse repetition rate of υrep = 20 kHz, a pulse duration of τpulse = 25 µs, and a powder layer thickness of tpowder = 60 µm.
The reduction of volume energy density leads to increased porosities [14]. However, for most applications, it is necessary that components have a high density to ensure high quality and good mechanical properties [19]. Therefore, three parameter sets with low downskin roughnesses and various powers, hatches, scan speeds, and volume energy densities are combined with the commercial cw infill parameter set “Ti64_SpeedM291 1.10” qualified to produce high densities. The parameter sets Downskin 1 and 2 are taken from the double pulsed exposure test series. Downskin 3 is based on the single-pulsed exposure test series, but receives an adjusted scan speed. With these downskin parameter sets (shown in Table 3), single and double exposures and the variation of downskin thickness are investigated. The areas to which the various parameter sets are assigned are shown schematically in Figure 3.

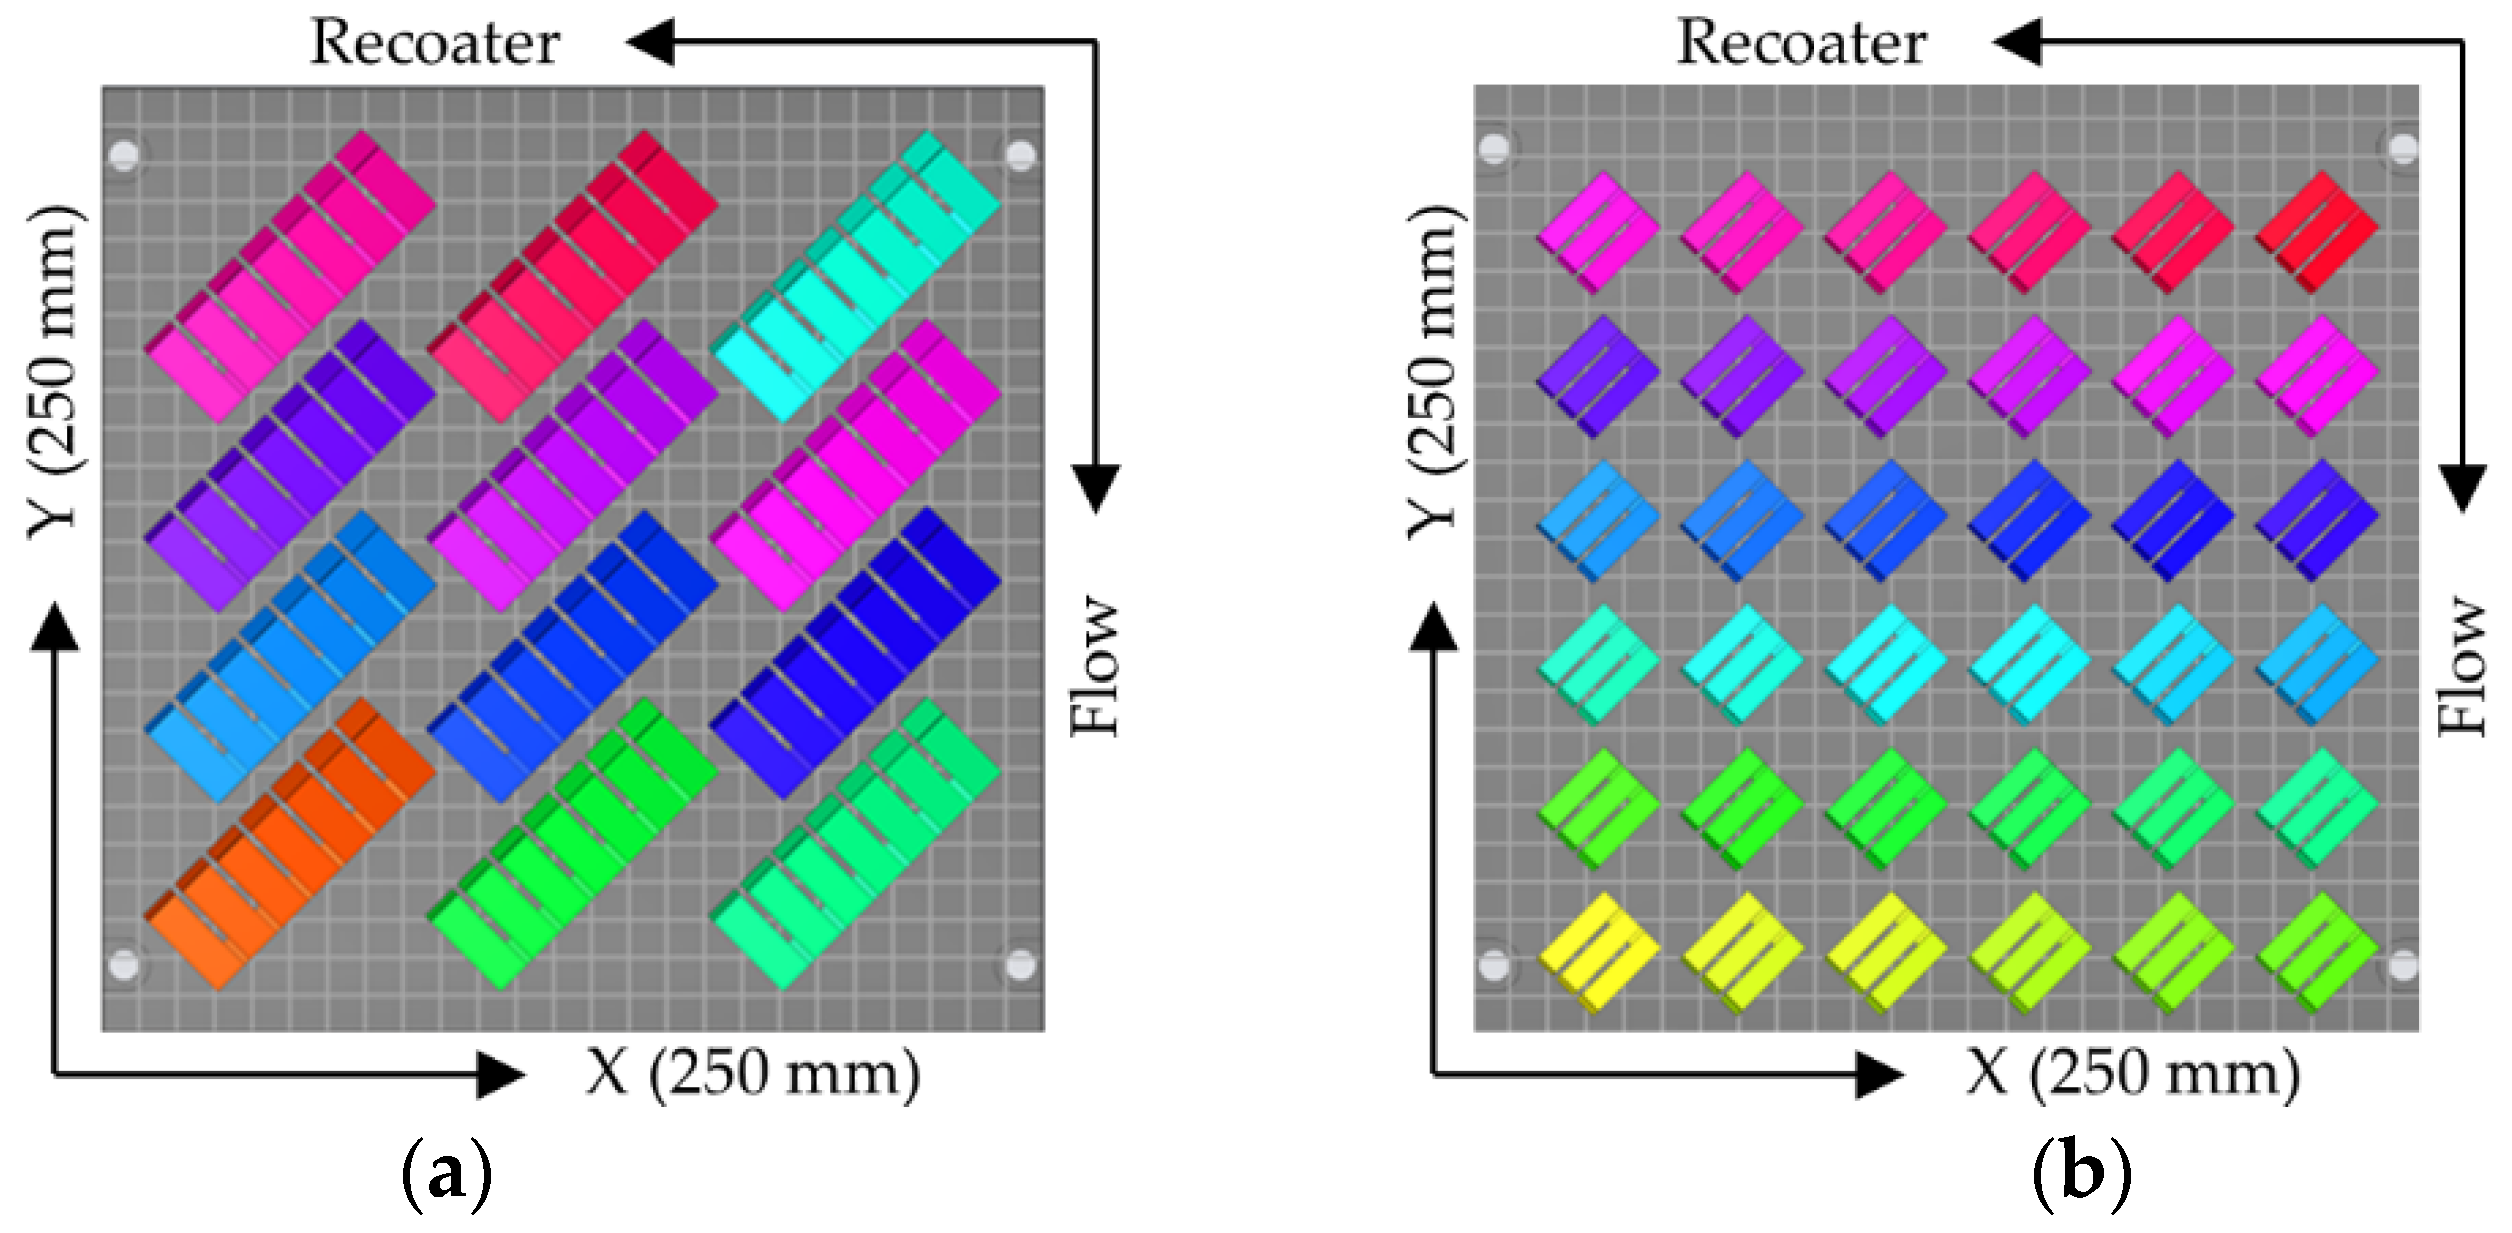
3.5. Build Job Design

The build job design for the different test specimens from Figure 1 is shown in Figure 4. In accordance with VDI 3405 Part 2 [20], the test specimens are placed at an azimuth angle of 45° to the coating and gas flow direction with the open angle ends oriented in the coating direction. This arrangement prevents protruding test specimens from being approached head-on by the coater blade and increases process robustness. The twisted arrangement prevents scan paths in the direction of the shielding gas flow during contour runs or runs parallel to the contour. In this way, undesirable interactions between discharged process emissions and the laser radiation are reduced.

3.6. Component Properties

To assess the manufacturability of flat overhang structures, the roughness of the downskin areas of the test specimens is measured. As very large roughness values are expected at the downskin surfaces owing to the geometry and the process, the specimens are declared not manufacturable from a roughness Ra > 150 µm, which is about twice as high as the reference values shown later. Porosity analyses are performed for selected parameter sets, because the focus of the optimization is on the reduction of roughness.

3.6.1. Roughness Measurement

A 3D profilometer (Keyence VR-3200, Ōsaka, Japan) is used to measure the roughness on the downskin surfaces of the test specimens via fringe projection. By means of the fringe projection method, an unambiguous topography measurement and high resolution can be achieved [21]. In order to establish comparability with other measurements, the established arithmetic average roughness Ra according to ISO 4287 [22] is evaluated from the raw data obtained by 31 homogeneously distributed single measurement sections of 20 mm in length. No low-pass filter λs is used in the evaluation, and the high-pass cut-off wavelength is set to λc = 2.5 mm.

3.6.2. Porosity

In order to compare the porosities of single and double exposure on one example parameter set, micrographs are created. For this purpose, the specimens are prepared in an acrylic cold mounting system, then ground with a 220 grit SiC foil and polished in three stages with cloths and polishing suspensions (9 µm, 1 µm, 0.04 µm). Subsequently, the micrographs are recorded with a 5× objective and a pixel size of approximately 1.4 µm/px.

4. Results and Discussion

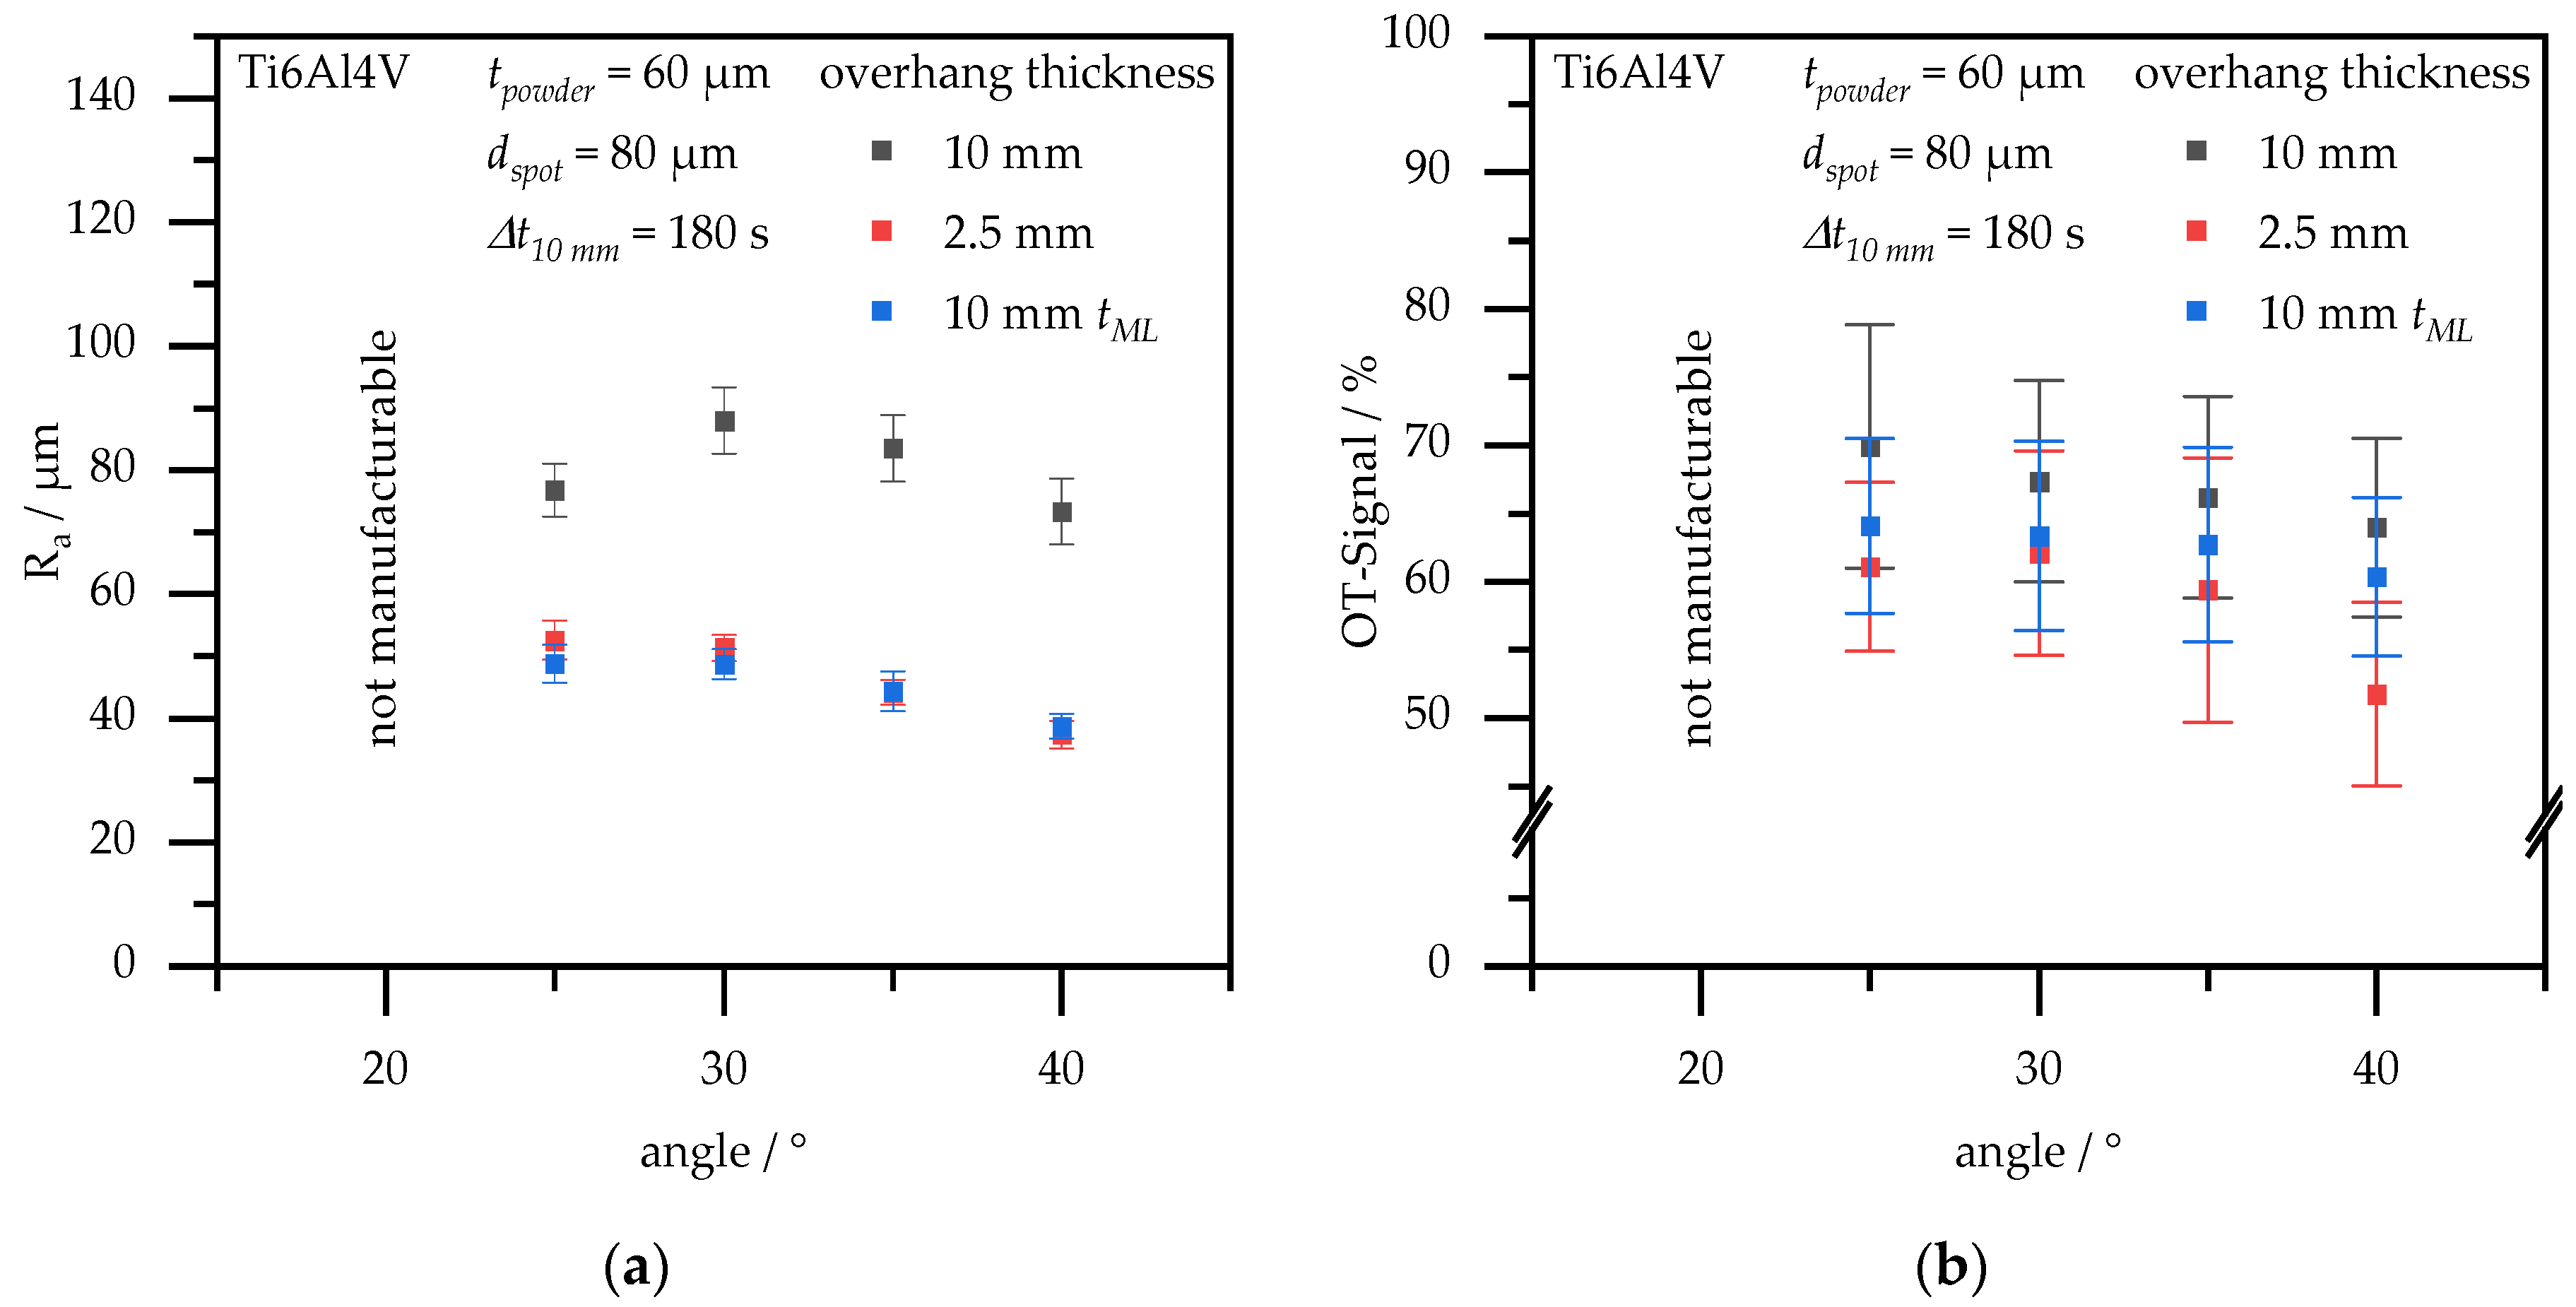
4.1. Continuous Exposure Strategies

Initial tests with commercial cw process parameters show the limits of manufacturing overhang structures using cw parameters and the potential to reduce the roughness by reducing heat accumulation in the specimen as a reference. According to Calignano [12], manufacturing of overhang structures with angles of 30° using PBF-LB/M is possible. With the commercial cw parameters in this study, structures with overhang thicknesses of 2.5 mm and 10 mm with angles up to 25° can be manufactured.
Figure 5a shows that the reference test specimens with overhang thicknesses of 10 mm have roughnesses of Ra > 70 µm on the downskin surface for all angles shown. The test specimens with overhang thicknesses of 2.5 mm exhibit, with Ra < 55 µm, significantly lower roughnesses for all angles. The extension of the layer time from tL10 mm ≈ 80 s to tML10 mm = 260 s with Δt10 mm ≈ 180 s in the production of the reference test specimens with overhang thicknesses of 10 mm also leads to a significant reduction of the roughness Ra < 50 µm for all angles shown. These values fit well with studies by Chen et al. [13], who achieved roughnesses on downskin surfaces of Ra ≥ 40 µm at 40° angles, Ra ≥ 30 µm at 50° angles, and Ra ≥ 15 µm at 60° angles.
Reducing the overhang thickness from 10 mm to 2.5 mm reduces the volume and area per layer to be melted. This reduces the energy introduced into the overhang structure. Less energy introduced results in less heat accumulated in the specimen. Extending the layer time by 3 min for test specimens with overhang thickness of 10 mm enables heat to be dissipated from the processing zone into the specimen and base plate for 3 min longer, thus reducing the heat accumulated. Lower accumulated heat results in lower process temperatures, and thus a reduction of thermal radiation at 900 nm, which can be detected by the OT system (see Figure 5b). Both adjustments in the cw exposure slightly reduce the average OT signal, confirming a reduction in the process temperature.
This lower process temperature tends to lead to lower roughness values on the overhang structures. The reasons for this can be less adhering powder particles, less melt pool dynamics at the overhang structures, as well as the formation of smaller melt pools in the dross zone as shown in [11]. The high standard deviations of the OT signals in Figure 5b indicate high melt pool dynamics, resulting in more irregular melt tracks at the downskin surface, and thus causing the comparatively high roughness values. In addition to reducing accumulated heat, reducing melt pool dynamics through pulsed exposure strategies offers the potential to reduce downskin roughness.

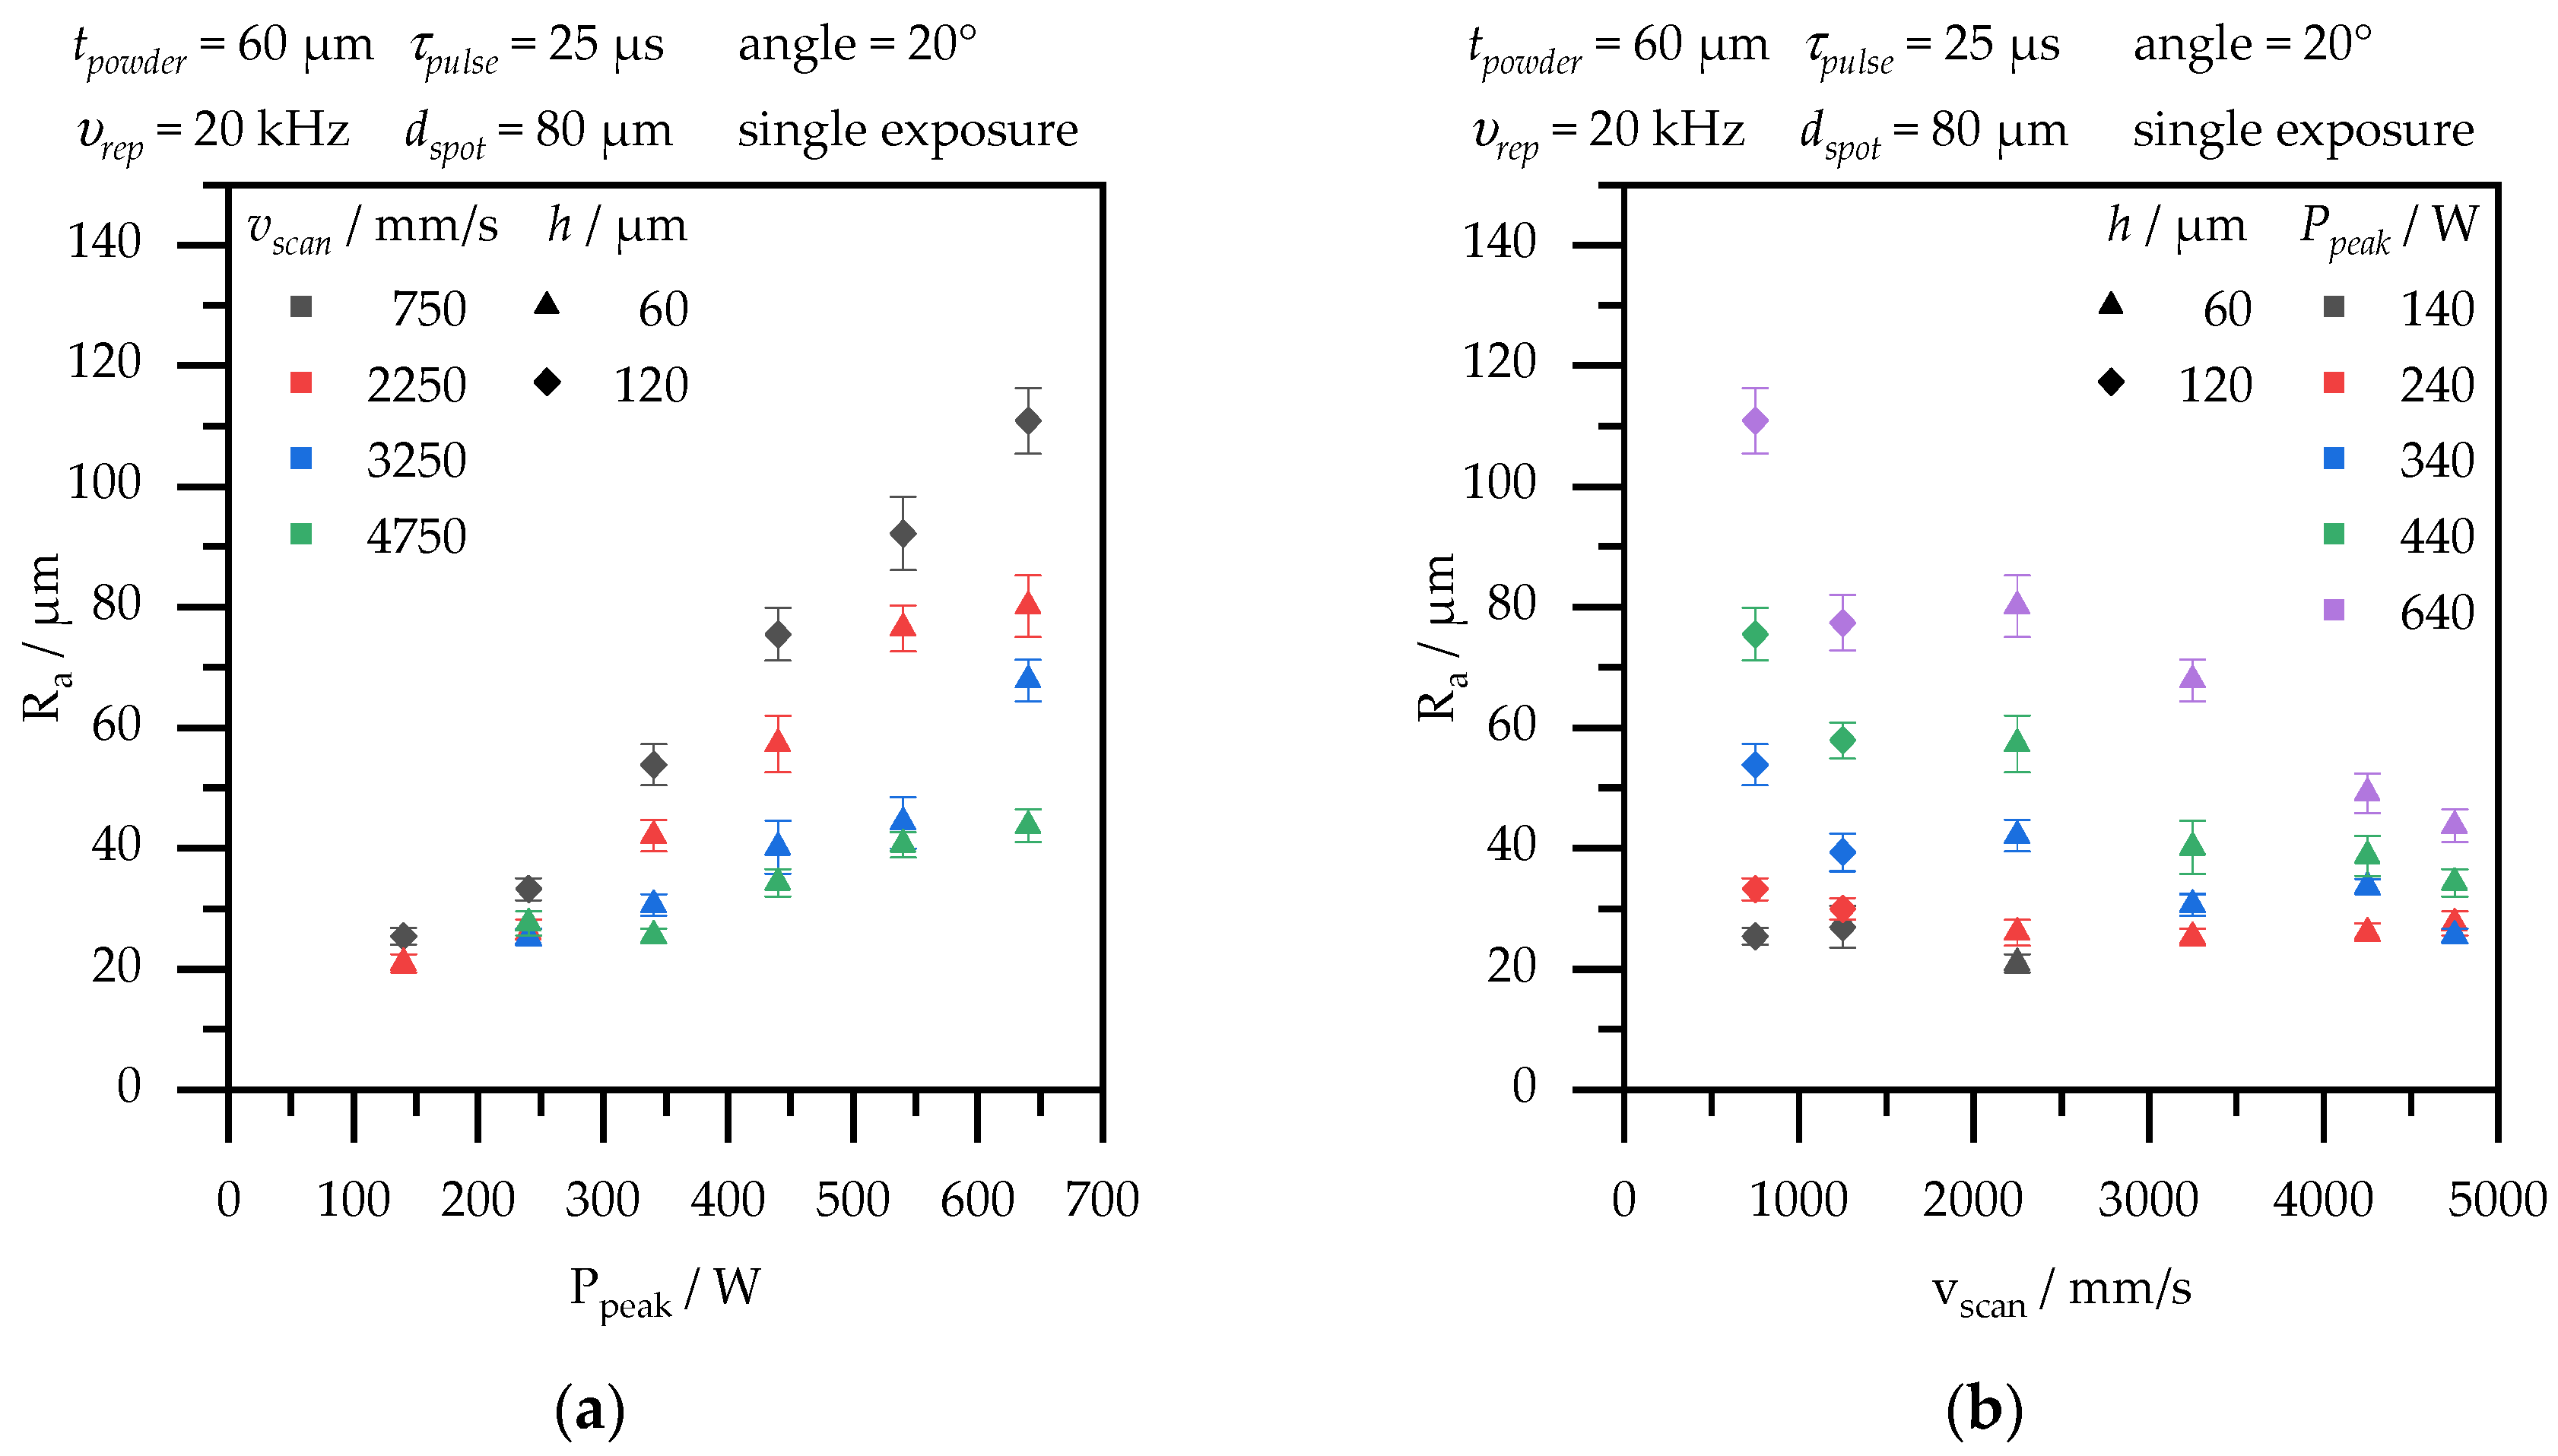
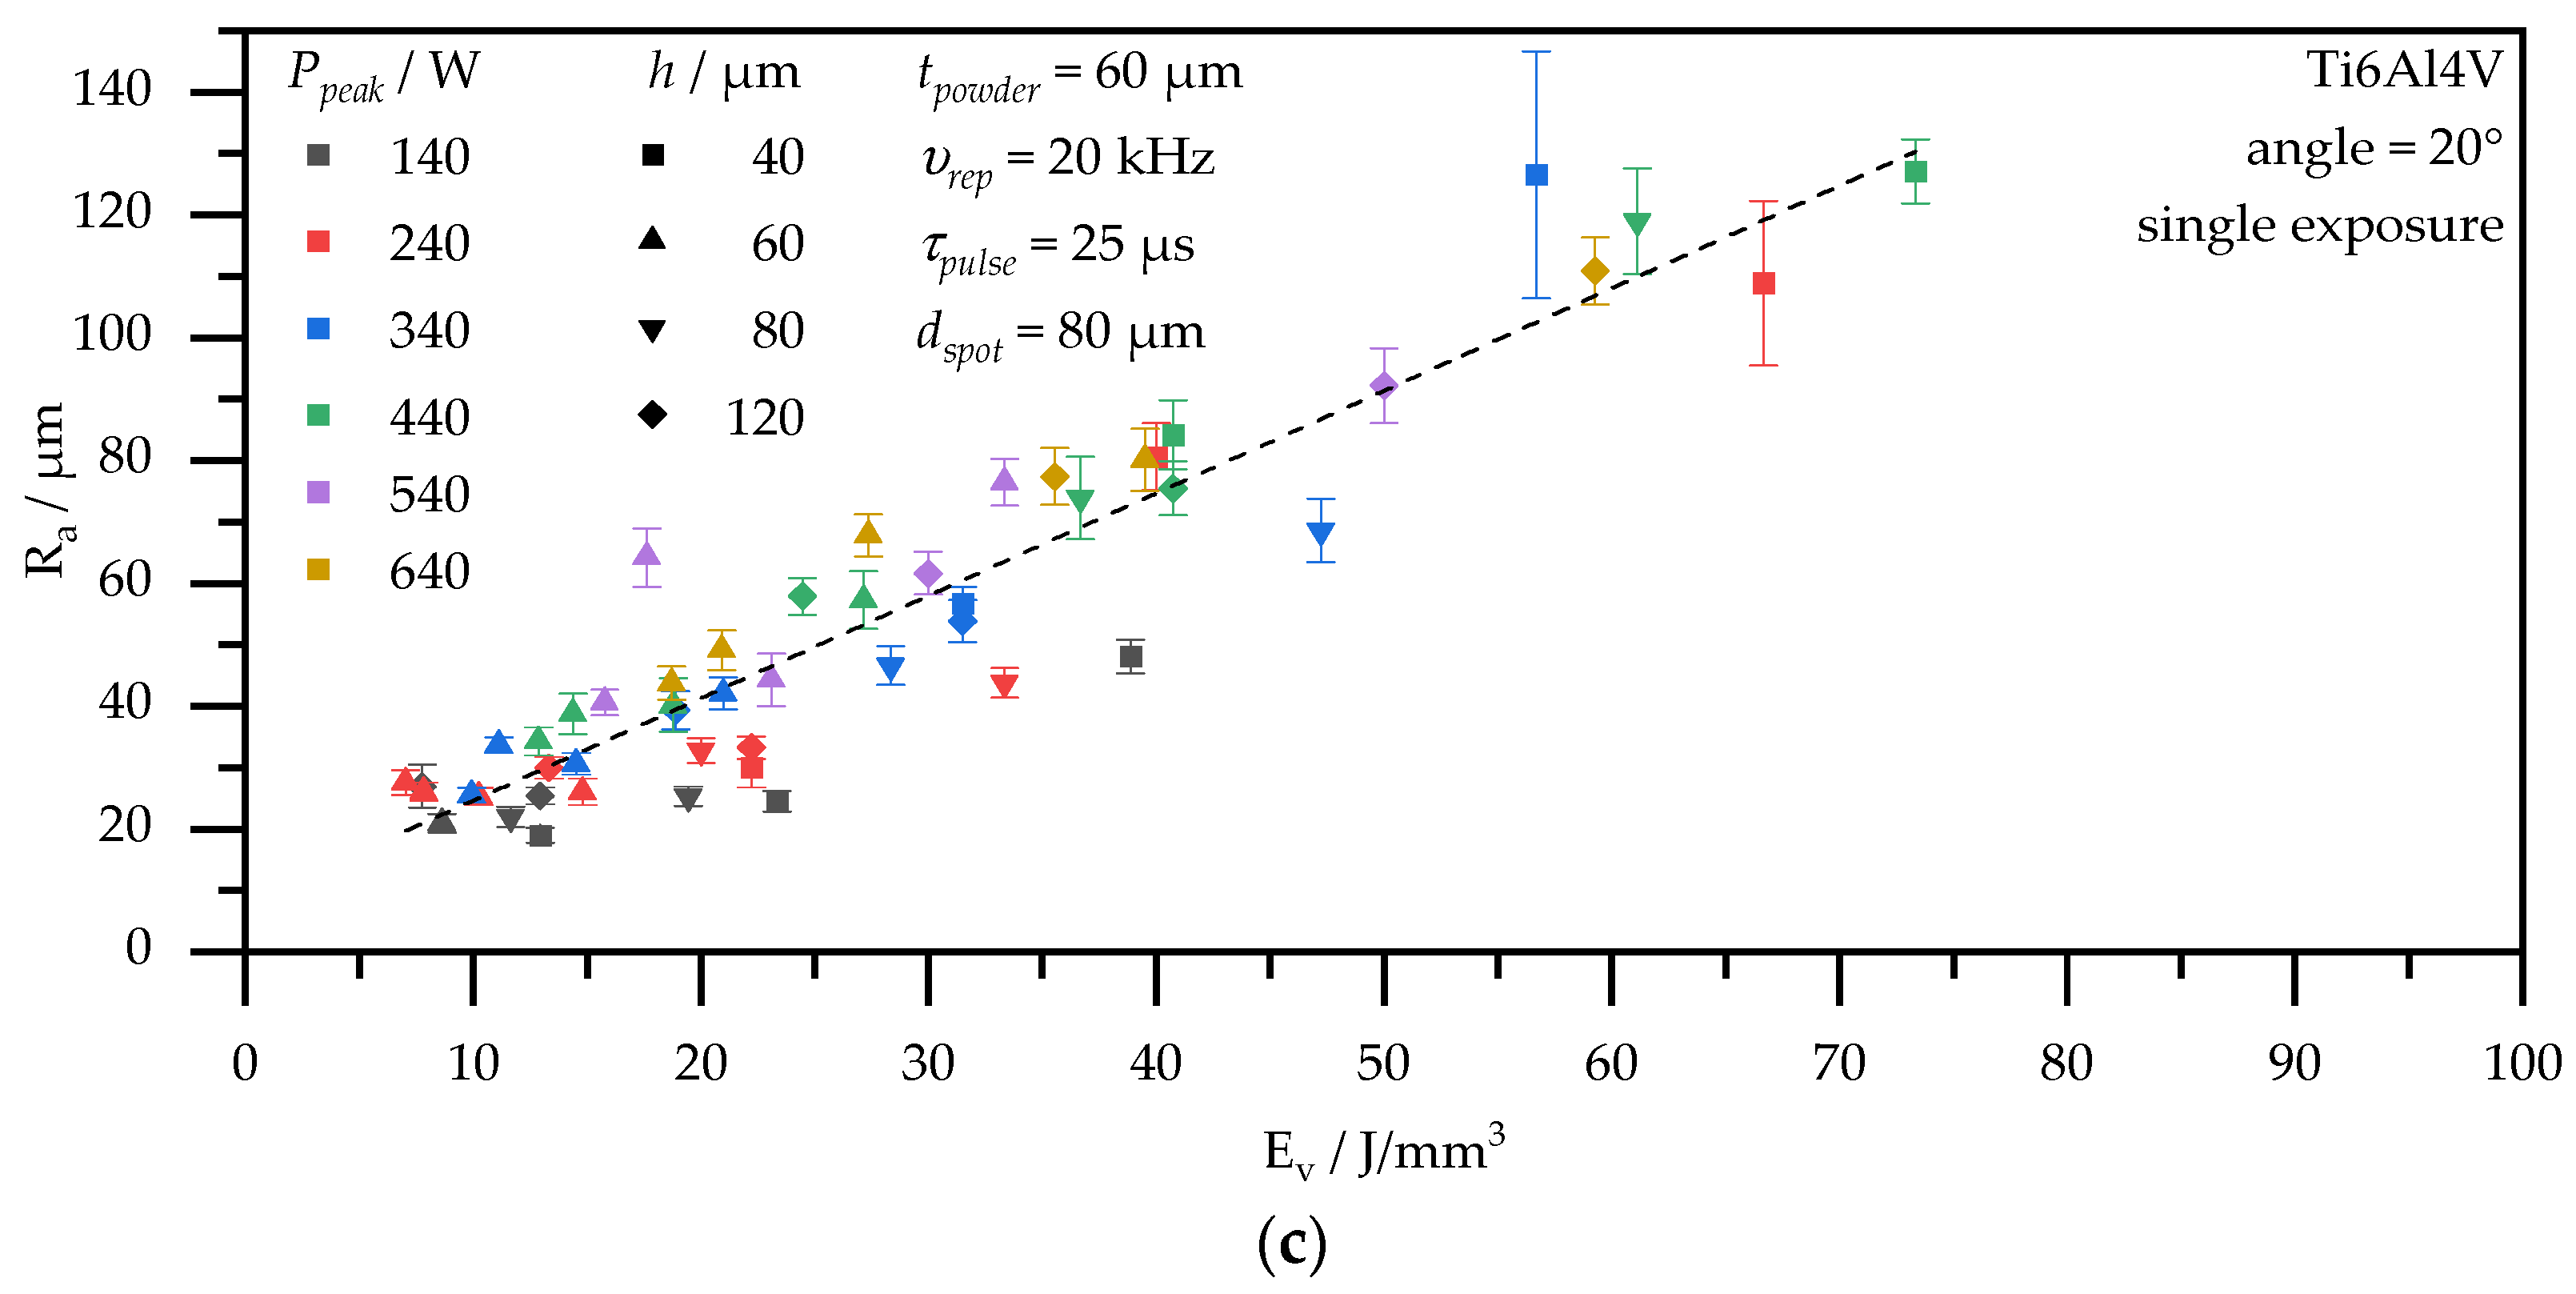
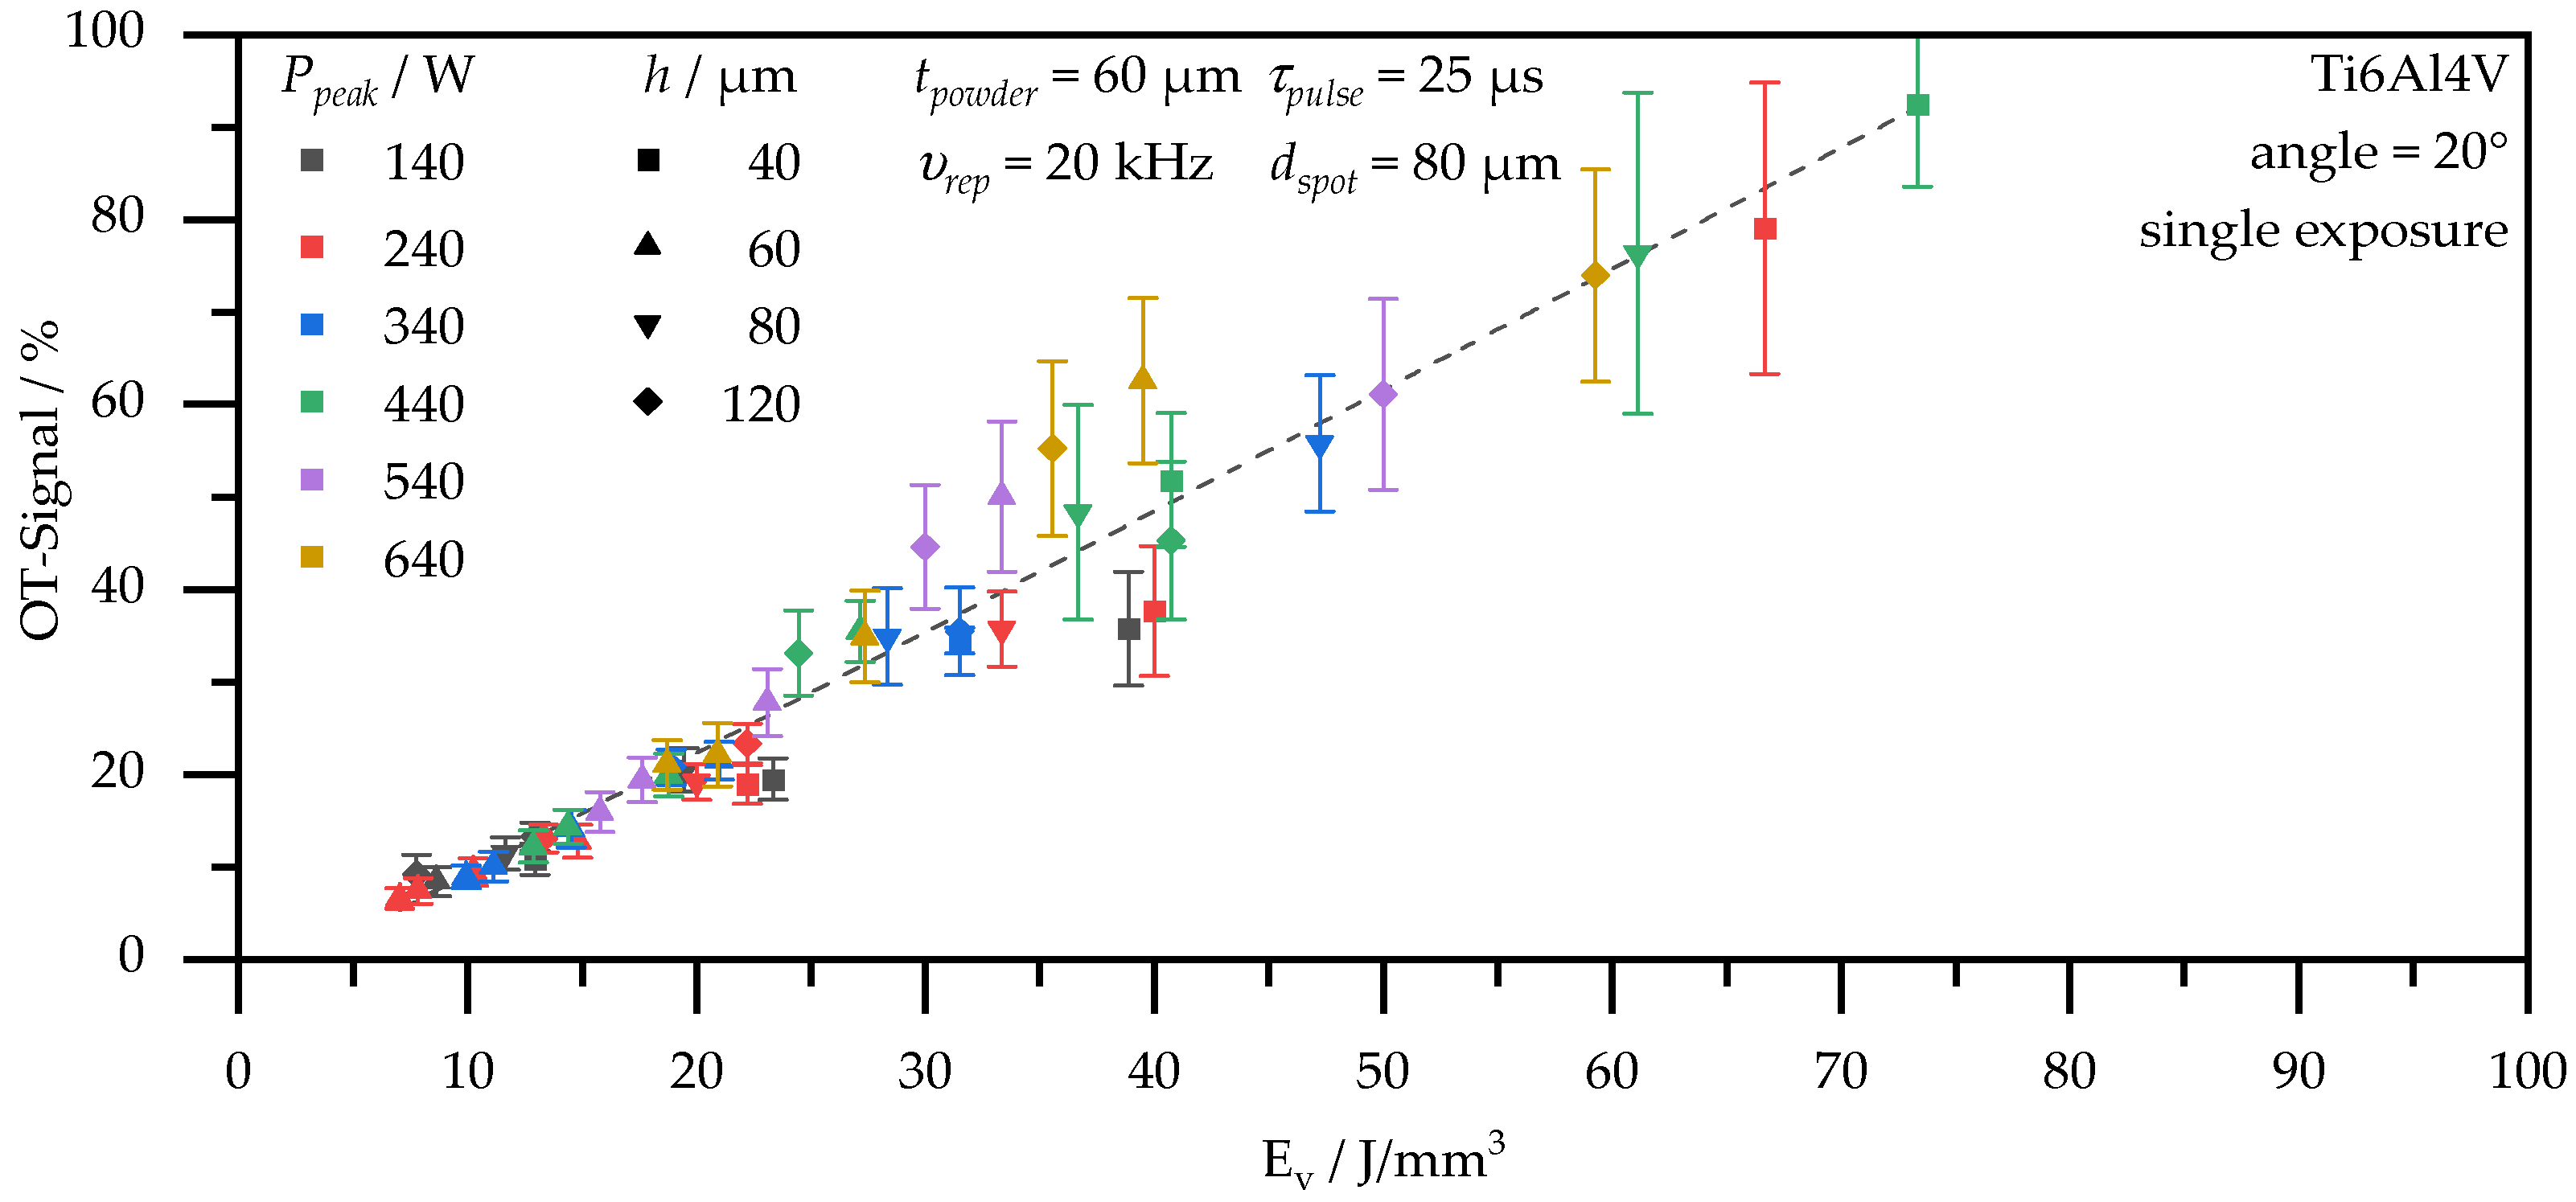
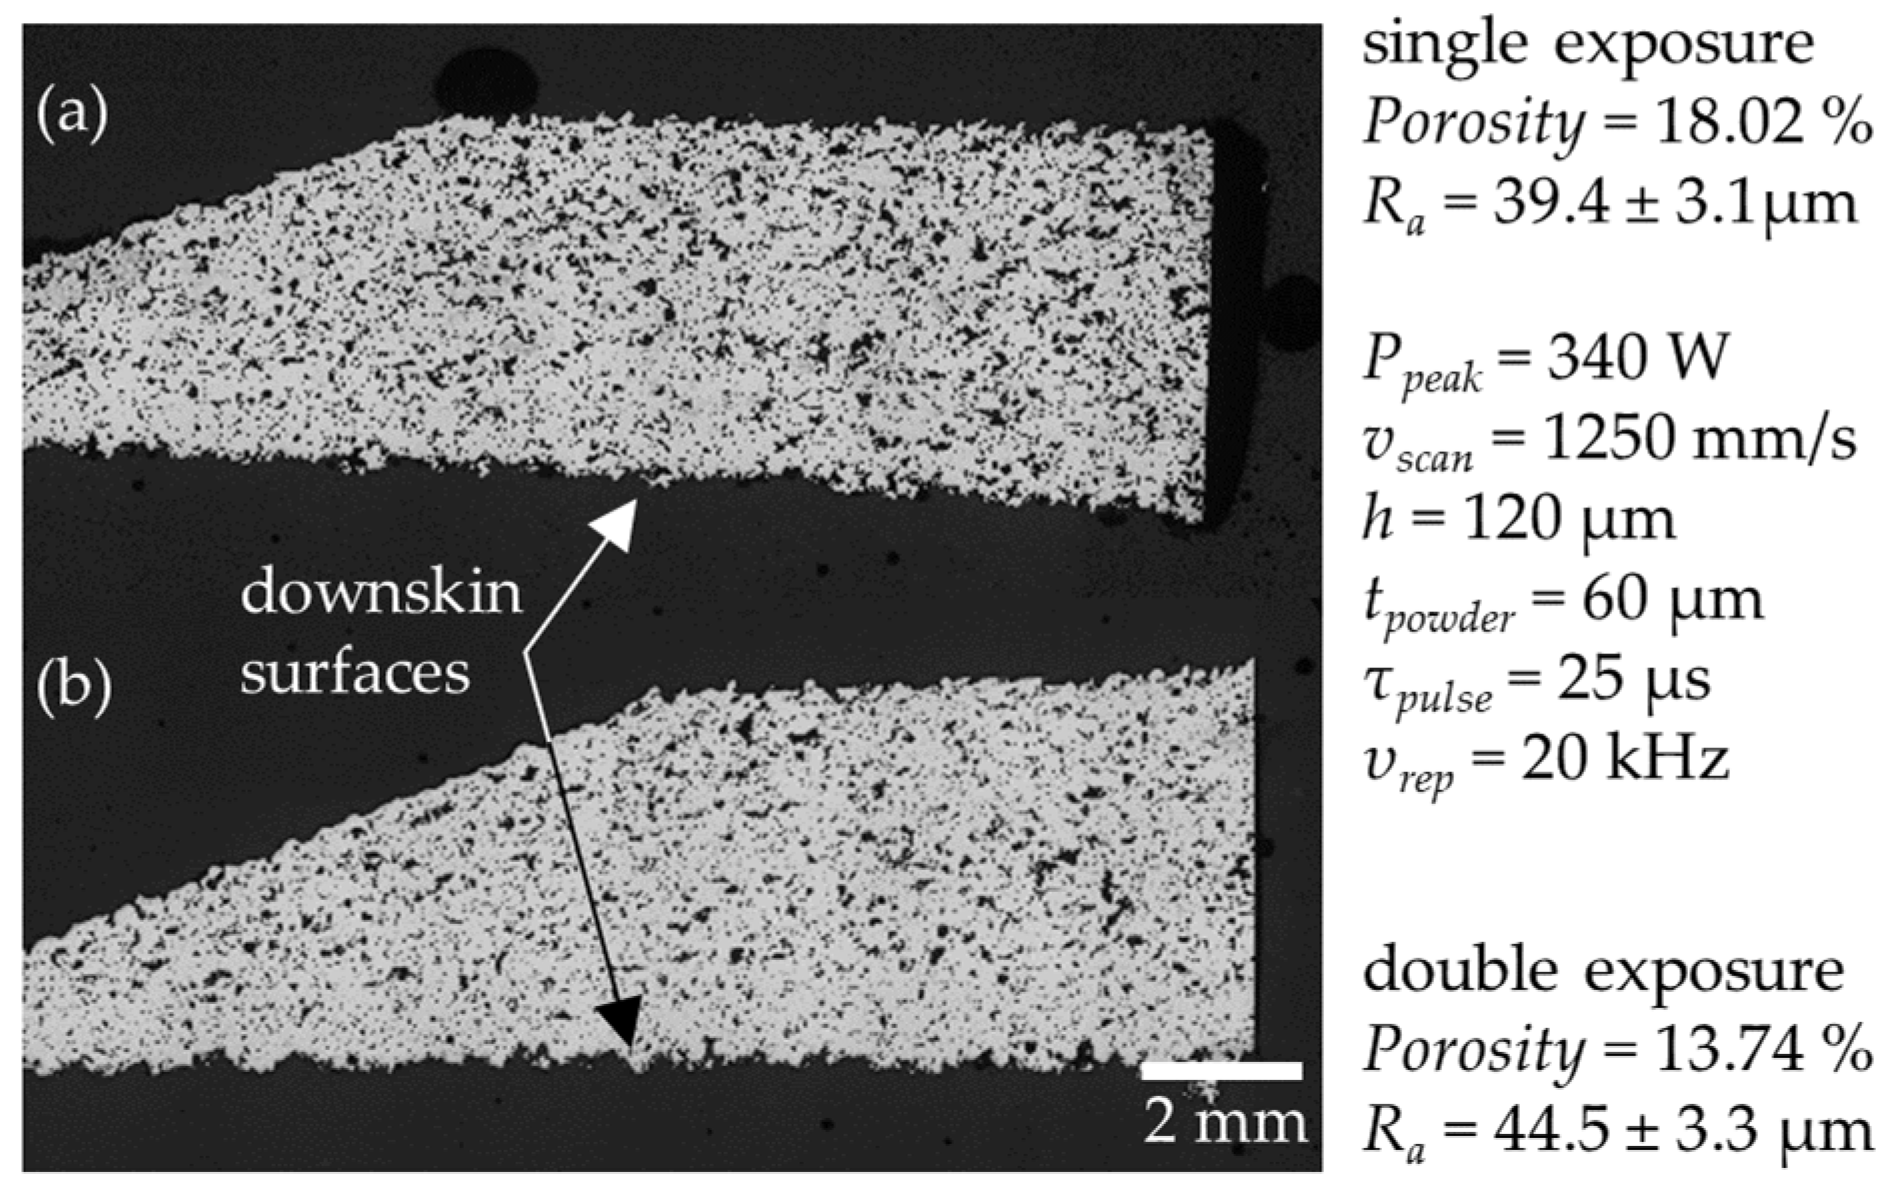
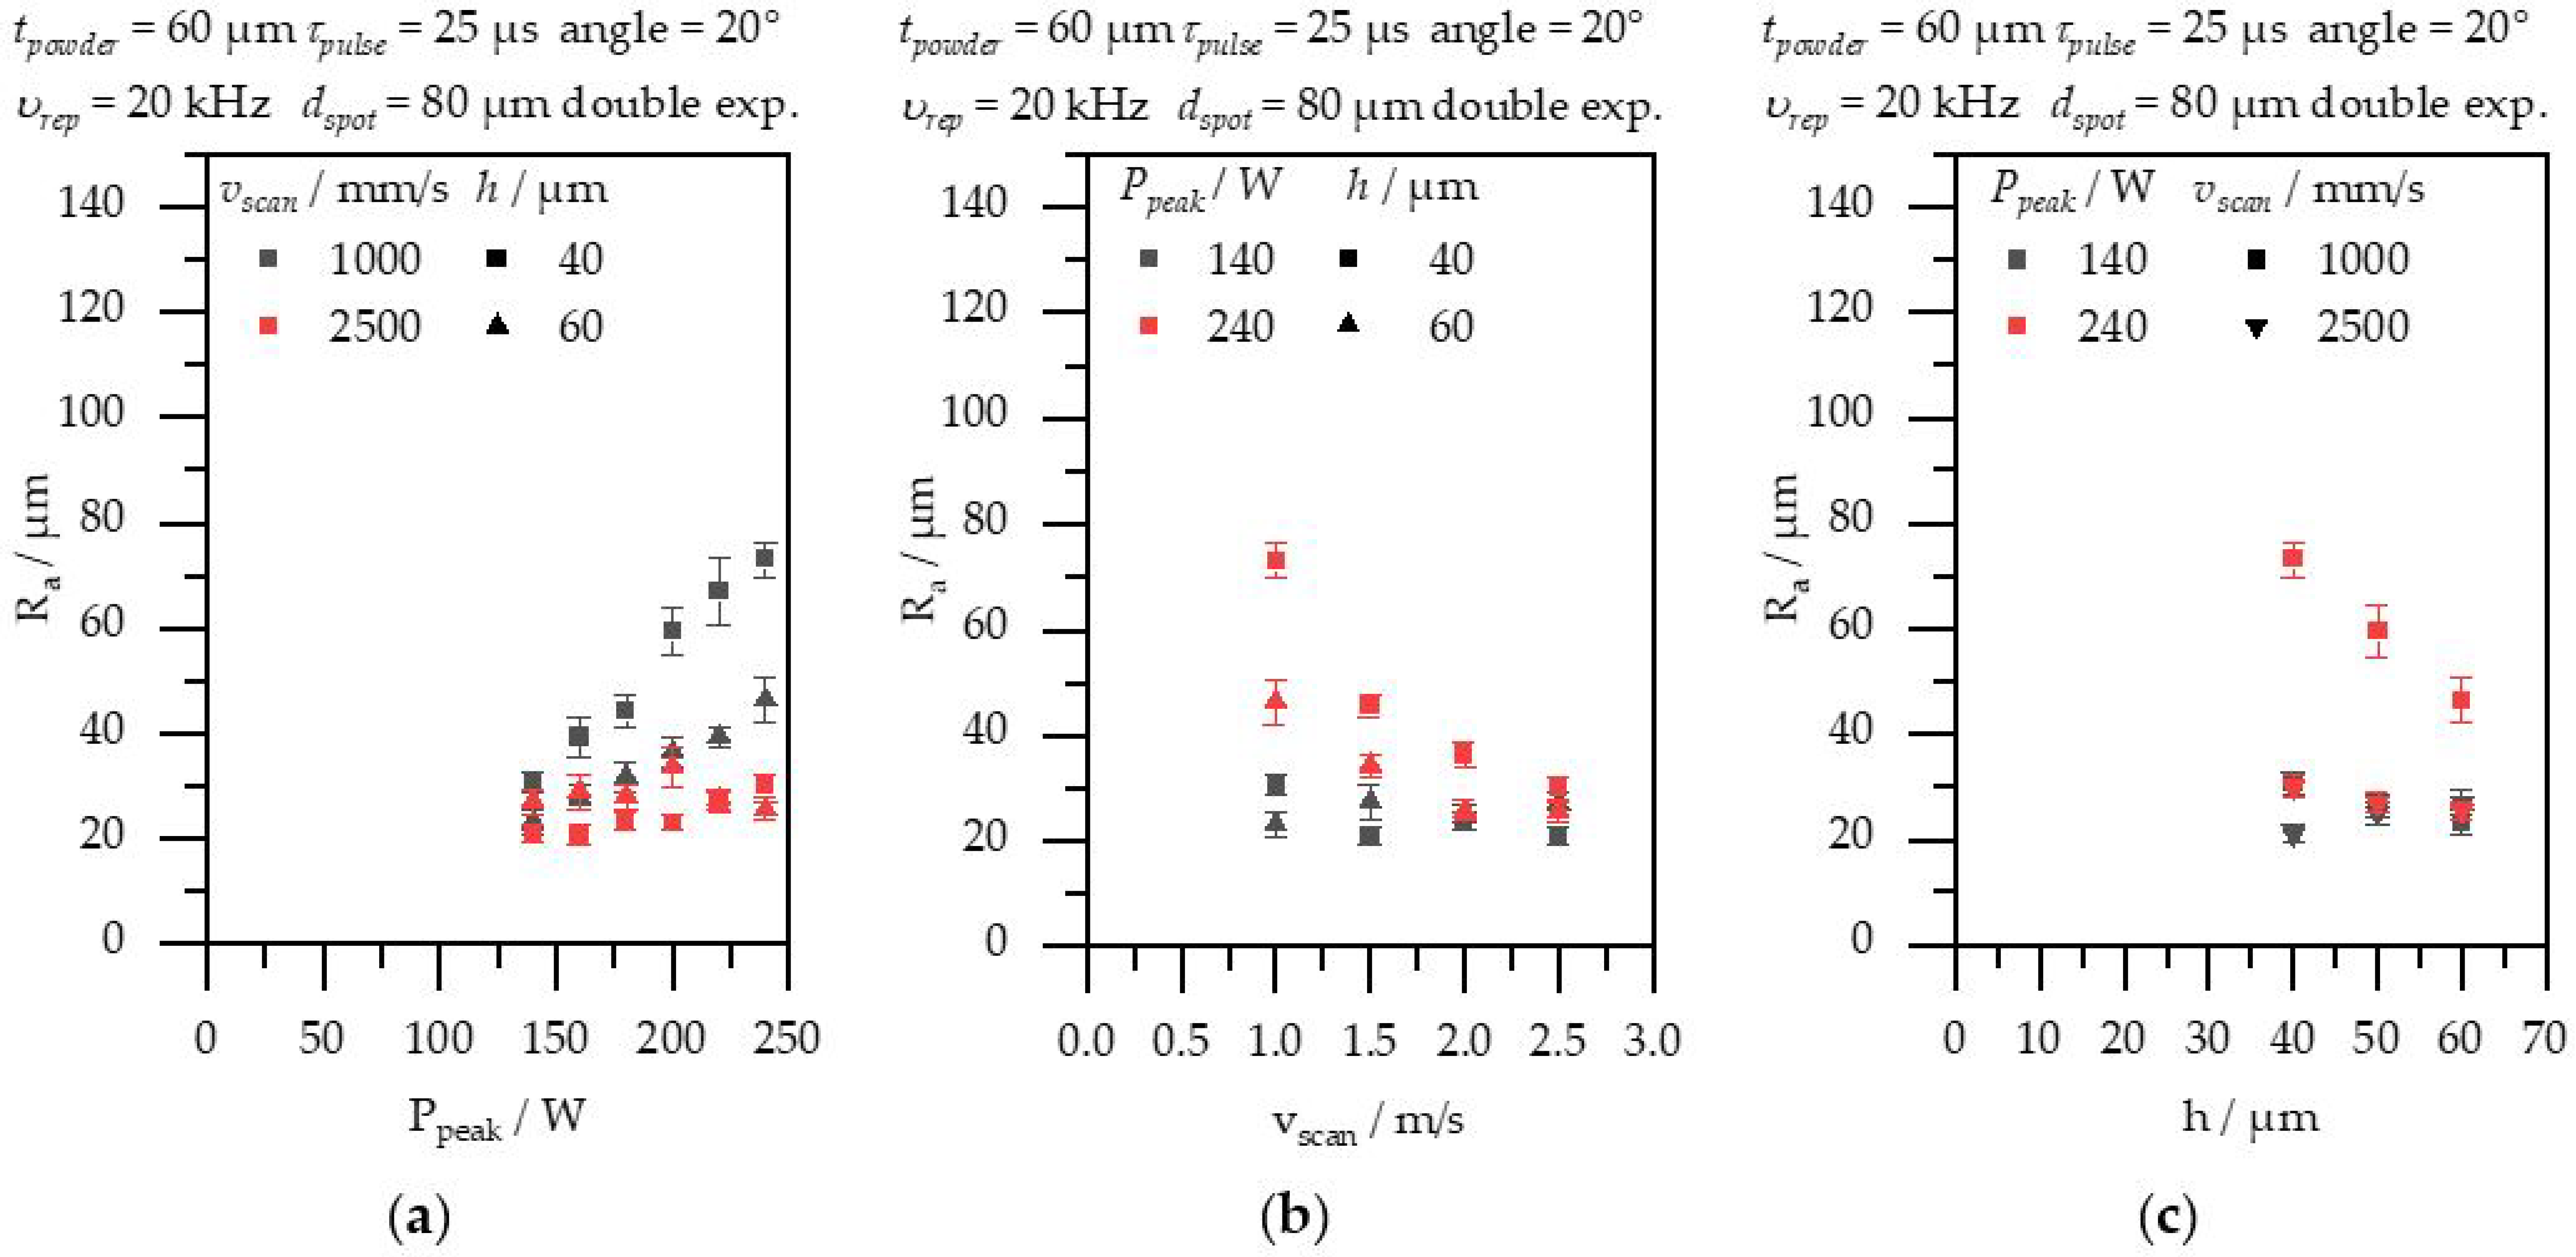
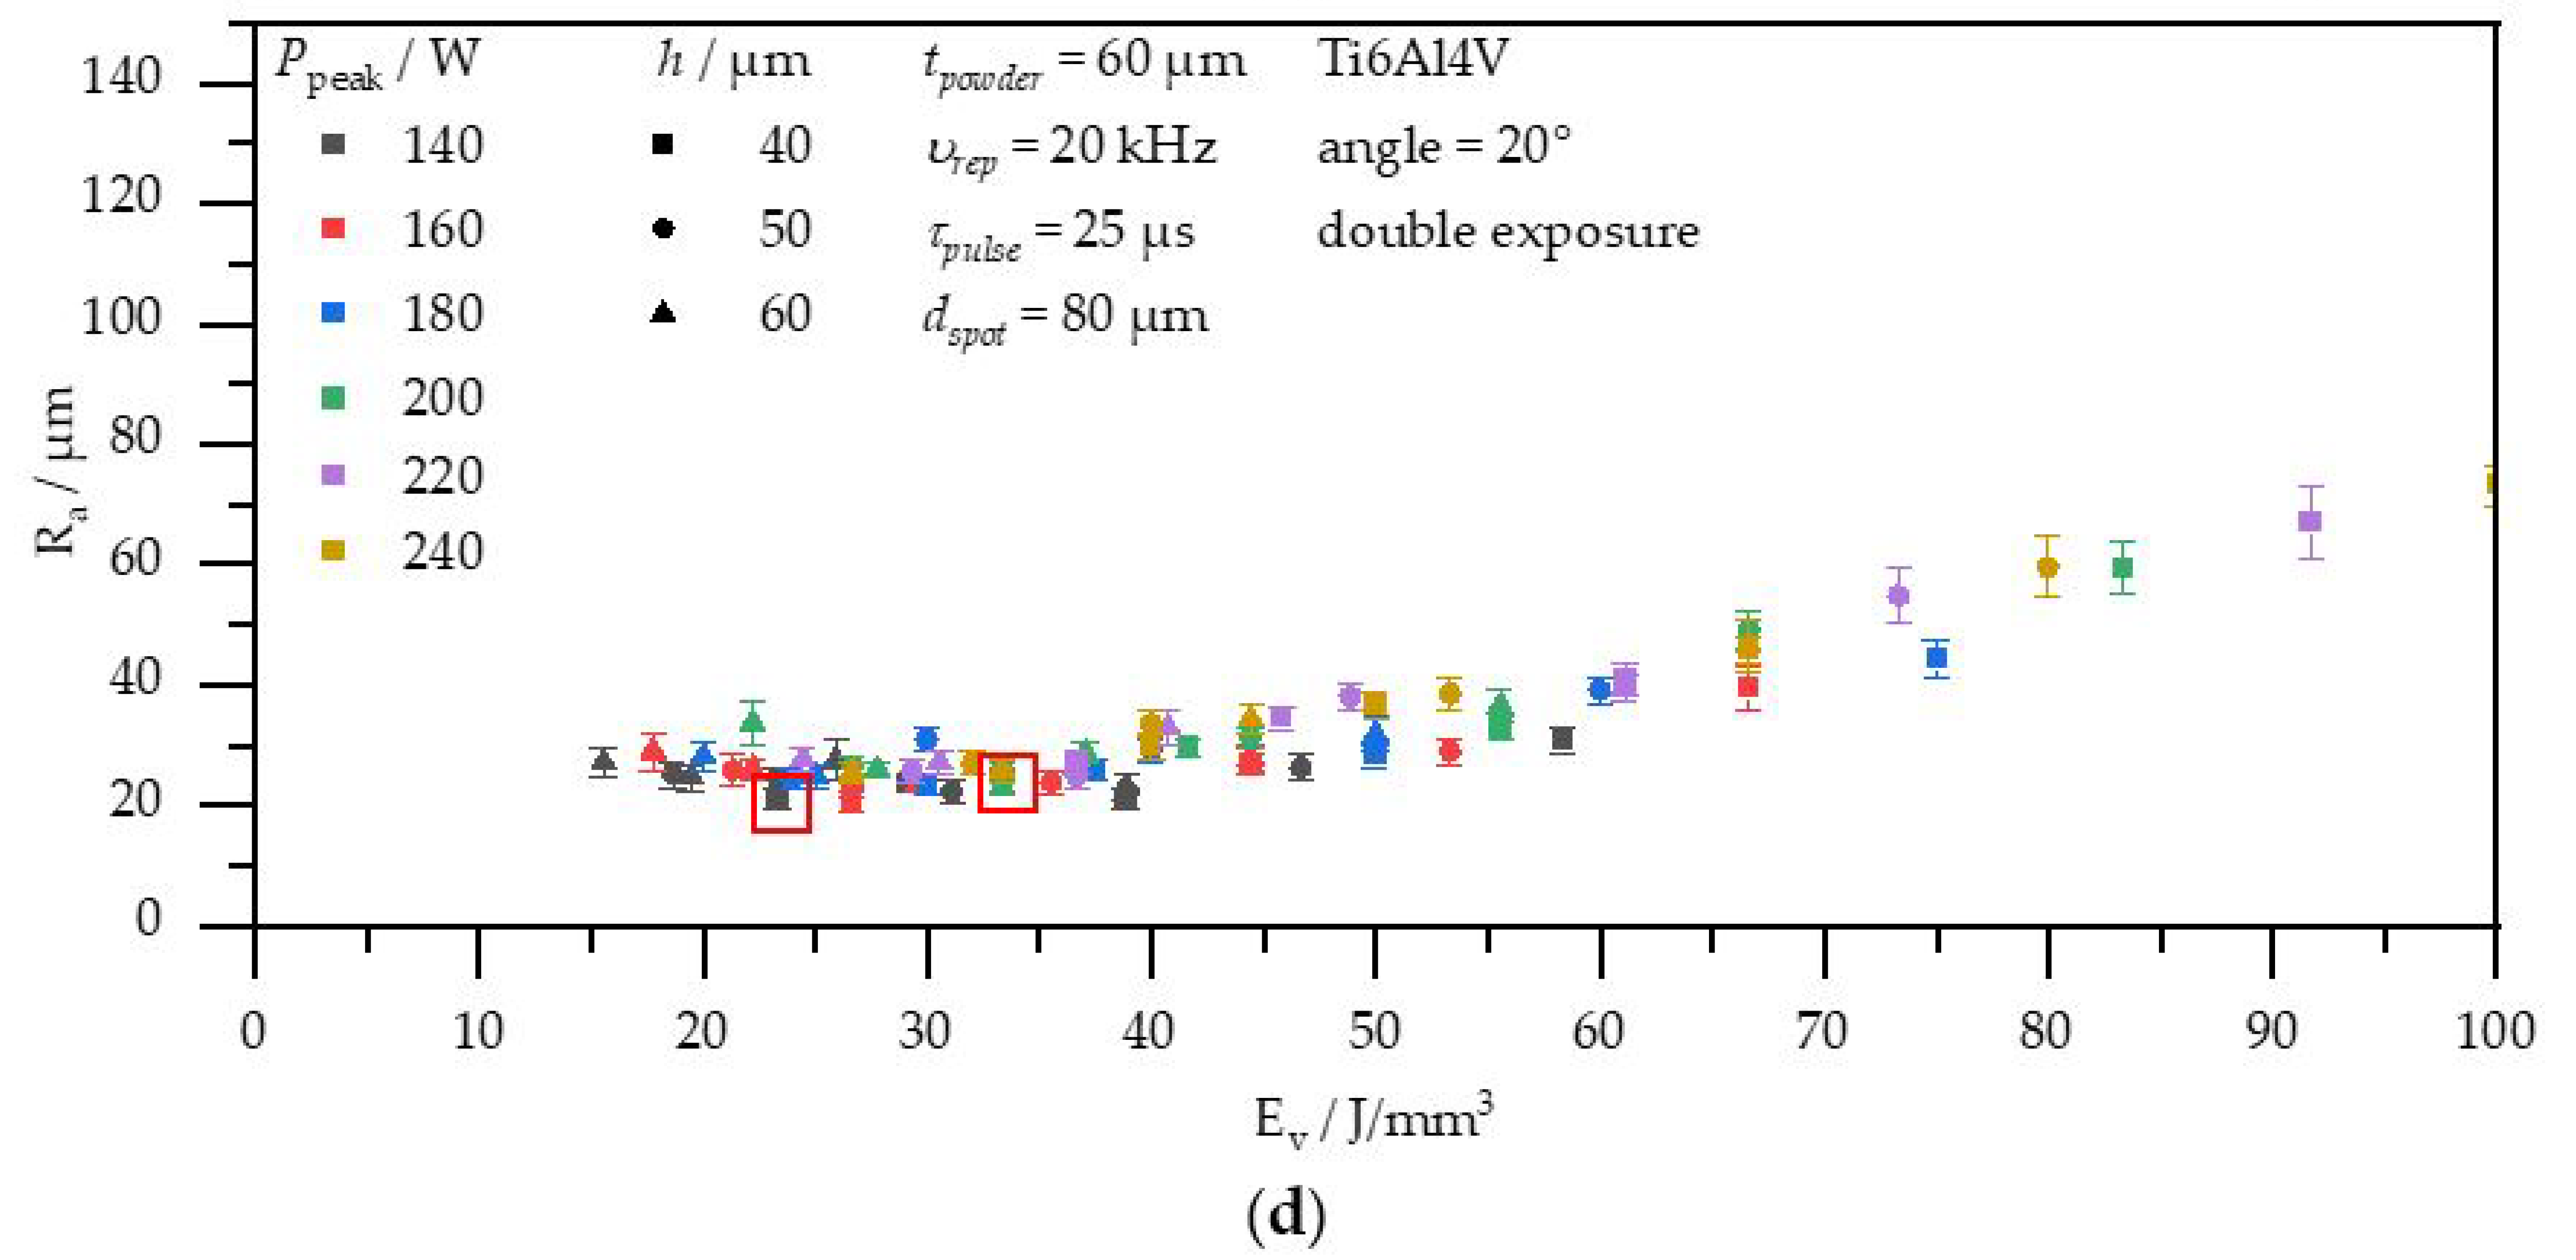
4.2. Pulsed Exposure Strategies

The pulsed exposure test series (see Section 3.4.) confirms that the reduction of the introduced volume energy density Ev also causes a reduction of roughness even with pulsed exposure.
Figure 6 shows the results of the single-pulsed exposure test series. The measured roughness values Ra at the downskin surfaces of 20° overhang structures are presented as a function of power P (a), scan speed v (b), and volume energy density Ev (c) calculated according to Equation (4). For the sake of clarity, only parameter combinations with hatches h = 60, 120 µm are shown in Figure 6a,b. As the hatch distances h are adjusted to power, scan speed, and volume energy density (see Section 3.4), they are not shown in a separate diagram. Figure 6c summarizes all tested parameter combinations. For volume energy densities Ev < 7 J/mm³, the applied energy is not sufficient to produce adequate material cohesion. Corresponding parameter sets are thus not considered further.
Figure 6a,b show increasing roughnesses Ra for increasing laser power Ppeak and decreasing scanning speed vscan. Summarizing the varied and constant process parameters into the volume energy density (see Equation (4)), it can be seen in Figure 6c that volume energy densities Ev and roughnesses Ra are strongly correlated. High volume energy densities Ev lead to high roughnesses Ra.
At similar volume energy densities Ev, parameter sets with low power (especially P = 140, 240 W) lead to low roughness values. As published by Demir et al. [2] and Laitinen et al. [8], pulsed exposures lead to narrower melt tracks owing to shorter interaction times of laser and material. This suggests that, without adjusting the hatch to h < 120 µm, there is an insufficient overlap of individual melt tracks. In order to ensure sufficient overlap of adjacent melt tracks, and thus enable low roughness and theoretically dense components, the hatch distances have to be in a sufficiently low range. Assuming that the distance for two adjacent pulses should also not be greater than a suitable hatch distance h ≤ 80 µm, Equation (3) shows that, for a pulse duration of τpulse = 25 µs and a pulse repetition rate of υrep = 20 kHz, a scan speed of vscan < 3200 mm/s must be used to achieve sufficient overlap between the pulses and melt tracks. Figure 6b shows that the roughnesses remain constant above this scan speed (with the exception of the samples produced with the laser power P = 640 W). This means that there is already a minimum of roughness. Increasing the scan speed above this value further decreases the volume energy density, potentially leading to an unnecessary increase in porosity.
Figure 7 shows the measured OT signals as a function of the volume energy density Ev. As can be seen, the introduced volume energy density and the signal delivered by OT are strongly correlated. As the volume energy density decreases, the standard deviation of the OT signal also decreases. Consequently, the introduction of lower volume energy densities Ev lowers the average temperature in the overhang structures during pulsed processes, resulting in smoother processes and lower roughness on the downskin surfaces of the test specimens. However, the lower energy input leads to increased porosities (see Figure 8). Using the parameter set shown in Figure 8 as an example, it can be found that double exposure has the potential to reduce porosity (by 23.8%) with increasing roughness (by 12.9%). For these reasons, the double exposure test series is designed as described in Section 3.4.
Figure 9 shows the results of the double-pulsed exposure test series. The values for the volume energy density are split into two exposure passes with identical parameters. The calculated total energy introduced is thus twice as high. As already mentioned, the energy introduced is not equal to the absorbed energy actually present in the process.
In Figure 9, the roughnesses are plotted as a function of laser power Ppeak (a), scan speed vscan (b), and hatch distance h (c) for two levels of the remaining parameters. Figure 9d summarizes all parameter combinations as volume energy density Ev and shows the roughness as a function of Ev. The level of roughness values Ra is significantly lower than in the more widely spread single exposure test series, which can be explained by the lower absorbed energy owing to double exposure. Figure 9a–c show that low powers Ppeak, high scan speeds vscan, and high hatch distances h tend to lead to small downskin roughnesses Ra. Summarizing these process parameters to volume energy density Ev confirms a correlation (see Figure 9d). It can be seen that the lowest roughnesses are achieved from volume energy densities of Ev ≈ 50 J/mm³. A further reduction of the volume energy density does not lead to lower values for roughness Ra. The roughnesses are in the volume energy density range between Ev ≈ 15 … 50 J/mm³ at a level between Ra ≈ 20 … 35 µm. Although double exposures contribute twice as much energy as single exposures, the results show that double exposures can achieve very low roughness values on the downskin surfaces compared with a cw process or single exposures.
For the final investigation of the combination of pulsed and continuous exposure strategies, three parameter sets with low roughnesses of different powers, scan speed, hatches, and volume energy densities are selected (see red squares in Figure 9d).

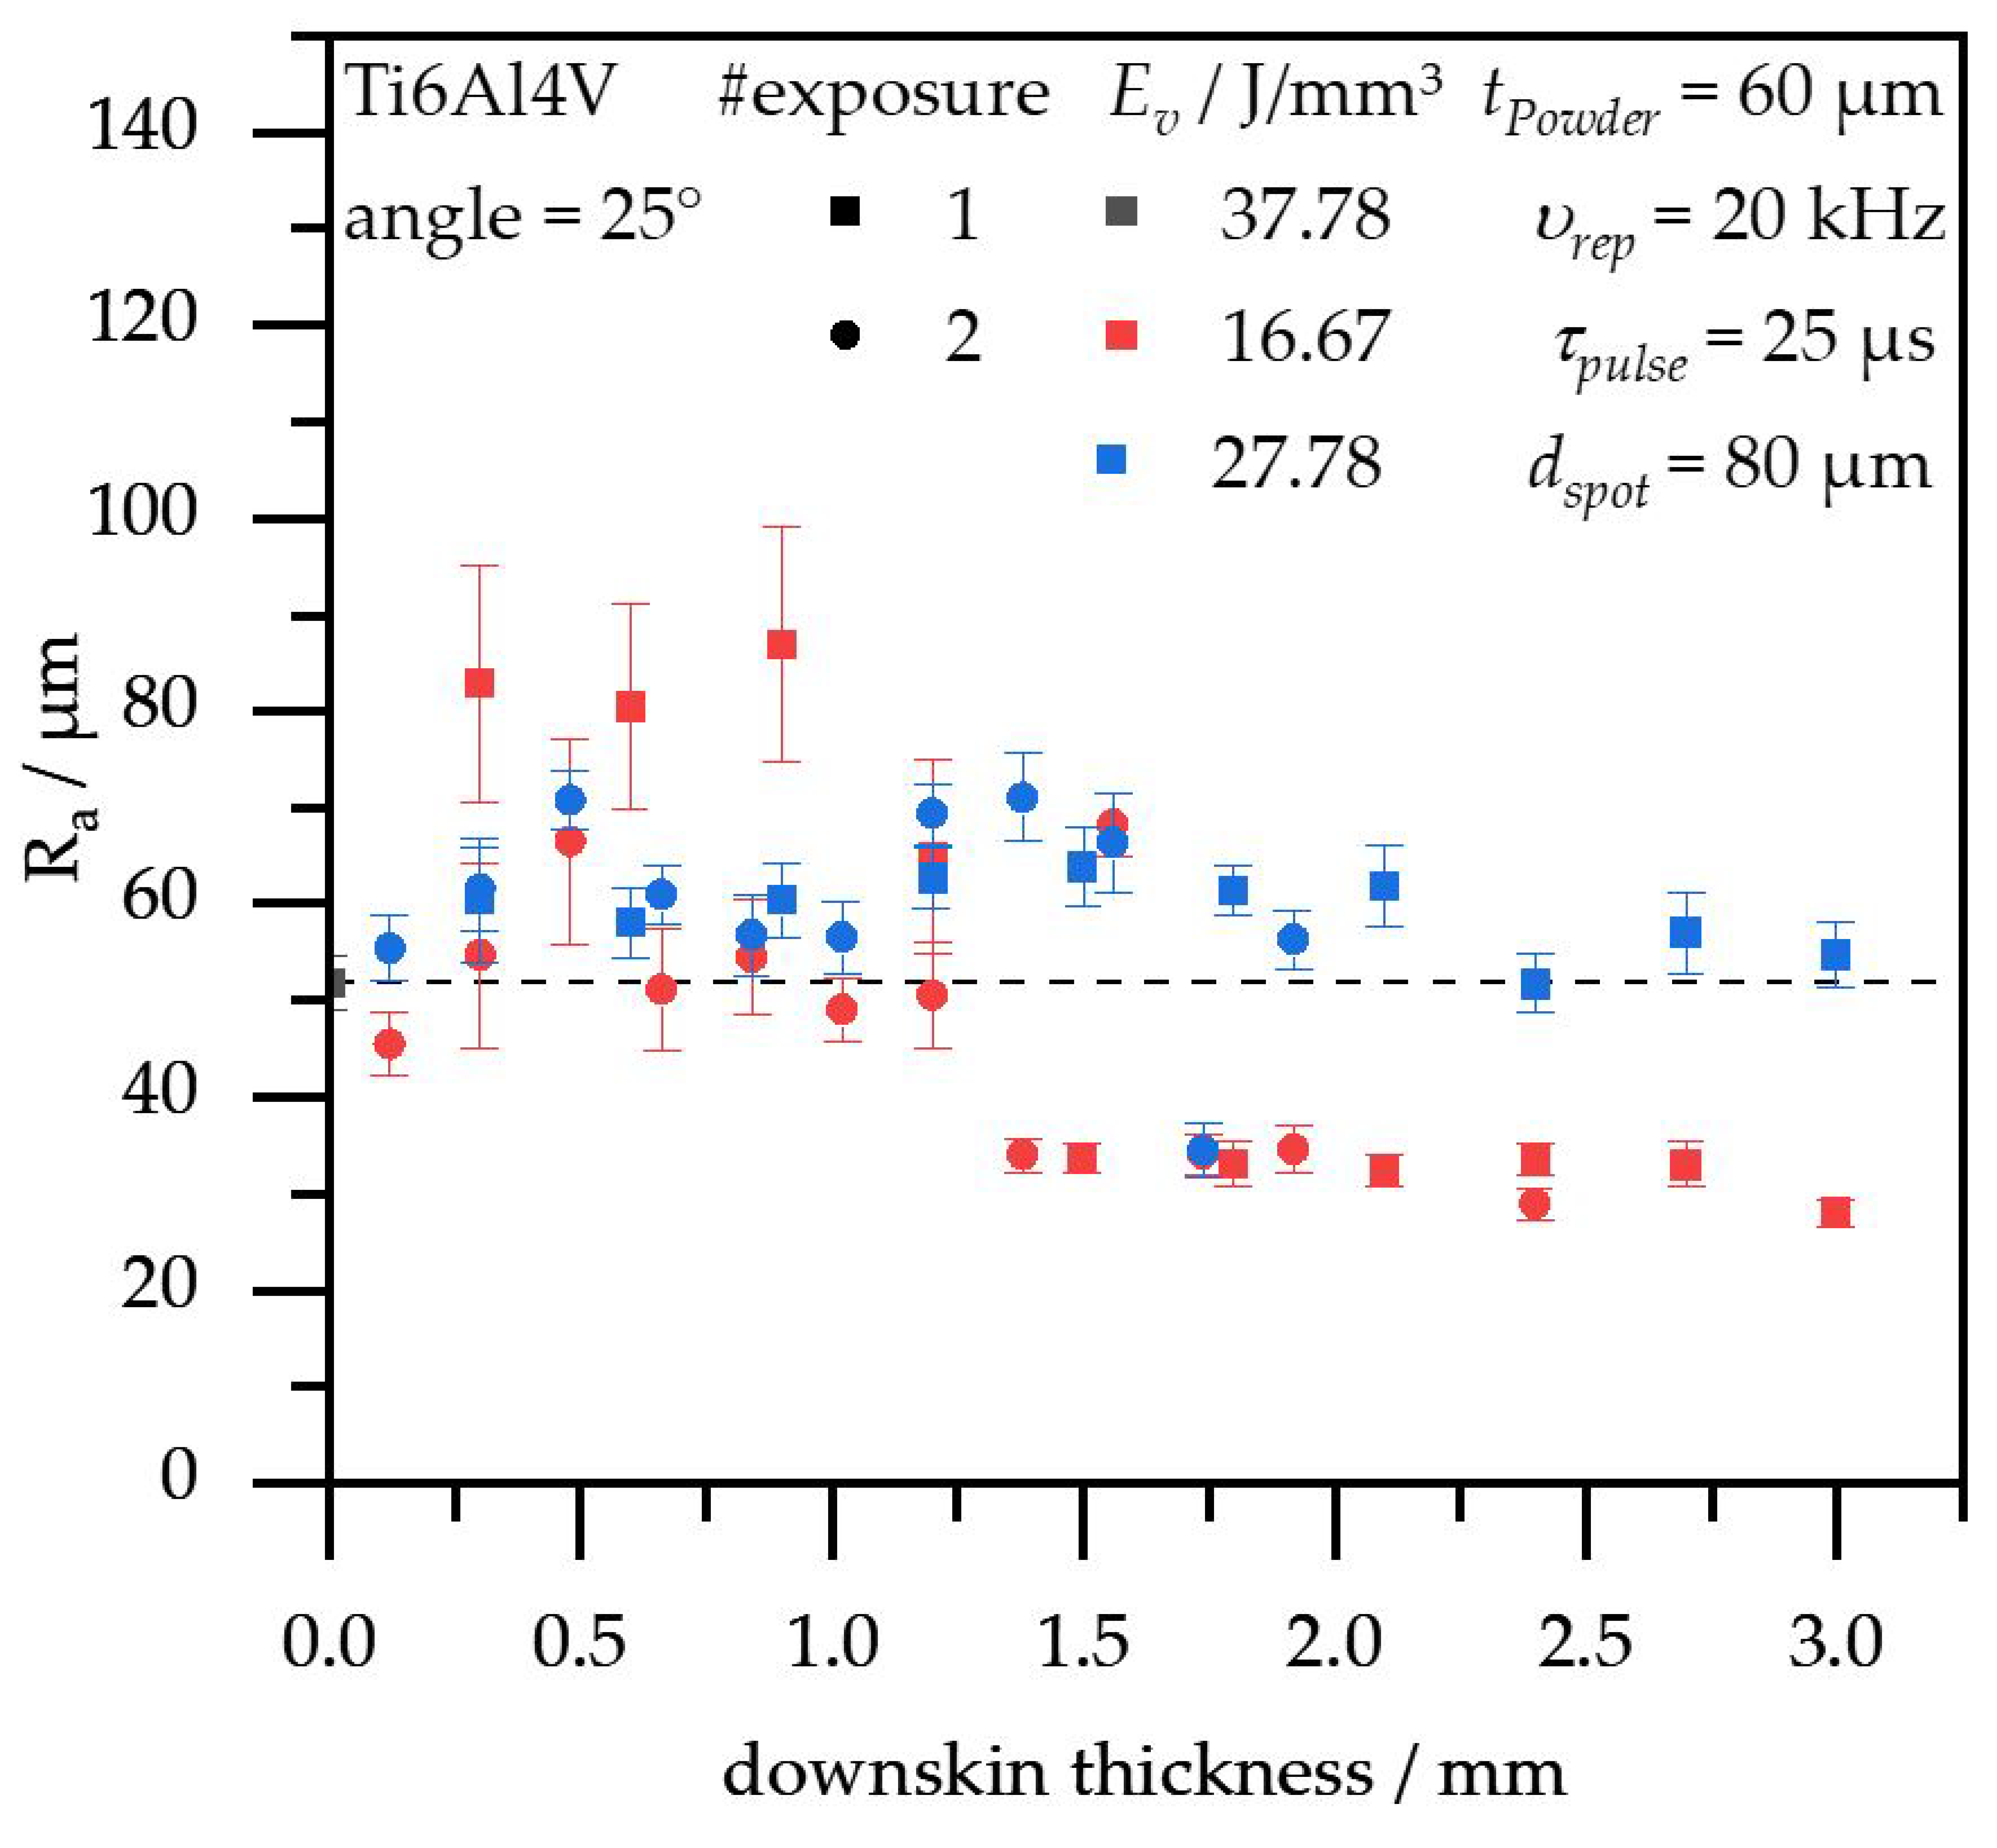
4.3. Combination of Pulsed Downskin and Continuous Wave Infill Parameters

When combining pulsed downskin with cw infill parameters (see Figure 3), the overhang structures with angles of 20° cannot be manufactured. For this reason, the results of the next steeper overhang angle (25°) are presented. With parameter set Downskin 1 (Ev ≈ 12 J/mm³), 25° angles are also not manufacturable (see exemplary Figure 10). Test specimens with parameter sets Downskin 2 and 3 (Ev ≈ 17, 28 J/mm³) can be manufactured regardless of the downskin thickness. Figure 11 shows the roughness as a function of the downskin thickness (see Figure 3). The commercial cw parameter set (Ev ≈ 38 J/mm³) is shown for reference as a vertical line and at 0 mm downskin thickness.
As can be seen, the roughness values increase for the combination of pulsed and cw parameters for thin downskin areas, especially for single exposure with Downskin 2 (Ev ≈ 17 J/mm³). The roughness values for the combination of cw infill and pulsed downskin with Downskin 3 (Ev ≈ 28 J/mm³) remain at a consistent level above the achievable roughness of cw parameters without separate downskin exposure, regardless of the downskin thickness used. The roughnesses of the downskin surfaces with Downskin 2 (Ev ≈ 17 J/mm³) exceed these values up to a downskin thickness of 1.2 mm. From a downskin thickness of ≥1.5 mm, the roughness reaches its minimum with this parameter combination and falls below the roughness values for the cw exposure without a separate downskin parameter.
One possible hypothesis is that the cw infill exposure introduces energy into the material at a level at which the heat capacity and thermal conductivity of the downskin region are no longer sufficient to dissipate the heat owing to the increased porosity. As a result, the downskin area overheats, which leads to increased roughness and, in extreme cases, even reduces the manufacturability of the specimen. The larger the gap between the energy densities, the higher the porosity in the downskin area, which intensifies the effect. This hypothesis is supported by the high roughnesses in single exposures with Downskin 2 (Ev ≈ 17 J/mm³). In these specimens, the double exposure presumably reduces the porosity, so that the increase in roughness is lower. Above a certain downskin thickness (approximately 1.3 mm in the example shown), the temperature at the interface between the powder bed and the downskin surface is no longer critical for roughness increase. As temperature increases occur in deeper layers, it cannot be detected with the existing system technology.

5. Conclusions

In this study, the influence of pulsed exposure strategies (τpulse = 25 µs, υrep = 20 kHz) on manufacturing of flat overhang structures and the roughness of corresponding downskin surfaces in powder bed fusion of Ti6Al4V using laser beam was investigated. Initially, it was found that a reduction in accumulated heat during cw exposure has the potential to reduce downskin surface roughness. The use of pulsed exposure strategies instead of cw also leads to reduced accumulated heat.
The results of this investigation can be summarized in the following key takeaways:
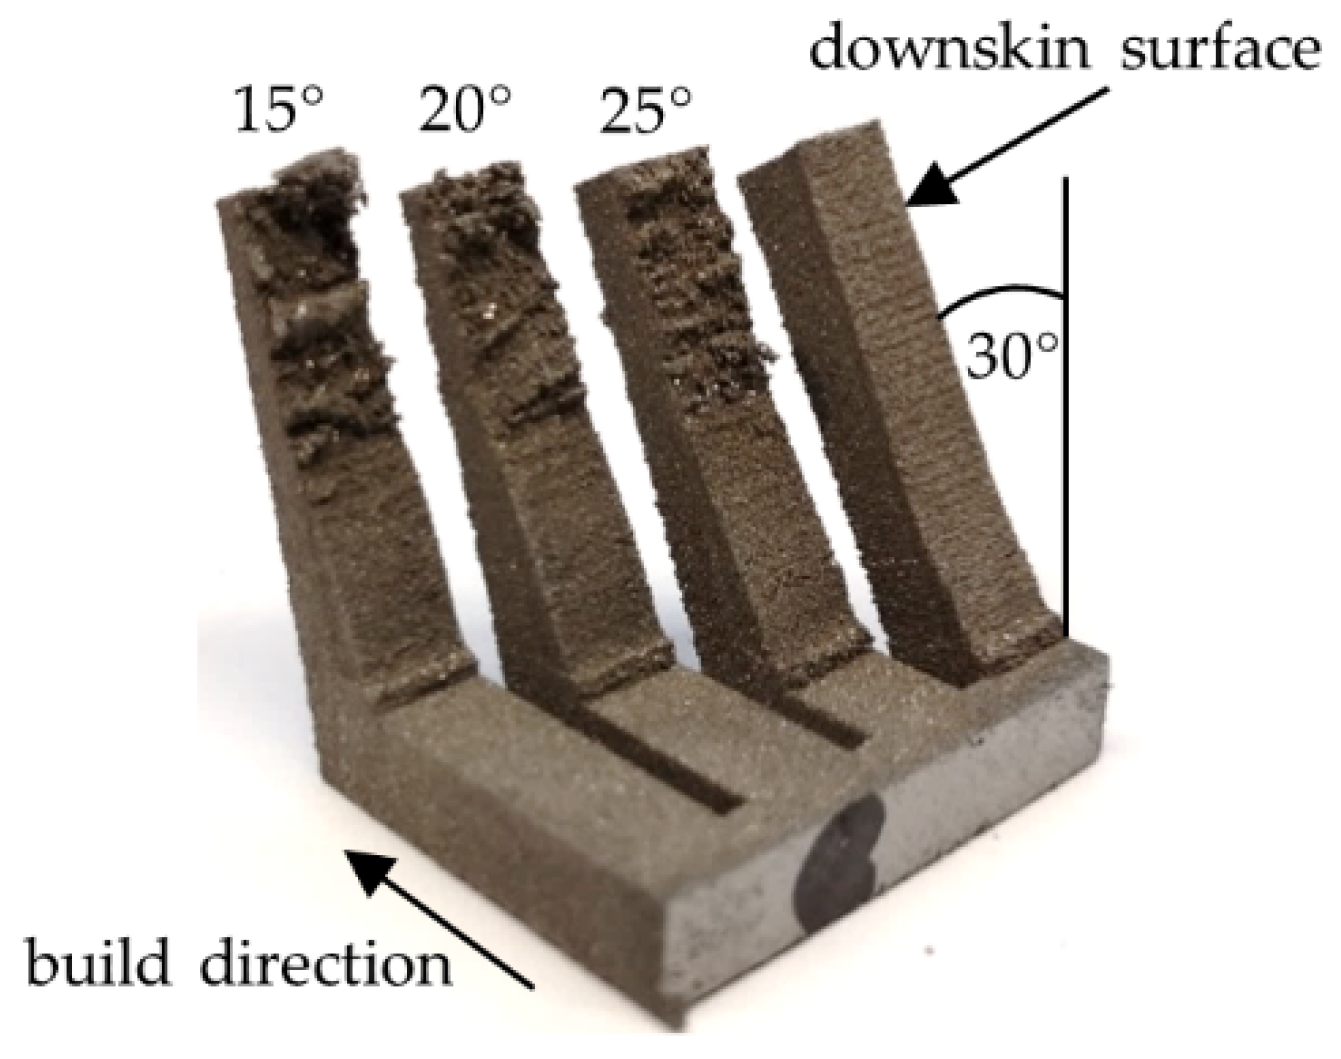
  • Pulsed exposure strategies with reduced volume energy densities enable manufacturing of flatter overhang structures down to <20° (pulsed) instead of 25° (cw).
  • In addition, pulsed exposure strategies lead to a reduction in roughness at the downskin surfaces down to Ra ≈ 20 µm (pulsed) instead of Ra ≈ 50 µm (cw).
  • When combining cw infill and pulsed downskin, heat accumulation and thickness of the downskin area must be considered to enable a decrease in roughness. A reduction of the overhang angle could not be shown owing to the high energy introduced in the infill.
In order to achieve low overhang angles and low downskin roughness at high component densities, a further research approach could be to increase the volume energy density from the downskin surface in a graded manner. Thus, the gap in energy densities and porosities between downskin and infill could be reduced.
In this study, pulse repetition rates and pulse durations were kept constant with υrep = 20 kHz and τpulse = 25 µs. The pulse durations, repetition rates, and their combination have an influence on the process and the process result [8]. Studies with varying pulse durations and repetition rates should thus be the subject of further investigations.
This study demonstrates the enormous potential that the use of pulsed exposure strategies offers in reducing and avoiding support structures.

Author Contributions

Conceptualization, J.G., R.S., and G.F.; methodology, J.G., P.C., and R.S.; validation, J.G. and P.C.; formal analysis, J.G. and P.C.; investigation, P.C.; resources, G.F.; data curation, J.G.; writing—original draft preparation, J.G.; writing—review & editing, J.G. and K.W.; visualization, J.G. and P.C.; supervision, G.F. and K.W.; project administration, J.G. and R.S.; funding acquisition, no additional/external funding. All authors have read and agreed to the published version of the manuscript.

Funding

This research received no external funding.

Data Availability Statement

The data presented in this study are available in the article.

Acknowledgments

This study was carried out in close cooperation with AMCM GmbH (an EOS group company). We thank AMCM for providing their infrastructure and materials as well as the great cooperation.

Conflicts of Interest

The authors declare no conflict of interest.

References

  1. Chou, R.; Milligan, J.; Paliwal, M.; Brochu, M. Additive Manufacturing of Al-12Si Alloy Via Pulsed Selective Laser Melting. JOM 2015, 67, 590–596. [Google Scholar] [CrossRef]
  2. Demir, A.G.; Colombo, P.; Previtali, B. From pulsed to continuous wave emission in SLM with contemporary fiber laser sources: Effect of temporal and spatial pulse overlap in part quality. Int. J. Adv. Manuf. Technol. 2017, 91, 2701–2714. [Google Scholar] [CrossRef]
  3. Karami, K.; Blok, A.; Weber, L.; Ahmadi, S.M.; Petrov, R.; Nikolic, K.; Borisov, E.V.; Leeflang, S.; Ayas, C.; Zadpoor, A.A.; et al. Continuous and pulsed selective laser melting of Ti6Al4V lattice structures: Effect of post-processing on microstructural anisotropy and fatigue behaviour. Addit. Manuf. 2020, 36, 101433. [Google Scholar] [CrossRef]
  4. Hopkinson, N.; Mumtaz, K. Top surface and side roughness of Inconel 625 parts processed using selective laser melting. Rapid Prototyp. J. 2009, 15, 96–103. [Google Scholar] [CrossRef]
  5. Hopkinson, N.; Mumtaz, K. Selective laser melting of Inconel 625 using pulse shaping. Rapid Prototyp. J. 2010, 16, 248–257. [Google Scholar] [CrossRef] [Green Version]
  6. Lee, H.; Lim, C.H.J.; Low, M.J.; Tham, N.; Murukeshan, V.M.; Kim, Y.-J. Lasers in additive manufacturing: A review. Int. J. Precis. Eng. Manuf.-Green Technol. 2017, 4, 307–322. [Google Scholar] [CrossRef]
  7. Caprio, L.; Demir, A.G.; Previtali, B. Influence of pulsed and continuous wave emission on melting efficiency in selective laser melting. J. Mater. Process. Technol. 2019, 266, 429–441. [Google Scholar] [CrossRef]
  8. Laitinen, V.; Piili, H.; Nyamekye, P.; Ullakko, K.; Salminen, A. Effect of process parameters on the formation of single track in pulsed laser powder bed fusion. Procedia Manuf. 2019, 36, 176–183. [Google Scholar] [CrossRef]
  9. Biffi, C.A.; Fiocchi, J.; Bassani, P.; Tuissi, A. Continuous wave vs pulsed wave laser emission in selective laser melting of AlSi10Mg parts with industrial optimized process parameters: Microstructure and mechanical behaviour. Addit. Manuf. 2018, 24, 639–646. [Google Scholar] [CrossRef]
  10. Chen, Z.W.; Guraya, T.; Singamneni, S.; Phan, M.A.L. Grain Growth During Keyhole Mode Pulsed Laser Powder Bed Fusion of IN738LC. JOM 2020, 72, 1074–1084. [Google Scholar] [CrossRef]
  11. Han, Q.; Gu, H.; Soe, S.; Setchi, R.; Lacan, F.; Hill, J. Manufacturability of AlSi10Mg overhang structures fabricated by laser powder bed fusion. Mater. Design 2018, 160, 1080–1095. [Google Scholar] [CrossRef]
  12. Calignano, F. Design optimization of supports for overhanging structures in aluminum and titanium alloys by selective laser melting. Mater. Design 2014, 64, 203–213. [Google Scholar] [CrossRef]
  13. Chen, Z.; Wu, X.; Tomus, D.; Davies, C.H. Surface roughness of Selective Laser Melted Ti-6Al-4V alloy components. Addit. Manuf. 2018, 21, 91–103. [Google Scholar] [CrossRef]
  14. Gong, H.; Rafi, K.; Gu, H.; Starr, T.; Stucker, B. Analysis of defect generation in Ti–6Al–4V parts made using powder bed fusion additive manufacturing processes. Addit. Manuf. 2014, 1–4, 87–98. [Google Scholar] [CrossRef]
  15. Cui, C.; Hu, B.; Zhao, L.; Liu, S. Titanium alloy production technology, market prospects and industry development. Mater. Design 2011, 32, 1684–1691. [Google Scholar] [CrossRef]
  16. Scharowsky, T. Grundlagenuntersuchungen zum Selektiven Elektronenstrahlschmelzen von TiAl6V4; FAU University Press: Erlangen, Germany, 2017; ISBN 978-3-96147-044-0. [Google Scholar]
  17. Boley, C.D.; Mitchell, S.C.; Rubenchik, A.M.; Wu, S.S.Q. Metal powder absorptivity: Modeling and experiment. Appl. Opt. 2016, 55, 6496–6500. [Google Scholar] [CrossRef] [PubMed]
  18. EOS GmbH—Electro Optical Systems. Material data sheet—EOS Titanium Ti64. Available online: https://www.eos.info/03_system-related-assets/material-related-contents/metal-materials-and-examples/metal-material-datasheet/titan/ti64/eos_ti64_9011-0014_9011-0039_m290_mds_11-17_en.pdf (accessed on 16 June 2021).
  19. Wang, Y.; Kamath, C.; Voisin, T.; Li, Z. A processing diagram for high-density Ti-6Al-4V by selective laser melting. Rapid Prototyp. J. 2018, 24, 1469–1478. [Google Scholar] [CrossRef]
  20. VDI Society Production and Logistics. Additive Manufacturing Processes, Rapid Manufacturing—Beam Melting of Metallic Parts—Qualification, Quality Assurance and Post Processing; Association of Engineers: Düsseldorf, Germany, 2013. [Google Scholar]
  21. Heinl, M.; Greiner, S.; Wudy, K.; Pobel, C.; Rasch, M.; Huber, F.; Papke, T.; Merklein, M.; Schmidt, M.; Körner, C.; et al. Measuring procedures for surface evaluation of additively manufactured powder bed-based polymer and metal parts. Meas. Sci. Technol. 2020, 31, 95202. [Google Scholar] [CrossRef]
  22. DIN Fundamental Technical Standards Committee. Geometrical Product Specifications (GPS)—Surface Texture: Profile Method—Terms, Definitions and Surface Texture Parameters (ISO 4287:1997 + Cor 1:1998 + Cor 2:2005 + Amd 1:2009); German Version EN (ISO 4287:1998 + AC:2008 + A1:2009); Beuth Verlag GmbH: Berlin, Germany, 2010. [Google Scholar]
Figure 1. Schematic view of the overlapping of the laser focus points, adapted from [2].
Metals 11 01125 g001
Figure 2. Schematic of the test specimens positioned on the base plate. (a) Test specimen with overhang thicknesses of 10 mm for cw exposure. (b) Test specimen with overhang thicknesses of 2.5 mm for cw exposure. (c) Test specimen with overhang thicknesses of 5 mm for pulsed exposure. (d) Test specimen with overhang thicknesses of 5 mm for combined pulsed and cw exposure.
Metals 11 01125 g002
Figure 3. Schematic of parameter combination in the infill and downskin area.
Metals 11 01125 g003
Figure 4. Design of build jobs with test specimens: cw exposure (a) and pulsed exposure (b).
Metals 11 01125 g004
Figure 5. Measured roughnesses Ra (a) and OT signal (b) with commercial cw process parameters with varying specimens, overhang angles, and layer times.
Metals 11 01125 g005
Figure 6. Measured roughnesses Ra of 20° angles with single exposure: Roughness Ra as a function of the laser peak power Ppeak (a), scan speed vscan (b) and volume energy density Ev (c).
Metals 11 01125 g006aMetals 11 01125 g006b
Figure 7. Measured OT signals of 20° angles with broad varying powers, scan speeds, and hatch distances.
Metals 11 01125 g007
Figure 8. Comparison of porosities from single exposure (a) to double exposure (b).
Metals 11 01125 g008
Figure 9. Measured roughnesses Ra of 20° angles with double exposure: Roughness Ra as a function of the laser peak power Ppeak (a), scan speed vscan (b), hatch distance h (c) and volume energy density Ev (d).
Metals 11 01125 g009aMetals 11 01125 g009b
Figure 10. Photograph of test specimen with combined cw (Ev ≈ 38 J/mm³) and pulsed (Ev ≈ 12 J/mm³) parameters with a downskin thickness of 2.4 mm.
Metals 11 01125 g010
Figure 11. Measured roughnesses Ra of 25° angles with commercial cw infill parameter as a function of downskin thickness with pulsed parameters.
Metals 11 01125 g011
Table 1. z-coordinates and areas of evaluated optical tomography (OT) data.
Overhang ThicknessAnglesz-CoordinateArea in Pixels
5 mm20°8.40 mm35 × 105
2.5 mm and 10 mm25°27.12 mm36 × 66 and 70 × 179
2.5 mm and 10 mm30°26.52 mm33 × 66 and 70 × 170
2.5 mm and 10 mm35°21.00 mm28 × 66 and 70 × 150
2.5 mm and 10 mm40°15.72 mm23 × 66 and 70 × 117
Table 2. Summarized pulsed process parameter sets.
Hatch Distance h in µmPeak Power Ppeak in WScanning Speed vscan in mm/sPowder Layer Thickness tpowder in µmPulse Duration τpulse in µsPulse Repetition Rate υrep in kHzNumber of Exposures
40140, 2407506025201
40140, 240, 340, 4401250, 22506025201
60140, 240, 340, 440, 540, 6402250, 3250, 4250, 47506025201
80140, 240, 340, 440750, 12506025201
120140, 240, 340, 440, 540, 640750, 12506025201
40, 50, 60140, 160, 180, 200, 220, 2401000, 1500, 2000, 25006025202
Table 3. Summarized process parameters for the combination of cw and pulsed exposure.
NameHatch Distance h in µmPeak Power Ppeak in WScanning Speed vscan in mm/sPowder Layer Thickness tpowder in µmPulse Duration τpulse in µsPulse Repetition Rate υrep in kHzVolume Energy Density Ev in J/mm³
Downskin 140140250060252012
Downskin 260240200060252017
Downskin 312034085060252028
InfillTi64_SpeedM291 1.1060cwcw38
Publisher’s Note: MDPI stays neutral with regard to jurisdictional claims in published maps and institutional affiliations.

