1. Introduction
The active development of the Arctic region justifies enhanced requirements for the mechanical properties of materials used for application in the cold climate. To solve this issue, in particular upon the construction of pipelines, steels of new generations (the X80 and X100 grades, or higher) are being designed, which are characterized by a continuously increasing ratio between ductility and strength [
1,
2]. Achieving high fracture resistance is possible due to the microstructure refinement by manufacturing processes that causes smaller bainitic grain sizes, reduced inclusion contents, etc. [
3].
However, high strength low alloyed steels (HSLA) of the X52 grade, which have been used in the pipeline construction for a long time, continue to be of interest. Their properties, especially impact toughness at low climatic temperatures, have to be improved. It is known that the X65 and X70 grade steels exhibit a high ductility-to-strength ratio, whereas the X100 ones have its lower level and their fracture is, typically, rather brittle. The above metallurgical (technological) aspects of increasing impact toughness at low climatic temperatures have also been discussed in various papers [
4,
5,
6]. A special role in improving this property is assigned to the bainite formation [
7]. Moreover, upper bainite, formed due to the presence of martensite–austenite (M–A) and an increased amount of low-angle lath boundaries, significantly decreases the ductility in these conditions.
To quantify crack resistance of a material, the ductile-brittle transition (DBT) temperature (DBTT) under impact bending test is applied [
8]. This parameter actually characterizes the permissible operating temperature range. In [
9], the microstructural aspects of embrittlement and toughening have been discussed in terms of the DBT. It has been shown that micro-voids hardly nucleate at fine M–A regions or carbides (they factually grow, but through bainite laths with high misorientation between them). Also, it is known from [
10] that the DBTT is not intrinsic to a material, but to a significant extent depends on the specimen type and test conditions, which actually determine the plastic constraint.
The DBTT aspect is typically discussed in relation to materials used in nuclear power plants [
11], since its development is due to aging through thermal and/or irradiation effects during long-term operation. Also, it is actively being studied for high-strength stainless pipeline steels. The key parameters that affect the DBT value are grain sizes, as well as the crack propagation direction relative to the boundaries of microstructural elements (determined by the rolling direction) [
12]. If strength of specimens cut at different angles to the rolling axis has not changed significantly, the DBTT is extremely sensitive to the predominant grain orientation. Thus, the targeted formation of the boundaries of microstructural elements (especially, high-angle ones) can be an effective way to control the DBTT.
Finally, many authors have discussed the DBTT aspect for relatively inexpensive stainless steels with low nickel contents [
13]. It has been shown that the DBT (as expected) is strongly affected by the crack propagation direction, depending on crystallographic texture and microstructural morphology. Moreover, the DBTT becomes extremely low in the case of fracture accompanying delamination.
Nowadays, “strain nano-technologies” [
14] are being actively developed that based on the formation of micro-scale structural elements in metals and alloys, according to the ‘top-bottom’ principle. It has been shown that (a) the Hall–Petch law on the relationship between grain sizes and yield stresses ceases to be fulfilled in the dimension range below 10 nm; (b) it is not necessary to reduce the sizes of all microstructural elements below the “generally accepted” threshold of 100 nm to ensure high strength properties and maintain acceptable plasticity [
15], but it is important to form a hierarchically organized microstructure in this case [
16]. In addition, one of the critical factors is the strong interaction of the microstructural elements with each other. This causes an increase in strength and excludes rapid strain localization processes.
Within this formulation of the problem, a promising direction is associated with the formation of “heterogeneous materials”, which is widely discussed in recent papers in the field of materials science [
17]. It should be noted that all structural materials are inherently heterogonous in one way or another. According to [
18], the principles of the heterogonous microstructure formation are determined both by the available technologies for processing metals and alloys, and by the possibility of its hierarchical alignment. Enhancing strength of these materials is achieved by heterogeneity of their microstructures, crystal structures, or compositions. The domain sizes can be in the range from micro- to millimeters, and their shapes vary to form very diverse material systems. Additional factors to ensure extraordinary strength and ductility are “back-stress strengthening and back-stress work hardening”. From the standpoint of the mechanisms providing the relaxation-ability of such materials, “statistically stored dislocations and geometrically necessary dislocations” are typically discussed.
At a higher (meso-scale) level, grain shapes and sizes, as well as texture and grain size variations, are crucial. The “lamellar microstructure with elongated soft coarse-grained domains embedded in the ultrafine grain matrix” is considered to be the “optimal” grain one [
19]. Thus, the principle of the hierarchical microstructure formation in the heterogeneous materials is determined by the back-stress produced due to dislocation pile-up at the domain boundaries, when their interface density is high. On the other hand, the spacing between them should be sufficient to ensure the possibility of dislocation strains. The authors have called this principle “strain partitioning among heterogeneous domains”, when the strain gradient increase the back-stress work hardening.
Undoubtedly, one of the factors limiting the widespread industrial use of the heterogeneous materials is the lack of high-performance procedures for the formation of such a microstructure.
The above-described principle of the lamellar microstructure formation at various scale levels is clearly illustrated in [
20]. It is shown that following the natural principles of the hierarchical microstructure alignment (like a seashell) enables to achieve high strength properties (with satisfactory ductility) for structural steels. This implies the formation of hierarchical sandwich microstructures, including gradient grain sizes, as well as both martensite and austenite phases. In this case, the lamellar microstructure has been observed both at the highest structural level (over the cross-sectional landscape of the material) and at the nano-scale (FCC austenite lamellae 5 nm wide alternate with 6 nm HCP martensite ones). It should be emphasized once again that the formation of such small microstructural elements does not suppress development of dislocation strain mechanisms even under conditions when grain sizes are about 20 nm.
Aspects related to the possibility of strength increasing with toughness retention (strength vs. toughness or hardness vs. ductility) for materials of various classes are discussed in a large number of papers (for example [
21,
22]) using the concepts of fracture mechanics. In [
23], transcrystalline fracture patterns are shown from the perspective of various scale levels as applied to structural steels. At the micro-level, it is proposed to use local fracture stress values to assess the local “work-of-fracture” parameter. Furthermore, at the nano-scale level, ahead of a sharp crack is proposed “to increase the compliance by a cooperative movement of atoms (involving extra work) to allow the crack-tip bond to displace sufficiently”. These representations are consistent with the plastic distortion mechanism considered in V.E. Panin’s paper [
24].
The formation of such a hierarchical microstructure, including the lamellar one, can be achieved using the radial–shear rolling procedure. The results of studies of the strain mechanisms for various materials subjected to this processing have been widely published recently [
25,
26,
27,
28,
29]. In all these papers, the importance of the lamellar microstructure formation in the conditions of multilevel structuring is noted for increasing strength and maintaining toughness of rolled bars.
A fairly complete review devoted to the formation of multiscale hierarchical microstructures, including hardening and providing ductility and plasticity by forming a laminate structure, is presented in [
30]. According to the authors, elastic modulus and yield strength obey the “rule of mean”. However, elongation and fracture toughness cannot be estimated by this principle. It is known that (for laminate composites) elongation is determined by a number of parameters: layer thickness, interface structure, gradient structure, strain hardening exponent, strain rate, etc. They, in turn, depend on crack deflection, blunting, and bridging, as well as stress redistribution, local plane stress deformation, and interfacial delamination cracking. Thus, the ideology of the formation of the laminate composites can be efficiently used to develop the heterogeneous materials with increased strength and toughness. In this case, the laminate microstructure can be formed at various structural levels.
In general, the implementation of the laminate microstructure as an effective way to improve fracture toughness can be traced to the example of the Egyptian pyramids [
31]. The laminate microstructure has shown particular efficiency in terms of increasing strength and toughness in the manufacture of bladed weapons such as Damascus steel, Japanese combat swords, etc. [
32]. In this case, the composites are formed from single base metals, while the layer-by-layer joining of stronger (for example, ultra-high carbon (UHC)) and more ductile (for example, Fe-3Si) steels is considered to be more efficient [
33].
A fairly detailed review of research results related to laminate metal composites (LMC) is presented in [
34]. It has been shown that one of the effective methods for the formation of such composites is accumulated roll bonding (ARB), and the highest both strength and toughness values are achieved by forming packets from materials with high and low strength. Numerous examples show that damage critical properties (fracture toughness, fatigue, and impact behavior) are largely depend on local delamination at the layer interfaces. In addition, the key factors that determine the mechanisms of distortion and failure are the parameters of the laminate formation, its ‘architecture’ and the microstructure of the layers and their interfaces.
It has been shown in [
35] that post-processing heat treatment of a twelve-layer “UHC steel/mild steel” composite significantly improves its impact toughness by enhancing strength at the layer interfaces during tests at a temperature of 79 °C.
One of the most effective methods of increasing the strength properties of conventional steels (for example, the X52 grade HSLA ones) is to form certain microstructures, phase compositions, and internal stresses in the bulk metal [
36]. Varying these parameters at the processing stage enables to obtain the required hardness, ductility, and crack resistance. Most often, processing includes heat treatment to form the optimal phase composition and plastic strain for additional hardening. Low-alloyed low-carbon steels of the pearlite class are best suited to such procedures [
37,
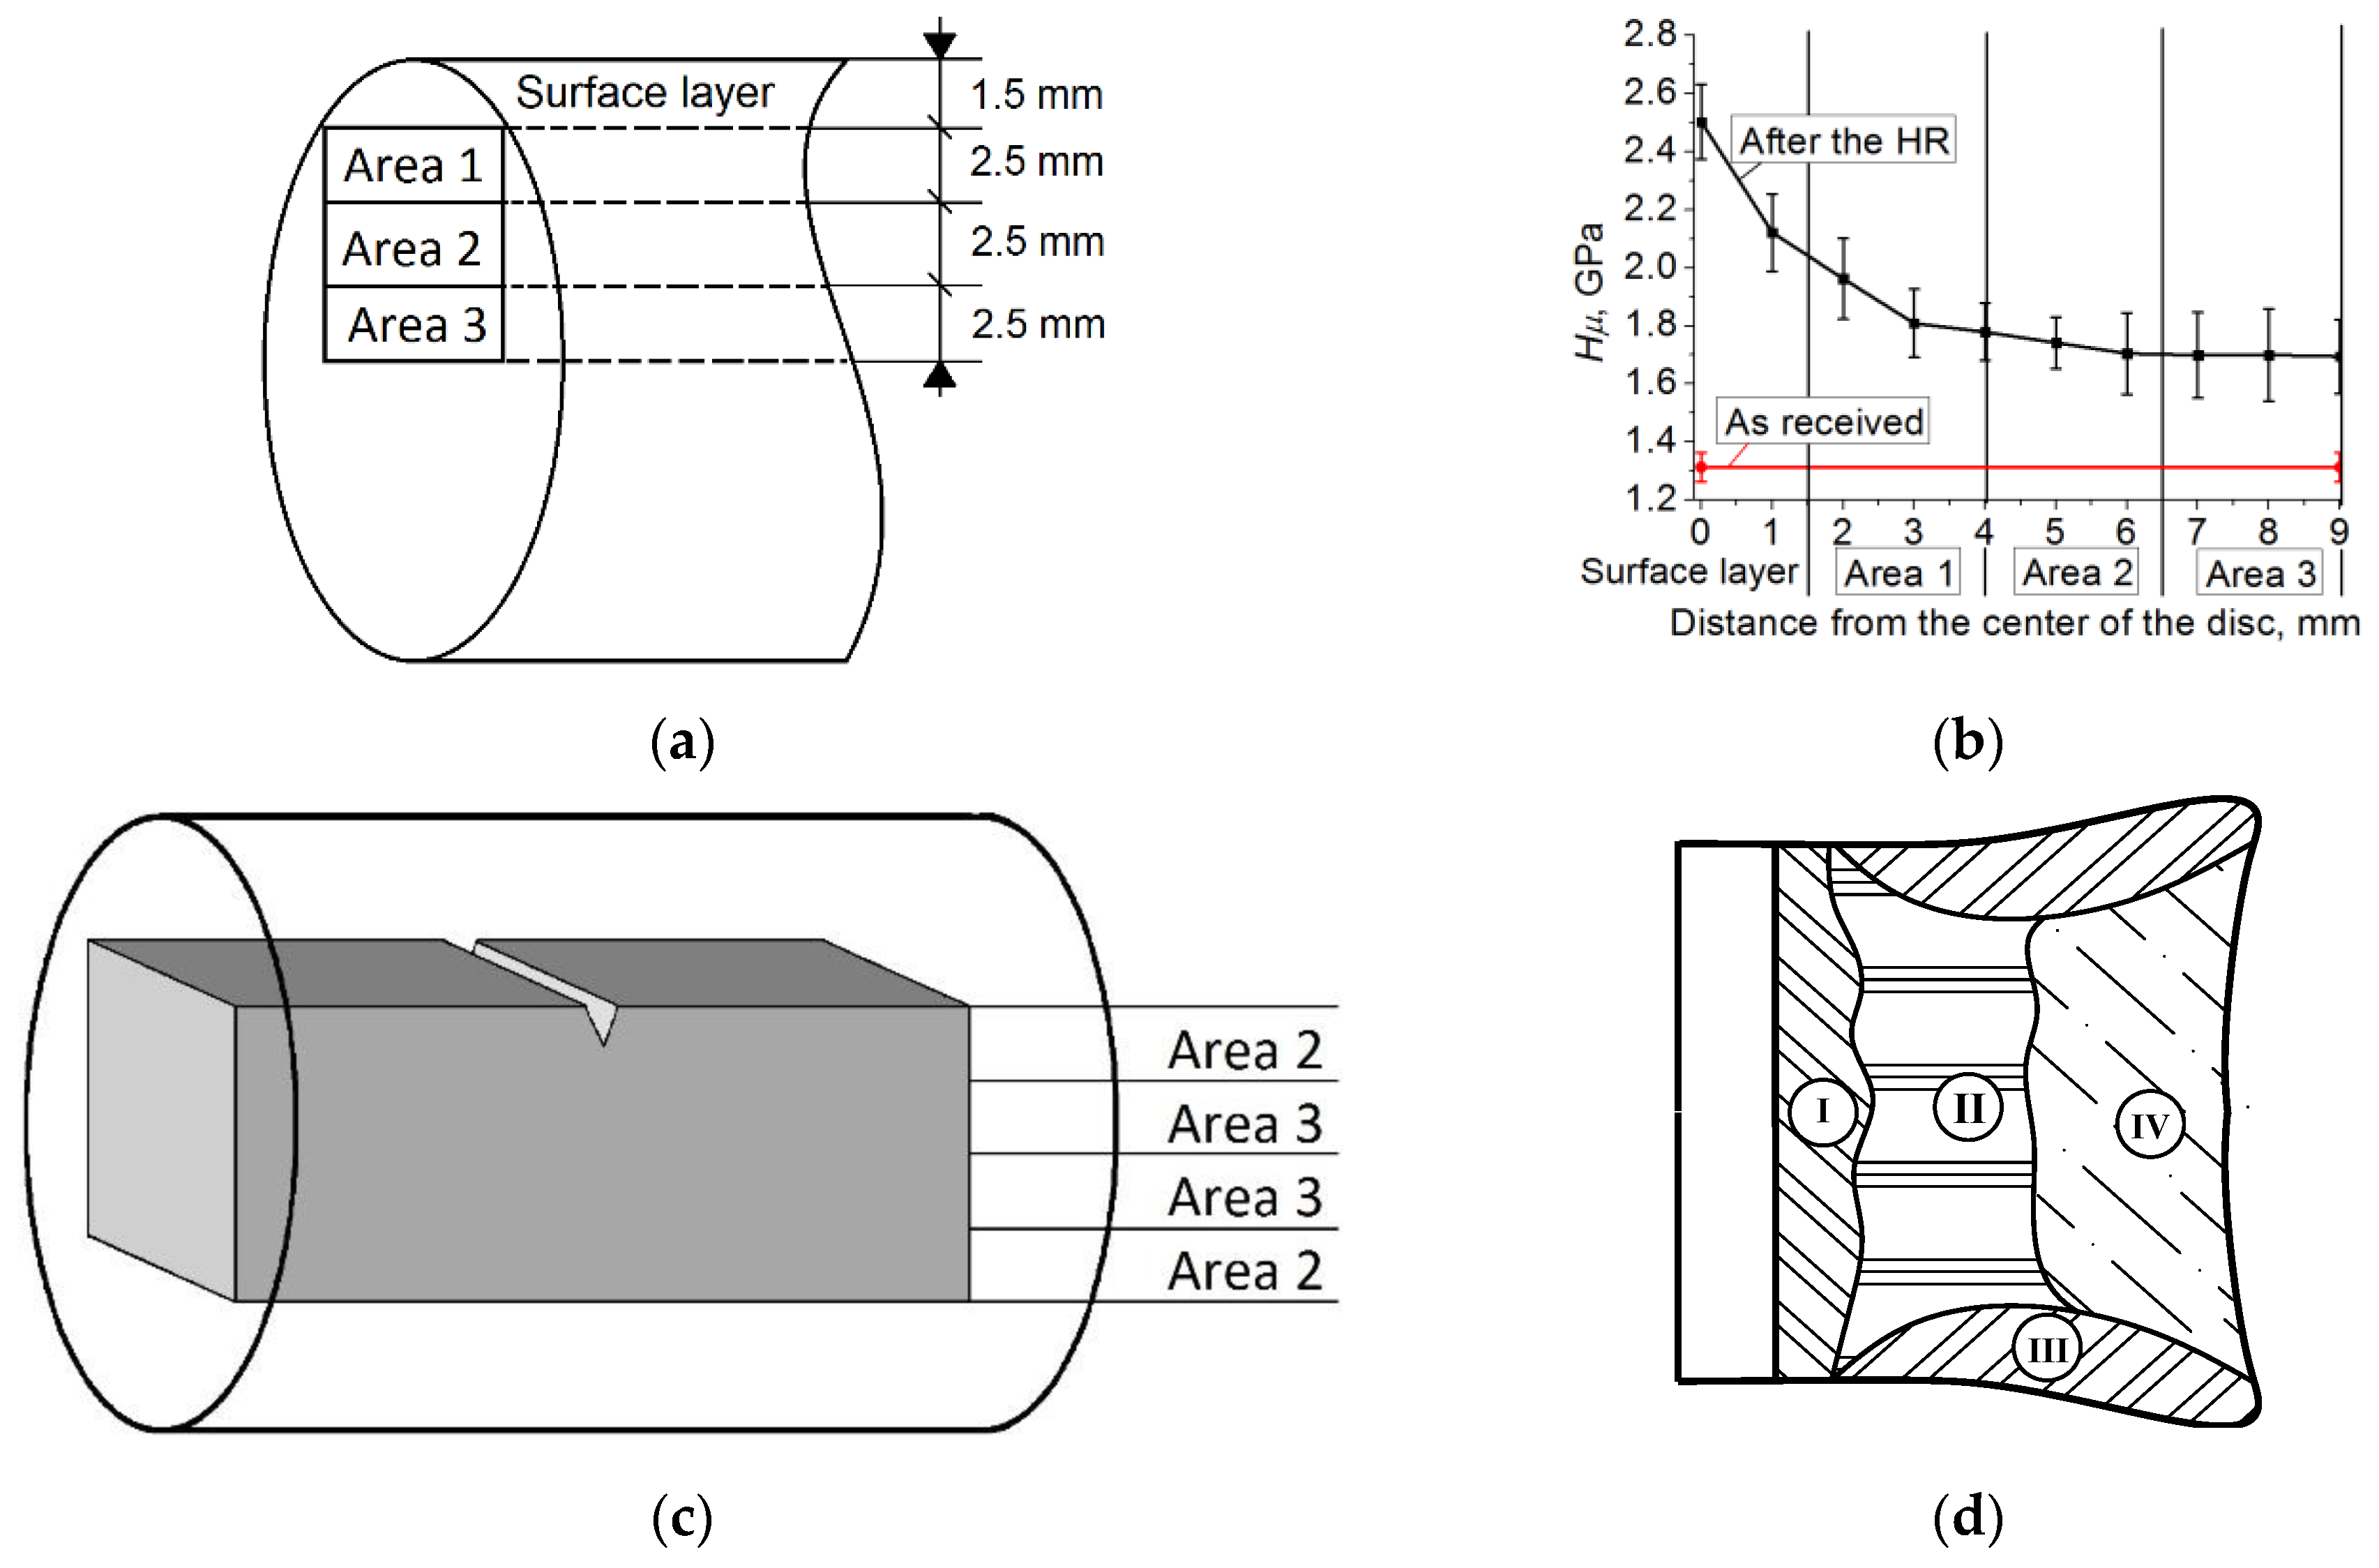
38]. In this regard, development of complex thermo-mechanical processing technologies is relevant to obtain materials that combine both high strength and sufficient ductility. To control and determine the optimal processing modes, the high-temperature helical rolling (HR) is widely applied, which can strain and heat treat the studied materials to a predetermined degree [
39].
The aim of this research has been to investigate the HR parameters (a number of passes) for the microstructural modification and the low-temperature impact toughness improvement of the 09Mn2Si HSLA steel. In order to achieve this purpose, work spent to crack initiation and propagation has been analyzed and compared with patterns of fracture surfaces. The second section describes the details of the experimental studies, including the HR modes. In the third one, the results of studies of the microstructure (optical and SEM micrographs) are shown and impact toughness values are presented in the temperature range from +20 to –70 °C. Also, the failure mechanisms in individual regions on the fracture surfaces are discussed. In the fourth section, the authors propose a methodology for computer simulation of the process within the framework of the excitable cellular automata method and its integration with the kinetic theory of fracture (S.N. Zhurkov). A theoretical analysis of the effect of grain shapes and orientations on the strain response patterns of a certain meso-volume simulating the material after the HR processing is carried out in the fifth section. The results presented in
Section 5 are not a complete analogy of the full-scale experiment, but are aimed at identifying the role of the processes at the internal interfaces on the propagation of energy flows. Finally, the authors draw conclusions based on the obtained results. It should be noted that the effect of such processing on the resistance to fatigue fracture for this steel has been considered in the previous paper of the authors [
40].
4. Justification of the Theoretical Approach to the Analysis of Deformation Processes under Impact Loading
The effects revealed in the experimental section required complex analysis, including the use of computer simulation methods. A multilevel approach for simulation of deformation and fracture processes seemed promising [
48,
49,
50]. However, before solving the issue of combining mechanisms operating at different scale levels (solved, for example, within the framework of molecular dynamics, crystal plasticity, finite element modeling, etc.), it was necessary to analyze the contribution of the processes at each scale. In this regard, it was expedient to apply the excitable cellular automata method at the meso-level, which showed its effectiveness for analyzing the behavior of materials under intense loads, considering rotational strain modes and material fragmentation at the pre-fracture stage. In this paper, the authors presented how this method could be developed to consider this period in terms of micro-damage initiation.
In the previous paper [
51], the authors—within the framework of the excitable cellular automata method [
52,
53,
54]—implemented a model for the numerical description of the process of material fatigue under cyclic loading. This model used Mott’s theory [
55], which postulated the dominance of kinetic (thermal fluctuation) processes when considering the dynamics of sliding of crystallite planes. According to this, the general expression for the shear activation energy
E, taking into account the external stress σ, was written as
where
a was an interatomic distance;
n was the number of atoms in a cluster of the crystallographic plane, the area of which was
nω;
F was the free energy required for shear due to cluster disordering. In this case, the expression for the free energy was written as
where
TM was the melting point;
L was latent heat of fusion per atom.
Mott’s theory described inter-crystalline shear as an oscillatory process directly related to thermal vibrations of the atomic lattice. Thus, for example, the frequencies of cluster shifts by distance
a could be written as
where
was the frequency of atomic vibrations.
Thus, internal stresses relaxed in a crystal at shear areas of the atomic planes. On the other hand, the mechanical energy of an external load enabled to dissipate due to thermal fluctuation processes associated with these shears.
In this paper, the authors, adhering to the line of dominance of the kinetic processes at the micro- and mesoscale levels, supplemented the excitable cellular automata model in the part of the thermo-fluctuation theory of strength, first proposed by S.N. Zhurkov in [
56] and greatly developed later [
57,
58,
59,
60]. Considering the structure-dependent kinetic processes was also very important to establish the dependence of strength characteristics from temperature and loading rate upon material fracture. These tasks were relevant when solving, for example, such a challenge as low-temperature brittleness [
61].
In the kinetic concept of S.N. Zhurkov, fracture was considered as a process that began immediately after application of an external load to a body and continuously developed in time. According to this theory, duration to failure
τ was determined by the following relation:
where
k was Boltzmann′s constant;
σ was tensile stress;
T was temperature;
χ,
τ0, and
U0 were material constants that had a clearly defined physical meaning. Thus,
τ0 was duration of natural vibrations of solid atoms (about 10
−13 s);
U0 was the level of the energy barrier that determined the probability of rupture of the interatomic bond.
It could be concluded that τ0 was the reciprocal of ς0 in expression (3) by S.N. Zhurkov, who described the frequency of an elementary act of shear strain in Mott’s theory. Thus, frequency of natural vibrations of the crystal lattice was a fundamental quantity both in describing plastic strain and fracture of a solid.
The parameter χ corresponded to a wide range of defect microstructures nucleated in a solid due to fracture under external loads and strongly depended on the material. It was found for the case of metallic single crystals that this coefficient was strictly inversely proportional to the density of dislocations generated under the external load. For pure polycrystalline metals, this value was determined by the density of dislocations at the grain boundaries.
Within the framework of the developed cellular automata approach, the material ‘torque’ (rotation) occurred under a local moment of force in an active element at a certain angle. The crystal lattice was distorted under this rotation, which was accompanied by the formation of single dislocations, and, then, multiple slip lines. Calculation of the material torsion angle enabled to quantify the induced change in density. For this purpose, the authors applied the approximation of the rod torsion model, considered in detail in [
53,
54]. Thus, χ, being the reciprocal of the density of dislocations, could be calculated proceeding from the local moment of forces by the formula:
where
klat was the proportionality coefficient associated with the type of crystal lattice;
r was the radius of an active element;
G was shear modulus;
SCA was the cross-sectional area of the cellular automaton active element.
The action of local moments of forces in the material was the reason for the transition of a cellular automaton active element from the initial ‘elasticity’ state to the ‘pre-failure’ one. The probability of this transition
P1 was calculated for the element with index
i as
where
j was the local index of a neighboring element on the first coordination sphere of the element with index
i;
J was the number of such neighboring elements (in the case of FCC packing
J = 12).
Before the beginning of the rapid fracture stage, stationary accumulation of cracks occurred when the rate
N was constant, and the number of cracks tended to a certain critical (threshold) value
N* (the number of cracks per unit volume). The critical value was determined from the concentration law [
62]
where
L was a mean crack length;
K* was the dimensionless material parameter in the range from 2.1 to 6.0. It was easy to see that
K* had the meaning of the cubic root of the quantity, which was inversely proportional to the critical volume fraction of all cracks in the material.
Within the framework of the excitable cellular automata method, the last relation could be used to calculate the probability of the transition of an active element from the ‘pre-fracture’ state to the ‘crack’ one (
P2). This was reflected in the laws of interaction with neighboring active elements. This probability was defined as the ratio of the density (amount per unit volume) of accumulated microcracks to the critical density:
Furthermore, in terms of a cellular-automaton evolutionary scheme, the probability was expressed as a sum over time steps of the algorithm as
The authors believed that the modification of the steel microstructure by the HR processing contributed to a longer stage of stationary damage accumulation, delaying the loss of the material’s bearing capacity. The degree of structural ‘imperfection’ of the material was effectively considered in the theory of S.N. Zhurkov by means of the χ parameter, which was determined by the density of dislocations at the crystallite level and by the density and energy state of the internal interfaces at the macro-scale one. Thus, within the framework of the described method, it was possible to consider both the temporal features of the damage accumulation process (according to the theory of S.N. Zhurkov) and the large-scale one (analyzed using the physical mesomechanic postulates), including the mesoscopic consideration of the deformation processes in Mott′s theory. The method explicitly took into account the energy dissipation during the nucleation of defect structures in accordance with the relation [
54]
where
was an increment of the vector torsion angle of the material in the active element;
was shear modulus;
was the experimentally measured dissipation coefficient;
was the radius of the active element.
The authors suggested the development of the presented approach of cellular automata modeling in determining the critical tensile strength in order to use its values for simulation processes at higher scale levels.
5. Numerical Simulation Results
As noted in the experimental section, resistance to impact fracture was significantly affected by the processes at the macro-discontinuity propagation stage. However, the microstructure formed upon the HR processing was decisive in terms of energy spent to crack initiation. The HR could have had a dual effect. On the one hand, an increase in yield stress restrained the transition of the material to plastic flow and, accordingly, the moment of crack initiation. A competing process was strain hardening (revealed, for example, by the microhardness tests) that reduced toughness. Together with the retention of strain dislocation mechanisms in the steel after the HR processing, it was possible to ensure the KCV values at the as-received steel level, while there was no significant decrease in impact toughness with the decrease in the test temperature compared to the as-received steel.
Thus, it was necessary to study how the modification of the microstructure by the HR processing affected propagation of energy fluxes in the steel specimens under impact loading. This section was devoted to solving the issue. The authors noted that they did not try to achieve a complete analogy with the experimental conditions (as was typically done for the finite element method). Nevertheless, a comparison of the obtained results with the above-described experimental data enabled to both develop the simulation method and outline ways to further improve the properties of structural materials by their microstructure modification via the HR processing.
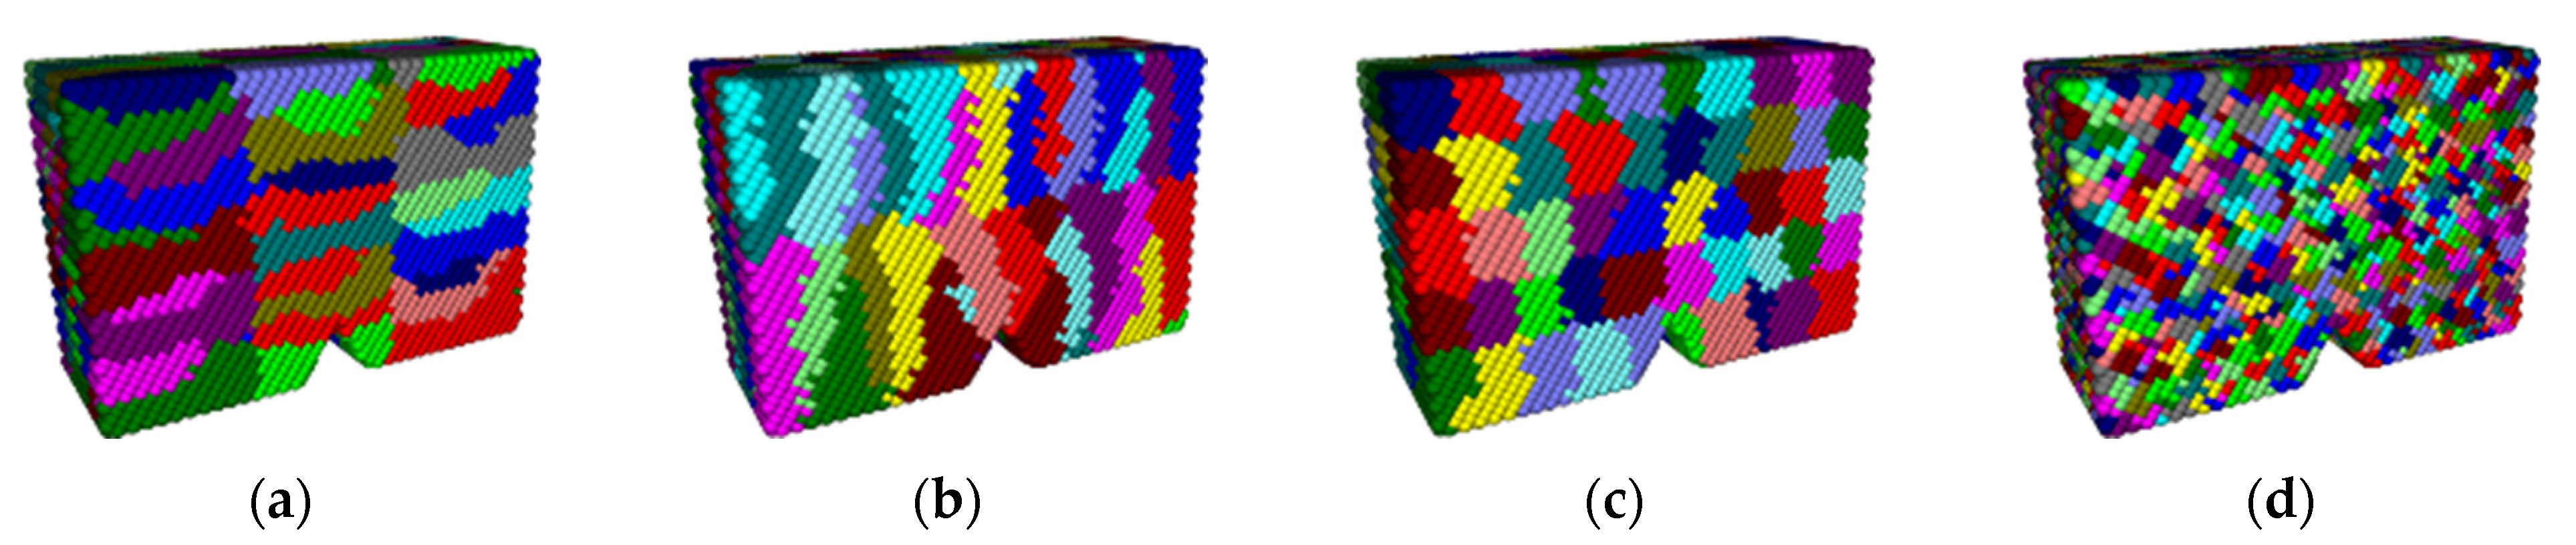
Implementing the modified excitable cellular automata method, two computer simulation series were carried out to study in detail impact loading of the steel specimens with different microstructures characterized by grain sizes of 30 × 6 × 6 (grains were elongated along the
x-axis), 6 × 6 × 30 (grains were elongated along the
z-axis), 9 × 10 × 12 and 3 × 3 × 3 μm (
Figure 9). Each specimen had dimensions of 90 × 30 × 60 μm and a symmetrical V-shaped notch 15 μm wide and 13 μm deep in the middle of the lower face. The size of a cellular automaton element was 1.5 μm, the time step was 1 ns.
In the first simulation series, the temperature of the specimens was +20 °C, but it was −70 ° C in the second ones. During each simulation with a duration of 100 μs, an elliptical area with semi-axes of 30 and 10 μm and a center in the middle of the upper face was under impact loading, and the smooth distribution of compression strain was set so that its maximum value (100 s−1) was reached in the ellipse center, and the minimum (zero) was on its boundary. The smooth load distribution on the lower face simulated the support reaction: the value of the compression strain rate was maximal (10 s−1) at the face edges, but it was minimal (2 s−1) at the face center. The rest of the specimen faces were not loaded and did not exchange energy with environment.
Figure 10,
Figure 11 and
Figure 12 show plots of time dependences of specific elastic energy, specific dissipated torsion energy and their proportions in the total energy, as well as mean moduli of specific moment of force for each of the four considered specimens. The expressions, according to which the calculations of these parameters were carried out, had been given in [
52].
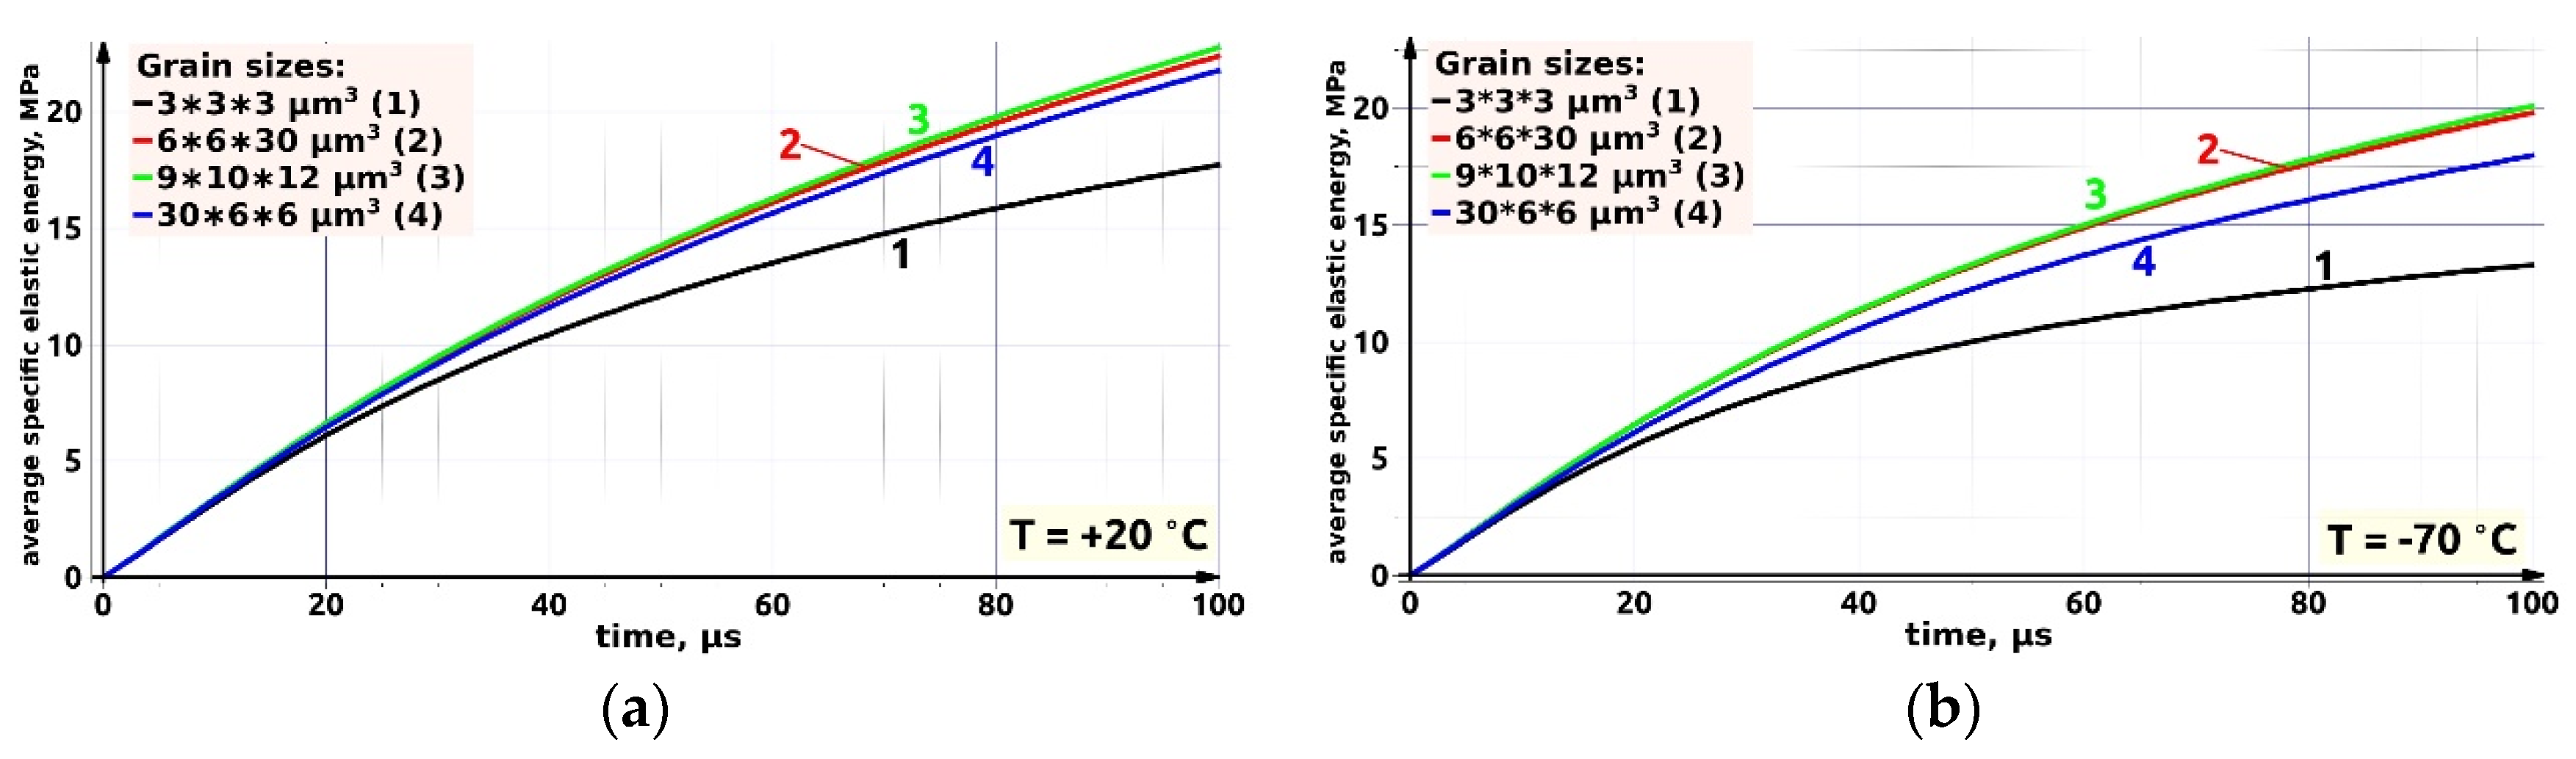
The behavior of the graphs in
Figure 10 enabled to conclude that the rate of accumulation of elastic energy gradually decreased in all specimens, and the minimum values of elastic energy were reached in the specimen with fine grains (3 μm in size). Of the other three specimens, the highest value of the accumulated specific elastic energy was shown by the specimen with almost equiaxed grains of ~10 μm, and the smallest one possessed the specimen with horizontally oriented (elongated) grains.
The curves shown in
Figure 10b, had very significant distinctions in the specimen energy capacity with lowering temperature. For instance, the accumulated energy in the finest-grained specimen at the temperature of −70 °C was 30% lower than that for the same microstructure at +20 °C. It could also be noted that the specimen with the lamellar horizontal microstructure (30 × 6 × 6 μm
3) showed a noticeable sensitivity to the decrease in temperature compared with the ‘coarse-grained’ one. In this case, low temperature, which changed the energy state of the grain boundaries, caused a higher barrier to the elastic energy front propagation.
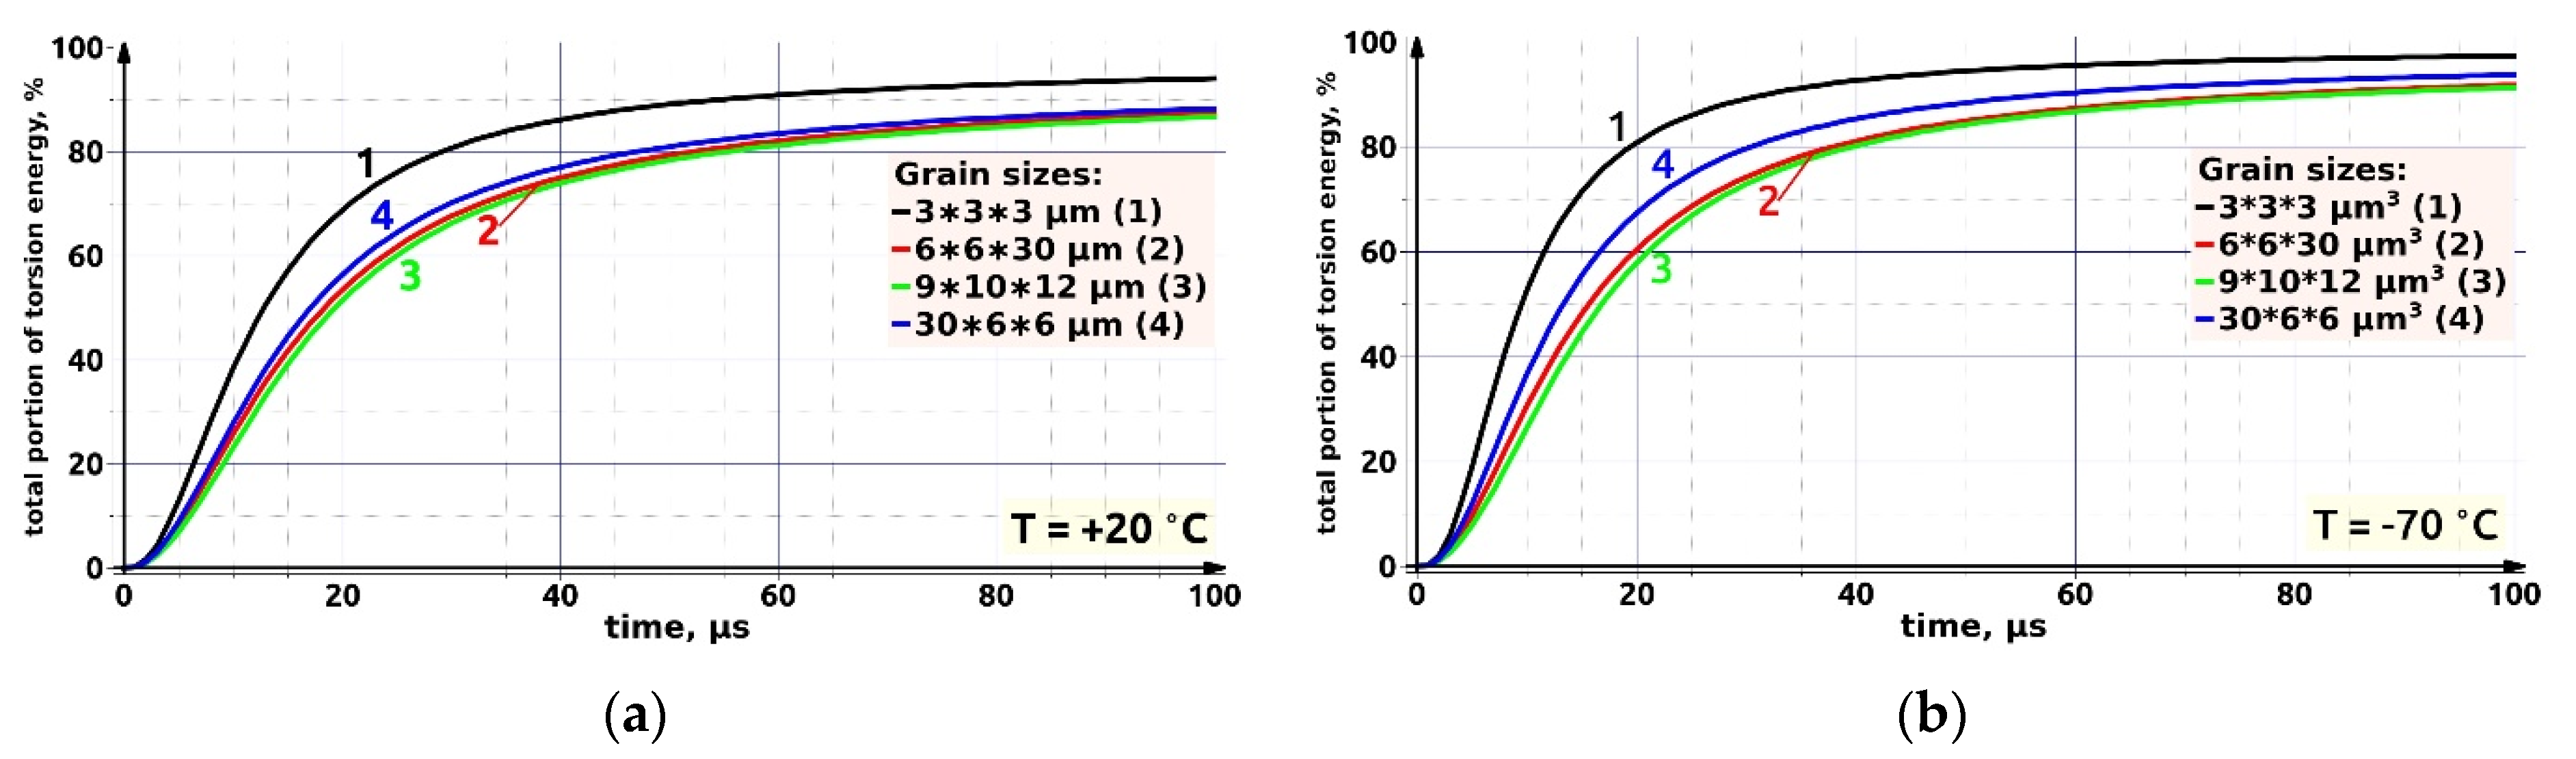
The value of the specific torsional energy characterized the ability of the material to nucleate new defect structures according to expression (10).
Figure 11 shows a gradual increase in the growth rate of the specific torsional energy for all specimens. At the same time, the maximum values were for the fine-grained material during the entire simulation. From three other specimens, they were for the material with grains oriented across the load direction. The minimum values of the torsional energy were accumulated in the specimen with large equiaxed grains (highly likely, due to the small extent of the boundaries themselves). At the end of the loading stage, the values of the torsional energy fractions stabilized in the range of 85–95%. The difference was noticeable only for the fine-grain specimens.
Analysis of the behavior of the plots in
Figure 10 and
Figure 11 enabled to conclude that the maximum dissipation of elastic energy occurred in the fine-grained microstructure. Analysis of the data on the specific torsional energy indicated that plastic strain developed according to the ‘shear plus rotation’ mechanism. In this case, the relaxation of excess stresses was in the grain bodies due to interplanar slip (described within the framework of Mott’s theory), while the rotational mechanism had to prevail at the grain boundaries. It should be noted that grain boundaries were not only the barrier preventing the elastic energy transfer and absorbing part of it, but they also significantly changed the stress–strain state patterns in the grain bodies.
Of the three specimens with the same mean volume, but having different grain orientations, the highest dissipation of elastic energy was shown by the one with the preferred orientation of the boundaries across the load direction. This was due to the fact that the strain front was forced to overcome the area of the grain boundaries larger than in other specimens during the propagation process. On the other hand, the ‘vertical’ grain orientation also increased the degree of energy dissipation compared to the equiaxial structure. In this case, the reason was the elastic energy front propagation to the support areas on the lower face, which passed mainly through the grain boundaries oriented parallel to its direction. Thus, there were two competing mechanisms of elastic energy absorption: (i) the microstructure with horizontally oriented grains realized micro-plastic shears in the grain bodies (according to Mott’s theory); (ii) the microstructure with vertically oriented grains was subjected by the intensive development of rotational wave of defect flows along the grain boundaries (according to the theory of V.E. Panin—V.E. Egorushkin).
The general tendency towards stabilization of the proportions of elastic and torsional energy for all types of the grain microstructures and temperatures was due to the fact that there was a gradual decrease in the energy gradients and moments of forces both inside the grains and at their boundaries upon loading because of the establishment of an equilibrium regime for the specimen macro-volume. This effect was not only due to the balancing of elastic macro-stresses, but also because of the achievement of a certain threshold value of the torsional energy, when the material was saturated with dislocation microstructures and exhausted the ductility margin [
63]. In this sense, the transition point on the curves, shown in
Figure 11, to the horizontal section (‘saturation’) indicated the beginning of the pre-fracture stage, the features of which are discussed below.
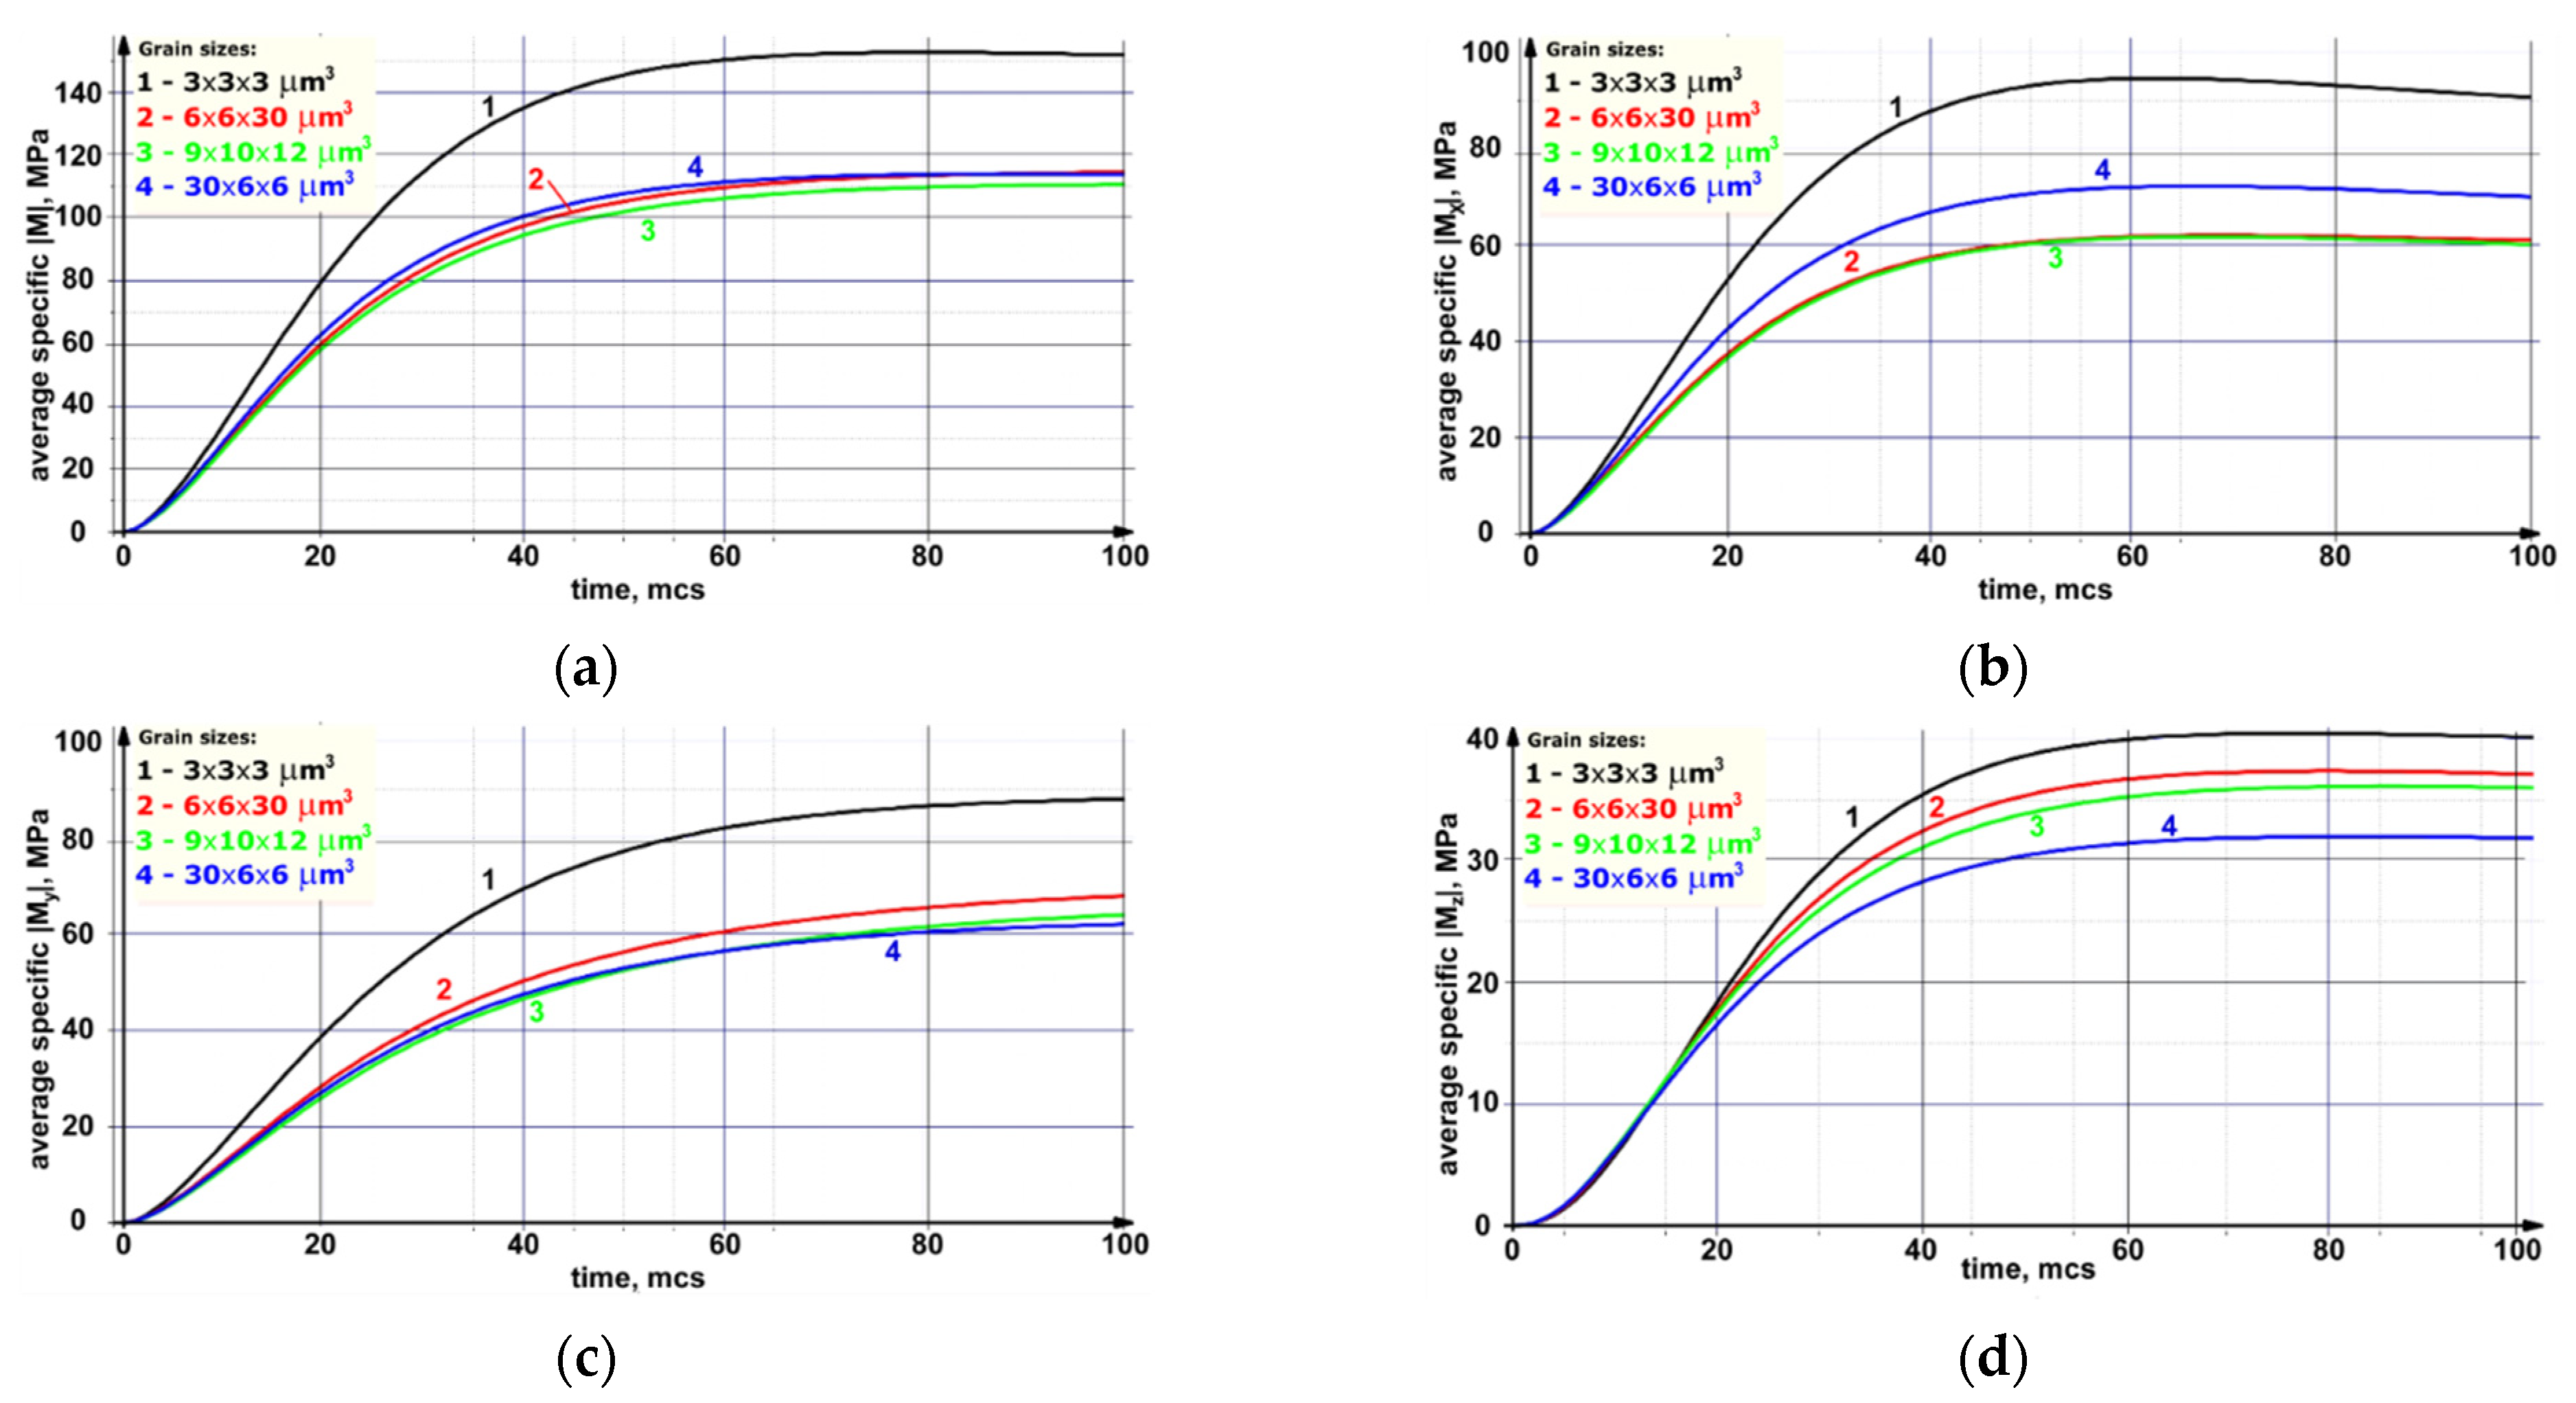
The magnitude of the modulus of the specific moment of force was analogous to the potential energy of torsion, which later (in the process of increasing the density of dislocations and the formation of slip lines) was transformed into the work spent to plastic strain. The time dependences presented in
Figure 12, a show a gradually decaying increase in the mean absolute values of the moment of force. For a more detailed study of the processes of the curvature formation at the grain boundaries, time dependences were also built for the three components of the moment of force for all simulation specimens (
Figure 12b–d). Since the relationship of the separate components of the moment of force was characterized exclusively by structural features, these graphs were plotted only for the temperature of +20 °C.
The maximum mean values of the moduli of the moments of forces and its components were shown by the specimen with the fine-grained microstructure. Again, this fact was due to the largest area of the grain boundaries in comparison with other investigated microstructures. The plots of the mean moduli of the moments of forces were almost identical for all other specimens with the same mean grain volume. Nevertheless, the dependences of the mean values of the moduli of various components of the moments were significantly different from each other. Accordingly, the grain shapes affected the spatial distribution pattern of the torsion zones of the material around one or another coordinate axis. For example, torsion of the material under simulation around the (horizontal) x axis was more intense during deformation if the grains were stretched in the horizontal direction. At the same time, ‘swirls’ around the vertical z axis was most pronounced in the microstructure with vertically oriented grains. This confirmed the above thesis about the competing mechanisms of the elastic energy dissipation. In the case of predominantly horizontally oriented grains (across the load direction), the dissipation was due to the formation of defect microstructures in the grain bodies. In the case of the grain microstructure oriented coaxially to impact load, the predominant development of the rotational wave of defect flows was along the grain boundaries.
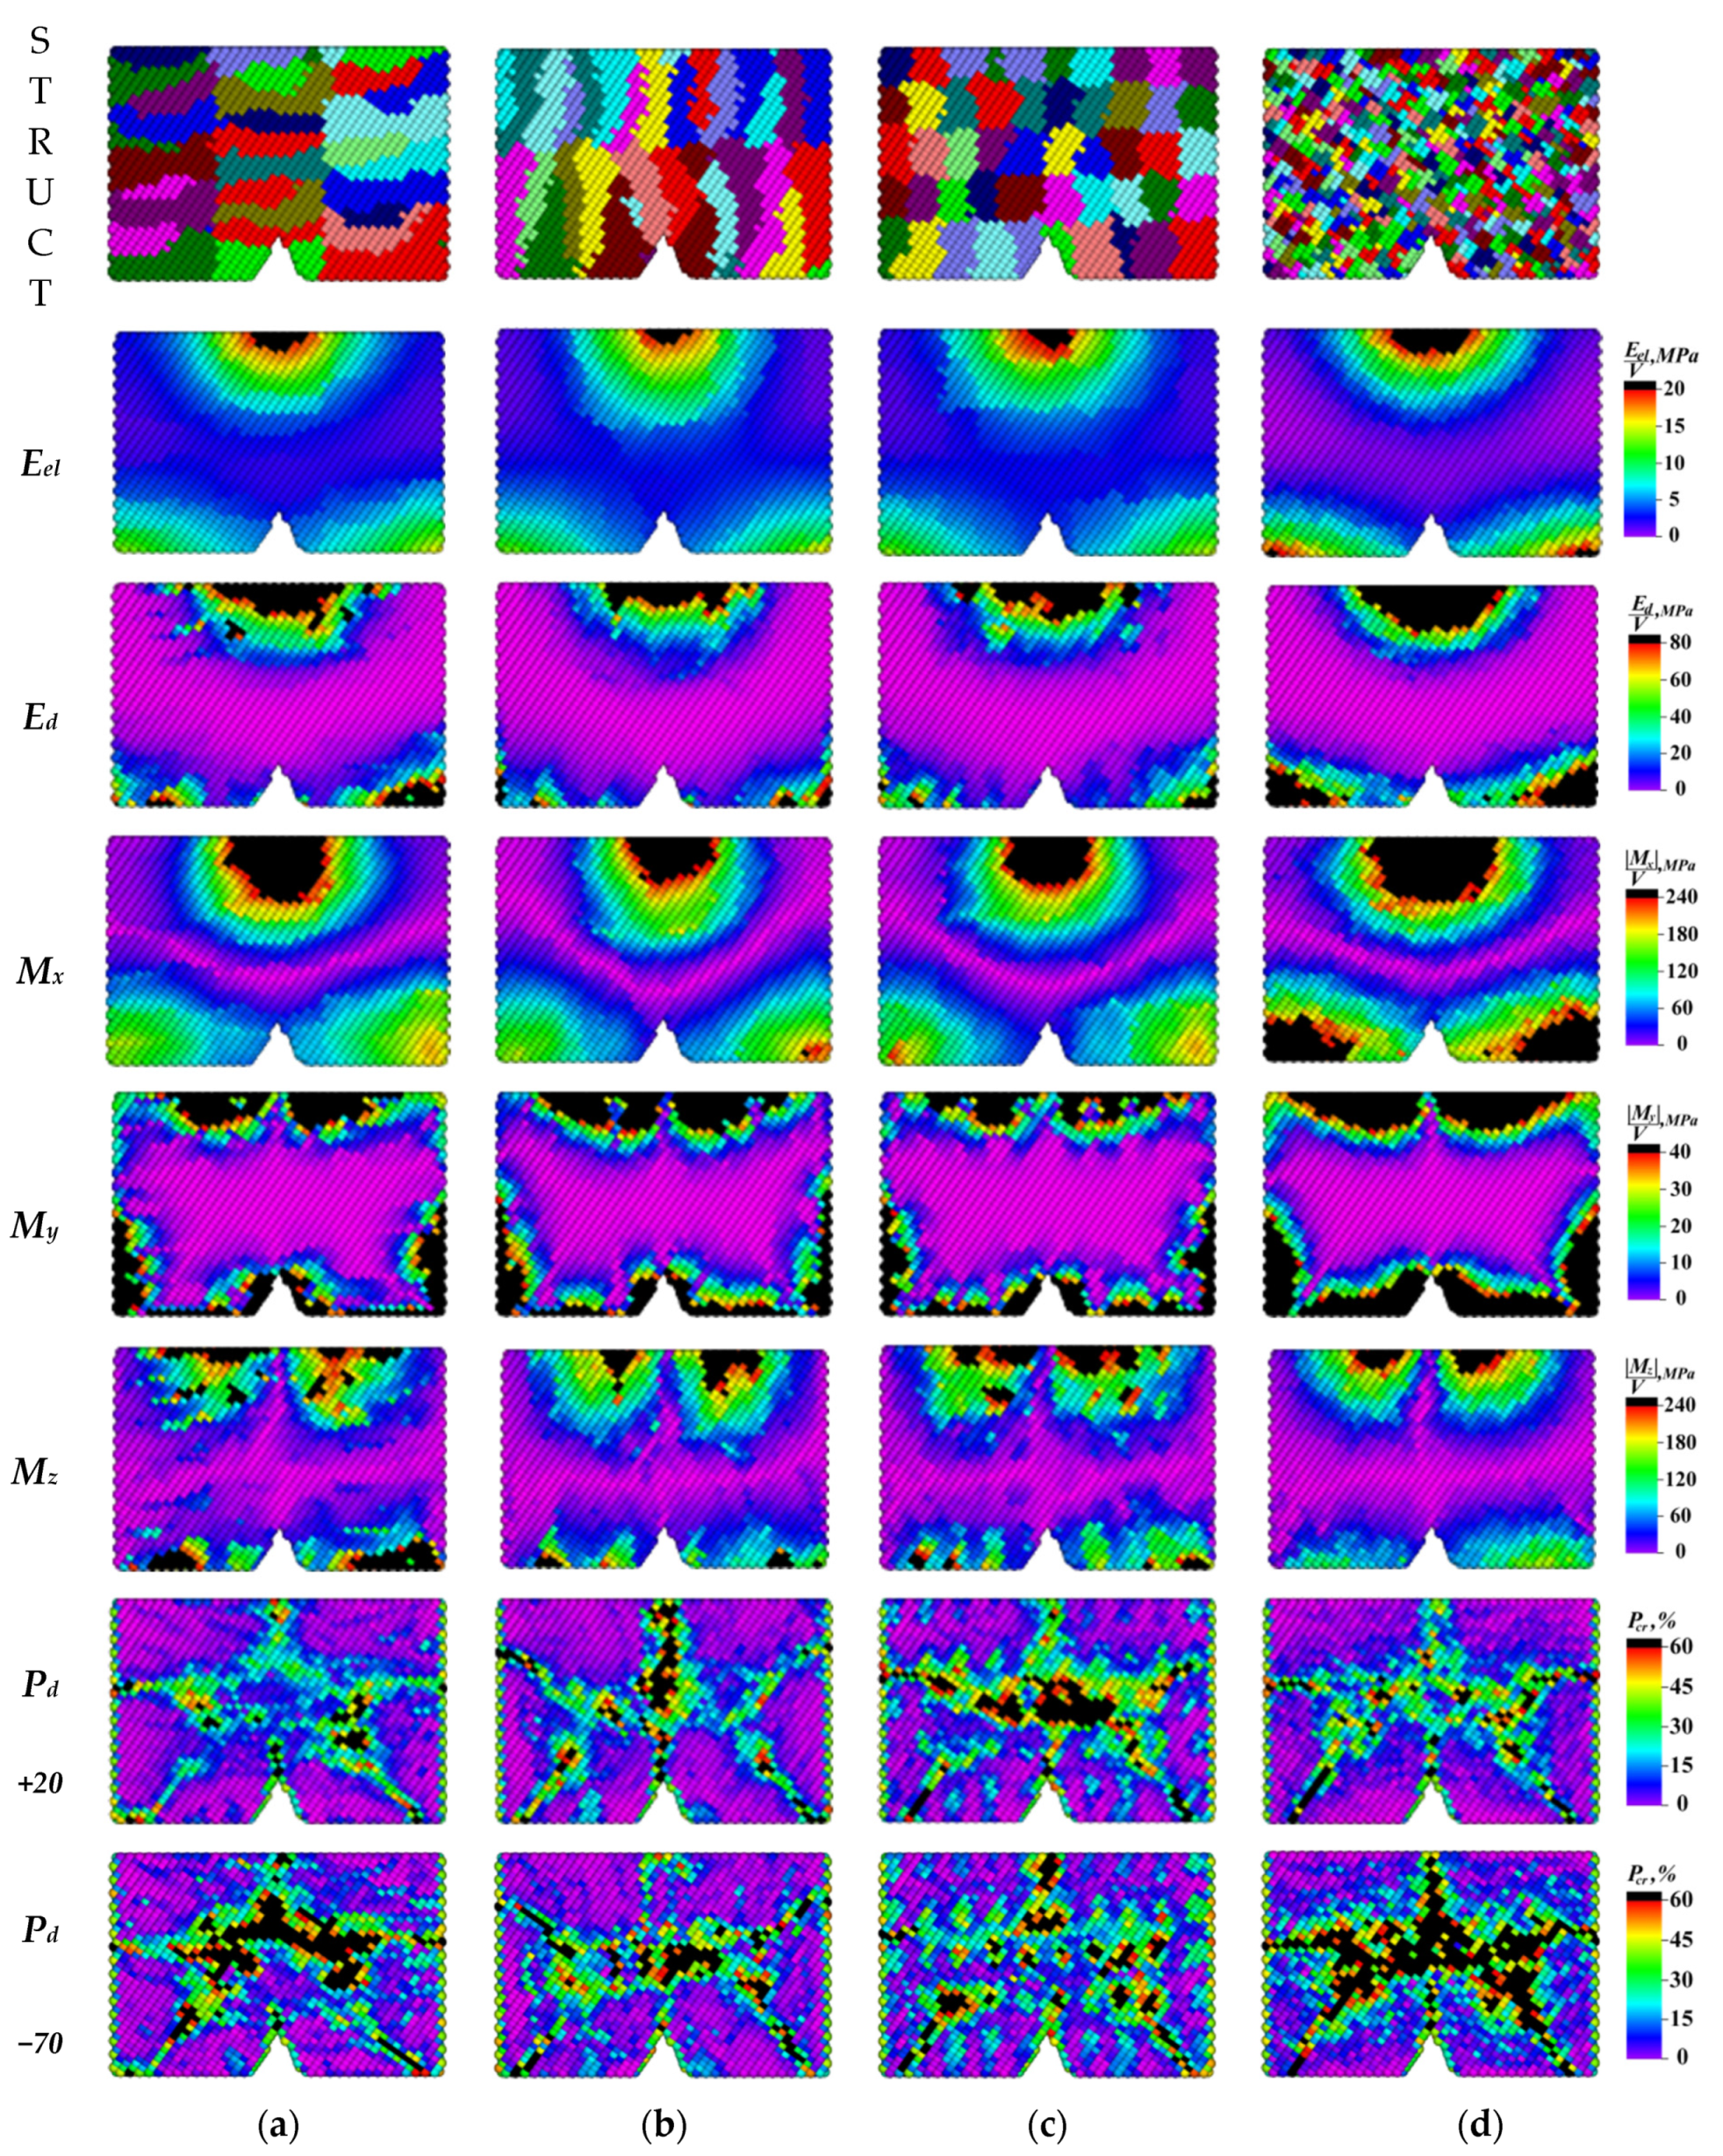
Figure 13 shows maps of the grain microstructure on the front faces of the simulation specimens and the distribution patterns of the specific elastic energy, the specific dissipated torsion energy, the mean moduli of the components of the specific moment of force, and the probabilities of micro-crack initiation on these faces after 20 μs.
The elastic energy propagation dynamics, presented in
Figure 13, demonstrated a gradual inflow of energy from the load application area at the upper face (as well as from the support side located at the lower face) into the specimens. The grain microstructure had a significant effect on the elastic energy front propagation rate (the grain boundaries slowed it down). For this reason, the ‘saturation of the material with elastic energy’ was slowest in the fine-grained microstructure compared to the other ones. The elastic energy dissipation was most intense both at the point of the impact load application and near the supports at the lower face.
It should be noted that the greatest increase in the torsional energy was in the regions of the grain boundaries, behind which this energy propagated deep into the specimen, mainly along the grain boundaries. Such a character of the torsional energy front propagation and its dissipation at the nucleation of the defect microstructures was caused by the action of the moments of forces arose as a result of the elastic energy gradients at the grain boundaries. In this case, the action of the local moments of forces also spread into the grain bodies, which subsequently caused their fragmentation and transcrystalline failure.
In
Figure 13, the distribution patterns of the X component absolute values of the specific moment of force
M were in many respects similar to the same distributions of the specific torsional energy
E. A distinctive feature of these patterns was a more significant difference between the fine-grained and other microstructures in the degree of accumulation of the X moment component values near the support areas.
It was noted above that the Y component values of the moment of force reached their maximum values on the lateral specimen faces at the beginning stage of impact loading. Then, they were gradually increased within the specimen. As a result, quasi-symmetric patterns of these component distributions were found at the front faces of the specimens. Their type was determined by the shapes and the sizes of the grains. In the case of the Z component of the moment of force, the distribution patterns were also quasi-symmetric about the central vertical axis (the axis of the applied impact load). In this case, they gradually ‘stabilized’ as they were loaded. The maximum modulus values were achieved in the grain bodies located near the loaded upper and lower faces. This was due to the fact that the grain bodies accumulated the torsional energy as a result of the action of the moments of forces generated along the grain boundaries and the specimen surface. On the other hand, the grain boundaries were channels for the propagation of rotational wave flows deep into the material.
The probability distributions of micro-crack initiation, calculated by formula (6), showed that the shapes and the sizes of the grains also had a significant effect on the nature of micro-cracking (
Figure 13;
Pd). Thus, there was an extremely effective damping effect of the microstructure with the preferred grain orientation perpendicular to the loading axis. Despite the “potentially incipient macro-cracks“ in the top notch and punch regions, the material resisted to accumulation of micro- ones in the specimen core to a critical level regulated by the concentration ratio (9). In the case of vertically oriented grains, the rapid formation of the ‘main crack’ through the entire specimen was very likely (
Figure 13b;
Pd). In the case of the equiaxial coarse-grained microstructure, an even more critical result was found (
Figure 13c;
Pd): the total specimen area affected by micro-cracking was the largest of all the studied microstructures. Moreover, the macro-crack propagation direction was difficult to predict in this case. It could be assumed that further fracture dynamics was of a bifurcation nature. The refinement of the microstructure enabled to reduce the mean level of the micro-crack initiation probability (
Figure 13d;
Pd). Nevertheless, no apparent damping effect was observed in the specimen volume due to the low efficiency of the microstructure refinement without its anisotropy.
The final stage of the loading process simulation was discussed above, where the torsion energy curve was transformed into the horizontal section corresponding to saturation with defects that correlated with the pre-fracture stage beginning. This section of the material saturation with the dislocation microstructures and broken interatomic bonds was in reality the beginning stage of microcrack accumulation into larger ones with their subsequent rapid propagation. The start of this step was regulated by the concentration law, expressed by Equation (7). Upon completion of the stage of accumulation of the defect microstructures, the propagation rate of the number of microcracks (N0) in formula (9) ceased to be a constant and began to rapidly increase. It should be noted that development of a special algorithm described accumulation of the microcracks into the macro- ones is a separate issue, which is planned for implementation by the authors in future works.
Similar calculations of the probability distribution of microcrack initiation were carried out for identical simulation specimens at the temperature of −70 °C. The simulation results are also shown in
Figure 13 (bottom line). They indicated a greater ability to generate damage with decreasing temperature. In this case, the fine-grained specimen showed the greatest ability to low-temperature embrittlement (
Figure 13d). The area of supposed microcracks was the largest of all specimens at the temperature of −70 °C. A very unexpected result was observed for the lamellar microstructure with grains oriented along the load axis. While at the temperature of +20 °C there was a clear growth of the longitudinal crack across the entire specimen, micro-cracks dispersed without agglomerating into macro-ones at −70 °C. In this case, an intense accumulation of the micro-damages was along the grain boundaries in the lamellar microstructure oriented across the loading axis, which was more resistant to impact loads at temperatures above zero. This fact highlighted requirements to form multilayer composite materials with alternating ‘parallel’ and ‘perpendicular’ lamellar microstructures.
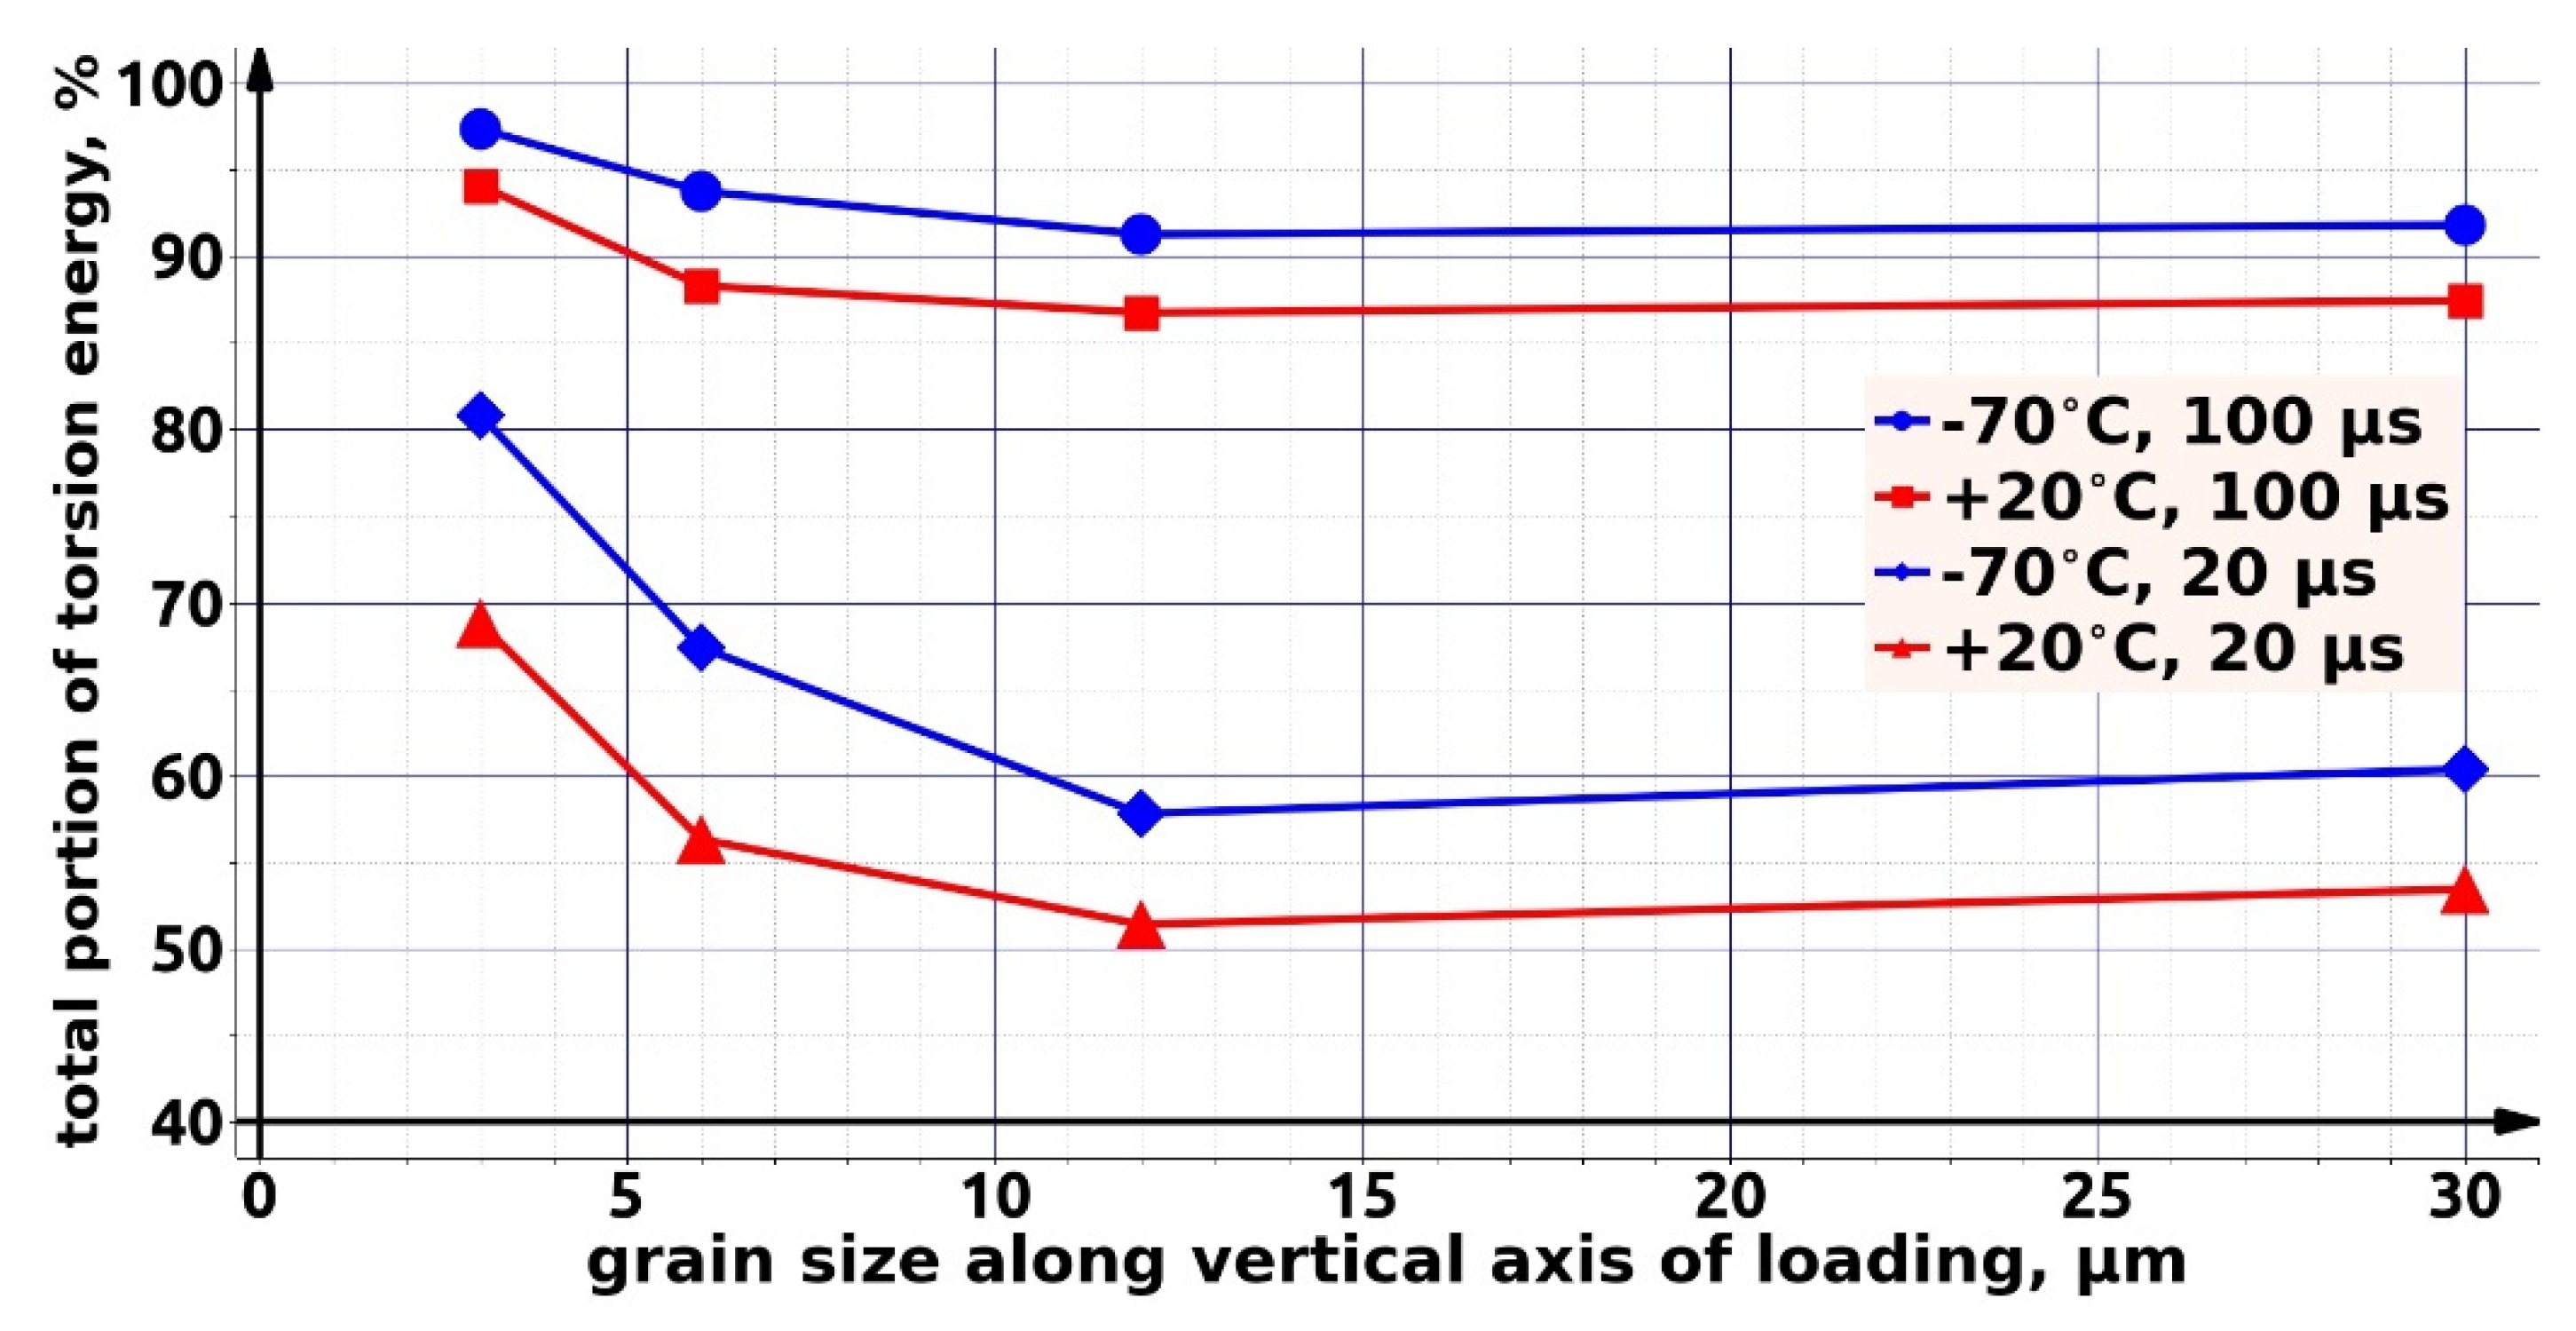
Since the relative torsional energy was directly related to the activation volume of fracture and, ultimately, to the micro-crack initiation probability, the authors considered it appropriate to provide a summary graph of the relative torsion energy for all simulation specimens and both temperatures (
Figure 14).
According to
Figure 14, the greatest difference in the behavior of various specimens, as well as the effect of temperature, was at the first stages of impact loading. With an increase in the load duration, the distinction between the microstructures decreased due to the tendency of the system to equilibrium. This was also consistent with the experimental fact that the ductile-brittle transition phenomenon was not observed under the quasi-static test conditions. This transition was not only a microstructure-dependent phenomenon (from a type of the crystal lattice) but was also an extremely non-equilibrium process in which strains of various natures competed with each other in grain bodies.
Thus, the performed theoretical studies enabled to trace explicitly the influence of the sizes and the orientations of the grain microstructure on the evolution of elastic and dissipated strains, including the crack initiation probability. It should be emphasized once again that the authors did not strive to obtain complete agreement between theoretical and experimental data, if only because of the specificity of the model approach they developed. However, the obtained results indicated the correctness of the chosen direction, within which research on fracture process simulation will be continued for structural materials after the HR processing.
By way of the discussion, authors would like to refer the interpretation of helical rolling effect given in [
64]. The effect of a lattice curvature on impact toughness at low temperatures has been studied for the 09Mn2Si and 10Mn2VNbAl high-strength low-alloy (HSLA) steels. It was shown that the formation of the lattice curvature of several degrees/micrometer significantly increases the low-temperature impact toughness of the HSLA steels, regardless of the alloying element compositions. It is suggested that the perlite–bainite phase transformation develops under helical rolling at a temperature of 850 °C. As a result, bainite is formed in the lattice curvature zones characterized by the presence of interstitial mesoscopic structural states where random rotational deformation modes could develop. This was responsible for drastic improvement of the temperature impact toughness of the HSLA steels.
For the above described reasons, the revealed increasing of impact toughness should be attributed to the structural transformations at various scale levels, including electron spectra modification (nanoscale), ensuring dislocation ductility and inverse perlite–bainite transformation (microscale lelel), lamellar grain structure formation (mesoscale), gradient pattern of structure variation (macroscale).
6. Conclusions
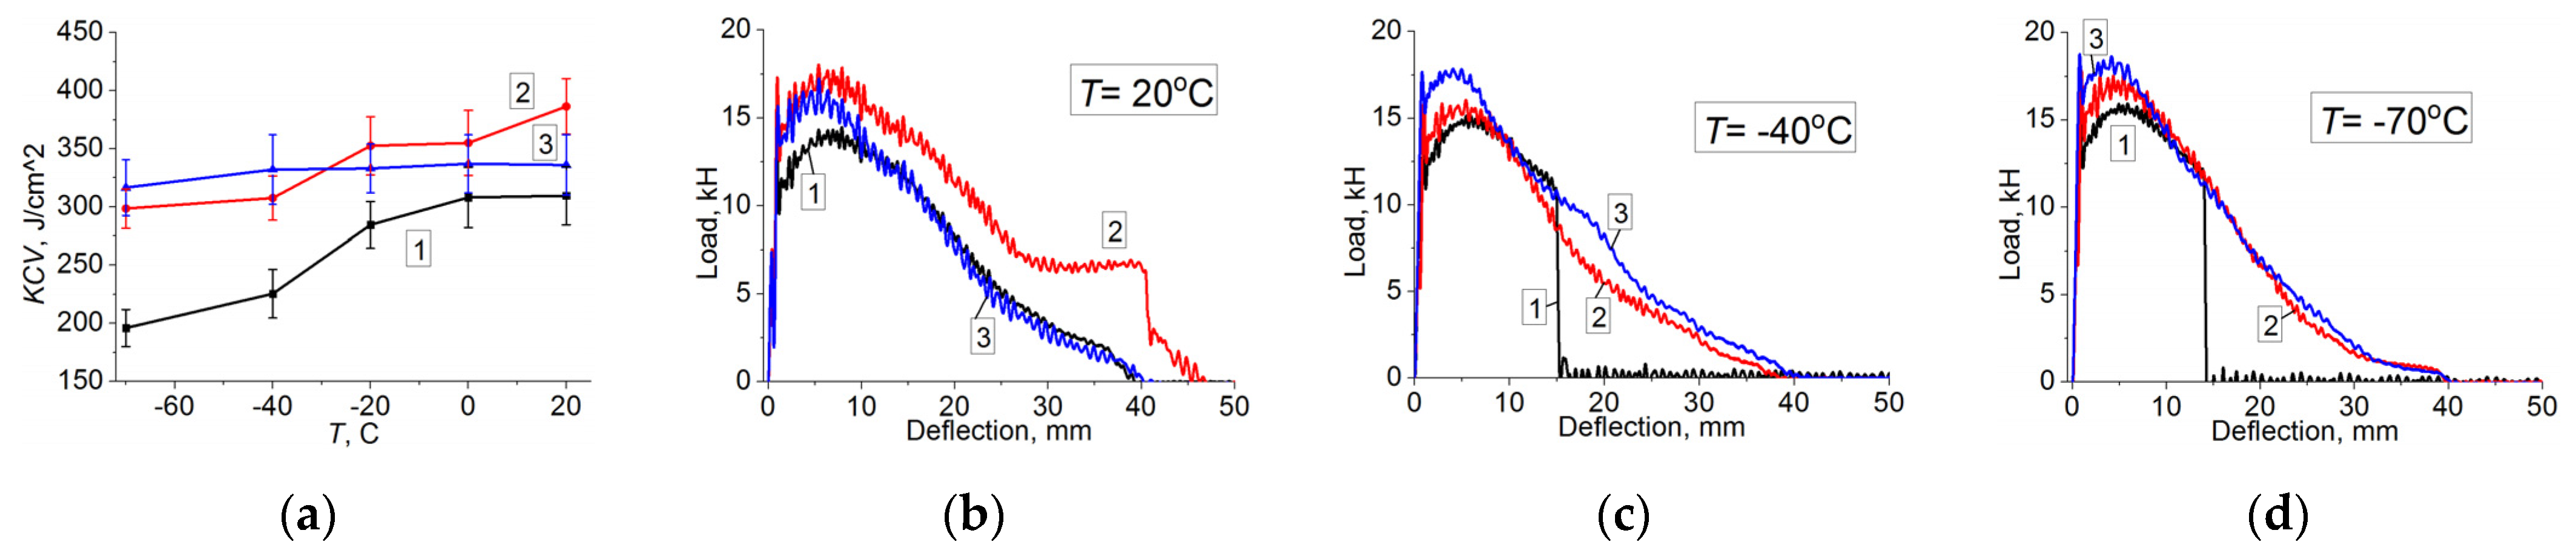
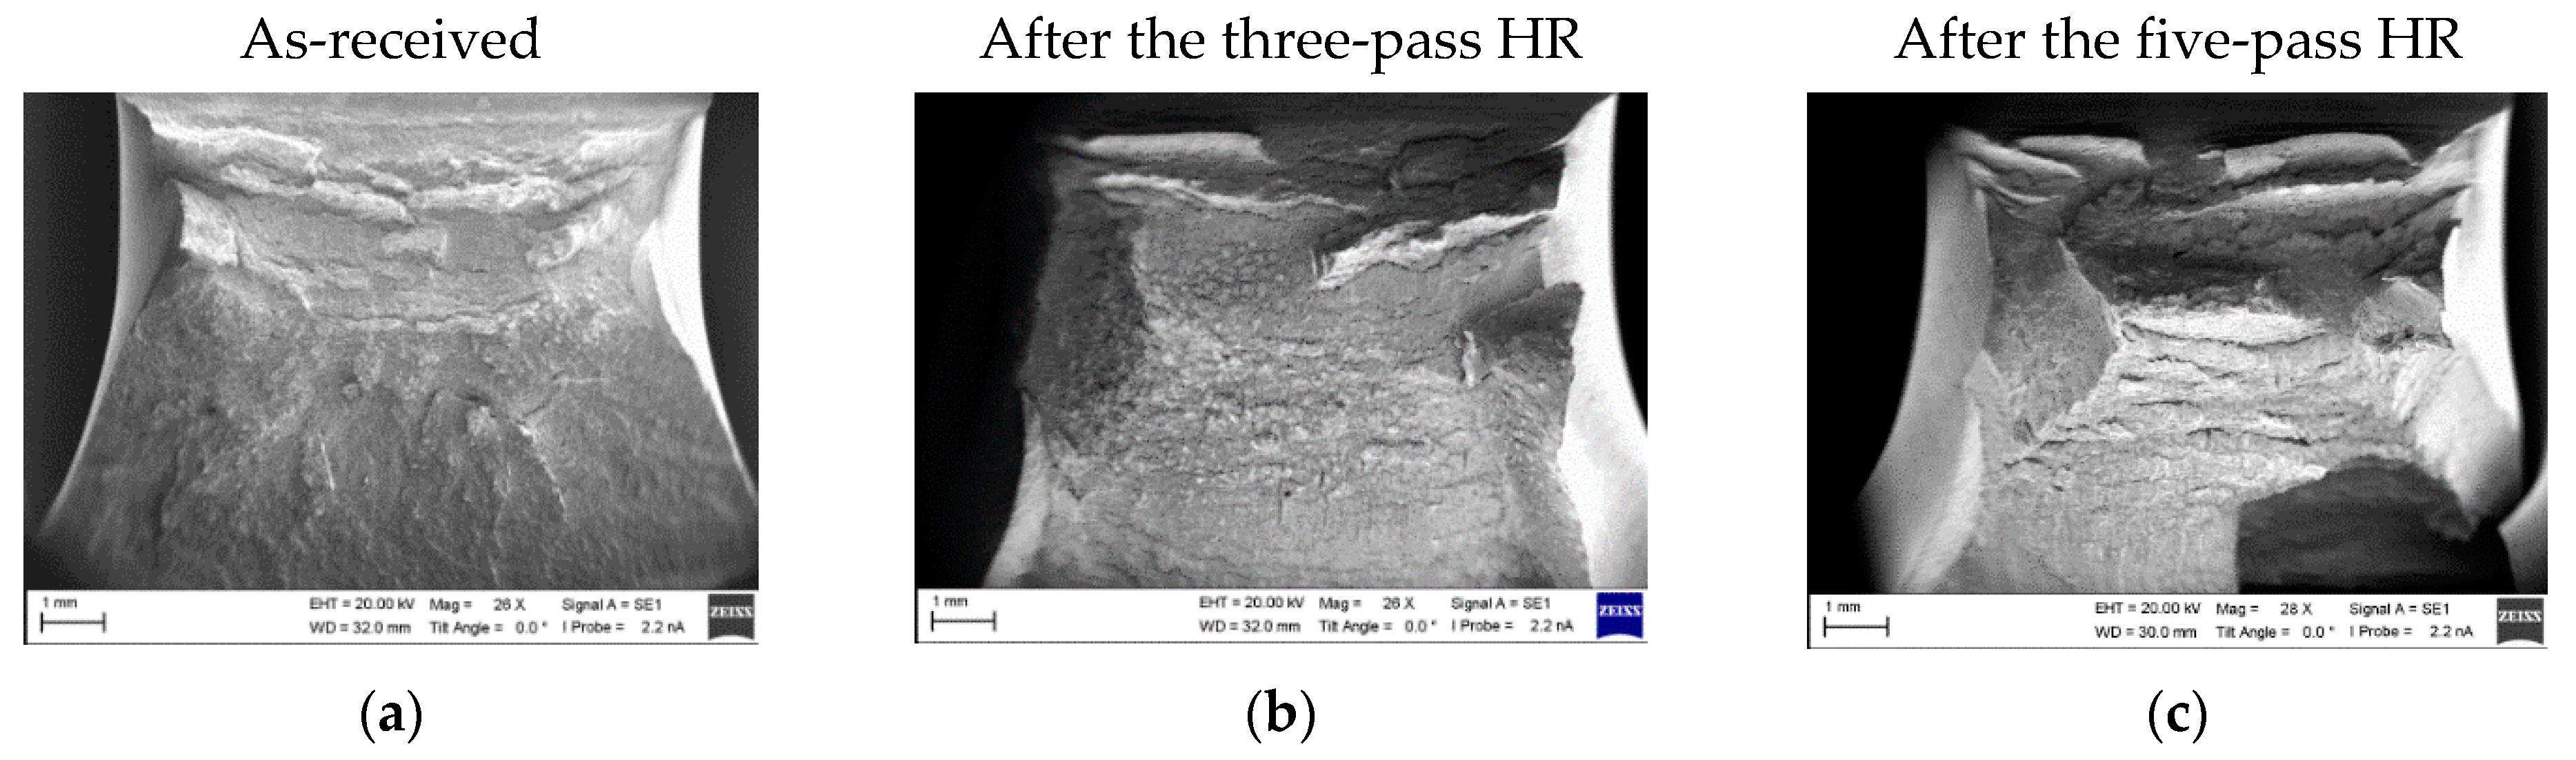
A study of the microstructure and the mechanical properties of the 09Mn2Si HSLA steel was carried out after the three- and five-pass HR processing. After three passes, toughness increased by 10% at the temperature of +20 °C, while it enhanced by 25% after five passes. When the temperature dropped below −20 °C, the impact toughness of the as-received steel specimens sharply decreased, and the difference (in comparison with the specimens after the HR) reached 60%.
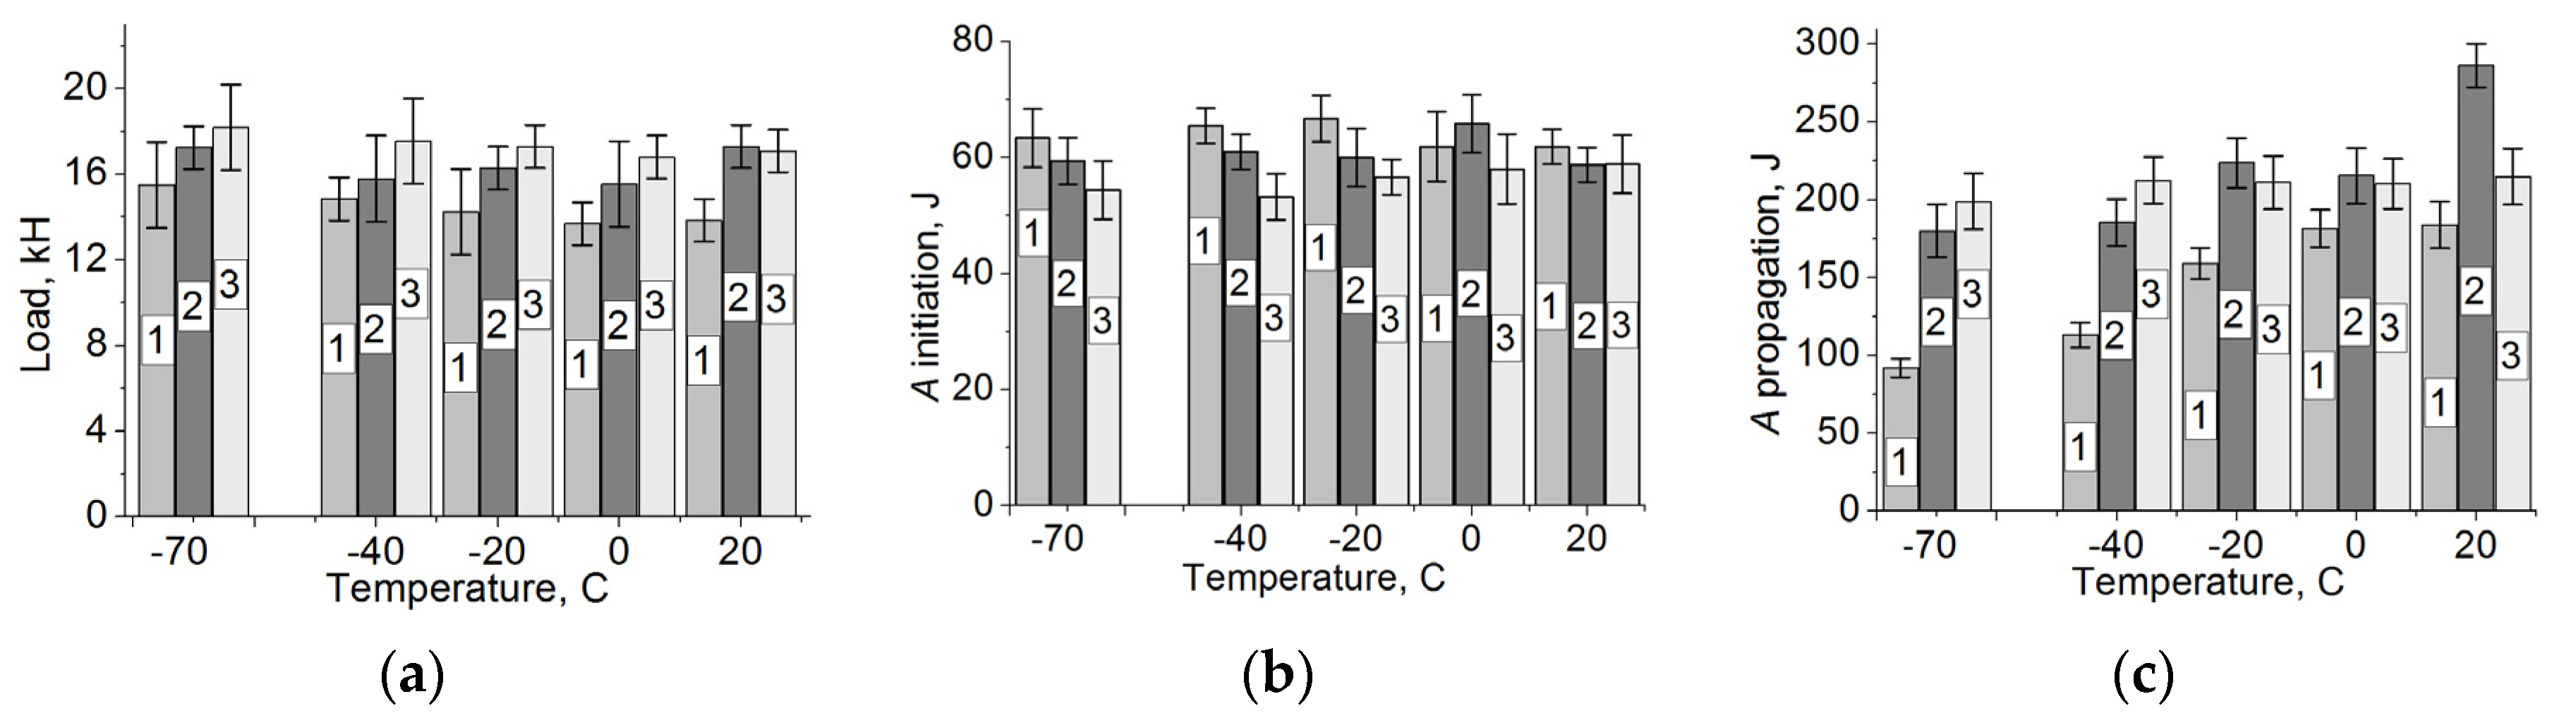
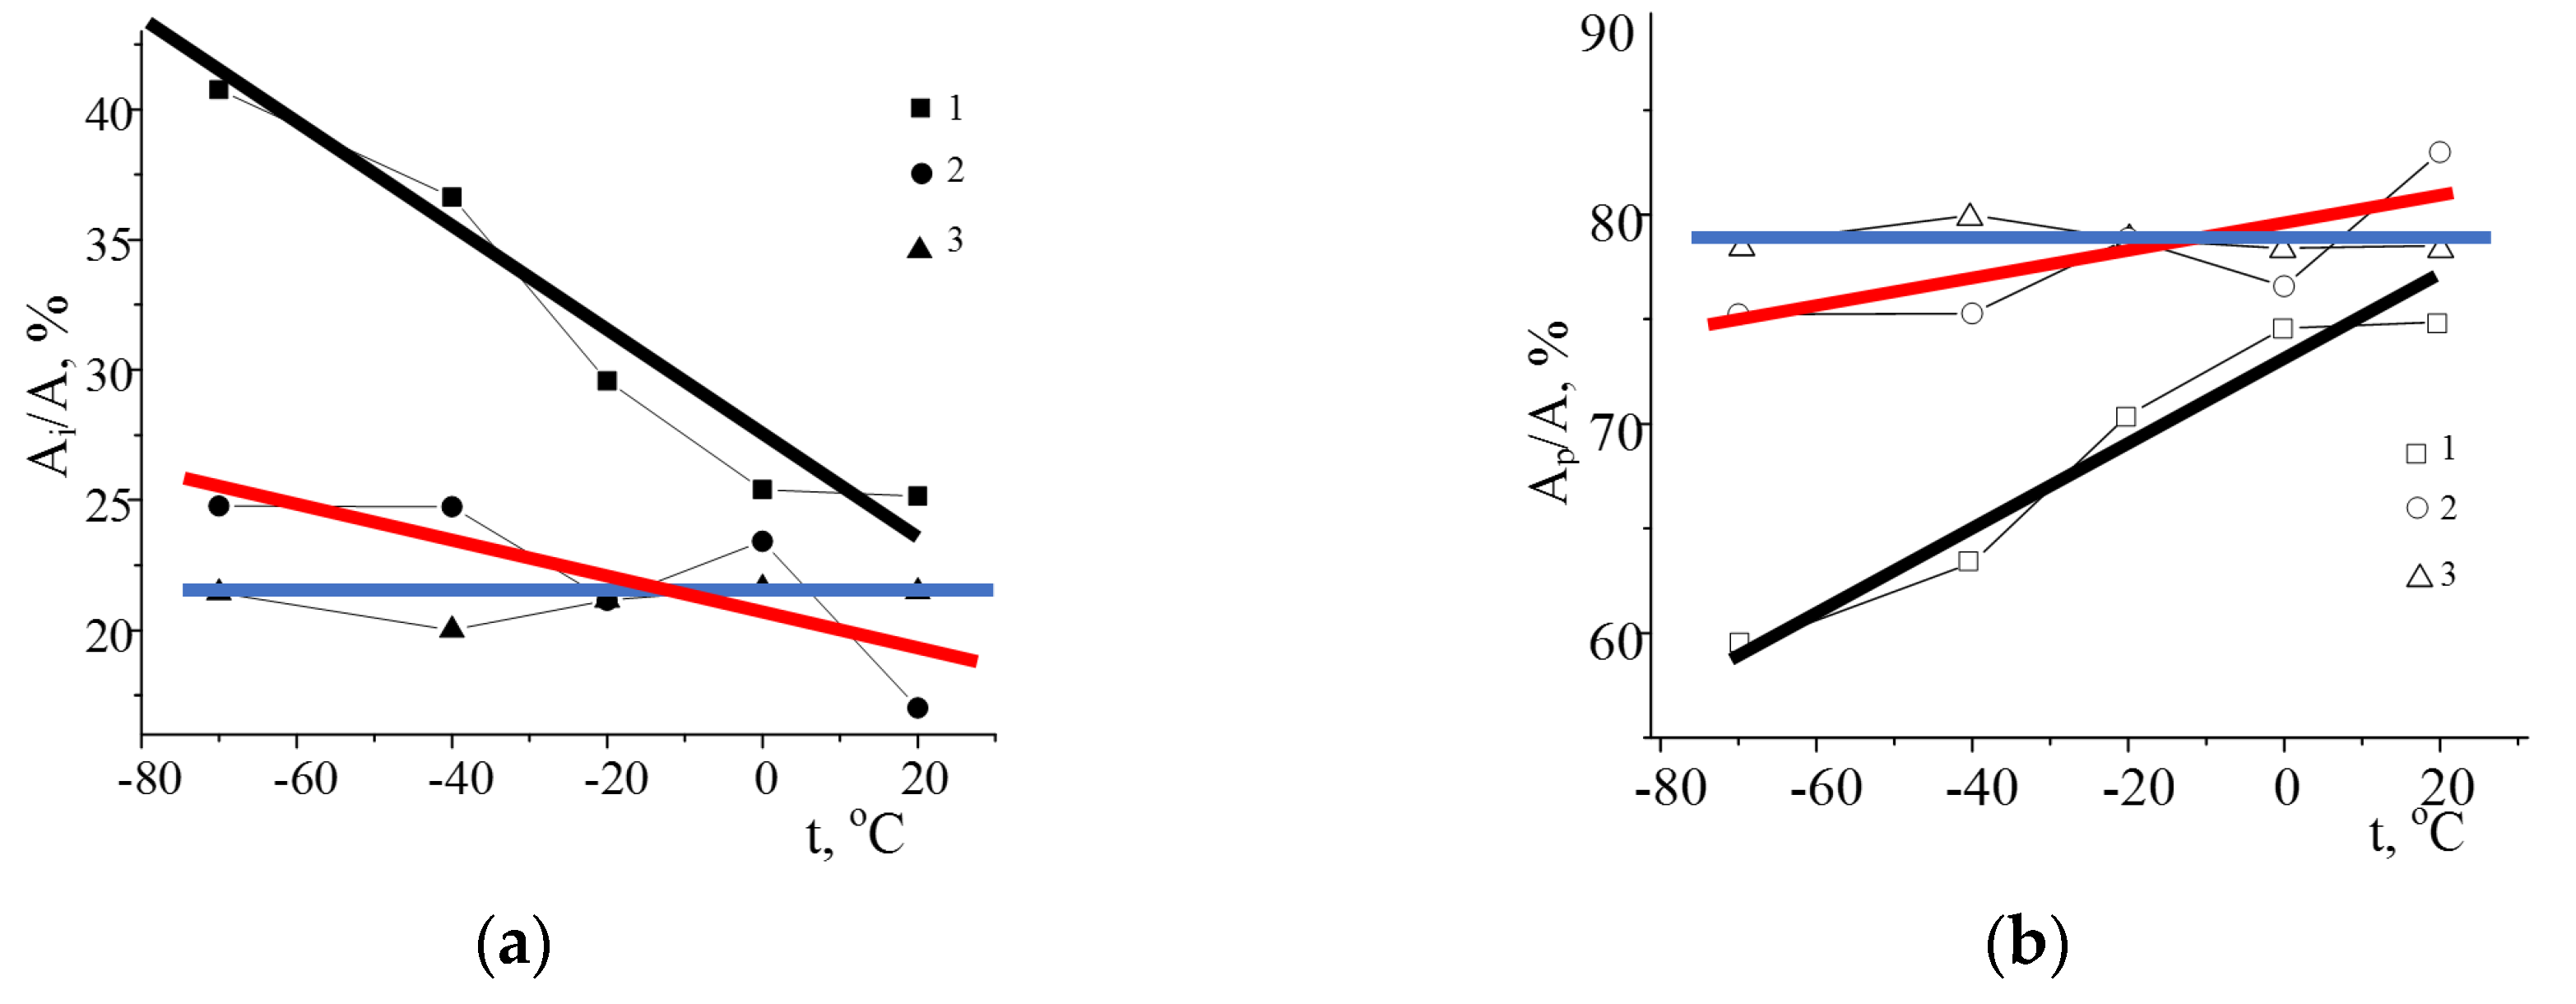
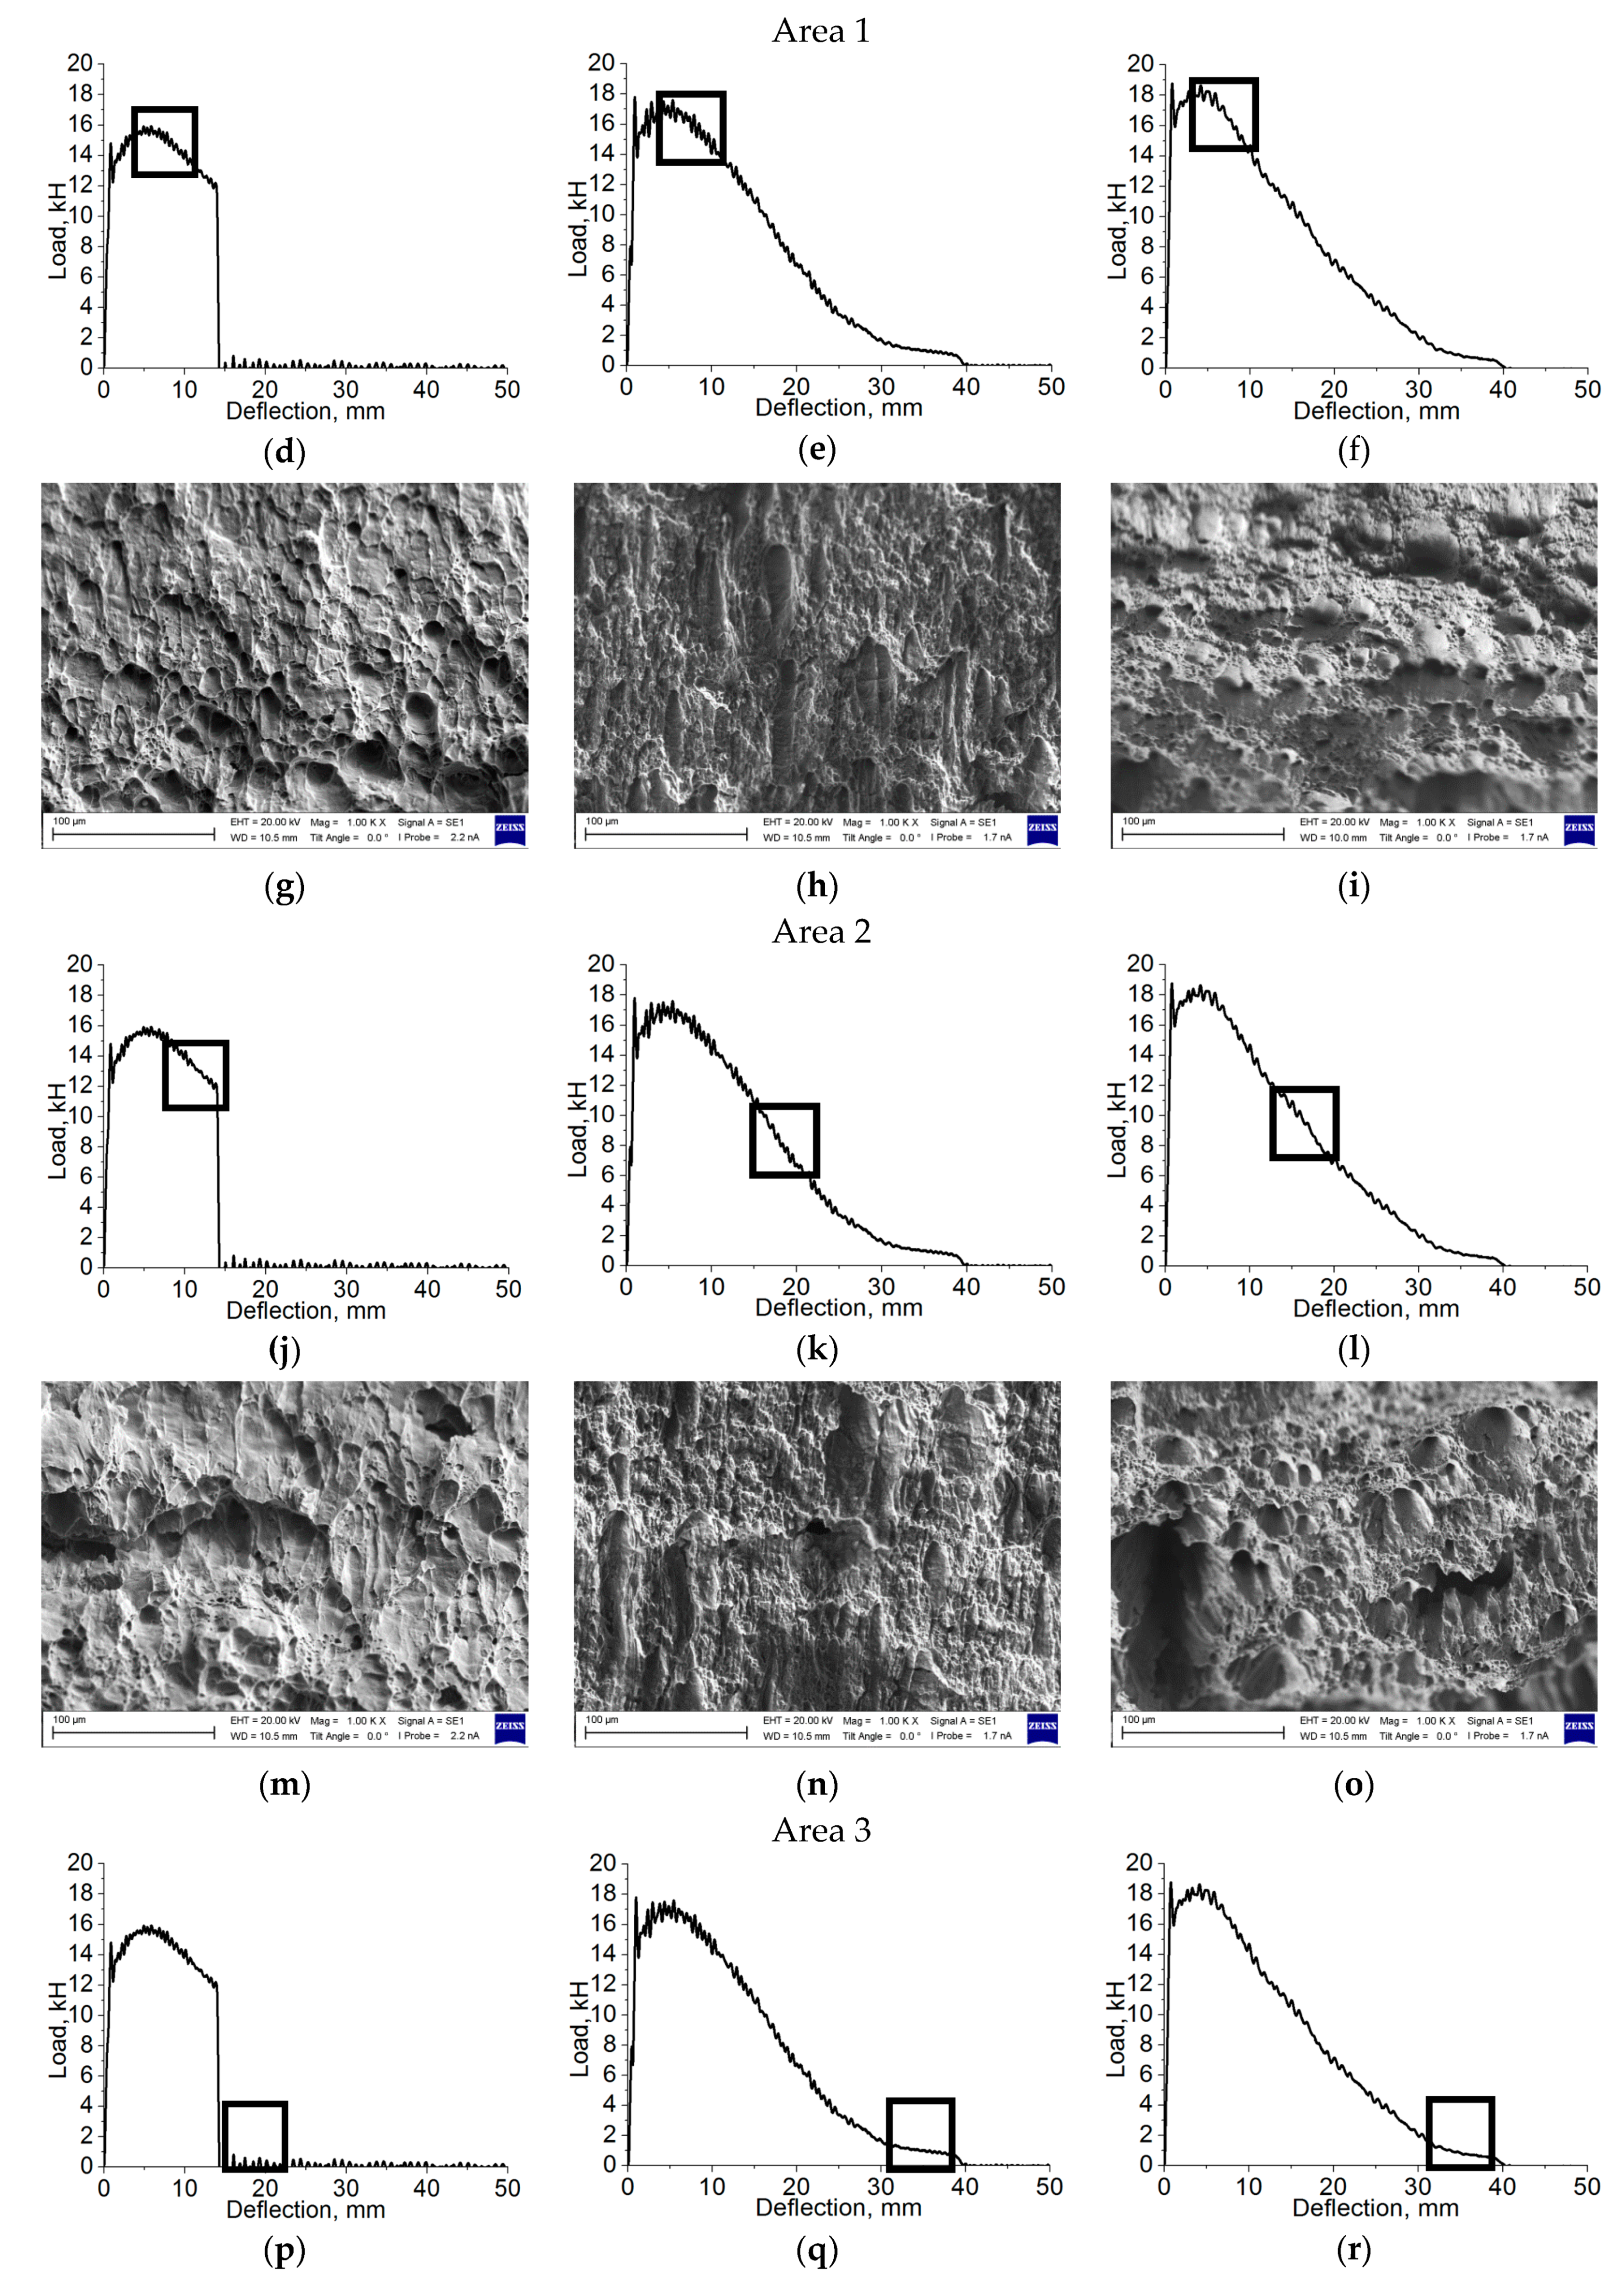
It was found that the contribution of the crack initiation energy Ai to the total energy consumption decreased for all specimens with reducing test temperature. Higher values were typical for the as-received steel, while lower levels were observed for ones after the five-pass HR. Thus, the main reason for the increase in impact toughness of the steel after the HR, according to the test results of work spent to crack initiation and propagation, was the more effective fracture resistance at both stages. The lowest values of the spent energy and its sharper decrease with reducing temperature were for the as-received steel specimens.
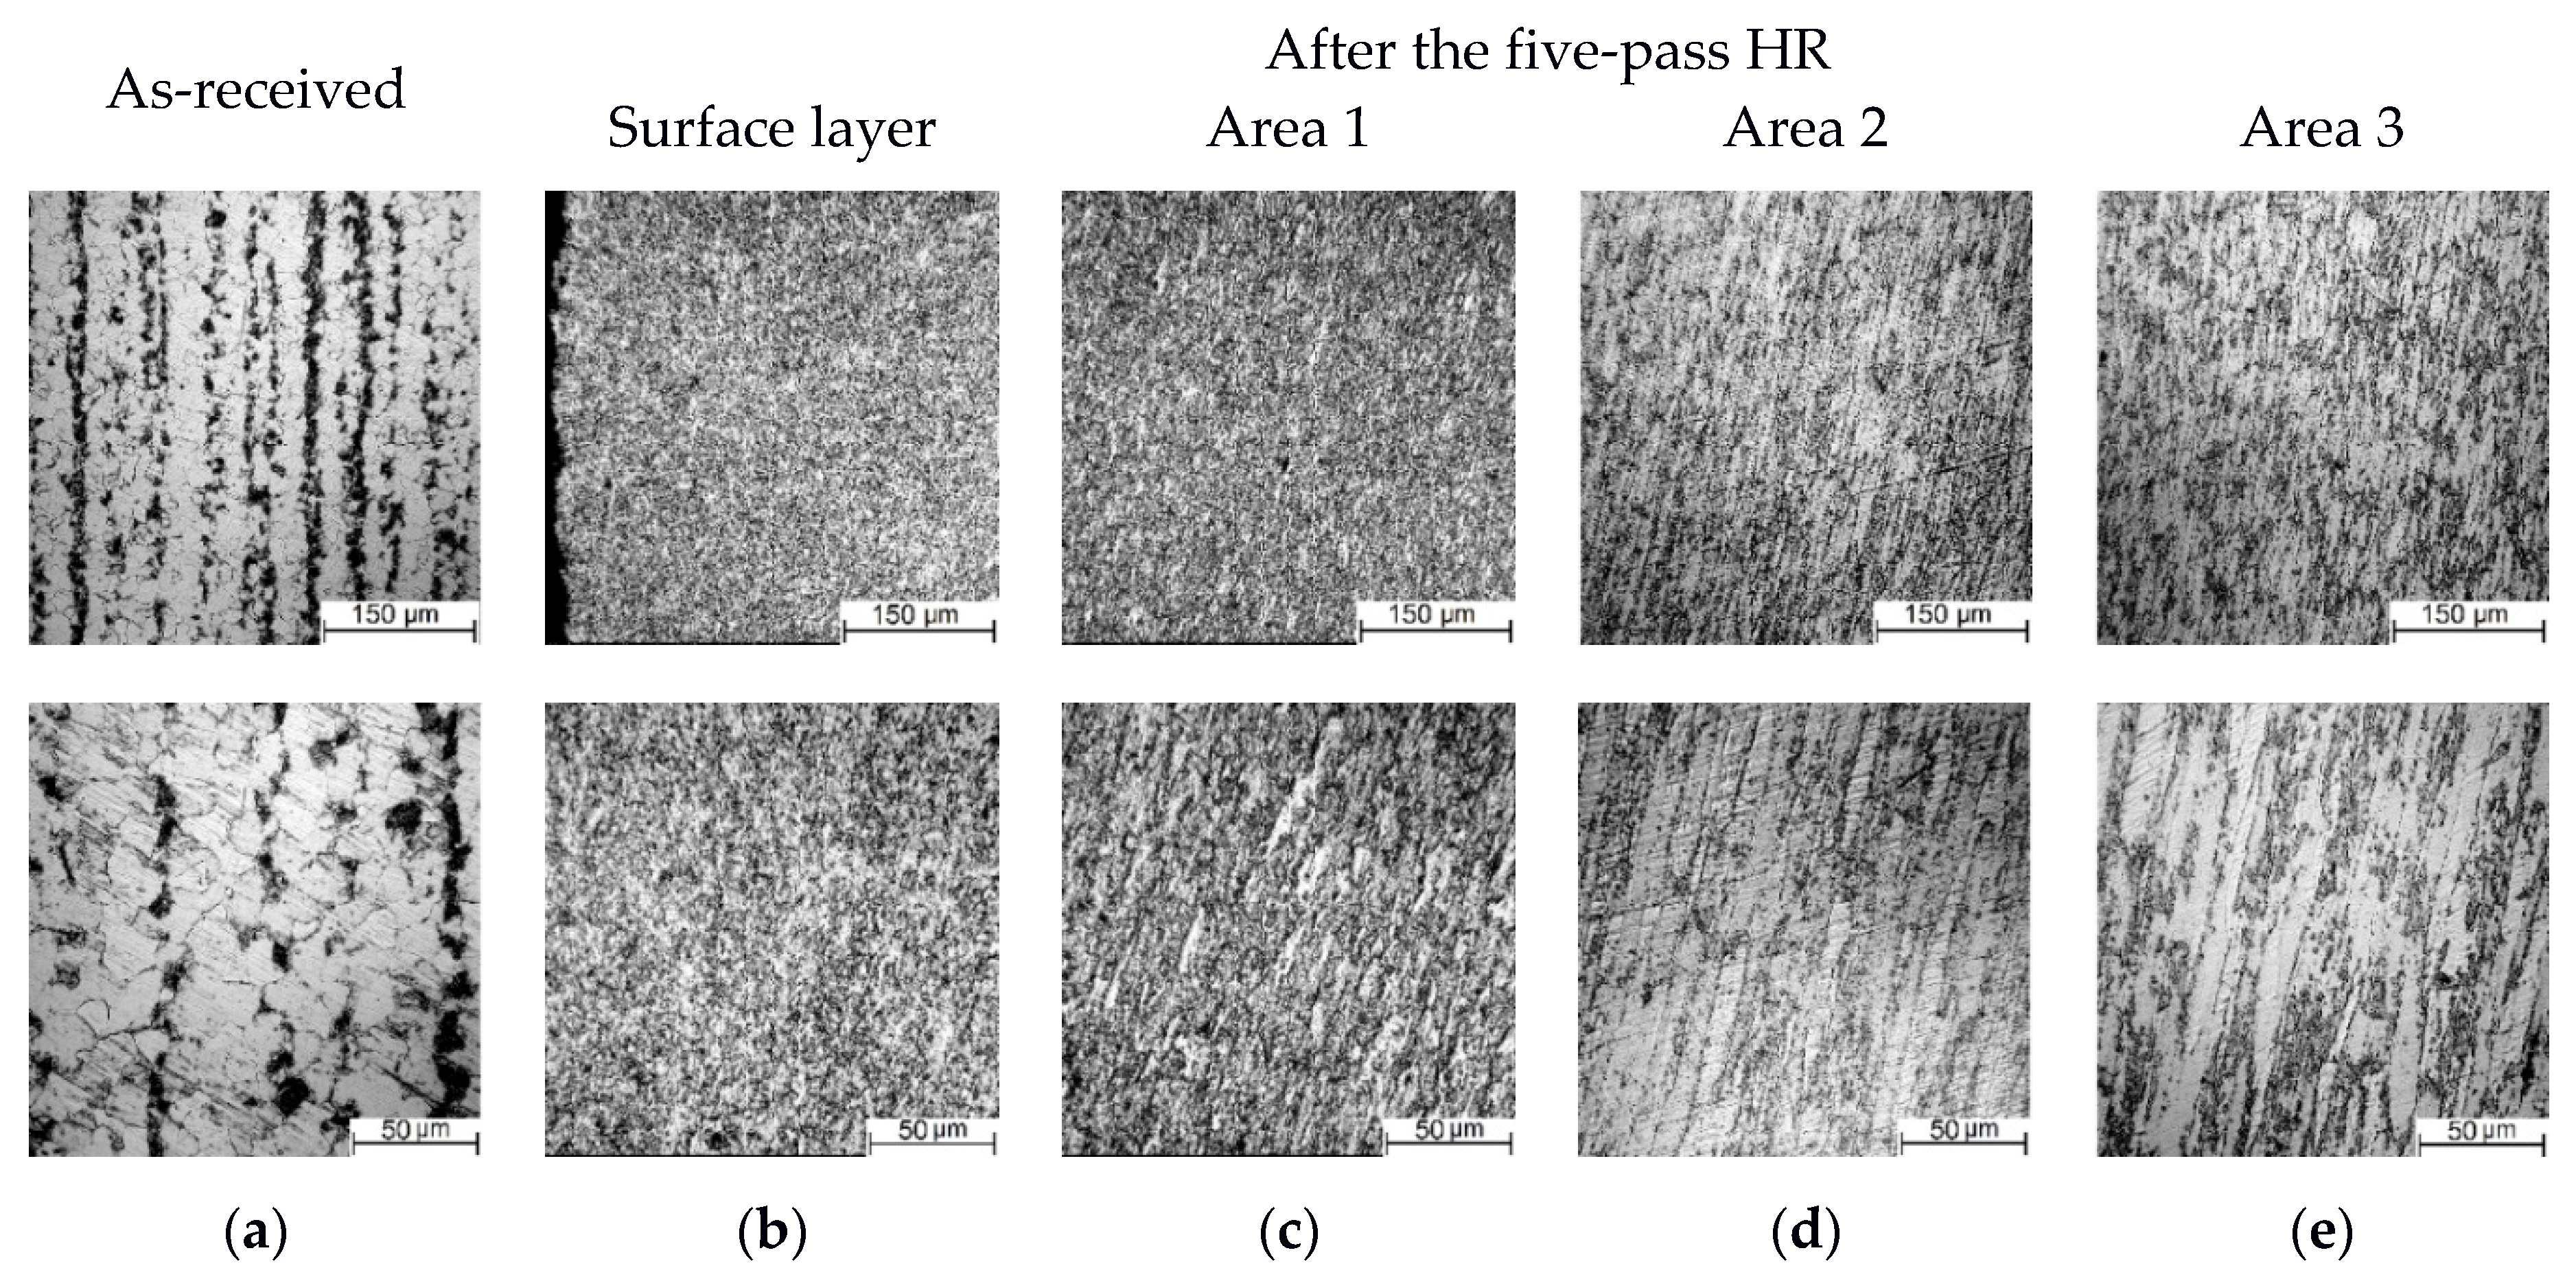
It was shown that the HR processing caused the change in the hierarchy of the microstructure of grains, their shapes and sizes, which affected the mechanical properties of the steel, including impact toughness. A decrease in the grain sizes resulted in a significant increase in the structural heterogeneity of the steel at the micro-level. This resulted in two main effects. First, the crack initiation energy intensity decreased. Second, the crack propagation energy intensity increased, which was associated with high energy spent to crack propagation in the micro-composite with the lamellar mesostructure.
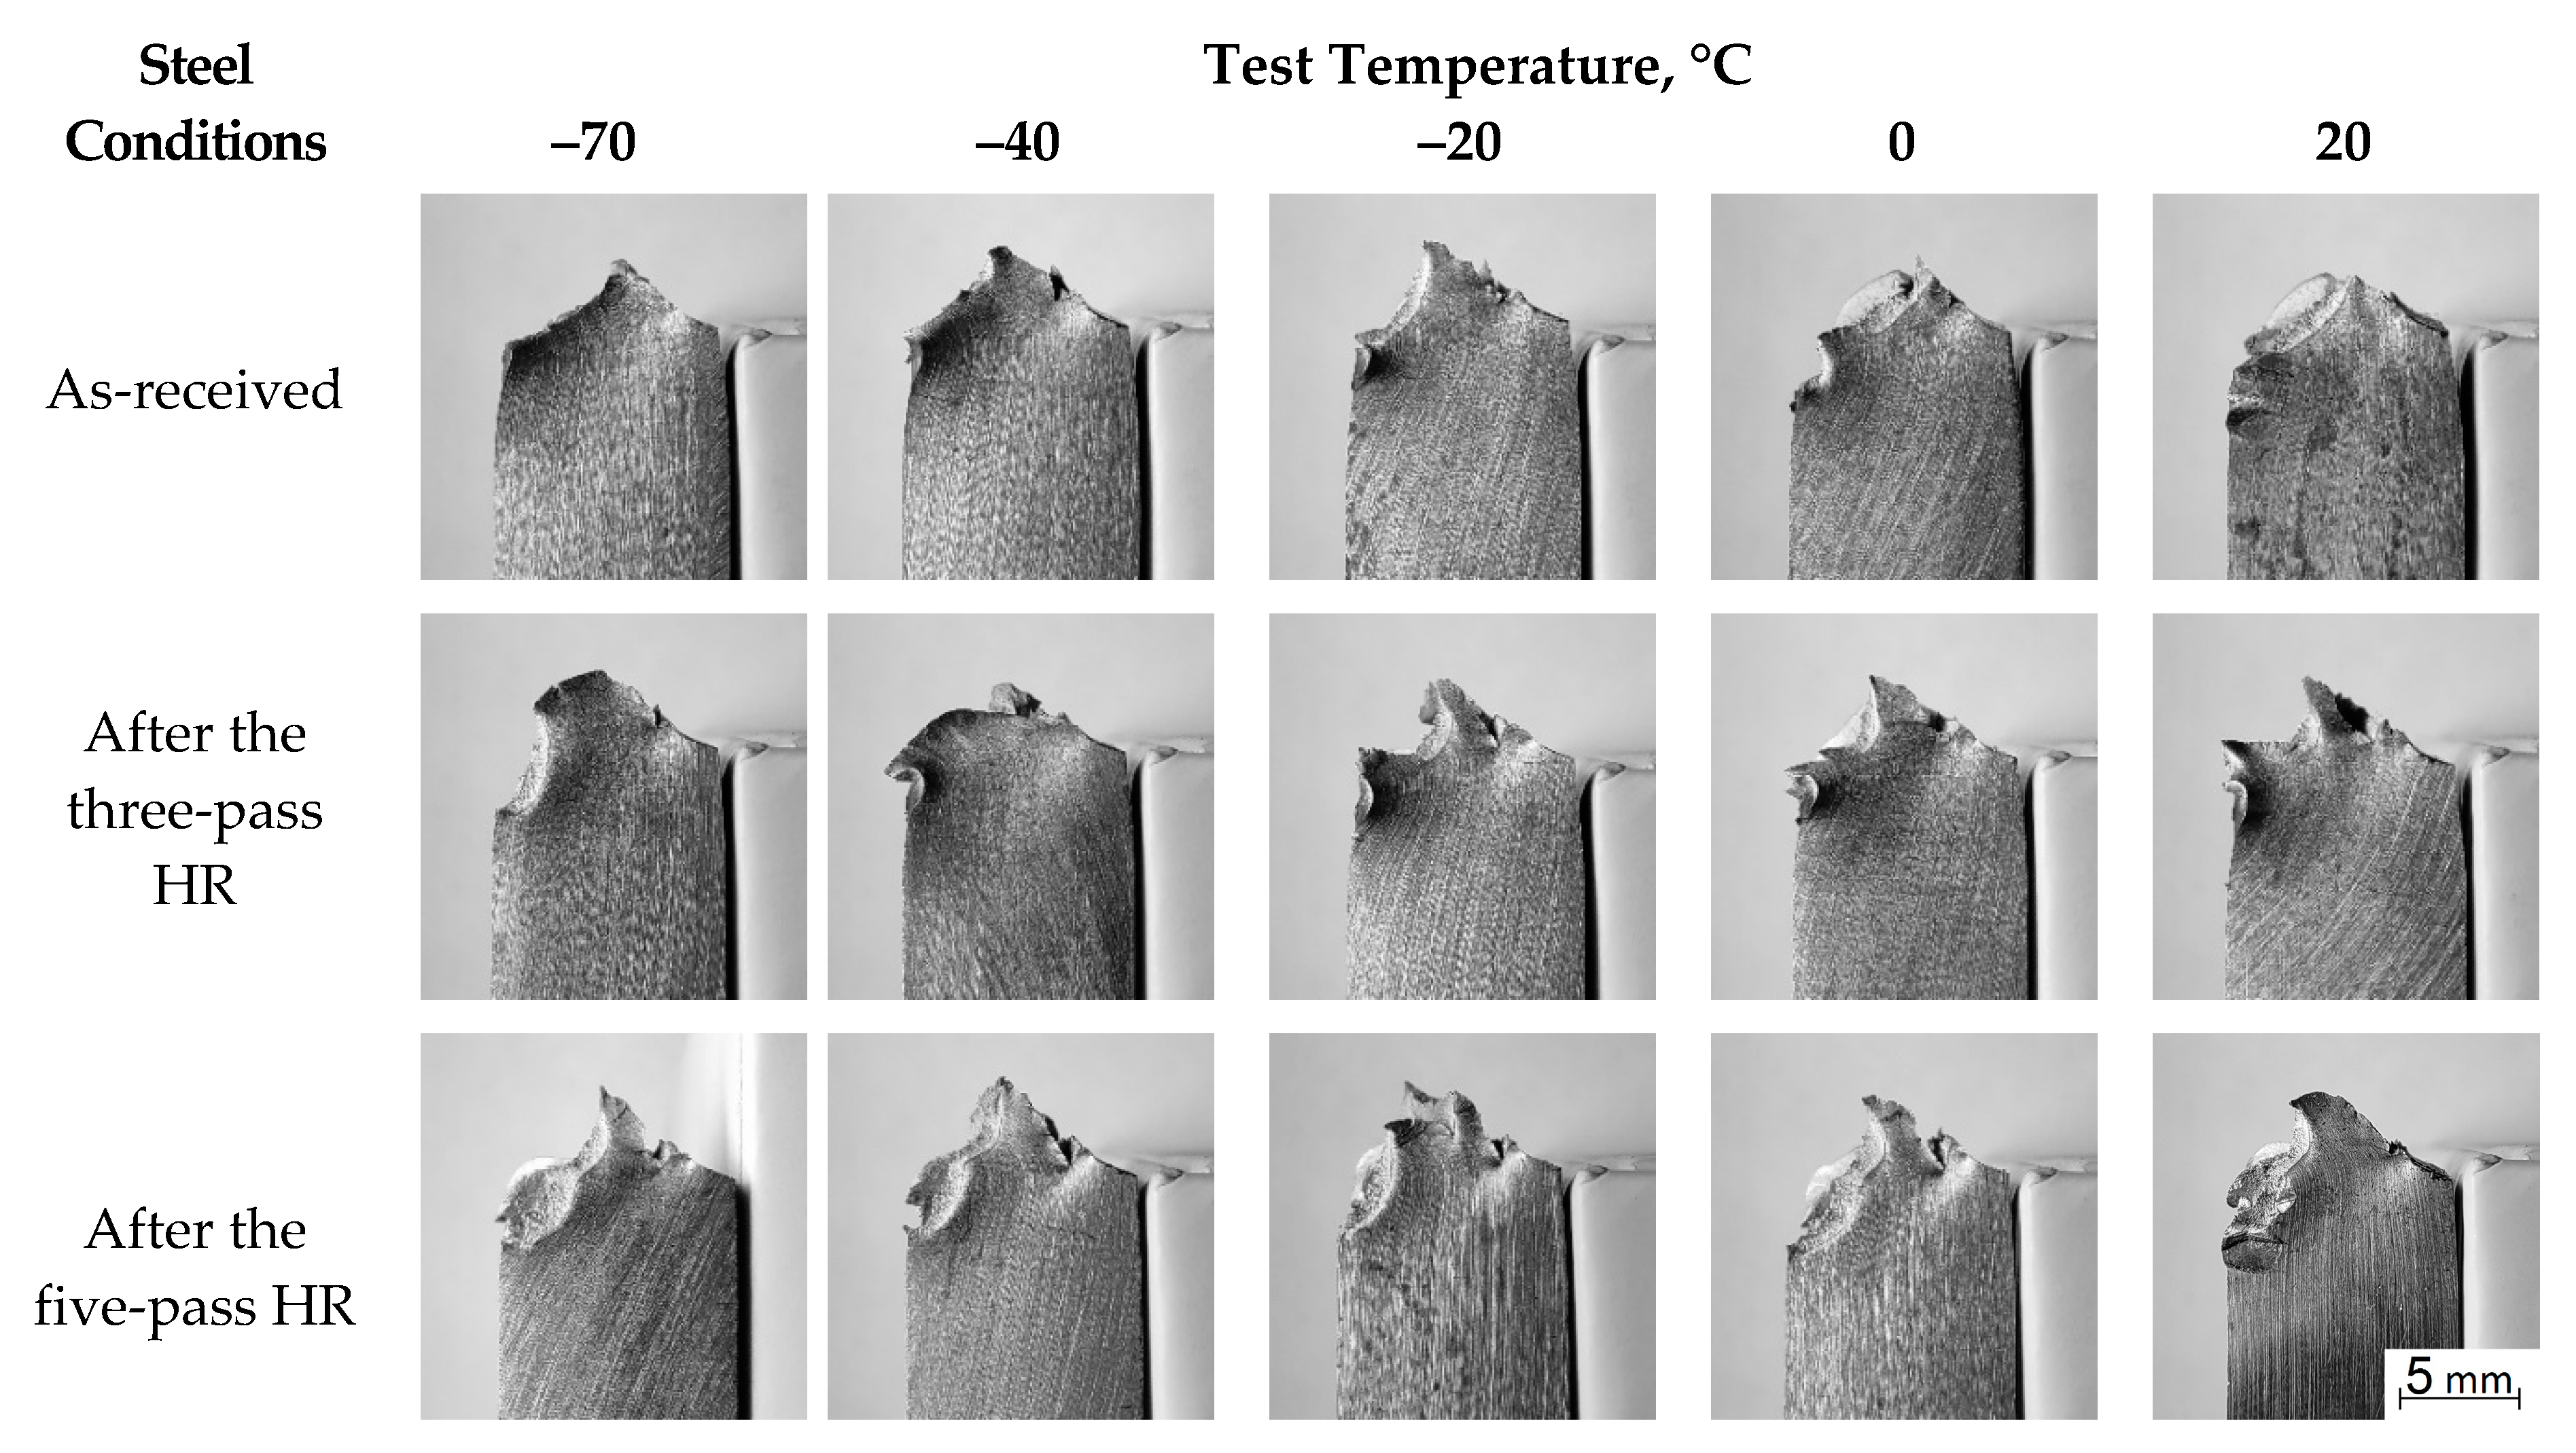
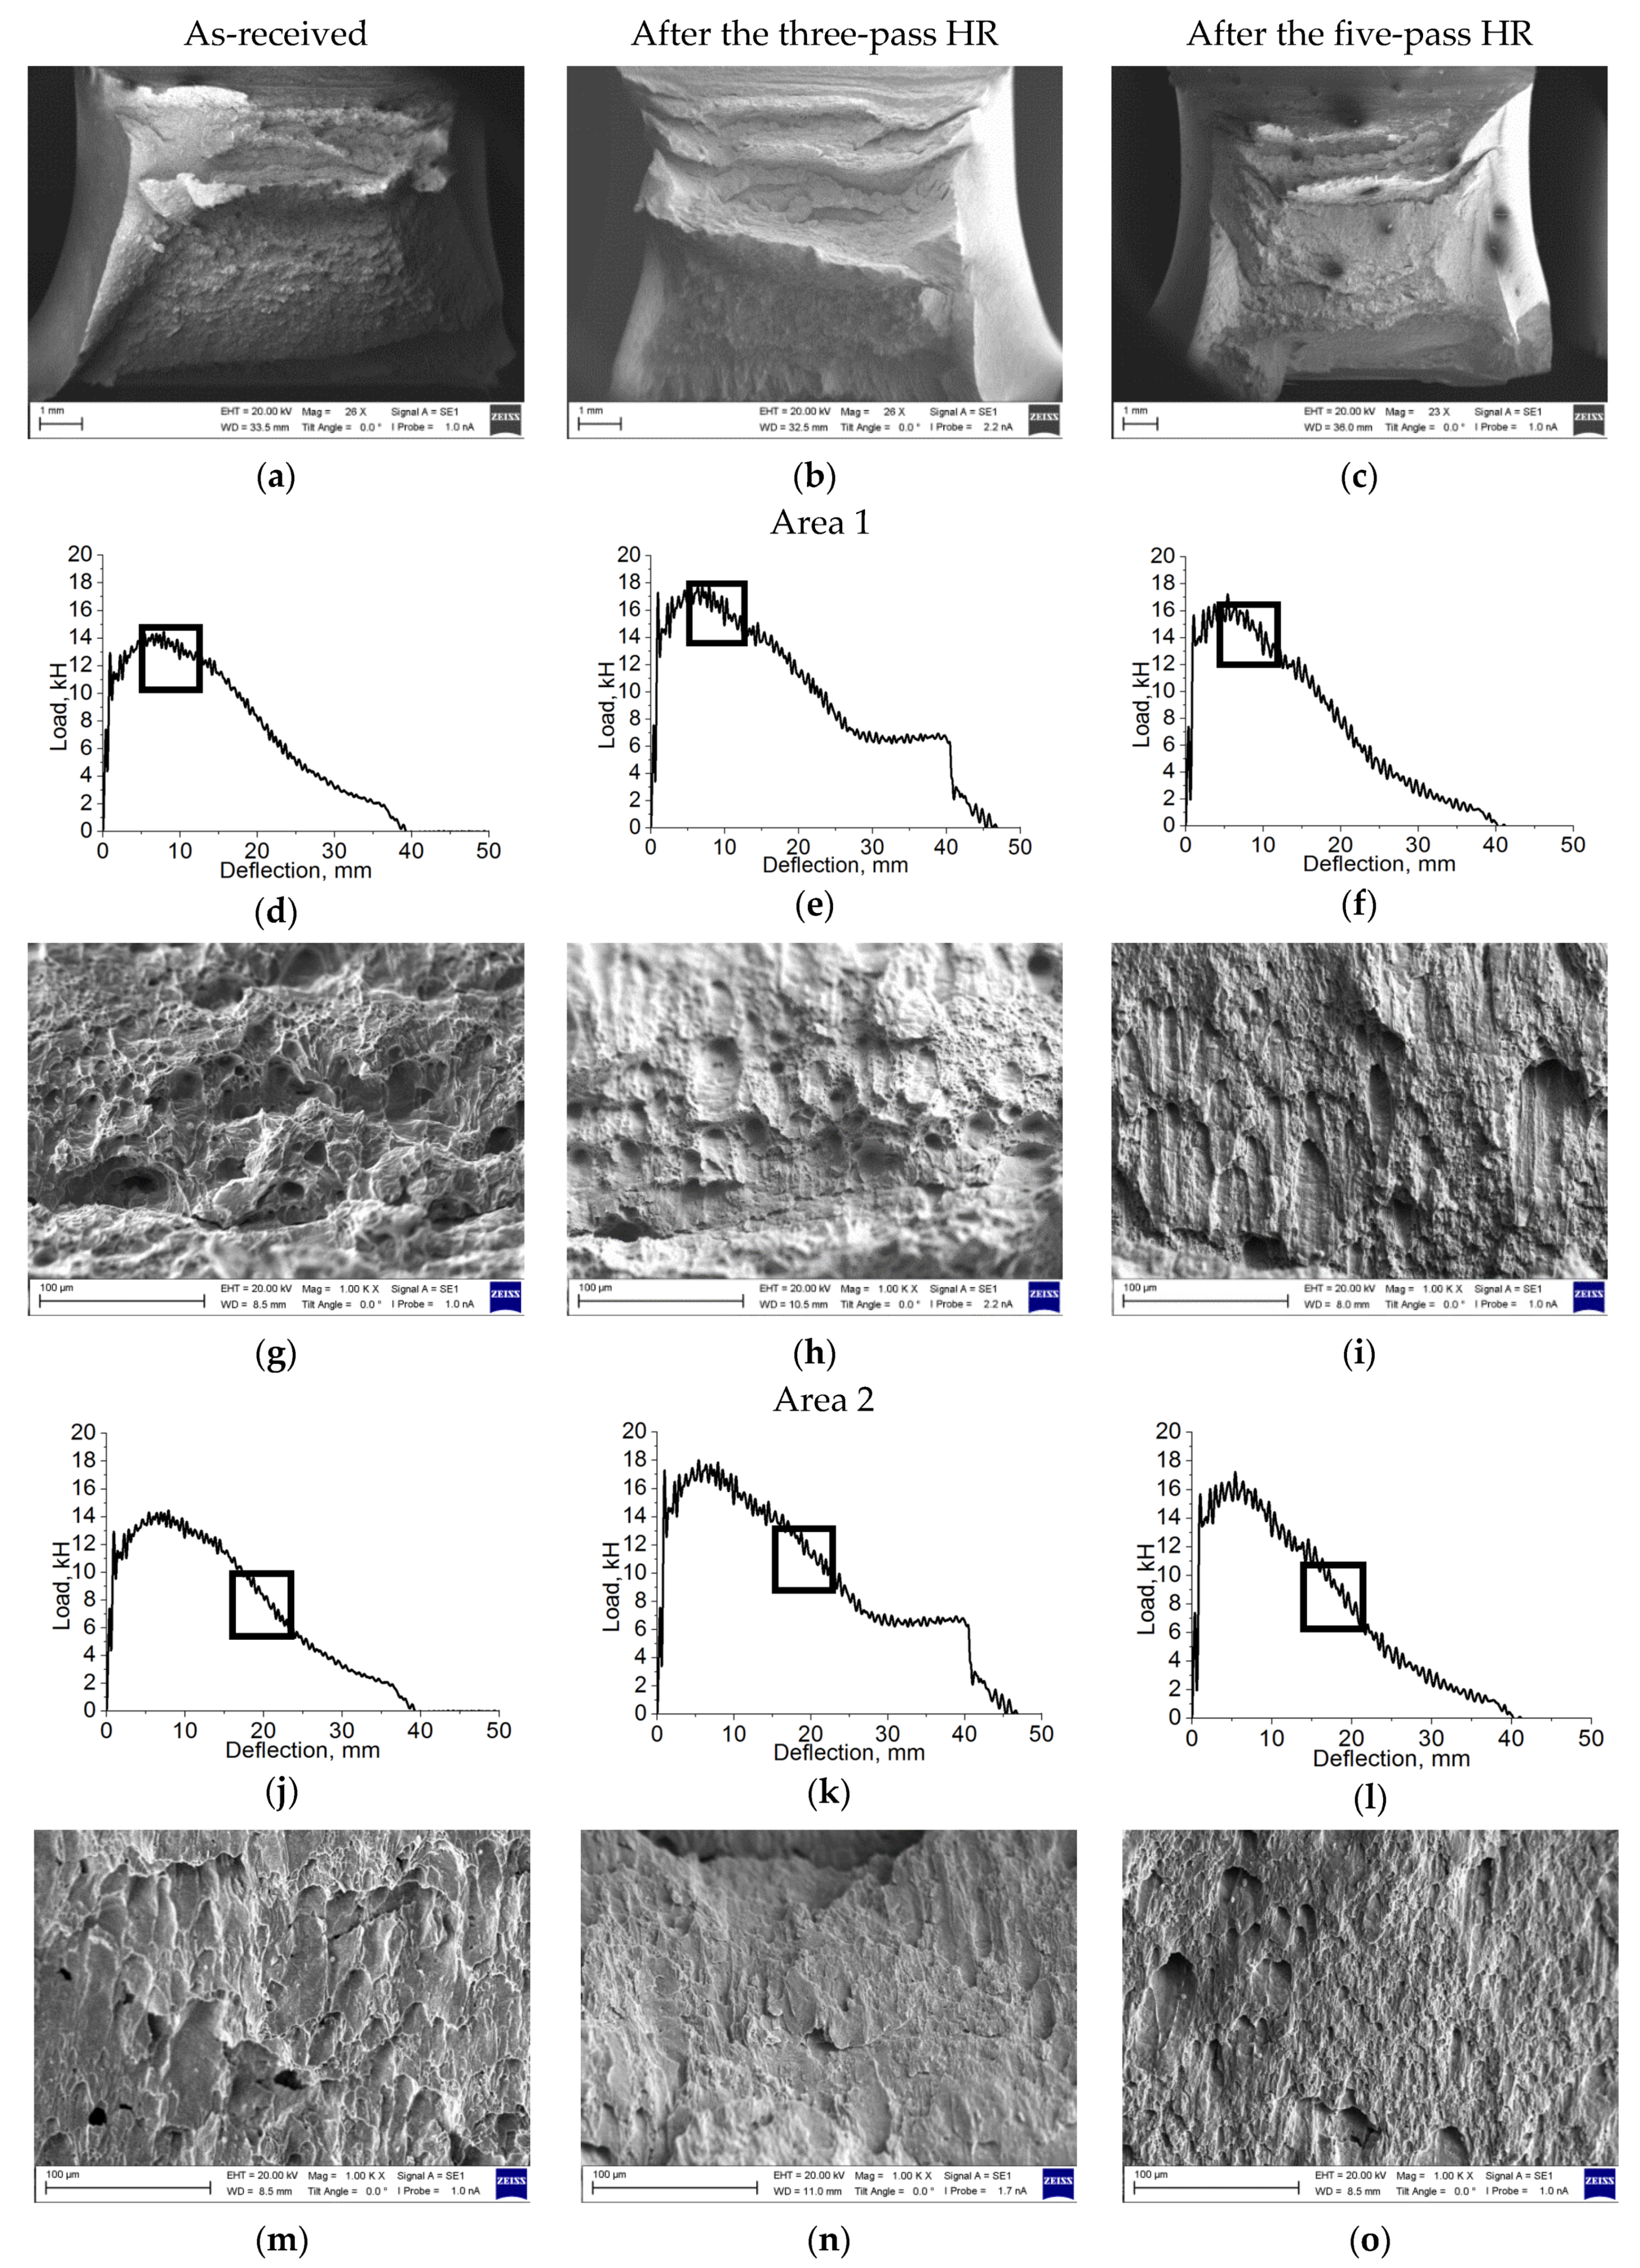
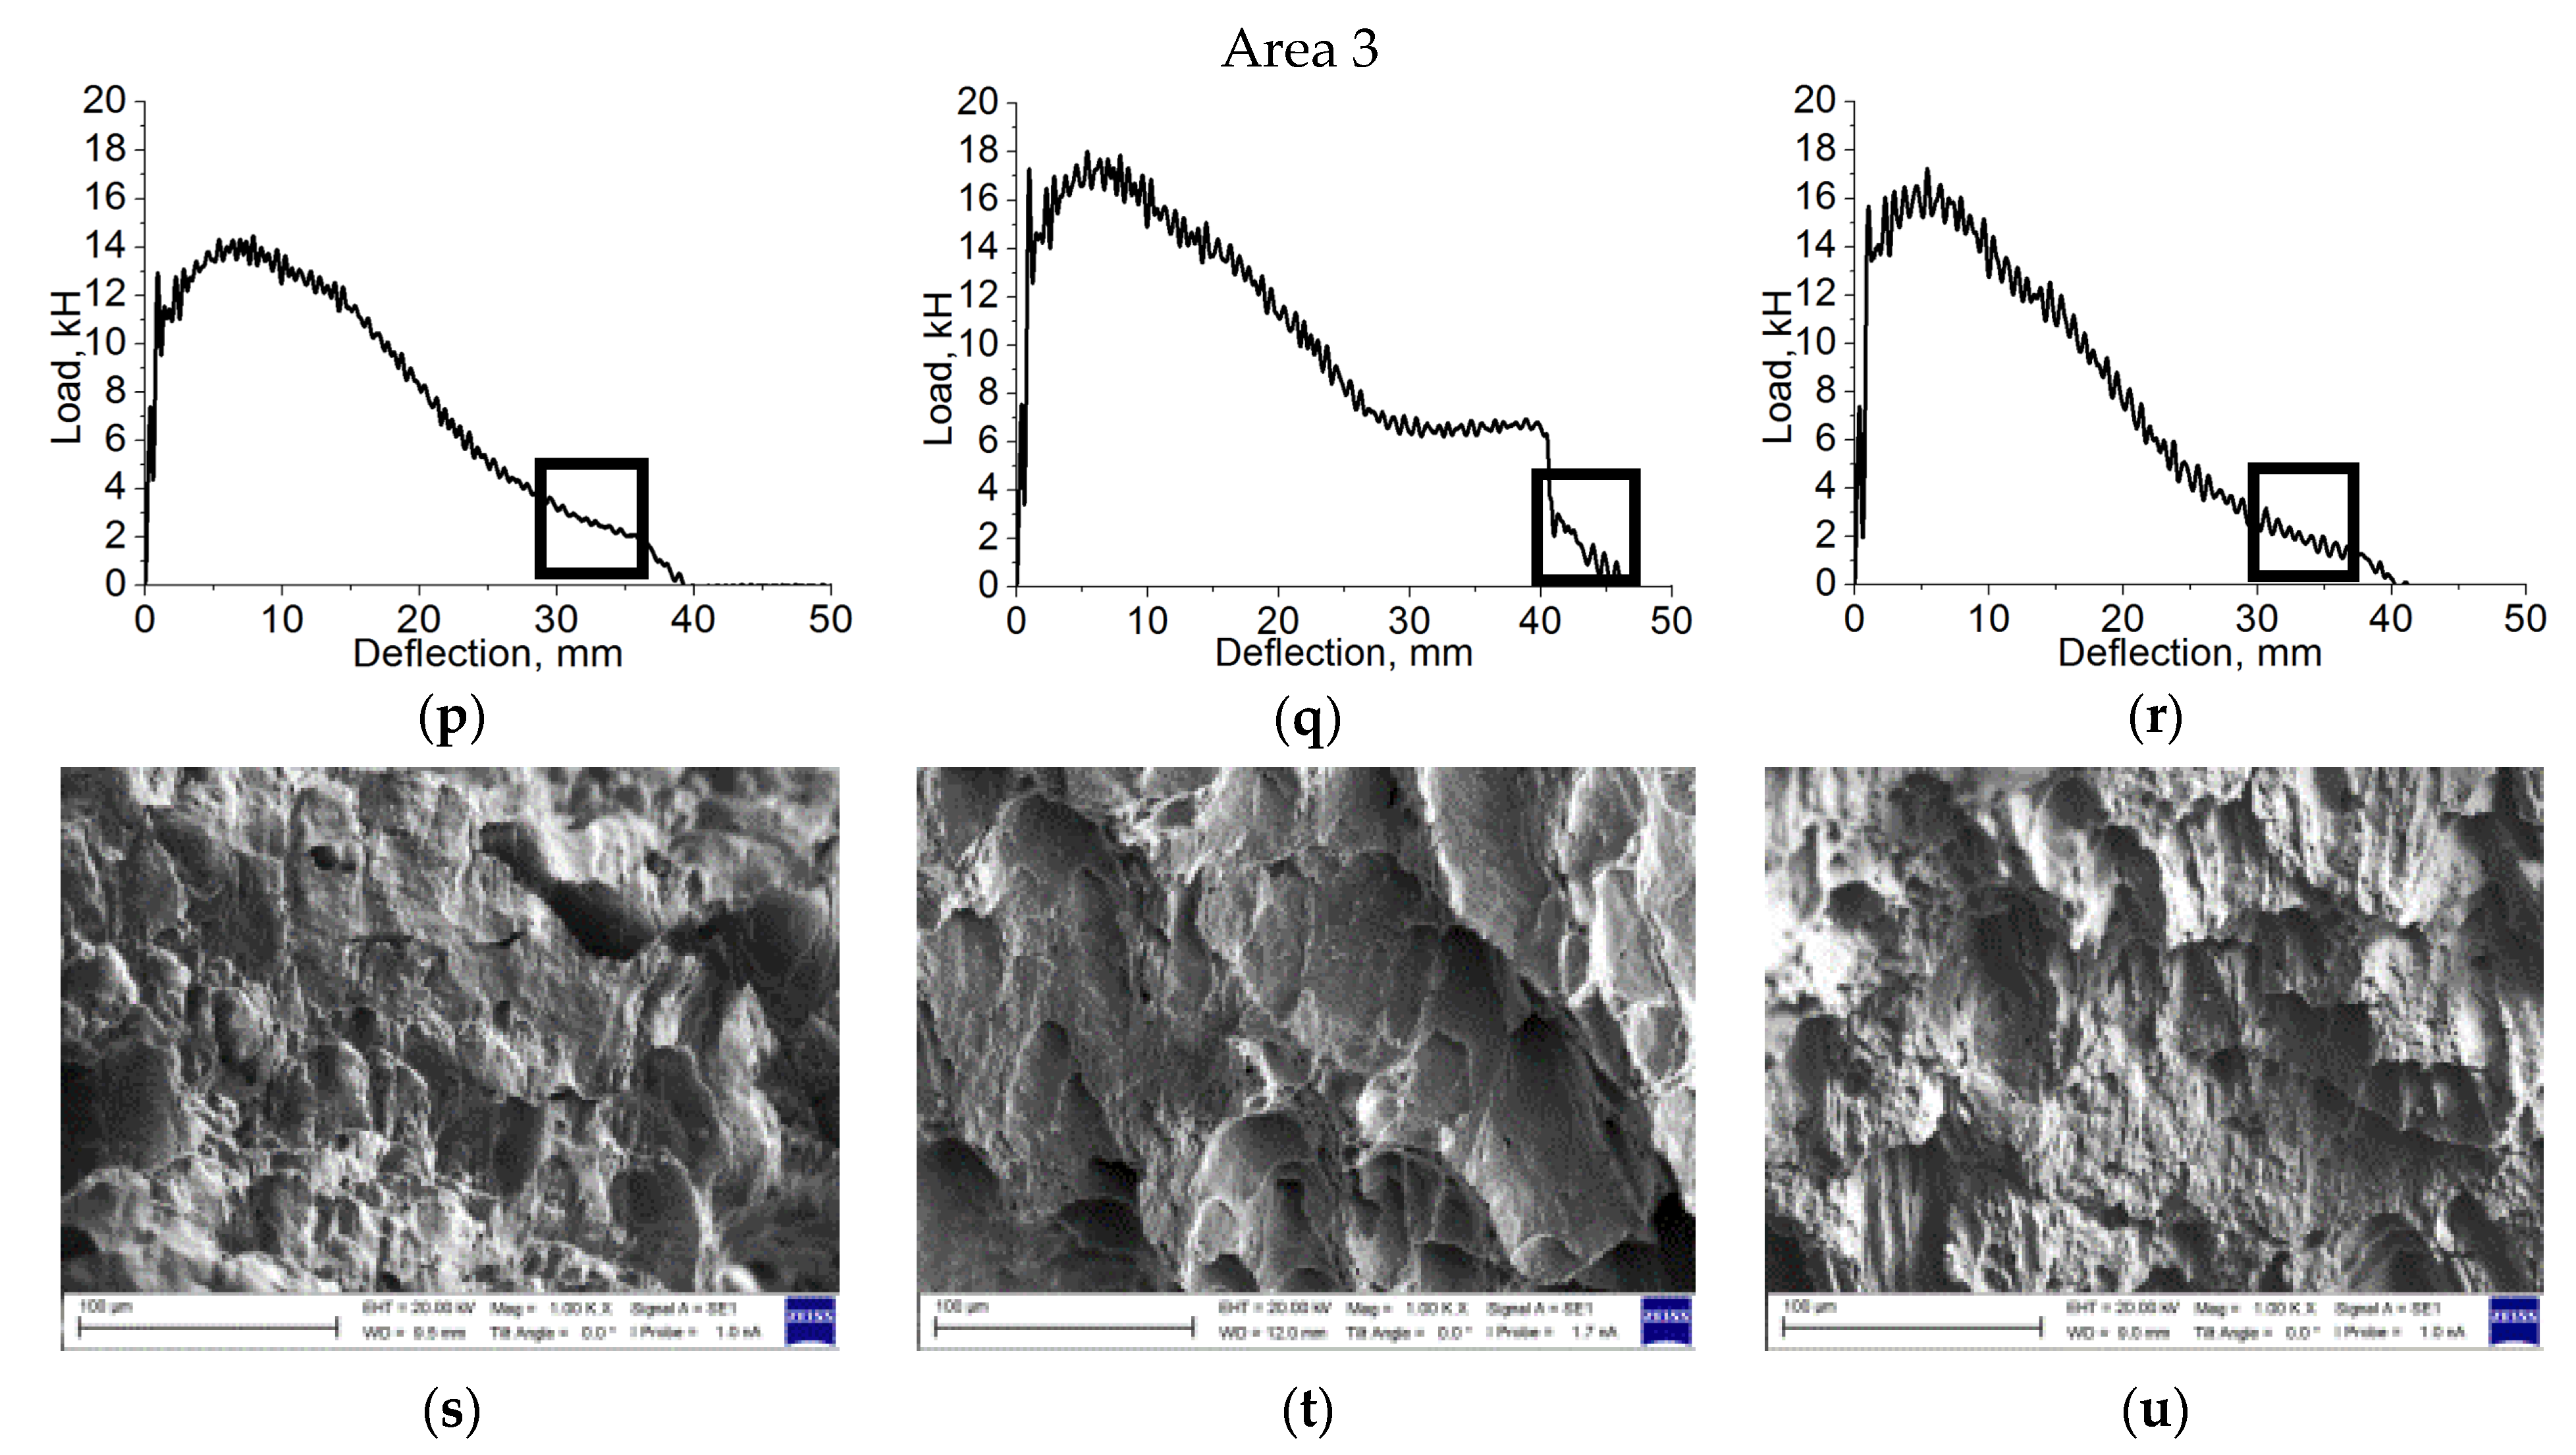
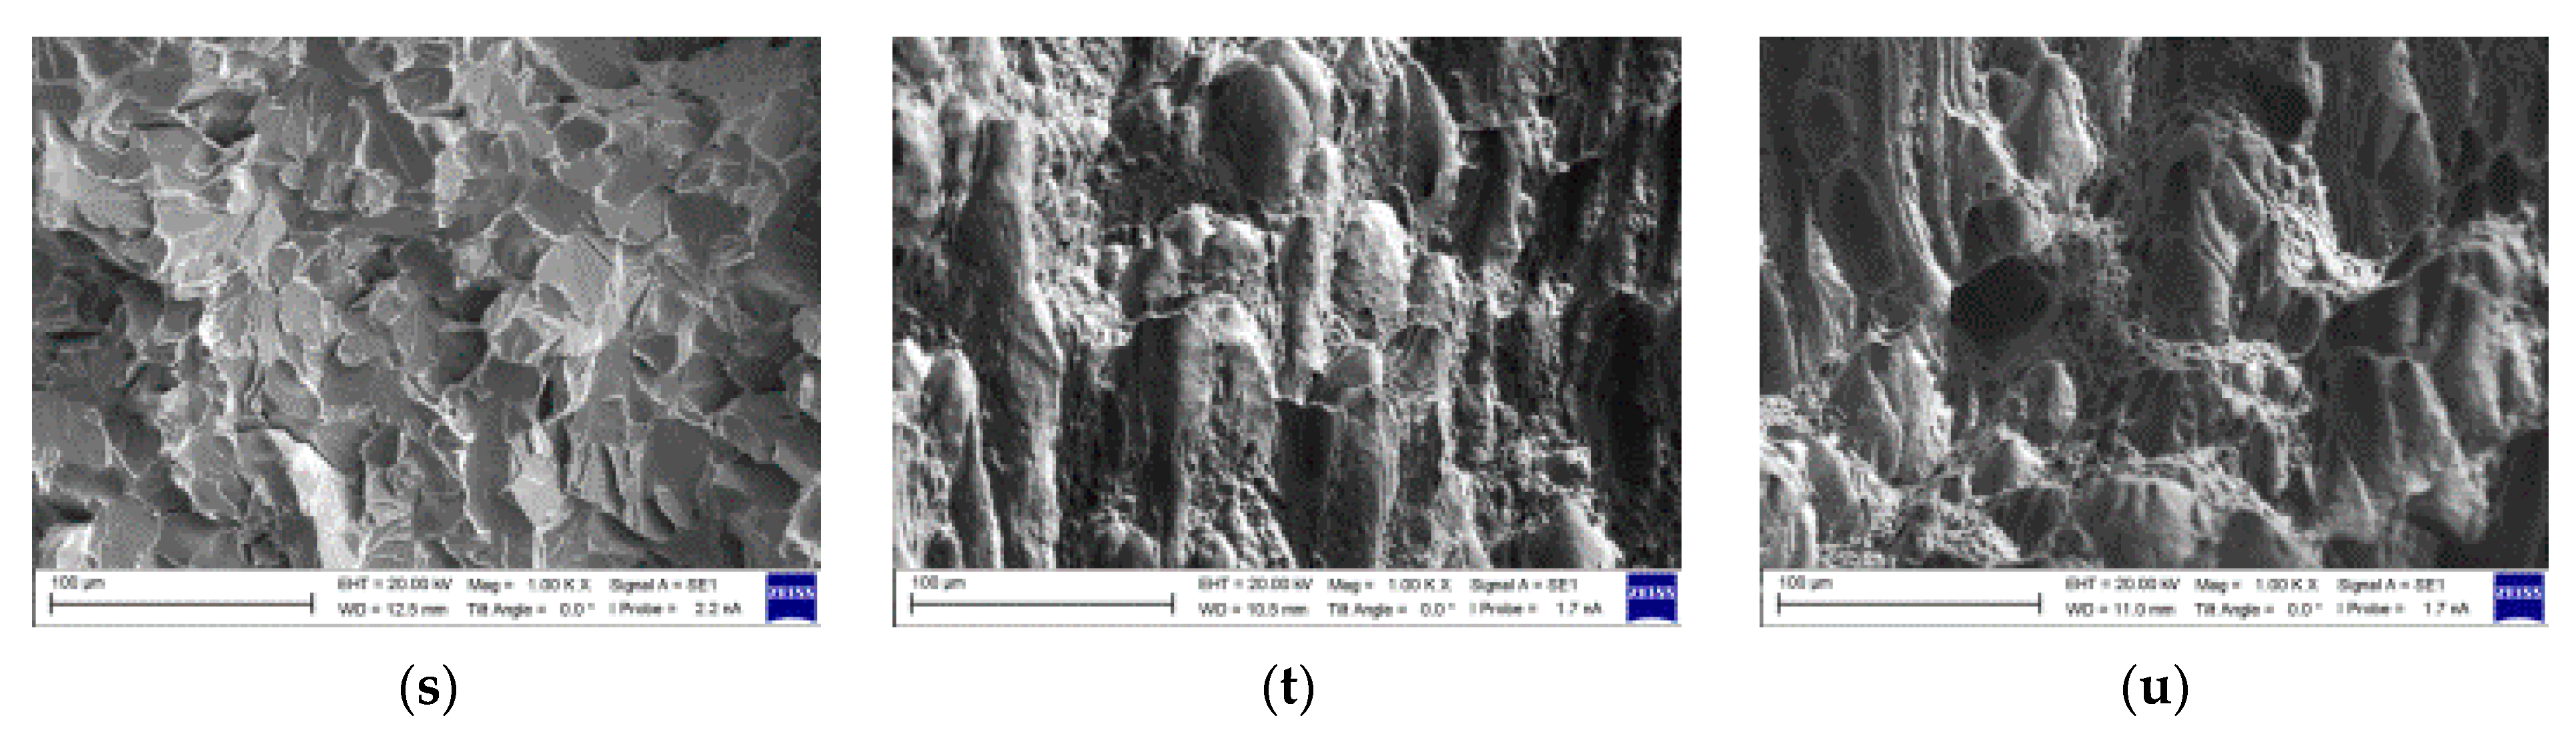
It was shown that the greatest difference in impact toughness, which manifested itself at the temperature of −70 °C, was reflected in the corresponding fracture surfaces. At the micro-level, the surface of the crack initiation and propagation areas was formed due to shear strains for the as-received steel specimen. The fractographic surface had a smoothed, ‘structureless’ appearance with micro-fractures mainly at the boundaries of the deformed micro-zones. The fractographic relief reflected the ductile-brittle pattern of fracture. The specimens after the HR retained the shear fracture (there were no ductile tear dimples). The surface had the more ‘smeared’ and ‘structureless’ character. No noticeable distinctions were found in the fractographic pattern of the specimens after the three- and five-pass HR.
Within the framework of the theoretical section, the advanced algorithm was proposed to calculate the probabilities of the initiation of microcracks under impact loading, which was based on the kinetic theory of fracture. Analysis of the graphs of the changes in various energy components enabled to identify the points of saturation of the specimen with the defect microstructures and, thereby, to determine the macro-crack initiation beginning. The nature of the distribution of the probabilities of microcrack nucleation at the temperature of +20 °C showed the highest energy intensity and damping ability of the anisotropic microstructure with grains oriented across the impact load axis. On the other hand, the lamellar microstructure with grains oriented along the load axis demonstrated the ability to disperse microcracks at low temperatures. For this reason, the authors concluded that it is advisable to form layered ‘transverse-longitudinal’ lamellar mesostructures in order to achieve optimal parameters of strength and fracture toughness, including at low temperatures.
A comparison of the simulation results immediately after the load application and at the end of loading showed the importance of considering the non-equilibrium process of energy distribution in the analysis of the behavior of various microstructures, especially at under-zero temperatures.
To develop a theoretical method, the authors plan to assess the energy capacity of various types of (experimentally detected) grain microstructures on the basis of the concentration criterion, primarily from the standpoint of the ability to accumulate micro-defects without loss of bearing capacity (failure).


 ,
, 


