Article

On the Wear Behaviour of Bush Drive Chains: Part II—Performance Screening of Pin Materials and Lubricant Effects

1
Chair of Mechanical Engineering, Montanuniversität Leoben, Franz Josef-Straße 18, 8700 Leoben, Austria
2
Miba Gleitlager Austria GmbH, Dr.-Mitterbauer-Str., 34663 Laakirchen, Austria
*
Author to whom correspondence should be addressed.
Lubricants 2023, 11(4), 157; https://doi.org/10.3390/lubricants11040157
Submission received: 11 January 2023 / Revised: 13 March 2023 / Accepted: 21 March 2023 / Published: 25 March 2023
(This article belongs to the Special Issue Tribology in Mobility, Volume II)

Abstract

:
In this second part of the paper series, parameter investigations of the tribological system chain pin/bush contact, carried out on a specifically developed pin on bush plate model test technique, are presented. Both the pin material and the lubricant varied widely. In case of the pin materials, a Cr-N monolayer coating and a Cr-N-Fe-based multilayer coating were investigated. As for the lubricants used, two different performing engine oils from the field were tested as well as fresh oils, some of which were diluted with a soot surrogate (carbon black) and diesel fuel in different amounts. The results show, among other things, that friction and wear performance strongly depend on the combination of pin material and lubricant used. In this context, especially the Cr-N-Fe in combination with the used engine oils showed a high wear resistance and low friction losses compared to the Cr-N reference. In the case of fresh oils with soot, the friction losses were higher but comparable between the pin materials, and a slightly better wear performance of the Cr-N was observed due to an agglomeration effect of the soot surrogate. In general, it was found that especially soot-free oils show clear wear advantages independent of the pin material used. Thus, soot clearly has a wear-promoting component. The investigations of this study suggest that a leading mechanism that is based on a corrosive–abrasive effect in the tested system, but this is more related to the soot surrogate carbon black than engine soot.

1. Introduction

In the first part of this series, Part I [1], a model test method for the tribological contact with bush chain pin components was presented, which facilitated efficient and controllable tribological investigations of a simplified simulated single joint contact of drive chains using original pin components. In this test set up, various tribological parameters such as the coefficient of friction can be recorded with high resolution during testing and thus paired with an accompanying wear and surface analysis of the contact surfaces; deep insights into the prevailing tribological processes can be obtained. A comparison with components from engine tests verified the transferability of the results from the presented model setup in Part I.
Generally, chain drives are important machine elements and components with a wide variety of applications in the drive and conveyor sector subjected to broadly diversified stresses and operating environments as well as associated demands on efficiency and reliability [2,3,4]. For this reason, it is necessary to build up in-depth knowledge of the tribological functionality for these components, which are also subjected to tribological stress. In the area of timing chains in internal combustion engines, the demands are extremely increased again [5], driven by the progressive transformation of the internal combustion engine. In this context, wear resistance and low friction losses are particularly required under constantly changing operating conditions towards more precarious trends such as: increased specific load, use of low-viscosity lubricants, long oil change intervals, formation of soot, oil dilution with fuel, etc. [6]. Here, the critical tribological single joint contact with the pin is of particular importance, as wear within this contact and the associated total chain elongation can lead to serious control damage to the engine [2].
Independent of the constructive measures and changing the operating conditions, one possibility to intervene here is of course to change or optimize the materials or coatings of the components involved. For bush drive chains some pin material variants were stated in previous studies such as case hardened steel or inchromized coatings [7]. Friction reducing effects through optimization of the pin material coating have also been reported [8]. In this regard, CrN is quite widely used for tribological purposes in automotive applications [9,10,11]. It has been assessed with several beneficial tribological properties such as high wear resistance [12]—for instance, showing a better wear resistance than electrolytic hard chrome coating [13] and TiN coating [14]—good friction performance [15], and high corrosion resistance [16,17,18,19]. Further improved material and coating solutions regarding tribological functionality have been linked with multilayer or graded chromium based coatings [20,21,22].
As in all tribological engine contacts, the lubricant plays an essential role as a design element. In general, additives contained in it, especially anti-wear or extreme pressure additives, interact with the tribological surfaces and form protective boundary layers that can protect against tribological damage or also reduce friction. Active tribofilm formation such as those of zinc-dialkyldithiophosphate (ZDDP) components on ferrous surfaces, also on others such as Si, are widely known and have been investigated comprehensively [23,24,25,26,27,28,29,30]. In the case of chromium-based coatings, such as CrN, few studies have been found in the literature, but still-active tribofilm formation was reported containing phosphate species [31], sulphide species [32], or both [33,34], depending on the used additive. For bush chain contacts, a study regarding lubricant-related effects was presented in [35], reporting increased friction losses for a used oil when comparing it to a fresh reference variant.
Tribological contacts in the internal combustion engine, such as chain contacts, are also affected significantly by soot, which is formed by the imperfect combustion of hydrocarbons. There are several studies on the effect of soot for tribological contacts, generally attributing a wear promoting effect of soot [36,37]. The reason behind this is attributed to many different basic mechanisms. Several investigations suggested an abrasive mechanism [38,39,40,41], whereby a soot substitute, e.g., carbon black, was often used in the various investigations. Other studies reported an adsorption-based wear promoting effect of soot [42,43]. Additionally, more recently, for ZDDP containing lubricants, a corrosive–abrasive wear effect has also been hypothesized [44,45], based on the ZDDP-induced iron sulphide formation and removal thereof through soot particles [46]. In the field of bush drive chain components, only few specific studies can be found investigating the effect of soot. Paulovics et al. [47] used model tests under the given test conditions to show that carbon black only has a wear-increasing effect above a certain carbon black level of 2 wt%. As for the friction performance, an increase was reported by Sappok et al. [48] when adding carbon black to a Poly-alpha-olefin/additive mixture.
As one can see, there are still only a few studies to be found in the literature in the area of chain pin bush contact, which justifies the need for further investigations. In addition, there is a need for further tribological studies on the performance and process procedures of tribological systems with chrome-based coatings, and there is still no consensus in the area of the effect of carbon black on friction and wear of tribological systems.
This study (Part II) is dedicated to the topic of experimental tribological investigations of the contact between chain pin and bush at the model level. The following key research topics are addressed:
  • Comparative friction and wear characterization of two chromium-based bush chain pin coatings, namely, CrN and a new Cr-based multilayer coating.
  • Characterization of lubricant-related effects, such as oil variation and specific influence of carbon black and fuel dilution, on friction and wear phenomena in a pin/bush-plate model contact.

2. Experimental Method and Materials

2.1. Test Method and Test Strategy

All experimental tests have been carried out by using the test rig and setup presented in Part I [1] of this study, namely, a new developed chain pin on bush plate configuration implemented on a TE77 test rig (for the schematic setup see Figure 1a). In this context, the same measured variables, such as the coefficient of friction, the contact near temperature measured within the steel counterpart, the contact potential, and so on, were also recorded experimentally in this study. Furthermore, the wear evaluation of the pin materials was also performed in a similar way through optical measurement of the contact zone on the pin.
A schematic representation of the basic test programme used is shown in Figure 1b. It can be seen that the normal load and the system temperature were changed during the course of the programme. A detailed description of the different phases of the programme can be found in Part I [1]. By varying the input parameters within the basic test programme according to Table 1, different test categories with various normal loads and test durations were created. The loads and test times were based on boundary conditions, which were inspired by engine test bench conditions.

2.2. Lubricants

In the present study, various lubricants were used to comprehensively investigate pin wear phenomena as well as lubricant–surface interactions in the bush chain model contact. An overview of the lubricants used as well as key data and differentiating attributes as well as abbreviations for the later course of the paper can be found in Table 2. Primarily, the lubricants used can be differentiated into used oils from engine test runs and artificially created oils.
In the case of the used engine oils (EO), relative information regarding chain wear performance was known from engine test runs based on original equipment manufacturer (OEM) data. Both lubricants were used in similar diesel engines with the similar running time and load history, resulting in different performance data regarding chain wear elongation. In this respect, EO1 showed moderate performance and higher, but still acceptable, chain elongation, displaying average performance. In contrast, EO2 showed higher, unacceptable chain elongation and thus poor performance. Both engine oils used typical automotive engine formulation spaces including zinc dialkyldithiophosphate (ZDDP), detergents, dispersants, antioxidants, and viscosity modifiers in different amounts.
For systematic investigations and controllable conditions in comparison to the used engine oils, artificially recreated oils (AO) were used. In this context, defined concentrations of artificial soot and diesel fuel were added to a fresh oil reference (AO1). The reference oil was a Fuchs Titan lubricant for diesel engines, consisting of a base oil mixture of mineral oil and PAOs with a kinematic viscosity of 58 mm2/s at 40 °C. An oil variant with a small amount of soot of 3 mass percent was produced (AO2), as well as pure-diesel-diluted oil (AO3) with 10 mass percent of diesel fuel. In addition, a highly contaminated oil variant was mixed with both increased soot addition of 4.5 mass percent and increased diesel content of 20 mass percent.

2.3. Pin Materials and Counterparts

Two pin material products with a diameter of 4.4 mm were used for this study. Pin material product 1 was already used in Part I of the study for method development and validation. These were steel pins with a Cr-N coating of approximately 2 µm (a detailed element analysis is shown in Part I). Figure 2a shows a scanning electron microscope (SEM) image of the surface of Cr-N and a corresponding cross-section view. One can see that the surface was characterized by fine scratches and a few pores. The pores were clearly visible in the cross-section, some of them were as deep as the coating itself and others were not. In this context, the Pin material 1 with a steel base material and a 2 µm thick Cr-N coating represented a kind of reference material and will be named Cr-N in the further course of the paper.
In addition to Cr-N, a second pin material product was investigated. Similar to Cr-N, the second pin solution was also based on a steel base material with an additional chrome-based coating. However, the coating differed significantly from Cr-N in some aspects. Figure 2b shows the surface of the second pin material with the aid of a SEM and a corresponding elemental analysis of the image area. It can be seen that the second pin material, in contrast to Cr-N, had a somewhat smoother surface free of layer pores. Energy dispersive X-ray spectroscopy (EDX or EDS) revealed that the top coating was a Cr-N-Fe layer. Further information on the second pin material (in the further course of the paper referred to as Cr-N-Fe) can be found in the micro-section in Figure 3. The first thing to notice is that Cr-N-Fe was a multi-layered coating with several layers in contrast to Cr-N. Secondly, the total layer thickness of the multi-layered coating was 15 µm, which was much thicker than in the case of Cr-N. A Fe-Cr-C layer (layer 1 or S1) was applied to the inner steel substrate. In between the top Cr-N-Fe layer (layer 3 or S3), there was a transition area (layer 2 or S2) with a pronounced stem-like transition structure. Through the multilayer structure, the Fe content of the substrate decreased continuously but can still be found, to a significant extent, on the surface.
Further in-depth investigations of the coating properties in terms of hardness and modulus were carried out with the aid of instrumented nanoindentation tests. The results of the nanoindentations and also schematic coating depictions can be seen in Figure 4 for Cr-N and Figure 5 for Cr-N-Fe. The two graphs each show the modulus values and hardness values over the measuring position in relation to the surface. The measuring positions are also shown in Figure 4b and Figure 5b in the schematic diagrams to make it easier to reconstruct these positions. For Cr-N (Figure 4a), the modulus values of the steel base material are around 250 GPa and those of the Cr-N coating itself are marginally higher, close to 300 GPa. The hardness values for pin material 1 are about 10 GPa for the substrate and more than double (~23 GPa) for the Cr-N coating. Regarding the measurements of the Cr-N layer, these fit quite well with the values found in the literature for Cr-N coatings, see [49,50].
The steel material of Cr-N-Fe (Figure 5a—blue markers) had similar values to that of Cr-N, namely, just under 250 GPa for the modulus and about 11 GPa for the hardness. The Cr-Fe-C layer had a slightly higher modulus of 300–320 GPa and was 23 GPa hard, thus it had similar values to the Cr-N coating. The intermediate layer naturally showed a higher scatter of the measured values, which could be explained by the stem structure. The modulus values were in the range of the Cr-Fe-C layer with an increase towards the top layer. The hardness values were somewhat lower in the range between 15 and 20 GPa. The Cr-N-Fe top layer showed both high hardness values between 25 and 32 GPa and high modulus values in the range of 600 GPa.
Rockwell adhesion tests and ramp scratch tests were carried out on the mantle surfaces to characterize further coating properties. Test conditions were a spherical diamond indenter with a radius of 60 µm, a constant load time of 60 s, and a maximum load of 10 N. Figure 6 shows the Rockwell indentations of Cr-N (a) and Cr-N-Fe (b). In general, good adhesion and no layer delamination or a pronounced crack network could be seen for both coating systems. However, it was evident to the reader that hardly any indentation surface remained without any cracking in the case of Cr-N-Fe (Figure 6b). In the case of Cr-N (Figure 6a), however, cracks could be seen along the circumference. The ramp scratch tests showed no further differentiations between the pin materials Cr-N and Cr-N-Fe, as both materials performed well without delamination or cracking.
The steel counter bodies were manufactured in accordance with the application. A NiCrMo-alloyed steel with a surface hardness of over 700 HV was used. The dimensions of the steel body were 40 × 20 × 10 (length, width, height) mm. The surface roughness was specified to a target Ra = 0.05 µm, according to measurements of component parts (see Part I [1]).

3. Experimental Results

3.1. Comparison of Pin Material Performance for Used Engine Oil EO1

The tribological performance of the two pin materials with EO1 oil differed significantly from each other. In the case of Cr-N, the tribometric measurement data and results obtained with EO1 oil were comprehensively presented and discussed in Part I of the study [1]. A hectic friction behaviour with plenty of friction peaks could be observed, as well as a significant increase in the wear that could be detected in case of load increase. Similar tests, according to the TC 1–3 test programme, were performed with the Cr-N-Fe material and EO1 lubricant. The tribometric data are shown in
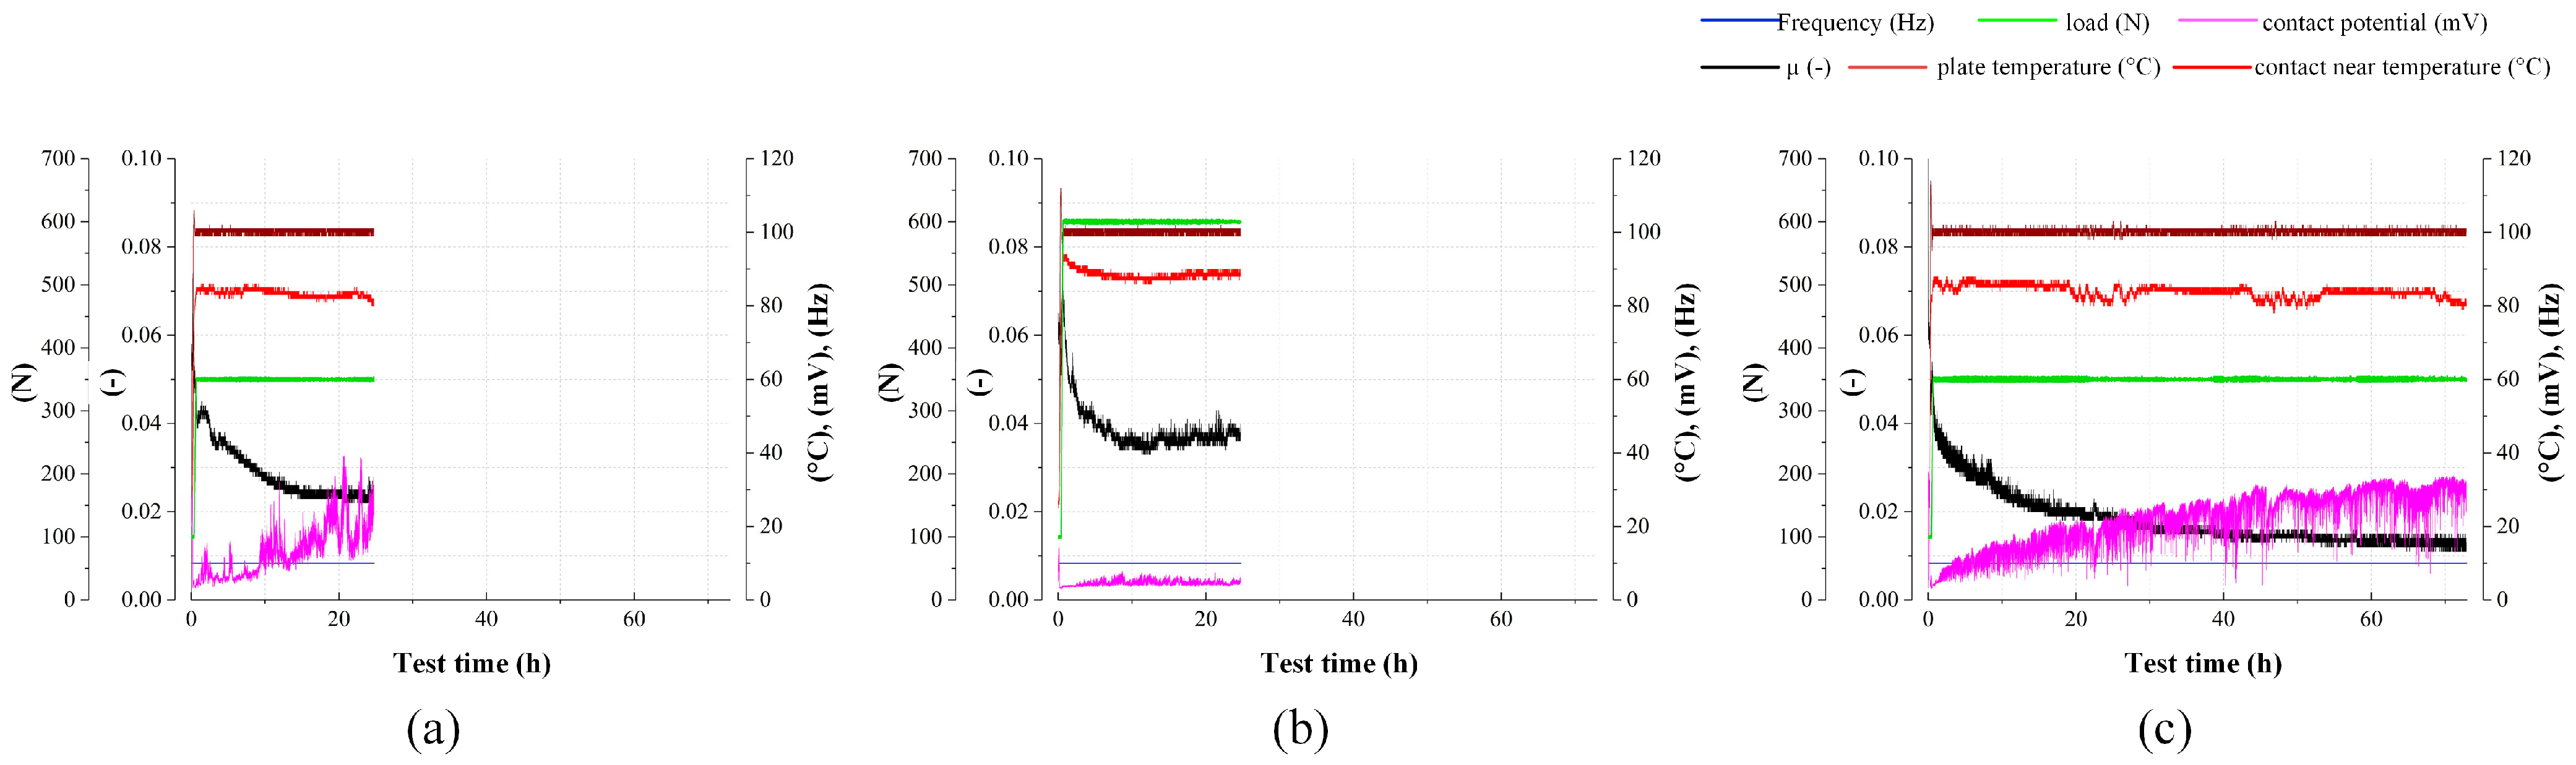
 Figure 7a–c. 
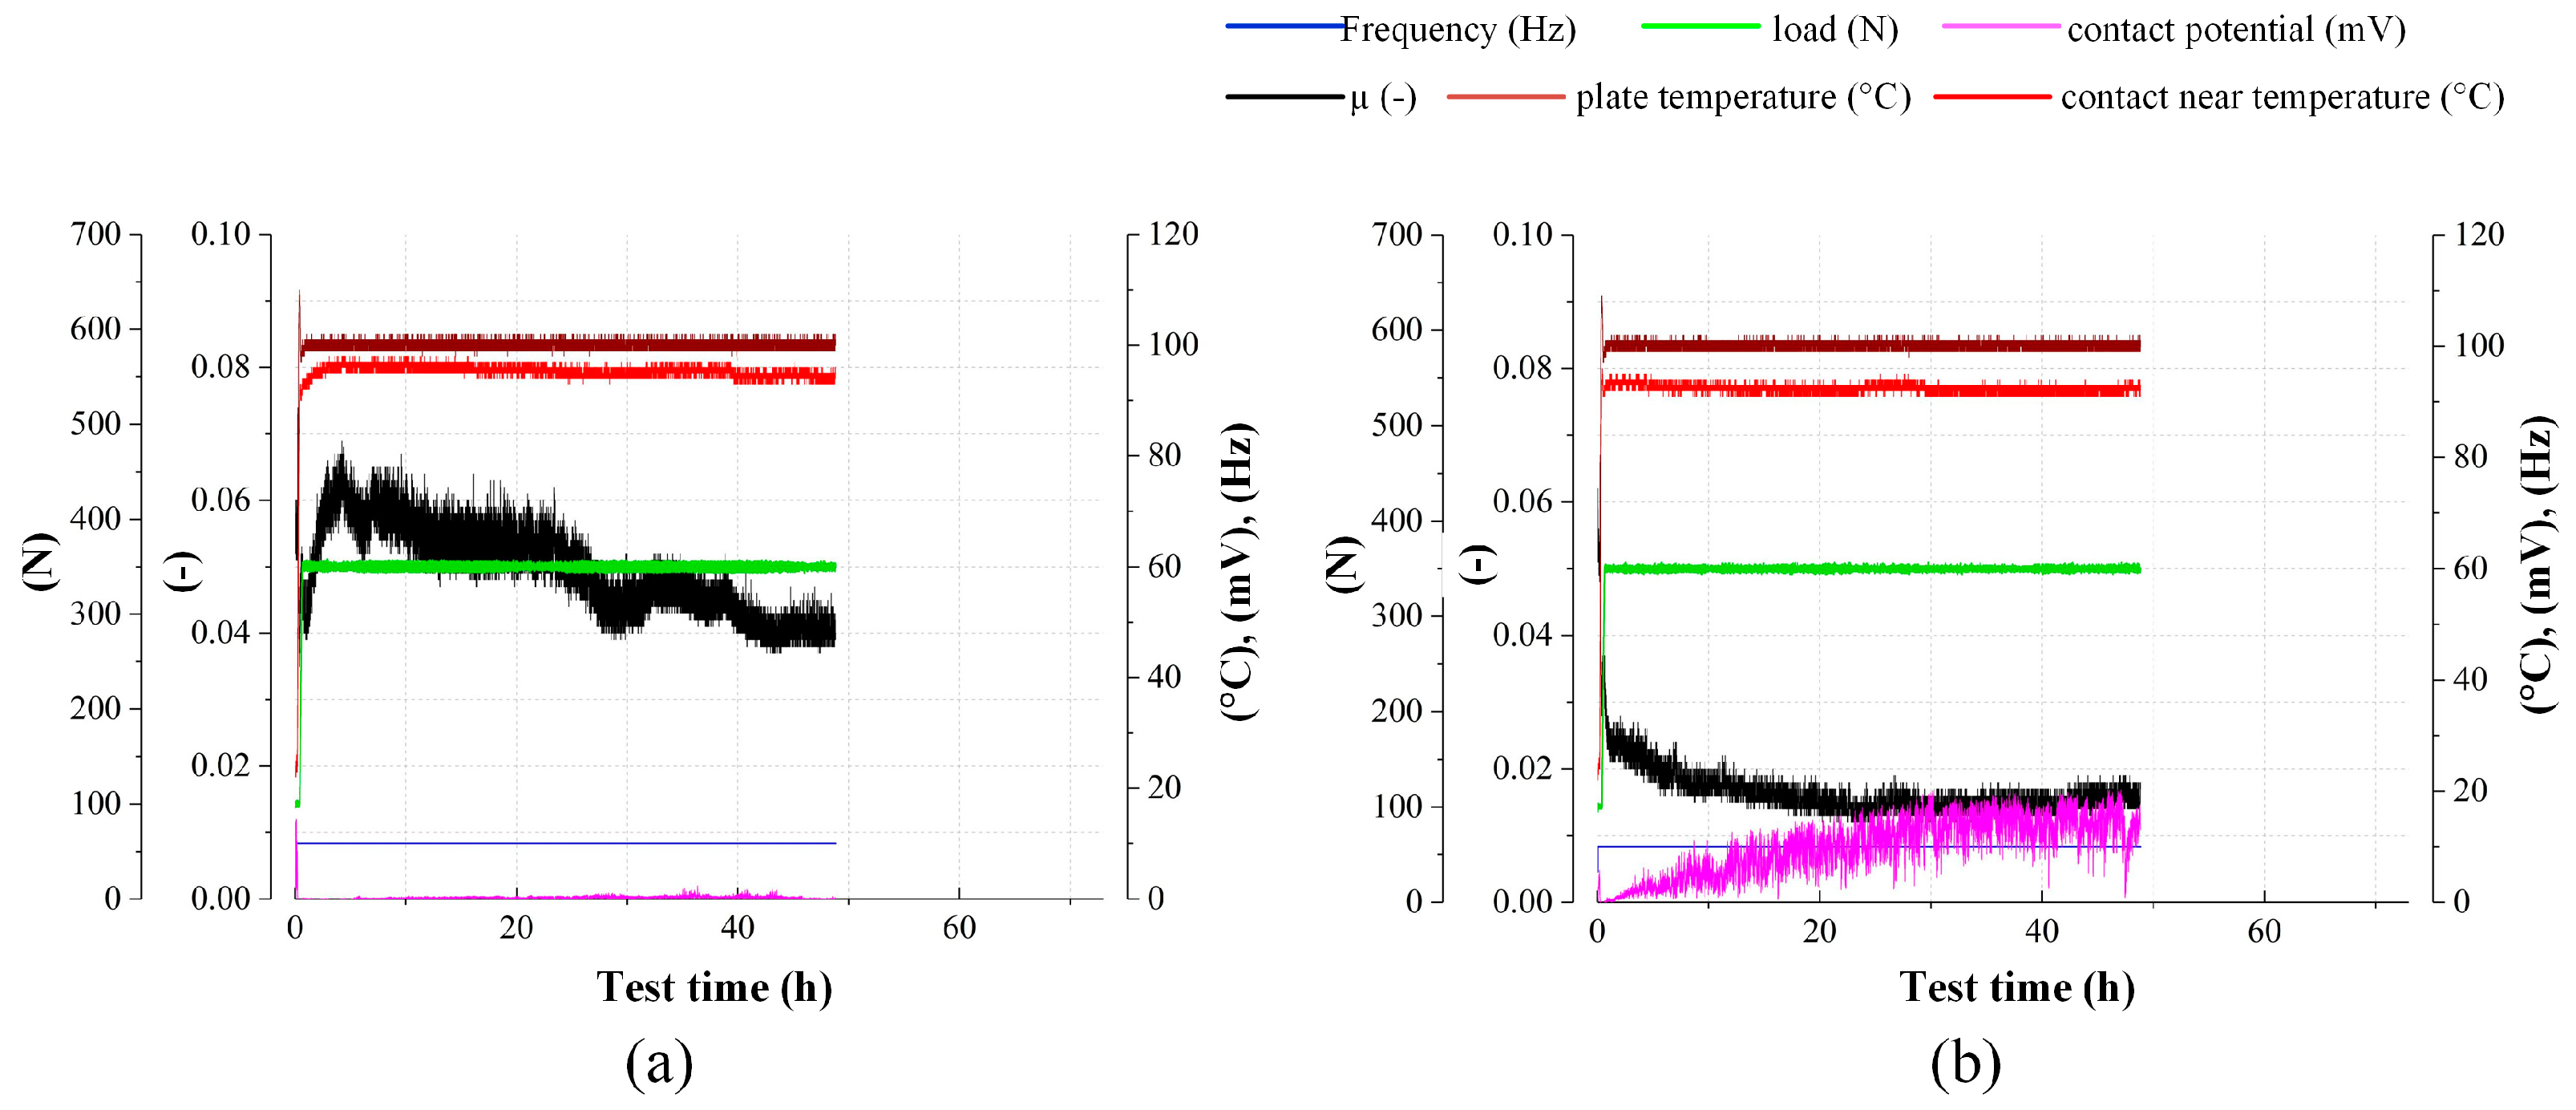
Figure 7a shows a measurement record of the test programme TC 1, which means a 350 N normal load and a running time of 25 h. As can be seen in the test plot, there is a pronounced run-in need at the beginning of the test. When the load is increased to the test load, the coefficient of friction drops abruptly, and the contact potential also drops to the minimum value. In the further course, an extended run-in characteristic is shown, which is characterized by a slow decrease in the coefficient of friction. A similar characteristic was also shown in tests with Cr-N, which can be read about in Part I. The coefficient of friction of Cr-N-Fe drops to values between 0.02 and 0.025 in the respective tests within 15 h. During this process, there is also a slight build-up of the contact potential, whereby the measured values are to be read as average values over the stroke, and it can thus be deduced that insulating boundary layers build up in several areas of the contact.
Figure 7b, on the other hand, shows a test with increased normal load. Similar to TC 1, the pronounced run-in process during the load increase to the test load can also be seen here. The friction peak value of approximately 0.07 was somewhat higher than in the tests with the standard load level. The extended run-in process was quicker and was completed at approximately 10 h. After this phase, the friction value stabilized at just under 0.04. In contrast to tests with low loads, no contact potential built up in these tests. This indicated poorer tribological conditions and rather metallic, wear-related contact processes. For longer tests at a standard load level (Figure 7c), similar characteristics to TC 1 were measured at the beginning. Through the longer test duration, it could be seen that the system continued to optimize itself energetically, and lower friction values up to µ~0.011 developed, accompanied by the continuous stabilization of the contact potential.
Surface images of this test series are shown in Figure 8. 
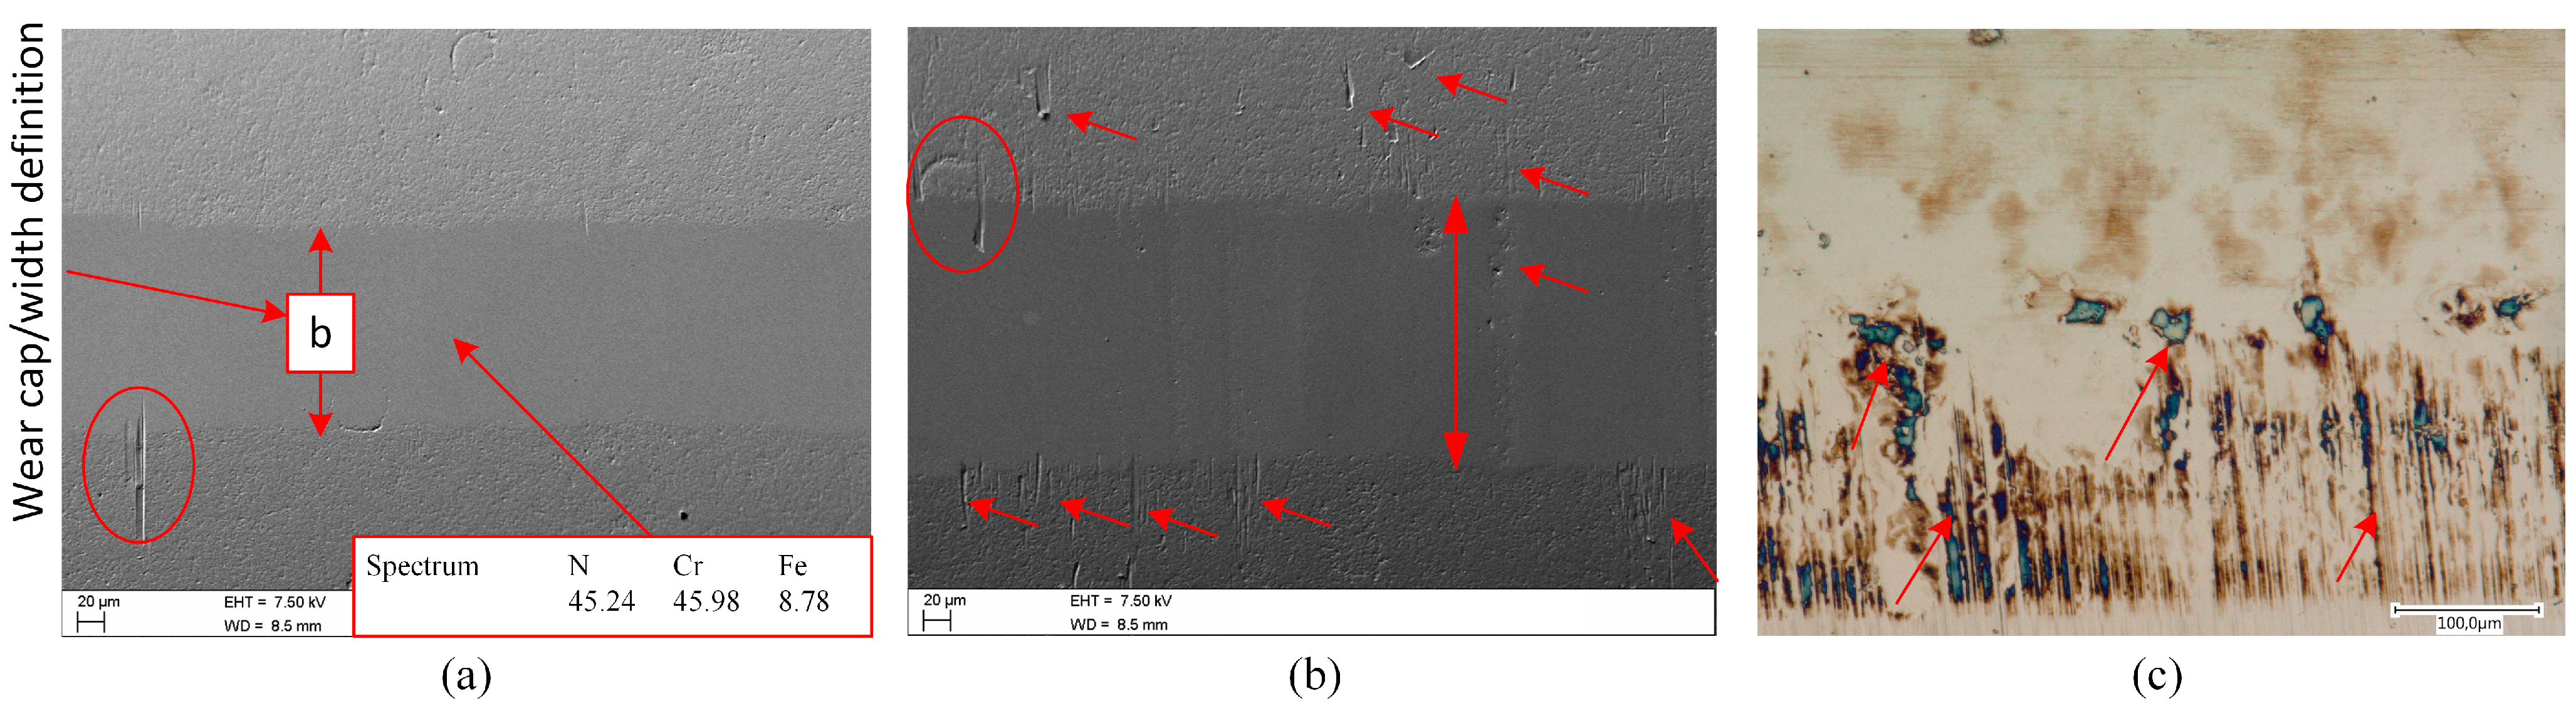
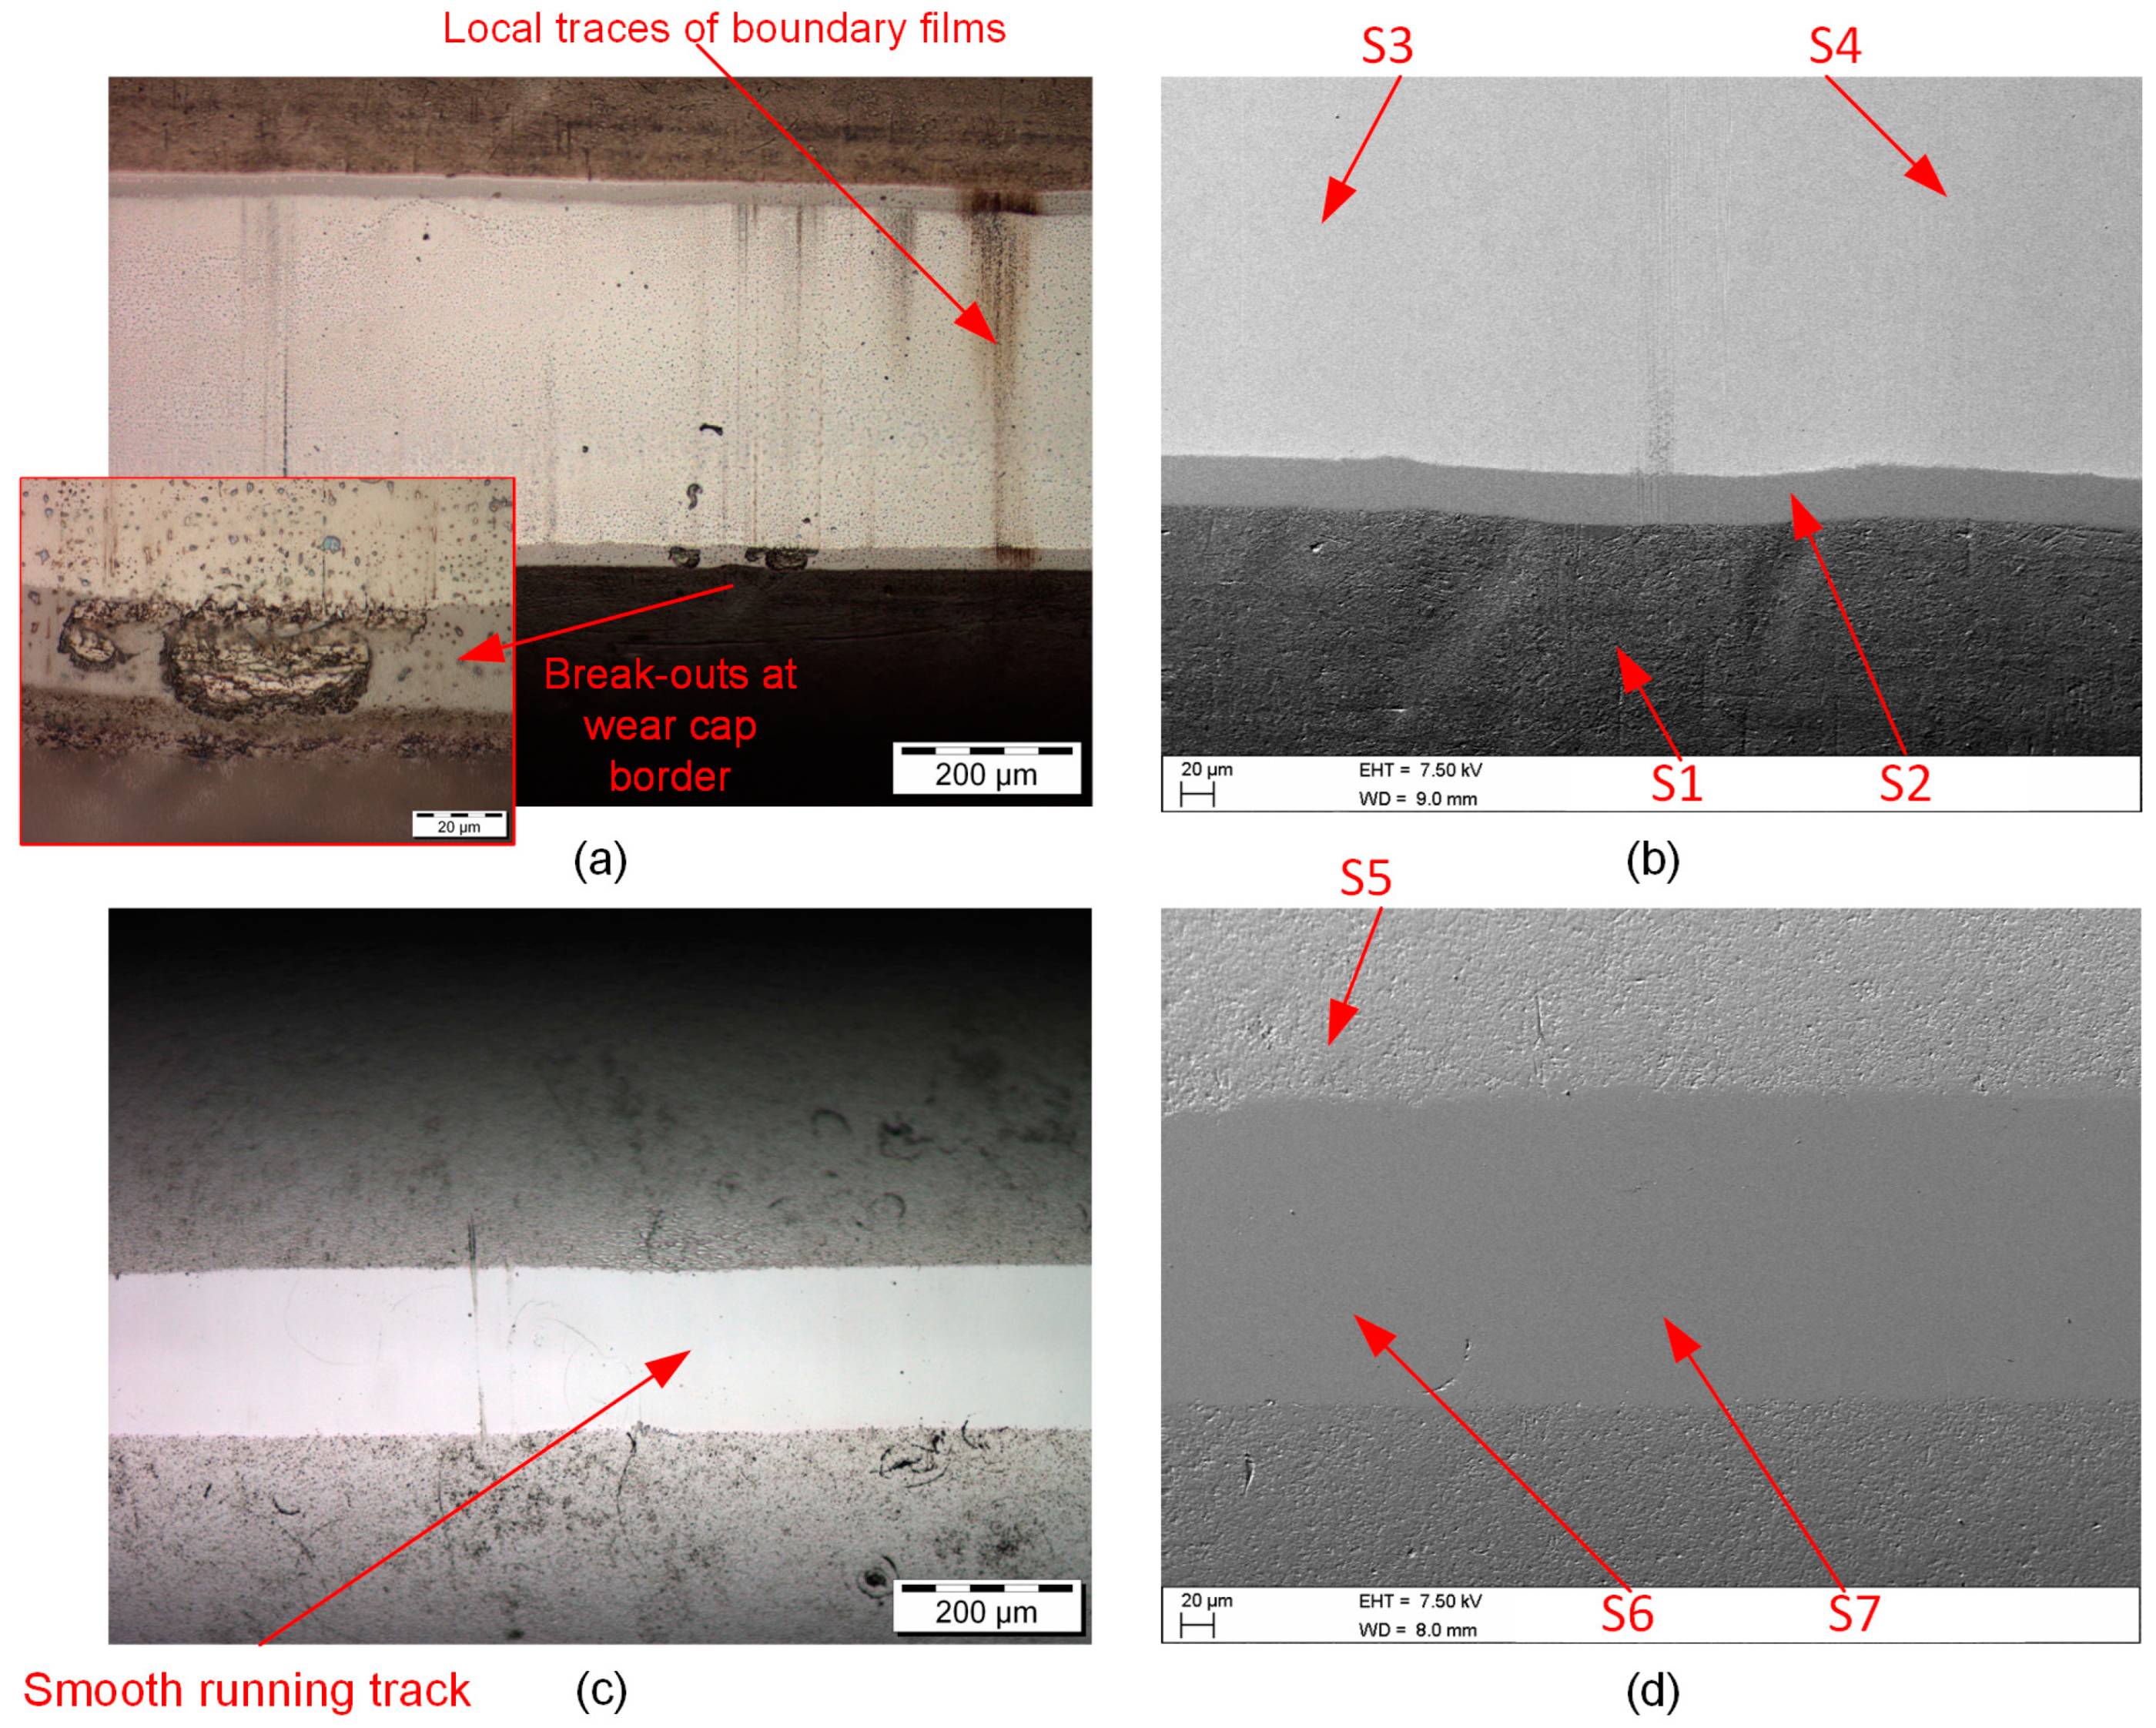
Figure 8a shows a pin surface from a test with standard load level, viz. TC 1. It shows a levelled and smoothed contact surface with a defined contact width. In the topography mode of the SEM, the difference between the surface structure outside the contact area can be seen very clearly. The initial structure is significantly rougher than the extremely smooth surface inside the contact track. It is also easy to see that the top layer is still fully present on the contact surface, as there are no contrast differences that would arise if elements with different atomic weights from various layers were present. This is also confirmed by elemental measurements, as presented in Figure 8a. Occasional scratches can be seen at the edge of the contact area, but these are not very pronounced and rather rare.
Essentially, the contact cap had a different width depending on the test duration and operating load, which referred to a different wear progression. In this regard, also under high load, the running track stayed smooth without noticeable coating chipping, delamination, material transfer, or abrasive marks. The phenomena described above can be seen in Figure 8b, which shows a pin surface from a test run with increased load. In comparison with the running surface from Figure 8a, no pronounced changes can be seen even in operation with increased load. The contact surface is still equally levelled and smoothed. As can be seen from the direct comparison, only the contact width has increased considerably, which proves an increased wear rate. Furthermore, there are slightly more scratches around the contact surface (red arrows in Figure 8b), but no further damage phenomena. In the case of tests with longer running time but standard load level, no further changes to the surface condition, shown in Figure 8a, can be seen, except for the slightly higher contact width.
These conditions were very different from the surface characteristics of Cr-N after testing, which were found under the same test conditions (see Part I). For Cr-N, some severe wear damage was observed on the pin surface after the tests. In this context, tests with increased load or long running time were particularly subjected to pronounced wear. Under these conditions, the coating of Cr-N in the contact area was already worn away and the Fe substrate is exposed. In addition, considerable signs of abrasion and/or deformation were observed for Cr-N. For the tests with EO1 and Cr-N-Fe, only minor tribologically induced changes in the surface texture could be seen on the steel counterparts compared to the initial condition. Essentially, the surface roughness was smoothed somewhat, which resulted from the changes in the surface grooves from the initial preferred grinding direction to the directional alignment of only very slight running grooves in the stroke direction. Locally (rather in the area of the reversal points), a few areas with lubricant additive layer formations were also visible. The layer formation was less pronounced at a test load of 350 N. In contrast, increased layer formation on the steel plate could be seen with increasing test load. The phenomena mentioned above were exemplified by the surface in Figure 8c, which showed a light microscopy (LIMI) image of a steel counter-surface from a test with Cr-N-Fe and EO2 and increased test load. The smooth steel surface discussed above could be seen, which was locally covered with light brownish and bluish tribopads. These layers were based on phosphate compounds with Zn and Ca elements (blue areas) and also sulphur and oxide compounds (brown areas).
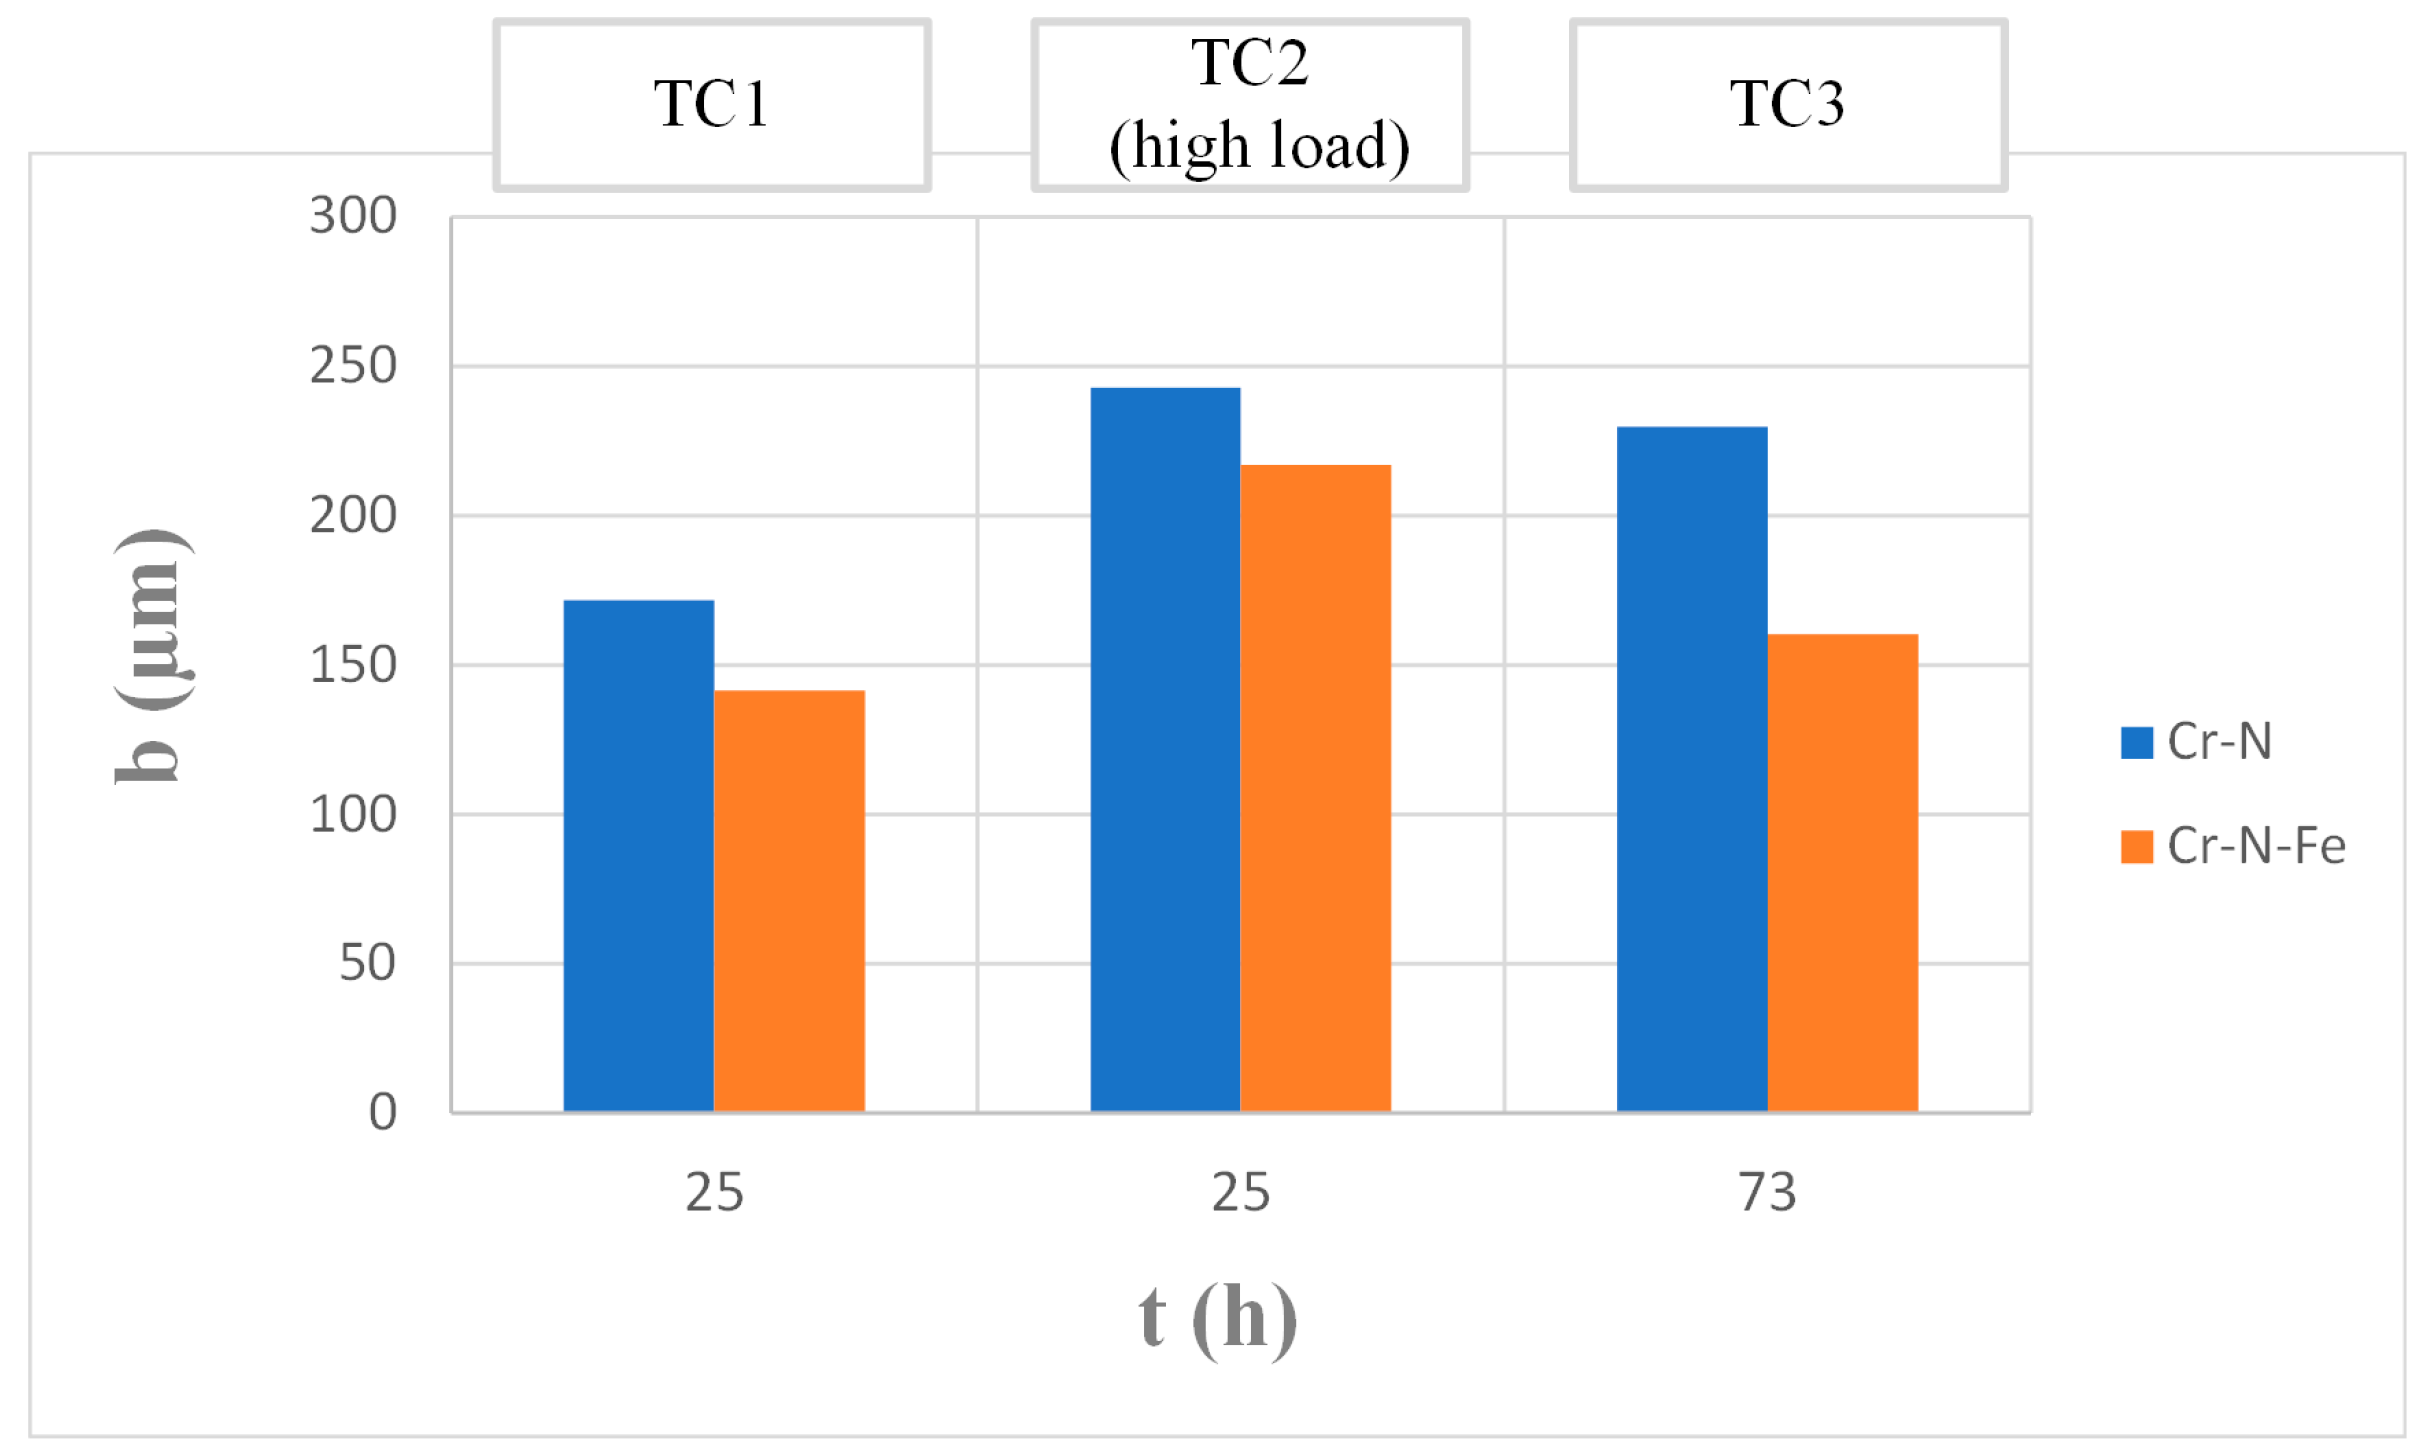
Figure 9 shows a direct quantitative comparison between the pin variants Cr-N and Cr-N-Fe in combination with the lubricant EO1 based on the time-based wear development over the wear cap b (defined as the width of the wear track on the pin, see Figure 8a; further definition can be found in the paper of Part I). The diagram shows what is already evident in the comparison of the qualitative damage analyses of the pin surfaces, namely, the higher wear resistance (lower values of the wear width b) of Cr-N-Fe for all test programmes used for tests with EO1. For all tests, the wear width of Cr-N-Fe is lower than that of Cr-N. The same applies to the dissipated friction energy over the entire test times, which can already be read from the qualitative course of the friction coefficient from the tests with Cr-N and Cr-N-Fe.

3.2. Comparison of Pin Material Performance for Used Engine Oil EO2

Tests with EO2 lubricant were carried out using test strategy TC 4, which is essentially characterised by a medium test time at moderate load. Representative test graphs for both Cr-N and Cr-N-Fe are shown in Figure 10. In the case of Cr-N (Figure 10a), two characteristics immediately stand out in the test plot. Firstly, the contact potential drops to the minimum value immediately after the load increase from the run-in load to the test load and remains there throughout the rest of the test. Secondly, there are significantly higher friction losses. During the run-in stage, the friction values are at a similar level to tests with EO1, namely in the range of 0.06. There is then a decrease in the friction value in the course of the load increase towards the test load, but this is followed by a new increase in the friction value to almost 0.07. The friction value amplitude is also very wide for these tests, which underlines the hectic nature of the system and suggests local damage from the friction value curve. After this maximum, a downstream drop in the coefficient of friction to just above 0.04 can be observed.
In contrast to Cr-N, tests with the Cr-N-Fe pin material, again, show very low friction values over the course of the test time. Figure 10b shows such a representative test run with Cr-N-Fe. At the beginning, a running-in process can also be seen here with an increase in load from the running-in load to the test load. This can be seen with the drop in the coefficient of friction from approximately 0.06 to values below 0.03. Here, too, a simultaneous collapse of the contact potential can be seen. Afterwards, similar to tests with EO1 lubricant, there is a further slow decrease in the COF until approximately 25 h test time and an accompanying slight build-up of the contact potential curve to values of just under 20 mV. This stable state is maintained for this system until the end of the test.
The quantitative comparison of friction and wear (for wear width definition please see Figure 8a) measurement data in Figure 11 reflects the measurement curves from the test graphs in Figure 10. While Cr-N-Fe shows a low wear cap/width (b) of approximately 183 µm on average, as well as a dissipated friction energy Ef, see Equation (1), in which Fr represents the friction force and s stands for the total sliding distance of less than 10 kJ joules, Cr-N, in contrast, shows increased dissipated friction energies of over 200 kJ, which is more than double the dissipated energy from tests with Cr-N-Fe, as well as increased wear values of 348 µm. Converted to the calculated size of the wear height, the layer thickness in the contact has passed through significantly.
E f = F r * s
Figure 12 shows surface analyses of pin surfaces Cr-N and Cr-N-Fe from tests with EO2, with Figure 12a,b showing those of Cr-N and Figure 12c,d showing those of Cr-N-Fe. In the light microscopic overview images, one can clearly see the different contact width, which was previously compared quantitatively. In addition, it is clearly recognisable for Cr-N that the coating was clearly rubbed off and the steel substrate was exposed over a large area in the entire area of the contact surface. This can be confirmed based on the element measurements carried out in Table 3—Spectrum 3 and 4. The measurement positions are marked in the scanning electron microscope image in Figure 12b. It can be clearly seen that the measuring positions, which are located within the lighter contact area, are elementally composed of components of the steel substrate. At the edge of the contact area, the high-contrast images from the light microscope and scanning electron microscope show a small edge strip, which can be assigned to the CrN coating by element measurements (Table 3—Spectrum 2). In these areas, chipping and deformation damage can also be seen repeatedly. Within the exposed steel substrate, smoothed surfaces can be seen for the most part, which also appear rather bright. Only locally a few tribofilms of layer-forming additive components from the lubricant are visible, see Figure 12a. For Cr-N-Fe, Figure 12c shows the little damaged running surface with a small contact width and no significant damage, but only a nicely smoothed contact surface. This is also shown by the element measurements using the energy-dispersive X-ray spectroscopy (EDS or EDX) technique. In this context, it can also be clearly shown that no tribological boundary layers or additive layers of the lubricant form on the pin-running surface of Cr-N-Fe in this test series; they form only on the bare-coating surfaces (Table 3—Spectrum 6–7).
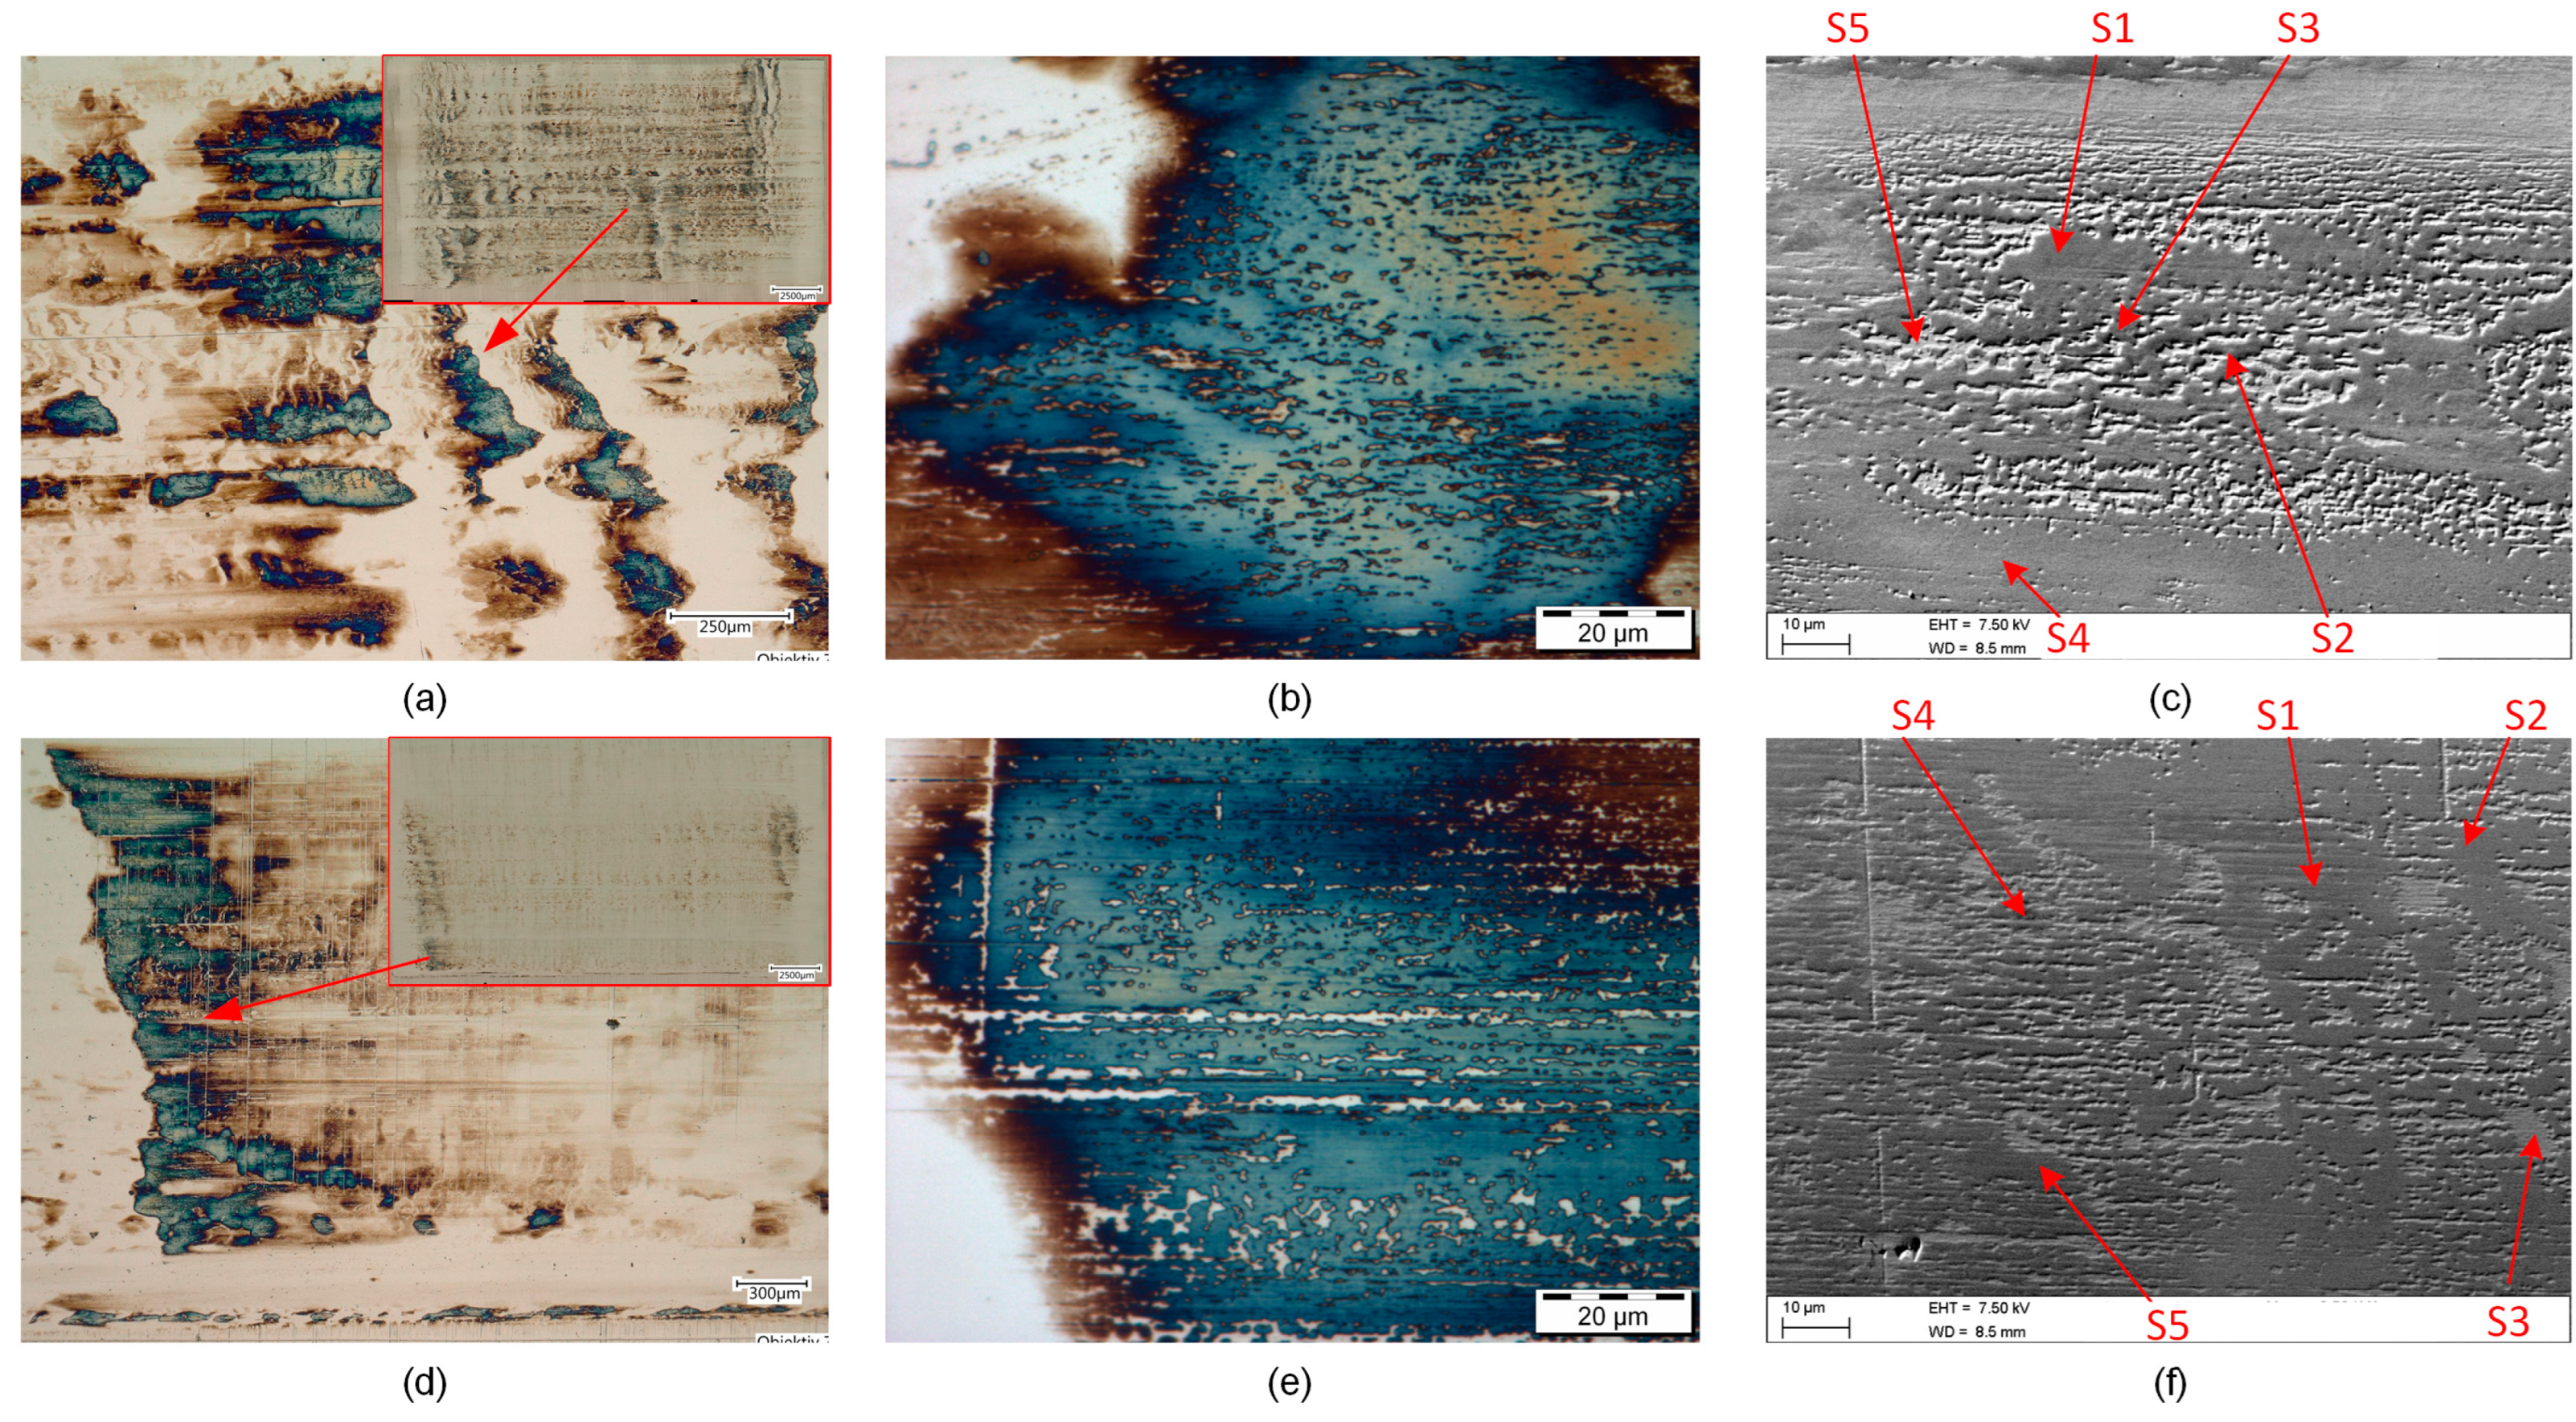
Figure 13 shows the corresponding steel mating surfaces to the pin surfaces of Figure 12. Figure 13a shows light microscopic overview and detail images of tests with Cr-N. It can be seen quite clearly in the overview image that a large part of the running surface is covered with boundary layers. This coverage was not seen in the tests with EO1 discussed so far, where these were, rather, the local phenomena (see Part I). A closer look at these layers revealed that they tend to build-up in the form of larger pad areas in lines transverse to the direction of stroke. In detail, a brown base layer as well as a blue layer on top can be seen (see Figure 13b), which repeatedly contains small holes where no tribolayer is formed on steel. This can be clearly seen from the colour contrast based light microscope image, but also from the elemental analysis. The element measurements in Figure 13c and Table 4 show that the brown layers are oxide products (e.g., Table 4 Spectrum 4) and that the elements P and partially S were measured, in addition, at blue layer areas (the element concentration suggests a higher penetration depth of the measurement than the layer thicknesses). Such antiwear layer formation on steel surfaces is well known in literature [23,51,52]. Figure 13d–f shows the corresponding surfaces from tests with Cr-N-Fe pin material. In the overview picture, it can be seen that the running surface is rather blank over a large area, and only in the reversal points is a larger layer covering visible. The external structure of these layers is similar to that of Cr-N (see Figure 13b,e), but differences can be seen in the element measurements. For Cr-N, mainly oxide fractions were measured with rather less concentrations of P and other lubricant elements. For Cr-N-Fe, under the same measuring conditions using EDX technology, slightly increased fractions of P and S can be detected (Figure 13f, Table 5). In addition, Ca is found in the element spectra of the layers (Figure 13f, Table 5, Spektrum 1, 4, 5).

3.3. Performance Assessment for Artificial Lubricants without Soot (AO1 and AO3)

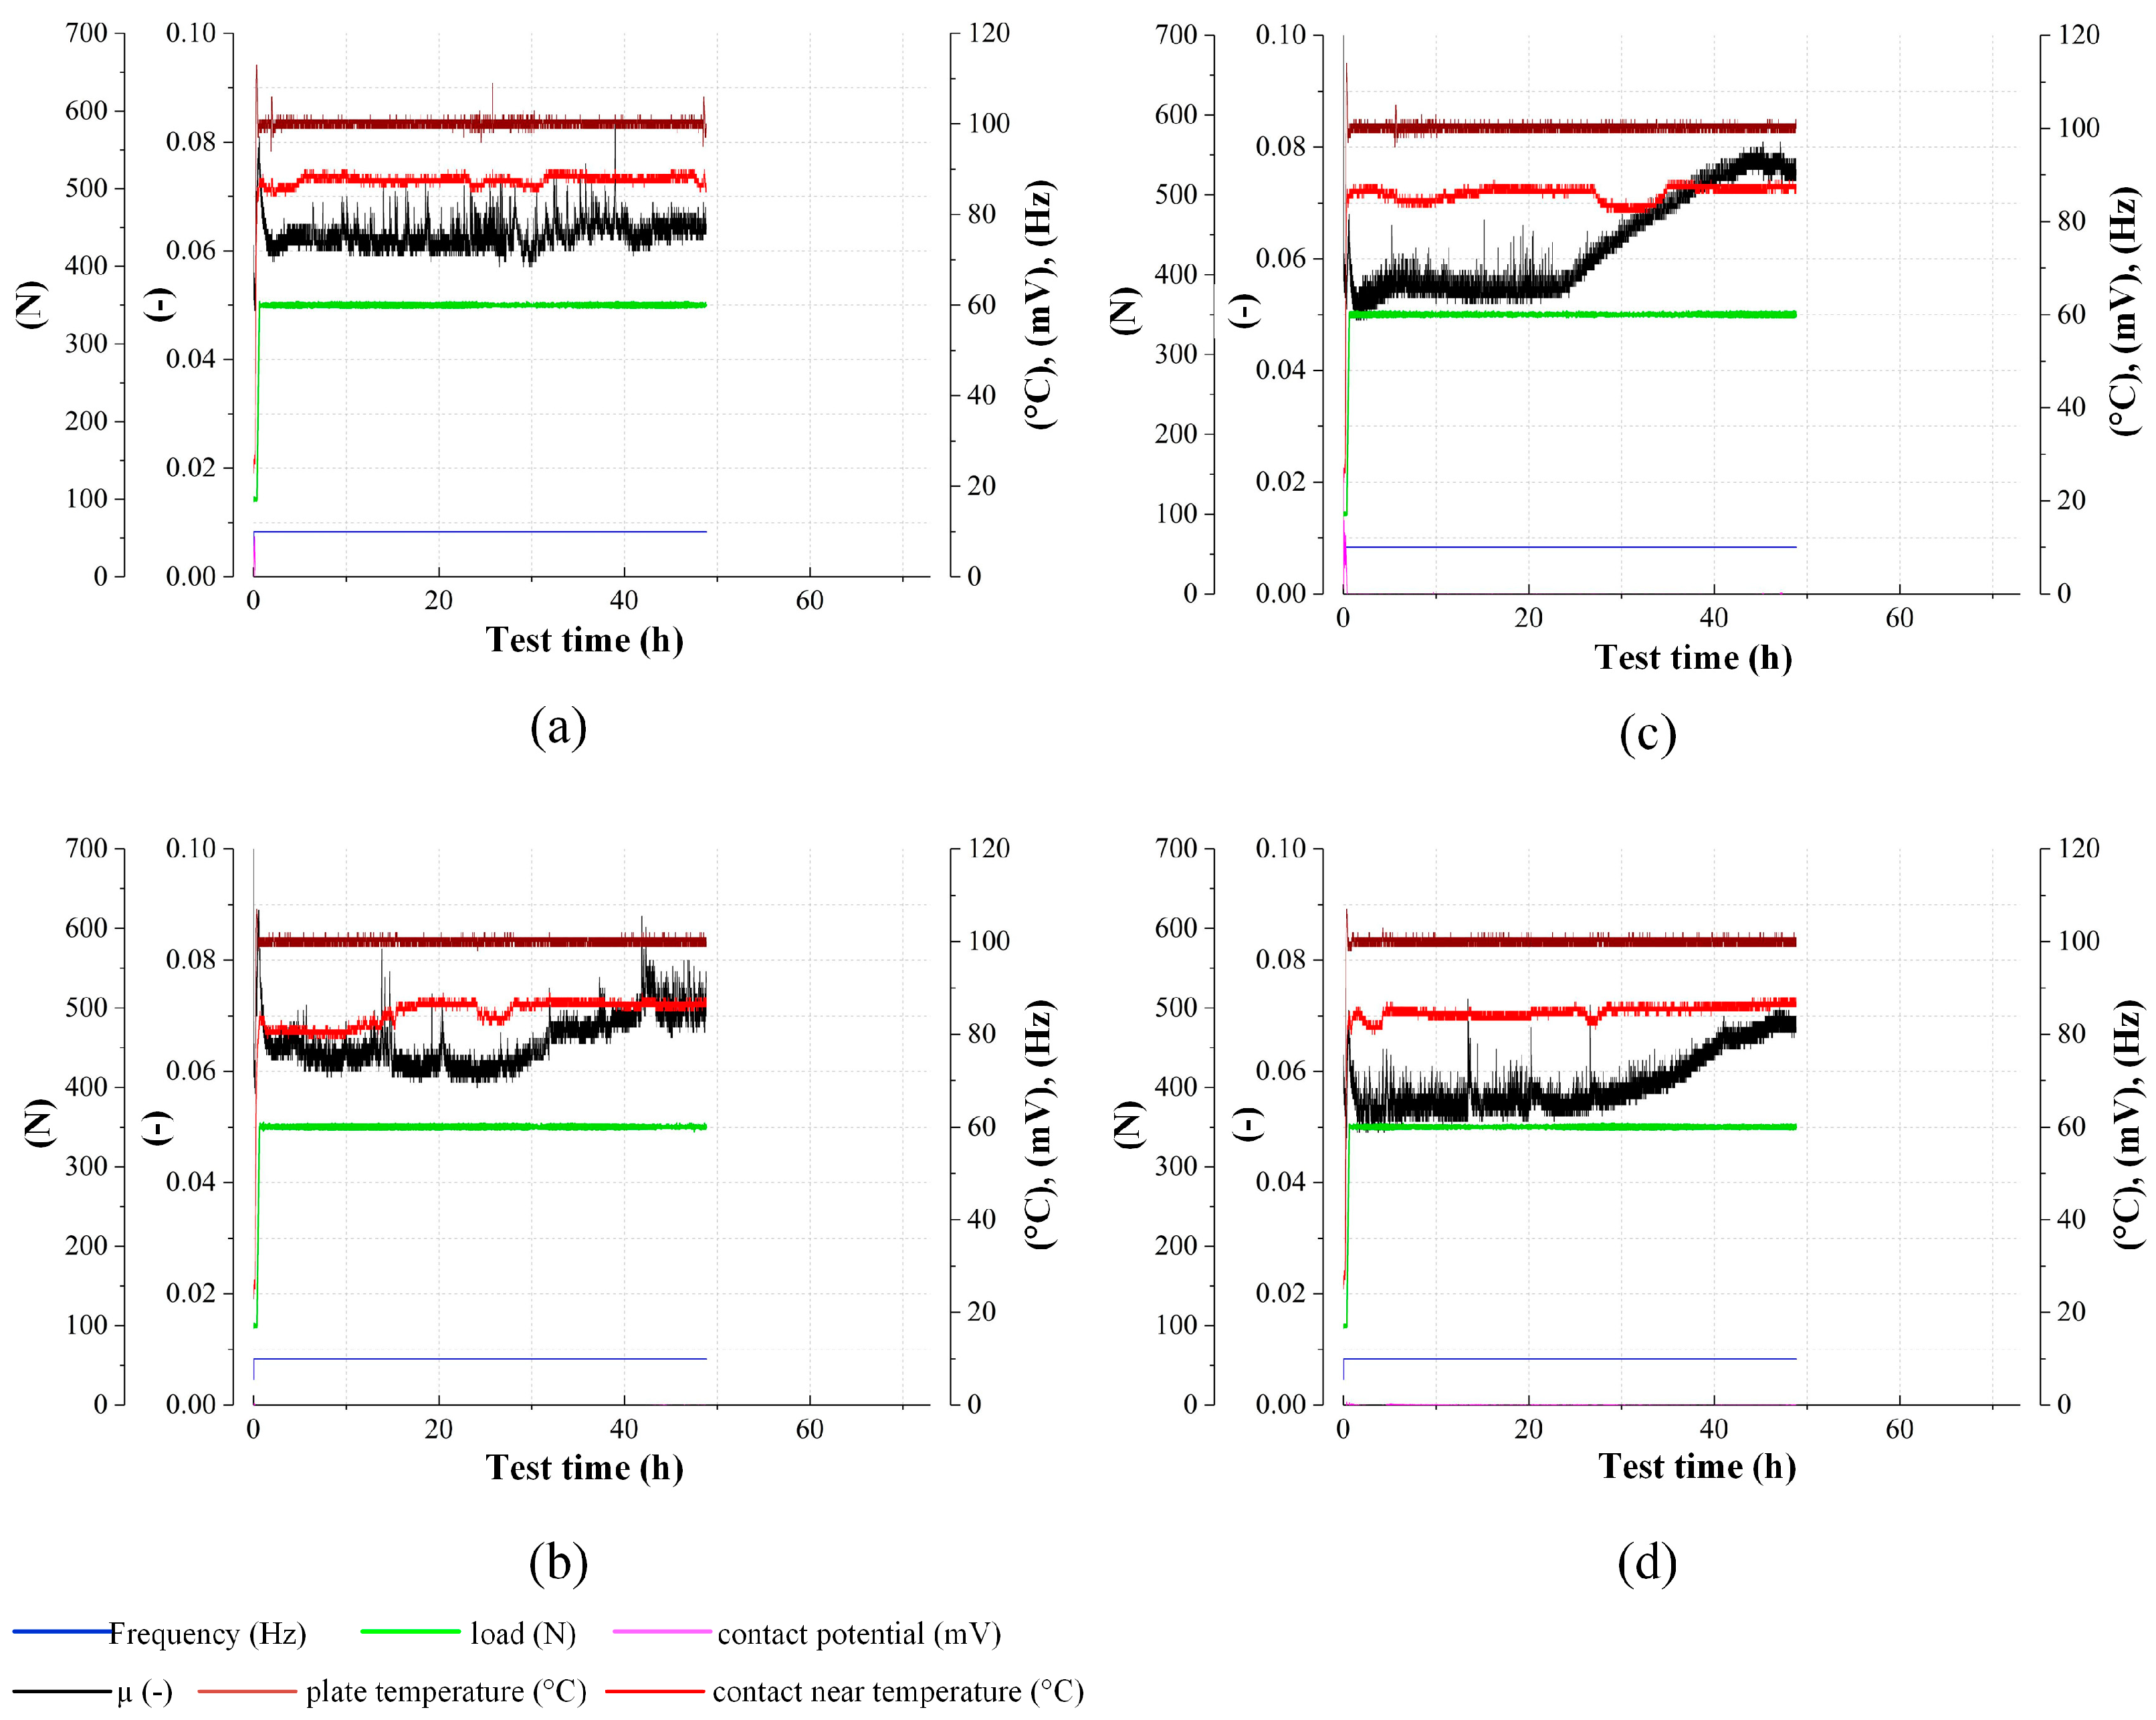
In the following section, the tribometric results of the artificial oils without soot, namely, fresh engine oil and diesel-diluted oil, are presented. The reader can see significant differences for both pin materials compared to the used oils from the engine test runs, see 
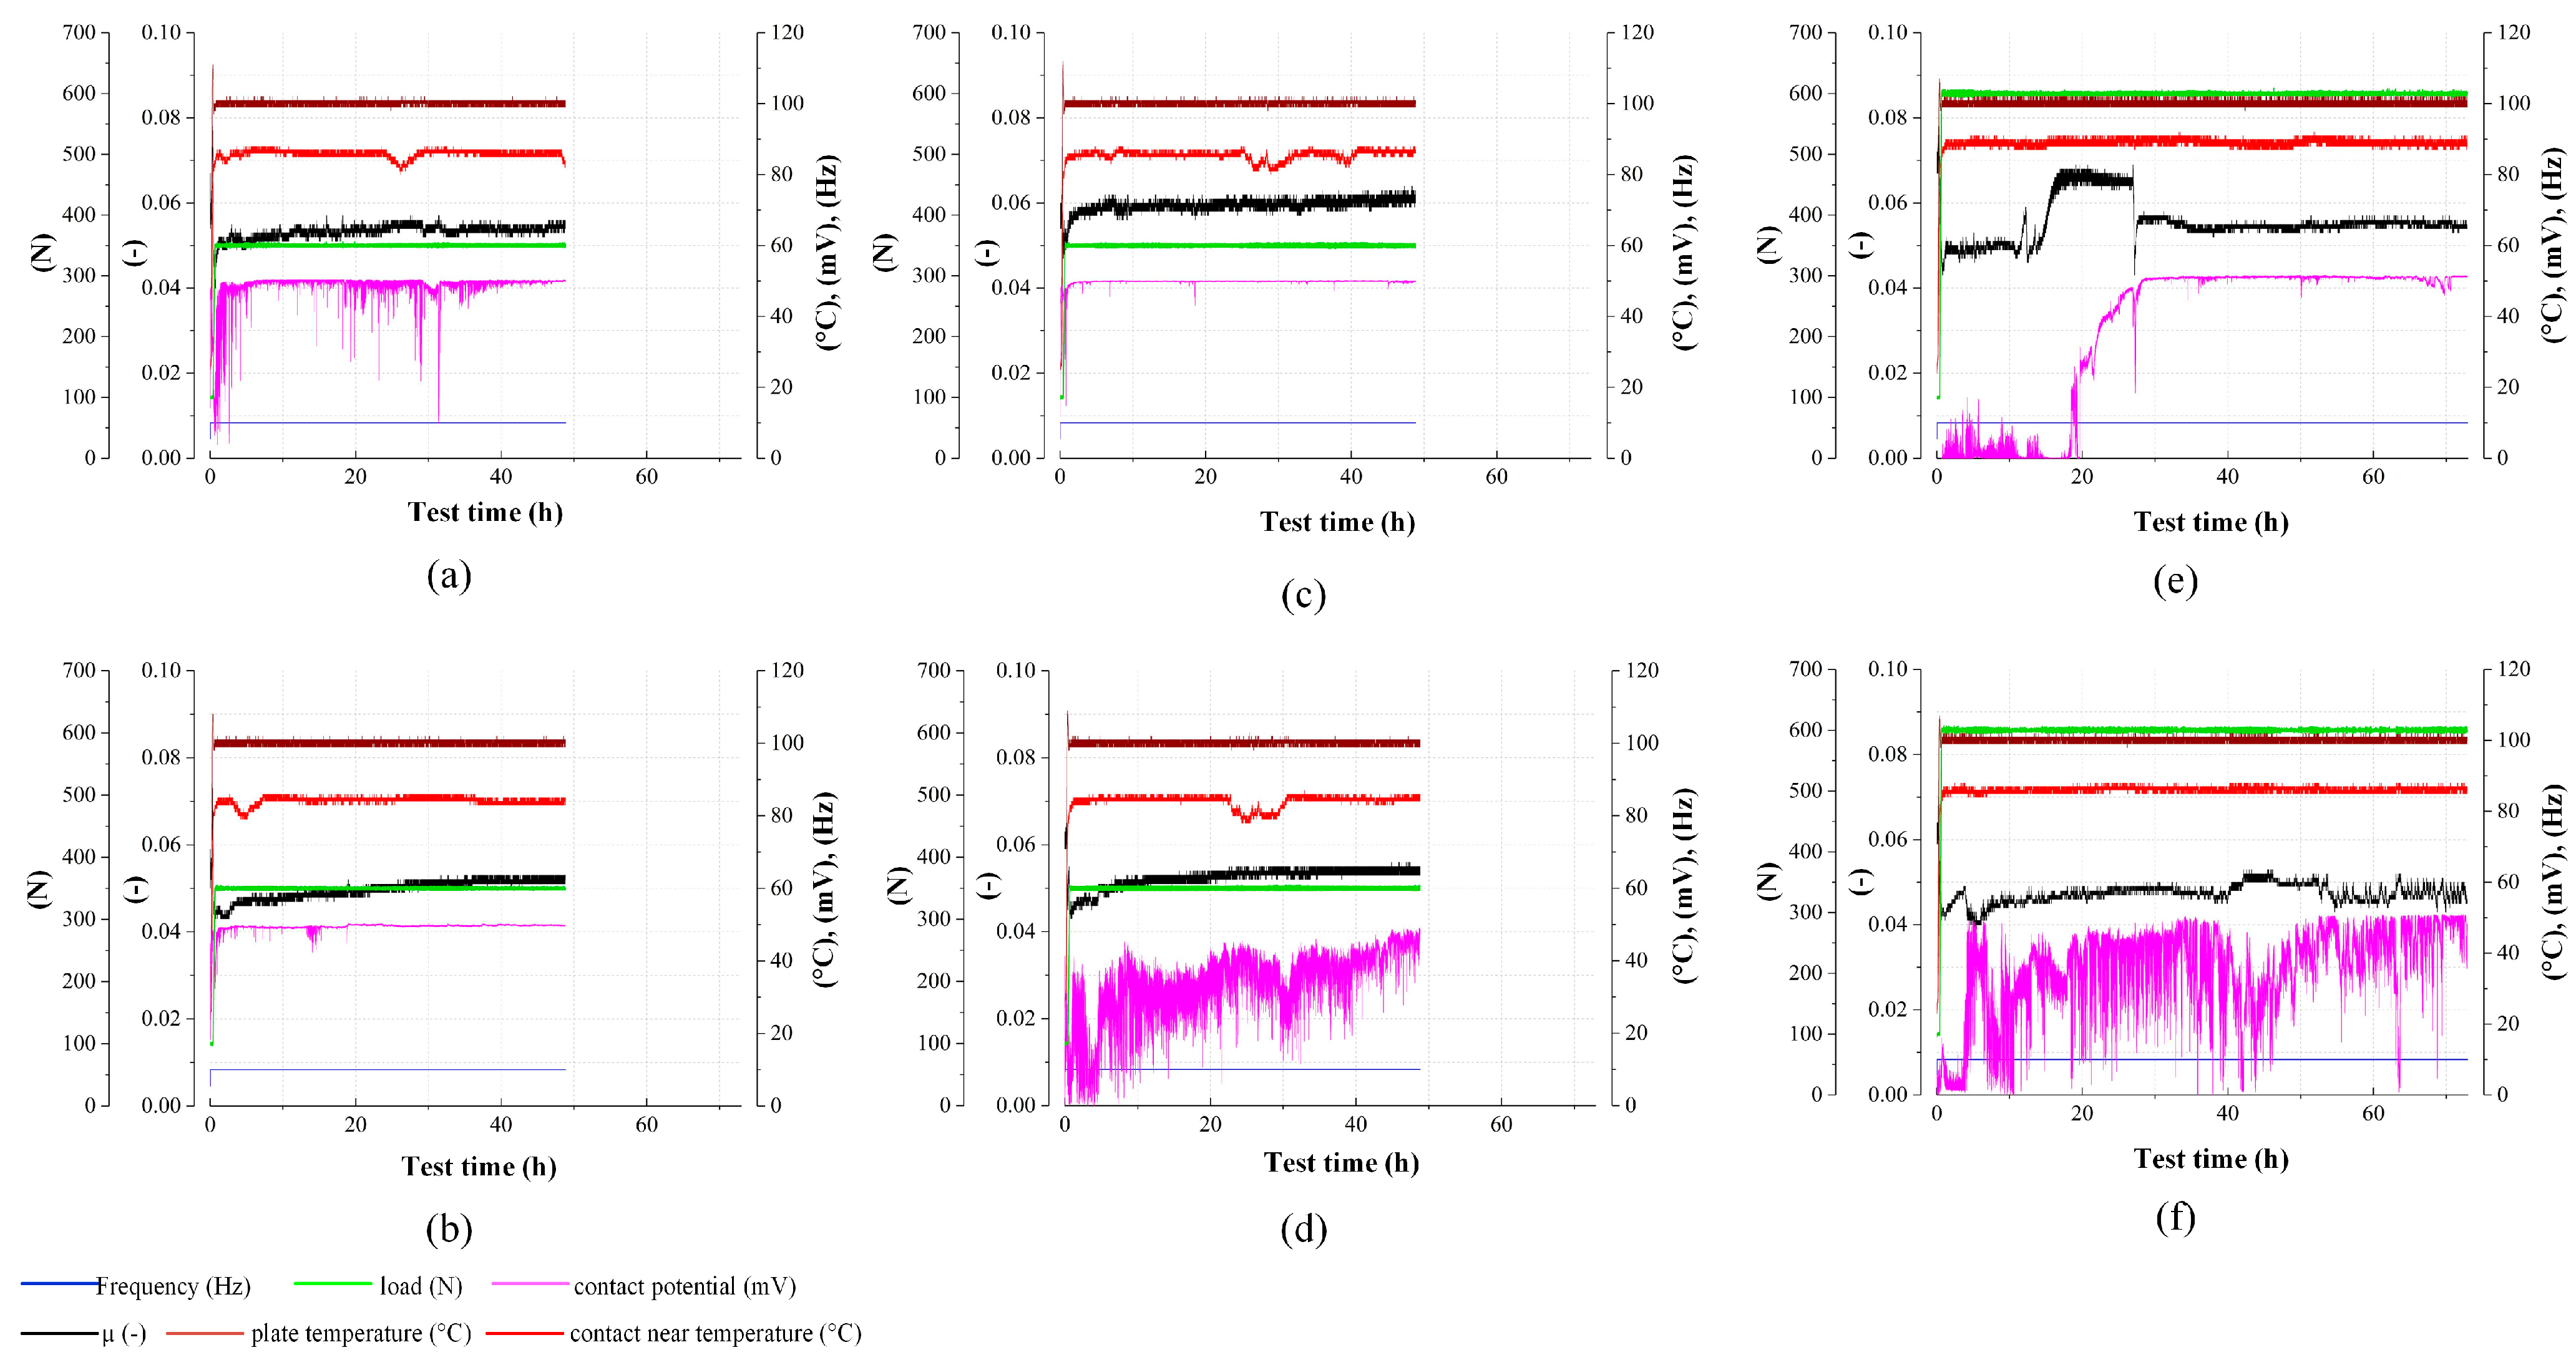
Figure 14. First, one can highlight the stable friction coefficient characteristic for the artificial oils with and without diesel dilution. After a short running-in process at the beginning of the tests (Figure 14a–d), the friction value stabilises and remains almost constant. In the course of the tests, there is a marginal increase in the coefficient of friction for all variants of this test series. In the case of Cr-N-Fe (Figure 14b,d), slightly lower friction coefficient curves can be seen, which are slightly below 0.05, and they steer towards this value towards the end of the tests. The friction coefficient characteristics of Cr-N (Figure 14a,c) are in the range of 0.05 or slightly above. Due to the similar friction coefficient curves, the temperature curves are also the same between the tests. The stable friction value processes can also be seen in the contact potential curves of all tests in this test series. For all tests, the contact potential rises to quite a high value and remains at this level for the rest of the test duration. Even for the TC 5 test condition (see Figure 14e,f—high load, long test duration), similar phenomena can be observed, although the measured friction and contact potential curve are more hectic.
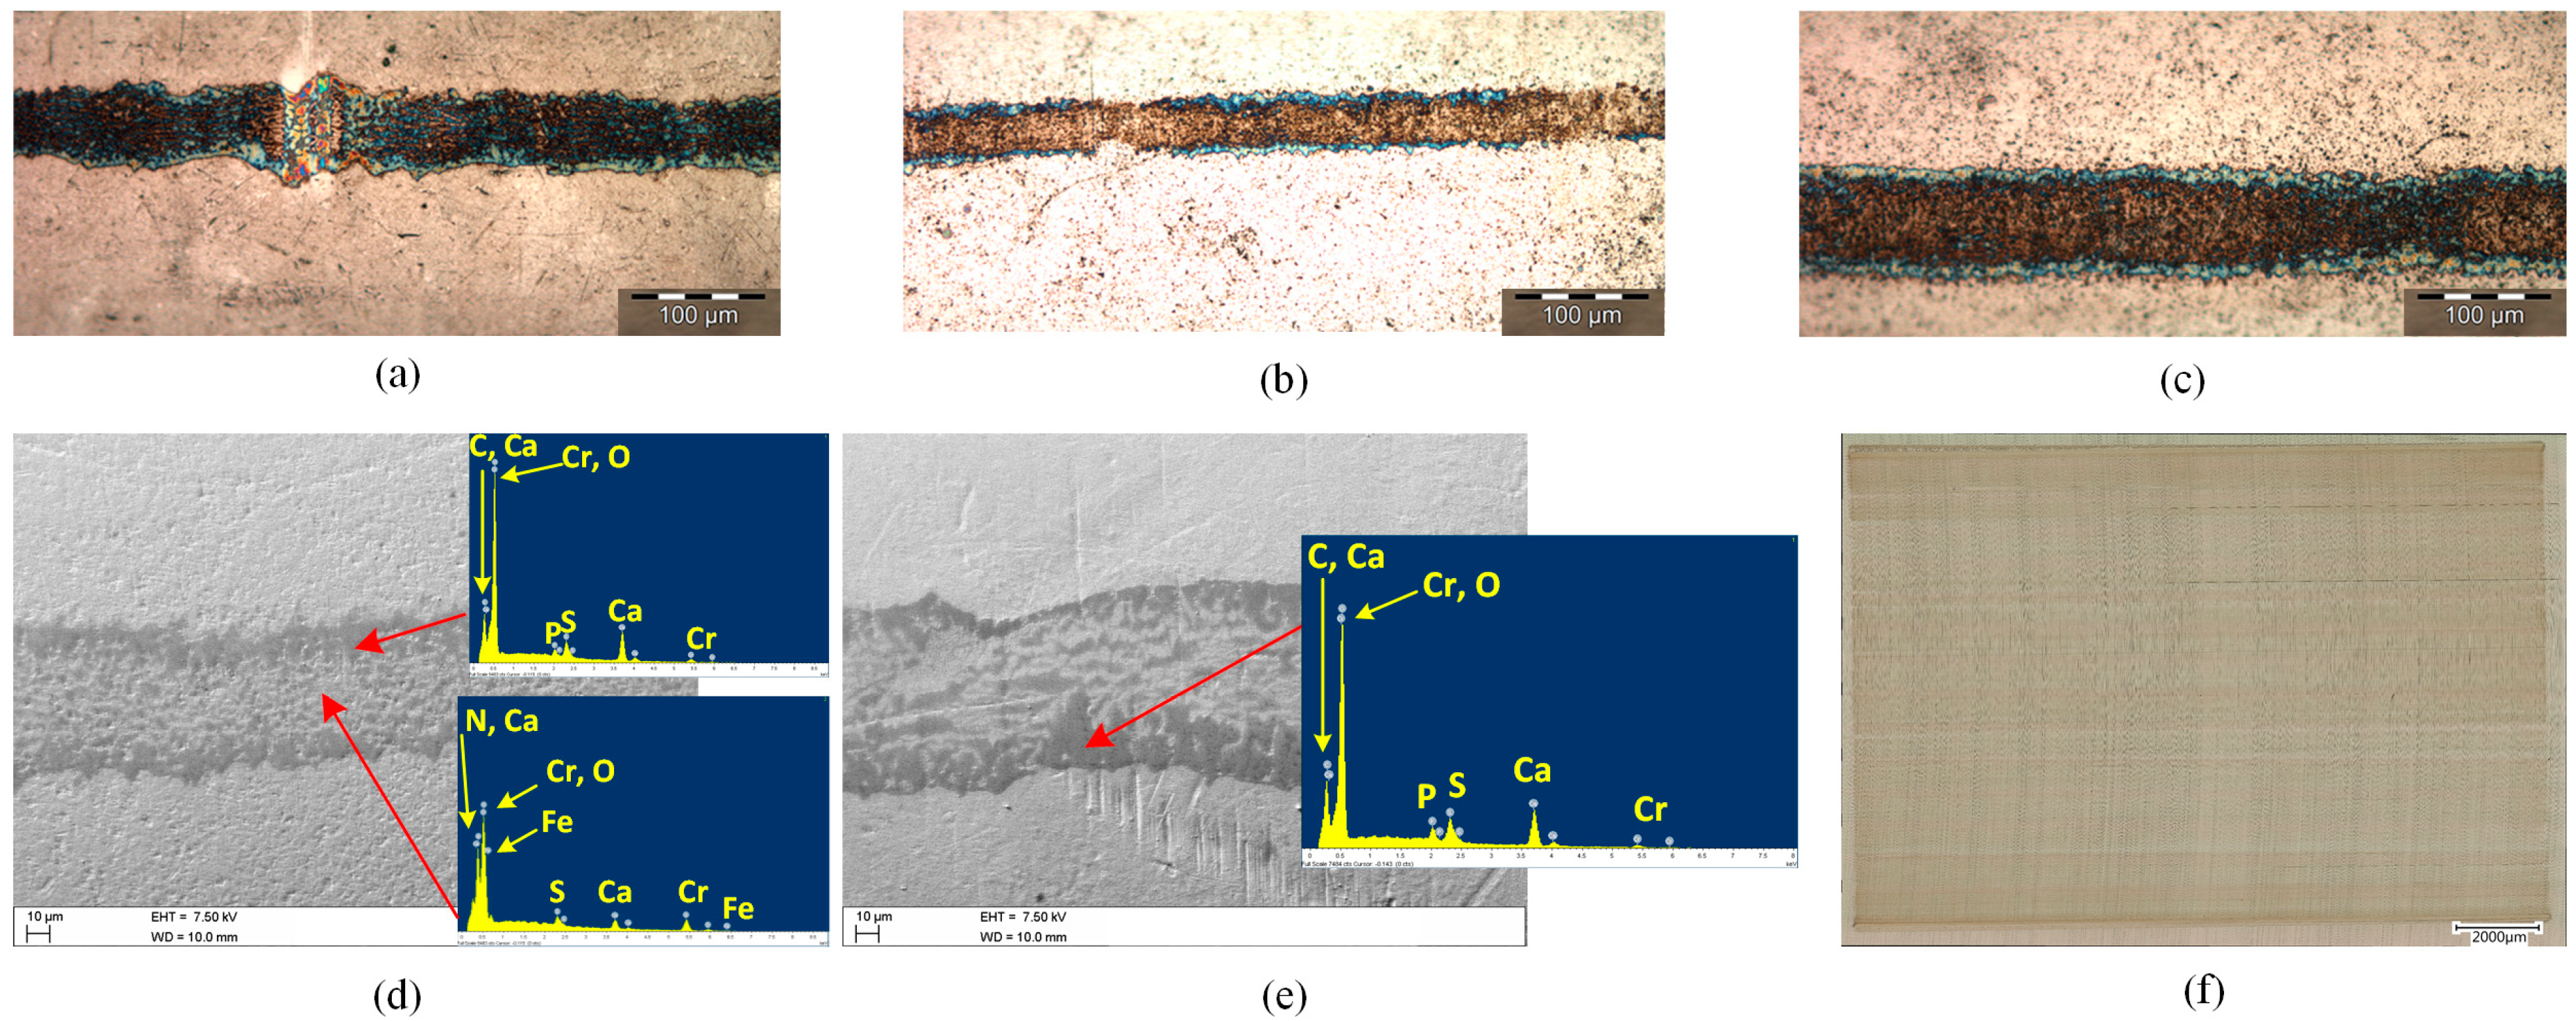
As for the surface conditions after the end of the test, these reflect the measured, stable tribological parameters during the tests. Multiple representative images from selected combinations of material, lubricant, and test programme of both surfaces of pin and steel counterpart are shown in Figure 15. Figure 15a–c shows light microscope images of the wear caps from tests with AO1 and AO3 and with both the Cr-N and Cr-N-Fe pin materials. It can be clearly seen that the wear caps are not very thick and are covered with brown and blue layers, depending on the combination. In this context, for the Cr-N-Fe material, the centre of the contact area seems to be covered more by brown tribofilms and are at the edge by blue pads (Figure 15b,c), whereas, for Cr-N, the brown layers seem to create a kind of base layer in the whole contact area, with blue pads forming on top of it (Figure 15a). Extensive tribological damage such as chipping, scoring, deformation, etc., is not visible.
Figure 15d,e shows more detailed analyses of the layers formed on both Cr-N and Cr-N-Fe using the scanning electron microscope and elemental analysis. The images show the local pad-shaped expression of the formed structures for both brown layer areas and blue ones. The elemental analyses show that the brown layers in the middle of the contact consist mainly of sulphur compounds. Calcium can also be detected there in a significant amount. The other elements such as Cr, N, and Fe originate from the pin coating (Figure 15d). For the blue pads on the Cr-N-Fe surface, an increased proportion of Ca can be detected. In addition to sulphur, phosphorus is increasingly measurable, which also indicates the formation of phosphate structures. The proportion of elements from the base material (Cr-N-Fe) is lower, with Fe and N no longer measurable at these points. The layers in the case of Cr-N (Figure 15e), which appear the same in the entire contact area, have the same elemental components as the blue layers on Cr-N-Fe, which were discussed just before, namely, primarily P, S, and Ca, in addition to O, C, and Cr, which originate from the coating. For testing at higher loads and longer duration, the proportions of P and S are increased, which can be attributed to the increased need for wear-protective components. Furthermore, a change in the formed tribological layers due to the diesel dilution could not be observed.
The steel counter bodies are free of significant surface changes in this test series, see Figure 15f. The running surface shows a slight smoothing as well as a structural alignment in the sliding direction, but this was more as a running-in process towards energetically favourable alignment for the tribological stress of the surface. Tribological protective layers or lubricant additive layers on the pin surfaces do not form over a large area.
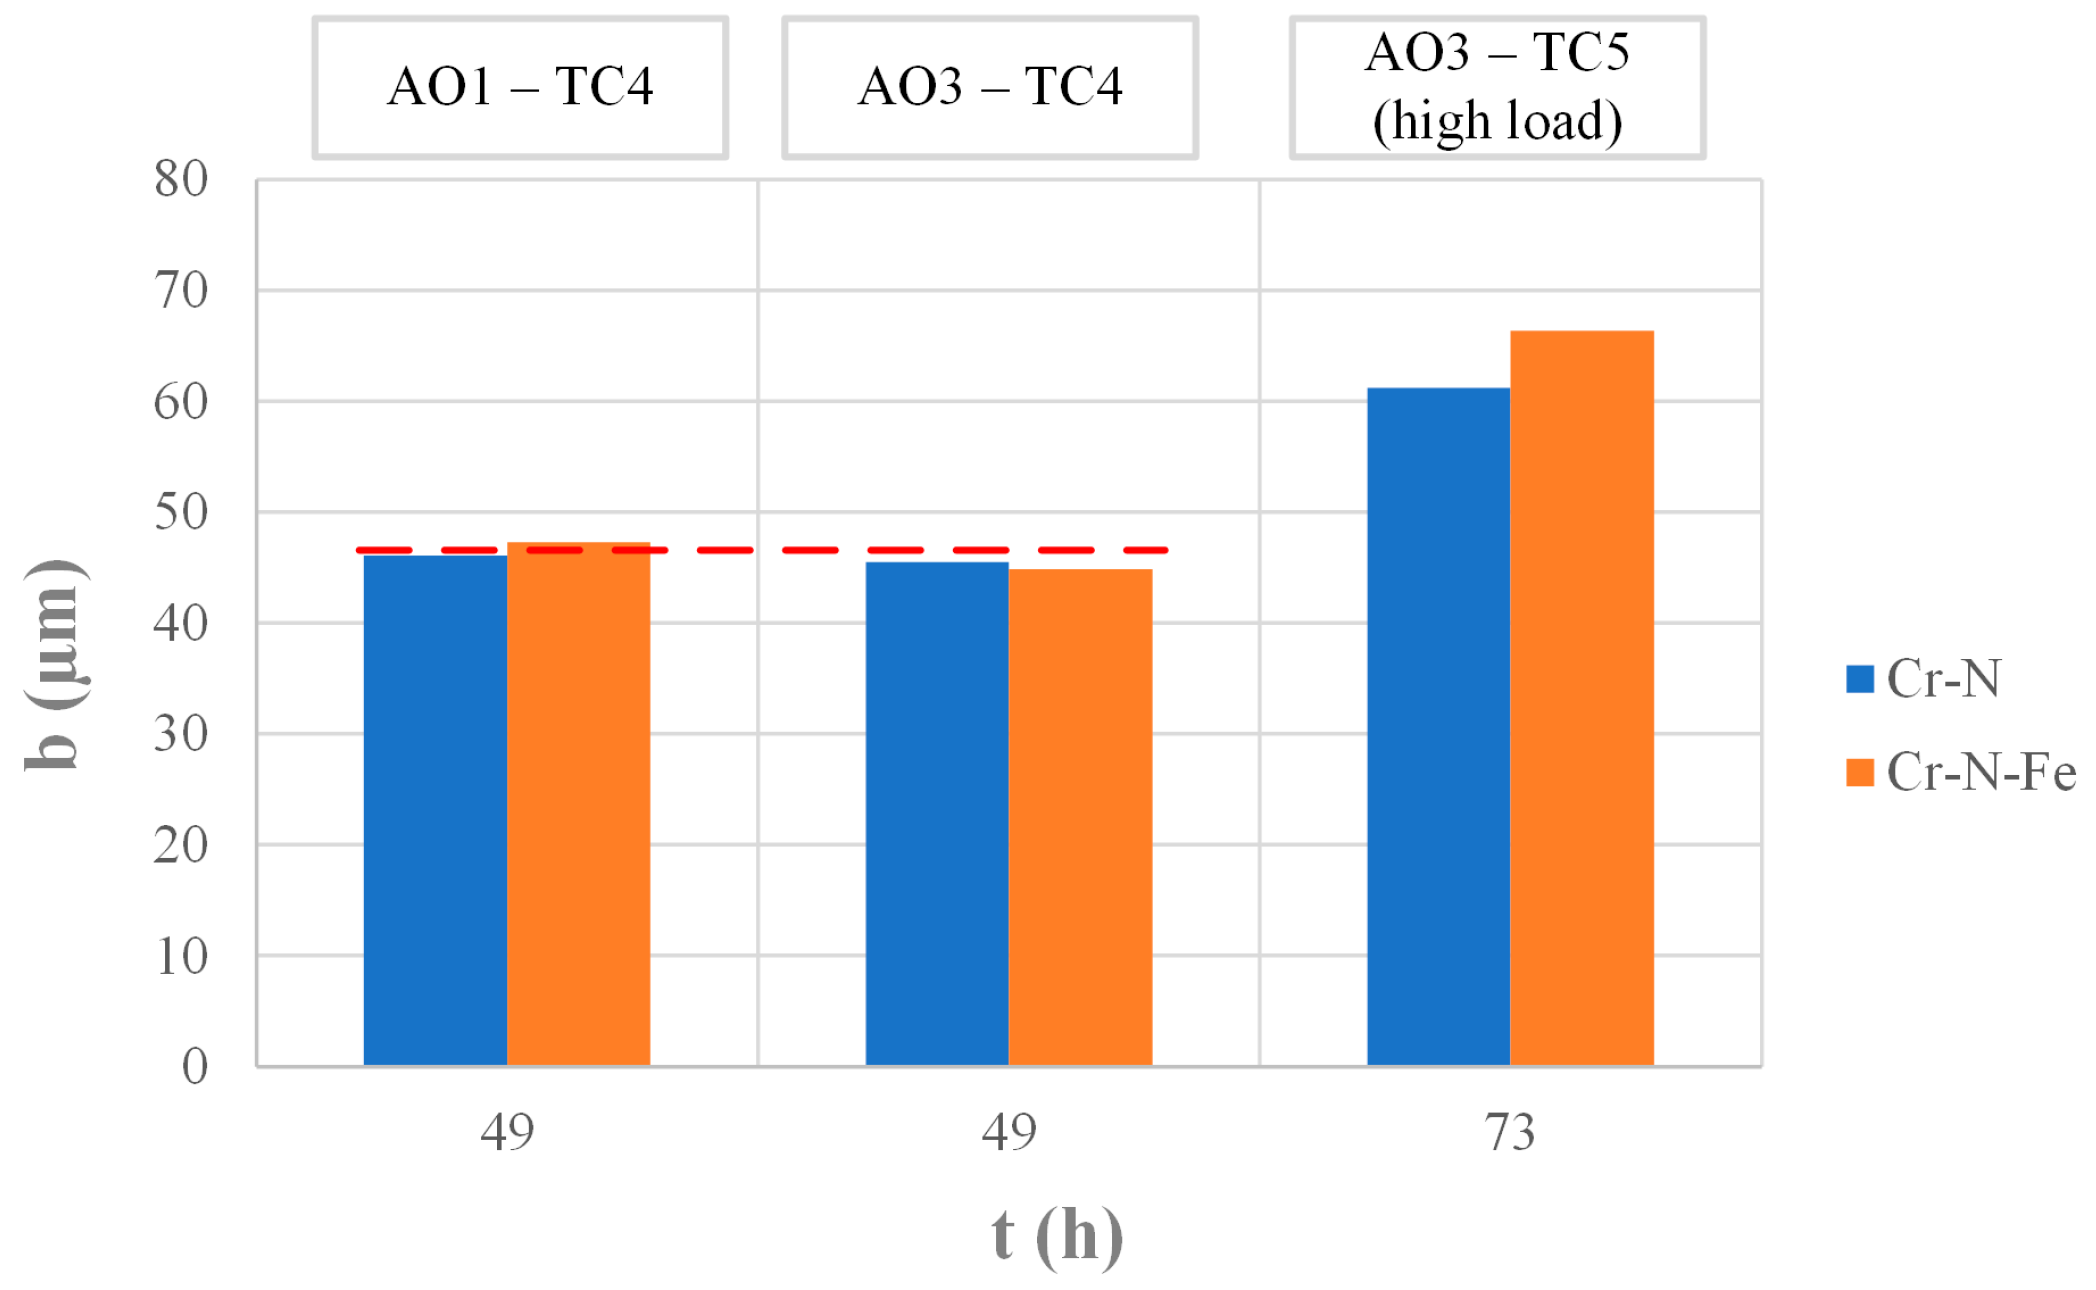
Figure 16 shows the measured wear caps of the tests with artificial oils without soot. It can be seen that the contact width that forms is significantly smaller than in the tests with used oil. In this context, the tests with fresh oil and fresh oil with diesel dilution show a wear width of just around 45 µm for moderate load and average test duration, and about 60–65 µm for long test durations and increased test load. The tests with the aged engine oils range between 150 and 350 µm, depending on the test scenario and the pin material used. It is also interesting to note that there are almost no differences between the pin materials in terms of contact width in this series of tests. As can be seen, the wear data for TC 4 are almost the same (red dotted line), and for TC 5 they are only marginally next to each other. It can also be clearly seen that the diesel dilution has no influence on the measurement results in terms of wear performance (the wear points for TC 4 also lie on top of each other for AO1 and AO3).

3.4. Performance Assessment for Artificial Lubricants with Soot (AO2 and AO4)

In this section, the experimental results with carbon black blended lubricants are presented. Figure 17 and Figure 18 show the measurement records of the experiments with the oils AO2 and AO4: Figure 18a shows the combination Cr-N/AO2, Figure 18b shows the combination Cr-N/AO4, Figure 18c shows the combination Cr-N-Fe/AO2, and Figure 18d shows the combination Cr-N-Fe/AO4. When looking at the data, it is noticeable that the contact potential collapses immediately after the start and remains at the lower limit level for the entire test duration for all tests. This indicates a limited formation of insulating boundary layers in the tribological contact for all tribosystems. By systematically comparing the same tribological systems with non-soot-blended oils, where high contact potential values were measured throughout, and the surface analyses were able to show stable lubricant boundary layers, this phenomenon can be attributed to the effect of carbon black. For the Cr-N material, in particular, a marked running-in process could be determined at the beginning in combination with AO2 (Figure 18a). In the course of this, the coefficient of friction drops somewhat and stabilizes. The absolute value of the coefficient of friction in this phase is about 0.06. In the further course, the coefficient of friction remains at this level, but the character changes to a very hectic course. Peaks in the coefficient of friction occur again and again. The high frequency of the peaks and the low overshoot values, as well as the rapid decay of these friction value peaks to the stable friction value base level, indicate locally occurring, but not further expanding, wear phenomena. This state does not change until the end of the test. In the case of the tests with Cr-N and both soot- and diesel-added lubricant (AO4), similar characteristics are shown as before (Figure 18b). There, too, there is a pronounced run-in of the friction value and then it is also slightly above 0.06 during the stable friction value level, the previously discussed friction value peaks. In contrast to AO2, however, the tests show a sustained increase in the friction coefficient level from the test duration of approximately 25 h, whereby this increase stops towards the end of the test and the friction coefficient hectic significantly increases. This increase in the friction coefficient level could be an indication of more intensive damage processes in the tribological contact. This hypothesis is confirmed by the comparison of the wear caps between the tests with AO2 and AO4 with the same material Cr-N, as an increased wear rate for the system with soot- and diesel-blended lubricant AO4 can be read there. For Cr-N-Fe, the tribometric performance with AO2 and AO4 is approximately the same (
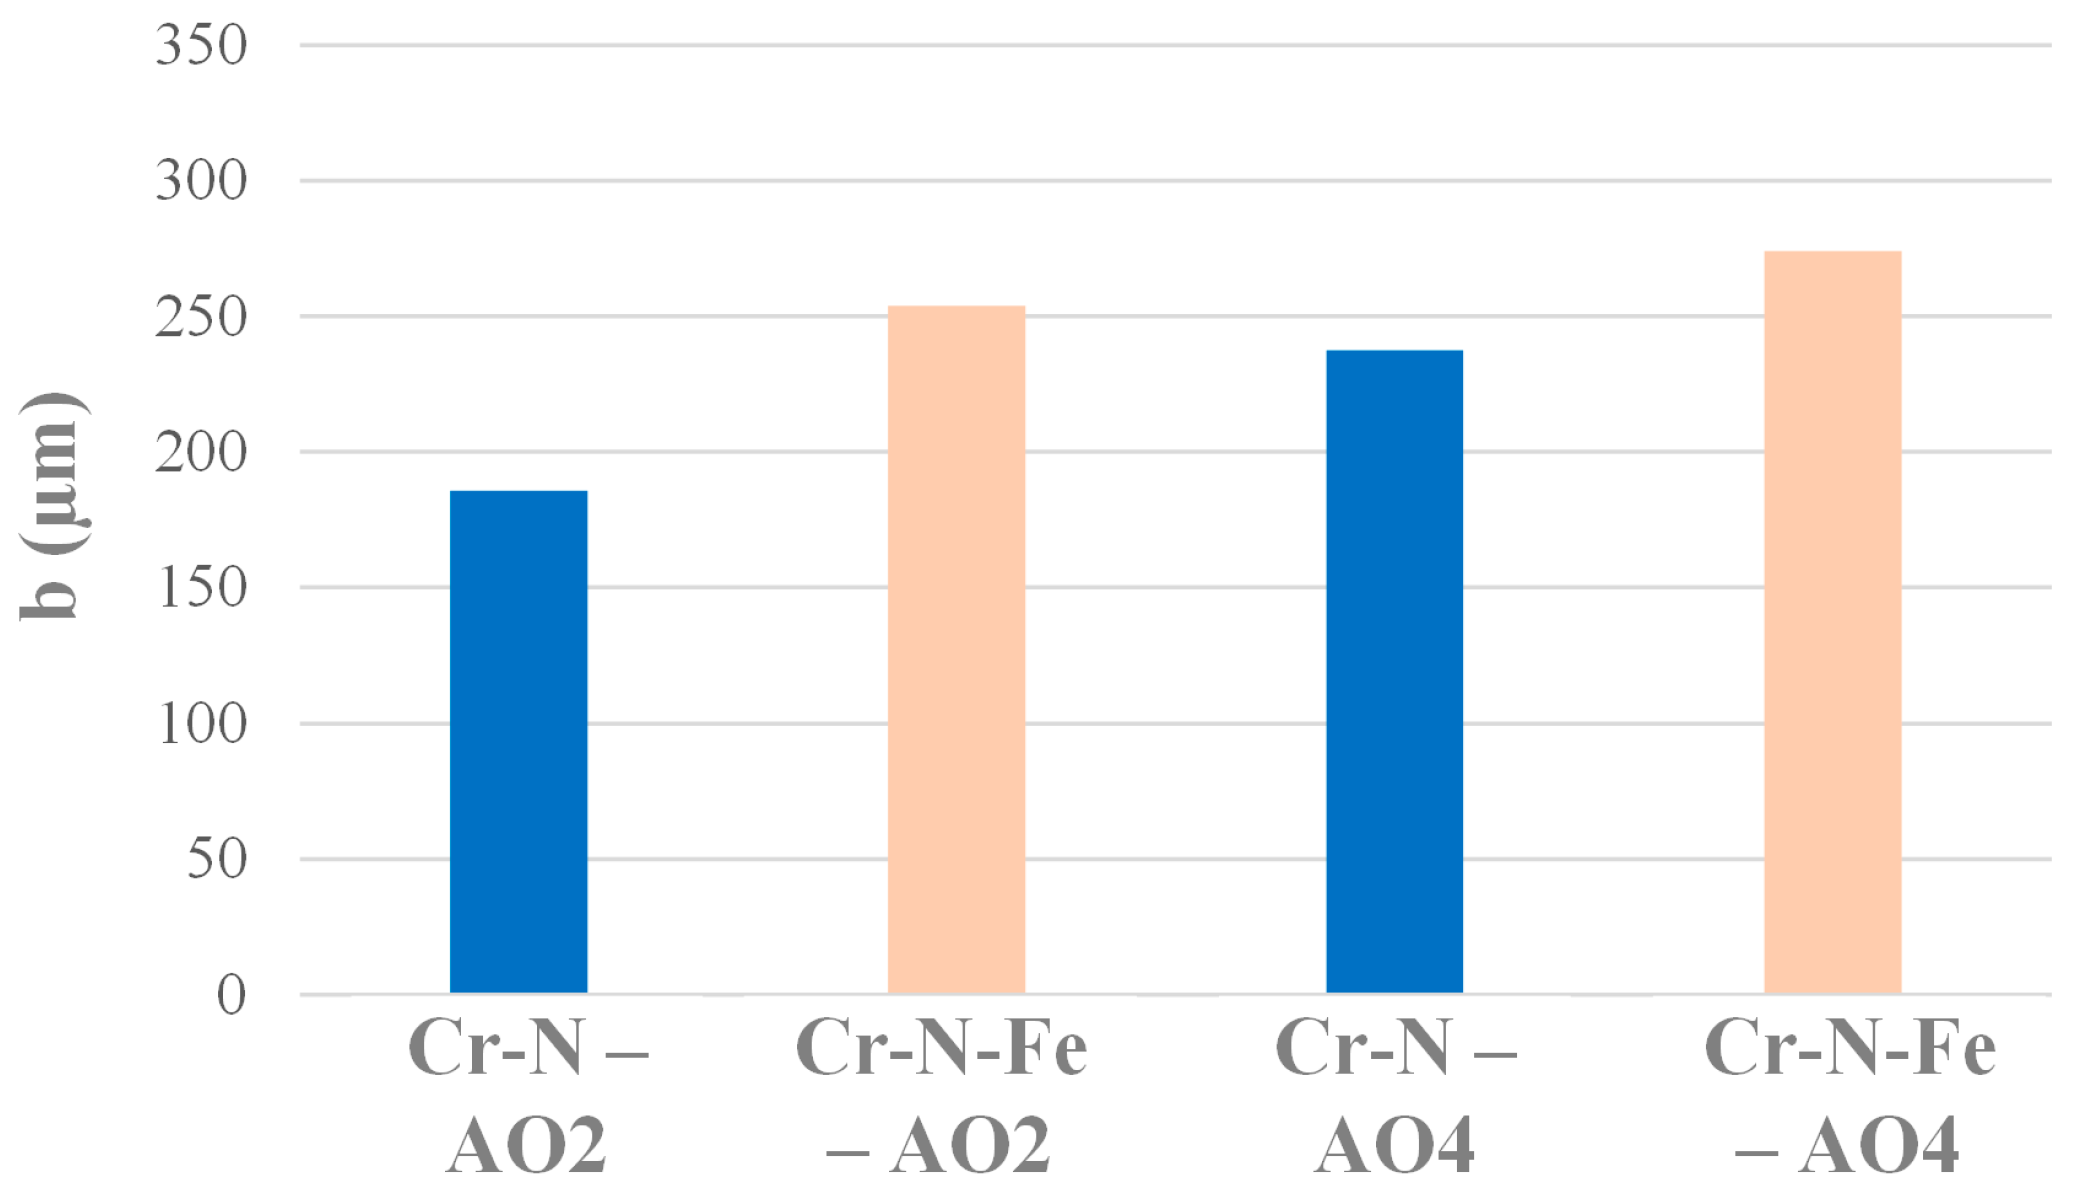
Figure 18c,d). The test curves show the same characteristics and can, therefore, be discussed in a uniform manner. Similar to Cr-N, Cr-N-Fe also shows a run-in with the soot-blended lubricants at the beginning of the tests. This is followed by stabilisation at a basic friction value level for this pin material as well. This level is approximately 0.05–0.055, i.e., somewhat below the level of Cr-N. These test runs also show pronounced friction value peaks, which are quickly reduced but also quickly end in new peaks. For the tests with Cr-N-Fe, an increase in the friction values could be observed after approximately 25 h of testing for all soot-blended lubricants. This development is accompanied by increased wear values for the Cr-N-Fe material (see Figure 17). In detail, for both lubricants with artificial soot AO2 and AO4, the wear cap of Cr-N-Fe is higher than that of Cr-N. These results are interesting because the material Cr-N-Fe performed significantly better than Cr-N in terms of wear performance in the previous test combinations.
Further insights into the prevailing tribological processes are provided by the surface analyses carried out. Figure 19a,b shows light microscope and SEM images with the pin material Cr-N and the lubricants AO2 and AO4. In addition, elemental measurements marked in Figure 19a are given (Table 6, Spectrum 1–5). The surfaces shown can be considered representative of the entire contact surfaces at the pin.
For Figure 19a, showing the surface from the tests with AO2, on the one hand, the colour contrast of the LIMI image shows the contact area; on the other hand, it can be seen that there is no run through of the coating here, which can be deduced from the absence of any further colour difference within the running surface. This is also seen in the SEM picture and confirmed via elemental measurement of the contact area, which only responds with Cr and N elements (Table 6, Spectrum 4). In addition, in the contact area, dark agglomerations and outgrowths can be seen again and again. On closer inspection, there are also local break-outs. These areas are accompanied by local bluish and brownish discolourations on the surrounding plateau areas of the coating. The rest of the contact area is consistently polished. Scanning electron microscope images and EDX analyses show that the dark agglomeration areas are mainly caused by coating breakouts and subsequent filling of the holes with deposits and overgrowth of the latter. The grown dark areas appear to be incorporated into the pin material and are deformed. An element measurement assigns the deposits to components of the lubricant additive chemistry. In this context, it is particularly P and Ca that are measurable here and characterise the additive layer characteristics in the form of potential Ca-containing phosphate glasses (Table 6, Spectrum 1, 5). Areas with high carbon contents (carbon black deposits) can also be found again and again (Table 6, Spectrum 3). These deposits often are measured along with higher amounts of S, whereby, in contrast, S is not present significantly for other tribofilm deposits. As for tests with the AO4 lubricant (Figure 19b), the processes discussed above are relatively more pronounced. The colour contrast image in the LIMI and the greyscale contrast image in the SEM show that the CrN has rubbed through, and the coating is only present at the edge of the contact area. The phenomena mentioned, such as agglomerations and chipping, are much more pronounced in these tests, as it can be seen. The mating body surfaces (Figure 19d,e) are rather bright and free of layer formations. Only in the reversal points can one find the local boundary layers, which, however, can mostly be attributed to oxide products. The topography of the surface appears for AO2 in a wavy basic order, which then shows rather smooth surfaces in the superimposed detail. For AO2, more areas with slight grooves are evident.
The surface phenomena found are in good agreement with the experimental measured values and, based on this, make it possible to hypothesise a tribological process sequence that can be explained well. It is shown that the contact is intensively stressed in mixed and boundary friction and, due to the system conditions, hardly manages to reach a stable, largely low-wear state, as in the case of the artificial oils without carbon black. In this context, the added carbon black actively prevents the formation of protective boundary layers and thus promotes wear. In the mode of action, it is not so much the possible abrasive component of the carbon black that is decisive as the tribo-chemical component, which is defined by the absence of boundary layers and grooves. In the further course, areas break out of the material Cr-N. This phenomenon has also been observed with the other lubricants and is a prominent characteristic of Cr-N. Within the contact deposits do these grow up in these areas of hollow, which lead to friction peaks in contact with the steel countersurface. Due to the harsher conditions in the tests with AO4 lubricant, the gradually exposed substrate material then results in the sustained increase in coefficient of friction in the case of AO4.
For Cr-N-Fe, break-out phenomena as in the previously presented tests are not observed. Consequently, the phenomenon of deposit build-up should also not occur. In contrast to Cr-N, for Cr-N-Fe in combination with the oils AO2 and AO4 (see Figure 19c), one sees a thoroughly smooth polished surface, with the coating being intact (see EDX measurement Table 6, Spectrum 7) and with only local grooves and local tribofilm layers (Table 6, Spectrum 8) or smaller carbon deposits (Table 6, Spectrum 8). Similar to Cr-N, tribofilms at the steel counterpart surface are missing (Figure 19f). The friction value peaks found in the measurement records, which have slightly different characteristics to Cr-N, are, therefore, more likely to originate from the adhesive interaction of the unprotected friction partners. The increased contact areas caused by this wear could, on the one hand, bring deeper layer areas of the heterogeneous layer Cr-N-Fe into contact and, on the other hand, sustainably increase the true contact area and thus explain the sustained increase in the friction value level.

4. Discussion

The results of these investigations can be discussed on the basis of the measured friction, the values for the pin wear, and the documented surface phenomena. Figure 20 shows an overall comparison of the tested systems in terms of friction, expressed as friction energy per test hour, and pin wear, expressed as wear width per sliding hour. Cr-N results are marked with blue points, whereas Cr-N-Fe results are marked with orange points. Results obtained with different lubricants are grouped with coloured ellipses. In addition, further notes on the test strategy are given in the diagram. A test duration of 25 h is described as a short run, a test duration of 73 h is described as a long run, a test duration of 49 h is not explicitly noted, and tests with 600 N are entitled with high load. For a better reading, friction and wear are ranked in different categories, viz. Friction from (A) to (C) and wear from (1) to (5), both from low to high.

4.1. Oils without Engine Soot or Carbon Black

Tests with fresh oil or solely-fuel-diluted oils up to 10 wt% showed very low wear rates—see group (1) in Figure 20. Independent of the pin material used, the wear remains at a run-in level in the range of less than 1 µm/h. Even in the case of tests with higher loads, no increase in the relative wear rate could be observed compared to the reference level. The low wear values certainly also result from the fact that P-, S-, and Ca-based anti-wear additive layers form in the interface, in particular, on the Cr-based pin surfaces. In this context, it is particularly interesting that these layers are observed especially on the Cr-based surfaces and not on the pure steel counterparts. In terms of dissipated friction, the tests with fresh or purely fuel-diluted oil tended to be at higher values (categories B to A). This observation can be backed up by other studies, as these anti-wear layers often have the effect of increasing the coefficient of friction [53,54,55]. Furthermore, when comparing fresh oil and pure diesel-diluted oil, no negative effects on friction and wear due to fuel dilution can be observed for these tests under mixed and boundary friction test regimes. Similar experimental observations, but with lower fuel contaminations and for vane pump tribosystems, were made by [42]. These findings were supported by the results from [56], which stated that diesel dilution affected viscosity rather than additive performance.

4.2. Oils from Engine Test Run

The oils used from the engine test benches (EO1/Eo2) showed significantly higher wear rates, in categories (2)–(4), than the fresh oil or solely-fuel-diluted oil for both pin materials tested. In the case of EO1 and the high load test condition, the wear rates even increased to the advanced category (5). For EO1, it was also possible to show the development over the test duration (comparison of short and long run), whereby, as expected, the wear rate was higher for shorter test runs and the associated higher real pressures. A comparison of the engine oils EO1 and EO2, in terms of wear performance, showed that the test rig did a good job of reproducing chain elongation ranking of the engine run, namely, the systems with EO1 performed better. For the engine oils, the friction losses were rather low, namely, in the lower end of category (B) or category (A) for a wide range of tests with both pin materials. In this regard, Cr-N-Fe, in combination with oils from engine test runs, showed lowest friction dissipation by far, viz. lower end of category (A). The advantages in friction losses compared to the fresh oil and fuel diluted oil can be attributed to two effects. First, under operation with both EO1 and EO2, the soot and combustion products seemed to tribo-chemically prevent the formation of antiwear additive layers on the Cr-based surfaces and the associated high friction. Secondly, soot as carbonaceous material could also provide friction reducing effects, as shown in [57,58,59].

4.3. Oils with Carbon Black Added

The addition of carbon black also significantly increased the wear rate to category (3) when comparing it to the fresh oil reference, both for Cr-N and Cr-N-Fe. For both pin materials, a higher carbon black content results in a higher increase in the wear rate. If we look at the friction for these tests, unlike the engine oils, no significant reduction in the friction energy could be observed here compared to the fresh reference oil, although the wear protection layers on the pin and also on the mating surfaces were not found here either. Therefore, this could mean that the used carbon black of this study does not have the same solid lubricating effects as the produced engine soot. If one looks at the surfaces for tests with added carbon black, where carbon containing agglomerations can be found in the interface, this hypothesis could be sustained. These solid agglomerations seem to be more strongly fixed in the interface and could be the cause of the friction peaks found in the corresponding measurement diagrams.

4.4. Pin Material Variation

The difference between the pin materials Cr-N and Cr-N-Fe is particularly pronounced. In the case of oils without soot or carbon black, there is hardly any measurable difference for the wear performance, but Cr-N-Fe provided slight advantages in terms of friction dissipation. As for oils from engine test runs, Cr-N-Fe showed both a higher wear-resistance and a lower friction dissipation compared to Cr-N. The difference is particularly large in the case of a poorly performing oil (EO2). The higher wear resistance of Cr-N-Fe can, potentially, be traced back to the higher hardness and modulus of its top compared to Cr-N, as the basic tribological mechanisms and surface structures were the same in the previously mentioned test series. Interestingly, in contrast, Cr-N showed slightly lower wear rates than Cr-N-Fe with carbon-black-added oils. This could be due to the formation of deposits, in case of Cr-N tests with carbon-black-added oils (see Figure 19a). This agglomeration may support bearing tribological loading and, therefore, could have a somewhat wear-reducing effect. On the other hand, as mentioned before, friction peaks and sliding instabilities could emerge due to this formation.

5. Conclusions

This paper covers the experimental investigations of tribological systems in the field of timing chain drives using the model testing method presented in Part I. In detail, two pin materials and several lubricant variants were tested and examined within the scope of the investigations presented. The following main findings can be noted:
  • The used test methodology was well suited to investigate and rank the different tribological systems (pin materials, lubricant, etc.). In this regard, the same oil performance ranking was achieved compared to an engine test run in terms of wear assessment when comparing two oils EO1 (acceptable chain elongation) and EO2 (high/non-acceptable chain elongation).
  • The results show that engine soot and carbon black both have a wear-promoting effect for all tested tribological systems in this study. With an increased amount of the soot surrogate carbon black from 2 wt% to 4.5 wt%, the wear increases accordingly. For oils from an engine test run, a friction reducing effect could be observed, but not for oils with added carbon black.
  • The addition of diesel fuel alone to the fresh oil with 10 wt.% did not change the friction and wear effects of either of the various tribological systems tested.
  • In the case of using fresh oils, an additive layer formation with phosphorous structures and sulphur structures on the chrome-based pin surfaces formed. Under the presence of engine soot or carbon black, these layers did not form on the Cr-based coatings, which was likely to be the reason of the wear increase. In addition, the surfaces were finely polished. This leads to the assumption of a corrosive–abrasive mechanism. In contrast to tests with engine oils, artificial oils with carbon black showed signs of carbon-based agglomerations on the pin materials, and, in particular, these were pronounced for the CrN coating, which created higher friction. These differences between oils from engine test runs and carbon-black-added oils were attributed to the different structures and surface chemistry between engine soot and carbon black, which was reported in [60].
  • In regard to the pin materials investigated, the alternative multilayer solution with a Cr-N-Fe top layer showed mostly significantly lower, but never worse, friction losses than the Cr-N reference coating under all test conditions and lubricant variants.
  • In regard to wear of the different pin materials, no significant differences were observed in the absence of soot or carbon black in the lubricant. For the oils from engine test runs, the Cr-N-Fe coating showed higher wear resistance under all test conditions compared to Cr-N, which is most likely due to the higher hardness and modulus of the Cr-N-Fe coating. In the case of the artificial oils with carbon black, the trend was the opposite in regard to the wear of the pin materials. This is hypnotized due to an accumulation and growth effect in the area of breakouts of the Cr-N layer of tribofilm and carbon deposits, which could have a wear-reducing effect.

Author Contributions

Conceptualization, F.S.; methodology, F.S. and P.B.; validation, F.S. and P.B.; formal analysis, F.S.; investigation, F.S. and P.B.; data curation, F.S.; writing—original draft preparation, F.S.; writing—review and editing, F.S., P.B., and F.G.; visualization, F.S.; supervision, F.G.; project administration, F.S. and F.G. All authors have read and agreed to the published version of the manuscript.

Funding

This research received no external funding.

Data Availability Statement

Not applicable.

Conflicts of Interest

The authors declare no conflict of interest.

References

  1. Summer, F.; Bergmann, P.; Grün, F. On the Wear Behavior of Bush Drive Chains: Part I—Characterization of Engine Damage Processes and Development of a Model Test Setup for Pin Wear. Lubricants 2023, 11, 85. [Google Scholar] [CrossRef]
  2. Fink, T.; Hirschmann, V. Kettentriebe für den Einsatz in modernen Verbrennungsmotoren. MTZ-Mot. Z. 2001, 62, 796–806. [Google Scholar] [CrossRef]
  3. Burgess, S.; Lodge, C. Optimisation of the chain drive system on sports motorcycles. Sport. Eng. 2004, 7, 65–73. [Google Scholar] [CrossRef]
  4. Sundar, M.; Kumaran, S.T.; Kurniawan, R.; Ahmed, F. Investigating the corrosion behaviour of conveyor chain pin and link. Mater. Today Proc. 2021, 50, 855–860. [Google Scholar] [CrossRef]
  5. Belmer, S.; Fink, T.; Lorenz, I.; Neukirchner, H. Steuertriebefür Verbrennungsmotoren. MTZ-Mot. Z. 2005, 66, 466–475. [Google Scholar] [CrossRef]
  6. Tung, S.C.; McMillan, M.L. Automotive tribology overview of current advances and challenges for the future. Tribol. Int. 2004, 37, 517–536. [Google Scholar] [CrossRef]
  7. Sappok, D.; Sauer, B. Wear Measurement on Chain Joint Components Using a Roundness Instrument. Period. Polytech. Mech. Eng. 2015, 59, 51–59. [Google Scholar] [CrossRef] [Green Version]
  8. Fink, T.; Bodenstein, H. Möglichkeiten der Reibungsreduktion in Kettentrieben. MTZ-Mot. Z. 2011, 72, 582–587. [Google Scholar] [CrossRef]
  9. Enomoto, Y.; Yamamoto, T. New materials in automotive tribology. Tribol. Lett. 1998, 5, 13–24. [Google Scholar] [CrossRef]
  10. Wan, S.; Li, D.; Zhang, G.; Tieu, A.K.; Zhang, B. Comparison of the scuffing behaviour and wear resistance of candidate engineered coatings for automotive piston rings. Tribol. Int. 2017, 106, 10–22. [Google Scholar] [CrossRef]
  11. Laxane, R.B.; Bhide, R.S.; Patil, A.S.; Sane, S.G. Characterisation of chromium nitride physical vapour deposition coating on diesel engine pistons. Surf. Eng. 2006, 22, 78–80. [Google Scholar] [CrossRef]
  12. Ferreira, R.; Carvalho, Ó.; Sobral, L.; Carvalho, S.; Silva, F. Influence of morphology and microstructure on the tribological behavior of arc deposited CrN coatings for the automotive industry. Surf. Coat. Technol. 2020, 397, 126047. [Google Scholar] [CrossRef]
  13. Bozyazı, E.; Ürgen, M.; Çakır, A.F. Comparison of reciprocating wear behaviour of electrolytic hard chrome and arc-PVD CrN coatings. Wear 2004, 256, 832–839. [Google Scholar] [CrossRef]
  14. Vera, E.; Vite, M.; Lewis, R.; Gallardo, E.; Laguna-Camacho, J. A study of the wear performance of TiN, CrN and WC/C coatings on different steel substrates. Wear 2011, 271, 2116–2124. [Google Scholar] [CrossRef]
  15. Tung, S.C.; Gao, H. Tribological characteristics and surface interaction between piston ring coatings and a blend of energy-conserving oils and ethanol fuels. Wear 2003, 255, 1276–1285. [Google Scholar] [CrossRef]
  16. Petrogalli, C.; Montesano, L.; Gelfi, M.; La Vecchia, G.; Solazzi, L. Tribological and corrosion behavior of CrN coatings: Roles of substrate and deposition defects. Surf. Coat. Technol. 2014, 258, 878–885. [Google Scholar] [CrossRef]
  17. Lorenzo-Martin, C.; Ajayi, O.; Erdemir, A.; Fenske, G.; Wei, R. Effect of microstructure and thickness on the friction and wear behavior of CrN coatings. Wear 2013, 302, 963–971. [Google Scholar] [CrossRef]
  18. Shan, L.; Zhang, Y.-R.; Wang, Y.-X.; Li, J.-L.; Jiang, X.; Chen, J.-M. Corrosion and wear behaviors of PVD CrN and CrSiN coatings in seawater. Trans. Nonferrous Met. Soc. China 2016, 26, 175–184. [Google Scholar] [CrossRef]
  19. Ou, Y.X.; Lin, J.; Tong, S.; Che, H.L.; Sproul, W.D.; Lei, M.K. Wear and corrosion resistance of CrN/TiN superlattice coatings deposited by a combined deep oscillation magnetron sputtering and pulsed dc magnetron sputtering. Appl. Surf. Sci. 2015, 351, 332–343. [Google Scholar] [CrossRef]
  20. Gilewicz, A.; Warcholinski, B. Tribological properties of CrCN/CrN multilayer coatings. Tribol. Int. 2014, 80, 34–40. [Google Scholar] [CrossRef]
  21. Qi, Y.; Liang, W.; Miao, Q.; Yi, J.; Lin, H.; Liu, Y.; Ma, H. Role of the nitrogen ratio on mechanical properties and wear resistance of CrN/Fe functionally graded coating produced by double glow plasma alloying. Appl. Surf. Sci. 2022, 585, 152735. [Google Scholar] [CrossRef]
  22. Sui, X.; Liu, J.; Zhang, S.; Yang, J.; Hao, J. Microstructure, mechanical and tribological characterization of CrN/DLC/Cr-DLC multilayer coating with improved adhesive wear resistance. Appl. Surf. Sci. 2018, 439, 24–32. [Google Scholar] [CrossRef]
  23. Spikes, H. The History and Mechanisms of ZDDP. Tribol. Lett. 2004, 17, 469–489. [Google Scholar] [CrossRef]
  24. Grün, F.; Summer, F.; Pondicherry, K.S.; Gódor, I.; Offenbecher, M.; Lainé, E. Tribological functionality of aluminium sliding materials with hard phases under lubricated conditions. Wear 2013, 298–299, 127–134. [Google Scholar] [CrossRef]
  25. Pereira, G.; Lachenwitzer, A.; Nicholls, M.; Kasrai, M.; Norton, P.; De Stasio, G. Chemical characterization and nanomechanical properties of antiwear films fabricated from ZDDP on a near hypereutectic Al–Si alloy. Tribol. Lett. 2005, 18, 411–427. [Google Scholar] [CrossRef]
  26. Pereira, G.; Lachenwitzer, A.; Munoz-Paniagua, D.; Kasrai, M.; Norton, P.R.; Abrecht, M.; Gilbert, P. The role of the cation in antiwear films formed from ZDDP on 52100 steel. Tribol. Lett. 2006, 23, 109–119. [Google Scholar] [CrossRef]
  27. Nicholls, M.A.; Do, T.; Norton, P.R.; Kasrai, M.; Bancroft, G. Review of the lubrication of metallic surfaces by zinc dialkyl-dithiophosphates. Tribol. Int. 2005, 38, 15–39. [Google Scholar] [CrossRef]
  28. Nicholls, M.A.; Norton, P.R.; Bancroft, G.M.; Kasrai, M.; Stasio, G.D.; Wiese, L.M. Spatially resolved nanoscale chemical and mechanical characterization of ZDDP antiwear films on aluminum?silicon alloys under cylinder/bore wear conditions. Tribol. Lett. 2005, 18, 261–278. [Google Scholar] [CrossRef]
  29. Martin, J.M. Antiwear mechanisms of zinc dithiophosphate: A chemical hardness approach. Tribol. Lett. 1999, 6, 1–8. [Google Scholar] [CrossRef]
  30. Ji, H.; Nicholls, M.A.; Norton, P.R.; Kasrai, M.; Capehart, T.W.; Perry, T.A.; Cheng, Y.-T. Zinc-dialkyl-dithiophosphate antiwear films: Dependence on contact pressure and sliding speed. Wear 2005, 258, 789–799. [Google Scholar] [CrossRef]
  31. Ng, E.; Sinha, S.K.; Satyanarayana, N.; Lim, C.; Narayan, A. Effect of ZDDP and ashless triphenyl phosphorothionate (TPPT) as lubricant additives on tribological performance of Cr–N coatings. Tribol.-Mater. Surf. Interfaces 2014, 8, 172–178. [Google Scholar] [CrossRef]
  32. Mandrino, D.; Podgornik, B. XPS investigations of tribofilms formed on CrN coatings. Appl. Surf. Sci. 2017, 396, 554–559. [Google Scholar] [CrossRef]
  33. Morina, A.; Haque, T.; Neville, A. Comparing Tribochemical Film Formation and Durability at Steel and CrN Coating Interface in Boundary Lubrication. Tribol. Online 2010, 5, 187–194. [Google Scholar] [CrossRef] [Green Version]
  34. Haque, T.; Morina, A.; Neville, A.; Kapadia, R.; Arrowsmith, S. Non-ferrous coating/lubricant interactions in tribological contacts: Assessment of tribofilms. Tribol. Int. 2007, 40, 1603–1612. [Google Scholar] [CrossRef]
  35. Tandler, R.; Bohn, N.; Gabbert, U.; Woschke, E. Experimental investigations of the internal friction in automotive bush chain drive systems. Tribol. Int. 2019, 140, 105871. [Google Scholar] [CrossRef]
  36. Mainwaring, R. Soot and Wear in Heavy Duty Diesel Engines. In SAE Transactions; SAE International: Warrendale, PA, USA, 1997. [Google Scholar] [CrossRef]
  37. Salehi, F.M.; Khaemba, D.N.; Morina, A.; Neville, A. Corrosive–Abrasive Wear Induced by Soot in Boundary Lubrication Regime. Tribol. Lett. 2016, 63, 256. [Google Scholar] [CrossRef] [Green Version]
  38. Ratoi, M.; Castle, R.C.; Bovington, C.H.; Spikes, H.A. The influence of soot and dispersant on ZDDP film thickness and friction. Lubr. Sci. 2004, 17, 25–43. [Google Scholar] [CrossRef]
  39. Chinas-Castillo, F.; Spikes, H. The Behavior of Diluted Sooted Oils in Lubricated Contacts. Tribol. Lett. 2004, 16, 317–322. [Google Scholar] [CrossRef]
  40. Ryason, P.; Chan, I.; Gilmore, J. Polishing wear by soot. Wear 1990, 137, 15–24. [Google Scholar] [CrossRef]
  41. Vyavhare, K.; Bagi, S.; Patel, M.; Aswath, P.B. Impact of Diesel Engine Oil Additives–Soot Interactions on Physiochemical, Oxidation, and Wear Characteristics of Soot. Energy Fuels 2019, 33, 4515–4530. [Google Scholar] [CrossRef]
  42. Salehi, F.M.; Morina, A.; Neville, A. The effect of soot and diesel contamination on wear and friction of engine oil pump. Tribol. Int. 2017, 115, 285–296. [Google Scholar] [CrossRef] [Green Version]
  43. Salehi, F.M.; Morina, A.; Neville, A. Zinc Dialkyldithiophosphate Additive Adsorption on Carbon Black Particles. Tribol. Lett. 2018, 66, 118. [Google Scholar] [CrossRef] [Green Version]
  44. Kontou, A.; Southby, M.; Spikes, H. Effect of steel hardness on soot wear. Wear 2017, 390–391, 236–245. [Google Scholar] [CrossRef]
  45. Olomolehin, Y.; Kapadia, R.; Spikes, H. Antagonistic Interaction of Antiwear Additives and Carbon Black. Tribol. Lett. 2009, 37, 49–58. [Google Scholar] [CrossRef] [Green Version]
  46. Kontou, A.; Southby, M.; Morgan, N.; Spikes, H.A. Influence of Dispersant and ZDDP on Soot Wear. Tribol. Lett. 2018, 66, 157. [Google Scholar] [CrossRef] [Green Version]
  47. Paulovics, L.; Kuti, R.; Rohde-Brandenburger, J.; Tóth-Nagy, C. Development of comparative investigation method for timing chain wear analysis using oscillating tribometer. Acta Tech. Jaurinensis 2021, 14, 406–423. [Google Scholar] [CrossRef]
  48. Sappok, D.; Merz, R.; Sauer, B.; Kopnarski, M. Surface Analysis of Chain Joint Components after Tribological Load and Usage of Antiwear Additives. Conf. Pap. Sci. 2015, 2015, 407048. [Google Scholar] [CrossRef] [Green Version]
  49. Lin, J.; Sproul, W.D.; Moore, J.J.; Lee, S.; Myers, S. High rate deposition of thick CrN and Cr2N coatings using modulated pulse power (MPP) magnetron sputtering. Surf. Coat. Technol. 2011, 205, 3226–3234. [Google Scholar] [CrossRef]
  50. Li, D.; Kong, N.; Zhang, B.; Zhang, B.; Li, R.; Zhang, Q. Comparative study on the effects of oil viscosity on typical coatings for automotive engine components under simulated lubrication conditions. Diam. Relat. Mater. 2020, 112, 108226. [Google Scholar] [CrossRef]
  51. Pondicherry, K.S.; Grün, F.; Gódor, I.; Bertram, R.; Offenbecher, M. Applicability of ring-on-disc and pin-on-plate test methods for Cu-steel and Al-steel systems for large area conformal contacts. Lubr. Sci. 2012, 25, 231–247. [Google Scholar] [CrossRef]
  52. Neville, A.; Morina, A.; Haque, T.; Voong, M. Compatibility between tribological surfaces and lubricant additives—How friction and wear reduction can be controlled by surface/lube synergies. Tribol. Int. 2007, 40, 1680–1695. [Google Scholar] [CrossRef]
  53. Taylor, L.J.; Spikes, H.A. Friction-Enhancing Properties of ZDDP Antiwear Additive: Part I—Friction and Morphology of ZDDP Reaction Films. Tribol. Trans. 2003, 46, 303–309. [Google Scholar] [CrossRef]
  54. Taylor, L.; Dratva, A.; Spikes, H.A. Friction and Wear Behavior of Zinc Dialkyldithiophosphate Additive. Tribol. Trans. 2000, 43, 469–479. [Google Scholar] [CrossRef]
  55. Morina, A.; Neville, A.; Green, J.; Priest, M. Assessing friction, wear and film formation characteristics in formulated lubricants in severe to moderate boundary lubrication conditions. In Tribological Research and Design for Engineering Systems; Dowson, D., Priest, M., Dalmaz, G., Lubrecht, A.A., Eds.; Elsevier: Amsterdam, The Netherlands, 2003; pp. 23–33. [Google Scholar] [CrossRef]
  56. Kaminski, P. Experimental Investigation into the Effects of Fuel Dilution on the Change in Chemical Properties of Lubricating Oil Used in Fuel Injection Pump of Pielstick PA4 V185 Marine Diesel Engine. Lubricants 2022, 10, 162. [Google Scholar] [CrossRef]
  57. Peng, J.-F.; Shen, M.-X.; Cai, Z.-B. Nano Diesel Soot Particles Reduce Wear and Friction Performance Using an Oil Additive on a Laser Textured Surface. Coatings 2018, 8, 89. [Google Scholar] [CrossRef] [Green Version]
  58. Saini, V.; Seth, S.; Ramakumar, S.S.V.; Bijwe, J. Carbon Nanoparticles of Varying Shapes as Additives in Mineral Oil Assessment of Comparative Performance Potential. ACS Appl. Mater. Interfaces 2021, 13, 38844–38856. [Google Scholar] [CrossRef] [PubMed]
  59. Marchetto, D.; Restuccia, P.; Ballestrazzi, A.; Righi, M.; Rota, A.; Valeri, S. Surface passivation by graphene in the lubrication of iron: A comparison with bronze. Carbon 2017, 116, 375–380. [Google Scholar] [CrossRef] [Green Version]
  60. Clague, A.; Donnet, J.; Wang, T.; Peng, J. A comparison of diesel engine soot with carbon black. Carbon 1999, 37, 1553–1565. [Google Scholar] [CrossRef]
Figure 1. Test method details: (a) Schematic of the test set up; (b) Test programme (Adapted from [1]).
Lubricants 11 00157 g001
Figure 2. Comparison of initial pin condition: (a) Surface and cross-section view of Cr-N; (b) Surface view of Cr-N-Fe; EDX spectrum measured with 7.5 kV.
Lubricants 11 00157 g002
Figure 3. Cross-section of Cr-N-Fe (EDX spectra measured with 7.5 kV).
Lubricants 11 00157 g003
Figure 4. Cr-N coating analysis: (a) Cross section nanoindentation measurements of surface near region of Cr-N (Position 7.5 µm represents the surface); (b) Schematic coating depiction.
Lubricants 11 00157 g004
Figure 5. Cr-N-Fe coating analysis: (a) Cross section nanoindentation measurements of surface near region of Cr-N-Fe (Position 21 µm represents the surface); (b) Schematic coating depiction.
Lubricants 11 00157 g005
Figure 6. Comparison of Rockwell adhesion indent marks: (a) Cr-N; (b) Cr-N-Fe.
Lubricants 11 00157 g006
Figure 7. Test plots of EO1/Cr-N-Fe test combination: (a) TC 1; (b) TC 2; (c) TC 3.
Lubricants 11 00157 g007
Figure 8. Surface analysis of selected test parts with EO1/Cr-N-Fe test combination: (a) Pin surface from test with TC 1 test programme (measured with 7.5 kV and values given in at.%); (b) Pin surface from test with TC 2 test programme; (c) Steel counterpart surface from test with TC 2 test programme. In the illustrations, the arrows and the red circles mark abrasive grooves (a,b) as well as regions of tribofilm formation for (c). The b label shows the wear cap.
Lubricants 11 00157 g008
Figure 9. Wear results from tests with EO1 lubricant; wear cap plotted over test time.
Lubricants 11 00157 g009
Figure 10. Test results obtained with TC 4 test programme and EO2 lubricant: (a) Cr-N; (b) Cr-N-Fe.
Lubricants 11 00157 g010
Figure 11. Quantitative results regarding friction energy (Ef) and wear (wear width b) from tests with EO2 lubricant.
Lubricants 11 00157 g011
Figure 12. Pin surfaces from tests with EO2 lubricant obtained with TC 4 test programme: (a) LIMI picture of Cr-N; (b) SEM picture of Cr-N; (c) LIMI picture of Cr-N-Fe; (d) SEM picture of Cr-N-Fe.
Lubricants 11 00157 g012
Figure 13. Steel counterpart surfaces from tests with EO2 lubricant obtained with TC 4 test programme: (a) Cr-N counterpart—LIMI overview pictures of surface condition and tribofilm coverage; (b) Cr-N counterpart—LIMI detailed picture of tribofilms; (c) Cr-N counterpart—SEM depiction of formed tribofilms; (d) Cr-N-Fe counterpart—LIMI overview pictures of surface condition and tribofilm coverage; (e) Cr-N-Fe counterpart—LIMI detailed picture of tribofilms; (f) Cr-N-Fe counterpart—SEM depiction of formed tribofilms.
Lubricants 11 00157 g013
Figure 14. Tests with artificial lubricants without soot: (a) Cr-N material and AO1 for TC 4 programme; (b) Cr-N-Fe material and AO1 for TC 4 programme; (c) Cr-N material and AO3 for TC 4 programme; (d) Cr-N-Fe material and AO3 for TC 4 programme; (e) Cr-N material and AO3 for TC 5 programme; (f) Cr-N-Fe material and AO3 for TC 5 programme.
Lubricants 11 00157 g014
Figure 15. Post-test surface condition of parts tested with artificial lubricants without soot: (a) Cr-N pin surface tested with AO1 and TC 4 programme; (b) Cr-N-Fe pin surface tested with AO1 and TC 4 programme; (c) Cr-N-Fe pin surface tested with AO3 and TC 5 programme; (d) SEM/EDX analysis of Cr-N-Fe pin surface tested with AO3 and TC 5 programme; (e) SEM/EDX analysis of Cr-N pin surface tested with AO1 and TC 4 programme; (f) steel counterpart overview for Cr-N-Fe/AO1/TC 4 test condition; EDX spectra measured with 7.5 kV.
Lubricants 11 00157 g015
Figure 16. Wear results from tests with artificial lubricants without soot; wear cap plotted over test duration for different test strategies and oils.
Lubricants 11 00157 g016
Figure 17. Comparison of the measured wear width from tests with AO2 and AO4 lubricants.
Lubricants 11 00157 g017
Figure 18. Tests with artificial lubricants with carbon black using TC 4 test programme: (a) Cr-N material and AO2; (b) Cr-N material and AO4; (c) Cr-N-Fe material and AO2; (d) Cr-N-Fe material and AO4.
Lubricants 11 00157 g018
Figure 19. Post-test surface condition of parts tested with artificial lubricants with carbon black: (a) Cr-N pin surfaces tested with AO2 and TC 4 programme in LIMI and SEM depiction; (b) Cr-N pin surface tested with AO4 and TC 4 programme in LIMI and SEM depiction; (c) Cr-N-Fe pin surface tested with AO4 and TC 4 programme in LIMI and SEM depiction; (d) steel counterpart picture—Cr-N/AO2/TC 4 test condition; (e) steel counterpart pictures—Cr-N/AO4/TC 4 test condition; (f) steel counterpart pictures—Cr-N-Fe/AO4/TC 4 test condition.
Lubricants 11 00157 g019
Figure 20. Friction/wear map of the different systems tested.
Lubricants 11 00157 g020
Table 1. Variation in test parameters.
AbbreviationTest Load (N)Test Time (h)
Test category I (also Part I)TC 135025
Test category II (also Part I)TC 260025
Test category III (also Part I)TC 335073
Test category IVTC 435049
Test category VTC 560073
Table 2. Lubricant matrix.
NomenclatureAbbreviationEngine Test PerformanceFresh Oil (wt%)Soot (wt%)Diesel Fuel (wt%)
Engine oil type 1EO 1Acceptable chain elongation---
Engine oil type 2EO 2High/Non-acceptable chain elongation---
Artificial oil type 1AO 1-100--
Artificial oil type 2AO 2-973-
Artificial oil type 3AO 3-90-10
Artificial oil type 4AO 4-75.54.520
Table 3. EDX point analysis of regions marked in Figure 12b,d (measured with 7.5 kV and values given in at.%).
SpectrumCNOCrFe
1-45.06.448.5-
2-48.32.749.0-
35.1--4.590.3
45.2--5.489.5
5-44.03.847.05.1
6-44.32.246.37.3
7-43.62.846.67.0
Table 4. EDX point analysis of regions marked in Figure 13c (measured with 7.5 kV and values given in at.%).
SpectrumCOPSCaFeZn
16.545.50.8--47.3-
29.939.30.7--50.2-
37.444.90.80.6-46.3-
48.624.8---66.6-
510.43.4---86.3-
Table 5. EDX point analysis of regions marked Figure 13f (measured with 7.5 kV and values given in at.%).
SpectrumCOPSCaFeZn
17.638.52.21.02.748.0-
27.237.21.1--54.5-
37.2----92.8-
425.027.81.41.02.042.9-
57.435.92.21.52.550.5-
Table 6. EDX point analysis of regions marked in Figure 19a,c (measured with 7.5 kV and values given in at.%).
SpectrumCNOPSCaCrFeZn
17.6-58.811.60.811.0-10.2-
28.19.7----17.564.7-
367.1-18.02.45.32.1-4.70.3
4-47.6----52.4--
511.8-59.86.91.015.2-5.2-
674.2-6.0-0.3-15.54.0-
7-44.8----45.79.5-
82.927.720.21.7-4.833.88.9-
Disclaimer/Publisher’s Note: The statements, opinions and data contained in all publications are solely those of the individual author(s) and contributor(s) and not of MDPI and/or the editor(s). MDPI and/or the editor(s) disclaim responsibility for any injury to people or property resulting from any ideas, methods, instructions or products referred to in the content.

