
Menstrual Cycle, Glucose Control and Insulin Sensitivity in Type 1 Diabetes: A Systematic Review

Abstract
:1. Introduction
2. Materials and Methods
2.1. Conduct of Review
2.2. Search Strategy and Study Selection
2.3. Data Extraction
2.4. Study Quality Assessment
3. Results
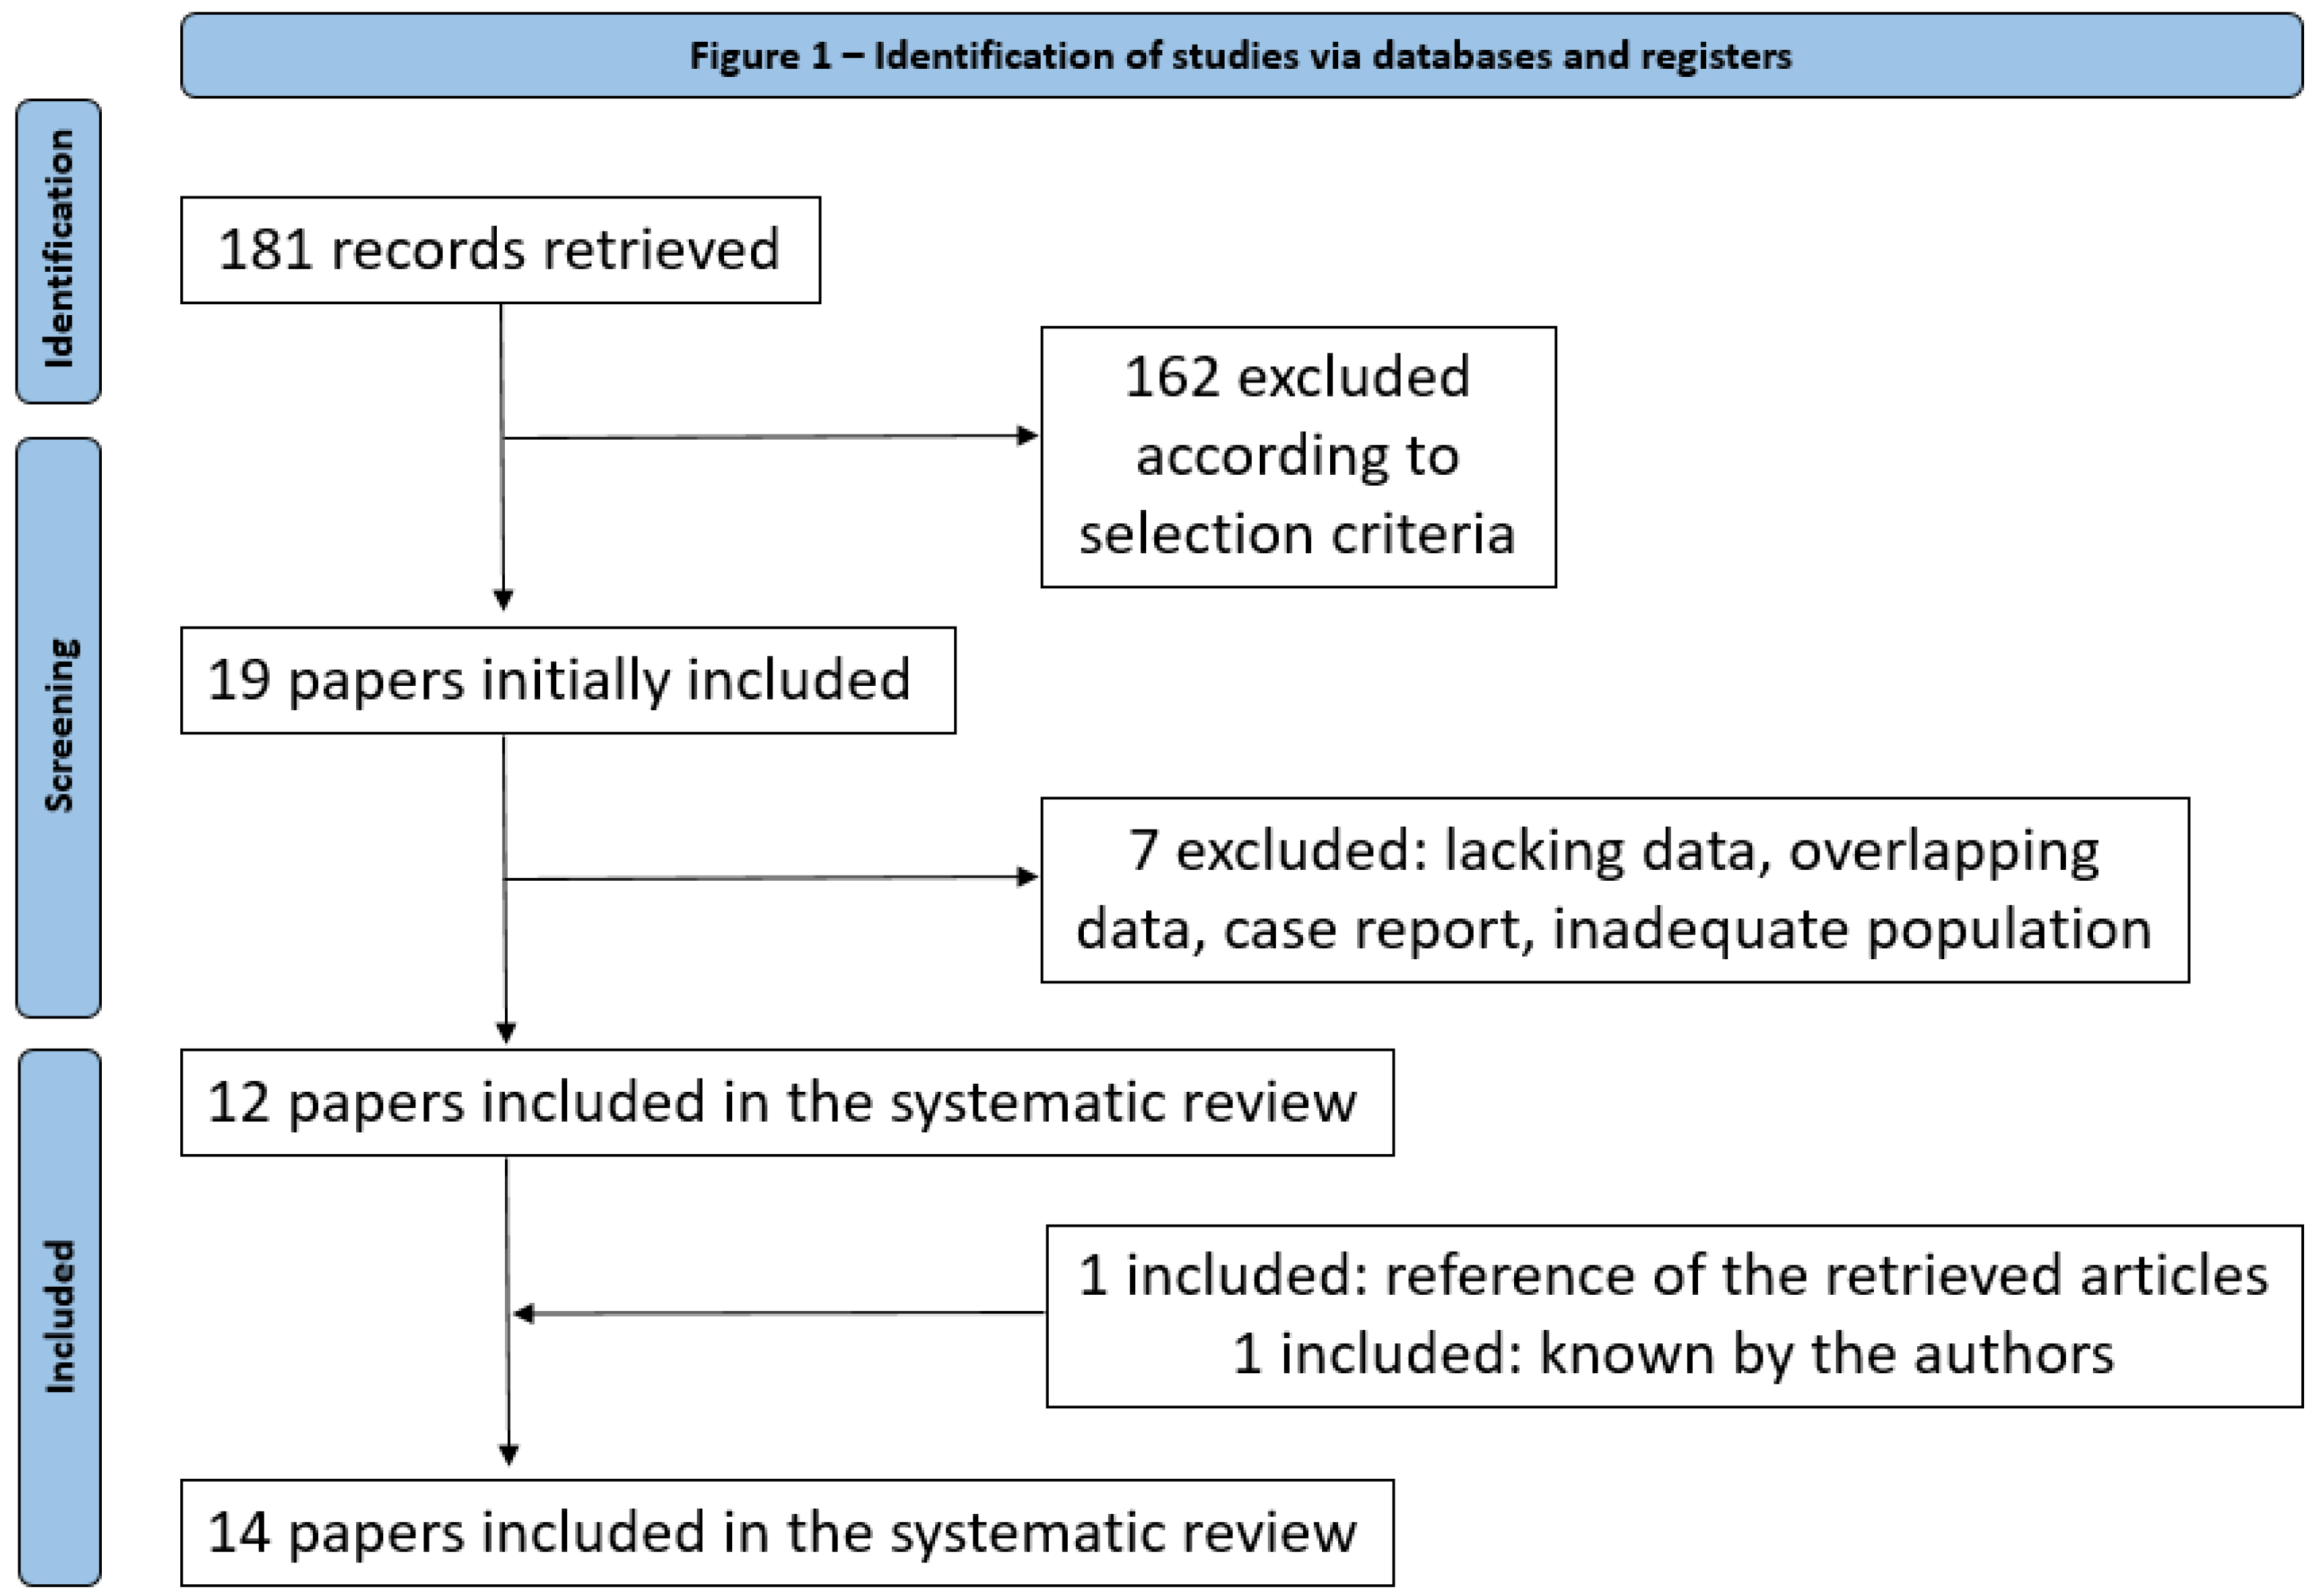
3.1. Eligible Articles
3.2. Qualitative Analysis
3.3. Quality Assessment
4. Discussion
5. Conclusions
Author Contributions
Funding
Institutional Review Board Statement
Informed Consent Statement
Data Availability Statement
Conflicts of Interest
Appendix A

| Study [Reference] | [10] | [20] | [21] | [19] | [9] | [12] | [22] | [23] | [13] | [14] | [7] | [11] | [15] | [16] | |
|---|---|---|---|---|---|---|---|---|---|---|---|---|---|---|---|
| GLUCOSE METRIC | |||||||||||||||
| Mean capillary glucose | x | ||||||||||||||
| Mean capillary FPG | x | ||||||||||||||
| Mean SD | x | x | |||||||||||||
| %SMBG > 7.8 mmol/L (140 mg/dl) | x | ||||||||||||||
| %SMBG < 3.1 mmol/L (55 mg/dl) | x | ||||||||||||||
| HBGI | x | x | |||||||||||||
| LBGI | x | x | |||||||||||||
| ADRR | x | ||||||||||||||
| TIR | x | x | |||||||||||||
| TAR | x | x | x | x | |||||||||||
| TAR > 7.8 mmol/L (140 mg/dl) | x | ||||||||||||||
| TAR < 2hPPG | x | ||||||||||||||
| TBR | x | x | x | x | |||||||||||
| TBR night | x | ||||||||||||||
| CV | x | x | |||||||||||||
| Mean CGM glucose | x | x | x | ||||||||||||
| IS METRIC | |||||||||||||||
| Indirect parameter | TDD | x | x | x | x | ||||||||||
| Total Basal Dose | x | ||||||||||||||
| Total Bolus Dose | x | ||||||||||||||
| Direct parameters | Euglycaemin clamp (AUC GIR) | x | x | ||||||||||||
| Kalman filtering method | x | ||||||||||||||
| FSIGT | x | ||||||||||||||
| Average daily glucose × tot insulin | x | ||||||||||||||
| IGIT (mean glucose at 2–4 h) | x | ||||||||||||||
| Hyperglycaemic hyperinsulemic clamp | x | ||||||||||||||
| LAB TESTS | |||||||||||||||
| Hormonal lab test | E2 | x | x | x | x | x | x | ||||||||
| P | x | x | x | x | x | x | x | ||||||||
| LH | x | x | |||||||||||||
| FSH | x | x | |||||||||||||
| urinary LH | x | x | x | ||||||||||||
| PRL | x | ||||||||||||||
| Cortisol | x | x | |||||||||||||
| T | x | x | |||||||||||||
| DHT | x | ||||||||||||||
| A | x | ||||||||||||||
| Catecholamine (NA) | x | ||||||||||||||
| GH | x | ||||||||||||||
| Beta-HCG | x | ||||||||||||||
| Metabolic lab tests | C-pep | x | x | ||||||||||||
| Insulinemia | x | x | |||||||||||||
| HbA1c | x | x | x | x | |||||||||||
| OTHERS | |||||||||||||||
| Ultrasound (for ovulation detection) | x | ||||||||||||||
| Diet | Tot CHO intake | x | |||||||||||||
| Tot Kcal intake | x | ||||||||||||||
| Questionnaires | Hypoglycaemic events | x | |||||||||||||
| Blood sugar pattern | x | ||||||||||||||
| Insulin dose | x | x | x | ||||||||||||
| Basal body temperature | x | ||||||||||||||
| Weight | x | ||||||||||||||
| Occasional medications | x | ||||||||||||||
| Diet habits | x | x | x | x | |||||||||||
| Physical activity | x | x | x | ||||||||||||
| PSQI | x | ||||||||||||||
| Sleep disturbance | x | ||||||||||||||
| Stress | x | ||||||||||||||
| Premenstrual syndrome | x | x | |||||||||||||
| Emotional state | x | ||||||||||||||
| Psychosocial condition | x | ||||||||||||||
| Wearable tackers | Sleep tracker | x | |||||||||||||
| Step counter | x |
References
- Cramer, H.I. Influence of menstruation on carbohydrate tolerance in diabetes mellitus. Can. Med. Assoc. J. 1942, 47, 51–55. [Google Scholar]
- Didyuk, O.; Econom, N.; Guardia, A.; Livingston, K.; Klueh, U. Continuous glucose monitoring devices: Past, present, and future focus on the history and evolution of technological innovation. J. Diabetes Sci. Technol. 2021, 15, 676–683. [Google Scholar] [CrossRef] [PubMed]
- Matsuda, M.; DeFronzo, R.A. Insulin sensitivity indices obtained from oral glucose tolerance testing: Comparison with the euglycemic insulin clamp. Diabetes Care 1999, 22, 1462–1470. [Google Scholar] [CrossRef]
- Bergman, R.N.; Ider, Y.Z.; Bowden, C.R.; Cobelli, C. Quantitative estimation of insulin sensitivity. Am. J. Physiol. 1979, 236, E667–E677. [Google Scholar] [CrossRef]
- Gutch, M.; Kumar, S.; Razi, S.M.; Gupta, K.K.; Gupta, A. Assessment of insulin sensitivity/resistance. Indian J. Endocrinol. Metab. 2015, 19, 160–164. [Google Scholar] [CrossRef]
- Januszewski, A.S.; Sachithanandan, N.; Ward, G.; Karschimkus, C.S.; O’Neal, D.N.; Jenkins, A.J. Estimated insulin sensitivity in type 1 diabetes adult using clinical and research biomarkers. Diabetes Res. Clin. Pract. 2020, 167, 108359. [Google Scholar] [CrossRef]
- Moberg, E.; Kollind, M.; Lins, P.E.; Adamson, U. Day-to-day variation of insulin sensitivity in patients with type 1 diabetes: Role of gender and menstrual cycle. Diabet. Med. 1995, 12, 224–228. [Google Scholar] [CrossRef]
- Cawood, E.; Bancroft, J.; Steel, J. Perimenstrual symptoms in women with diabetes mellitus and the relationship to diabetic control. Diabet. Med. 1993, 10, 444–448. [Google Scholar] [CrossRef]
- Gamarra, E.; Fop, F.; Beccuti, G.; Bisio, A.; Grassi, G. Menstrual cyclicity, sleep efficiency and unplanned physical activity: Glycemic response in women suffering from type 1 diabetes mellitus. J. AMD 2016, 19, 105–112. [Google Scholar]
- Tatulashvili, S.; Julla, J.B.; Sritharan, N.; Rezgani, I.; Levy, V.; Bihan, H.; Riveline, J.-P.; Cosson, E. Ambulatory glucose profile according to different phases of the menstrual cycle in women living with type 1 diabetes. J. Clin. Endocrinol. Metab. 2022, 107, 2793–2800. [Google Scholar] [CrossRef]
- Lundman, B.; Asplund, K.; Norberg, A. Metabolic control, food intake and mood during the menstrual cycle in patients with insulin-dependent diabetes. Int. J. Nurs. Stud. 1994, 31, 391–401. [Google Scholar] [CrossRef] [PubMed]
- Brown, S.A.; Jiang, B.; McElwee-Malloy, M.; Wakeman, C.; Breton, M.D. Fluctuation of hyperglycemia and insulin sensitivity are linked to menstrual cycle phases in women with type 1 diabetes. J. Diabetes Sci. Technol. 2015, 9, 1192–1199. [Google Scholar] [CrossRef] [Green Version]
- Goldner, W.S.; Kraus, V.L.; Sivitz, W.I.; Hunter, S.K.; Dillon, J.S. Cyclic changes in glycemia assessed by continuous glucose monitoring system during multiple complete menstrual cycles in women with type 1 diabetes. Diabetes Technol. Ther. 2004, 6, 473–480. [Google Scholar] [CrossRef]
- Lunt, H.; Brown, L. Self-reported changes in capillary glucose and insulin requirements during the menstrual cycle. Diabet. Med. 1996, 13, 525–530. [Google Scholar] [CrossRef]
- Widom, B.; Diamond, M.P.; Simonson, D.C. Alteration in glucose metabolism during menstrual cycle in women with IDDM. Diabetes Care 1992, 15, 213–220. [Google Scholar] [CrossRef] [PubMed]
- Macdonald, I.; Scott, A.; Bowman, C.; Jeffcoate, W. Effect of phase of menstrual cycle on insulin sensitivity, peripheral blood flow and cardiovascular responses to hyperinsulinaemia in young women with type 1 diabetes. Diabet. Med. 1990, 7, 57–62. [Google Scholar] [CrossRef]
- Moher, D.; Liberati, A.; Tetzlaff, J.; Altman, D.G.; the PRISMA Group. Preferred reporting items for systematic reviews and meta-analyses: The PRISMA statement. BMI 2009, 339, b2535. [Google Scholar]
- Study Quality Assessment Tools | NHLBI, NIH. Available online: https://www.nhlbi.nih.gov/health-topics/study-quality-assessment-tools (accessed on 16 November 2022).
- Herranz, L.; Saez-De-Ibarra, L.; Hillman, N.; Gaspar, R.; Pallardo, L. Glycemic changes during menstrual cycles in women with type 1 diabetes. Med. Clin. 2016, 146, 287–291. [Google Scholar] [CrossRef]
- Diaz, C.J.L.; Fabris, C.; Breton, M.D.; Cengiz, E. Insulin replacement across the menstrual cycle in women with type 1 diabetes: An in-silico assessment of the need for ad-hoc technology. Diabetes Technol. Ther. 2022, 24, 832–841. [Google Scholar] [CrossRef]
- Levy, C.J.; O’Malley, G.; Raghinaru, D.; Kudva, Y.C.; Laffel, L.M.; Pinsker, J.E.; Lum, J.W.; Brown, S.A.; Kovatchev, B.; Anderson, S.; et al. Insulin delivery and glucose variability throughout the menstrual cycle on closed loop control for women with type 1 diabetes. Diabetes Technol. Ther. 2022, 24, 357–361. [Google Scholar] [CrossRef]
- Barata, D.S.; Adan, L.F.; Netto, E.M.; Ramalho, A.C. The effect of the menstrual cycle on glucose control in women with type 1 diabetes evaluated using a continuous glucose monitoring system. Diabetes Care 2013, 36, e70. [Google Scholar] [CrossRef] [PubMed] [Green Version]
- Trout, K.K.; Rickels, M.R.; Schutta, M.H.; Petrova, M.; Freeman, E.W.; Tkacs, N.C.; Teff, K.L. Mentrual cycle effects on insulin sensitivity in women with type 1 diabetes: A pilot study. Diabetes Technol. Ther. 2007, 9, 176–182. [Google Scholar] [CrossRef]
- Battelino, T.; Alexander, C.M.; Amiel, S.A.; Arezza-Rubin, G.; Beck, R.W.; Bergenstal, R.M.; Buckingham, B.A.; Carroll, J.; Ceriello, A.; Chow, E.; et al. Continuous glucose monitoring and metrics for clinical trials: An international consensus statement. Lancet Diabetes Endocrinol. 2023, 1, 42–57. [Google Scholar] [CrossRef] [PubMed]
- Roy, S.K.; Ghosh, B.P.; Bhattacharjee, S.K. Changes in oral glucose tolerance during normal menstrual cycle. J. Indian Med. Assoc. 1971, 57, 201–204. [Google Scholar] [PubMed]
- Jarrett, R.J.; Graver, H.J. Changes in oral glucose tolerance during the menstrual cycle. Br. Med. J. 1968, 2, 528–529. [Google Scholar] [CrossRef] [Green Version]
- Bonora, E.; Zavaroni, I.; Alpi, O.; Pezzarossa, A.; Dall’Aglio, E.; Coscelli, C.; Butturini, U. Influence of the menstrual cycle on glucose tolerance and insulin secretion. Am. J. Obstet. Gynecol. 1987, 157, 140–141. [Google Scholar] [CrossRef]
- Cudworth, A.G.; Veevers, A. Carbohydrate metabolism in the menstrual cycle. Br. J. Obstet. Gynaecol. 1975, 82, 162–169. [Google Scholar] [CrossRef]
- Spellacy, W.N.; Carlson, K.L.; Shade, S.L. Menstrual cycle carbohydrate metabolism. Am. J. Obstet. Gynecol. 1967, 99, 382–386. [Google Scholar] [CrossRef]
- Yki-Järvinen, H. Insulin sensitivity during the menstrual cycle. J. Clin. Endocrinol. Metab. 1984, 59, 350–353. [Google Scholar] [CrossRef]
- Toth, E.L.; Suthijumroon, A.; Crockford, P.M.; Ryan, E.A. Insulin action does not change during the menstrual cycle in normal women. J. Clin. Endocrinol. Metab. 1987, 64, 74–80. [Google Scholar] [CrossRef]
- Diamond, M.P.; Simonson, D.C.; DeFronzo, R.A. Menstrual cyclicity has a profound effect on glucose homeostasis. Fertil. Steril. 1989, 52, 204–208. [Google Scholar] [CrossRef]
- Ader, M.; Pacini, G.; Yang, J.Y.; Bergman, R.N. Importance of glucose per se to intravenous glucose tolerance. Comparison of the minimal-model prediction with direct measurements. Diabetes 1985, 34, 1092–1103. [Google Scholar] [CrossRef] [PubMed]
- Jovanovic, L. Advances in diabetes for the millennium: Diabetes in women. MedGenMed 2004, 6, 3. [Google Scholar] [PubMed]
- De Pirro, R.; Fusco, A.; Bertoli, A.; Greco, A.V.; Lauro, R. Insulin receptors during the menstrual cycle in normal women. J. Clin. Endocrinol. Metab. 1978, 47, 1387–1389. [Google Scholar] [CrossRef] [PubMed]
- Bertoli, A.; De Pirro, R.; Fusco, A.; Greco, A.V.; Magnatta, R.; Lauro, R. Differences in insulin receptors between men and menstruating women and influence of sex hormones on insulin binding during the menstrual cycle. J. Clin. Endocrinol. Metab. 1980, 50, 246–250. [Google Scholar] [CrossRef]
- Moore, P.; Kolterman, O.; Weyant, J.; Olefsky, J.M. Insulin binding in human pregnancy: Comparisons to the postpartum, luteal and follicular states. J. Clin. Endocrinol. Metab. 1981, 52, 937–941. [Google Scholar] [CrossRef]
- Schroeder, B.; Hertweck, S.P.; Sanfilippo, J.S.; Foster, M.B. Correlation between glycemic control and menstruation in diabetic adolescents. J. Reprod. Med. 2000, 45, 1–5. [Google Scholar] [CrossRef]

| Authors | Year of Publication | Journal | Sample Size | Inclusion Criteria | Exclusion Criteria | Aim | |||
|---|---|---|---|---|---|---|---|---|---|
| Nr Patients Enrolled | Nr Patients in OCP | Nr MC/pat | Nr MC tot | ||||||
| Tatulashvili et al. [10] | 2022 | J. Clin. Endocrinol. Metab. | 24 | 0 | 1–3 | 62 | T1D, > 18 years, premenopausal, spontaneous MC of 24–35 days, use of CGM, MDI/CSII | Lifestyles/therapy changes in the 3 months prestudy, HbA1c > 10%, OCP, pregnancy, PCOS, gastroparesis, language barriers | Evaluate the variability in glucose values according to different phases of menstruation through CGM data in T1D women. |
| Diaz et al. [20] | 2022 | Diabetes Technol. Ther. | 16 | 8 | 1 | 16 | T1D since > 1 year, 12–35 years, HbA1c < 9%, regular MC | Pregnancy or breastfeeding, any OCP if 12–17 years, only P OCP if 18–35 years | Test the hypothesis that improved glycaemic control can be achieved in women experiencing premenstrual hyperglycaemia if a priori knowledge on cycle-related IS changes is properly considered when planning insulin therapy |
| Levy et al. [21] | 2022 | Diabetes Technol. Ther. | 16 | 4 | 3–14 | 96 | T1D since > 1 year, > 14 years, TDD > 10 UI/die, use of Tandem C-IQ | Pregnancy, other diabetes medications | Analyse insulin delivery and glycaemic metric throughout the menstrual cycle for women with T1D using closed-loop control insulin delivery |
| Herranz et al. [19] | 2016 | Med. Clin. (Barc.) | 26 | 0 | 6.5 ± 2.2 | 168 | T1D, CSII plus SMBG | OCP | Determine the frequency of women with T1D showing menstrual cycle changes in glycaemia, analyse their clinical characteristics and assess the pattern of glycaemic changes |
| Gamarra et al. [9] | 2016 | J. AMD | 10 | 1 | 4 | 40 | T1D since > 5 years, 17–40 years, CSII plus CGM since > 1 year, HbA1c 6–8.5%, eumenorrhea since > 1 year or OCP, BMI < 30 kg/m2 | Diabetes complications (except nonproliferative diabetic retinopathy), pregnancy or breastfeeding | Point out correlations between female menstrual cycle, sleep quality and glycaemic response in a sample of T1D patients in order to find which ones deserve further investigation to become clinically relevant |
| Brown et al. [12] | 2015 | J. Diabetes Sci. Technol. | 12 | 0 | 3 | 36 | T1D since > 2 years, CSII since > 6 months, HbA1c 5–10%, regular MC 20–40 days | Pregnancy/desire for, OCP/intrauterine device/Depo-MAP, PCOS, elevated testosterone, paracetamol use, steroid use for > 10 days, uncontrolled thyroid disease, elevated liver enzymes | Identify glycaemic variability and IS changes using data available in the outpatient setting (of T1D) across menstrual cycle phases |
| Barata et al. [22] | 2013 | Diab. Care | 6 | 0 | 1 | 6 | T1D, regular MC, HbA1c < 8%, MDI/CSII | OCP, pregnancy or breastfeeding, impaired thyroid function | Evaluate the effect of menstrual cycle in T1D patients |
| Trout et al. [23] | 2007 | Diabetes Technol. Ther. | 6 | 0 | 1 | 6 | T1D, 18–45 years, HbA1c < 9% | OCP or antidepressants in the 2 months prestudy, significant comorbidities, significant life changes, pregnancy or breastfeeding | Evaluate possible differences in IS between follicular and luteal phases in women with T1D |
| Goldner et al. [13] | 2004 | Diabetes Technol. Ther. | 4 | 0 | 3 | 12 | T1D, 18–45 years, HbA1c < 7.5%, creatinine < 1.5 mg/dl, normal proteinuria, MDI/CSII | OCP, pregnancy or breastfeeding, proliferative diabetic retinopathy, cardiovascular disease, gastroparesis | Describe the pattern of changes in glucose control throughout the complete menstrual cycle and the reproducibility of these changes |
| Lunt et al. [14] | 1996 | Diabet Med. | 124 | 9 | NR | NR | T1D since > 6 months, 18–40 years, OCP/not OCP | Pregnancy | Describe the prevalence and temporal pattern of self-reported changes in capillary glucose and insulin dose during the menstrual cycle (in T1D) and compare HbA1c result between subjects who adjust their insulin dose perimenstrually and those who do not |
| Moberg et al. [7] | 1995 | Diabet Med. | 15 | 0 | 1 | 15 | T1D, MDI/CSII | Diabetic retinopathy, nephropathy and peripheral neuropathy | Compare day-to-day variation in IS in males and females with T1D and assess IS in the follicular and luteal phase of the menstrual cycle |
| Lundmann et al. [11] | 1994 | Int. J. Nurs. Stud. | 20 | 0 | 1–2 | 18 | T1D since > 2 years, OCP/not OCP | Pregnancy, dialysis | Elucidate the impact of menstruation on metabolic control and daily living in patient T1D |
| Widom et al. [15] | 1992 | Diab. Care | 16 | 0 | 1 | 16 | T1D since > 2 years, 18–38 years, HbA1c > 7.5% | OCP | Examine the hormonal mechanisms underlying the variability in glycaemic control during the different phases of the menstrual cycle in women with T1D |
| Scott et al. [16] | 1990 | Diabet Med. | 9 | 0 | 1 | 9 | T1D | OCP | Compare IS and cardiovascular function before and during hyperinsulinaemia in young T1D women during the follicular and luteal phases of the menstrual cycle |
| Study | MC Phases Definition | MC Phases Assessment | Glycaemic Metrics * | Definition of Hypo/Hyper Glycaemia According to International Guidelines | IS Metric * | Hormonal or Metabolic Lab Tests * | Other Factors Considered * | Outcomes | ||
|---|---|---|---|---|---|---|---|---|---|---|
| Diet | Questionnaires. | Wearable Trackers | ||||||||
| Tatulashvili et al. [10] | EF, MF, PO, ML, LL | Dates of menses | CGM | Yes | Patient reported data | No | Yes | Yes | No | TIR decreases over the phases with SS difference between EF and LL. TAR is SS higher in LL vs. EF. TBR is SS higher in MF vs. EF |
| Diaz et al. [20] | F and L | NR | Clamp | NA | Direct parameter | No | No | No | No | AUC GIR SS decreases from F to L (equals decrease in IS in L-phase) |
| Levy et al. [21] | Menstruation, L, all the rest | Dates of menses | CGM | Yes | Indirect parameter | No | No | No | No | CGM and insulin metrics unchanged across cycle phases |
| Herranz et al. [19] | EF, LF, EL, LL | Dates of menses | SMBG | NA | Indirect parameter | No | No | No | No | 65.4% of women had cycle changes, defined as > 0.8 mmol/L (15 mg/dL) increase in mean blood glucose from EF to LL in > 2/3 of cycles, with mean glucose and %SMBG > 7.8 mmol/L (140 mg/dl) SS increase from EF to LL. No SS changes in other parameters |
| Gamarra et al. [9] | EF, MLF, PO, EL, LL | Dates of menses and urinary LH, P test | CGM | Yes | Indirect parameter | Yes | No | Yes | Yes | SS increase in mean glycaemia and SD in L-PO, higher TBR in F and TAR in EL. Not SS changes in insulin dose, CHO intake and sleep efficiency. |
| Brown et al. [12] | EF, MLF, PO, EL, ML, LL | Dates of menses and urinary LH, P test | CGM | NA | Direct and Indirect parameter | Yes | Yes | No | No | SS higher HBGI in PO and EL (increases progressively up to EL and then falls back). LBGI stable in F and then decreases (but not SS). IS (nocturnal) SS decreases in L vs. EF. No changes in TDD, CHO and Kcal. |
| Barata et al. [22] | 72 h F (day 4–8) and 72 h L (day 18–22) | US and E2 and P test | CGM | Yes | NA | Yes | No | No | No | TAR increases and the TBR decreases in L vs. F. Mean glucose SS higher 2h post breakfast and 2h post lunch in L vs. F |
| Trout et al. [23] | F (day 6–8 post menstruation) and L (day 7–9 post urinary test +) | Dates of menses and urinary LH, P and E2 test | Clamp | NA | Direct parameter | Yes | No | No | No | Mean glucose higher in L vs. F (not SS). SI higher in F vs. L (+24%, not SS). IS inversely correlated with P level and Penn Daily scale score, not correlated with E2 and cortisol level |
| Goldner et al. [13] | L (14 days), O (-14 day from menstruation), F | Dates of menses and P, E2, LH and FSH test | CGM | No | Direct parameter | Yes | Yes | Yes | No | 2/4 patients: higher TAR in L. 2/4 patients: no glucose pattern. SS direct correlation between P level and hyperglycaemia in 2/4 patients. SS inverse correlation between E2 level and hyperglycaemia in 1/4 patients. Reproducibility: not between women but between cycles in the same woman |
| Lunt et al. [14] | Pre/post menstruation. | Dates of menses | Patient reported data | NA | Patient reported data | Yes | Yes | Yes | No | 61% of all patients (67% of OCP patients) notice glycaemic changes, especially glucose increase in L. HbA1c does not change between adjusters (36%) vs. nonadjusters (25%) of insulin patients. 56% of patients notice appetite change, especially increased food intake perimenstrually |
| Moberg et al. [7] | F (days 2–14) and L (days 19–31) | Dates of menses | Clamp | NA | Direct parameter | Yes | No | No | No | Not SS differences in IS L vs. F |
| Lundmann et al. [11] | F and L | Dates of menses | Patient reported data | NA | Patient reported data | Yes | Yes | Yes | No | Not SS differences in glucose and food intake in L vs. F |
| Widom et al. [15] | MF (days 5–11) and ML (days 20–29) | Dates of menses | Clamp | NA | Direct parameter | Yes | No | No | No | Not SS worsening of hyperglycaemia and IS in L, associated with E2 level increase only in a subset of patients |
| Scott et al. [16] | F (days 6–9) and L (days 20–23) | Dates of menses | Clamp | NA | Direct parameter | Yes | No | No | No | Not SS differences in IS in L vs. F, but SS higher GH level in L with possible consequences on glucose production, glucose disposal and IS |
| First Author, Year | 1 | 2 | 3 | 4 | 5 | 6 | 7 | 8 | 9 | 10 | 11 | 12 | 13 | 14 | Total |
|---|---|---|---|---|---|---|---|---|---|---|---|---|---|---|---|
| Tatulashvili, 2022 | Yes | Yes | Yes | Yes | No | Yes | Yes | Yes | No | No | Yes | No | Yes | No | 9/14 |
| Diaz, 2022 | Yes | Yes | Yes | Yes | No | Yes | No | No | NR | No | Yes | No | Yes | No | 7/14 |
| Levy, 2022 | Yes | Yes | Yes | Yes | No | Yes | Yes | No | No | No | Yes | No | Yes | No | 8/14 |
| Herranz, 2016 | Yes | Yes | Yes | Yes | No | Yes | Yes | Yes | No | No | Yes | No | Yes | No | 9/14 |
| Gamarra, 2016 | Yes | Yes | Yes | Yes | No | Yes | Yes | Yes | Yes | Yes | Yes | No | Yes | No | 11/14 |
| Brown, 2015 | Yes | Yes | Yes | Yes | No | Yes | Yes | Yes | Yes | Yes | Yes | No | Yes | No | 11/14 |
| Barata, 2013 | Yes | Yes | Yes | Yes | No | Yes | No | No | Yes | Yes | Yes | No | Yes | No | 9/14 |
| Trout, 2007 | Yes | Yes | Yes | Yes | No | Yes | No | No | Yes | Yes | Yes | No | Yes | No | 9/14 |
| Goldner, 2004 | Yes | Yes | Yes | Yes | No | Yes | Yes | No | Yes | Yes | Yes | No | No | No | 9/14 |
| Lunt, 1996 | Yes | Yes | Yes | Yes | No | Yes | NS | No | No | No | Yes | No | Yes | No | 7/14 |
| Moberg, 1994 | Yes | Yes | Yes | Yes | No | Yes | No | No | No | No | Yes | No | Yes | No | 7/14 |
| Lundmann, 1994 | Yes | Yes | Yes | Yes | No | Yes | No | No | No | No | Yes | No | No | No | 6/14 |
| Widom, 1992 | Yes | Yes | Yes | Yes | No | Yes | No | No | No | No | Yes | No | Yes | No | 7/14 |
| Scott, 1990 | Yes | Yes | Yes | Yes | No | Yes | No | No | No | No | Yes | No | Yes | No | 7/14 |
| Question of the Present Systematic Review | Conclusion | References Supporting These Findings |
|---|---|---|
| What impacts of the MC on glycaemic outcomes can be expected in women with T1DM? | Possible worsening/higher risk of hyperglycaemia in the luteal phase versus the follicular phase in a subset of patients | [9,10,12,13,14,15,19,22,23] |
| What impacts of the MC on IS can be expected in women with T1DM? | Possible worsening of IS in the luteal phase versus the follicular phase in a subset of patients | [12,15,20,23] |
Disclaimer/Publisher’s Note: The statements, opinions and data contained in all publications are solely those of the individual author(s) and contributor(s) and not of MDPI and/or the editor(s). MDPI and/or the editor(s) disclaim responsibility for any injury to people or property resulting from any ideas, methods, instructions or products referred to in the content. |
© 2023 by the authors. Licensee MDPI, Basel, Switzerland. This article is an open access article distributed under the terms and conditions of the Creative Commons Attribution (CC BY) license (https://creativecommons.org/licenses/by/4.0/).
Share and Cite
Gamarra, E.; Trimboli, P. Menstrual Cycle, Glucose Control and Insulin Sensitivity in Type 1 Diabetes: A Systematic Review. J. Pers. Med. 2023, 13, 374. https://doi.org/10.3390/jpm13020374
Gamarra E, Trimboli P. Menstrual Cycle, Glucose Control and Insulin Sensitivity in Type 1 Diabetes: A Systematic Review. Journal of Personalized Medicine. 2023; 13(2):374. https://doi.org/10.3390/jpm13020374
Chicago/Turabian StyleGamarra, Elena, and Pierpaolo Trimboli. 2023. "Menstrual Cycle, Glucose Control and Insulin Sensitivity in Type 1 Diabetes: A Systematic Review" Journal of Personalized Medicine 13, no. 2: 374. https://doi.org/10.3390/jpm13020374