

Hard and Soft Tissue Asymmetry in Patients with Skeletal Class III Malocclusion: A Cone-Beam Computed Tomography Study

Abstract
:1. Introduction
2. Materials and Methods
2.1. Sample Size Calculation
2.2. Patient Inclusion
2.3. Data Acquisition and Assessment
2.4. Statistical Analysis
3. Results
4. Discussion
5. Conclusions
Author Contributions
Funding
Institutional Review Board Statement
Informed Consent Statement
Data Availability Statement
Conflicts of Interest
References
- Rhodes, G.; Proffitt, F.; Grady, J.M.; Sumich, A. Facial symmetry and the perception of beauty. Psychon. Bull. Rev. 1998, 5, 659–669. [Google Scholar] [CrossRef] [Green Version]
- Little, A.C.; Jones, B.C.; DeBruine, L.M. Facial attractiveness: Evolutionary based research. Philos. Trans. R Soc. Lond. B Biol. Sci. 2011, 366, 1638–1659. [Google Scholar] [CrossRef] [Green Version]
- Grammer, K.; Thornhill, R. Human (Homo sapiens) facial attractiveness and sexual selection: The role of symmetry and averageness. J. Comp. Psychol. 1994, 108, 233–242. [Google Scholar] [CrossRef]
- Scheib, J.E.; Gangestad, S.W.; Thornhill, R. Facial attractiveness, symmetry and cues of good genes. Proc. Biol. Sci. 1999, 266, 1913–1917. [Google Scholar] [CrossRef] [Green Version]
- Penton-Voak, I.S.; Jones, B.C.; Little, A.C.; Baker, S.; Tiddeman, B.; Burt, D.M.; Perrett, D.I. Symmetry, sexual dimorphism in facial proportions and male facial attractiveness. Proc. Biol. Sci. 2001, 268, 1617–1623. [Google Scholar] [CrossRef] [Green Version]
- Jones, B.C.; Little, A.C.; Penton-Voak, I.S.; Tiddeman, B.P.; Burt, D.M.; Perrett, D.I. Facial symmetry and judgements of apparent health: Support for a “good genes” explanation of the attractiveness–symmetry relationship. Evol. Hum. Behav. 2001, 22, 417–429. [Google Scholar] [CrossRef]
- Claes, P.; Walters, M.; Vandermeulen, D.; Clement, J.G. Spatially-dense 3D facial asymmetry assessment in both typical and disordered growth. J. Anat. 2011, 219, 444–455. [Google Scholar] [CrossRef] [PubMed] [Green Version]
- Rossi, M.; Ribeiro, E.; Smith, R. Craniofacial asymmetry in development: An anatomical study. Angle Orthod. 2003, 73, 381–385. [Google Scholar] [CrossRef] [PubMed]
- Shaw, W.C.; Rees, G.; Dawe, M.; Charles, C.R. The influence of dentofacial appearance on the social attractiveness of young adults. Am. J. Orthod 1985, 87, 21–26. [Google Scholar] [CrossRef]
- Shackelford, T.K.; Larsen, R.J. Facial asymmetry as an indicator of psychological, emotional, and physiological distress. J. Pers. Soc. Psychol. 1997, 72, 456–466. [Google Scholar] [CrossRef] [PubMed]
- Haraguchi, S.; Iguchi, Y.; Takada, K. Asymmetry of the face in orthodontic patients. Angle Orthod. 2008, 78, 421–426. [Google Scholar] [CrossRef] [PubMed] [Green Version]
- Lundström, A. Some asymmetries of the dental arches, jaws, and skull, and their etiological significance. Am. J. Orthod. 1961, 47, 81–106. [Google Scholar] [CrossRef]
- Cheong, Y.W.; Lo, L.J. Facial asymmetry: Etiology, evaluation, and management. Chang. Gung Med. J. 2011, 34, 341–351. [Google Scholar] [PubMed]
- Bishara, S.E.; Burkey, P.S.; Kharouf, J.G. Dental and facial asymmetries: A review. Angle Orthod. 1994, 64, 89–98. [Google Scholar] [CrossRef] [PubMed]
- Wang-Sik, K.; Ki-Heon, L.; Hyeon-Shik, H. Comparison of asymmetric degree between maxillofacial hard and soft tissue in facial asymmetric subjects using three-dimensional computed tomography. Korean J. Orthod. 2005, 35, 163–173. [Google Scholar]
- Siqueira de Lima, L.; Brunetto, D.P.; da Cunha Gonçalves Nojima, M. Evaluation of facial soft tissue thickness in symmetric and asymmetric subjects with the use of cone-beam computed tomography. Am. J. Orthod. Dentofac. Orthop. 2019, 155, 216–223. [Google Scholar] [CrossRef]
- Severt, T.R.; Proffit, W.R. The prevalence of facial asymmetry in the dentofacial deformities population at the University of North Carolina. Int. J. Adult Orthodon Orthognath. Surg. 1997, 12, 171–176. [Google Scholar]
- Good, S.; Edler, R.; Wertheim, D.; Greenhill, D. A computerized photographic assessment of the relationship between skeletal discrepancy and mandibular outline asymmetry. Eur. J. Orthod. 2006, 28, 97–102. [Google Scholar] [CrossRef] [Green Version]
- Fedorov, A.; Beichel, R.; Kalpathy-Cramer, J.; Finet, J.; Fillion-Robin, J.C.; Pujol, S.; Bauer, C.; Jennings, D.; Fennessy, F.; Sonka, M.; et al. 3D Slicer as an image computing platform for the Quantitative Imaging Network. Magn Reson. Imaging 2012, 30, 1323–1341. [Google Scholar] [CrossRef] [Green Version]
- Lee, S.T.; Mori, Y.; Minami, K.; An, C.H.; Park, J.W.; Kwon, T.G. Does skeletal surgery for asymmetric mandibular prognathism influence the soft tissue contour and thickness? J. Oral. Maxillofac. Surg. 2013, 71, 1577–1587. [Google Scholar] [CrossRef]
- Huang, L.; Li, Z.; Yan, J.; Chen, L.; Piao, Z.G. Evaluation of facial soft tissue thickness in asymmetric mandibular deformities after orthognathic surgery. Maxillofac. Plast Reconstr. Surg. 2021, 43, 37. [Google Scholar] [CrossRef]
- Maeda, M.; Katsumata, A.; Ariji, Y.; Muramatsu, A.; Yoshida, K.; Goto, S.; Kurita, K.; Ariji, E. 3D-CT evaluation of facial asymmetry in patients with maxillofacial deformities. Oral. Surg. Oral. Med. Oral. Pathol. Oral. Radiol. Endod 2006, 102, 382–390. [Google Scholar] [CrossRef]
- Ajmera, D.H.; Hsung, R.T.; Singh, P.; Wong, N.S.M.; Yeung, A.W.K.; Lam, W.Y.H.; Khambay, B.S.; Leung, Y.Y.; Gu, M. Three-dimensional assessment of facial asymmetry in Class III subjects. Part 1: A retrospective study evaluating postsurgical outcomes. Clin. Oral. Investig. 2022, 26, 4947–4966. [Google Scholar] [CrossRef]
- Kim, S.J.; Lee, K.J.; Lee, S.H.; Baik, H.S. Morphologic relationship between the cranial base and the mandible in patients with facial asymmetry and mandibular prognathism. Am. J. Orthod. Dentofac. Orthop. 2013, 144, 330–340. [Google Scholar] [CrossRef]
- Kim, B.R.; Oh, K.M.; Cevidanes, L.H.; Park, J.E.; Sim, H.S.; Seo, S.K.; Reyes, M.; Kim, Y.J.; Park, Y.H. Analysis of 3D soft tissue changes after 1- and 2-jaw orthognathic surgery in mandibular prognathism patients. J. Oral. Maxillofac. Surg. 2013, 71, 151–161. [Google Scholar] [CrossRef] [PubMed]
- Ferrario, V.F.; Sforza, C.; Ciusa, V.; Dellavia, C.; Tartaglia, G.M. The effect of sex and age on facial asymmetry in healthy subjects: A cross-sectional study from adolescence to mid-adulthood. J. Oral. Maxillofac. Surg. 2001, 59, 382–388. [Google Scholar] [CrossRef] [PubMed]
- Nur, R.B.; Çakan, D.G.; Arun, T. Evaluation of facial hard and soft tissue asymmetry using cone-beam computed tomography. Am. J. Orthod. Dentofac. Orthop. 2016, 149, 225–237. [Google Scholar] [CrossRef]
- Andrade Ada, S.; Gavião, M.B.; Gameiro, G.H.; De Rossi, M. Characteristics of masticatory muscles in children with unilateral posterior crossbite. Braz Oral. Res. 2010, 24, 204–210. [Google Scholar] [CrossRef] [Green Version]
- Iodice, G.; Danzi, G.; Cimino, R.; Paduano, S.; Michelotti, A. Association between posterior crossbite, skeletal, and muscle asymmetry: A systematic review. Eur. J. Orthod. 2016, 38, 638–651. [Google Scholar] [CrossRef] [Green Version]
- Li, Y.; Hu, Z.; Ye, B.; Liu, Y.; Ren, X.; Zhu, S. Combined Use of Facial Osteoplasty and Orthognathic Surgery for Treatment of Dentofacial Deformities. J. Oral. Maxillofac. Surg. 2016, 74, 2505.e2501–2505.e2512. [Google Scholar] [CrossRef] [PubMed]
- Vittert, L.; Katina, S.; Ayoub, A.; Khambay, B.; Bowman, A.W. Assessing the outcome of orthognathic surgery by three-dimensional soft tissue analysis. Int. J. Oral. Maxillofac. Surg. 2018, 47, 1587–1595. [Google Scholar] [CrossRef] [Green Version]
- Wermker, K.; Kleinheinz, J.; Jung, S.; Dirksen, D. Soft tissue response and facial symmetry after orthognathic surgery. J. Craniomaxillofac. Surg. 2014, 42, e339–e345. [Google Scholar] [CrossRef] [PubMed]
- Ho, C.T.; Lin, H.H.; Liou, E.J.; Lo, L.J. Three-dimensional surgical simulation improves the planning for correction of facial prognathism and asymmetry: A qualitative and quantitative study. Sci. Rep. 2017, 7, 40423. [Google Scholar] [CrossRef] [PubMed] [Green Version]
- Denadai, R.; Pai, B.C.; Lo, L.J. Balancing the dental occlusion and facial aesthetic features in cleft orthognathic surgery: Patient-centered concept for computer-aided planning. Biomed. J. 2020, 43, 143–145. [Google Scholar] [CrossRef] [PubMed]
- Liao, Y.F.; Chen, Y.F.; Yao, C.F.; Chen, Y.A.; Chen, Y.R. Long-term outcomes of bimaxillary surgery for treatment of asymmetric skeletal class III deformity using surgery-first approach. Clin. Oral. Investig. 2019, 23, 1685–1693. [Google Scholar] [CrossRef]
- Hwang, H.S.; Yuan, D.; Jeong, K.H.; Uhm, G.S.; Cho, J.H.; Yoon, S.J. Three-dimensional soft tissue analysis for the evaluation of facial asymmetry in normal occlusion individuals. Korean J. Orthod. 2012, 42, 56–63. [Google Scholar] [CrossRef] [Green Version]


| Description | |
|---|---|
| Points | |
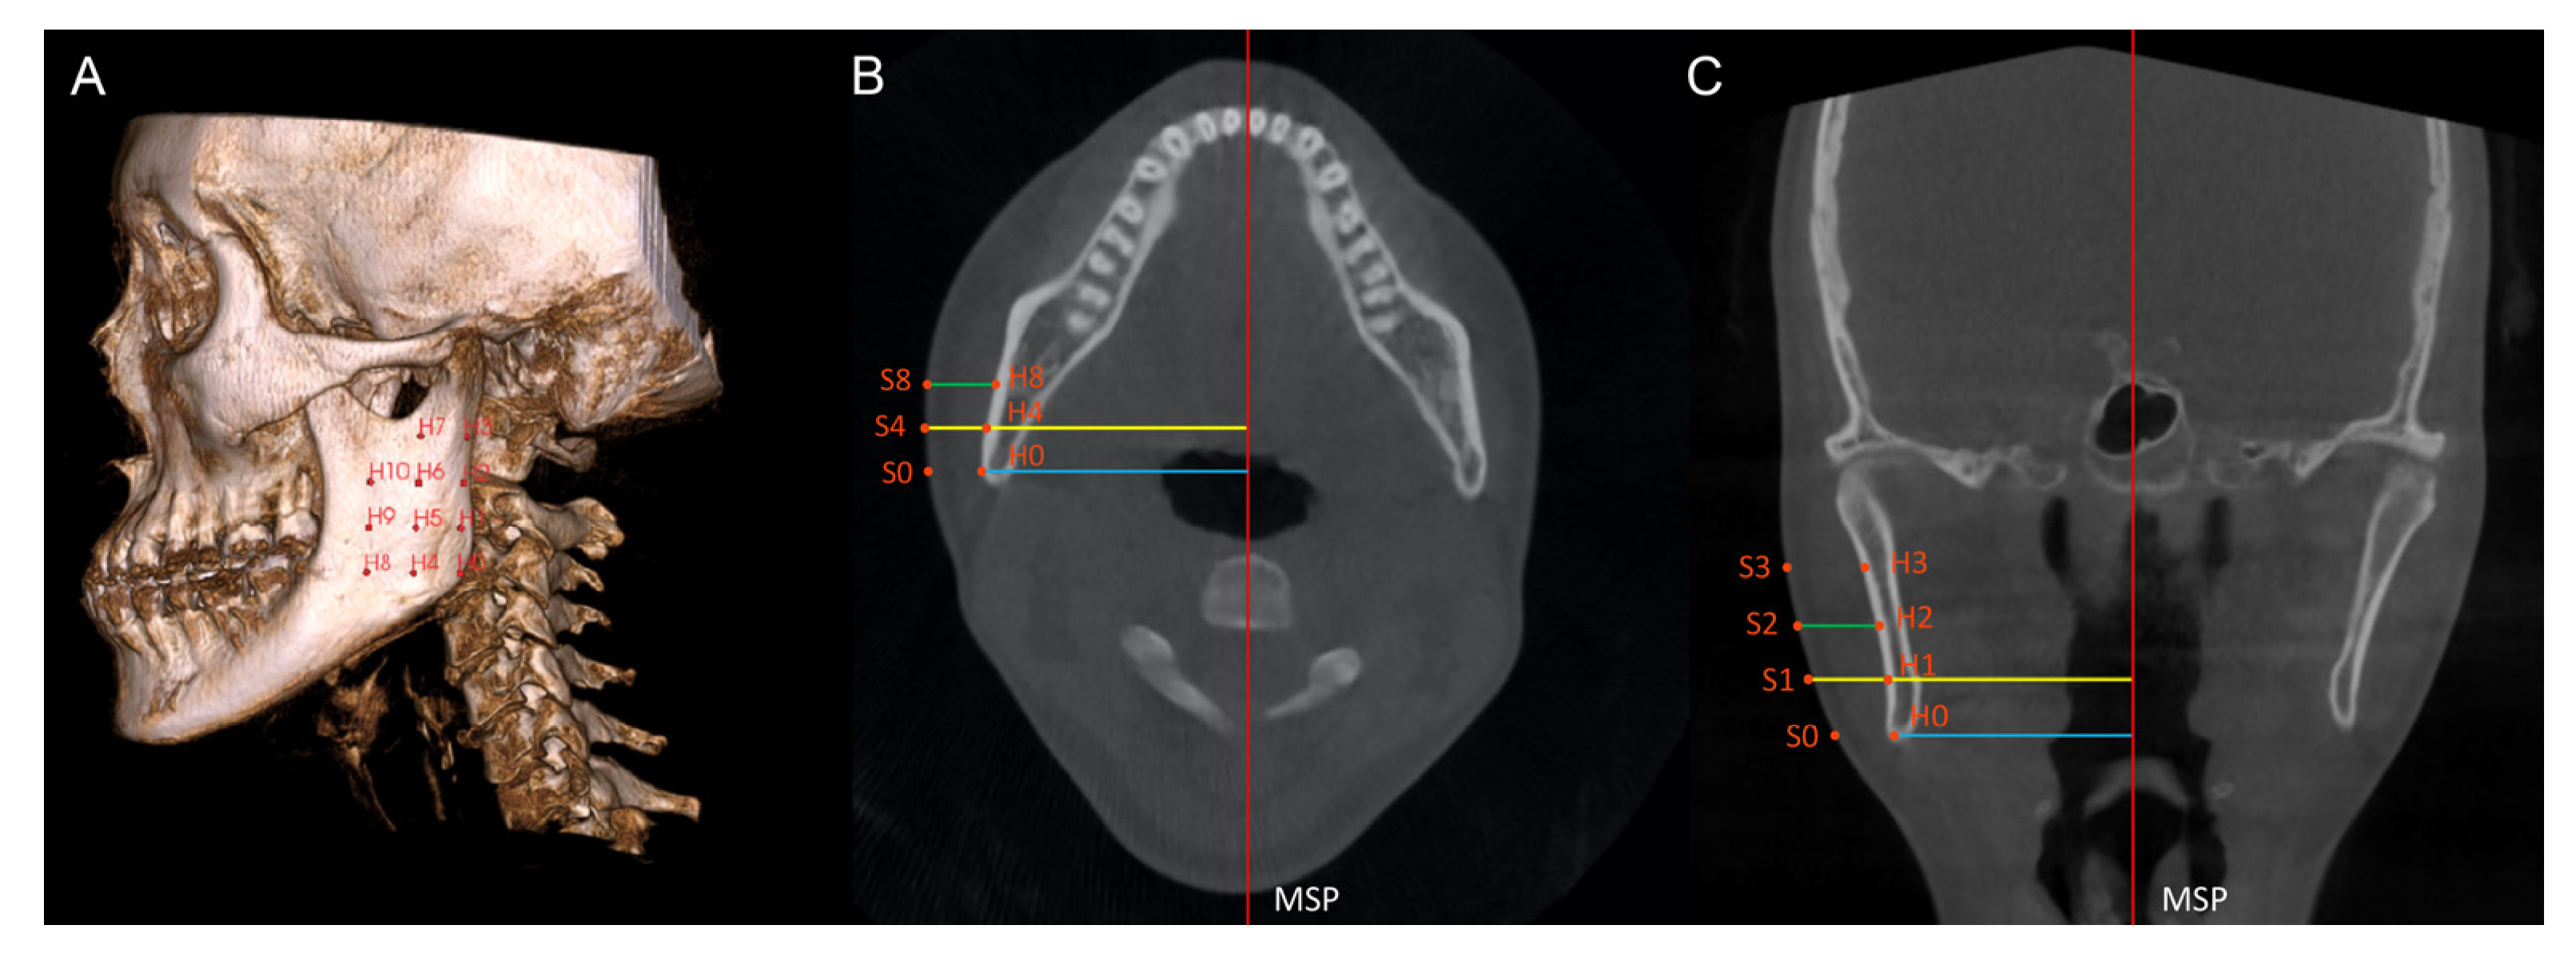
| H0 | Point corresponding to the Gonion point on the deviated side. |
| H1 | Point located on the external cortical bone of the mandible, on the same coronal slice as H0, and 10 mm above H0 on the axial slice. |
| H2 | Point located on the external cortical bone of the mandible, on the same coronal slice as H0, and 10 mm above H1 on the axial slice. |
| H3 | Point located on the external cortical bone of the mandible, on the same coronal slice as H0, and 10 mm above H2 on the axial slice. |
| H4 | Point located on the external cortical bone of the mandible, on the same axial slice as H0, and 10 mm anterior to H0 on the coronal slice. |
| H5 | Point located on the external cortical bone of the mandible, on the same coronal slice as H4, and 10 mm above H4 on the axial slice. |
| H6 | Point located on the external cortical bone of the mandible, on the same coronal slice as H4, and 10 mm above H5 on the axial slice. |
| H7 | Point located on the external cortical bone of the mandible, on the same coronal slice as H4, and 10 mm above H6 on the axial slice. |
| H8 | Point located on the external cortical bone of the mandible, on the same axial slice as H4, and 10 mm anterior to H4 on the coronal slice. |
| H9 | Point located on the external cortical bone of the mandible, on the same coronal slice as H8, and 10 mm above H8 on the axial slice. |
| H10 | Point located on the external cortical bone of the mandible, on the same coronal slice as H8, and 10 mm above H9 on the axial slice. |
| S0–S10 | Extension of hard tissue point (H0 to H10) perpendicularly from the MSP to the outermost soft tissue contour of the face. |
| H’0–H’10 | Hard tissue points on the non-deviated side of the mandible, corresponding to H0 to H10. |
| S’0–S’10 | Soft tissue points on the non-deviated side, corresponding to S0 to S10. |
| Measurements | |
| Hard tissue prominence (mm) | The perpendicular distance from a hard tissue point to the MSP. |
| Soft tissue prominence (mm) | The perpendicular distance from a soft tissue point to the MSP. |
| Soft tissue thickness (mm) | The distance between a hard tissue point and a soft tissue point perpendicular to the MSP. |
| Menton deviation (mm) | The perpendicular distance from the menton point to the mid-sagittal plane. |
| Symmetric Group | Asymmetric Group | |
|---|---|---|
| Variables | ||
| Patient (n) | 25 | 25 |
| Gender (Male/Female) | 12 M, 13 F | 14 M, 11 F |
| Age (year), mean ± SD | 23.65 ± 5.12 | 25.18 ± 4.77 |
| menton deviation (mm), mean ± SD | 0.87 ± 0.67 | 4.26 ± 1.69 |
| Side of menton deviation (n) | 13 L, 12 R | 15 L, 10 R |
| Symmetric Group (n = 25) | Asymmetric Group (n = 25) | |||||||||||
|---|---|---|---|---|---|---|---|---|---|---|---|---|
| Variables | Deviated Side | SD | Non-Deviated Side | SD | Mean Difference | p Value # | Deviated Side | SD | Non-Deviated Side | SD | Mean Difference | p Value # |
| Hard tissue prominence (mm) | ||||||||||||
| H0/H’0 | 48.94 | 4.57 | 48.95 | 2.54 | −0.02 | 0.985 | 52.08 | 3.15 | 48.51 | 3.89 | 3.57 | 0.002 * |
| H1/H’1 | 48.68 | 3.63 | 49.31 | 2.42 | −0.63 | 0.492 | 51.21 | 3.22 | 48.94 | 3.58 | 2.27 | 0.054 |
| H2/H’2 | 50.08 | 3.53 | 50.52 | 2.96 | −0.43 | 0.670 | 52.29 | 3.01 | 50.76 | 3.46 | 1.53 | 0.175 |
| H3/H’3 | 51.65 | 3.64 | 52.53 | 3.27 | −0.88 | 0.388 | 53.31 | 2.85 | 52.25 | 2.89 | 1.06 | 0.311 |
| H4/H’4 | 47.06 | 3.45 | 46.87 | 2.39 | 0.19 | 0.843 | 50.40 | 2.93 | 46.70 | 3.20 | 3.70 | 0.002 * |
| H5/H’5 | 47.88 | 3.42 | 47.74 | 2.82 | 0.14 | 0.880 | 50.78 | 2.89 | 47.30 | 3.17 | 3.49 | 0.002 * |
| H6/H’6 | 48.96 | 3.56 | 48.71 | 3.50 | 0.25 | 0.798 | 51.39 | 3.10 | 48.99 | 2.91 | 2.40 | 0.027 * |
| H7/H’7 | 49.53 | 4.11 | 49.47 | 4.03 | 0.07 | 0.947 | 51.42 | 2.98 | 49.80 | 2.41 | 1.62 | 0.097 |
| H8/H’8 | 41.56 | 10.87 | 44.50 | 2.21 | −2.94 | 0.199 | 47.96 | 3.36 | 43.70 | 2.54 | 4.26 | <0.001 * |
| H9/H’9 | 44.77 | 3.52 | 44.60 | 2.83 | 0.17 | 0.849 | 47.76 | 3.24 | 44.07 | 2.78 | 3.69 | 0.001 * |
| H10/H’10 | 45.55 | 3.58 | 45.29 | 3.38 | 0.26 | 0.777 | 47.52 | 3.54 | 44.85 | 2.60 | 2.67 | 0.011 * |
| Soft tissue prominence (mm) | ||||||||||||
| S0/S’0 | 60.35 | 4.26 | 59.81 | 4.10 | 0.54 | 0.615 | 61.50 | 3.25 | 58.33 | 3.71 | 3.17 | 0.006 * |
| S1/S’1 | 64.12 | 3.80 | 63.88 | 4.04 | 0.23 | 0.781 | 65.26 | 3.16 | 62.79 | 3.71 | 2.46 | 0.028 * |
| S2/S’2 | 67.20 | 3.46 | 66.85 | 4.37 | 0.35 | 0.700 | 68.44 | 3.62 | 66.37 | 3.62 | 2.07 | 0.062 |
| S3/S’3 | 69.25 | 2.88 | 69.21 | 4.49 | 0.04 | 0.965 | 70.09 | 3.80 | 68.86 | 3.85 | 1.22 | 0.273 |
| S4/S’4 | 62.15 | 3.46 | 61.72 | 3.92 | 0.43 | 0.625 | 63.68 | 3.35 | 60.13 | 3.06 | 3.56 | 0.001 * |
| S5/S’5 | 65.94 | 3.15 | 65.23 | 4.02 | 0.70 | 0.387 | 66.89 | 3.17 | 64.14 | 3.05 | 2.75 | 0.004 * |
| S6/S’6 | 68.22 | 3.56 | 67.79 | 4.14 | 0.44 | 0.555 | 69.07 | 3.44 | 67.05 | 3.23 | 2.02 | 0.039 * |
| S7/S’7 | 69.67 | 3.42 | 69.82 | 4.71 | −0.15 | 0.853 | 70.16 | 3.33 | 69.17 | 3.31 | 0.99 | 0.297 |
| S8/S’8 | 62.38 | 3.67 | 61.62 | 4.22 | 0.76 | 0.397 | 63.66 | 4.13 | 59.37 | 2.94 | 4.29 | <0.001 * |
| S9/S’9 | 65.20 | 3.25 | 64.91 | 4.28 | 0.29 | 0.711 | 66.33 | 3.73 | 63.60 | 3.27 | 2.73 | 0.005 * |
| S10/S’10 | 67.85 | 3.03 | 67.40 | 4.56 | 0.44 | 0.555 | 68.32 | 3.65 | 66.32 | 3.42 | 2.00 | 0.045 * |
| Soft tissue thickness (mm) | ||||||||||||
| ST0/ST’0 | 11.41 | 2.96 | 10.86 | 3.36 | 0.55 | 0.114 | 9.42 | 1.99 | 9.82 | 2.89 | −0.40 | 0.279 |
| ST1/ST’1 | 15.44 | 3.00 | 14.57 | 2.77 | 0.87 | 0.077 | 14.05 | 1.92 | 13.86 | 2.79 | 0.19 | 0.577 |
| ST2/ST’2 | 17.12 | 2.45 | 16.34 | 2.59 | 0.78 | 0.131 | 16.15 | 2.12 | 15.61 | 2.69 | 0.54 | 0.052 |
| ST3/ST’3 | 17.60 | 2.39 | 16.68 | 2.32 | 0.92 | 0.058 | 16.78 | 2.39 | 16.61 | 3.23 | 0.17 | 0.647 |
| ST4/ST’4 | 15.10 | 2.46 | 14.85 | 2.35 | 0.25 | 0.301 | 13.29 | 1.88 | 13.43 | 2.77 | −0.15 | 0.725 |
| ST5/ST’5 | 18.06 | 2.26 | 17.50 | 1.84 | 0.56 | 0.124 | 16.11 | 2.21 | 16.84 | 2.99 | −0.74 | 0.116 |
| ST6/ST’6 | 19.26 | 2.26 | 19.08 | 1.68 | 0.19 | 0.711 | 17.68 | 2.48 | 18.06 | 3.11 | −0.38 | 0.364 |
| ST7/ST’7 | 20.14 | 2.31 | 20.36 | 1.86 | −0.22 | 0.619 | 18.74 | 2.75 | 19.37 | 3.10 | −0.62 | 0.162 |
| ST8/ST’8 | 20.82 | 11.84 | 17.12 | 2.64 | 3.70 | 0.123 | 15.70 | 2.03 | 15.67 | 2.64 | 0.03 | 0.919 |
| ST9/ST’9 | 20.43 | 2.87 | 20.32 | 2.07 | 0.12 | 0.735 | 18.56 | 2.38 | 19.52 | 2.98 | −0.96 | 0.011 * |
| ST10/ST’10 | 22.29 | 2.48 | 22.11 | 1.96 | 0.18 | 0.547 | 20.80 | 2.73 | 21.47 | 3.08 | −0.67 | 0.159 |
| Symmetric Group (n = 25) | Asymmetric Group (n = 25) | |||
|---|---|---|---|---|
| Variables | Correlation Coefficient | p Value | Correlation Coefficient | p Value |
| Hard tissue difference | ||||
| H0/H’0 | 0.166 | 0.427 | −0.027 | 0.897 |
| H1/H’1 | 0.135 | 0.519 | −0.043 | 0.838 |
| H2/H’2 | 0.146 | 0.485 | −0.157 | 0.452 |
| H3/H’3 | 0.023 | 0.915 | −0.180 | 0.388 |
| H4/H’4 | 0.224 | 0.281 | 0.187 | 0.371 |
| H5/H’5 | 0.183 | 0.382 | 0.215 | 0.302 |
| H6/H’6 | 0.094 | 0.655 | 0.047 | 0.824 |
| H7/H’7 | 0.125 | 0.551 | −0.007 | 0.972 |
| H8/H’8 | 0.356 | 0.062 | 0.451 | 0.024 * |
| H9/H’9 | 0.184 | 0.379 | 0.271 | 0.190 |
| H10/H’10 | 0.221 | 0.288 | 0.173 | 0.409 |
| Soft tissue difference | ||||
| S0/S’0 | 0.250 | 0.228 | 0.152 | 0.468 |
| S1/S’1 | 0.299 | 0.147 | −0.017 | 0.937 |
| S2/S’2 | 0.204 | 0.329 | −0.122 | 0.562 |
| S3/S’3 | 0.187 | 0.371 | −0.142 | 0.500 |
| S4/S’4 | 0.245 | 0.238 | 0.323 | 0.116 |
| S5/S’5 | 0.227 | 0.276 | 0.038 | 0.856 |
| S6/S’6 | 0.182 | 0.383 | −0.081 | 0.701 |
| S7/S’7 | 0.185 | 0.375 | −0.195 | 0.351 |
| S8/S’8 | 0.269 | 0.194 | 0.412 | 0.041 * |
| S9/S’9 | 0.348 | 0.088 | 0.064 | 0.759 |
| S10/S’10 | 0.266 | 0.199 | −0.078 | 0.710 |
| Soft tissue thickness difference | ||||
| ST0/ST’0 | 0.342 | 0.095 | 0.252 | 0.108 |
| ST1/ST’1 | 0.377 | 0.063 | 0.092 | 0.661 |
| ST2/ST’2 | 0.067 | 0.749 | 0.182 | 0.384 |
| ST3/ST’3 | 0.305 | 0.139 | 0.084 | 0.690 |
| ST4/ST’4 | 0.028 | 0.895 | 0.244 | 0.240 |
| ST5/ST’5 | 0.026 | 0.904 | −0.416 | 0.038 * |
| ST6/ST’6 | 0.085 | 0.685 | −0.298 | 0.148 |
| ST7/ST’7 | 0.048 | 0.821 | −0.303 | 0.146 |
| ST8/ST’8 | −0.337 | 0.100 | −0.252 | 0.225 |
| ST9/ST’9 | 0.303 | 0.141 | −0.575 | 0.003 * |
| ST10/ST’10 | −0.023 | 0.912 | −0.326 | 0.117 |
Disclaimer/Publisher’s Note: The statements, opinions and data contained in all publications are solely those of the individual author(s) and contributor(s) and not of MDPI and/or the editor(s). MDPI and/or the editor(s) disclaim responsibility for any injury to people or property resulting from any ideas, methods, instructions or products referred to in the content. |
© 2023 by the authors. Licensee MDPI, Basel, Switzerland. This article is an open access article distributed under the terms and conditions of the Creative Commons Attribution (CC BY) license (https://creativecommons.org/licenses/by/4.0/).
Share and Cite
Tam, T.K.M.; Guo, R.; Liu, H.; Lin, Y. Hard and Soft Tissue Asymmetry in Patients with Skeletal Class III Malocclusion: A Cone-Beam Computed Tomography Study. Diagnostics 2023, 13, 869. https://doi.org/10.3390/diagnostics13050869
Tam TKM, Guo R, Liu H, Lin Y. Hard and Soft Tissue Asymmetry in Patients with Skeletal Class III Malocclusion: A Cone-Beam Computed Tomography Study. Diagnostics. 2023; 13(5):869. https://doi.org/10.3390/diagnostics13050869
Chicago/Turabian StyleTam, Tim King Man, Runzhi Guo, Hao Liu, and Yifan Lin. 2023. "Hard and Soft Tissue Asymmetry in Patients with Skeletal Class III Malocclusion: A Cone-Beam Computed Tomography Study" Diagnostics 13, no. 5: 869. https://doi.org/10.3390/diagnostics13050869