
Evolution of the Cross-Sectional Area of the Osseous Lumbar Spinal Canal across Decades: A CT Study with Reference Ranges in a Swiss Population
 , ,
, ,
Abstract
:1. Introduction
2. Materials and Methods
2.1. Study Design and Patient Population
2.2. CT Protocol
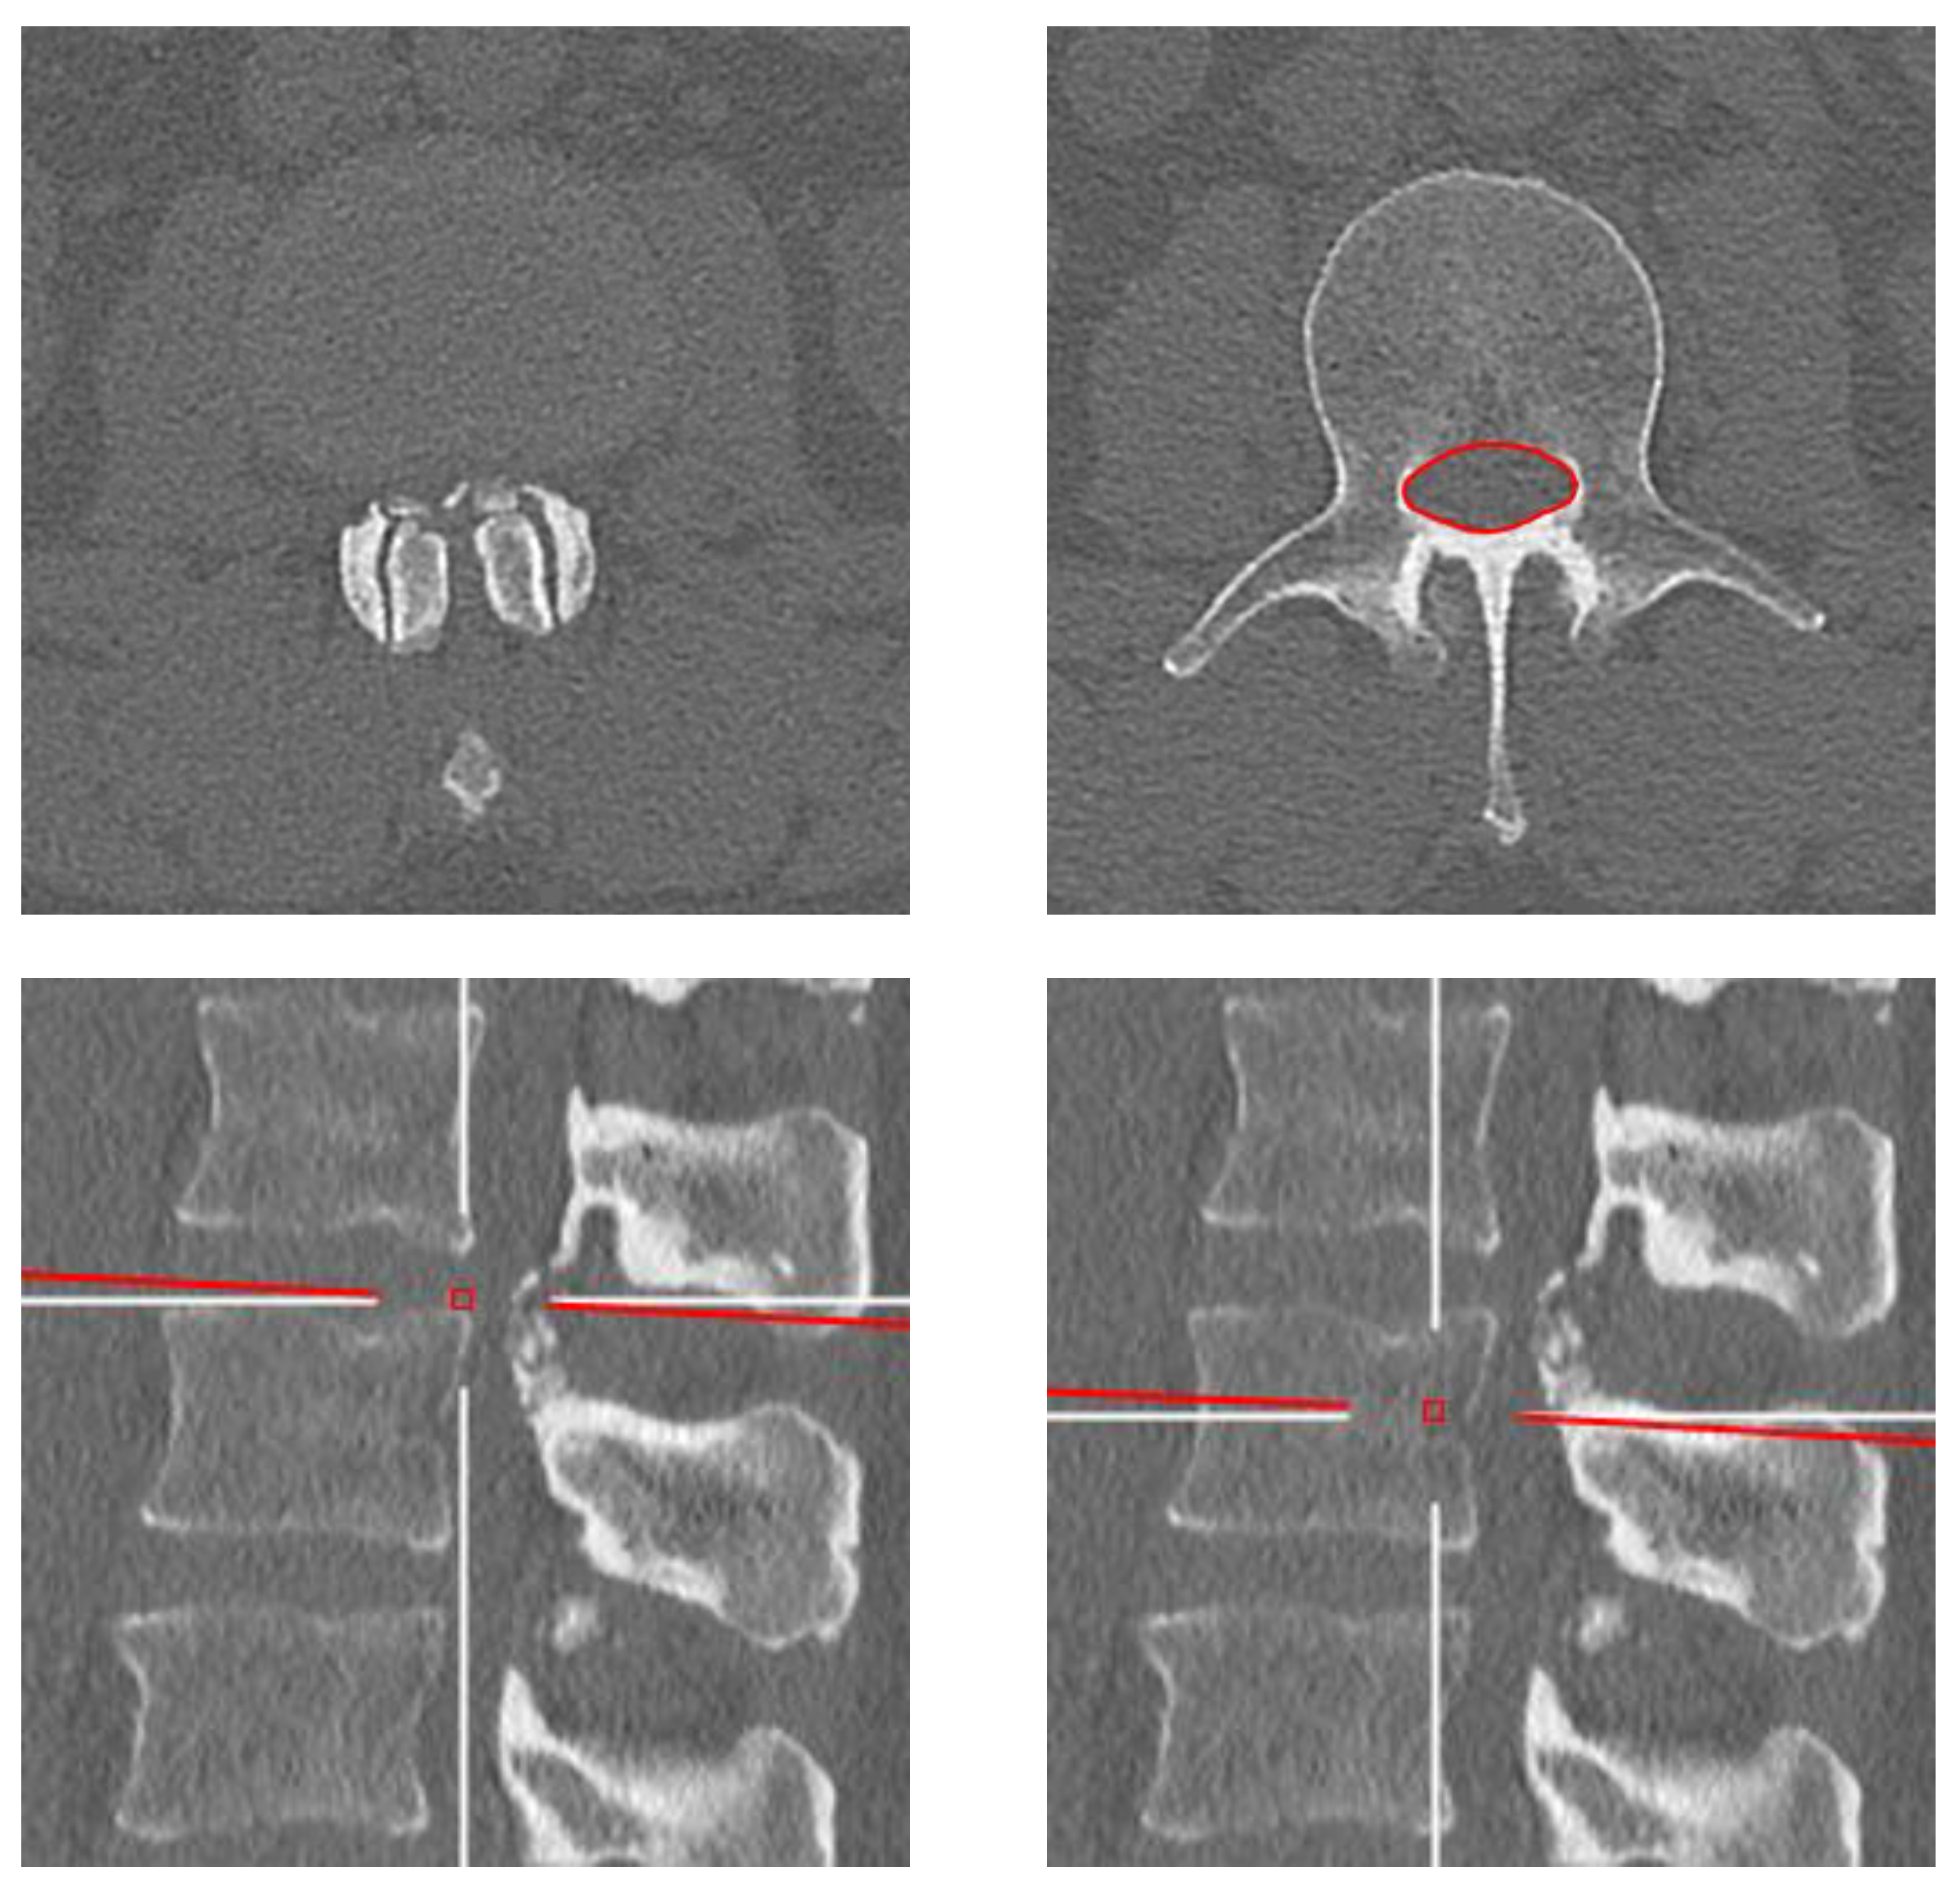
2.3. Image Analysis
2.4. Statistical Analysis
3. Results
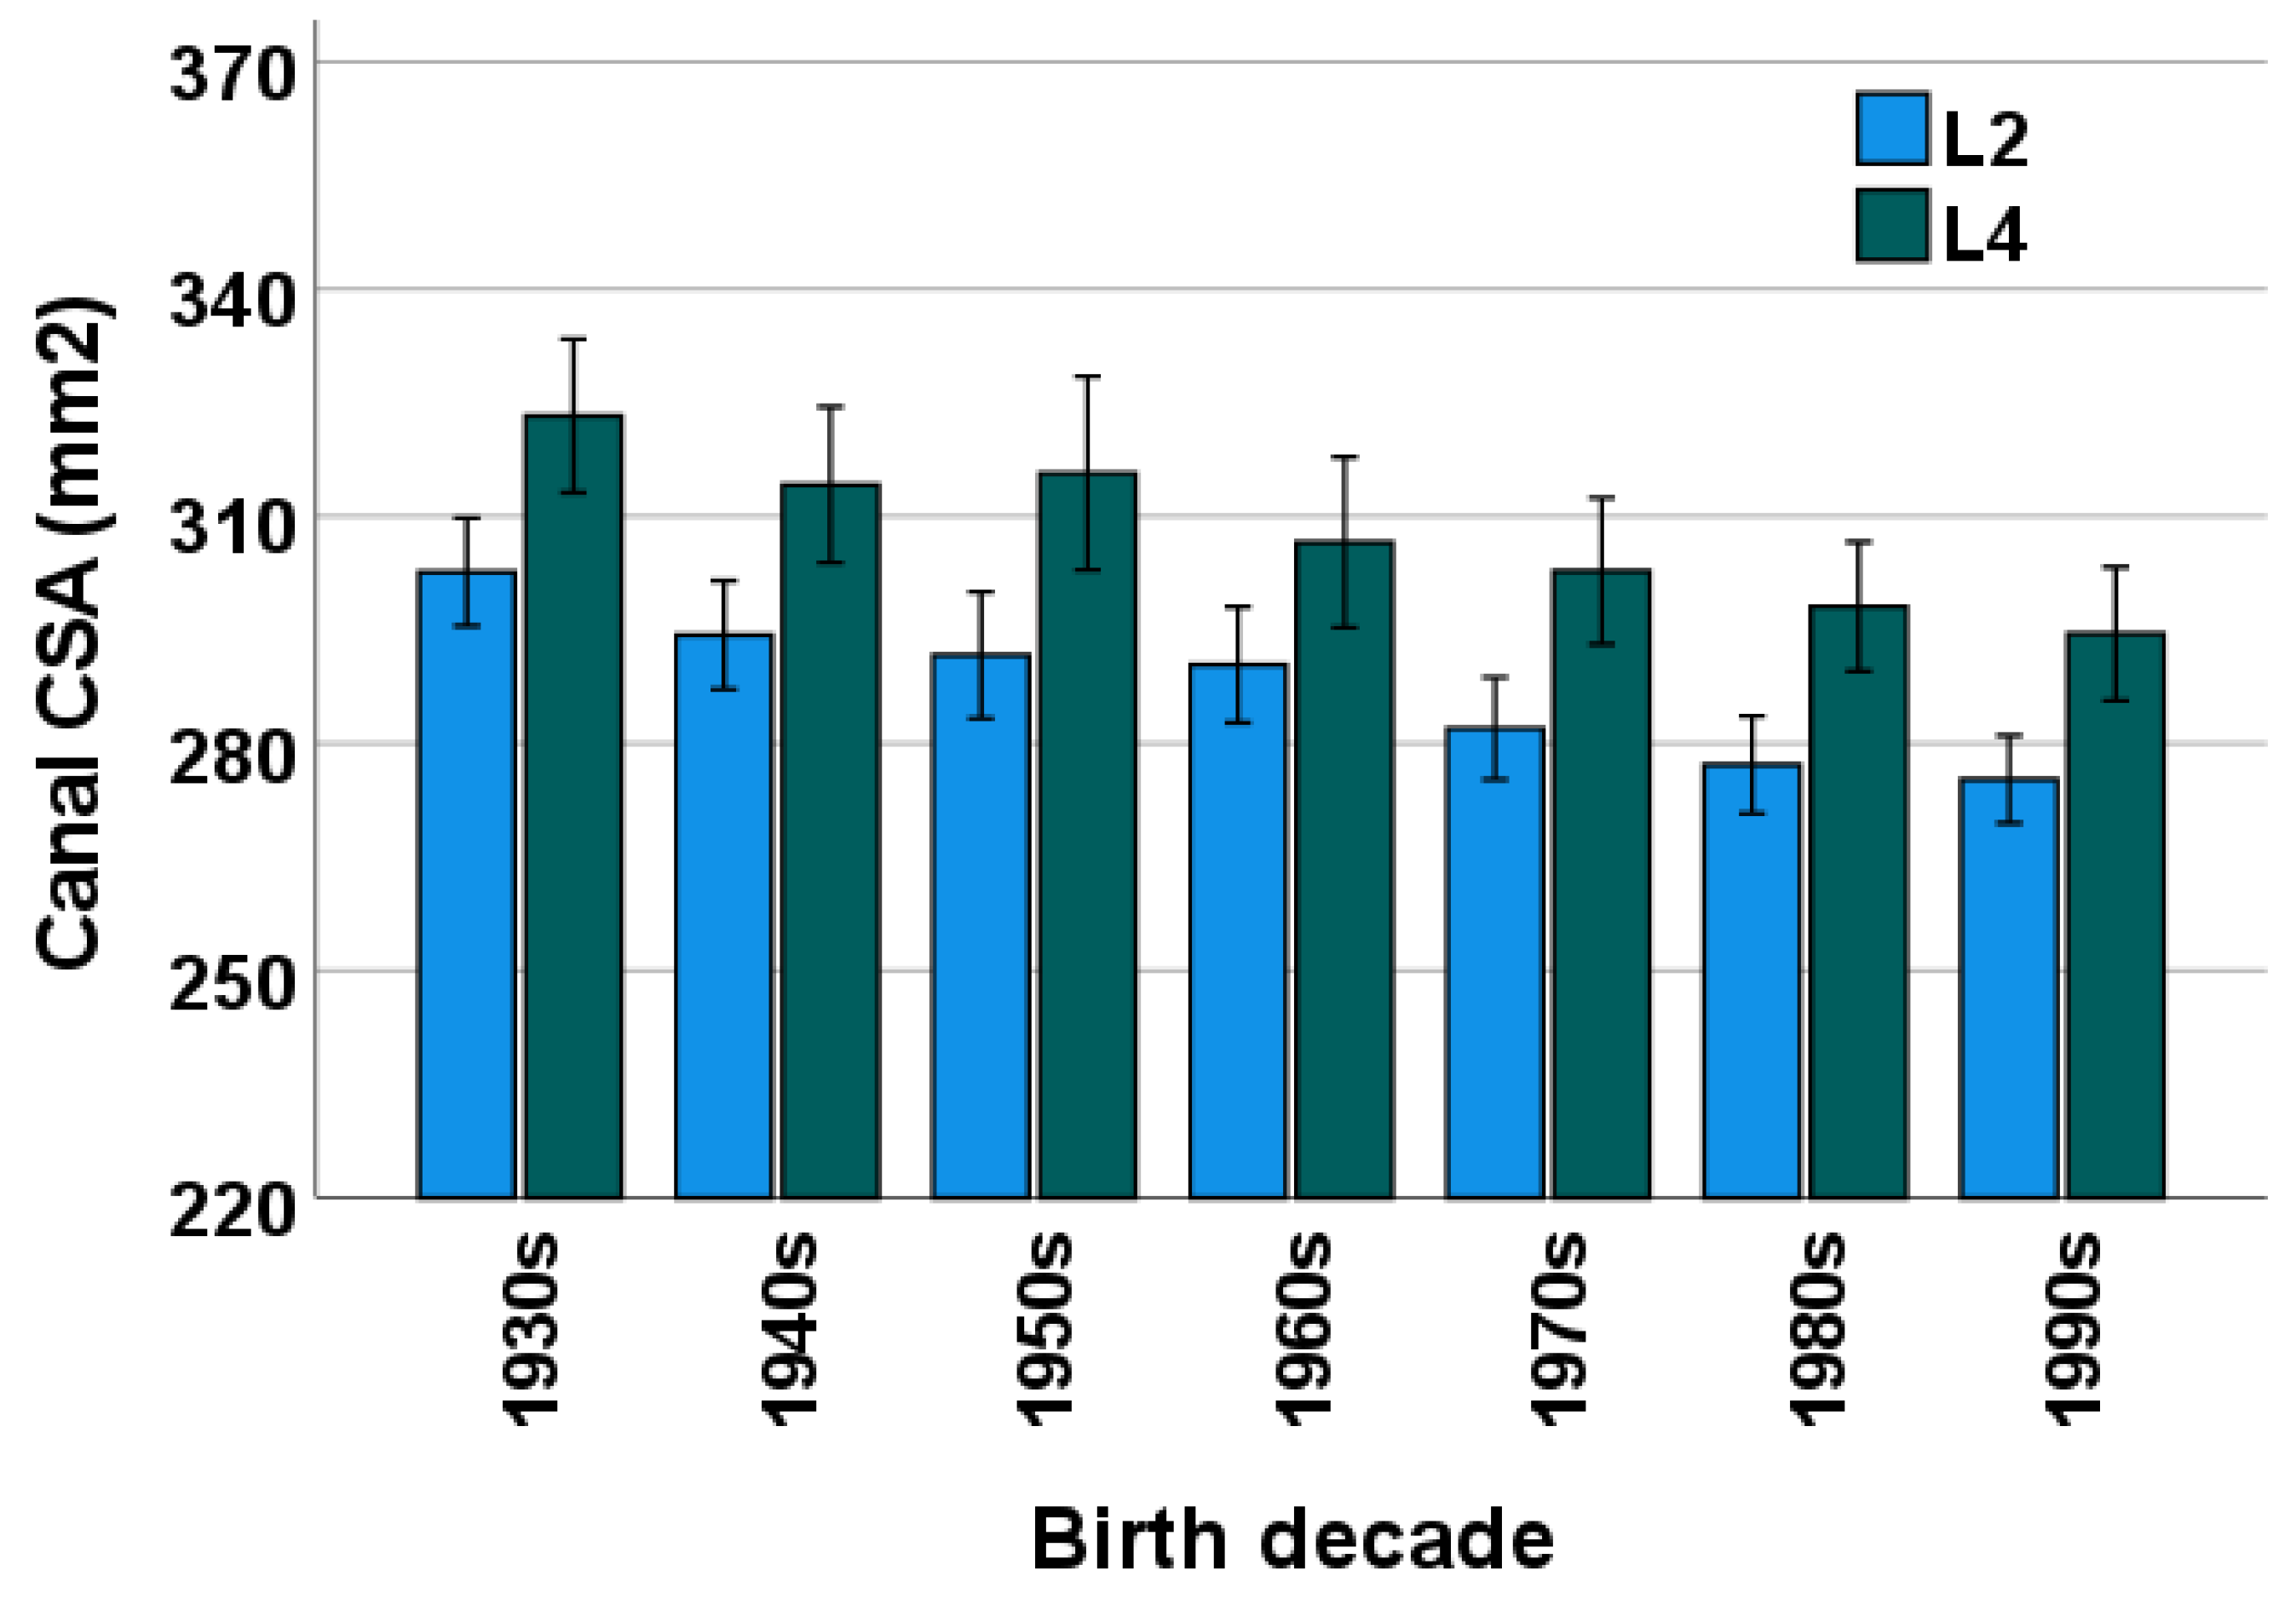
3.1. Comparison between L2 and L4 Levels
3.2. Birth Decade
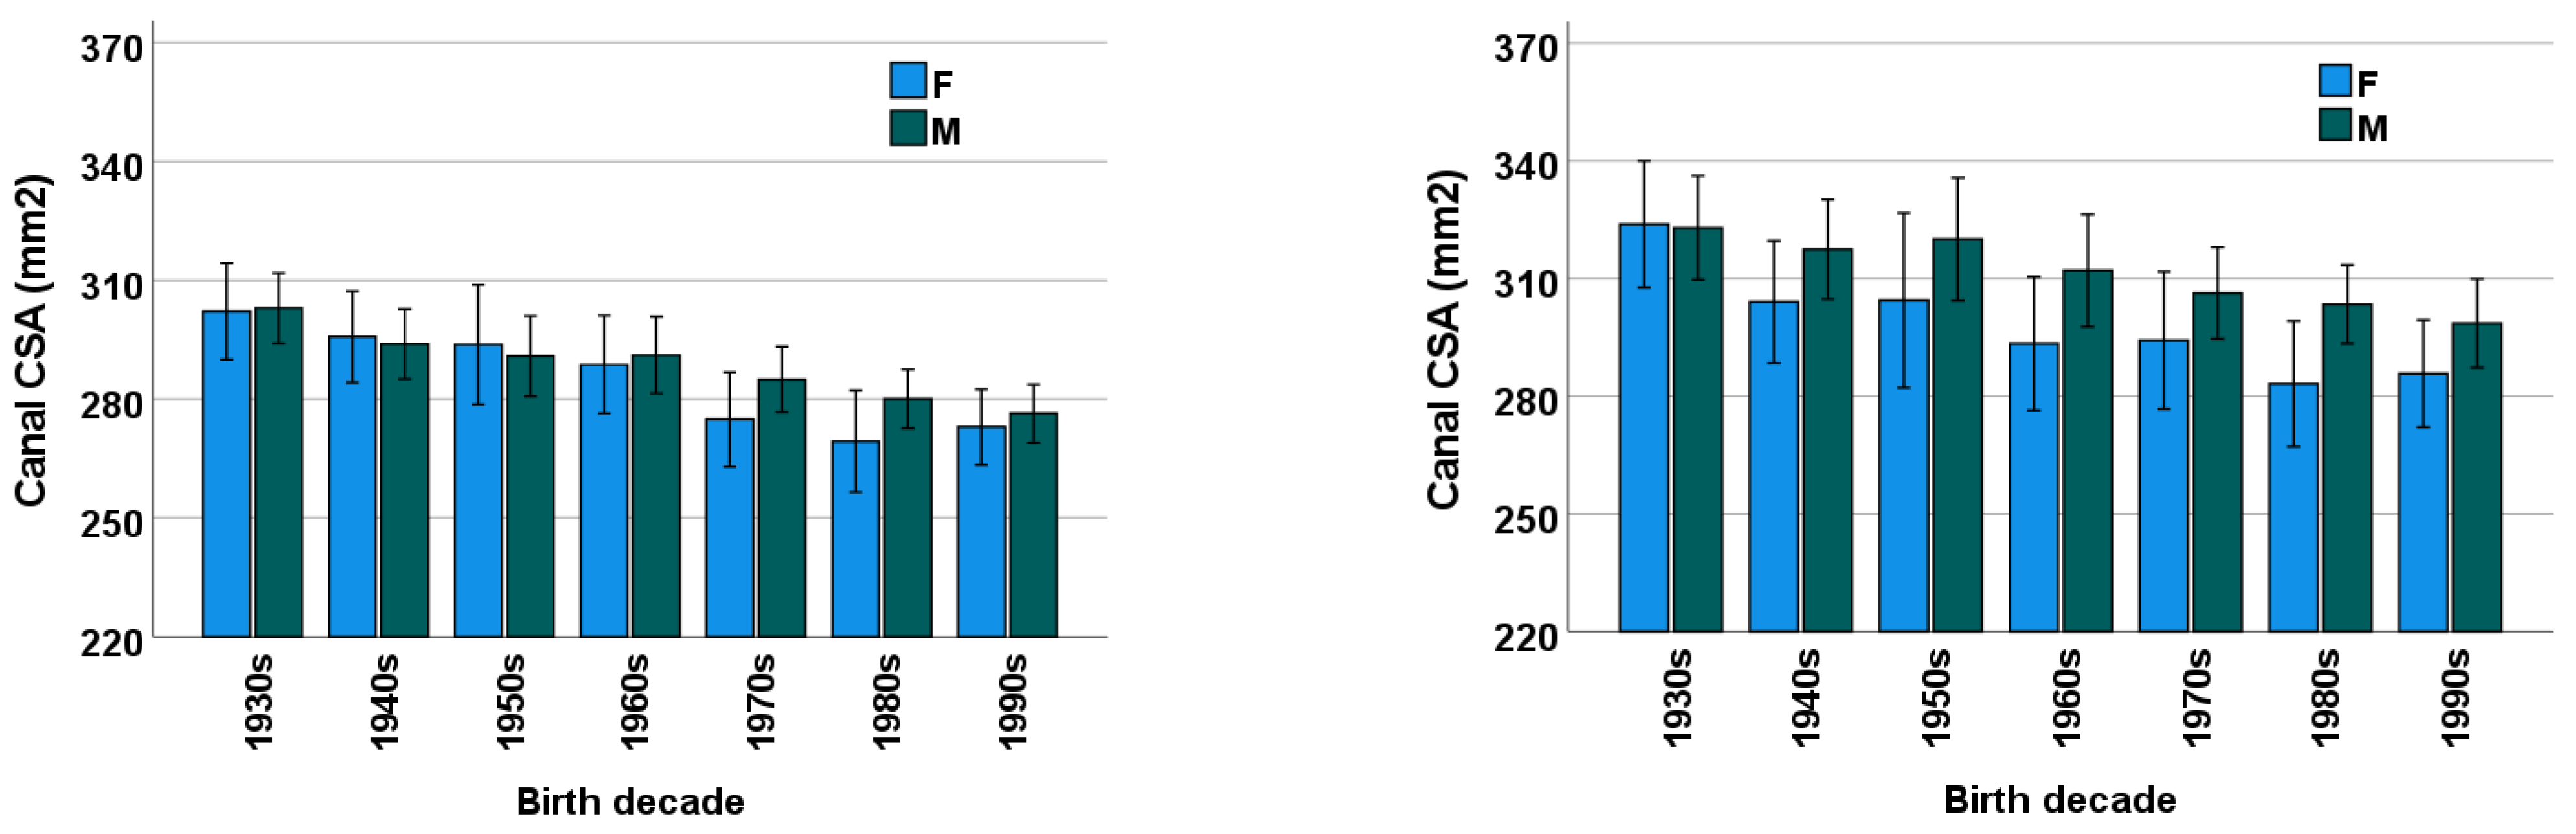
3.3. Sex
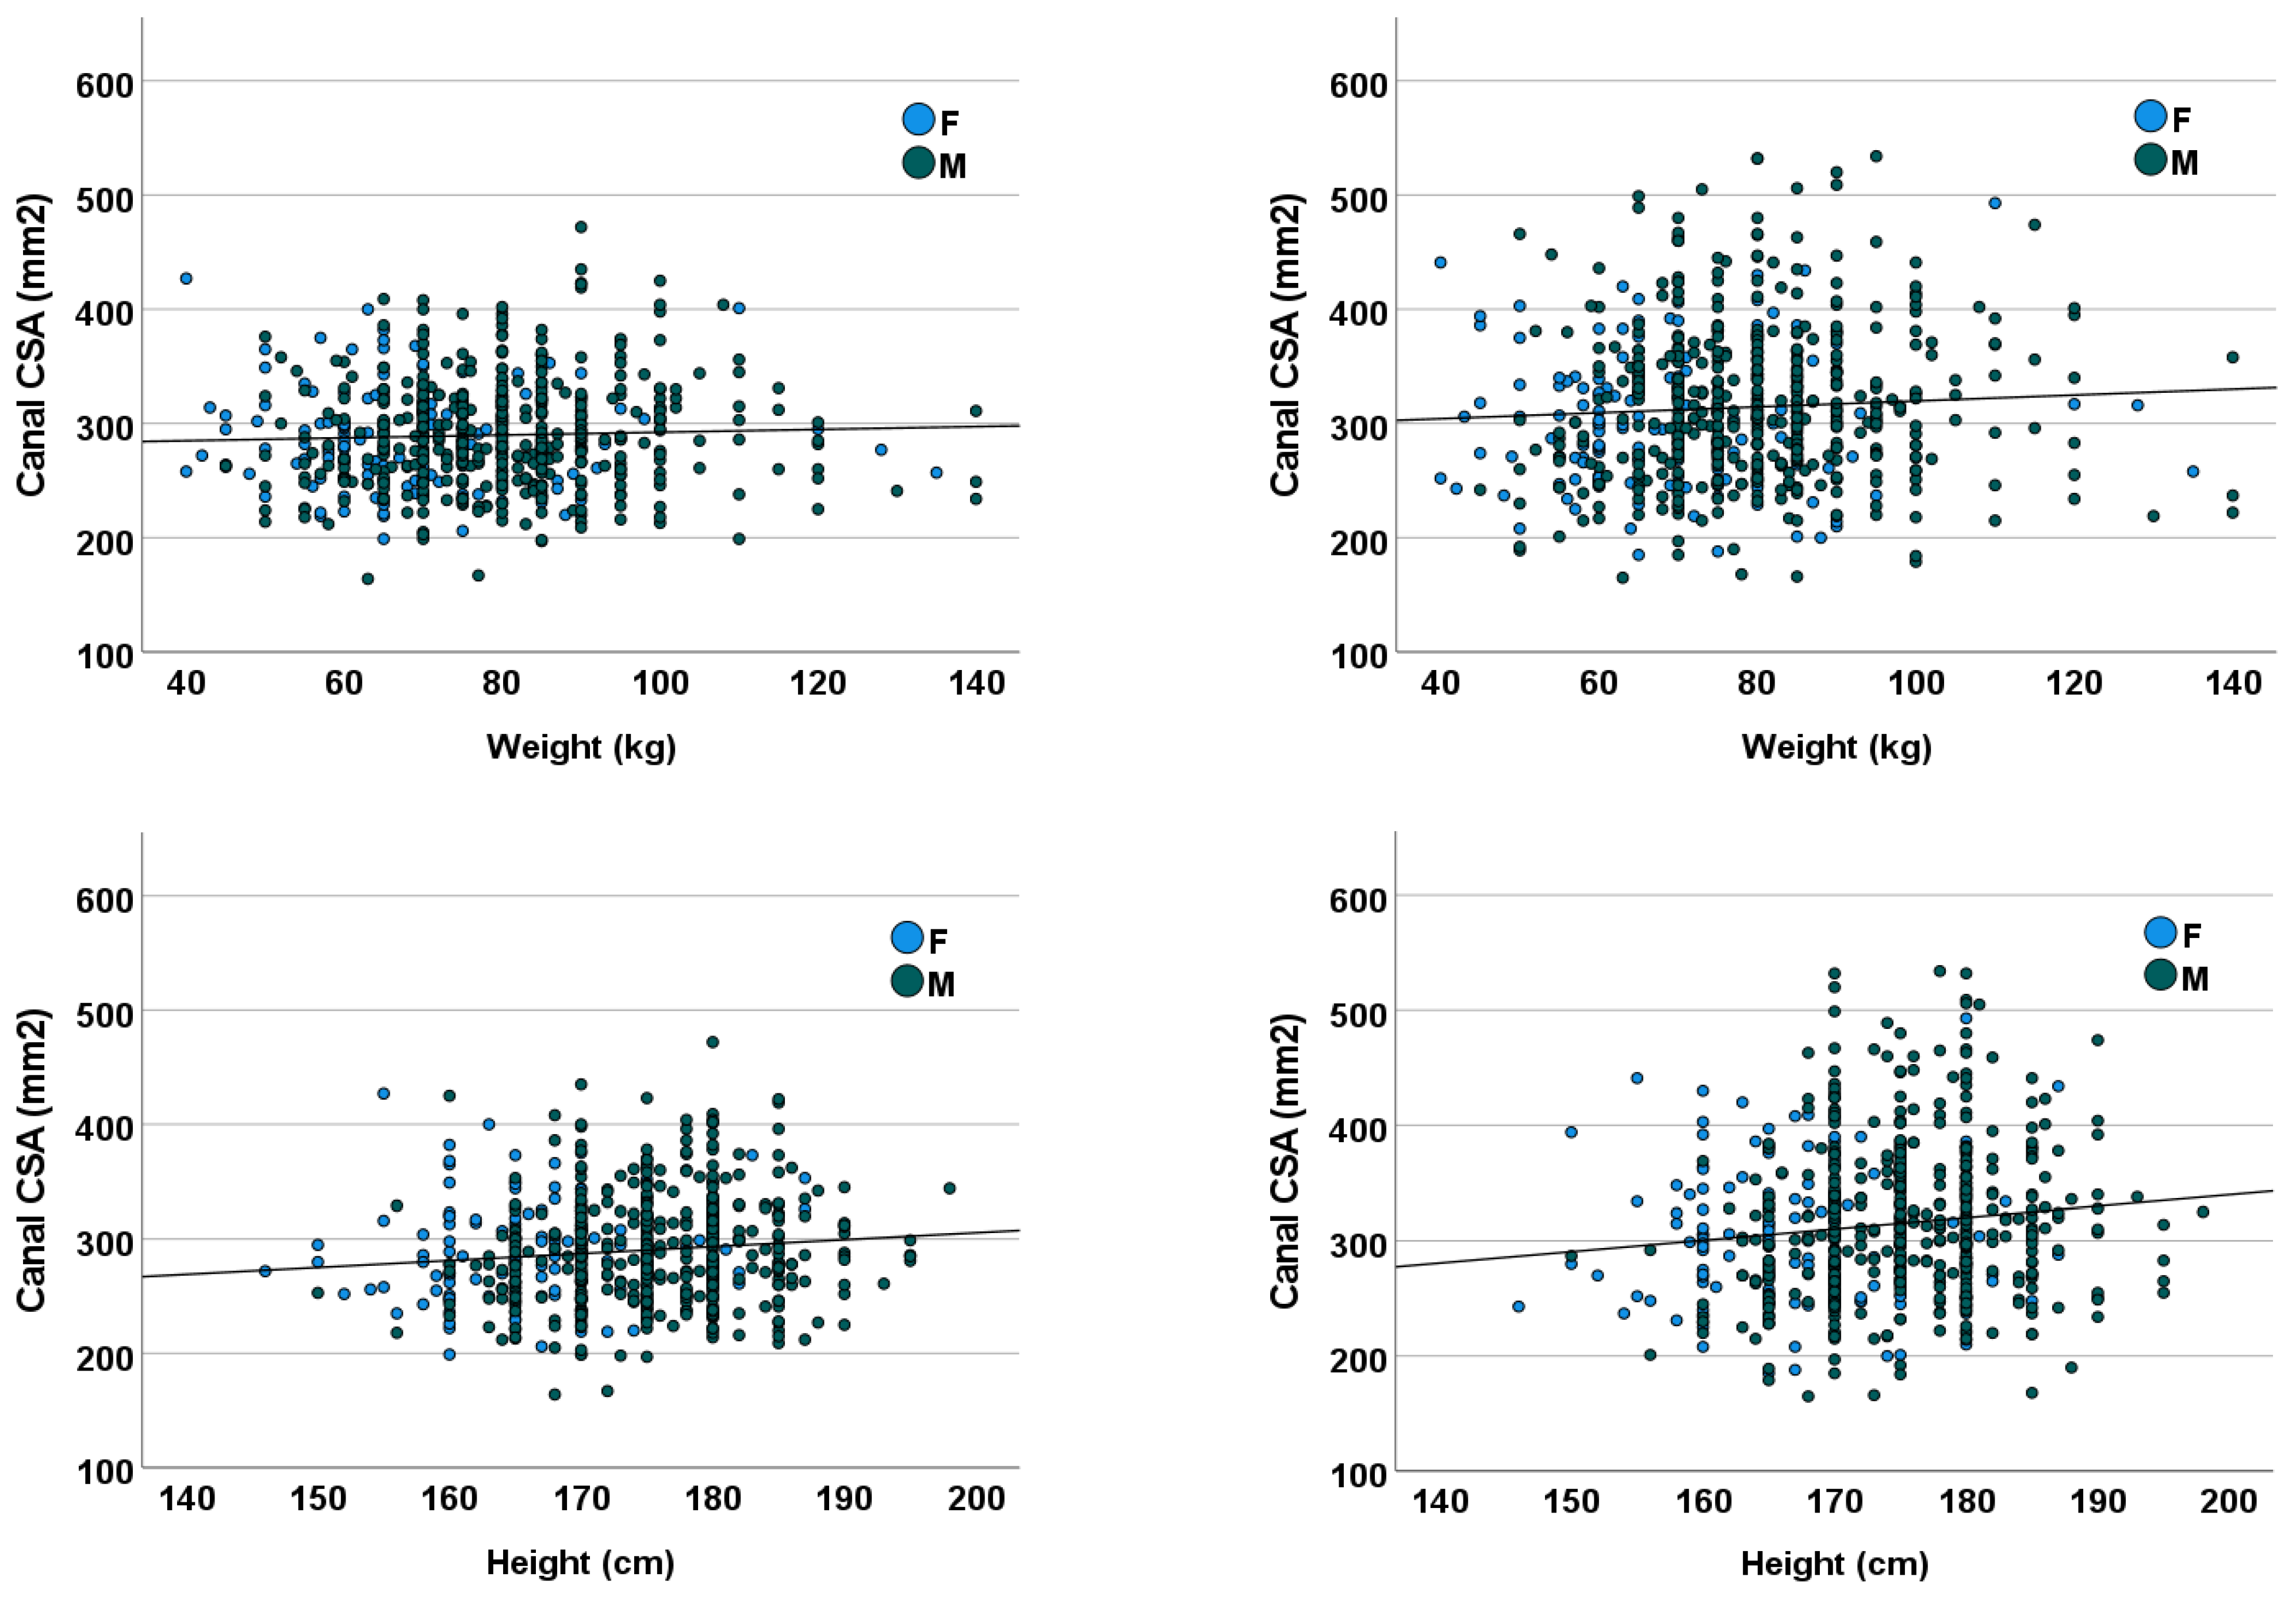
3.4. Height and Weight
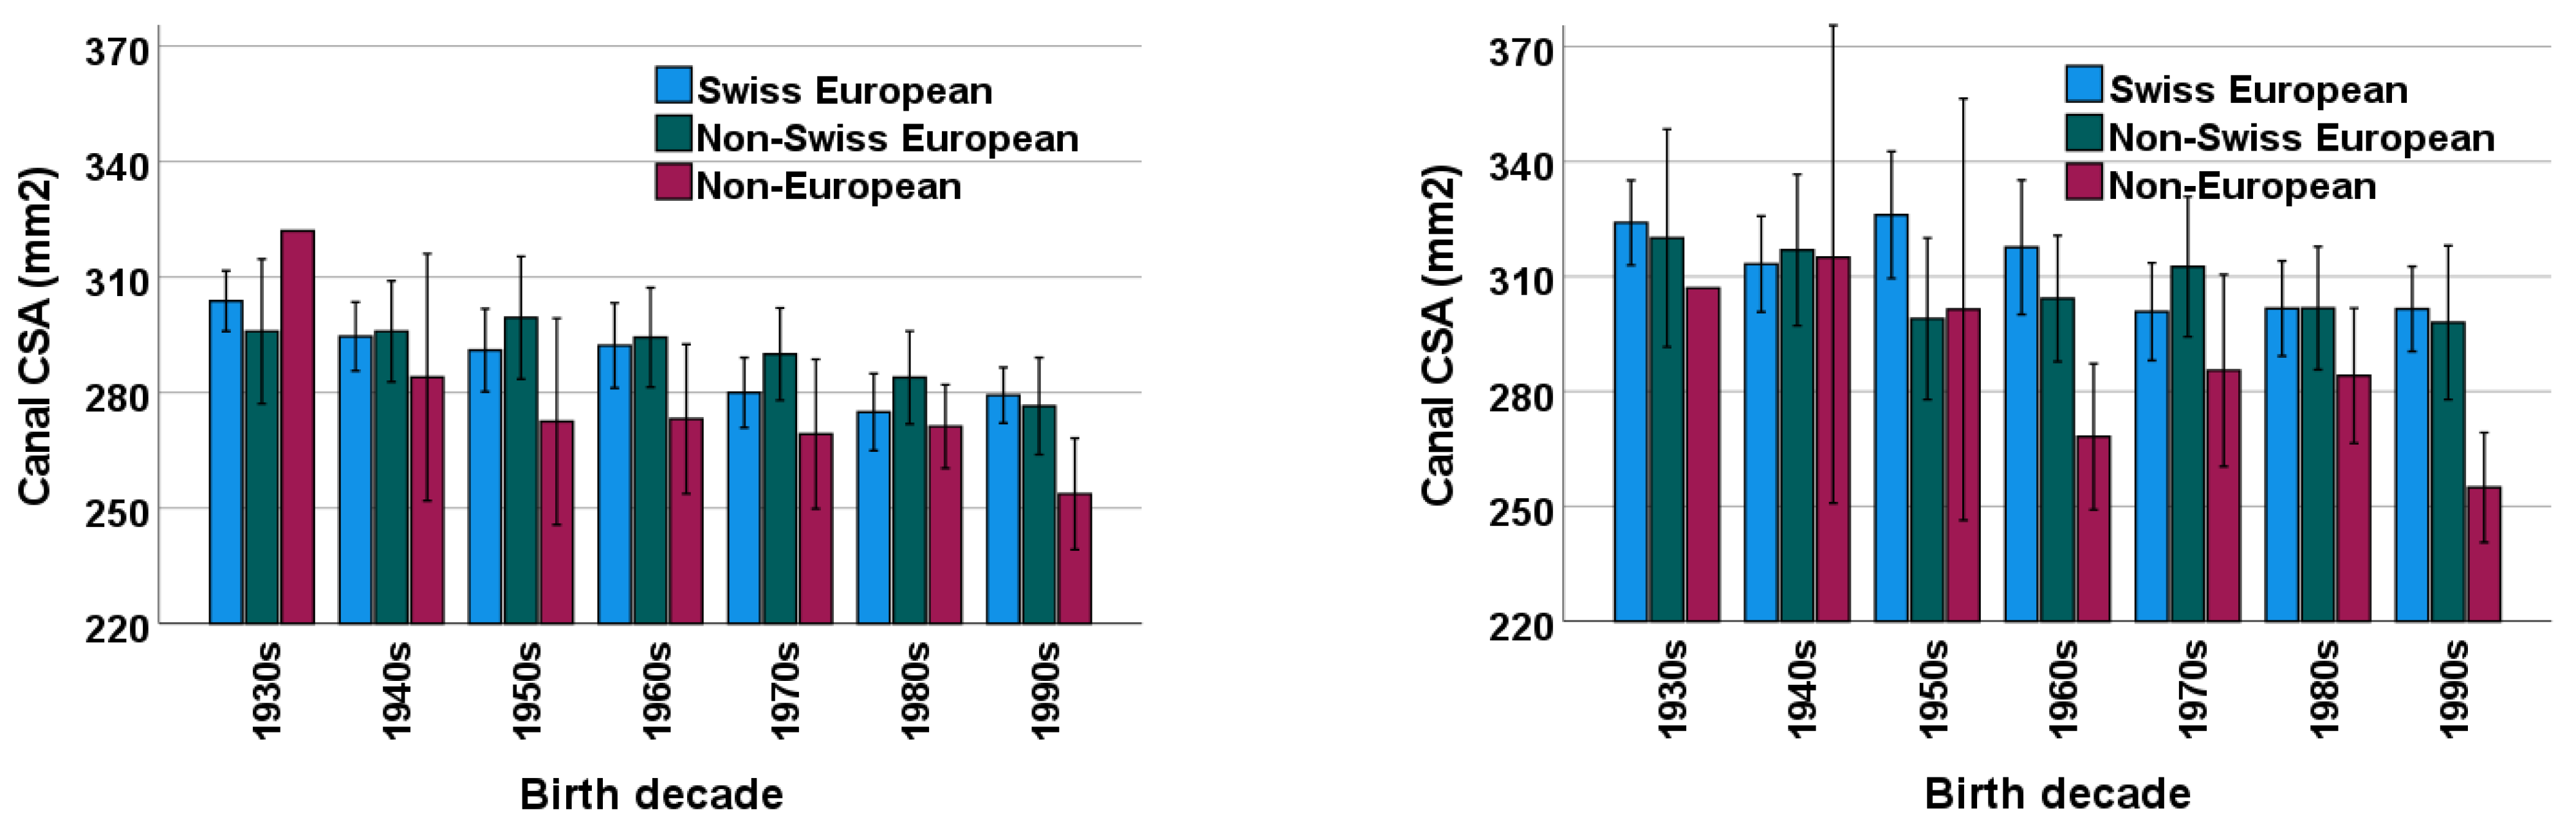
3.5. Ethnicity
3.6. Measurement Reliability
4. Discussion
5. Conclusions
Author Contributions
Funding
Institutional Review Board Statement
Informed Consent Statement
Data Availability Statement
Conflicts of Interest
Appendix A

| Decade | Mean CSA ± SD (mm2) | Mean CSA − 2 SD (mm2) | Median CSA (IQR) (mm2) | Lower Quartile CSA (25th Percentile, Q1) (mm2) |
|---|---|---|---|---|
| 1930s | 302.9 ± 43.1 | 216.7 | 302 (49) | 273.75 |
| 1940s | 293.9 ± 48.7 | 196.5 | 291.5 (60) | 266 |
| 1950s | 290.9 ± 51.8 | 187.3 | 289 (70) | 250 |
| 1960s | 291.3 ± 48.7 | 193.9 | 283 (64) | 256.25 |
| 1970s | 284.9 ± 42.4 | 200.1 | 276.5 (50) | 256 |
| 1980s | 280.1 ± 39.7 | 200.7 | 280 (52) | 249 |
| 1990s | 276.4 ± 39.1 | 198.2 | 266 (60) | 249 |
| Decade | Mean CSA ± SD (mm2) | Mean CSA − 2 SD (mm2) | Median CSA (IQR) (mm2) | Lower Quartile CSA (25th Percentile, Q1) (mm2) |
|---|---|---|---|---|
| 1930s | 322.9 ± 64.0 | 194.9 | 305.5 (97) | 275.5 |
| 1940s | 317.5 ± 70.4 | 176.7 | 311 (92) | 268.25 |
| 1950s | 320.1 ± 80.0 | 160.1 | 303 (98) | 267 |
| 1960s | 312.2 ± 72.1 | 168.0 | 310 (101) | 256.5 |
| 1970s | 306.3 ± 60.1 | 186.1 | 301.5 (79) | 264 |
| 1980s | 303.5 ± 53.2 | 197.1 | 300 (62) | 270 |
| 1990s | 298.6 ± 60.2 | 178.2 | 294 (87) | 252 |
| Decade | Mean CSA ± SD (mm2) | Mean CSA − 2 SD (mm2) | Median CSA (IQR) (mm2) | Lower Quartile CSA (25th Percentile, Q1) (mm2) |
|---|---|---|---|---|
| 1930s | 302.2 ± 44.3 | 213.6 | 302 (60) | 269 |
| 1940s | 295.7 ± 35.6 | 224.5 | 295 (43) | 271 |
| 1950s | 293.8 ± 47.4 | 199.0 | 284.5 (67) | 255.25 |
| 1960s | 288.7 ± 39.7 | 209.3 | 290.5 (46) | 266.75 |
| 1970s | 274.9 ± 38.7 | 197.5 | 271 (59) | 243 |
| 1980s | 269.4 ± 40.2 | 189.0 | 267.5 (51) | 244.25 |
| 1990s | 273.0 ± 34.2 | 204.6 | 268 (52) | 247.5 |
| Decade | Mean CSA ± SD (mm2) | Mean CSA − 2 SD (mm2) | Median CSA (IQR) (mm2) | Lower Quartile CSA (25th Percentile, Q1) (mm2) |
|---|---|---|---|---|
| 1930s | 323.9 ± 58.6 | 206.7 | 324 (99) | 274 |
| 1940s | 304.1 ± 48.0 | 208.1 | 300 (64) | 269 |
| 1950s | 304.5 ± 69.7 | 165.1 | 295 (101) | 246 |
| 1960s | 293.4 ± 54.7 | 184.0 | 283.5 (72) | 252.75 |
| 1970s | 294.3 ± 56.9 | 180.5 | 291 (85) | 246 |
| 1980s | 283.2 ± 50.1 | 183.0 | 275 (55) | 253 |
| 1990s | 285.8 ± 49.1 | 187.6 | 275 (80) | 250 |
| Decade | Mean CSA ± SD (mm2) | Mean CSA − 2 SD (mm2) | Median CSA (IQR) (mm2) | Lower Quartile CSA (25th Percentile, Q1) (mm2) |
|---|---|---|---|---|
| 1930s | 303.8 ± 43.6 | 216.6 | 302 (58) | 270 |
| 1940s | 294.6 ± 48.4 | 197.8 | 293 (64) | 265 |
| 1950s | 291.0 ± 50.5 | 190.0 | 284 (66) | 252 |
| 1960s | 292.4 ± 48.1 | 196.2 | 288 (55) | 262 |
| 1970s | 280.0 ± 39.3 | 201.4 | 271 (40) | 255.25 |
| 1980s | 275.0 ± 41.6 | 191.8 | 270 (54) | 246.5 |
| 1990s | 279.3 ± 37.7 | 203.9 | 268 (55) | 250 |
| Decade | Mean CSA ± SD (mm2) | Mean CSA − 2 SD (mm2) | Median CSA (IQR) (mm2) | Lower Quartile CSA (25th Percentile, Q1) (mm2) |
|---|---|---|---|---|
| 1930s | 324.0 ± 61.6 | 200.8 | 308 (95) | 276 |
| 1940s | 313.3 ± 67.7 | 177.9 | 302 (92) | 268 |
| 1950s | 326.1 ± 77.7 | 170.7 | 311 (98) | 272 |
| 1960s | 317.8 ± 76.2 | 165.4 | 314 (112) | 255 |
| 1970s | 300.8 ± 55.0 | 190.8 | 289.5 (79) | 259.25 |
| 1980s | 301.7 ± 51.7 | 198.3 | 299 (67) | 264.5 |
| 1990s | 301.5 ± 57.9 | 185.7 | 298 (81) | 258 |
| Decade | Mean CSA ± SD (mm2) | Mean CSA − 2 SD (mm2) | Median CSA (IQR) (mm2) | Lower Quartile CSA (25th Percentile, Q1) (mm2) |
|---|---|---|---|---|
| 1930s | 295.9 ± 43.5 | 208.5 | 295 (49) | 270 |
| 1940s | 295.9 ± 38.8 | 217.9 | 297.5 (48) | 266.5 |
| 1950s | 299.5 ± 51.1 | 197.3 | 297.5 (75) | 256.5 |
| 1960s | 294.3 ± 44.5 | 205.3 | 288 (57) | 260.25 |
| 1970s | 290.0 ± 43.1 | 203.8 | 287.5 (70) | 249.5 |
| 1980s | 283.9 ± 42.6 | 198.1 | 285 (46) | 255 |
| 1990s | 276.5 ± 36.1 | 204.3 | 269.5 (52) | 252.5 |
| Decade | Mean CSA ± SD (mm2) | Mean CSA − 2 SD (mm2) | Median CSA (IQR) (mm2) | Lower Quartile CSA (25th Percentile, Q1) (mm2) |
|---|---|---|---|---|
| 1930s | 320.0 ± 65.7 | 188.6 | 315 (108) | 274 |
| 1940s | 316.9 ± 58.3 | 200.3 | 314 (86) | 268.5 |
| 1950s | 299.0 ± 68.0 | 163.0 | 288 (98) | 249.5 |
| 1960s | 304.3 ± 56.7 | 190.9 | 297 (80) | 262.75 |
| 1970s | 312.6 ± 65.7 | 181.2 | 304 (90) | 266.25 |
| 1980s | 301.8 ± 57.1 | 187.6 | 300 (71) | 265 |
| 1990s | 298.0 ± 57.6 | 182.8 | 297.5 (85) | 254.25 |
| Decade | Mean CSA ± SD (mm2) | Mean CSA − 2 SD (mm2) | Median CSA (IQR) (mm2) | Lower Quartile CSA (25th Percentile, Q1) (mm2) |
|---|---|---|---|---|
| 1930s | ||||
| 1940s | 284.0 ± 38.4 | 207.2 | 288 (56) | 258.5 |
| 1950s | 272.5 ± 46.4 | 179.7 | 268 (63) | 236.75 |
| 1960s | 273.2 ± 40.3 | 192.6 | 278 (43) | 246 |
| 1970s | 269.2 ± 42.7 | 183.8 | 277 (65) | 231 |
| 1980s | 271.2 ± 29.6 | 212.0 | 277 (40) | 248 |
| 1990s | 253.7 ± 32.6 | 188.5 | 247.5 (58) | 224.5 |
| Decade | Mean CSA ± SD (mm2) | Mean CSA − 2 SD (mm2) | Median CSA (IQR) (mm2) | Lower Quartile CSA (25th Percentile, Q1) (mm2) |
|---|---|---|---|---|
| 1930s | ||||
| 1940s | 315.0 ± 76.7 | 161.6 | 305 (46) | 296.5 |
| 1950s | 301.4 ± 95.3 | 110.8 | 280 (171) | 217 |
| 1960s | 268.2 ± 39.5 | 189.2 | 269 (66) | 234 |
| 1970s | 285.5 ± 55.0 | 175.5 | 303 (90) | 240 |
| 1980s | 284.1 ± 48.1 | 187.9 | 289 (76) | 247 |
| 1990s | 255.0 ± 32.3 | 190.4 | 252 (34) | 236.25 |
References
- Jensen, R.K.; Harhangi, B.S.; Huygen, F.; Koes, B. Lumbar spinal stenosis. BMJ 2021, 373, n1581. [Google Scholar] [CrossRef] [PubMed]
- Jensen, R.K.; Jensen, T.S.; Koes, B.; Hartvigsen, J. Prevalence of lumbar spinal stenosis in general and clinical populations: A systematic review and meta-analysis. Eur. Spine J. 2020, 29, 2143–2163. [Google Scholar] [CrossRef] [PubMed]
- Porter, R.W. Spinal stenosis and neurogenic claudication. Spine 1996, 21, 2046–2052. [Google Scholar] [CrossRef] [PubMed]
- Katz, J.N.; Harris, M.B. Clinical practice. Lumbar spinal stenosis. N. Engl. J. Med. 2008, 358, 818–825. [Google Scholar] [CrossRef]
- Kobayashi, S. Pathophysiology, diagnosis and treatment of intermittent claudication in patients with lumbar canal stenosis. World J. Orthop. 2014, 5, 134–145. [Google Scholar] [CrossRef]
- Singh, K.; Samartzis, D.; Vaccaro, A.R.; Nassr, A.; Andersson, G.B.; Yoon, S.T.; Phillips, F.M.; Goldberg, E.J.; An, H.S. Congenital lumbar spinal stenosis: A prospective, control-matched, cohort radiographic analysis. Spine J. 2005, 5, 615–622. [Google Scholar] [CrossRef]
- Schizas, C.; Theumann, N.; Burn, A.; Tansey, R.; Wardlaw, D.; Smith, F.W.; Kulik, G. Qualitative grading of severity of lumbar spinal stenosis based on the morphology of the dural sac on magnetic resonance images. Spine 2010, 35, 1919–1924. [Google Scholar] [CrossRef] [Green Version]
- Grøvle, L.; Fjeld, O.R.; Haugen, A.J.; Helgeland, J.; Småstuen, M.C.; Solberg, T.K.; Zwart, J.A.; Grotle, M. The Rates of LSS Surgery in Norwegian Public Hospitals: A Threefold Increase From 1999 to 2013. Spine 2019, 44, E372–E378. [Google Scholar] [CrossRef] [Green Version]
- Clark, G.A.; Panjabi, M.; Wetzel, F. Can infant malnutrition cause adult vertebral stenosis? Spine 1985, 10, 165–170. [Google Scholar] [CrossRef]
- Tobin, M.K.; Gragnanielloa, C.; Horwitza, J.; Sun, F.W.; Schizasb, C.; Neckrysha, S. Generational Changes in Lumbar Spinal Canal Dimensions: Findings from a Sample U.S. Population. World Neurosurg. 2021, 146, e902–e916. [Google Scholar] [CrossRef]
- Schizas, C.; Schmit, A.; Schizas, A.; Becce, F.; Kulik, G.; Pierzchala, K. Secular changes of spinal canal dimensions in Western Switzerland: A narrowing epidemic? Spine 2014, 39, 1339–1344. [Google Scholar] [CrossRef]
- Griffith, J.F.; Huang, J.; Law, S.-W.; Xiao, F.; Leung, J.C.S.; Wang, D.; Shi, L. Population reference range for developmental lumbar spinal canal size. Quant. Imaging Med. Surg. 2016, 6, 671–679. [Google Scholar] [CrossRef] [Green Version]
- D’Souza, S.W.; Black, P.; Richards, B. Smoking in pregnancy: Associations with skinfold thickness, maternal weight gain, and fetal size at birth. Br. Med. J. (Clin. Res. Ed.) 1981, 282, 1661–1663. [Google Scholar] [CrossRef] [Green Version]
- McCormick, M.C. The contribution of low birth weight to infant mortality and childhood morbidity. N. Engl. J. Med. 1985, 312, 82–90. [Google Scholar] [CrossRef]
- Monier, A.; Omoumi, P.; Schizas, S.; Becce, F.; Schizas, C. Dimensional changes of cervical and lumbar bony spinal canals in one generation in Western Switzerland: A computed tomography study. Eur. Spine J. 2017, 26, 345–352. [Google Scholar] [CrossRef]
- Koo, T.K.; Li, M. A Guideline of Selecting and Reporting Intraclass Correlation Coefficients for Reliability Research. J. Chiropr. Med. 2016, 15, 155–163. [Google Scholar] [CrossRef] [Green Version]
- Nicklas, T.; Webber, L.S.; Srinivasan, S.R.; Berenson, G.S. Secular trends in dietary intakes and cardiovascular risk factors of 10-y-old children: The Bogalusa Heart Study (1973–1988). Am. J. Clin. Nutr. 1993, 57, 930–937. [Google Scholar] [CrossRef]
- Jeffrey, J.E.; Campbell, D.M.; Golden, M.H.; Smith, F.W.; Porter, R.W. Antenatal factors in the development of the lumbar vertebral canal: A magnetic resonance imaging study. Spine 2003, 28, 1418–1423. [Google Scholar] [CrossRef]
- Wang, M.; Wang, Z.-P.; Gong, R.; Zhao, Z.-T. Maternal smoking during pregnancy and neural tube defects in offspring: A meta-analysis. Childs Nerv. Syst. 2014, 30, 83–89. [Google Scholar] [CrossRef]
- Hitchman, S.C.; Fong, G.T. Gender empowerment and female-to-male smoking prevalence ratios. Bull World Health Organ. 2011, 89, 195–202. [Google Scholar] [CrossRef]
- Papp, T.; Porter, R.W.; Craig, C.E.; Aspden, R.; Campbell, D.M. Significant antenatal factors in the development of lumbar spinal stenosis. Spine 1997, 22, 1805–1810. [Google Scholar] [CrossRef]
- Baird, P.A.; Sadovnick, A.; Yee, I. Maternal age and birth defects: A population study. Lancet 1991, 337, 527–530. [Google Scholar] [CrossRef] [PubMed]
- Roenneberg, T.; Kuehnle, T.; Pramstaller, P.P.; Ricken, J.; Havel, M.; Guth, A.; Merrow, M. A marker for the end of adolescence. Curr. Biol. 2004, 14, R1038–R1039. [Google Scholar] [CrossRef] [PubMed] [Green Version]
- Ursu, T.R.; Porter, R.; Navaratnam, V. Development of the lumbar and sacral vertebral canal in utero. Spine 1996, 21, 2705–2708. [Google Scholar] [CrossRef]
- Chazono, M.; Tanaka, T.; Kumagae, Y.; Sai, T.; Marumo, K. Ethnic differences in pedicle and bony spinal canal dimensions calculated from computed tomography of the cervical spine: A review of the English-language literature. Eur. Spine J. 2012, 21, 1451–1458. [Google Scholar] [CrossRef] [PubMed] [Green Version]
- Eisenstein, S. The morphometry and pathological anatomy of the lumbar spine in South African negroes and caucasoids with specific reference to spinal stenosis. J. Bone Jt. Surg. Br. 1977, 59, 173–180. [Google Scholar] [CrossRef] [Green Version]
- Böker, T.; Vanem, T.T.; Pripp, A.H.; Rand-Hendriksen, S.; Paus, B.; Smith, H.-J.; Lundby, R. Dural ectasia in Marfan syndrome and other hereditary connective tissue disorders: A 10-year follow-up study. Spine J. 2019, 19, 1412–1421. [Google Scholar] [CrossRef] [Green Version]
- Mesfin, A.; Ahn, N.U.; Carrino, J.A.; Sponseller, P.D. Ten-year clinical and imaging follow-up of dural ectasia in adults with Marfan syndrome. Spine J. 2013, 13, 62–67. [Google Scholar] [CrossRef]


| Decade | Mean CSA ± SD (mm2) | Mean CSA − 2 SD (mm2) | Median CSA (IQR) (mm2) | Lower Quartile CSA (25th Percentile, Q1) (mm2) |
|---|---|---|---|---|
| 1930s | 302.6 ± 43.4 | 215.8 | 302 (54) | 270 |
| 1940s | 294.4 ± 45.7 | 203.0 | 294 (58) | 266 |
| 1950s | 291.7 ± 50.4 | 190.9 | 287 (68) | 252 |
| 1960s | 290.5 ± 46.2 | 198.1 | 284.5 (56) | 260 |
| 1970s | 282.0 ± 41.5 | 199.0 | 274 (54) | 251 |
| 1980s | 277.2 ± 39.9 | 197.4 | 274 (52) | 248 |
| 1990s | 275.3 ± 37.5 | 200.3 | 267 (52) | 249 |
| Decade | Mean CSA ± SD (mm2) | Mean CSA − 2 SD (mm2) | Median CSA (IQR) (mm2) | Lower Quartile CSA (25th Percentile, Q1) (mm2) |
|---|---|---|---|---|
| 1930s | 323.3 ± 61.8 | 199.7 | 308 (96) | 275.5 |
| 1940s | 314.2 ± 65.7 | 182.8 | 306 (88) | 269 |
| 1950s | 315.7 ± 77.3 | 166.1 | 302 (96) | 263.5 |
| 1960s | 306.7 ± 67.8 | 171.1 | 297 (89) | 255 |
| 1970s | 302.8 ± 59.3 | 184.2 | 298 (80) | 260.5 |
| 1980s | 298.1 ± 53.0 | 192.1 | 297 (71) | 261.5 |
| 1990s | 294.5 ± 57.0 | 180.5 | 286 (84) | 251.5 |
| Decade | 1930s | 1940s | 1950s | 1960s | 1970s | 1980s | 1990s |
|---|---|---|---|---|---|---|---|
| 1930s | |||||||
| 1940s | 0.65 | ||||||
| 1950s | 0.34 | 0.99 | |||||
| 1960s | 0.22 | 0.99 | 1.00 | ||||
| 1970s | 0.001 | 0.17 | 0.49 | 0.64 | |||
| 1980s | <0.001 | 0.01 | 0.07 | 0.12 | 0.97 | ||
| 1990s | <0.001 | 0.002 | 0.02 | 0.04 | 0.83 | 1.00 |
| Decade | 1930s | 1940s | 1950s | 1960s | 1970s | 1980s | 1990s |
|---|---|---|---|---|---|---|---|
| 1930s | |||||||
| 1940s | 0.88 | ||||||
| 1950s | 0.95 | 1.00 | |||||
| 1960s | 0.29 | 0.95 | 0.90 | ||||
| 1970s | 0.09 | 0.70 | 0.59 | 0.99 | |||
| 1980s | 0.01 | 0.28 | 0.21 | 0.91 | 0.99 | ||
| 1990s | 0.002 | 0.08 | 0.06 | 0.63 | 0.91 | 0.99 |
Disclaimer/Publisher’s Note: The statements, opinions and data contained in all publications are solely those of the individual author(s) and contributor(s) and not of MDPI and/or the editor(s). MDPI and/or the editor(s) disclaim responsibility for any injury to people or property resulting from any ideas, methods, instructions or products referred to in the content. |
© 2023 by the authors. Licensee MDPI, Basel, Switzerland. This article is an open access article distributed under the terms and conditions of the Creative Commons Attribution (CC BY) license (https://creativecommons.org/licenses/by/4.0/).
Share and Cite
Maeder, B.; Becce, F.; Kehtari, S.; Monier, A.; Chaboudez, E.; Rothenfluh, D.A.; Schizas, C.; Hajdu, S.D. Evolution of the Cross-Sectional Area of the Osseous Lumbar Spinal Canal across Decades: A CT Study with Reference Ranges in a Swiss Population. Diagnostics 2023, 13, 734. https://doi.org/10.3390/diagnostics13040734
Maeder B, Becce F, Kehtari S, Monier A, Chaboudez E, Rothenfluh DA, Schizas C, Hajdu SD. Evolution of the Cross-Sectional Area of the Osseous Lumbar Spinal Canal across Decades: A CT Study with Reference Ranges in a Swiss Population. Diagnostics. 2023; 13(4):734. https://doi.org/10.3390/diagnostics13040734
Chicago/Turabian StyleMaeder, Benoit, Fabio Becce, Sam Kehtari, Arnaud Monier, Etienne Chaboudez, Dominique A. Rothenfluh, Constantin Schizas, and Steven D. Hajdu. 2023. "Evolution of the Cross-Sectional Area of the Osseous Lumbar Spinal Canal across Decades: A CT Study with Reference Ranges in a Swiss Population" Diagnostics 13, no. 4: 734. https://doi.org/10.3390/diagnostics13040734