Article

Phylogeographical Analysis of the Freshwater Gudgeon Huigobio chenhsienensis (Cypriniformes: Gobionidae) in Southern China

Ministry of Education Key Laboratory for Biodiversity Science and Ecological Engineering, Coastal Ecosystems Research Station of the Yangtze River Estuary, Institute of Biodiversity Science and Institute of Eco-Chongming, School of Life Sciences, Fudan University, Shanghai 200082, China
*
Author to whom correspondence should be addressed.
Life 2022, 12(7), 1024; https://doi.org/10.3390/life12071024
Submission received: 26 May 2022 / Revised: 17 June 2022 / Accepted: 6 July 2022 / Published: 9 July 2022
(This article belongs to the Section Diversity and Ecology)

Abstract

:
The freshwater gudgeon Huigobio chenhsienensis (Cypriniformes: Gobionidae) is a small fish endemic to southern China. In this study, we used mitochondrial cytochrome b gene (Cytb), from wide-ranging samplings of H. chenhsienensis from the Ou River (the central of southern China) to the Yangtze River Basin (the northernmost part of southern China) to explore genetic variations and the evolutionary history of H. chenhsienensis in southern China. In total, 66 haplotypes were identified from Cytb sequences of 142 H. chenhsienensis individuals, which could be divided into lineages A, B, and C with divergence times of ~4.24 Ma and ~3.03 Ma. Lineage A was distributed in the lower reaches of the Yangtze River, the Oujiang River, and the Jiao River, lineage B was distributed in the Qiantang River and the Cao’e River, whereas lineage C was restricted to the Poyang Lake drainage from the middle reaches of the Yangtze River. Lineage A could be subdivided into sub-lineages A-I, A-II, A-III, and A-IV, with divergence times of 1.30, 0.97, and 0.44 Ma. Lineage C could be subdivided into sub-lineages C-I and C-II, with a divergence time of 0.85 Ma. Our findings indicate that climate change during the Pliocene and Pleistocene eras, as well as the limited dispersal ability of H. chenhsienensis, have been major drivers for shaping the phylogeographical patterns of H. chenhsienensis.

1. Introduction

Phylogeography focuses on the geographic distributions of inter- and intraspecific lineages, as well as the historical processes that have affected their evolution [1,2]. Freshwater fish in contemporary isolated drainages are often the products of historical river evolutions. Therefore, phylogeographical studies of freshwater fish are significant for understanding the historical reorganization or rearrangements of rivers within and among drainages [3,4,5,6]. The genetic diversity observed within a species is a key facet of biodiversity that reflects the evolutionary history and adaptability of a species as a whole, or its constituent populations [7,8].
Grant and Bowen [9] classified four categories of genetic diversity patterns according to levels of polymorphism for haplotypes and nucleotides. They defined high or low haplotype polymorphism (h) as h ≥ 0.5 or h < 0.5, and high or low nucleotide polymorphism (π) as π ≥ 0.005 or π < 0.005. The Yangtze River is the northern boundary for freshwater fish distributed in southern China [10]. Previous studies (Table S1) have shown two categories of genetic diversity for freshwater fish in southern China, i.e., type II (high h value and low π value) and type IV (high h value and high π value), as defined by Grant and Bowen [9]. The potential formation mechanism of type II cases is a genetic bottleneck followed by rapid population expansion [9]. However, widespread climate oscillations in the Pleistocene and secondary contacts resulting from population expansions after the glacial period may have shaped the type IV genetic diversity pattern [11].
Based on the geographical distribution of lineages and the degree of genetic differentiation, Avise [12] summarized five categories of phylogeographic patterns as follows: “Deep gene tree, major lineages allopatric” (pattern I), “Deep gene tree, major lineages broadly sympatric” (pattern II), “Shallow gene tree, lineages allopatric” (pattern III), “Shallow gene tree, lineages sympatric” (pattern IV), and “Shallow gene tree, lineage distributions varied” (pattern V). Prior studies on freshwater fish in southern China (Table S2) have shown three categories of phylogeographic patterns. The main driver of pattern I is the long-term isolation of drainages resulting from biogeographic barriers formed by geological tectonic movement [13,14,15]. The main driver of pattern II is river capture or historical connections of the river facilitated by sea level fall during the Pleistocene glacial period [16,17]. Pattern V is relatively rare in nature, and is attributed to the low contemporary gene flow between populations which have historically been closely connected [12,18]. Although Chinese ichthyologists have carried out phylogeographical studies on a variety of fish in southern drainages, it is still necessary to add phylogeographical cases of fish species in the above area so that more evidence can be accumulated to understand the evolutionary processes that generate and maintain intraspecific genetic variation, and lay a scientific foundation for the effective management and rational protection of genetic resources for freshwater fish in China.
Huigobio chenhsienensis Fang 1938 is classified under the order Cypriniformes, family Gobionidae, subfamily Gobioninae, and genus Huigobio [19,20]. It is a species endemic to southern China, and is distributed from the Ou River to the Yangtze River [20,21,22,23]. H. chenhsienensis is small (standard length of less than 8 cm) and usually inhabits the upper reaches of streams, feeding mainly on benthic algae [21,22,24]. The small body size and stream headwater habitats may indicate the potential limited dispersal ability of H. chenhsienensis. In addition to H. chenhsienensis, the genus Huigobio comprises two other species: H. exilicauda Jiang and Zhang 2013 and H. heterocheilus Sun, Li, Tang and Zhao 2022. H. exilicauda is distributed in the Pearl River, whereas H. heterocheilus is found in the Xiang River, a tributary of Dongting Lake drainage in the middle reaches of the Yangtze River [22,23].
In this study, mitochondrial cytochrome b gene (Cytb) sequences were obtained from samples covering the distribution drainages of H. chenhsienensis. Based on analyses of phylogeny, genetic structure, and population history, we discuss the roles of river evolution and paleoclimatic events in the formation of phylogeographic patterns of H. chenhsienensis in southern China.

2. Materials and Methods

2.1. Sample Collection

From November 2011 to September 2019, 142 specimens of H. chenhsienensis were collected from the Ou River, Jiao River, Qiantang River, Cao’e River, and Yangtze River, using small set nets and gill nets by ourselves or with help from local fishermen. There are a total of 22 localities, with 1 to 18 specimens for each locality (Figure 1 and Table 1). In order to take into account fish euthanasia, the experimental fish were anesthetized to lose consciousness using the Eugenol. First, the Eugenol (purity ≥ 99.99%) was diluted into an aqueous solution with a concentration of 0.25 mL·L−1. Second, experimental fish were placed in the aqueous solution of the Eugenol until they were anesthetized to lose consciousness. Third, the anesthetized fish were fixed in 75% and then transferred to 95% ethanol for long-term storage. All specimens collected in this study were deposited in the Zoological Museum of Fudan University.

2.2. Sequence Obtaining and Processing

Genomic DNA was extracted from muscle tissue using a salting-out extraction method [25]. A pair of primers (CGluF: 5′-TCTTGCTCGGAYTTTAACCGAG-3′, CThrR: 5′-TCTTGCTCGGAYTTTAACCGAG-3′) [26] were used for PCR amplification of Cytb gene. The PCR amplification was conducted in a 30 μL reaction volume which contained 1.2 μL of template DNA, 0.6 μL of each primers, 15.0 μL of 2 × Es Taq MasterMix, and 12.6 μL of ddH2O. The reaction conditions of PCR amplification for Cytb gene were the same as Chai and Fu [27] except that the primers were annealed at 58 °C. Moreover, the primers and annealing temperature for PCR amplification of the mitochondrial genome used in this study are listed in Table S3. The PCR products were subsequently purified and sequenced by Jieli Biology Co., Ltd., Shanghai, China.
The obtained sequences were assembled in Sequencher v5.4 (Gene Codes, Ann Arbor, MI, USA) and supplemented with manual correction for incorrect base recognition of the chromatograms. Sequence alignment was performed with the default algorithm under MAFFT v7.427 [28]. Amino acid translation was performed in DAMBE v7.2.43 to check whether there were terminators in the sequences [29]. The newly generated Cytb sequences were imported into DnaSP v6.12.01 to obtain haplotype data [30]. Basic information on the Cytb sequence was acquired using MEGA (Molecular Evolutionary Genetics Analysis) version 7.0.26 (Arizona State University, Philadelphia, PA, USA) [31].

2.3. Phylogeographic Analysis and Divergence Time Estimation

The Cytb time tree of H. chenhsienensis was reconstructed in BEAST v2.6.6 software (University of Auckland, Auckland, New Zealand) [32] based on haplotype sequences. Taking full account of the lack of fossil information on Huigobio for estimating the differentiation time of H. chenhsienensis, a mitochondrial genome time tree of Huigobio and its close relatives was thus developed to obtain the differentiation time of H. chenhsienensis and H. heterocheilus as the secondary calibration point by using two fossil species of Gobionidae with complete skeletons and corresponding stratigraphic age information (data sources and results are shown in Table S4 and Figure S1). The best base substitution model for the 13 mitochondrial protein genes was obtained based on the automatic search function of the bModelTest module in BEAST v2.6.6, the Birth–Death model was selected, and a tree model was set at the same time [33]. The first fossil species corresponded to the divergence node of Gobionidae and Acheilognathidae [34]. This fossil species, which occurred in the Middle Eocene (50.5–42.0 Ma) [35] is †Palaeogobio zhongyuanensi [36], i.e., calibration point 1 (C1), and was set to LogNormal distribution, μ = 3.82, σ = 0.05. The second fossil species corresponded to the divergence node of Gnathopogon and Coreoleuciscus [37]. This fossil species occurred in the Miocene (20.4–15.0 Ma) [38] and is †Gnathopogon macrocephala [36], i.e., calibration point 2 (C2), and was set to LogNormal distribution, μ = 2.86, σ = 0.078. The molecular clock was set as a relaxed clock. Two independent runs of 400 million generations with sampling every 10,000 generations in each run were performed in the Bayesian analysis. The two runs were combined and the first 30% sampling trees were discarded as burn-in. Effective sample size (ESS) was evaluated using Tracer v1.7.0 [39]. When the ESS was greater than 200 for each parameter, the results were considered to be convergent.
To test for the geographic correspondence of haplotypes across all populations of H. chenhsienensis, the median-joining network was constructed under NETWORK v10.2.0.0 (Fluxus Technology Ltd., Colchester, England; https://www.fluxus-engineering.com, accessed on 15 January 2022). Combined with the geographical distribution and individual number of haplotypes, it was further modified in Adobe Illustrator.
The interspecific divergence time between H. chenhsienensis and H. heterocheilus was 11.66 Ma (95% HDP: 13.04–10.44 Ma), which was obtained from the time tree of the mitochondrial genome presented above and used as a secondary calibration point to infer the Cytb time tree of H. chenhsienensis. The specific settings were as follows: normal distribution, m = 11.74, s = 0.66. Using the likelihood-ratio test in DAMBE v7.2.43, the result of the molecular clock test (X2 = 96.11, d.f. = 69, p = 0.0172) did not support the molecular clock model [29], and the relaxed-clock model was set. H. heterocheilus was selected as an outgroup. The Birth–Death model was selected as a tree prior. Two independent runs of 100 million generations, with sampling every 1000 generations, were performed. The remaining settings were the same as the time tree construction above.

2.4. Genetic Structure and Population History

The genetic diversity of H. chenhsienensis was estimated, and the genetic differentiation coefficients, NST and GST, of the populations were calculated and compared with determination of the presence of a significant genetic structure using DnaSP v6.12.01 [30,40]. The total ΦST and pairwise comparison ΦST values among basins were obtained in Arlequin v3.5.1 [41]. To detect the spatial genetic structure of H. chenhsienensis populations, the maximum ΦCT value and its corresponding grouping were obtained by simulating the groupings of different populations using SAMOVA v2.0 [42]. For each lineage, Arlequin v3.5.1 was applied to conduct neutrality tests [43,44] and mismatch distribution tests with a spatial expansion model [45]. Bayesian skyline plot analysis of each lineage was implemented in BEAST v2.6.6 [32], the Relaxed Clock Log-Normal distribution model was selected, and the tree model was set as the Coalescent Bayesian Skyline. The best base substitution model used for the analysis was obtained from jModeltest v2 [46]. The Cytb mutation rate (1.30% substitutions per site per million years) obtained from the time tree of Cytb haplotypes of H. chenhsienensis was used in the reconstruction of the Bayesian skyline plot.

2.5. Ancestral Area Reconstruction

The ancestral area reconstruction of H. chenhsienensis was performed by loading the BioGeoBEARS package version 0.2.1 [47] in the R v3.5.0 program. The analysis used the Cytb haplotypes time-calibrated tree of H. chenhsienensis as the input tree and the basins as the geographic distribution unit. Finally, the optimal model was selected according to Akaike information criterion (AIC) to reconstruct the ancestral area of H. chenhsienensis [48].

2.6. Inferring Palaeodrainage along the Coast

Topographic and bathymetric information on a 30 arc-second interval grid at a global scale, with accuracy in meters, was retrieved from the digital elevation model (DEM) of the General Bathymetric Charge of the Oceans 2021 Grid (GEBCO_2021 Grid; http://www.gebco.net/, accessed on 10 November 2021). The maximum sea level decline during the glacial period of the Late Pleistocene was about −130 m [49,50]. Therefore, the elevation and bathymetry data of the maximum sea level retreat during the glacial period of the Late Pleistocene could be used to infer potential connections between palaeodrainages and current basins along the coast of China through the Arc Hydro Tools Box in ArcGIS v.10. The palaeodrainage reconstruction methods were performed in reference to Thomaz et al. [51] with the following steps: first, the DEM of GEBCO_2021 Grid was imported into ArcGIS v.10; secondly, the −130 m basic contours were drawn using the Contour List tool in the Surface Tools box to estimate the maximum extent of continental shelf exposure during the Pleistocene, followed by the generation of a clipped digital elevation model grid chart using the Fill, Flow Direction, Watershed, Flow Accumulation, and Stream Order tools in the Arc Hydro Tools Box. Finally, the raster streams were converted to vectors, and a visualized palaeodrainage reconstruction map was generated using the Stream to Feature tool.

3. Results

3.1. Phylogenetic Relationships and Divergence Time

A total of 66 haplotypes (Table 1, GenBank Accession: OM647979-OM648044) were detected among the Cytb sequences of 142 H. chenhsienensis specimens. All the Cytb sequences had an identical length (1140 bp), with a GC content of 41.3%, containing 184 variable sites and 161 parsimony informative sites. The time-calibrated phylogeny (Figure 2) showed that 66 Cytb haplotypes of H. chenhsienensis could be divided into lineages A (29 haplotypes), B (18 haplotypes), and C (19 haplotypes); divergence times among them were 4.24 Ma and 3.03 Ma. The lineage A could be subdivided into four sub-lineages, namely, A-I, A-II, A-III, and A-IV, which diverged from each other at 1.30, 0.97, and 0.44 Ma. The lineage C consisted of two sub-lineages, C-I and C-II, with a divergence time of 0.85 Ma.
There were 61 mutational steps between lineages A and B + C and 54 mutational steps between lineages B and C observed in the haplotype network. All 66 haplotypes were private haplotypes for each river basin (Figure 3). In lineage A, the three sub-lineages, A-I, A-II, and A-III, were only distributed in the lower reaches of the Yangtze River, whereas the sub-lineage A-IV was distributed across the lower reaches of the Yangtze River, Ou River, and Jiao River (Figure 3a). The lineage B was distributed in the Qiantang River and Cao’e River (Figure 3b). The lineage C was only distributed in Poyang Lake of the middle reaches of the Yangtze River (Figure 1 and Figure 3c), among which the sub-lineage C-I was distributed in Gan River of the Poyang Lake river system (Locality No. 20–22, as shown in Table 1 and Figure 1) and the sub-lineage C-II was distributed in Rao River, Xin River, and Xiu River of the Poyang Lake river system (Locality No. 14–19, as shown in Table 1 and Figure 1).

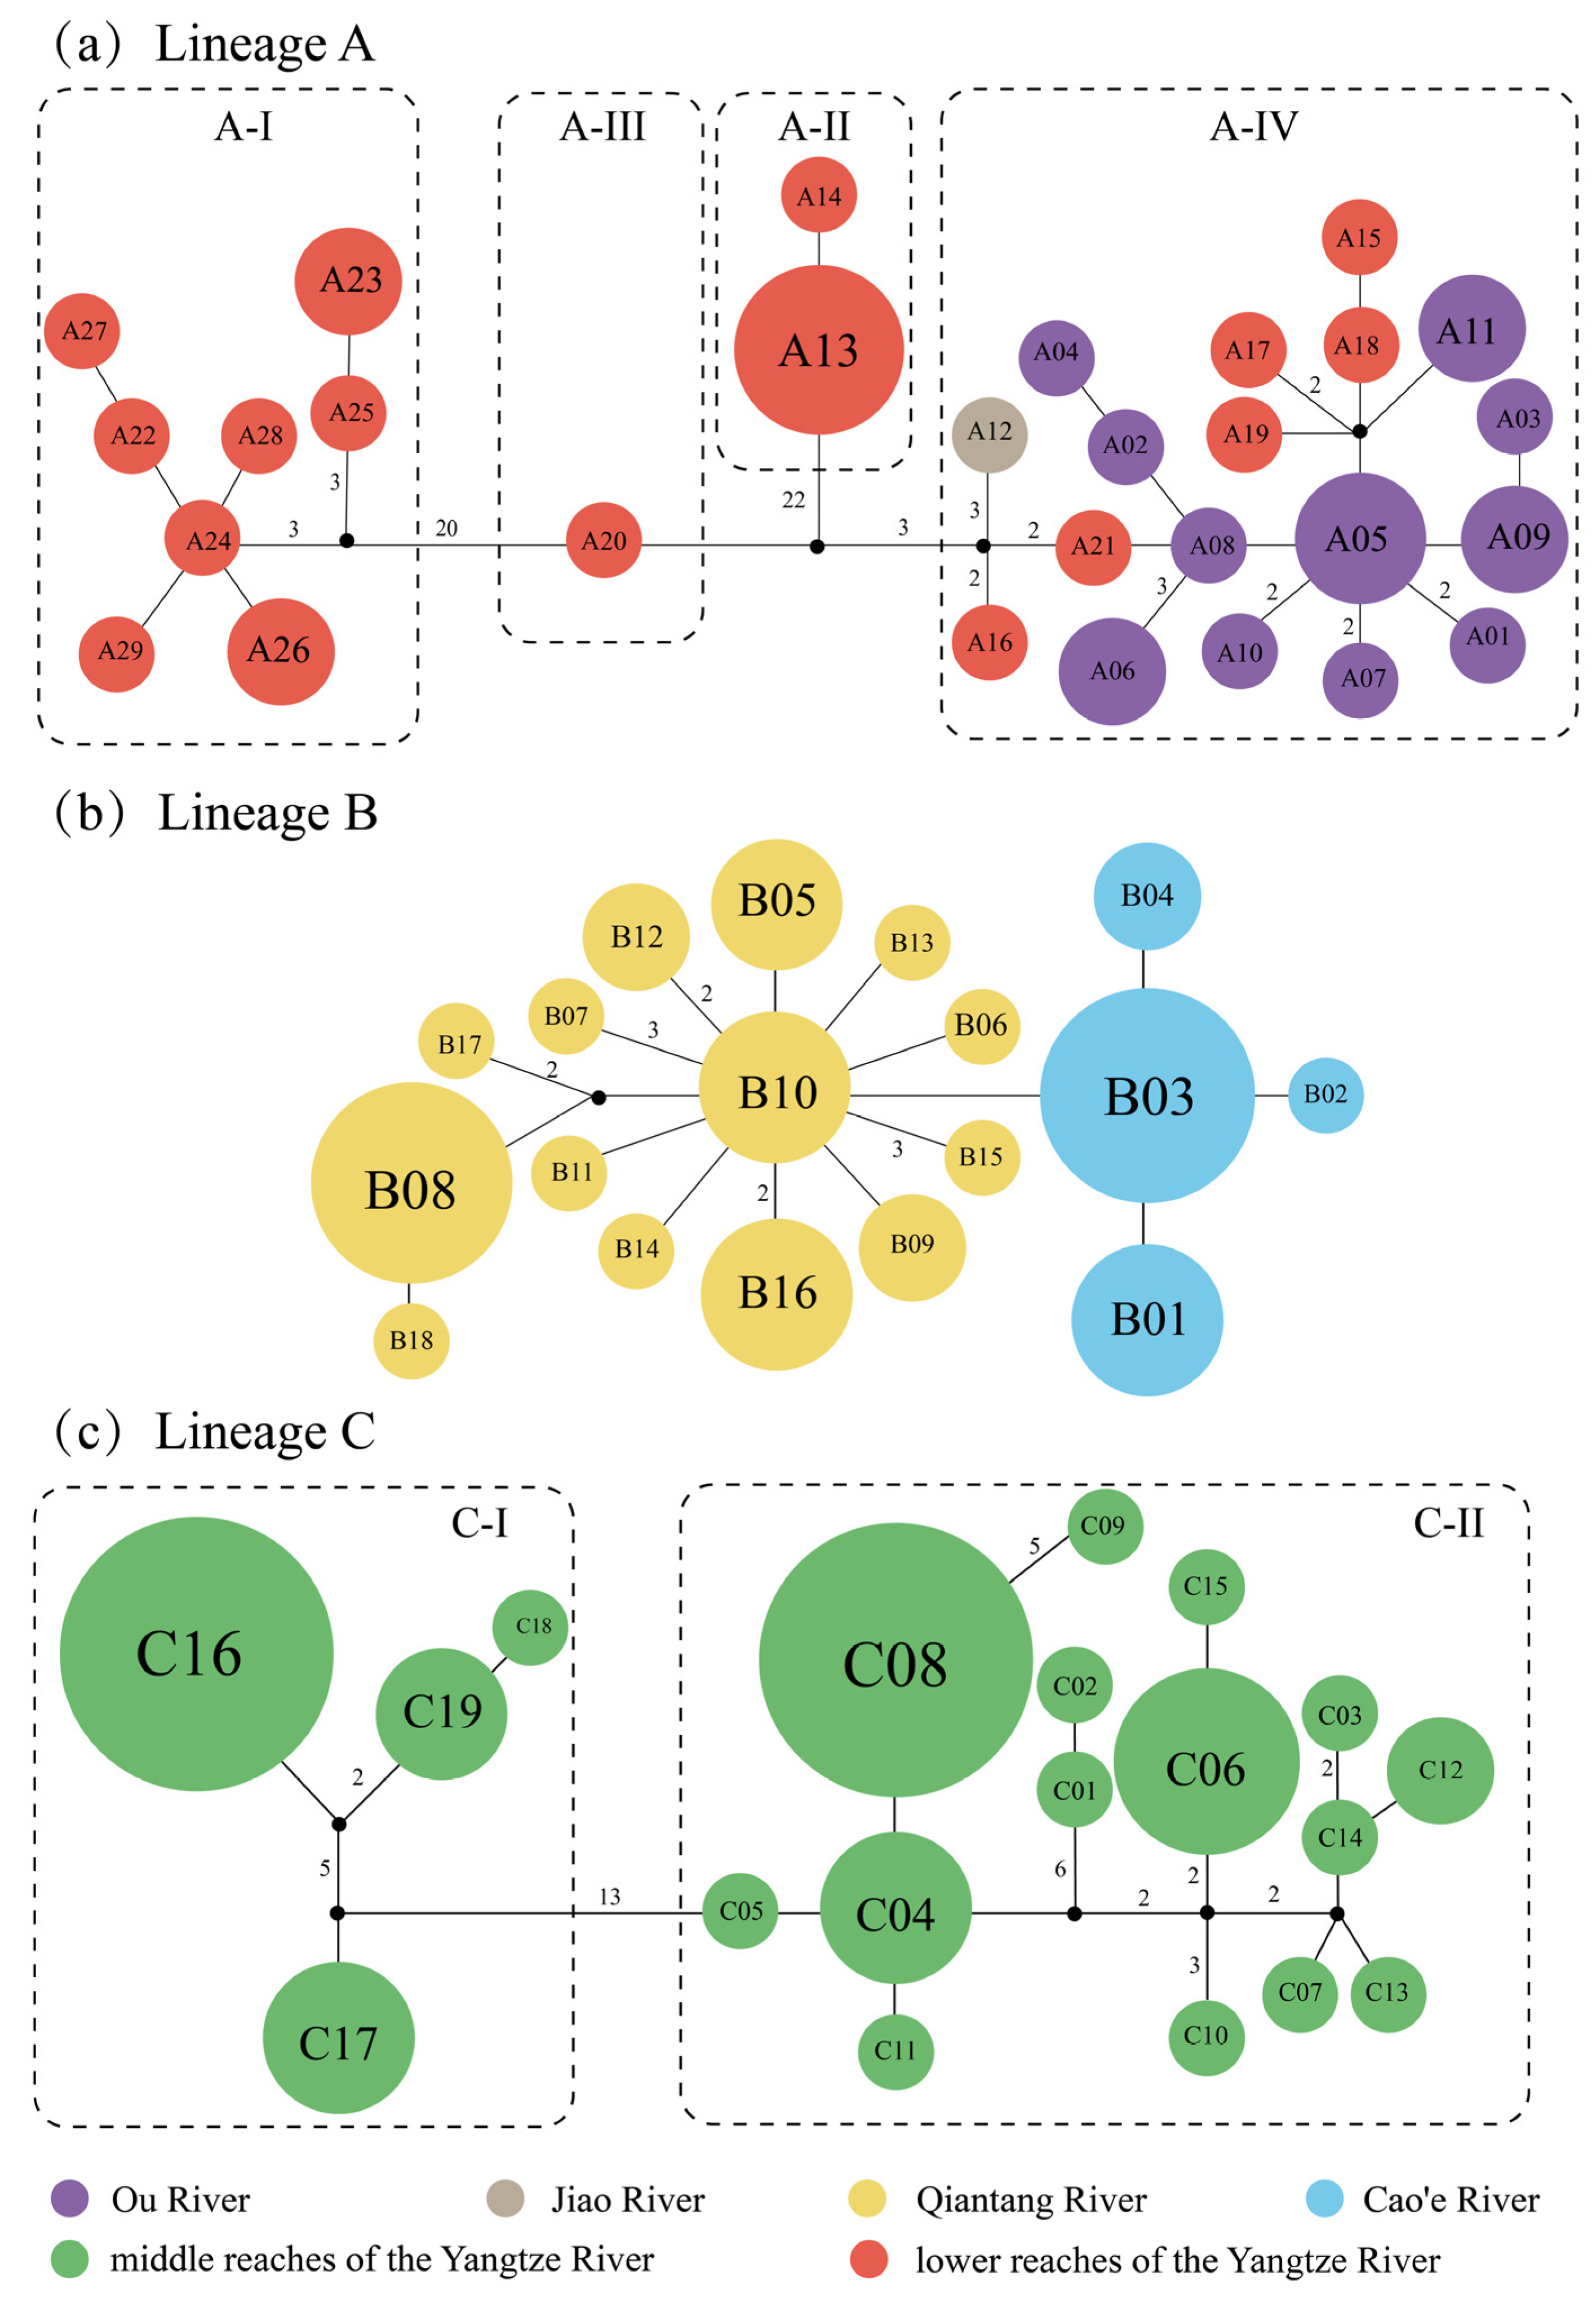
3.2. Genetic Structure

Among the distribution basins of H. chenhsienensis (excluding Jiao River with one specimen), haplotype diversity (Table 2) was highest in the Ou River (h = 0.9500) and lowest in Cao’e River (h = 0.6667); nucleotide diversity (Table 2) was highest in the Yangtze River (π = 0.0371) and lowest in Cao’e River (π = 0.0007).
Comparison between two genetic differentiation coefficients (NST > GST: NST = 0.796, GST = 0.072) indicated a significant geographic structure for H. chenhsienensis. The total ΦST among basins was 0.627 (p = 0.000), and the pairwise comparison ΦST values among basins were relatively high and significant (Table 3). The SAMOVA divided the five basins into four genetic groups as follows: Yangtze River, Qiantang River, Cao’e River, Ou River + Jiao River, where ΦCT value (=0.741) was the largest.

3.3. Demographic History

Tajima’s D value and Fu’s Fs value of lineage A for H. chenhsienensis were insignificantly positive and marginally significantly negative, respectively, and both indices were significantly negative in lineage B and insignificantly positive in lineage C (Table 4). Bimodal distributions were observed in lineages A and C, whereas lineage B exhibited a unimodal peak (Figure 4a). The Bayesian skyline plot analysis (Figure 4b) revealed that the population expansion of lineages A and B started at 0.088 Ma and 0.110 Ma, respectively; however, lineage C contracted from 0.040 Ma.

3.4. Ancestral Area Estimation

By evaluating six biogeographic models of BioGeoBEARS analyses, the DIVALIKE+J model provided an optimal fit to the data based on AIC scores (Table S5). The ancestral area reconstructions based on the optimal model supported the suggestion that the common ancestor of H. chenhsienensis was widely distributed in the middle reaches of the Yangtze River, the lower reaches of the Yangtze River, the Qiantang River, and the Cao’e River at 4.24 Ma (95% HPD: 6.05–2.62 Ma). The current geographic distribution pattern was formed after three vicariant and three dispersal events (Figure 2).

3.5. Palaeodrainage Reconstructions

Among the distribution basin of H. chenhsienensis, the reconstruction of the coastal palaeodrainages (Figure 1) showed that the Yangtze River, Qiantang River, and Cao’e River were interconnected on the exposed continental shelf during the Last Glacial Maximum, whereas the Ou River and Jiao River entered the sea independently during the same period.

4. Discussion

4.1. Phylogeographic Pattern and Processes

In this study, the lineages A, B, and C of H. chenhsienensis were separated from each other over geographic space (Figure 1), and these three lineages were linked by 54 or 61 mutational steps, demonstrating deep genetic differentiation. Thus, the phylogeographic pattern of H. chenhsienensis conformed to category I defined by Avise [12], viz., allopatric lineages with deep differentiation. East Asian monsoon studies in geology indicated that the East Asian summer monsoon intensified at about 5.0–4.2 Ma [52,53,54] and 3.7–2.9 Ma [55,56] during the Pliocene (5.333–2.58 Ma), accompanied by noticeably increased temperature and monsoon rainfall. These two intensification phases of the East Asian summer monsoon in the Pliocene coincided well with the divergence times of three lineages for H. chenhsienensis (~4.24 Ma, node 1 in Figure 2; ~3.03 Ma, node 8 in Figure 2). At the same time, the global temperature was roughly 2–4 °C warmer in the early mid-Pliocene (ca. 5–3 Ma) than at present [57], which resulted in the global sea level being approximately 10–20 m higher than today [58], suggesting that the basins within distribution regions of H. chenhsienensis were isolated from each other during that period. However, H. chenhsienensis from each basin did not form a monophyletic group (Figure 1). Hence, two noticeable climatic change events in the early mid-Pliocene may be responsible for the divergence of lineages A, B, and C and the formation of geographical patterns of H. chenhsienensis.
The lineage A of H. chenhsienensis consisted of four sub-lineages. Among them, three sub-lineages, A-I, A-II, and A-III, were only distributed in the lower reaches of the Yangtze River, whereas the sub-lineage A-IV was distributed sporadically in the Ou River, Jiao River, and the lower reaches of the Yangtze River (Figure 3a). Paleoclimate studies of East Asia showed that the East Asian summer monsoon weakened and the climate became cold and dry at about 1.8–1.2 Ma and 0.9–0.3 Ma during the Pleistocene (2.58–0.0117 Ma), whereas the East Asian summer monsoon strengthened and the climate turned warm and wet at 1.2–0.9 Ma [59]. In addition, all 29 haplotypes of the lineage A were private to each sampling site, implicating the low dispersal ability of H. chenhsienensis, inhabiting the upper stream. The geographical distribution and the divergence time (1.30, 0.97, and 0.44 Ma; nodes 2, 4, and 6 in Figure 2, respectively) of the four sub-lineages of lineage A in H. chenhsienensis suggested that the low dispersal ability of this species, rather than climate change in the Pleistocene, may be the main driving force of sub-lineage splits and geographical pattern formation of lineage A. Combining phylogenetic relationships of the four sub-lineages of lineage A (Figure 2) and phylogenetic nesting of haplotypes from the Ou River and the Jiao River within haplotypes from the lower reaches of the Yangtze River (Figure 3a), it was suggested that the lineage A originating from the lower reaches of the Yangtze River and H. chenhsienensis from the Ou River and Jiao River in the sub-lineage A-IV came from the dispersion of the lower reaches of the Yangtze River population. The result of reconstructing palaeodrainages in this study indicated that the Yangtze River, Ou River, and Jiao River met the sea independently during the Pleistocene glacial period, implying that these three basins were unconnected when the sea level dropped at that time. The time of most recent common ancestor of sub-lineage A-IV was 0.28 Ma (node 7 in Figure 2), during which the global sea level dropped about 60 m [60], but the climate was characterized by warmth and humidity [59,61]. Previous studies have shown that seasonal flooding could facilitate the dispersion of fish through a temporary connection between rivers that meet the sea independently [62,63]. Consequently, the seasonal floods during the late Middle Pleistocene may be the reason for the colonization of H. chenhsienensis from the lower reaches of the Yangtze River to the Ou River and Jiao River.
The lineage B of H. chenhsienensis was distributed in the Qiantang River and Cao’e River (Figure 1). The 18 haplotypes of this lineage were all restricted to each basin, and the haplotypes in the two basins were linked by only a single mutational step (Figure 3b), which revealed a recent historical connection between the Qiantang River and Cao’e River. The TMRCA of lineage B was 0.25 Ma (node 9 in Figure 2), which falls into the late mid-Pleistocene glacial period, and the global sea level dropped about 80 m at that time [60]. Palaeodrainage reconstruction in this study suggested that the Qiantang River and Cao’e River could be interconnected through palaeodrainages as the sea level dropped during the glacial period (Figure 1). Therefore, a sea level fall during the late mid-Pleistocene glacial period prompted the historical connection between the Qiantang River and Cao’e River, and then drove a close relationship between haplotypes of the two basins from lineage B of H. chenhsienensis.
The lineage C of H. chenhsienensis comprises two sub-lineages. The sub-lineage C-I was distributed in the Gan River of Poyang Lake drainage (sampling site 20–22), whereas the sub-lineage C-II was distributed in the Rao River (sampling site 14), Xin River (sampling site 15), and Xiu River (sampling site 16–19) of the Poyang Lake drainage. All 19 haplotypes from the two sub-lineages were private haplotypes for each river in the Poyang Lake drainage (Table 1), which implies low gene flow among rivers for the lineage C of H. chenhsienensis inhabiting the Poyang Lake drainage. The divergence time between sub-lineages C-I and C-II was 0.85 Ma (node 10 in Figure 2), when the climate of East Asia was cold and dry [59,64]. Consequently, climatic change in the late Early Pleistocene and the low dispersal ability of H. chenhsienensis may have driven the lineage divergence and geographic pattern of lineage C.

4.2. Genetic Structure and Historical Demography

The fixation coefficient of genetic differentiation, NST, was much higher than GST, indicating that the geographical environment was closely related to lineage differentiation in H. chenhsienensis. Among basins, high levels of genetic variation detected in pairwise comparison and lack of shared haplotypes reflected limited gene flow in H. chenhsienensis. A high genetic differentiation of fish populations from different basins was also observed in the Yangtze River and its southern drainage systems, for example, Aphyocypris normalis [14] and Hemibagrus guttatus [65]. An increasing number of cases suggested that smaller freshwater fish inhabiting the middle and lower water column have poor dispersal ability, which is apt to display genetic differentiation, thus resulting in a pronounced genetic structure [66,67,68,69,70]. Therefore, the spatial niche for H. chenhsienensis which inhabits the upper reaches of streams and the low dispersal ability owing to its small size (<8 cm) may be responsible for the strong spatial genetic structure of H. chenhsienensis.
In this study, the pattern of genetic diversity of H. chenhsienensis in the Yangtze River Basin showed high haplotype polymorphism (h) and high nucleotide polymorphism (π), which may be ascribed to the simultaneous occurrence of lineages A and C. However, there was only a single lineage (A or B) in the Ou River, Qiantang River, or Cao’e River, and the pattern of genetic diversity of H. chenhsienensis in each basin was observed as having high h values and low π values, which suggested that H. chenhsienensis populations in these basins may have suffered from genetic bottlenecks, followed by rapid population expansions [9]. This speculation was further supported by the borderline significant or significantly negative Fu’s Fs values of lineages A and B, respectively, as well as the unimodal peak in mismatch distribution of the lineage B. Moreover, we detected that the population expansions of lineages A and B started at ~0.088 Ma or ~0.110 Ma, respectively, but the lineage C experienced population contraction from ~0.040 Ma to the present (Figure 4b). Paleoclimate studies of East Asia demonstrated that from 0.110 Ma to 0.040 Ma, there was an interglacial to glacial transition stage in the Late Pleistocene, when the global sea level was 40–50 m lower than the present day, and the climate was cold and dry [71]. Therefore, this study concluded that the cross-basin spatial distribution of lineages A and B of H. chenhsienensis was the reason for rapid population growth after the lower-temperature period and reduced rainfall during the Late Pleistocene, whereas the spatial distribution of the lineage C was confined to the Poyang Lake drainage system, causing a severe population bottleneck after the experience of the dry and cold climate in the Late Pleistocene; thus, the population of lineage C had hardly recovered and is in a state of contraction.

5. Conclusions

In summary, H. chenhsienensis was composed of three lineages, exhibiting a pattern of allopatric lineages with deep divergence. The climate changes during the Pliocene and Pleistocene and the poor dispersal ability of H. chenhsienensis might be the major driving forces of its phylogeographical pattern. The Yangtze River population of H. chenhsienensis denoted high haplotype polymorphism (h) and high nucleotide polymorphism (π); other drainage populations exhibited high h and low π. During the Late Pleistocene, lineages A and B experienced population expansion, whereas lineage C suffered from severe bottleneck effects. Based on the spatial subdivision of genetic structure for H. chenhsienensis, it is suggested that the four conservation geographic units (Yangtze River, Qiantang River, Cao’e River, Jiao River + Ou River) should be classified for management.

Supplementary Materials

The following supporting information can be downloaded at: https://www.mdpi.com/article/10.3390/life12071024/s1, Figure S1: Time tree of Huigobio and its close relatives based on 13 protein-coding genes of mitochondrial genomes; Table S1: Reviews of the genetic diversity of freshwater fishes endemic to southern China revealed by mitochondrial genes; Table S2: Reviews of the phylogeographical patterns of freshwater fishes endemic to southern China revealed by mitochondrial genes; Table S3: Primers and annealing temperature used in PCR amplification of mitochondrial genomes; Table S4: Sampling localities and source of mitochondrial genome for Huigobio and outgroup taxa; Table S5: Comparisons among six models of biogeography analyses in ancestral area reconstruction of H. chenhsienensis. References [11,13,14,15,16,17,18,26,27,37,65,72,73,74,75,76,77,78,79,80,81,82,83,84,85,86,87,88,89,90,91,92,93,94,95,96,97,98,99,100,101,102,103,104,105,106] are cited in the supplementary materials.

Author Contributions

Conceptualization, C.F.; Methodology, X.Y. and X.N.; Software, X.Y., X.N. and C.F.; Validation, X.Y., X.N. and C.F.; Formal Analysis, X.Y. and X.N.; Investigation, X.Y.; Resources, C.F.; Writing—Original Draft Preparation, X.Y.; Writing—Review & Editing, X.Y., X.N. and C.F.; Visualization, X.Y.; Supervision, C.F.; Project Administration, C.F.; Funding Acquisition, C.F. All authors have read and agreed to the published version of the manuscript.

Funding

This research was funded by National Natural Science Foundation of China (grant number 31872209).

Institutional Review Board Statement

All field collection in this work was conducted in accordance with the rules of the Implementation of the Fisheries Law of the People’s Republic of China (Revised in November 2020). All animal experiments followed Laboratory animal—Guideline for ethical review of animal welfare of the National Standard of the People’s Republic of China (GB/T 35892-2018).

Informed Consent Statement

Not applicable.

Data Availability Statement

The newly generated sequences of mitochondrial Cytb gene and genomes in this study are available on GenBank (http://www.ncbi.nlm.nih.gov, accessed on 27 October 2022) with the following accession number: OM647979–OM648044 (Cytb sequences), OM743247–OM743251 (Cytb sequences) and ON316823–ON316826 (genomes sequences).

Acknowledgments

We are particularly grateful to two anonymous reviewers for their insightful comments on the manuscript. We would like to thank the members of the Biogeography Laboratory at Fudan University for their assistances in specimen collection.

Conflicts of Interest

The authors declare no conflict of interest. The funders had no role in the design of the study; in the collection, analyses, or interpretation of data; in the writing of the manuscript, or in the decision to publish the results.

References

  1. Emerson, B.C.; Hewitt, G.M. Phylogeography. Curr. Biol. 2005, 15, R367–R371. [Google Scholar] [CrossRef] [PubMed]
  2. Avise, J.C. Phylogeography: Retrospect and prospect. J. Biogeogr. 2009, 36, 3–15. [Google Scholar] [CrossRef] [Green Version]
  3. Hughes, J.M.; Schmidt, D.J.; Finn, D.S. Genes in streams: Using DNA to understand the movement of freshwater fauna and their riverine habitat. Bioscience 2009, 59, 573–583. [Google Scholar] [CrossRef]
  4. Lyons, N.J.; Val, P.; Albert, J.S.; Willenbring, J.; Gasparini, N.M. Topographic controls on divide migration, stream capture, and diversification in riverine life. Earth Surf. Dyn. 2020, 8, 893–912. [Google Scholar] [CrossRef]
  5. Lima, S.M.Q.; Berbel, W.; Vilasboa, A.; Lazoski, C.; Volpi, T.; Lazzarotto, H.; Russo, C.A.M.; Tatarenkov, A.; Avise, J.C.; Sole-Cava, A.N.M. Rio de Janeiro and other palaeodrainages evidenced by the genetic structure of an Atlantic Forest catfish. J. Biogeogr. 2021, 48, 1475–1488. [Google Scholar] [CrossRef]
  6. Barreto, S.B.; Knowles, L.L.; Mascarenhas, R.; Affonso, P.R.A.D.M.; Batalha-Filho, H. Drainage rearrangements and in situ diversification of an endemic freshwater fish genus from north-eastern Brazilian rivers. Freshw. Biol. 2022, 67, 759–773. [Google Scholar] [CrossRef]
  7. Leigh, D.M.; van Rees, C.B.; Millette, K.L.; Breed, M.F.; Schmidt, C.; Bertola, L.D.; Hand, B.K.; Hunter, M.E.; Jensen, E.L.; Kershaw, F.; et al. Opportunities and challenges of macrogenetic studies. Nat. Rev. Genet. 2021, 22, 791–807. [Google Scholar] [CrossRef]
  8. Bridle, J.; Hoffmann, A. Understanding the biology of species ranges: When and how does evolution change the rules of ecological engagement? Philos. Trans. R. Soc. B-Biol. Sci. 2022, 337, 20210027. [Google Scholar] [CrossRef]
  9. Grant, W.S.; Bowen, B.W. Shallow population histories in deep evolutionary lineages of marine fishes: Insights from sardines and anchovies and lessons for conservation. J. Hered. 1998, 89, 415–426. [Google Scholar] [CrossRef]
  10. Chai, J. Studies on Phylogenetic Relationships, Historical Biogeography and Phylogeography of Squalidus Fishes. Ph.D. Thesis, Fudan University, Shanghai, China, 2020. (In Chinese). [Google Scholar]
  11. Wu, X.Y.; Luo, J.; Huang, S.; Chen, Z.M.; Xiao, H.; Zhang, Y.P. Molecular Phylogeography and evolutionary history of Poropuntius huangchuchieni (Cyprinidae) in Southwest China. PLoS ONE 2013, 8, e79975. [Google Scholar] [CrossRef] [Green Version]
  12. Avise, J.C. Phylogeography: The History and Formation of Species; Harvard University Press: Cambridge, MA, USA, 2000; pp. 135–147. ISBN 0-674-66638-0. [Google Scholar]
  13. Chen, X.L.; Chiang, T.Y.; Lin, H.D.; Zheng, H.; Shao, K.; Zhang, H.S.; Shao, K.T.; Zhang, Q.; Hsu, K.C. Mitochondrial DNA phylogeography of Glyptothorax fokiensis and Glyptothorax hainanensis in Asia. J. Fish Biol. 2007, 70, 75–93. [Google Scholar] [CrossRef]
  14. Huang, X.X.; Hsu, K.C.; Kang, B.; Kuo, P.H.; Tsai, W.H.; Liang, C.; Lin, H.; Wang, W.K. Population structure of Aphyocypris normalis: Phylogeography and systematics. ZooKeys 2019, 872, 77–90. [Google Scholar] [CrossRef] [PubMed]
  15. Cao, L.; Liang, X.F.; Tang, W.Q.; Zhao, J. Phylogeography of Coreoperca whiteheadi (Perciformes: Coreoperca) in China based on mitochondrial and nuclear gene sequences. Biochem. Syst. Ecol. 2013, 50, 223–231. [Google Scholar] [CrossRef]
  16. Yang, L.; Mayden, R.L.; He, S.P. Population genetic structure and geographical differentiation of the Chinese catfish Hemibagrus macropterus (Siluriformes, Bagridae): Evidence for altered drainage patterns. Mol. Phylogenet. Evol. 2009, 51, 405–411. [Google Scholar] [CrossRef] [PubMed]
  17. Zhou, T.Q.; Lin, H.D.; Hsu, K.C.; Kuo, P.H.; Wang, W.K.; Tang, W.Q.; Liu, D.; Yang, J.Q. Spatial genetic structure of the cyprinid fish Onychostoma lepturum on Hainan Island. Mitochondrial DNA A 2017, 28, 901–908. [Google Scholar] [CrossRef]
  18. Yang, J.Q.; Hsu, K.C.; Liu, Z.Z.; Su, L.W.; Kuo, P.H.; Tang, W.Q.; Zhou, Z.C.; Liu, D.; Bao, B.L.; Lin, H.D. The population history of Garra orientalis (Teleostei: Cyprinidae) using mitochondrial DNA and microsatellite data with approximate Bayesian computation. BMC Evol. Biol. 2016, 16, 73. [Google Scholar] [CrossRef] [Green Version]
  19. Tan, M.; Armbruster, J.W. Phylogenetic classification of extant genera of fishes of the order Cypriniformes (Teleostei: Ostariophysi). Zootaxa 2018, 4476, 6–39. [Google Scholar] [CrossRef] [Green Version]
  20. Yang, X.S. Systematics and Biogeography of Microphysogobio Sensu Lato in the Family Gobionidae. Ph.D. Thesis, Fudan University, Shanghai, China, 2021. (In Chinese). [Google Scholar]
  21. Yue, P.Q. Gobioninae. In Fauna Sinica, Osteichthyes: Cypriniformes (II); Chen, Y.Y., Ed.; Science Press: Beijing, China, 1998; pp. 262–389. ISBN 7-03-005824-0. (In Chinese) [Google Scholar]
  22. Jiang, Z.G.; Zhang, E. Molecular evidence for taxonomic status of the gudgeon genus Huigobio Fang, 1938 (Teleostei: Cypriniformes), with a description of a new species from Guangdong Province, South China. Zootaxa 2013, 3731, 171–182. [Google Scholar] [CrossRef]
  23. Sun, Z.X.; Li, X.J.; Tang, W.Q.; Zhao, Y.H. A new species of the gudgeon genus Huigobio Fang, 1938 (Cypriniformes: Cyprinidae) from the Yangtze River Basin, southern China. Zool. Res. 2022, 43, 33–39. [Google Scholar] [CrossRef]
  24. Mao, J.R. Cypriniformes. In Fauna of Zhejiang-Fresh Water Fishes; Mao, J.R., Xu, S.S., Eds.; Zhejiang Scientific and Technical Press: Hangzhou, China, 1991; pp. 136–137. ISBN 7-5341-0306-1. (In Chinese) [Google Scholar]
  25. Miller, S.A.; Dykes, D.D.; Polesky, H.F. A simple salting out procedure for extracting DNA from human nucleated cells. Nucleic Acids Res. 1988, 16, 1215. [Google Scholar] [CrossRef] [Green Version]
  26. Yin, W. Studies on Phylogeny and Biogeography of the Opsariichthine Fishes. Ph.D. Thesis, Fudan University, Shanghai, China, 2015. [Google Scholar]
  27. Chai, J.; Fu, C.Z. Three mitochondrial genomes of freshwater fishes in the genus Squalidus (Cypriniformes: Gobionidae). Mitochondrial DNA Part B Resour. 2020, 5, 3761–3763. [Google Scholar] [CrossRef] [PubMed]
  28. Katoh, K.; Standley, D.M. MAFFT multiple sequence alignment software version 7: Improvements in performance and usability. Mol. Biol. Evol. 2013, 30, 772–780. [Google Scholar] [CrossRef] [PubMed] [Green Version]
  29. Xia, X.H. DAMBE6: New tools for microbial genomics, phylogenetics, and molecular evolution. J. Hered. 2017, 108, 431–437. [Google Scholar] [CrossRef] [PubMed] [Green Version]
  30. Rozas, J.; Ferrer-Mata, A.; Sánchez-DelBarrio, J.C.; Guirao-Rico, S.; Librado, P.; Ramos-Onsins, S.E.; Sánchez-Gracia, A. DnaSP 6: DNA sequence polymorphism analysis of large data sets. Mol. Biol. Evol. 2017, 34, 3299–3302. [Google Scholar] [CrossRef]
  31. Kumar, S.; Stecher, G.; Tamura, K. MEGA7: Molecular Evolutionary Genetics Analysis Version 7.0 for bigger datasets. Mol. Biol. Evol. 2016, 33, 1870–1874. [Google Scholar] [CrossRef] [Green Version]
  32. Bouckaert, R.; Vaughan, T.G.; Barido-Sottani, J.; Duchêne, S.; Fourment, M.; Gavryushkina, A.; Heled, J.; Jones, G.; Khnert, D.; Maio, N.D.; et al. BEAST 2.5: An advanced software platform for Bayesian evolutionary analysis. PLoS Comput. Biol. 2019, 15, e1006650. [Google Scholar] [CrossRef] [Green Version]
  33. Bouckaert, R.R.; Drummond, A.J. bModelTest: Bayesian phylogenetic site model averaging and model comparison. BMC Evol. Biol. 2017, 17, 42. [Google Scholar] [CrossRef] [Green Version]
  34. Stout, C.C.; Tan, M.; Lemmon, A.R.; Lemmon, E.M.; Armbruster, J.W. Resolving Cypriniformes relationships using an anchored enrichment approach. BMC Evol. Biol. 2016, 16, 244–257. [Google Scholar] [CrossRef] [Green Version]
  35. Liu, J.; Zhang, X.H.; Mei, X.; Zhao, Q.H.; Guo, X.W.; Zhao, W.N.; Liu, J.X.; Saito, Y.; Wu, Z.Q.; Li, J.; et al. The sedimentary succession of the last ~ 3.50 Myr in the western south Yellow Sea: Paleoenvironmental and tectonic implications. Mar. Geol. 2018, 399, 47–65. [Google Scholar] [CrossRef]
  36. Zhou, J.J. The Cyprinidae fossils from middle Miocene of Shanwang basin. Vert. PalAsiat. 1990, 28, 95–127. (In Chinese) [Google Scholar]
  37. Tang, K.L.; Agnew, M.K.; Chen, W.J.; Hirt, M.V.; Raley, M.E.; Sado, T.; Schneider, L.M.; Yang, L.; Bart, H.L.; He, S.P.; et al. Phylogeny of the gudgeons (Teleostei: Cyprinidae: Gobioninae). Mol. Phylogenet. Evol. 2011, 61, 103–124. [Google Scholar] [CrossRef]
  38. Deng, T.; Hou, S.K.; Wang, S.Q. Neogene integrative stratigraphy and timescale of China. Sci. Chin. Earth Sci. 2019, 62, 310–323. [Google Scholar] [CrossRef]
  39. Rambaut, A.; Drummond, A.J.; Xie, D.; Baele, G.; Suchard, M.A. Posterior summarization in Bayesian phylogenetics using Tracer 1.7. Syst. Biol. 2018, 67, 901–904. [Google Scholar] [CrossRef] [PubMed] [Green Version]
  40. Pons, O.; Petit, R.J. Measuring and testing genetic differentiation with ordered versus unordered alleles. Genetics 1996, 144, 1237–1245. [Google Scholar] [CrossRef]
  41. Excoffier, L.; Lischer, H.E.L. Arlequin suite ver 3.5: A new series of programs to perform population genetics analyses under Linux and Windows. Mol. Ecol. Resour. 2010, 10, 564–567. [Google Scholar] [CrossRef] [PubMed]
  42. Dupanloup, I.; Schneider, S.; Excoffier, L. A simulated annealing approach to define the genetic structure of populations. Mol. Ecol. 2002, 11, 2571–2581. [Google Scholar] [CrossRef]
  43. Tajima, F. Statistical method for testing the neutral mutation hypothesis by DNA polymorphism. Genetics 1989, 123, 585–595. [Google Scholar] [CrossRef]
  44. Fu, Y.X. Statistical tests of neutrality of mutations against population growth, hitchhiking and background selection. Genetics 1997, 147, 915–925. [Google Scholar] [CrossRef]
  45. Ray, N.; Currat, M.; Excoffier, L. Intra-Deme Molecular Diversity in Spatially Expanding Populations. Mol. Biol. Evol. 2003, 20, 76–86. [Google Scholar] [CrossRef] [Green Version]
  46. Darriba, D.; Taboada, G.L.; Doallo, R.; Posada, D. jModelTest 2: More models, new heuristics and parallel computing. Nat. Methods 2012, 9, 772. [Google Scholar] [CrossRef] [Green Version]
  47. Matzke, N.J. Probabilistic historical biogeography: New models for founder-event speciation, imperfect detection, and fossils allow improved accuracy and modeltesting. Front. Biogeogr. 2013, 5, 242–248. [Google Scholar] [CrossRef] [Green Version]
  48. Matzke, N.J. Model Selection in historical biogeography reveals that founder-event speciation is a crucial process in island clades. Syst. Biol. 2014, 63, 951–970. [Google Scholar] [CrossRef] [PubMed]
  49. Lambeck, K.; Rouby, H.; Purcell, A.; Sun, Y.Y.; Sambridge, M. Sea level and global ice volumes from the Last Glacial Maximum to the Holocene. Proc. Natl. Acad. Sci. USA 2014, 111, 15296–15303. [Google Scholar] [CrossRef] [PubMed] [Green Version]
  50. Yokoyama, Y.; Esat, T.M.; Thompson, W.G.; Thomas, A.L.; Webster, J.M.; Miyairi, Y.; Sawada, C.; Aze, T.; Matsuzaki, H.; Okuno, J.; et al. Rapid glaciation and a two-step sea level plunge into the Last Glacial Maximum. Nature 2018, 559, 603–607. [Google Scholar] [CrossRef]
  51. Thomaz, A.T.; Malabarba, L.R.; Bonatto, S.L.; Knowles, L.L. Testing the effect of palaeodrainages versus habitat stability on genetic divergence in riverine systems: Study of a Neotropical fish of the Brazilian coastal Atlantic Forest. J. Biogeogr. 2015, 42, 2389–2401. [Google Scholar] [CrossRef]
  52. Gai, C.C.; Liu, Q.S.; Roberts, A.P.; Chou, Y.M.; Zhao, X.X.; Jiang, Z.X.; Liu, J.X. East Asian monsoon evolution since the late Miocene from the South China Sea. Earth Planet. Sci. Lett. 2020, 530, 115960. [Google Scholar] [CrossRef]
  53. Wang, Y.C.; Lu, H.Y.; Wang, K.X.; Wang, Y.; Li, Y.X.; Clemens, S.; Lv, H.Z.; Huang, Z.H.; Wang, H.L.; Hu, X.Z.; et al. Combined high- and low-latitude forcing of East Asian monsoon precipitation variability in the Pliocene warm period. Sci. Adv. 2020, 6, eaba2414. [Google Scholar] [CrossRef]
  54. Lu, J.Y.; Yang, H.; Griffiths, M.L.; Burls, N.; Xiao, G.Q.; Yang, J.L.; Wang, J.K.; Johnson, K.R.; Xie, S.C. Asian monsoon evolution linked to Pacific temperature gradients since the Late Miocene. Earth Planet. Sci. Lett. 2021, 563, 116882. [Google Scholar] [CrossRef]
  55. Yang, S.L.; Ding, Z.L.; Feng, S.H.; Jiang, W.Y.; Huang, X.F.; Guo, L.C. A strengthened East Asian summer monsoon during Pliocene warmth: Evidence from ‘red clay’ sediments at Pianguan, northern China. J. Asian Earth Sci. 2018, 155, 124–133. [Google Scholar] [CrossRef]
  56. Huang, X.F.; Jiang, D.B.; Dong, X.X.; Yang, S.L.; Su, B.H.; Li, X.Y.; Tang, Z.H.; Wang, Y.D. Northwestward migration of the northern edge of the East Asian Summer Monsoon during the Mid-Pliocene warm period: Simulations and reconstructions. J. Geophys. Res. Atmos. 2019, 124, 1392–1404. [Google Scholar] [CrossRef]
  57. Abell, J.T.; Winckler, G.; Anderson, R.F.; Herbert, T.D. Poleward and weakened westerlies during Pliocene warmth. Nature 2021, 589, 70–75. [Google Scholar] [CrossRef] [PubMed]
  58. Miller, K.G.; Browning, J.V.; Schmelz, W.J.; Kopp, R.E.; Mountain, G.S.; Wright, J.D. Cenozoic sea-level and cryospheric evolution from deep-sea geochemical and continental margin records. Sci. Adv. 2020, 6, eaaz1346. [Google Scholar] [CrossRef] [PubMed]
  59. Chen, D.B.; Pan, B.T.; Ma, J.F.; Hu, X.F.; Geng, H.P.; Pang, H.L. Paleoclimatic record from the clay mineralogy of Quaternary sediments of drill core DWJ from Jiudong subbasin (western Hexi Corridor), NW China. Quat. Res. 2020, 93, 124–138. [Google Scholar] [CrossRef]
  60. Cheng, H.; Edwards, R.L.; Sinha, A.; Spötl, C.; Li, Y.; Chen, S.T.; Kelly, M.; Kathayat, G.; Wang, X.F.; Li, X.L.; et al. The Asian monsoon over the past 640,000 years and ice age terminations. Nature 2016, 534, 640–646. [Google Scholar] [CrossRef]
  61. Wang, L.Y.; Li, G.X.; Liu, J.; Mei, X.; Zhang, Y. Astronomical dating of Quaternary strata in the South Yellow Sea and its indication for paleoclimatic evolution. Mar. Geol. 2021, 439, 106557. [Google Scholar] [CrossRef]
  62. Araripe, J.; do Rêgo, P.S.; Queiroz, H.; Sampaio, I.; Schneider, H. Dispersal capacity and genetic structure of Arapaima gigas on different geographic scales using microsatellite markers. PLoS ONE 2013, 8, e54470. [Google Scholar] [CrossRef] [Green Version]
  63. Chen, W.T.; Zhong, Z.X.; Dai, W.; Fan, Q.; He, S.P. Phylogeographic structure, cryptic speciation and demographic history of the sharpbelly (Hemiculter leucisculus), a freshwater habitat generalist from Southern China. BMC Evol. Biol. 2017, 17, 216. [Google Scholar] [CrossRef] [Green Version]
  64. Liu, C.Y.; Nie, J.S.; Li, Z.J.; Qiao, Q.Q.; Abell, J.T.; Wang, F.; Xiao, W.J. Eccentricity forcing of East Asian monsoonal systems over the past 3 million years. Proc. Natl. Acad. Sci. USA 2021, 118, e2107055118. [Google Scholar] [CrossRef]
  65. Yang, L.; He, S.P. Phylogeography of the freshwater catfish Hemibagrus guttatus (Siluriformes, Bagridae): Implications for South China biogeography and influence of sea level changes. Mol. Phylogenet. Evol. 2008, 49, 393–398. [Google Scholar] [CrossRef]
  66. Šlechtová, V.; Bohlen, J.; Freyhof, J.; Persat, H.; Delmastro, G.B. The Alps as barrier to dispersal in cold-adapted freshwater fishes? Phylogeographic history and taxonomic status of the bullhead in the Adriatic freshwater drainage. Mol. Phylogenet. Evol. 2004, 33, 225–239. [Google Scholar] [CrossRef]
  67. Barluenga, M.; Meyer, A. Old fish in a young lake: Stone loach (Pisces: Barbatula barbatula) populations in Lake Constance are genetically isolated by distance. Mol. Ecol. 2005, 14, 1229–1239. [Google Scholar] [CrossRef] [PubMed] [Green Version]
  68. Chiang, T.Y.; Lin, H.D.; Zhao, J.; Kuo, P.H.; Lee, T.W.; Hsu, K.C. Diverse processes shape deep phylogeographical divergence in Cobitis sinensis (Teleostei: Cobitidae) in East Asia. J. Zool. Syst. Evol. Res. 2013, 51, 316–326. [Google Scholar] [CrossRef]
  69. Li, G.G.; Peng, Z.G.; Zhang, R.Y.; Tang, Y.T.; Tong, C.; Feng, C.G.; Zhang, C.F.; Zhao, K. Mito-nuclear phylogeography of the cyprinid fish Gymnodiptychus dybowskii in the arid Tien Shan region of Central Asia. Biol. J. Linnean Soc. 2016, 118, 304–314. [Google Scholar] [CrossRef] [Green Version]
  70. Chen, W.T.; Li, C.; Chen, F.C.; Li, Y.F.; Yang, J.P.; Li, J.; Li, X.H. Phylogeographic analyses of a migratory freshwater fish (Megalobrama terminalis) reveal a shallow genetic structure and pronounced effects of sea-level changes. Gene 2020, 737, 144478. [Google Scholar] [CrossRef] [PubMed]
  71. Grant, K.M.; Rohling, E.J.; Ramsey, C.B.; Cheng, H.; Edwards, R.L.; Florindo, F.; Heslop, D.; Marra, F.; Roberts, A.P.; Tamisiea, M.E.; et al. Sea-level variability over five glacial cycles. Nat. Commun. 2014, 5, 5076. [Google Scholar] [CrossRef]
  72. Zhao, L.J.; Zhou, X.Y.; Liu, Q.G.; Zhang, H. Genetic variation and phylogeography of Sinibrama macrops (Teleostei: Cyprinidae) in Qiantang River basin, China. Biochem. Syst. Ecol. 2013, 49, 10–20. [Google Scholar] [CrossRef]
  73. Chen, W.T.; Du, K.; He, S.P. Genetic structure and historical demography of Schizothorax nukiangensis (Cyprinidae) in continuous habitat. Ecol. Evol. 2015, 5, 984–995. [Google Scholar] [CrossRef]
  74. Zheng, L.P.; Yang, J.X. Genetic diversity and population demography of the endemic species Acrossocheilus longipinnis (Teleostei, Cyprinidae) based on mtDNA COI and Cytb gene sequences. Mitochondrial DNA Part A 2018, 29, 403–408. [Google Scholar] [CrossRef]
  75. Zhao, J.; Hsu, K.C.; Luo, J.Z.; Wang, C.H.; Chan, B.P.; Li, J.; Kuo, P.H.; Lin, H.D. Genetic diversity and population history of Tanichthys albonubes (Teleostei: Cyprinidae): Implications for conservation. Aquat. Conserv.-Mar. Freshw. Ecosyst. 2018, 28, 422–434. [Google Scholar] [CrossRef]
  76. Zhang, W.J.; Wang, J.J.; Li, C.; Chen, J.Q.; Li, W.; Jiang, S.Y.; Hsu, K.C.; Zhao, M.T.; Lin, H.D.; Zhao, J. Spatial genetic structure of Opsariichthys hainanensis in South China. Mitochondrial DNA Part A 2020, 31, 98–107. [Google Scholar] [CrossRef]
  77. Chen, A.H. Studies on Molecular Phylogeny of the Gobioninae (Teleostei: Cyprinidae). Master Dissertation, Fudan University, Shanghai, China, 2014. [Google Scholar]
  78. Kim, P.; Han, J.H.; An, S.L. Complete mitochondrial genome of freshwater fish, Microphysogobio jeoni (Actinopterygii, Cypriniformes, Cyprinidae), from South Korea. Mitochondrial DNA Part B-Resour. 2020, 5, 856–857. [Google Scholar] [CrossRef] [PubMed] [Green Version]
  79. Cheng, C.Y.; Wang, J.P.; Ho, C.W.; Cheng, J.W.; Ueng, Y.T. Complete mitochondrial DNA genome of Microphysogobio brevirostris (Cypriniformes: Cyprinidae). Mitochondrial DNA 2015, 26, 293–294. [Google Scholar] [CrossRef] [PubMed]
  80. Hwang, D.S.; Song, H.B.; Lee, J.S. Complete mitochondrial genome of the freshwater gudgeon, Microphysogobio koreensis (Cypriniformes, Cyprinidae). Mitochondrial DNA 2014, 25, 15–16. [Google Scholar] [CrossRef]
  81. Kim, K.R.; Bang, I.C. Complete mitochondrial genome of the endangered freshwater fish Microphysogobio rapidus (Cypriniformes, Cyprinidae) from Korea. Mitochondrial DNA Part B-Resour. 2020, 5, 447–448. [Google Scholar] [CrossRef] [PubMed] [Green Version]
  82. Lin, D.Y.; Lin, H.D.; Tzeng, S.J.; Chiang, T.Y. Complete mitochondrial genome of Microphysogobio alticorpus (Cypriniformes, Cyprinidae). Mitochondrial DNA 2014, 25, 173–174. [Google Scholar] [CrossRef]
  83. Horikawa, M.; Nakajima, J.; Mukai, T. Distribution of indigenous and non-indigenous mtDNA haplotypes of Biwia zezera (Cyprinidae) in northern Kyushu, Japan. Jpn. J. Ichthyol. 2007, 54, 149–159. (In Japanese) [Google Scholar]
  84. Hwang, D.S.; Byeon, H.K.; Lee, J.S. Complete mitochondrial genome of the freshwater gudgeon, Gobiobotia macrocephala (Cypriniformes; Cyprinidae). Mitochondrial DNA 2014, 25, 31–32. [Google Scholar] [CrossRef]
  85. Li, Y.H.; Cao, K.; Fu, C.Z. Ten fish mitogenomes of the tribe Gobionini (Cypriniformes: Cyprinidae: Gobioninae). Mitochondrial DNA Part B-Resour. 2018, 3, 802–803. [Google Scholar] [CrossRef] [Green Version]
  86. Wang, F.Y.; Jean, C.T.; Chen, Y.J.; Lin, K.Y.; Liu, M.Y. The complete mitochondrial genome sequence of Belligobio nummifer (Cypriniformes, Cyprinidae). Mitochondrial DNA 2016, 27, 435–436. [Google Scholar] [CrossRef]
  87. Kim, K.Y.; Lim, Y.H.; Bang, I.C.; Nam, Y.K. Phylogenetic relationships among three new Hemibarbus mitogenome sequences belonging to the subfamily Gobioninae (Teleostei, Cypriniformes, and Cyprinidae). Mitochondrial DNA 2009, 20, 119–125. [Google Scholar] [CrossRef]
  88. Chen, Y.; Fu, C.Z. Three complete mitochondrial genomes of freshwater fishes in the genus Abbottina (Cypriniformes: Gobionidae). Mitochondrial DNA Part B-Resour. 2019, 4, 2179–2180. [Google Scholar] [CrossRef] [PubMed] [Green Version]
  89. Fu, J.W.; Fu, C.Z. Three mitochondrial genomes of Pseudogobio fishes (Cypriniformes: Gobionidae). Mitochondrial DNA Part B-Resour. 2020, 5, 3046–3047. [Google Scholar] [CrossRef] [PubMed]
  90. Tong, J.; Fu, C.Z. Four complete mitochondrial genomes of Saurogobio fishes (Cypriniformes: Gobionidae). Mitochondrial DNA Part B-Resour. 2019, 4, 2175–2176. [Google Scholar] [CrossRef] [PubMed] [Green Version]
  91. Yi, T.Y.; Fu, C.Z. Two mitochondrial genomes of freshwater gudgeons in the genus Gobio (Cypriniformes: Gobionidae). Mitochondrial DNA Part B-Resour. 2020, 5, 3054–3055. [Google Scholar] [CrossRef] [PubMed]
  92. Saitoh, K.; Sado, T.; Mayden, R.L.; Hanzawa, N.; Nakamura, K.; Nishida, M.; Miya, M. Mitogenomic evolution and interrelationships of the Cypriniformes (Actinopterygii: Ostariophysi): The first evidence toward resolution of higher-level relationships of the world’s largest freshwater fish clade based on 59 whole mitogenome sequences. J. Mol. Evol. 2006, 63, 826–841. [Google Scholar] [CrossRef]
  93. Tao, W.J.; Zhao, H.P. The complete mitogenome of Gnathopogon polytaenia (Cypriniformes; Cyprinidae). Mitochondrial DNA 2016, 27, 1307–1308. [Google Scholar] [CrossRef]
  94. Kim, K.Y.; Nam, Y.K.; Bang, I. Phylogeny and divergence time estimation of Coreoleuciscus splendidus populations (Teleostei: Cypriniformes) endemic to Korea based on complete mitogenome sequences. Genes Genom. 2012, 34, 149–156. [Google Scholar] [CrossRef]
  95. Chen, A.H.; Xia, R.; Lei, G.C.; Fu, C.Z. Complete mitochondrial genome of Pseudorasbora elongata (Cypriniformes: Cyprinidae). Mitochondrial DNA 2015, 26, 250–251. [Google Scholar] [CrossRef]
  96. Yu, J.N.; Kim, S.; Kwak, M. Complete mitochondrial genome sequence of a Korean Pungtungia herzi (Cypriniformes, Gobioninae). Mitochondrial DNA 2014, 25, 414–415. [Google Scholar] [CrossRef]
  97. Hwang, D.S.; Lee, W.K.; Lee, J.S. Complete mitochondrial genome of the freshwater gudgeon, Pseudopungtungia nigra (Cypriniformes, Gobioninae). Mitochondrial DNA 2014, 25, 1–2. [Google Scholar] [CrossRef]
  98. Chen, X.; Zhou, Z.M.; Chen, Z.J.; Ai, W.M. Complete mitochondrial genome of Sarcocheilichthys parvus (Cypriniformes, Cyprinidae). Mitochondrial DNA 2013, 24, 97–98. [Google Scholar] [CrossRef] [PubMed]
  99. Tang, W.R.; Lin, H.D.; Su, L.W.; Tang, W.Q.; Wu, C.Y.; Yang, J.Q. The complete mitochondrial genome sequence of Sarcocheilichthys nigripinnis (Cypriniformes, Cyprinidae). Mitochondrial DNA 2013, 24, 478–480. [Google Scholar] [CrossRef] [PubMed]
  100. Du, F.K.; Xu, G.C.; Nie, Z.J.; Xu, P.; Gu, R.B. Complete mitochondrial genome of Paracanthobrama guichenoti. Mitochondrial DNA 2016, 27, 727–728. [Google Scholar] [CrossRef] [PubMed]
  101. Xu, D.D.; Li, P.; Zhang, Y.G.; Peng, Z.G. Comparative study of the complete mitochondrial genomes of the bronze gudgeon (Coreius heterodon) and largemouth bronze gudgeon (Coreius guichenoti). Mitochondrial DNA 2013, 24, 189–190. [Google Scholar] [CrossRef] [PubMed]
  102. An, Q.; Fu, C.Z. Complete mitochondrial genome of Ladislavia taczanowskii (Cypriniformes: Gobionidae). Mitochondrial DNA Part B-Resour. 2021, 6, 2227–2228. [Google Scholar] [CrossRef] [PubMed]
  103. Zhu, X.P.; Ma, Z.H.; Yang, X.F.; Xu, H.X.; Yang, R.B. Complete mitochondrial genome of the Chinese bitterling Acheilognathus macropterus (Cypriniformes: Cyprinidae). Mitochondrial DNA Part A 2016, 27, 589–590. [Google Scholar] [CrossRef]
  104. Xu, C.Z.; Xie, F.; Zhang, X.; Zhao, S. The complete mitochondrial genome of Amur bitterling (Rhodeus sericeus) from China. Mitochondrial DNA Part A 2016, 27, 2377–2378. [Google Scholar] [CrossRef]
  105. Luo, Y.; Cao, X.J.; Zhu, Y.R. The complete mitochondrial genome of Tanakia limbata (Cypriniformes: Cyprinidae). Mitochondrial DNA 2016, 27, 1713–1714. [Google Scholar] [CrossRef]
  106. Song, H.Y.; Bang, I.C. Coreoleuciscus aeruginos (Teleostei: Cypriniformes: Cyprinidae), a new species from the Seomjin and Nakdong rivers, Korea. Zootaxa 2015, 3931, 140–150. [Google Scholar] [CrossRef] [Green Version]
Figure 1. Localities of Huigobio chenhsienensis specimens and spatial distributions of mitochondrial cytochrome b gene (Cytb) lineages. The green (paleo-Yangtze River), magenta (paleo-Jiao River), and orange (paleo-Ou River) lines represent paleo-channels of coastal rivers’ downward movement to continental shelf at an elevation of −130–0 m during the last glacial maximum (LGM) when the sea level fell by about 130 m. The code of each population is shown in Table 1 and lineages are defined in Figure 2. FJ—Fujian Province; JX—Jiangxi Province; ZJ—Zhejiang Province; AH—Anhui Province.
Life 12 01024 g001
Figure 2. A time-calibrated phylogeny and ancestral area reconstructions among 66 Cytb haplotypes of H. chenhsienensis. The mean value of the divergence times and their 95% confidence interval are shown above the nodes. The posterior probabilities are below the nodes. The numbers labelled in black circles represent the serial numbers of the major nodes (posterior probability more than 0.9). The outgroup taxon (Huigobio heterocheilus) is not shown, and its information in detail is provided in Table S4. The color block at each node reflects ancestral distribution.
Life 12 01024 g002
Figure 3. A haplotype network of lineages A (a), B (b) and C (c) for H. chenhsienensis. Missing haplotypes are represented with black dots. The number of mutational steps is marked between the haplotypes unless that number is one.
Life 12 01024 g003
Figure 4. Population history including mismatch distributions (a) and Bayesian skyline plots (b) for lineages A, B, and C of H. chenhsienensis. In the mismatch distributions, the bar graphs represent observed values, and the black solid dots and solid lines represent expected values under the population expansion model. For the Bayesian skyline plots, the actual value of effective population size is represented with the solid blue line, 95% confidence interval is represented with the shaded range, and the time range of population expansion or recession is shown with the red box.
Life 12 01024 g004
Table 1. Information on localities of specimens and mitochondrial cytochrome b gene (Cytb) haplotypes for Huigobio chenhsiensis.
Basin and LocalityLat.Long.NCytb Haplotype
Ou River
1. Yongjia County, Zhejiang Province28.35° N120.75° E14A01(1), A02(1), A03(1), A04(1), A05(3), A06(2), A07(1), A08(1), A09(2), A10(1)
2. Jinyun County, Zhejiang Province28.66° N120.09° E2A11(2)
Jiao River
3. Tiantai County, Zhejiang Province29.14° N121.03° E1A12(1)
Cao’e River
4. Xinchang County, Zhejiang Province29.51° N120.91° E15B01(4), B02(1), B03(8), B04(2)
Qiantang River
5. Pan’an County, Zhejiang Province29.06° N120.45° E1B05(1)
6. Yuqian Town, Lin’an City, Zhejiang Province30.19° N119.40° E6B06(2), B07(1), B08(2), B09(1)
7. Changhua Town, Lin’an City, Zhejiang Province30.17° N119.22° E10B08(3), B10(4), B11(1), B12(1), B13(1)
8. Yunti Village, Ningguo City, Anhui Province30.37° N119.21° E11B05(1), B08(2), B12(1), B14(1), B15(1), B16(4), B17(1)
9. Huangshan City, Anhui Province29.72° N118.31° E1B05(1)
10. Jiangshan City, Zhejiang Province28.76° N118.66° E1B18(1)
Yangtze River
11. Anji County, Zhejiang Province30.64° N119.67° E6A13(5), A14(1)
12. Ningguo City, Anhui Province30.62° N118.95° E7A15(1), A16(1), A17(1), A18(1), A19(1), A20(1), A21(1)
13. Shitai County, Anhui Province30.21° N117.50° E10A22(1), A23(2), A24(1), A25(1), A26(2), A27(1), A28(1), A29(1)
14. Fuliang County, Jiangxi Province29.52° N117.28° E1C01(1)
15. Yushan County, Jiangxi Province28.69° N118.28° E1C02(1)
16. Fengxin County, Jiangxi Province28.71° N115.38° E6C03(1), C04(2), C05(1), C06(1), C07(1)
17. Jing’an County, Jiangxi Province28.85° N115.39° E18C04(2), C08(13), C09(1), C10(1), C11(1)
18. Tonggu County, Jiangxi Province28.53° N114.39° E9C06(5), C12(2), C13(1), C14(1)
19. Xiushui County, Jiangxi Province29.02° N114.54° E1C15(1)
20. Ningdu County, Jiangxi Province26.46° N116.00° E5C16(3), C17(2)
21. Suichuan County, Jiangxi Province26.31° N114.52° E15C16(9), C17(2), C18(1), C19(3)
22. Anfu County, Jiangxi Province27.39° N114.63° E1C16(1)
Lat.—latitude; Long.—longitude; N—number of individuals; number of individuals for each haplotype is in bracket.
Table 2. Genetic diversity of H. chenhsienensis.
BasinNumberNumber of HaploTypes (Nh)Number of Private Haplotypes (Nph)Haplotype Diversity (h)Nucleotide Diverstiy (π)
Ou River1611110.9500 ± 0.03640.0028 ± 0.0017
Jiao River111--
Cao’e River15440.6667 ± 0.09910.0007 ± 0.0006
Qiantang River3014140.9126 ± 0.03070.0024 ± 0.0015
Yangtze River8036360.9370 ± 0.01490.0371 ± 0.0180
Total14266660.9722 ± 0.00540.0460 ± 0.0222
Table 3. Pairwise comparison ΦST values among basins (lower diagonal) and associated p values (upper diagonal) of H. chenhsienensis.
Ou RiverCao’e RiverQiantang RiverYangtze River
Ou River 0.0000.0000.000
Cao’e River0.986 0.0000.000
Qiantang River0.9810.367 0.000
Yangtze River0.5460.5100.559
Jiao River was excluded from the analysis because it had only one sample. Significant p values (p < 0.05) by Bonferroni correction are displayed in bold.
Table 4. Neutrality tests for lineages A, B, and C of H. chenhsienensis.
LineageTajima’s DFu’s Fs
A0.320 (p = 0.706)−4.231 (p = 0.095)
B−1.768 (p = 0.014)−9.126 (p = 0.000)
C0.528 (p = 0.781)1.220 (p = 0.714)
Publisher’s Note: MDPI stays neutral with regard to jurisdictional claims in published maps and institutional affiliations.

