Article

Transcriptomic Analysis of the Anthocyanin Biosynthetic Pathway Reveals the Molecular Mechanism Associated with Purple Color Formation in Dendrobium Nestor

Flower Research Institute, Guangxi Academy of Agricultural Sciences, Nanning 530007, China
*
Authors to whom correspondence should be addressed.
Life 2021, 11(2), 113; https://doi.org/10.3390/life11020113
Submission received: 23 December 2020 / Revised: 27 January 2021 / Accepted: 29 January 2021 / Published: 2 February 2021
(This article belongs to the Special Issue Research Advances in Plant Genomics)

Abstract

:
Dendrobium nestor is a famous orchid species in the Orchidaceae family. There is a diversity of flower colorations in the Dendrobium species, but knowledge of the genes involved and molecular mechanism underlying the flower color formation in D. nestor is less studied. Therefore, we performed transcriptome profiling using Illumina sequencing to facilitate thorough studies of the purple color formation in petal samples collected at three developmental stages, namely—flower bud stage (F), half bloom stage (H), and full bloom stage (B) in D. nestor. In addition, we identified key genes and their biosynthetic pathways as well as the transcription factors (TFs) associated with purple flower color formation. We found that the phenylpropanoid–flavonoid–anthocyanin biosynthesis genes such as phenylalanine ammonia lyase, chalcone synthase, anthocyanidin synthase, and UDP-flavonoid glucosyl transferase, were largely up-regulated in the H and B samples as compared to the F samples. This upregulation might partly account for the accumulation of anthocyanins, which confer the purple coloration in these samples. We further identified several differentially expressed genes related to phytohormones such as auxin, ethylene, cytokinins, salicylic acid, brassinosteroid, and abscisic acid, as well as TFs such as MYB and bHLH, which might play important roles in color formation in D. nestor flower. Sturdy upregulation of anthocyanin biosynthetic structural genes might be a potential regulatory mechanism in purple color formation in D. nestor flowers. Several TFs were predicted to regulate the anthocyanin genes through a K-mean clustering analysis. Our study provides valuable resource for future studies to expand our understanding of flower color development mechanisms in D. nestor.

1. Introduction

The Orchidaceae family comprises orchids from 736 genera and represents the second largest family of flowering plants [1,2]. Dendrobium species represent important orchids that are either epiphytic or lithophytic and have frequent buds [1,3]. The species is distributed and cultivated in tropical Asia, Australasia, and Australia [4]. More than 74 species and two widely cultivated genotypes of this genus were reported in China, some of which are famed for their flowers during Father’s Day in Asia [4]. Dendrobium nestor is derived from a cross between Dendrobium parishii x D. anosmum, and its flowers present color diversity, spanning from white, red, to purple [5]. The color variations in the D. nestor flower contribute to the release of fragrance as attractants for pollinators [6]. Color variations in orchids account for their aesthetic and commercial values in the ornamental industry [2]. The purple color variant in D. nestor substantially accounts for the visual appeal and market value of the flowers. Dendrobium orchids are also highly employed for their medicinal values. Several bioactive compounds and metabolites housed in these species are useful for human health, including nourishing the kidney, enhancing the body’s immunity, and resisting cancer [4].
Anthocyanins are part of flavonoids, the phenolic compounds that determine flower, fruit, and seed color in several plant species [7,8,9,10]. They are key members of the phenylpropanoid biosynthetic pathway [11,12] and are water-soluble, synthesized in cytosol, stored in the vacuole, and encode for the blue, purple, red, or white colors of flowers and fruits [13]. Three aromatic rings characterize these compounds and could be substituted by acyl, hydroxyl, methyl, and sugar, depending on the plant species [7]. Biosynthesis of anthocyanins are controlled by structural and regulatory genes involved in the formation of enzymes, and regulation of expression of specific enzymes [10,14]. In petunia flowers, differential expression of anthocyanin structural genes result in spot color formation [15,16].
Major genes participating in the anthocyanin biosynthetic pathway encode flavanone 3-hydroxylase, flavonoid 3′-hydroxylase, dihydroflavonol 4-reductase, chalcone synthase, chalcone isomerase, cinnamate 4-hydroxylase, 4-coumaroyl CoA ligase, glutathione S-transferase, leucoanthocyanidin dioxygenase, phenylalanine ammonia-lyase, and UDP-flavonoid glucosyl transferase [17]. Transcription factors (TFs) control gene expression in numerous biological processes in plants [5]. The regulatory mechanisms of a number of genes involved in the anthocyanin biosynthetic pathway are well characterized in plants [6,18,19,20,21]. For instance, a flower-specific MYB protein activation of genes involved in phenylpropanoid biosynthesis was reported in Antirrhinum [22,23]. In Arabidopsis, PAP1/MYB75, PAP2/MYB90, MYB113, and MYB114 control anthocyanin biosynthesis [24,25]. Likewise, it was demonstrated that TTG1 (WD40), GL3/EGL3/TT8 (bHLH), and PAP1/PAP2/MYB113/MYB114 (MYB) for a WBM complex that controls anthocyanin biosynthesis [26,27]. The implication of WRKY TFs in the co-regulation of anthocyanin via the MBW complex were documented in Arabidopsis and Petunia [18,28]. Additionally, the bZIP TF family members are potential regulators of the anthocyanin pathway in apple [29].
Although extensive knowledge are available in different plant species concerning the molecular mechanisms of color formation, species-specific distinctiveness in the transcriptional regulation of color formation in plants was reported. Currently, the role of the anthocyanin biosynthetic pathway in petal/flower color formation in D. nestor remains unclear. Identifying the key genes related to color formation in the D. nestor flower would facilitate the manipulation of the related pathways to develop new cultivars with specific flower colors. In recent years, transcriptome sequencing (RNA-seq) was used as a rapid technique to uncover differentially expressed genes, TFs, and biosynthesis pathways related to specific traits in plants [13,30,31]. Transcriptome sequencing of the D. nestor petals/flowers would provide useful insights into the genetics of purple color formation. To the best of our knowledge, there is limited study on flower coloration in D. nestor, and the molecular mechanisms of the flower coloration and regulation remains obscure. In this study, we performed transcriptome sequencing on the petals of blooming flowers of D. nestor at different periods to discover key candidate genes of the anthocyanin biosynthetic pathway underlying the purple color formation. Our results serve as a reference for understanding the regulation of key genes and transcription processes in purple color formation in the flowers of this aesthetically important orchid.

2. Material and Methods

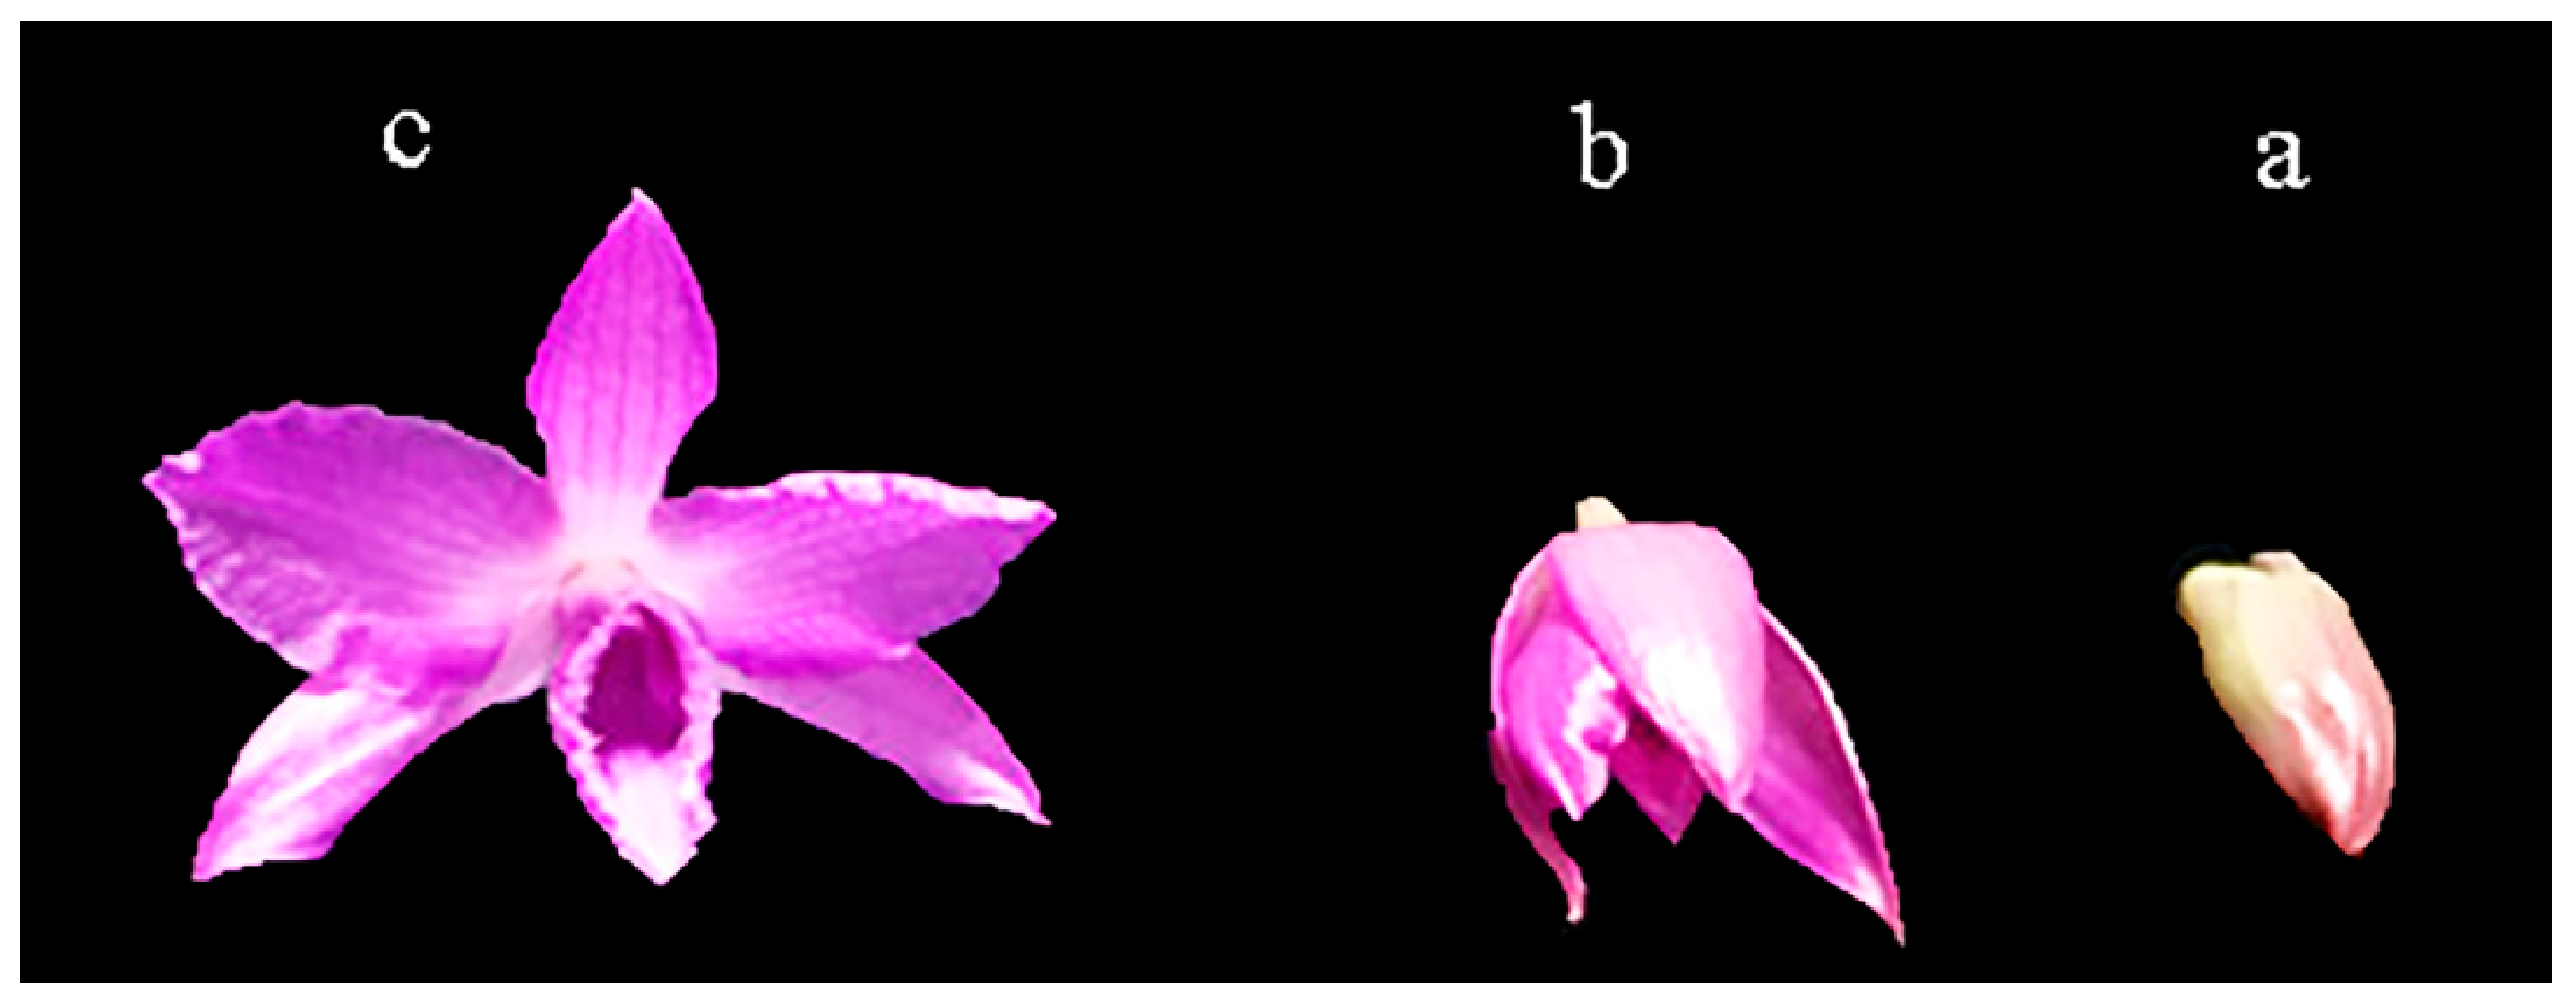
2.1. Plant Growth and Sample Preparation

D. nestor produces a large number of flowers, rich floral fragrance, gorgeous colors, and is highly appreciated by consumers. The genetic material used in the present study (D. nestor) was derived from a cross between Dendrobium parishii × D. anosmum. The color of the D. nestor flower at the full blooming stage is purplish. The D. nestor plants were cultivated in a greenhouse at the Flower Research Institute, Guangxi Academy of Agricultural Sciences, Nanning, China. A total of 12 petals were collected from 12 plants at three different stages of flower development, i.e., the flower bud stage (F, 5 mm long); half blooming stage (H, 10 mm long) and blooming stage (B, ˃11 mm long), and mixed to constitute a biological replicate (Figure 1). Sampling was conducted in three biological replicates at each flower developmental stage. Samples were immediately lyophilized in liquid nitrogen and stored at –80 °C and used in future experiments.

2.2. RNA Extraction, Sequencing Libraries, and RNA-Seq

Total RNA was extracted from each sample (3 samples × 3 biological repeats) of D. nestor using Trizol reagents (Invitrogen, Carlsbad, CA, USA). The transcriptome library was constructed using the Illumina TruSeq Stranded total RNA with Ribo-Zero Globin (Illumina, San Diego, CA, USA), according to the manufacturer’s instructions. All cDNA libraries were subjected to high throughput sequencing using the Illumina HiSeq™ 4000 platform at Biomarker Technologies (Beijing, China). The raw sequencing data were cleaned and assembled using the Trinity software [32]. Gene expressions were normalized to the fragments per kilobase of transcript per million (FPKM) by HTSeq [33]. The expressions of genes were heatmapped and visualized using the Toolkit for Biologists, integrating various biological data handling tools [34].

2.3. Sequenced Data Filtering, Assembly, and Functional Annotation

The raw sequenced data with low-quality linker contaminants and reads with too high and unknown base contents were filtered using the FastQC software version 0.11.9 [35] to ensure reliability of results. The clean reads were used as candidates for the transcriptome assembly. The polymerase chain reaction (PCR) duplicates were removed with the Trinity program (version 2.8.4) [32]. The assembled transcripts were then clustered and a cluster deduplication was performed to obtain the final unigenes. The unigenes were named according to the cluster number, followed by its serial order. The assembled unigenes were annotated using the Clusters of Orthologous Groups of proteins (COG) [36], Gene Ontology (GO) (https://www.geneontology.org [37]), Kyoto Encyclopedia of Genes and Genomes (KEGG) [38], Pfam [39], translated European Molecular Biology Laboratory (TrEMBL; [40]), the NCBI non-redundant protein sequence database (Nr) (https://ftp.ncbi.nih.gov/blast/db/FASTA/nr.gz; [41]), and Eukaryotic Clusters of the Orthologous Groups (KOG, https://www.ncbi.nlm.nih.gov/COG/new/shokog.cgi). Principal Components Analysis (PCA) and Pearson correlation were performed on the basis of gene expression profiles obtained from FPKM, among the nine samples, in R [42].

2.4. Detection of Differentially Expressed Genes and Functional Enrichment Analysis

The uniquely mapped reads were retained for the unigene expression analysis. Differential expression analysis between treatments was performed based on FPKM, using the DESeq R package (1.10.1) with the Benjamini and Hochberg’s correction [43]. The unigenes with a false discovery rate (FDR) of ≤ 0.001 and a fold change of ≥ 2.0 or ≤ 0.5 in any pairwise comparison (F_vs_H, F_vs_B and H_vs_B) were considered as differentially expressed unigenes, which were designated as differentially expressed genes (DEGs). The DEGs were clustered by the Short Time-series Expression Miner (STEM) clustering analysis (STEM software), by setting 30 as the maximum number of model profiles, and 1 as the maximum unit change in model profiles between time-points [44]. The Kyoto Encyclopedia of Genes and Genomes (KEGG) database (https://www.genome.jp/kegg) was used for the functional annotation of specific purple color-conferring DEGs with the BLAST software [45] to identify anthocyanin biosynthetic pathways among the samples, in pairwise comparisons with a minimum threshold of statistical significance at p < 0.05.

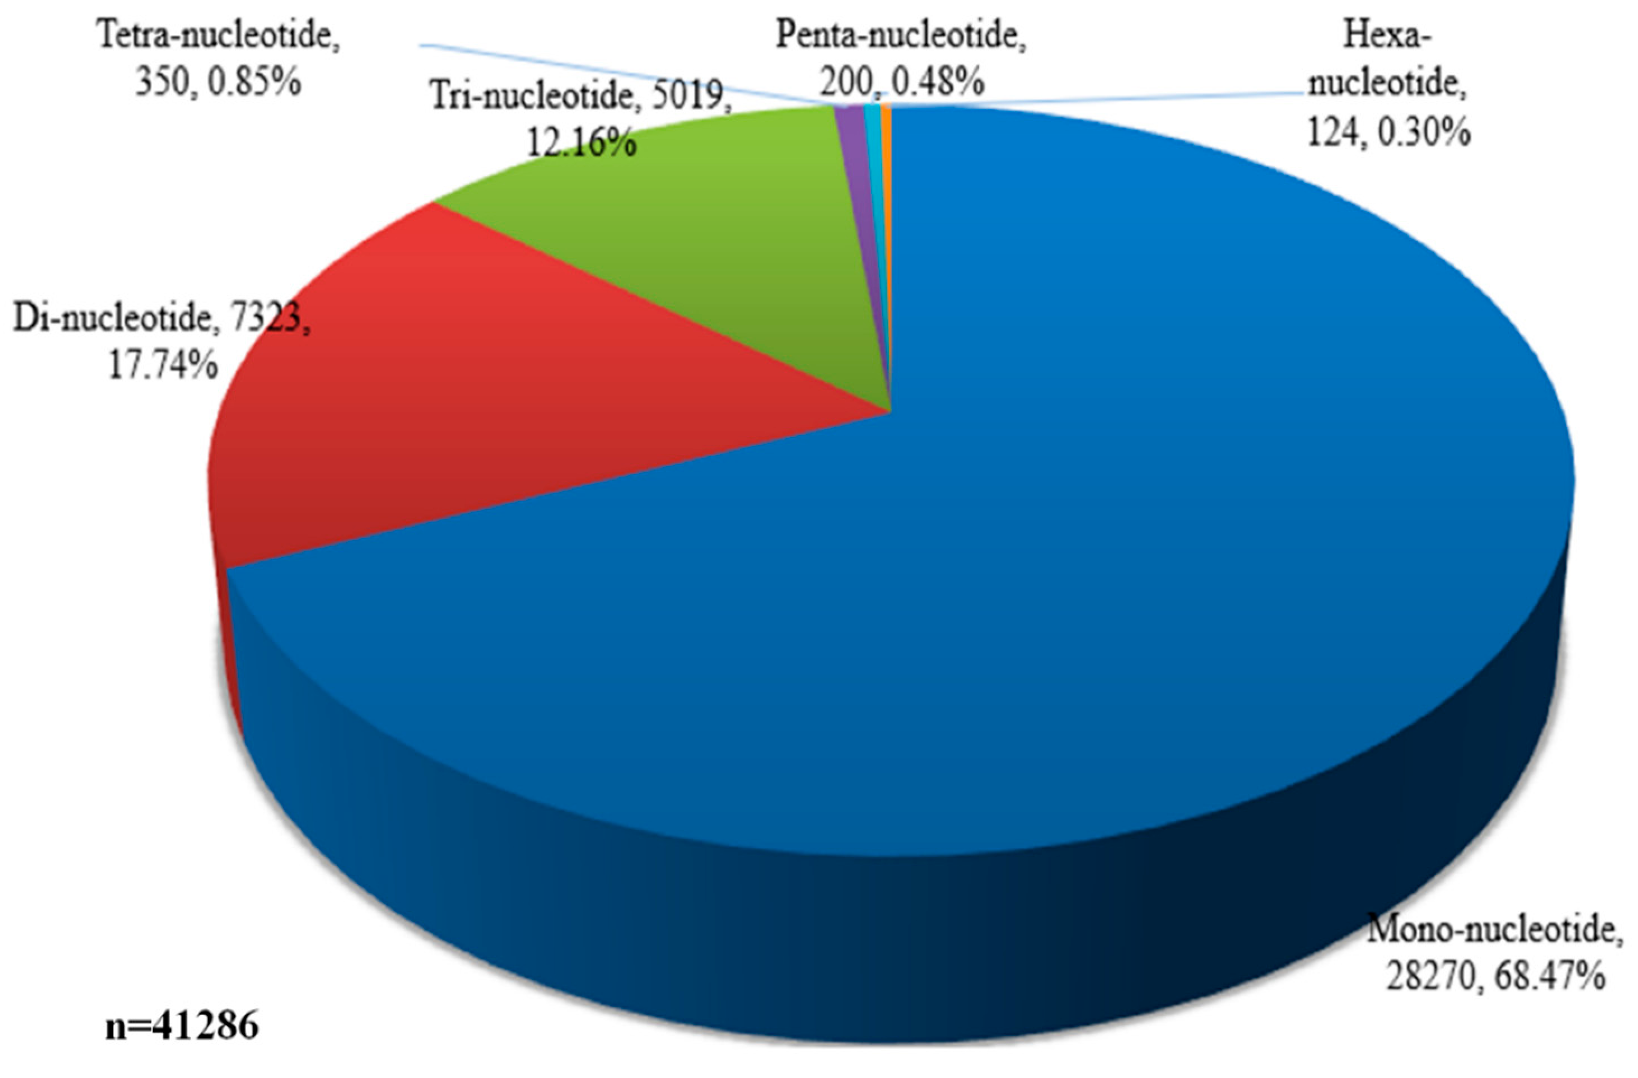
2.5. Identification of Transcription Factors and Simple Sequence Repeats

To predict transcription factors (TFs) involved in purple color formation in D. nestor, we utilized the getorf database (mini-size 150) to find the open reading frame (ORF) [46] and then used the HMM search database (version 3.0) to align the ORFs to the TF protein domain [47]. The aligned sequences were described according to the TF families available on the PlantTF database version 3.0 [48]. The online Perl script program, MIcroSAtellite identification tool (MISA; http://pgrc.ipk-gatersleben.de/misa/) was employed to identify SSRs in D. nestor using the default settings. Primer3 software (ver 2.2.2) was used to design primers for the detected SSRs [49].

2.6. Real-Time Quantitative Polymerase Chain Reaction Analysis

Primers were designed using the Primer 4.0 tool (Additional File 8: Table S6). The qRT-PCR was performed using the LightCycler 480 with Unique AptamerTM qPCR SYBR® Green Master Mix (Novogene Technology Co. Ltd., Beijing, China), according to the manufacturer’s instructions. The gene Actin (JX294908) was used as the housekeeping gene. All reactions were performed in biological triplicates and technical triplicates. Relative expression values were computed using the 2−∆∆Ct method [50]. Student t-test was used to separate the means, thus, the difference was considered to be statistically significant at p < 0.05.

3. Results

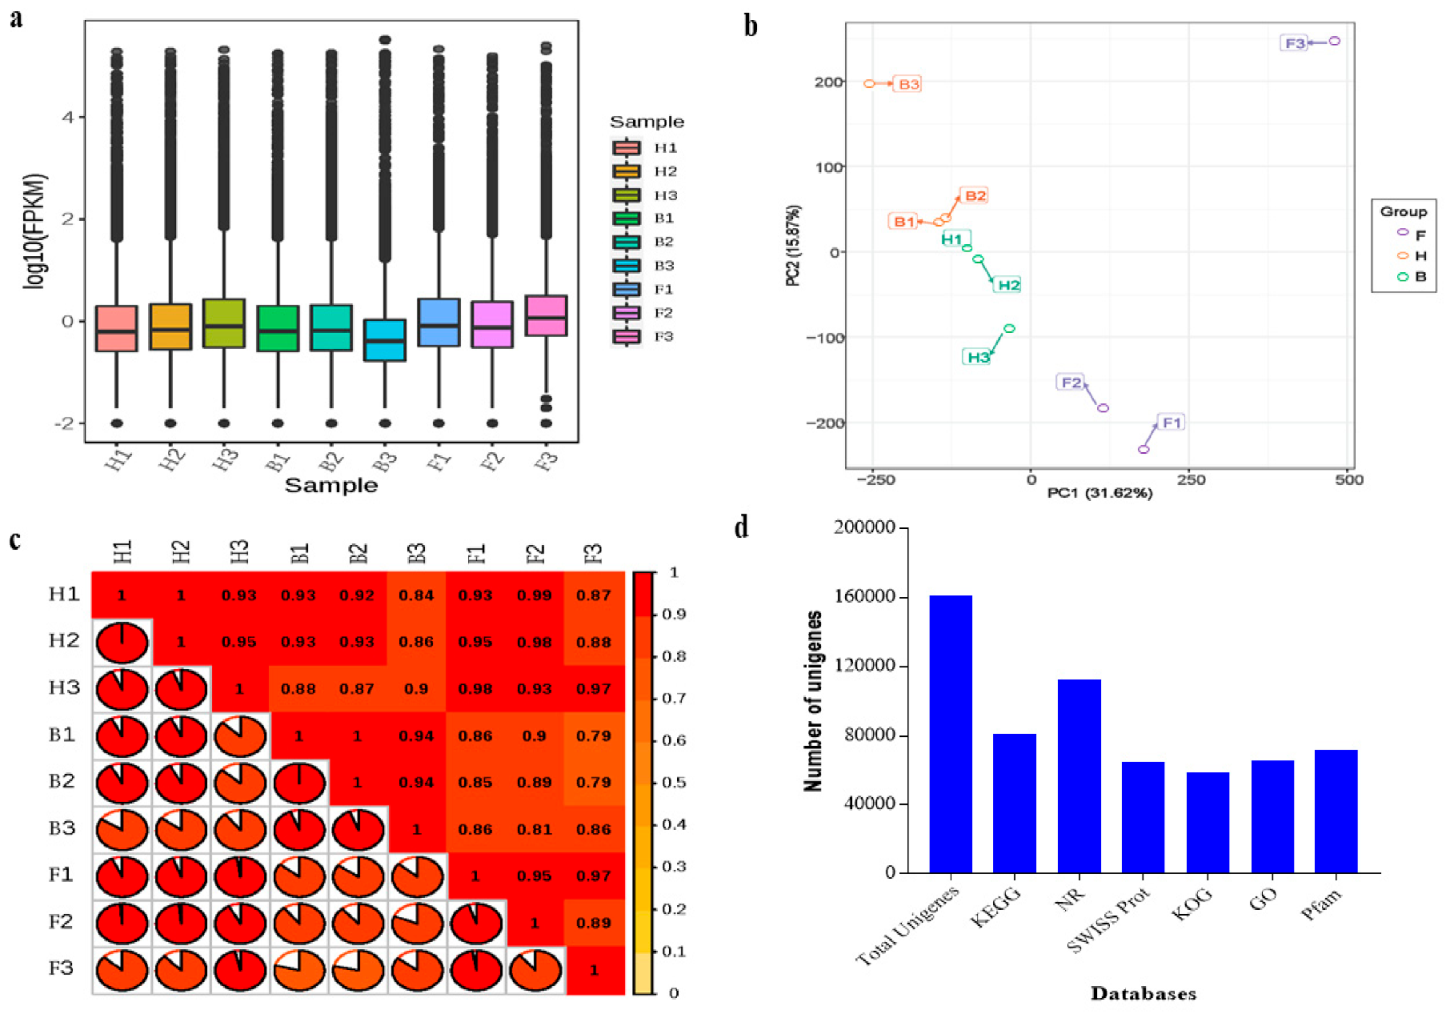
3.1. Sequencing Summary, Assembly, and Unigene Annotation

Flower samples collected in triplicates at three stages of development (F = flower bud stage; H = half blooming stage; and B = full blooming stage) from D. nestor plants were used for RNA-seq (Figure 1). The purple coloration increased gradually from F to B (Figure 1). The RNA-seq was conducted on nine cDNA libraries (3 samples × 3 repeats) and generated, on average, 50,047,108 (F), 48,759,280 (H), and 51,171,054 (B) raw reads, (Table 1). After filtering the contaminants, the average clean reads ranged from 46,903,317 (95.05% of the raw reads) to 49,217,131 (96.28% of the raw reads) corresponding to 7.03–7.38 Gb clean reads. Each sample had a Q30 and GC content above 93% and 46%, respectively (Table 1).
The clean libraries were assembled with the program Trinity [32]. The assembler generated a total of 220,258 transcripts, out of which 59,986 (27.23%) had a length of 200–300 bp (Additional File 1: Figure S1). Subsequently, a cluster deduplication was performed to obtain the final unigene for analyses. As a result, a total of 161,228 unigenes were obtained, of which 26,998 (16.75%) had a mean length ≥2000 bp (Additional File 1: Figure S1). The overall distribution of the gene expression was based on the fragments per kilobase of transcript per million fragments mapped (FPKM) procedure (Figure 2a). The use of relative unigene expression obtained from FPKM for principal component analysis (PCA) showed 47.49% variability among the three samples (F, H, and B) (Figure 2b). However, biological replicates had a very strong correlation co-efficient (r ≥ 0.79), as evidenced in Figure 2c. Overall, we detected 46,770, 45,739, and 38,601 expressed unigenes in F, H, and B samples, respectively.
From above, 112,581 unigenes (representing 69.83%) were successfully annotated to at least one of the six public gene functional annotation databases, including KEGG, Nr, SWISS Prot, KOG, GO, and Pfam via BLAST. Figure 2d gives annotation across the six databases. The high-quality reads, variability among the sample groups, and similarity within biological replicates confirmed the reliability of our data for further analyses.
Transcriptome assembly of D. nestor provides the opportunity to detect simple sequence repeats (SSR), which could be useful for a variety of identification and molecular assisted breeding. In total, we identified 41,286 SSR markers, dominated by mono-nucleotide (68.47%), di-nucleotide (17.47%), and tri-nucleotide (12.16%) SSR types (Additional file 2: Table S1, Figure 3).

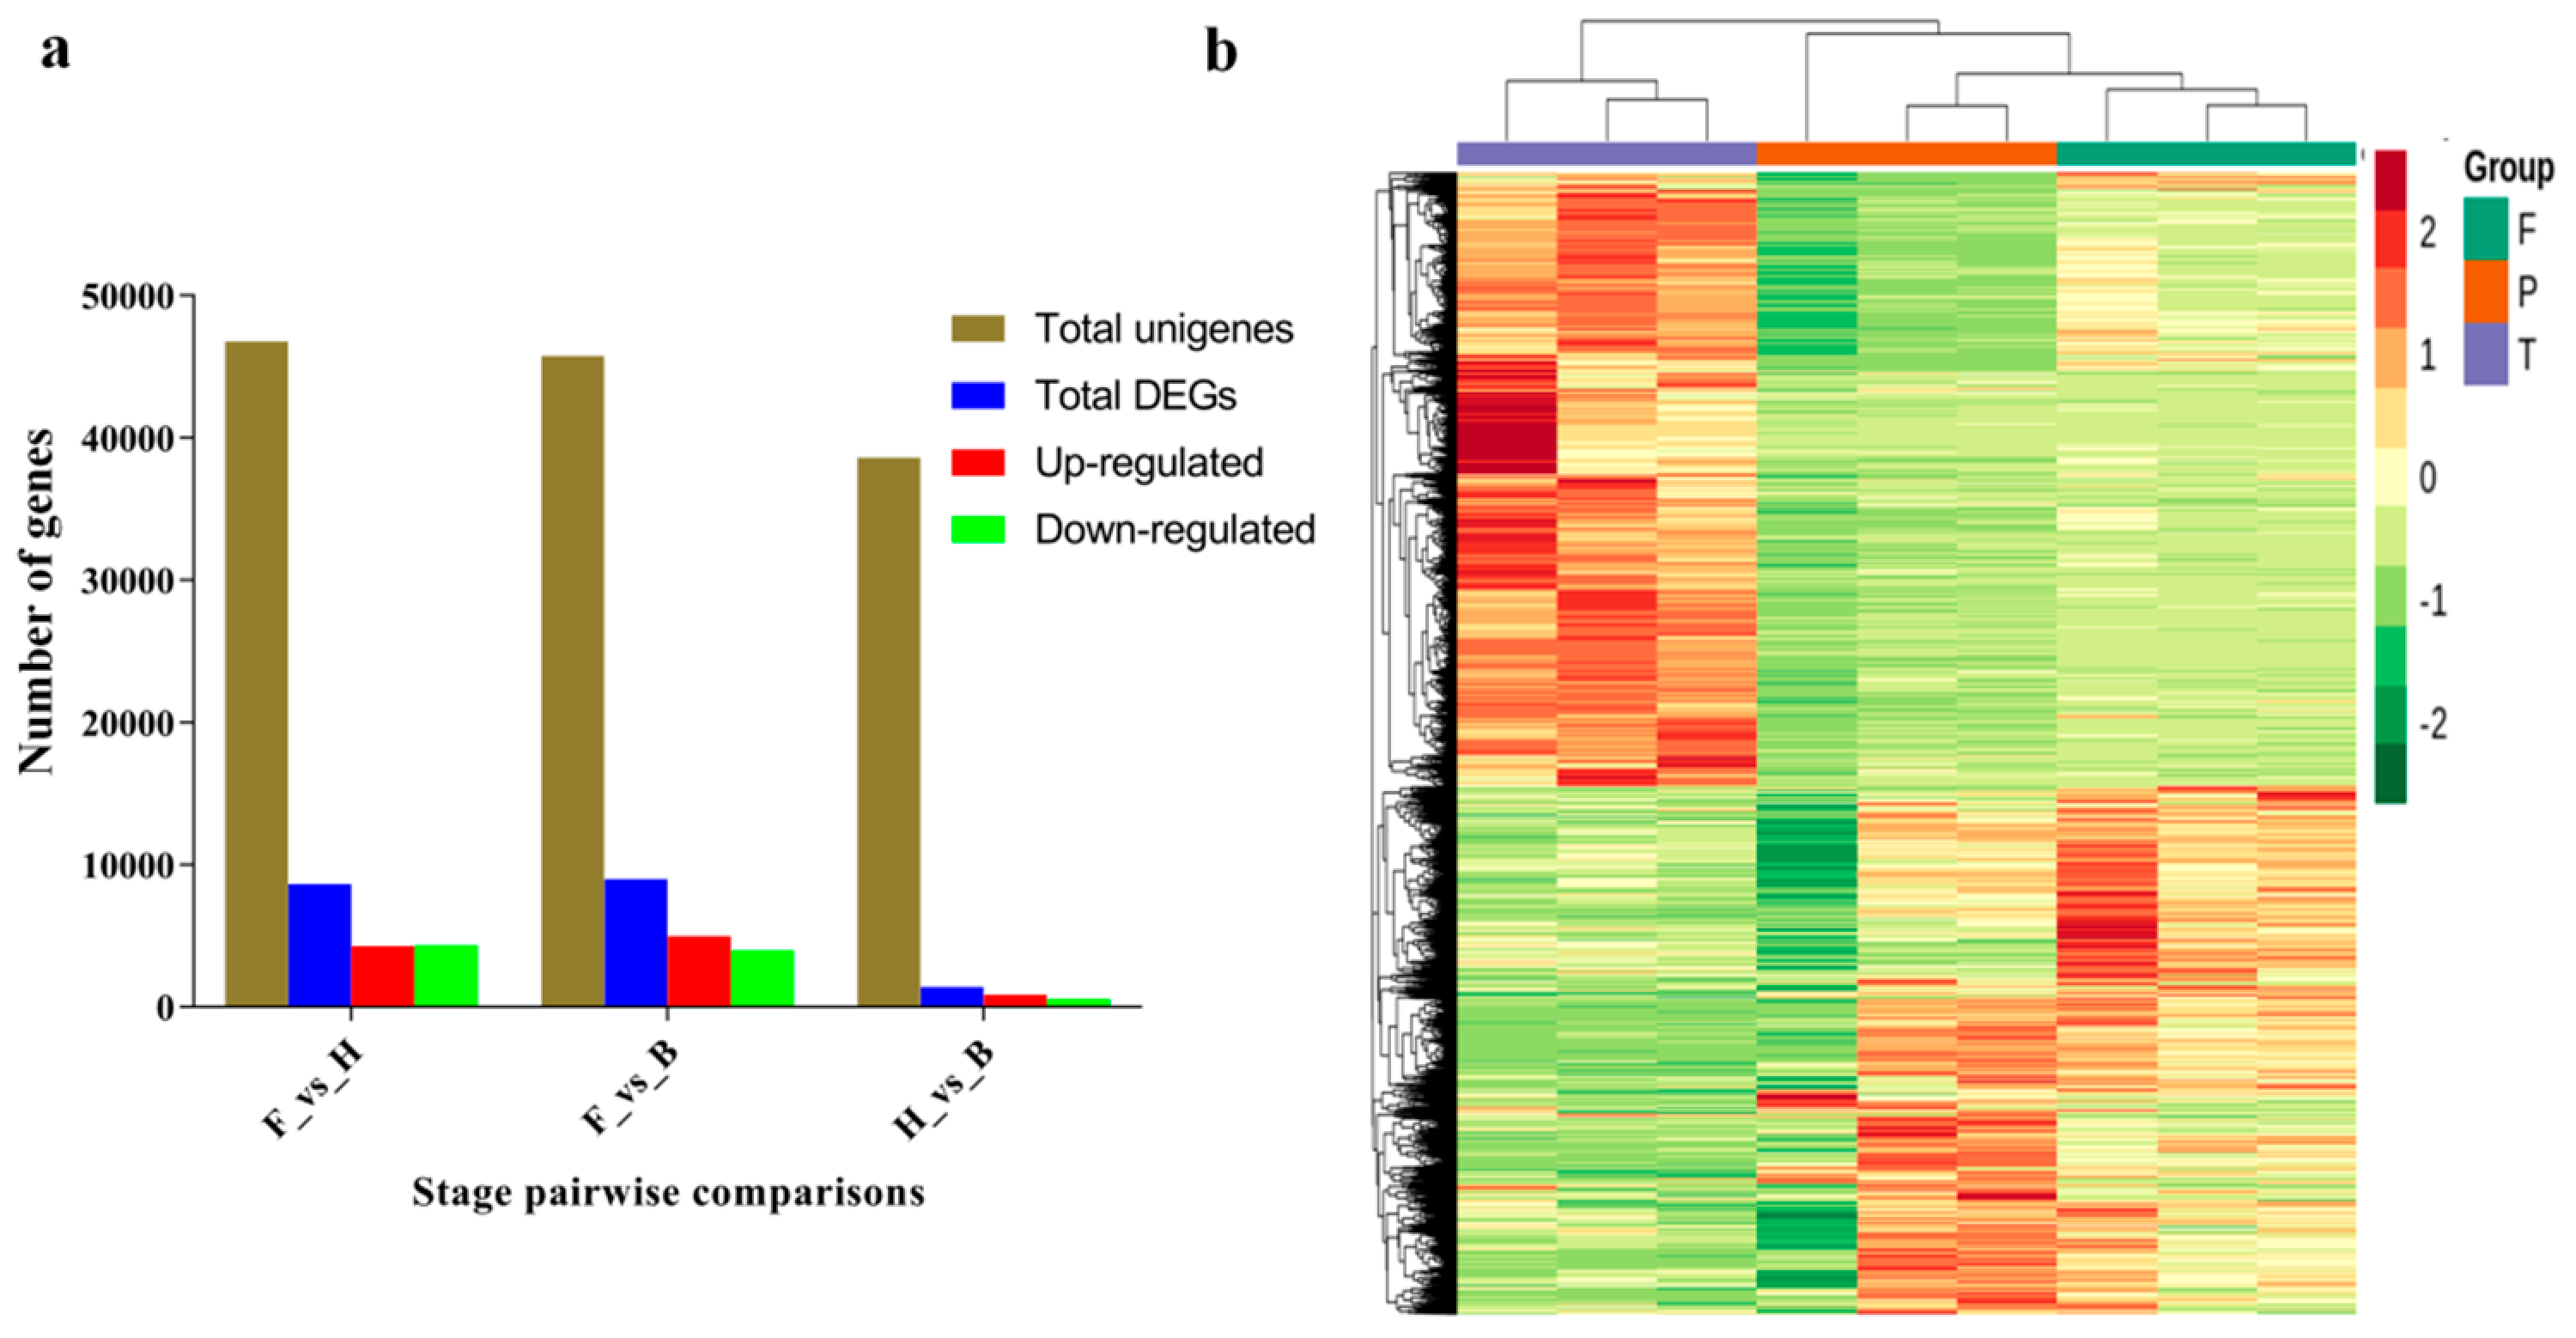
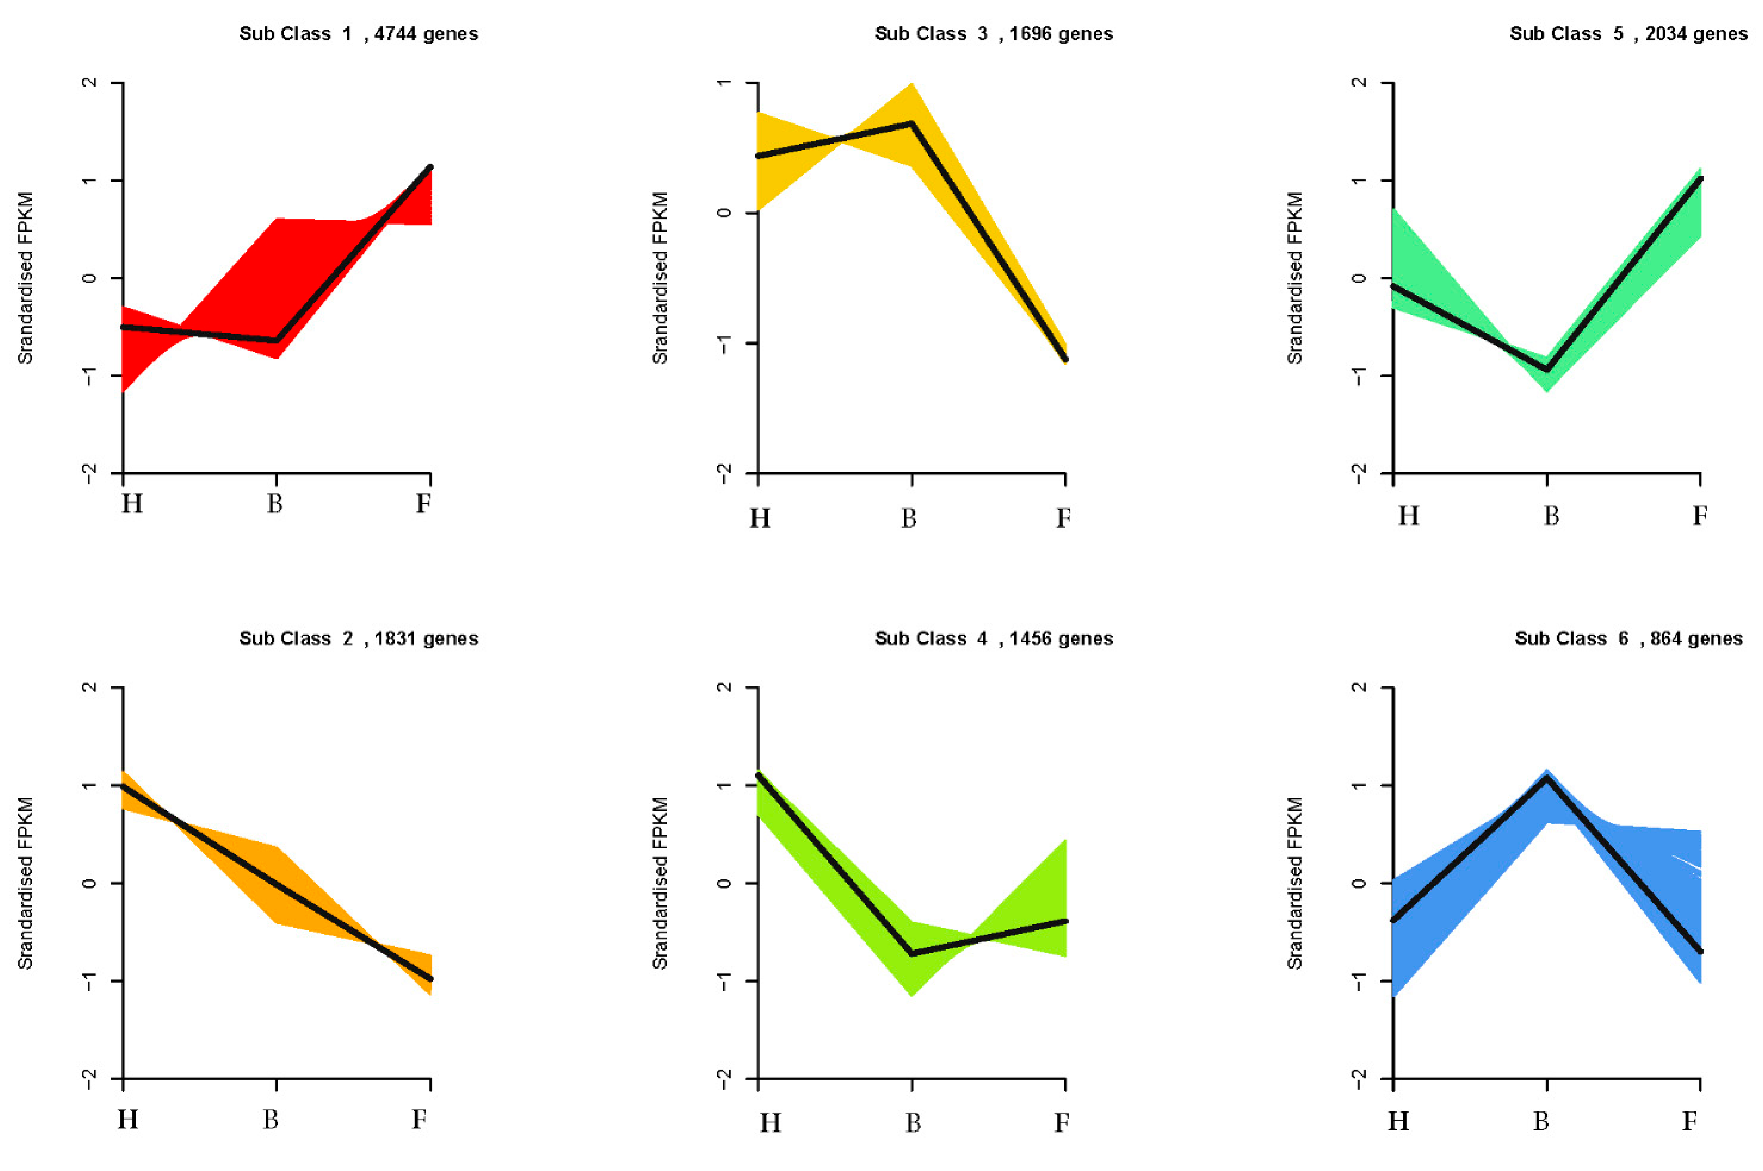
3.2. Differentially Expressed Genes and Functional Enrichment Analyses

Differentially expressed genes (DEGs) were selected based on a threshold of log2 fold change (log2FC) ≥ 1 and false discovery rate (FDR) ≤ 0.05. We obtained a total of 8627, 8993, and 1418 DEGs in F_vs_H, F_vs_B, and H_vs_B, respectively, from 46,770, 45,739, and 38,601 unigenes (Figure 4a; Additional file 3: Table S2a–c). Based on the DEGs, two main clusters of flower samples were obtained (Figure 4b). Cluster one mainly comprised F samples, whereas cluster two consisted of H and B samples. This implied that H and B samples had some similarity in transcriptional activity. This similarity might be due to relatively similar anthocyanin synthesis and accumulation at the half blooming stage (H) and full blooming stage (B). The ten DEGs selected for qRT-PCR to validate our RNA-seq data had similar relative expression pattern with the RNA-seq data (Additional file 4: Figure S2).
The DEGs obtained in each pairwise group were employed for the KEGG pathway enrichment analysis. From the KEGG pathway enrichment analysis based on the p-value of significance (Additional File 5: Table S3), the most significant pathways were phenylpropanoid biosynthesis, biosynthesis of secondary metabolites, plant hormone signal transduction, metabolic pathways, carotenoid biosynthesis, and the circadian rhythm of the plant. Given that phenylpropanoid (particularly anthocyanin biosynthesis pathway) and plant hormone signal transduction are well known to modulate color formation in plants, we focused on these as the candidate pathways to elucidate their involvement in petal/flower color formation in D. nestor.

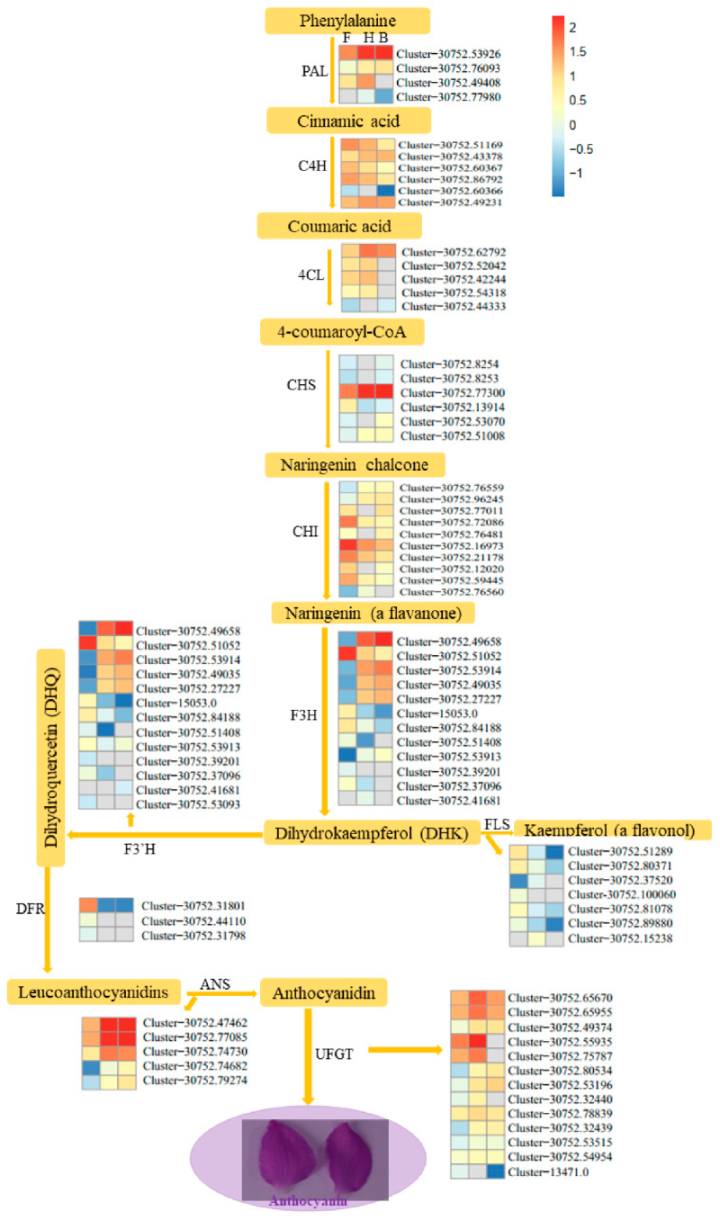
3.3. DEGs Involved in Anthocyanins Biosynthesis Pathway

The key determinant of flower color is the composition and concentrations of anthocyanins, carotenoids, and betalains as key pigments [25]. Anthocyanins are responsible for orange, pink, red, purple, blue, and blue-black flower colors [25,51]. Anthocyanins are flavonoids, which are a major offshoot of the highly branched phenylpropanoid pathway with several enzymes involved [52]. The main amino acid precursor for phenylpropanoids is phenylalanine (phenylalanine ammonia lyase, PAL). In our present study, four key genes (Cluster-30752.53926, Cluster-30752.76093, Cluster-30752.77980, and Cluster-30752.49408) linked to PAL were highly up-regulated in the H and B samples, as compared to the F sample, with the exception of Cluster-30752.49408, which had no expression in the P sample (Figure 5). Similarly, two out of six genes (Cluster-30752.43378 and Cluster-30752.49231) linked to cinnamate 4-hyroxylase (C4H) in converting cinnamic acid to coumaric acid were highly expressed in the H and B samples relative to the F sample. In addition, enzymes: 4-coumarateCoA ligase (4CL), chalcone synthase (CHS), chalcone isomerase (CHI), flavone 3-hydroxylase (F3H), flavonoid 3′-hydroxylase (F3′H) and flavonol synthase (FLS) were associated with 5, 6, 10, 12, 13, and 7 DEGs, respectively. Out of these, most were highly expressed in the H and B samples, as compared to the F sample (Figure 5). Surprisingly, three genes (Cluster-30752.31801, Cluster-30752.44110, and Cluster-30752.31798) linked to dihydroflavonol reductase (DFR) were more highly expressed in the F sample than either in the H or B sample; this enzyme converts Dihydroquercetin (DHQ) to Leucoanthocyanidins (Figure 5). Anthocyanidin synthase (ANS) converts the Leucoanthocyanidins to anthocyanidin and we identified five DEGs including, Cluster-30752.47462, Cluster-30752.77085, Cluster-30752.74730, Cluster-30752.74682, and Cluster-30752.79274. These genes were highly expressed in the H and B samples relative to the H sample (Figure 5). Thirteen DEGs encoding the UDP-flavonoid glucosyl transferase (UFGT) were more highly expressed in the H or B samples than in the F sample (Figure 5). These results showed that globally, most genes involved in the early and late steps of the anthocyanin biosynthetic pathway were strongly upregulated over the flower development stages in D. nestor and might be critical for the purple color formation.

3.4. Plant Hormone Signal Transduction

Beside environmental stimuli such as light and temperature, phytohormones (auxin, ethylene, cytokinins, salicylic acid, brassinosteroid, and abscisic acid (ABA)) significantly influence anthocyanin biosynthesis [54,55,56,57,58,59]. Most DEGs involved in auxin and ethylene were largely upregulated in the H and B samples relative to the F sample (Figure 6a,b). On the contrary, DEGs related to brassinosteroid, ABA, cytokinins, and salicylic acid were mostly repressed in the H and B samples, as compared to the F sample (Figure 6c–f). All phytohormones related to DEGs were clustered under the three samples (F, H, and B) into two sub-clusters. With the exception of cytokinins, all phytohormones clustered with the H and B samples into one sub-cluster, while the F sample was in another sub-cluster. This supports the trend of increasing purpleness, as observed in Figure 1. These trends showed various modulating roles of different phytohormones in color formation in D. nestor. In addition, these signify the important roles of plant hormone signal transduction in modulating petal color development in D. nestor.

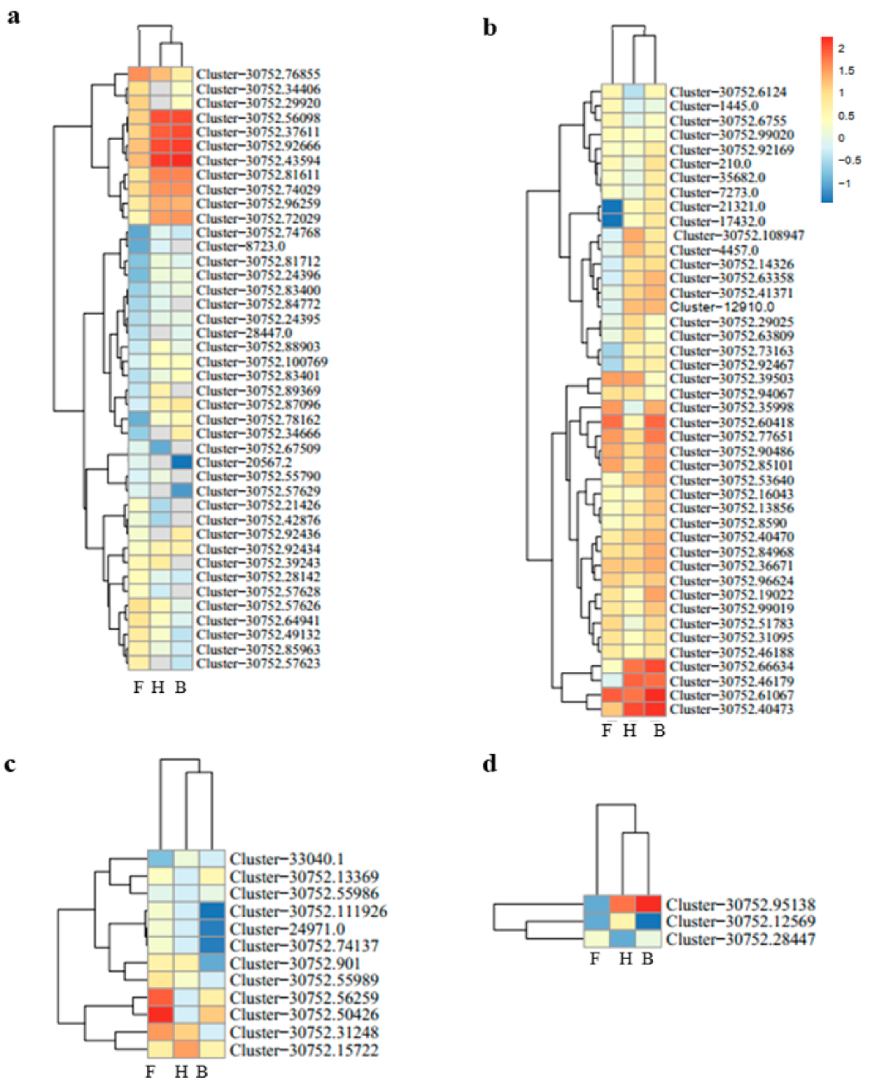
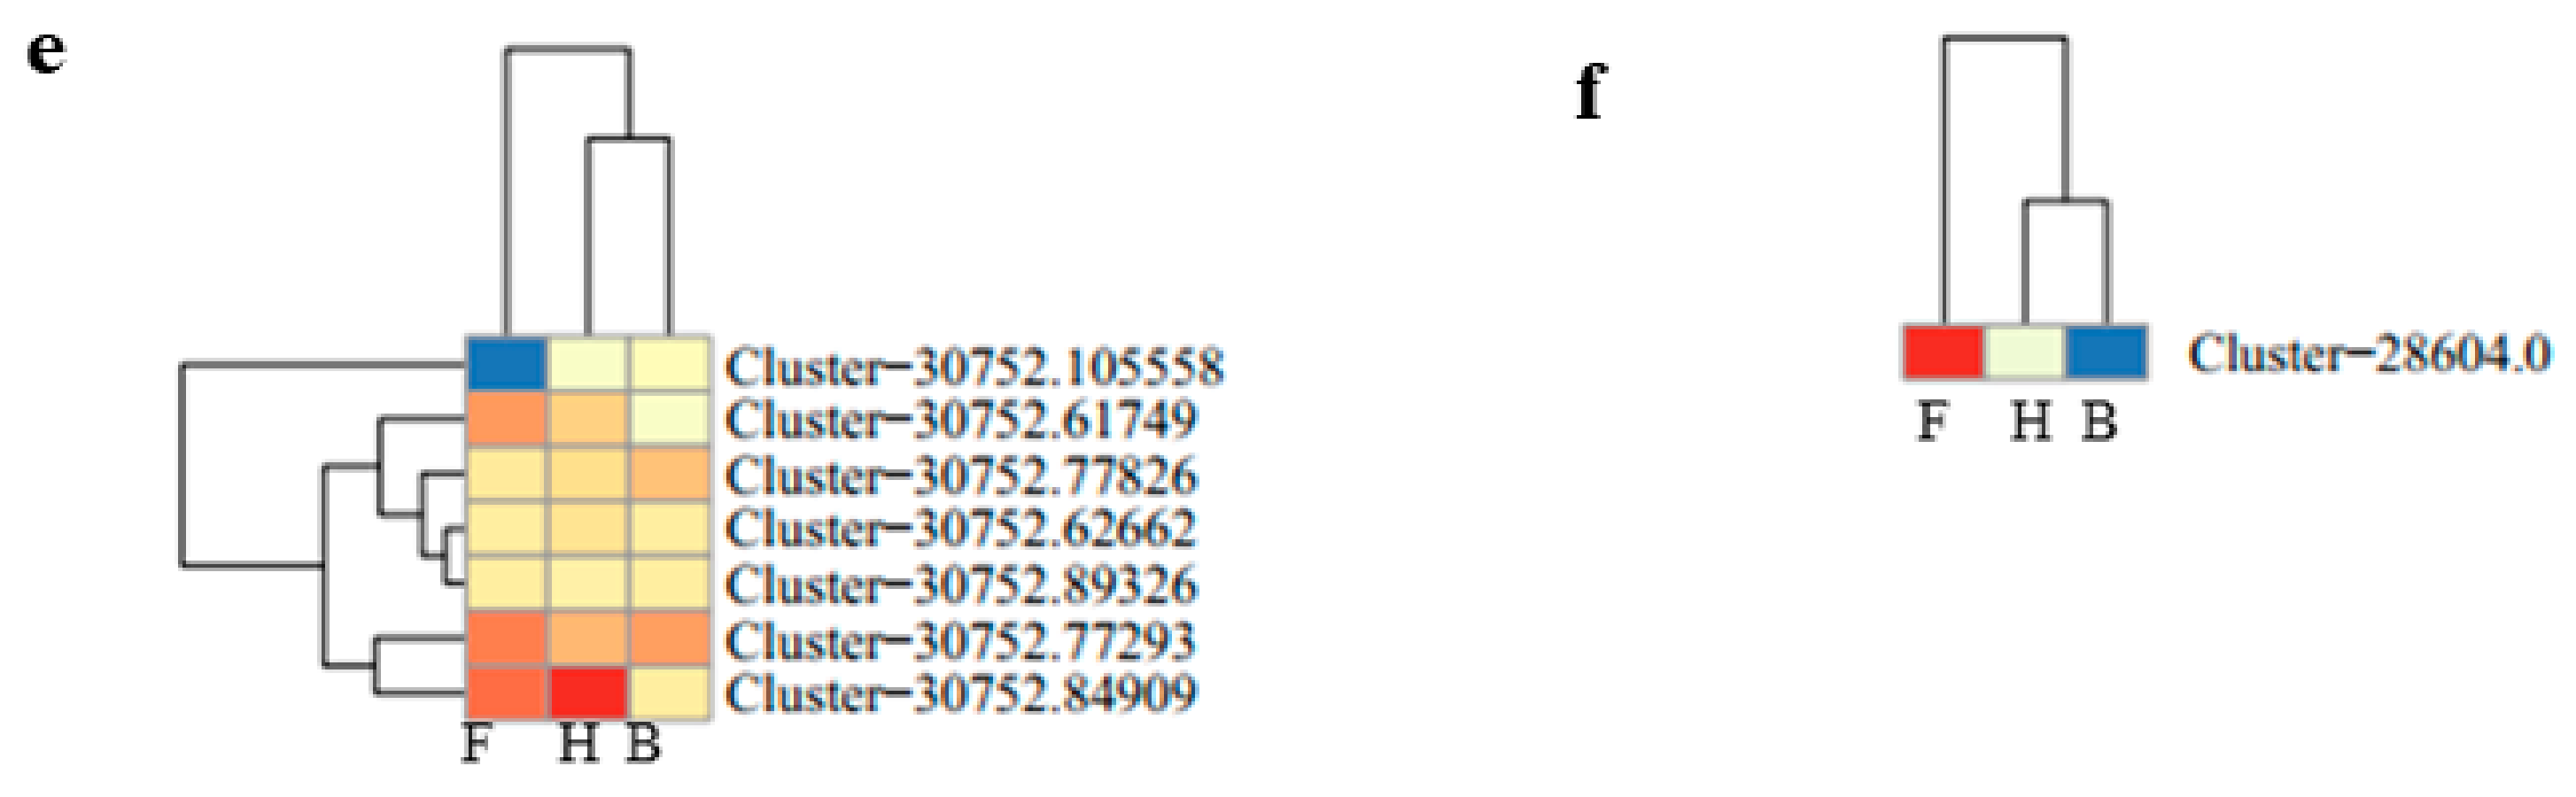
3.5. Identification of Transcription Factors Regulating Color Formation in the Petals/Flowers of D. nestor

Transcription factors (TFs) are the primary regulators of gene expression [60], of which many were predicted to modulate anthocyanin accumulation and biosynthesis in flowering plants. The sequences of DEGs obtained in each pairwise group were submitted to the plant transcription factor database to identify DEGs encoding for TFs. A total of 601 (F_vs_H), 583 (F_vs_B), and 116 (H_vs_B) DEGs encoding TF were detected, with varied degree of regulation (Additional File 6: Table S4a–c). The AP2/ERF, bHLH, bZIP, C2H2, C3H, HB, MADS-MIKC/MADS-M-type, NAC, and WRKY TFs were largely upregulated in F_vs_H and F_vs_B but were downregulated in H_vs_B (Table 2). However, C2C2, MYB, and Tify TFs were mostly downregulated in the three pairwise groups (Table 2).
In addition, a K-means clustering analysis based on the FPKM of 12,625 unique genes among the samples (F, H, and B) was conducted by following the procedure outlined by [61] to identify co-expressed modules. Importantly, the TFs co-expressed with the anthocyanin biosynthetic genes could play important roles in modulating purple coloration in the petal/flower of D. nestor. In all, six clusters of genes were detected (Figure 7). Most genes involved in the anthocyanin biosynthesis pathway were grouped in Cluster 1 with several TF family members, including MYB, bHLH, WRKY, and AP2/ERF (Additional file 7: Table S5). For instance, Cluster-30752.54898, Cluster-30752.54899, and Cluster-30752.54900 in Cluster 1 have bHLH-MYC and R2R3-MYB TFs N-terminal domain.
Genes involved in the anthocyanin pathways are differentially modulated in monocots and dicots by MYB, bHLH, and WD40 TFs [62,63]. Hence, we studied MYB and bHLH TFs further to deepen our understanding of their involvement in modulating purple flower color formation at three different stages in D nestor. A total of 53 and 50 genes with MYB and bHLH were profiled for their expressions among the F, H, and B samples, based on standardized FPKM values (Figure 8a,b). Most of these genes were largely upregulated (58.49% and 62%) in the F sample, as compared to the H and B samples. Five MYB TFs: Cluster-30752.45562, Cluster-30752.14638, Cluster-30752.37578, Cluster-30752.48958, and Cluster-30752.73483 and another five bHLH TFs: Cluster-30752.24208, Cluster-30752.33109, Cluster-30752.37946, Cluster-30752.89185, and Cluster-4068.0 potentially modulated increasing purple coloration from the F to the B sample. However, this needed further functional validation to ascertain their specific roles in color formation.

4. Discussion

Flowers offer visual appeal, and the commercial value of ornamental plants is markedly determined by petal color. Previous studies on floral coloration revealed species-specific distinctiveness in pigment regulation [25,64,65,66,67]. Additionally, the variations in floral coloration emanates from different processes, such as competition among pathways, expression patterns of structural genes involved in pigment formation, and mutations in structural or regulatory genes [24,68]. Thus, species-specific studies of flower color formation and the elucidation of their regulatory mechanisms are essential to deepen our understanding of flower color development in orchids. In plant breeding and horticulture, transcriptome sequencing is highly employed for predicting novel genes, gene function, and genome evolution [11]. Here, we performed whole-transcriptome sequencing to study the mechanism of purple color development in D. nestor petals, which is the first report, as compared to other Dendrobium species [13,69,70,71,72]. H and B samples might have relatively similar anthocyanins accumulation and synthesis, hence the high similarity as evident in Figure 1a,b and Figure 4b. We also reported the first ever SSR markers useful for future molecular breeding efforts in D. nestor (Figure 3, Additional file 2: Table S1).

4.1. Pathways Involved in Purple Color Formation in Petals of D. nestor at Different Stages of Development

Flowering plants exhibit a wide variation in their flora, foliage, and fruit colors, as a result of genetic factors and variations in environments. Flower color formation in orchids are controlled largely by anthocyanins, carotenoids, and betalains [25]. In this present study, petals/flowers of D. nestor were sampled at different developmental stages to conduct transcriptome sequencing. From the KEGG pathway enrichment analyses, the most prominent pathways were phenylpropanoid–flavonoid–anthocyanin biosynthesis, biosynthesis of secondary metabolites, plant hormone signal transduction, metabolic pathways, carotenoid biosynthesis, and the circadian rhythm plant biosynthesis pathway (Figure 4a–c; Additional file 5: Table S3). Ma et al. [73] and Luo et al. [74] reported these to be the predominant pathways in color formation in Vitus vinifera and Punica granatum, which was consistent with the results of this study.
Anthocyanins are flavonoids, which are a major offshoot of the highly branched phenylpropanoid pathway, with several prominent genes including, PAL, C4H, 4CL, CHS, CHI, F3H, F3′H, FLS, DFR, ANS, and UFGT [52]. Our results revealed most of the PAL, CHS, ANS, and UFGT genes involved in anthocyanins biosynthesis were up-regulated and increased in abundance in the H and B samples, as compared to the F sample (Figure 5). These genes might have contributed to the increasing purple coloration from the F sample to the H and B samples, as evidenced in Figure 1. The CHS provides the precursor for 4-coumaroyl-CoA to naringenin chalcone in the flavonoid biosynthesis pathway. The CHS encoded genes (Cluster-30752.8254, Cluster-30752.8253, Cluster-30752.53070, Cluster-30752.77300, and Cluster-30752.51008), which were highly expressed in the B sample, relative to the F and H samples. However, the latter two genes were more highly expressed in the H sample than F sample (Figure 5). These genes are involved in the key regulatory step during the synthesis of flavonoids, which is a major pigment in many flowers, leaves, and fruits [75,76]. The Naringenin is converted into several anthocyanin-related substances like dihydrokaempferol, by the action of the F3H encoded genes, which were mostly expressed the most in the B samples than either the F or H samples (Figure 5). Earlier study identified PaCHS as one of the modulators of purple coloration in Phalaenopsis amabilis [77]. SlCHS contributes to red coloration in tomato [78], while CaCHS regulates anthocyanin-pigmented fruits in Capsicum annuum [79]. The ANS converts the leucoanthocyanidins to anthocyanidins (Figure 5). It was previously reported that CaANS increases from the young stage and reaches maximum at the late unripe stage, prior to ripening in C. annuum [79]. A similar trend was observed for the five ANS genes (Cluster-30752.47462, Cluster-30752.77085, Cluster-30752.74730, Cluster-30752.74682, and Cluster-30752.79274) in the three samples of flowers (Figure 5). Similarly, expression levels of genes encoding ANS were upregulated and the abundance of their corresponding proteins also increased during fruit color development [74]. Another prominent gene, UFGT, which glycolyzes anthocyanidin into anthocyanin [80], gene13307, and gene43584 were down-regulated in the low anthocyanin Yunyan 87 mutant of tobacco [81]. In our study, ten UFGT genes (Cluster-30752.65670, Cluster-30752.65955, Cluster-30752.49374, Cluster-30752.55935, Cluster-30752.75787, Cluster-30752.80534, Cluster-30752.53196, Cluster-30752.32440, Cluster-30752.78839, Cluster-30752.32439, Cluster-30752.53515, and Cluster-30752.54954) were highly expressed in the H and the B sample, as compared to that of the F sample (Figure 5).
Anthocyanin biosynthesis pathway is modulated by a number of phytohormones [54,55,56,57,58,59]. He et al. (2020) highlighted that endogenous auxin (indole acetic acid) and ABA play diverse and specific roles in D. officinale color development. In our study, 25 of the 43 genes involved in auxin signaling pathway were more highly expressed in either the H or the B samples than in the F samples (Figure 6a). This is not surprising as auxins (naphthalene acetic acid) or 2,4-dichlorophenoxyacetic acid modulates secondary metabolic pathways, including those related to phenylpropanoid, flavonoid, and anthocyanin metabolism [82,83]. Additionally, most genes involved in ethylene signaling were upregulated in the largely anthocyanin-accumulated samples (H or B) (Figure 6b). This contradicted reports by Jeong et al. [55] that ethylene signaling negatively regulates anthocyanin accumulation. Our results provide evidence of phenylpropanoid–flavonoid–anthocyanin biosynthesis, and plant hormone signal transduction pathways modulating flower coloration in D. nestor. Although in this study we provided a good insight into the expression patterns of the anthocyanin-biosynthesis-pathway-related structural genes, we did not perform any analytical analysis to identify the key pigments conferring the purple coloration in D. nestor petals. Hence, we are designing a future study that would clarify this to consolidate the molecular data reported in the present work.

4.2. Transcriptional Regulation of Purple Color Formation in D. nestor

Gene expression is a complex process and involves the coordination of multi-dynamic events, which are subject to multi-level regulation [84], including transcriptional, post-transcriptional, translational, and post-translational events. Transcription factors (TF) perform two important roles in flowering plants—they recognize and bind to short, specific sequences of DNA within the regulatory region. Second, they recruit or bind to proteins that participate in transcriptional regulation [85]. The most abundant TFs predicted in this study were AP2/ERF, AUX/IAA, bHLH, bZIP, MYB, NAC, Tify, WRKY, and other families (Table 2; Additional File 6: Table S4a–c). The class of TFs identified were previously implicated in the modulation of color formation in petals/flowers of orchids, such as roses [29,30,31]. For example, five bHLH-MYC and R2R3-MYB were more highly expressed in the H and B samples than in the T samples (Additional File 6: Table S4b,c). These indicate that some bHLH and MYB TFs were positive regulators of anthocyanins biosynthesis in D. nestor. These were in consonance with earlier reports that anthocyanins biosynthesis is transcriptionally regulated by the MYB–bHLH–WD40 complex [22,86,87]. In apple, MdMYB1 and its alleles, MdMYB10 and MdMYBA, act as positive modulators of anthocyanin biosynthesis, by activating the expressions of MdDFR and MdUF3GT [88,89,90]. On the contrary, downregulation of MdMYB1 inhibits anthocyanin accumulation mediated by ethylene, abscisic acid (ABA), wounding, drought, and different light intensities [91,92,93,94]. Another abundant TF family, WRKY, was highly expressed in the H and B samples, as compared to the F samples, indicating that WRKY play a significant role in modulating anthocyanins biosynthesis. Recent studies on proanthocyanin and anthocyanin biosynthesis pathways in Arabidopsis and Petunia revealed that WRKY regulates the color development in concert with the MYB–bHLH–WD40 complex [95,96].
Similarly, most genes with NAC TFs increased in expression from the F, to the H and B samples. In peach (Prunus persicae), PpNAC1 activates the transcription of PpMYB10.1, leading to anthocyanin pigmentation in tobacco and apple [97,98]. In contrast, PpNAC1 was silenced resulting in a reduction in anthocyanin pigmentation in blood-fleshed peaches [97]. We employed a K-means clustering, as proposed earlier by Handhayani and Hiryanto [61], which permitted the clustering of 12,625 unique genes among the samples (F, H, and B ) into six sub-clusters with some members in Cluster 1 associated with genes from the MYB and bHLH TFs. The members in the six sub-clusters might be exploited for further downstream analyses to unravel the regulatory mechanisms of flower color formation in D. nestor.

4.3. SSR Markers Discovered for Practical D. nestor Breeding

Transcriptome data provide fast and cost-effective development of molecular markers for practical plant breeding [99,100]. Specifically, SSR markers are useful tools for genomic studies and plant breeding. We detected a total of 41,286 SSR markers and developed 41,285 primers for these markers (Figure 3, Additional File 2: Table S1). It is expected that these molecular markers would facilitate genotyping and marker-assisted breeding in D. nestor and other related species.

5. Conclusions

We performed transcriptome analyses to study the molecular mechanisms that regulate flower color development in D. nestor. We showed that flower coloration in D. nestor is largely controlled by anthocyanins biosynthetic genes. The structural genes and co-expressed TFs reported in this study would serve as useful genetic resources for further functional characterization and molecular breeding programs in D. nestor.

Supplementary Materials

The following are available online at https://www.mdpi.com/2075-1729/11/2/113/s1, Figure S1. Distribution of transcript lengths and unigenes (n = total number). Figure S2. Relative expression of selected differentially expressed genes for quantitative polymerase chain reaction (qRT-PCR), among the three samples (F = flower bud stage; H = half blooming stage; B = full blooming stage). The error bar represents standard error of means. The correlation plot was constructed using qRT-PCR and RNA-seq data. *,**,*** represent significant difference between F samples and H / B samples at p < 0.05, 0.01, 0.001, respectively. Table S1. Primers for specific simple sequence repeats detected in each unigene (designed usingPrimer3 software). Table S2a. Differentially expressed genes detected in F_vs_H and their functional annotations. Table S2b. Differentially expressed genes detected in F_vs_B and their functional annotations. Table S2c. Differentially expressed genes detected in H_vs_B and their functional annotations. Table S3. Predominant pathways detected from Kyoto Encyclopedia of Genes and Genomes database with differentially expressed genes mutually detected among the three pairwise groups. Table S4a. Transcription factors identified among the differentially expressed genes in F_vs_H. Table S4b. Transcription factors identified among the differentially expressed genes in F_vs_B. Table S4c. Transcription factors identified among the differentially expressed genes in H_vs_B. Table S5. K-means clustering analysis based on the FPKM of 12625 unique genes among the samples (F, H and B). Table S6. Primers of selected genes used for the qRT-PCR.

Author Contributions

X.C., J.L., and Z.Z. conceived and designed the experiments. X.C., J.D., C.H., X.T., X.L. (Xianmin Li), and X.L. (Xiuling Li) performed the experiments and bioinformatic analyses. X.C. and J.D. performed the qRT-PCR analysis. X.C. drafted the manuscript. J.L. and Z.Z. revised the paper and provided financial support. All authors read and approved the final version of the manuscript.

Funding

This work was supported by the Science and Technology Major Project of Guangxi (GuiKe AA17204026; GuiKe AA17204045-6) and Guangxi Key Research and Development Plan Project (GK AB16380061). The funding agencies had no roles in the design of the study, in the collection, analyses, and interpretation of the data, or in the writing of the manuscript.

Data Availability Statement

The datasets used or analyzed during the current study are available from the corresponding author upon reasonable request. The transcriptome raw reads were deposited in the Sequence Reads Archive (SRA) of the National Center for Biotechnology Information (NCBI), under the BioProject number PRJNA680853. The transcriptome raw reads have been deposited in the Sequence Reads Archive of the National Center for Biotechnology Information under the BioProject number PRJNA680853.

Conflicts of Interest

The authors declare no conflict of interest.

Abbreviations

COGClusters of orthologous groups of proteins
DEGsDifferentially expressed genes
FPKMFragments per kilobase of transcript per million fragments mapped
KEGGKyoto Encyclopedia of Genes and Genomes
KOGEukaryotic Clusters of Orthologous Groups
MISAMIcroSAtellite identification Single nucleotide polymorphisms
NrNon-redundant protein sequence database
ORFOpen reading frame
SSRSimple sequence repeats
STEMShort time-series expression miner
TFsTranscription factors
TrEMBLTranslated European molecular biology laboratory

References

  1. Yan, L.; Wang, X.; Liu, H.; Tian, Y.; Lian, J.; Yang, R.; Hao, S.; Wang, X.; Yang, S.; Li, Q.; et al. The genome of dendrobium officinale illuminates the biology of the important traditional Chinese orchid herb. Mol. Plant 2015, 8, 922–934. [Google Scholar]
  2. Chase, M.W.; Cameron, K.M.; Freudenstein, J.V.; Pridgeon, A.M.; Salazar, G.; van den Berg, C.; Schuiteman, A. An updated classification of Orchidaceae. Bot. J. Linn. Soc. 2015, 177, 151–174. [Google Scholar] [CrossRef] [Green Version]
  3. Tang, H.; Zhao, T.; Sheng, Y.; Zheng, T.; Fu, L.; Zhang, Y. Dendrobium officinale Kimura et Migo: A Review on Its Ethnopharmacology, Phytochemistry, Pharmacology, and Industrialization. Evid. based Complement. Altern. Med. 2017, 93, 1795–1803. [Google Scholar] [CrossRef] [PubMed] [Green Version]
  4. Zhitao, N.; Shuying, Z.; Jiajia, P.; Ludan, L.; Jing, S.; Xiaoyu, D. Comparative analysis of Dendrobium plastomes and utility of plastomic mutational hotspots. Sci. Rep. 2017, 7, 1–11. [Google Scholar] [CrossRef] [PubMed] [Green Version]
  5. Riechmann, J.L.; Heard, J.; Martin, G.; Reuber, L.; Jiang, C.Z.; Keddie, J.; Adam, L.; Pineda, O.; Ratcliffe, O.J.; Samaha, R.R.; et al. Arabidopsis transcription factors: Genome-wide comparative analysis among eukaryotes. Science 2000, 290, 2105–2110. [Google Scholar] [CrossRef]
  6. Cazzonelli, C.I.; Pogson, B.J. Source to sink: Regulation of carotenoid biosynthesis in plants. Trends Plant Sci. 2010, 15, 266–274. [Google Scholar] [CrossRef]
  7. Balilashaki, K.; Zakizadeh, H.; Olfati, J.A.; Vahedi, M.; Kumar, A.; Indracanti, M. Recent Advances in Phalaenopsis Orchid Improvement using Omics Approaches. Plant Tissue Cult. Biotechnol. 2019, 29, 133–149. [Google Scholar] [CrossRef]
  8. Rebecca, O.P.S.; Boyce, A.N.; Chandran, S. Pigment identification and antioxidant properties of red dragon fruit (Hylocereus polyrhizus). African J. Biotechnol. 2010, 9, 1450–1454. [Google Scholar]
  9. Zhang, S.; Zhang, A.; Wu, X.; Zhu, Z.; Yang, Z.; Zhu, Y.; Zha, D. Transcriptome analysis revealed expression of genes related to anthocyanin biosynthesis in eggplant (Solanum melongena L.) under high-temperature stress. BMC Plant Biol. 2019, 19, 1–13. [Google Scholar] [CrossRef] [Green Version]
  10. Yang, X.; Xia, X.; Zhang, Z.; Nong, B.; Zeng, Y.; Wu, Y.; Xiong, F.; Zhang, Y.; Liang, H.; Pan, Y.; et al. Identification of anthocyanin biosynthesis genes in rice pericarp using PCAMP. Plant Biotechnol. J. 2019, 17, 1700–1702. [Google Scholar] [CrossRef] [Green Version]
  11. Rameneni, J.J.; Choi, S.R.; Chhapekar, S.S.; Man-Sun, K.; Singh, S.; Yi, S.Y.; Heon, O.S.; Kim, H.; Lee, C.Y.; Man-Ho, O.; et al. Red Chinese cabbage transcriptome analysis reveals structural genes and multiple transcription factors regulating reddish purple color. Int. J. Mol. Sci. 2020, 21, 2901. [Google Scholar] [CrossRef] [PubMed] [Green Version]
  12. Wang, L.S.; Shiraishi, A.; Hashimoto, F.; Aoki, N.; Shimizu, K.; Sakata, Y. Analysis of petal anthocyanins to investigate flower coloration of Zhongyuan (Chinese) and Daikon Island (Japanese) tree peony cultivars. J. Plant Res. 2001, 114, 33–43. [Google Scholar] [CrossRef]
  13. He, C.; Liu, X.; Teixeira da Silva, J.A.; Liu, N.; Zhang, M.; Duan, J. Transcriptome sequencing and metabolite profiling analyses provide comprehensive insight into molecular mechanisms of flower development in Dendrobium officinale (Orchidaceae). Plant Mol. Biol. 2020, 104, 529–548. [Google Scholar] [CrossRef] [PubMed]
  14. Zhu, H.H.; Yang, J.X.; Xiao, C.H.; Mao, T.Y.; Zhang, J.; Zhang, H.Y. Differences in flavonoid pathway metabolites and transcripts affect yellow petal colouration in the aquatic plant Nelumbo nucifera. BMC Plant Biol. 2019, 19, 277. [Google Scholar] [CrossRef]
  15. Yamagishi, M. How genes paint lily flowers: Regulation of colouration and pigmentation patterning. Sci. Hortic. 2013, 163, 27–36. [Google Scholar] [CrossRef]
  16. Koseki, M.; Goto, K.; Masuta, C.; Kanazawa, A. The star-type color pattern in Petunia hybrid ‘Red Star’ flowers is induced by sequence-specific degradation of chalcone synthase RNA. Plant Cell Psysiol. 2005, 46, 1879–1883. [Google Scholar] [CrossRef] [Green Version]
  17. Holton, T.A.; Brugliera, F.; Tanaka, Y. Cloning and expression of flavonol synthase from Petunia hybrida. Plant J. 1993, 4, 1003–1010. [Google Scholar] [CrossRef]
  18. Falcone Ferreyra, M.L.; Rius, S.P.; Casati, P. Flavonoids: Biosynthesis, biological functions, and biotechnological applications. Front. Plant Sci. 2012, 3, 1–15. [Google Scholar] [CrossRef] [Green Version]
  19. Stenbaek, A.; Jensen, P.E. Redox regulation of chlorophyll biosynthesis. Phytochemistry 2010, 71, 853–859. [Google Scholar] [CrossRef]
  20. Mudalige-Jayawickrama, R.G.; Champagne, M.M.; Hieber, A.D.; Kuehnle, A.R. Cloning and characterization of two anthocyanin biosynthetic genes from Dendrobium orchid. J. Am. Soc. Hortic. Sci. 2005, 130, 611–618. [Google Scholar] [CrossRef]
  21. Whang, S.S.; Um, W.S.; Song, I.J.; Lim, P.O.; Choi, K.; Park, K.W.; Kang, K.W.; Choi, M.S.; Koo, J.C. Molecular Analysis of Anthocyanin Biosynthetic Genes and Control of Flower Coloration by Flavonoid 3′,5′-Hydroxylase (F3′5′H) in Dendrobium moniliforme. J. Plant Biol. 2011, 54, 209–218. [Google Scholar] [CrossRef]
  22. Jaakola, L. New insights into the regulation of anthocyanin biosynthesis in fruits. Trends Plant Sci. 2013, 18, 477–483. [Google Scholar] [CrossRef] [PubMed] [Green Version]
  23. Winkel-Shirley, B. Flavonoid biosynthesis. A colorful model for genetics, biochemistry, cell biology, and biotechnology. Plant Physiol. 2001, 126, 485–493. [Google Scholar] [CrossRef] [PubMed] [Green Version]
  24. Grotewold, E. The genetics and biochemistry of floral pigments. Annu. Rev. Plant Biol. 2006, 57, 761–780. [Google Scholar] [CrossRef] [PubMed]
  25. Davies, K.M.; Schwinn, K.E. Molecular biology and biotechnology of flower pigments. In Plant Developmental Biology; Pua, E.C., Davey, M.R., Eds.; Springer: Berlin/Heidelberg, Germany, 2010; pp. 161–187. ISBN 9783642046698. [Google Scholar]
  26. Quattrocchio, F.; Wing, J.F.; Van der Woude, K.; Mol, J.N.M.; Koes, R. Analysis of bHLH and MYB domain proteins: Species-specific regulatory differences are caused by divergent evolution of target anthocyanin genes. Plant J. 1998, 13, 475–488. [Google Scholar]
  27. Tian, J.; Chen, M.C.; Zhang, J.; Li, K.T.; Song, T.T.; Zhang, X.; Yao, Y.C. Characteristics of dihydroflavonol 4-reductase gene promoters from different leaf colored Malus crabapple cultivars. Hortic. Res. 2017, 4, 17070. [Google Scholar] [CrossRef] [Green Version]
  28. Arrom, L.; Munné-Bosch, S. Hormonal changes during flower development in floral tissues of Lilium. Planta 2012, 236, 343–354. [Google Scholar] [CrossRef]
  29. Eugster, C.H.; Märki-Fischer, E. The Chemistry of Rose Pigments. Angew. Chem. Int. Ed. Engl. 1991, 30, 654–672. [Google Scholar] [CrossRef]
  30. Lu, J.; Zhang, Q.; Lang, L.; Jiang, C.; Wang, X.; Sun, H. Integrated Metabolome and Transcriptome Analyses Reveal the Molecular Mechanism of a Color Mutation in Miniature Roses. BMC Plant Biol. 2019, 20, 611. [Google Scholar]
  31. Li, D.; Liu, X.; Shu, L.; Zhang, H.; Zhang, S.; Song, Y.; Zhang, Z. Global analysis of the AP2 / ERF gene family in rose ( Rosa chinensis ) genome unveils the role of RcERF099 in Botrytis resistance. BMC Plant Biol. 2020, 20, 1–15. [Google Scholar] [CrossRef]
  32. Grabherr, M.G.; Haas, B.J.; Yassour, M.; Levin, J.Z.; Thompson, D.A.; Amit, I.; Adiconis, X.; Fan, L.; Raychowdhury, R.; Zeng, Q.; et al. Full-length transcriptome assembly from RNA-Seq data without a reference genome. Nat. Biotechnol. 2011, 29, 644–652. [Google Scholar] [CrossRef] [PubMed] [Green Version]
  33. Anders, S.; Pyl, P.T.; Huber, W. HTSeq-A Python framework to work with high-throughput sequencing data. Bioinformatics 2015, 31, 166–169. [Google Scholar] [CrossRef] [PubMed]
  34. Chen, C.; Chen, H.; He, Y.; Xia, R. TBtools, a Toolkit for Biologists integrating various biological data handling tools with a user-friendly interface. Mol. Plant 2020, 13, 1194–1202. [Google Scholar] [CrossRef] [PubMed]
  35. Andrews, S. FASTQC A Quality Control tool for High Throughput Sequence Data. Babraham Inst. 2015, 12, 20–30. [Google Scholar]
  36. Galperin, M.Y.; Makarova, K.S.; Wolf YI, K.E. Expanded microbial genome coverage and improved protein family anno- tation in the COG database. Nucleic. Acids Res. 2014, 43, D261–D269. [Google Scholar] [CrossRef] [PubMed]
  37. Gene Ontology Consortium. Gene ontology consortium: Going forward. Nucleic Acids Res. 2014, 43, D1049–D1056. [Google Scholar]
  38. Kanehisa, M.; Sato, Y.; Kawashima, M.; Furumichi, M.; Tanabe, M. KEGG as a reference resource for gene and protein annotation. Nucleic Acids Res. 2016, 32, 277–280. [Google Scholar] [CrossRef] [PubMed] [Green Version]
  39. Finn, R.D.; Coggill, P.; Eberhardt, R.Y.; Eddy, S.R.; Mistry, J.; Mitchell, A.L.; Potter, S.C.; Punta, M.; Qureshi, M.; Sangrador-Vegas, A.; et al. The Pfam protein families database: Towards a more sustainable future. Nucleic Acids Res. 2016, 44, D279–D285. [Google Scholar]
  40. Bairoch, A.; Apweiler, R. The SWISS-PROT protein sequence database and its supplement TrEMBL in 2000. Nucleic Acids Res. 2000, 28, 45–48. [Google Scholar] [CrossRef]
  41. Deng, Y.Y.; Li, J.Q.; Wu, S.F.; Zhu, Y.P.; Chen, Y.W.; He, F.C. Integrated nr database in protein annotation system and its localization. Nat. Commun. 2010, 32, 71–72. [Google Scholar]
  42. R Development Core Team R: A Language and Environment for Statistical Computing. R Found. Stat. Comput. 2013, 4, 2–7.
  43. Benjamini, Y.; Hocheberg, Y. Controlling the false discovery rate-A practical and powerful approach to multiple testing. J. Roy. Stat. Soc. Ser. 1995, B57, 289–300. [Google Scholar] [CrossRef]
  44. Ernst, J.; Bar-Joseph, Z. STEM: A tool for the analysis of short time series gene expression data. BMC Bioinform 2006, 7, 191. [Google Scholar] [CrossRef] [PubMed] [Green Version]
  45. Camacho, C.; Coulouris, G.; Avagyan, V.; Ma, N.; Papadopoulos, J.; Bealer, K.; Madden, T.L. BLAST+: Architecture and applications. BMC Bioinform. 2009, 10, 421. [Google Scholar] [CrossRef] [PubMed] [Green Version]
  46. Rice, P.; Longden, L.; Bleasby, A. EMBOSS: The European Molecular Biology Open Software Suite. Trends Genet. 2000, 16, 276–277. [Google Scholar] [CrossRef]
  47. Mistry, J.; Finn, R.D.; Eddy, S.R.; Bateman, A.; Punta, M. Challenges in homology search: HMMER3 and convergent evolution of coiled-coil regions. Nucleic Acids Res. 2013, 41, e121. [Google Scholar] [PubMed] [Green Version]
  48. Zhang, H.; Jin, J.; Tang, L.; Zhao, Y.; Gu, X.; Gao, G.; Luo, J. PlantTFDB 2.0: Update and improvement of the comprehensive plant transcription factor database. Nucleic Acids Res. 2011, 9, D1114–D1117. [Google Scholar] [CrossRef] [PubMed] [Green Version]
  49. Untergasser, A.; Cutcutache, I.; Koressaar, T.; Ye, J.; Faircloth, B.C.; Remm, M.; Rozen, S.G. Primer3-new capabilities and interfaces. Nucleic Acids Res. 2012, 40, e115. [Google Scholar] [CrossRef] [Green Version]
  50. KJ Livak, T.S. Analysis of relative gene expression data using real-time quantitative PCR and the 2−ΔΔCT method. Methods 2001, 25, 402–408. [Google Scholar] [CrossRef]
  51. Tanaka, Y.; Sasaki, N.; Ohmiya, A. Biosynthesis of plant pigments: Anthocyanins, betalains and carotenoids. Plant J. 2008, 54, 733–749. [Google Scholar] [CrossRef]
  52. Irani, N.G.; Hernandez, J.M.; Grotewold, E. Regulation of anthocyanin pigmentation. In Recent Advances in Phytochemistry; Springer: New York, NY, USA, 2003; pp. 59–78. [Google Scholar]
  53. Kolde, R. Pheatmap: Pretty Heatmaps, R package version 1.0.12, R Packag. version 1.0.8; 015. 2019.
  54. Rowan, D.D.; Cao, M.; Lin-Wang, K.; Cooney, J.M.; Jensen, D.J.; Austin, P.T.; Hunt, M.B.; Norling, C.; Hellens, R.P.; Schaffer, R.J.; et al. Environmental regulation of leaf colour in red 35S:PAP1 Arabidopsis thaliana. New Phytol. 2009, 182, 102–115. [Google Scholar] [CrossRef] [PubMed]
  55. Jeong, S.W.; Das, P.K.; Jeoung, S.C.; Song, J.Y.; Lee, H.K.; Kim, Y.K.; Kim, W.J.; Il Park, Y.; Yoo, S.D.; Choi, S.B.; et al. Ethylene suppression of sugar-induced anthocyanin pigmentation in arabidopsis. Plant Physiol. 2010, 154, 1514–1531. [Google Scholar] [CrossRef] [PubMed] [Green Version]
  56. Das, P.K.; Shin, D.H.; Choi, S.B.; Yoo, S.D.; Choi, G.; Park, Y. Il Cytokinins enhance sugar-induced anthocyanin biosynthesis in Arabidopsis. Mol. Cells 2012, 34, 93–101. [Google Scholar] [CrossRef] [PubMed] [Green Version]
  57. Li, G.; Zhao, J.; Qin, B.; Yin, Y.; An, W.; Mu, Z.; Cao, Y. ABA mediates development-dependent anthocyanin biosynthesis and fruit coloration in Lycium plants. BMC Plant Biol. 2019, 19, 317. [Google Scholar] [CrossRef] [Green Version]
  58. Gondor, O.K.; Janda, T.; Soós, V.; Pál, M.; Majláth, I.; Adak, M.K.; Balázs, E.; Szalai, G. Salicylic acid induction of flavonoid biosynthesis pathways in wheat varies by treatment. Front. Plant Sci. 2016, 7, 1447. [Google Scholar]
  59. Yuan, L.B.; Peng, Z.H.; Zhi, T.T.; Zho, Z.; Liu, Y.; Zhu, Q.; Xiong, X.Y.; Ren, C.M. Brassinosteroid enhances cytokinin-induced anthocyanin biosynthesis in Arabidopsis seedlings. Biol. Plant. 2014, 59, 99–105. [Google Scholar] [CrossRef]
  60. Mitsis, T.; Efthimiadou, A.; Bacopoulou, F.; Vlachakis, D.; Chrousos, G.; Eliopoulos, E. Transcription factors and evolution: An integral part of gene expression (Review). World Acad. Sci. J. 2020, 2, 3–8. [Google Scholar] [CrossRef] [Green Version]
  61. Handhayani, T.; Hiryanto, L. Intelligent Kernel K-Means for Clustering Gene Expression. In Proceedings of the Procedia Computer Science; Elsevier B.V.: Amsterdam, The Netherlands, 2015; pp. 171–177. [Google Scholar]
  62. Grotewold, E. Plant metabolic diversity: A regulatory perspective. Trends Plant Sci. 2005, 10, 57–62. [Google Scholar] [CrossRef]
  63. Petroni, K.; Tonelli, C. Recent advances on the regulation of anthocyanin synthesis in reproductive organs. Plant Sci. 2011, 181, 219–229. [Google Scholar] [CrossRef]
  64. Mol, J.; Grofewold, E.; Koes, R. How genes paint flowers and seeds. Trends Plant Sci. 1998, 3, 212–217. [Google Scholar] [CrossRef]
  65. Ben-Meir, H.; Zuker, A.; Weiss, D.; Vainstein, A. Molecular Control of Floral Pigmentation: Anthocyanins. In Breeding For Ornamentals: Classical and Molecular Approaches; Vainstein, A., Ed.; Springer: San Francisco, CA, USA, 2002; pp. 253–272. [Google Scholar]
  66. Sobel, J.M.; Streisfeld, M.A. Flower color as a model system for studies of plant evo-devo. Front. Plant Sci. 2013, 4, 321. [Google Scholar] [CrossRef] [PubMed]
  67. Gao, L.; Yang, H.; Liu, H.; Yang, J.; Hu, Y. Extensive transcriptome changes underlying the flower color intensity variation in Paeonia ostii. Front. Plant Sci. 2016, 6, 1–16. [Google Scholar] [CrossRef] [PubMed] [Green Version]
  68. Morita, Y.; Hoshino, A. Recent advances in flower color variation and patterning of Japanese morning glory and petunia. Breed. Sci. 2018, 68, 128–138. [Google Scholar] [CrossRef] [PubMed] [Green Version]
  69. Yuan, Y.; Zhang, B.; Tang, X.; Zhang, J.; Lin, J. Comparative transcriptome analysis of different dendrobium species reveals active ingredients-related genes and pathways. Int. J. Mol. Sci. 2020, 21, 861. [Google Scholar] [CrossRef] [PubMed] [Green Version]
  70. Zhang, J.; He, C.; Wu, K.; Teixeira da Silva, J.A.; Zeng, S.; Zhang, X.; Yu, Z.; Xia, H.; Duan, J. Transcriptome analysis of dendrobium officinale and its application to the identification of genes associated with polysaccharide synthesis. Front. Plant Sci. 2016, 7, 1–14. [Google Scholar] [CrossRef] [Green Version]
  71. Wang, Z.; Zhao, M.; Cui, H.; Li, J.; Wang, M. Transcriptomic Landscape of Medicinal Dendrobium Reveals Genes Associated with the Biosynthesis of Bioactive Components. Front. Plant Sci. 2020, 28, 391. [Google Scholar] [CrossRef] [PubMed]
  72. Yuan, Y.; Zhang, J.; Liu, X.; Meng, M.; Wang, J.; Lin, J. Tissue-specific transcriptome for Dendrobium officinale reveals genes involved in flavonoid biosynthesis. Genomics 2020, 112, 1781–1794. [Google Scholar] [CrossRef]
  73. Ma, Z.H.; Li, W.F.; Mao, J.; Li, W.; Zuo, C.W.; Zhao, X.; Dawuda, M.M.; Shi, X.Y.; Chen, B.H. Synthesis of light-inducible and light-independent anthocyanins regulated by specific genes in grape “Marselan” (V. Vinifera L.). PeerJ 2019, 7, e6521. [Google Scholar]
  74. Luo, X.; Cao, D.; Li, H.; Zhao, D.; Xue, H.; Niu, J.; Chen, L.; Zhang, F.; Cao, S. Complementary iTRAQ-based proteomic and RNA sequencing-based transcriptomic analyses reveal a complex network regulating pomegranate (Punica granatum L.) fruit peel colour. Sci. Rep. 2018, 8, 1–13. [Google Scholar] [CrossRef] [Green Version]
  75. Liu, X.J.; Chuang, Y.N.; Chiou, C.Y.; Chin, D.C.; Shen, F.Q.; Yeh, K.W. Methylation effect on chalcone synthase gene expression determines anthocyanin pigmentation in floral tissues of two Oncidium orchid cultivars. Planta 2012, 236, 401–409. [Google Scholar] [CrossRef]
  76. Li, S.J.; Deng, X.M.; Mao, H.Z.; Hong, Y. Enhanced anthocyanin synthesis in foliage plant Caladium bicolor. Plant Cell Rep. 2005, 23, 716–720. [Google Scholar] [CrossRef] [PubMed]
  77. Meng, X.; Li, G.; Gu, L.; Sun, Y.; Li, Z.; Liu, J.; Wu, X.; Dong, T.; Zhu, M. Comparative Metabolomic and Transcriptome Analysis Reveal Distinct Flavonoid Biosynthesis Regulation Between Petals of White and Purple Phalaenopsis amabilis. J. Plant Growth Regul. 2020, 39, 823–840. [Google Scholar] [CrossRef]
  78. Sapir, M.; Oren-Shamir, M.; Ovadia, R.; Reuveni, M.; Evenor, D.; Tadmor, Y.; Nahon, S.; Shlomo, H.; Chen, L.; Meir, A.; et al. Molecular aspects of Anthocyanin fruit tomato in relation to high pigment-1. J. Hered. 2008, 99, 292–303. [Google Scholar] [CrossRef] [PubMed] [Green Version]
  79. Stommel, J.R.; Lightbourn, G.J.; Winkel, B.S.; Griesbach, R.J. Transcription factor families regulate the anthocyanin biosynthetic pathway in capsicum annuum. J. Am. Soc. Hortic. Sci. 2009, 134, 244–251. [Google Scholar] [CrossRef] [Green Version]
  80. Xie, D.Y.; Sharma, S.B.; Paiva, N.L.; Ferreira, D.; Dixon, R.A. Role of anthocyanidin reductase, encoded by BANYULS in plant flavonoid biosynthesis. Science 2003, 299, 396–399. [Google Scholar] [CrossRef] [Green Version]
  81. Jiao, F.; Zhao, L.; Wu, X.; Song, Z.; Li, Y. Metabolome and transcriptome analyses of the molecular mechanisms of flower color mutation in tobacco. BMC Genom. 2020, 21, 1–10. [Google Scholar] [CrossRef]
  82. Murthy, H.N.; Lee, E.J.; Paek, K.Y. Production of secondary metabolites from cell and organ cultures: Strategies and approaches for biomass improvement and metabolite accumulation. Plant Cell. Tissue Organ. Cult. 2014, 118, 1–16. [Google Scholar] [CrossRef]
  83. Wang, Y.; Wang, N.; Xu, H.; Jiang, S.H.; Fang, H.C.; Su, M.Y.; Zhang, Z.Y.; Zhang, T.L.; Chen, X.S. Auxin regulates anthocyanin biosynthesis through the Aux/IAA–ARF signaling pathway in apple. Hortic. Res. 2018, 5, 1–11. [Google Scholar] [CrossRef] [Green Version]
  84. Taylor, J.B.; Triggle, D.J. Comprehensive Medicinal Chemistry II; Elsevier Ltd.: Amsterdam, The Netherlands, 2006; ISBN 9780080450445. [Google Scholar]
  85. Cheatle Jarvela, A.M.; Hinman, V.F. Evolution of transcription factor function as a mechanism for changing metazoan developmental gene regulatory networks. Evodevo 2015, 6, 3–9. [Google Scholar] [CrossRef] [Green Version]
  86. Allan, A.C.; Hellens, R.P.; Laing, W.A. MYB transcription factors that colour our fruit. Trends Plant Sci. 2008, 13, 99–102. [Google Scholar] [CrossRef]
  87. Dubos, C.; Stracke, R.; Grotewold, E.; Weisshaar, B.; Martin, C.; Lepiniec, L. MYB transcription factors in Arabidopsis. Trends Plant Sci. 2010, 15, 573–581. [Google Scholar] [CrossRef] [PubMed]
  88. Takos, A.M.; Jaffé, F.W.; Jacob, S.R.; Bogs, J.; Robinson, S.P.; Walker, A.R. Light-induced expression of a MYB gene regulates anthocyanin biosynthesis in red apples. Plant Physiol. 2006, 142, 1216–1232. [Google Scholar] [CrossRef] [PubMed] [Green Version]
  89. Ban, Y.; Honda, C.; Hatsuyama, Y.; Igarashi, M.; Bessho, H.; Moriguchi, T. Isolation and functional analysis of a MYB transcription factor gene that is a key regulator for the development of red coloration in apple skin. Plant Cell Physiol. 2007, 48, 958–970. [Google Scholar] [CrossRef] [PubMed]
  90. Espley, R.V.; Hellens, R.P.; Putterill, J.; Stevenson, D.E.; Kutty-Amma, S.; Allan, A.C. Red colouration in apple fruit is due to the activity of the MYB transcription factor, MdMYB10. Plant J. 2007, 49, 414–427. [Google Scholar] [CrossRef] [PubMed] [Green Version]
  91. An, J.P.; Wang, X.F.; Li, Y.Y.; Song, L.Q.; Zhao, L.L.; You, C.X.; Hao, Y.J. EIN3-LIKE1, MYB1, and ethylene response factor3 act in a regulatory loop that synergistically modulates ethylene biosynthesis and anthocyanin accumulation1 [OPEN]. Plant Physiol. 2018, 178, 808–823. [Google Scholar] [CrossRef]
  92. An, J.P.; Wang, X.F.; Zhang, X.W.; Bi, S.Q.; You, C.X.; Hao, Y.J. MdBBX22 regulates UV-B-induced anthocyanin biosynthesis through regulating the function of MdHY5 and is targeted by MdBT2 for 26S proteasome-mediated degradation. Plant Biotechnol. J. 2019, 17, 2231–2233. [Google Scholar] [CrossRef]
  93. An, J.P.; Liu, Y.J.; Zhang, X.W.; Bi, S.Q.; Wang, X.F.; You, C.X.; Hao, Y.J.; Vicente, A. Dynamic regulation of anthocyanin biosynthesis at different light intensities by the BT2-TCP46-MYB1 module in apple. J. Exp. Bot. 2020, 71, 3094–3109. [Google Scholar] [CrossRef]
  94. An, J.P.; Zhang, X.W.; Bi, S.Q.; You, C.X.; Wang, X.F.; Hao, Y.J. The ERF transcription factor MdERF38 promotes drought stress-induced anthocyanin biosynthesis in apple. Plant J. 2020, 101, 573–589. [Google Scholar] [CrossRef]
  95. Lloyd, A.; Brockman, A.; Aguirre, L.; Campbell, A.; Bean, A.; Cantero, A.; Gonzalez, A. Advances in the MYB-bHLH-WD Repeat (MBW) pigment regulatory model: Addition of a WRKY factor and co-option of an anthocyanin MYB for betalain regulation. Plant Cell Physiol. 2017, 58, 1431–1441. [Google Scholar] [CrossRef] [Green Version]
  96. Verweij, W.; Spelt, C.E.; Bliek, M.; de Vries, M.; Wit, N.; Faraco, M.; Koes, R.; Quattrocchio, F.M. Functionally similar WRKY proteins regulate vacuolar acidification in petunia and hair development in arabidopsis. Plant Cell 2016, 28, 786–803. [Google Scholar] [CrossRef]
  97. Zhou, H.; Lin-Wang, K.; Wang, H.; Gu, C.; Dare, A.P.; Espley, R.V.; He, H.; Allan, A.C.; Han, Y. Molecular genetics of blood-fleshed peach reveals activation of anthocyanin biosynthesis by NAC transcription factors. Plant. J. 2015, 82, 105–121. [Google Scholar] [CrossRef] [PubMed]
  98. Zhang, S.; Chen, Y.; Zhao, L.; Li, C.; Yu, J.; Li, T.; Yang, W.; Zhang, S.; Su, H.; Wang, L. A novel NAC transcription factor, MdNAC42, regulates anthocyanin accumulation in red-fleshed apple by interacting with MdMYB10. Tree Physiol. 2020, 40, 413–423. [Google Scholar] [CrossRef] [PubMed]
  99. Perez-de-Castro, A.M.; Vilanova, S.; Canizares, J.; Pascual, L.; Blanca, M.J.; Diez, M.J.; Prohens, J.; Pico, B. Application of Genomic Tools in Plant Breeding. Curr. Genom. 2012, 13, 179–195. [Google Scholar] [CrossRef] [PubMed] [Green Version]
  100. Singh, V.K.; Singh, A.K.; Singh, S.; Singh, B.D. Next-generation sequencing (NGS) tools and impact in plant breeding. In Advances in Plant Breeding Strategies: Breeding, Biotechnology and Molecular Tools; Al-Khayri, J.M., Jain, S.M., Johnson, D.V., Eds.; Springer: Cham, Switzerland, 2016; pp. 563–612. ISBN 9783319225210. [Google Scholar]
Figure 1. Petals of Dendrobium nestor at different stages of development. (a) Flower bud stage (F), (b) half blooming stage (H), and (c) full blooming stage (B).
Life 11 00113 g001
Figure 2. Transcripts and unigenes obtained from the petals of D. nestor at three stages of development (F, H, and B). (a) Overall distribution of sample gene expression based on fragments per kilobase of transcript per million fragments mapped (FPKM). (b) Principal component analysis based on FPKM. (c) Pearson correlation between three replicates of the three samples. (d) Number of unigenes in the pairwise groups (F_vs_H, F_vs_B, and H_vs_B) annotated to different databases. Where F = flower bud stage; H = half blooming stage; and B = full blooming stage.
Life 11 00113 g002
Figure 3. Type of simple sequence repeats detected in the transcriptome; n = total number of markers.
Life 11 00113 g003
Figure 4. Number of differentially expressed genes (DEGs) relative to the total number of unigenes obtained from the petals of D. nestor in pairwise groups (F_vs_H, F_vs_B, and H_vs_B). (a) Total number of unigenes, DEGs, and their extent of regulation (either up- or down-regulated). (b) Heatmap obtained based on FPKM of DEGs. Where F = flower bud stage; H = half blooming stage; and B = full blooming stage.
Life 11 00113 g004
Figure 5. A schema of the anthocyanin biosynthesis pathway with the differentially expressed genes (DEGs) in the F, H, and B samples and their related enzymes. The log10 transformed fragments per kilobase of transcript per million fragments mapped the values of DEGs linked to enzymes were used to draw to the heatmap with the pheatmap package in R [53]. The enzymes include phenylalanine ammonia lyase (PAL), 4-coumarateCoA ligase (4CL), chalcone synthase (CHS), chalcone isomerase (CHI), flavone 3-hydroxylase (F3H), flavonoid 3′-hydroxylase (F3′H), flavonol synthase (FLS), dihydroflavonol reductase (DFR), and UDP-flavonoid glucosyl transferase (UFGT). F refers to the flower bud stage; H refers to the half blooming stage; B refers to the full blooming stage. The color gradient comprisess chocolate, ghostwhite, and blue, representing the upregulated, not regulated, and downregulated genes, respectively.
Life 11 00113 g005
Figure 6. Expression profile based on standardized (log10 transformed) fragments per kilobase of transcript per million fragments mapped (FPKM) values of differentially expressed genes (DEGs) related to phytohormones with the Euclidean distance method implemented with the pheatmap package in R [53]. (a) Auxin, (b) Ethylene, (c) Brassinosteroid, (d) Abscisic acid, (e) Cytokinin, and (f) Salicylic acid. Where F = flower bud stage; H = half blooming stage; and B = full blooming stage. The color gradient comprises chocolate, ghostwhite, and blue, representing upregulated, not regulated, and downregulated genes, respectively.
Life 11 00113 g006aLife 11 00113 g006b
Figure 7. K-means clustering of differentially expressed genes based on standardized (log10 transformed) fragments per kilobase of transcript per million fragments mapped values of three samples of D. nestor flowers (F, H, and B). The numbers of genes clustered in each subclass are given above each Figure. Where F = flower bud stage; H = half blooming stage; and B = full blooming stage.
Life 11 00113 g007
Figure 8. Expression profile of (a) MYB and (b) bHLH transcription factor families with differentially expressed genes based on standardized (log10 transformed) fragments per kilobase of transcript per million fragments mapped values of three samples of D. nestor flowers (F, H, and B ) constructed with the pheatmap package in R [53]. Where F = flower bud stage; H = half blooming stage; and B = full blooming stage. The color gradient comprises chocolate, ghostwhite, and blue, representing upregulated, not regulated, and downregulated genes, respectively.
Life 11 00113 g008
Table 1. Overview of the transcriptome sequencing dataset and quality check.
Sample aRaw ReadsClean Reads bClean Base (G)Q30 (%)GC Content (%)
F15332757652337746 (98.14%)7.8593.5847.24
F25299542649011814 (92.48%)7.3594.7047.50
F34719016046301832 (98.12%) 6.9593.4346.36
Average F5004710847538849 (96.25%)7.1394.3247.72
H15309892449694824 (93.59%)7.4594.0047.98
H25176426249406926 (95.45%)7.4194.5347.91
H34527813843514798 (96.11%)6.5394.4247.26
Average H5004710847538849 (94.98%)7.0394.0747.96
B15242266850153474 (95.67%)7.524894.3047.81
B25033153247943212 (95.25%)7.1994.1747.74
B35075896249698100 (97.91%)6.3993.7348.32
Average P5117105448879555 (95.52%)7.3893.9047.03
a F = flower bud stage; H = half blooming stage; B = full blooming stage. b those in parenthesis represent ratio of clean reads relative to raw reads expressed in percentage.
Table 2. Twenty most abundant transcription factors among the differentially expressed genes.
TF aF_vs_HF_vs_BH_vs_B
Total bUp cDown dTotalUpDownTotalUpDown
AP2/ERF4440459372216115
AUX/IAA1064133108-8
B3292062913163-3
bHLH56422438929826
bZIP19127241772-2
C2C23082237532413
C2H2251781414-1-1
C3H2620623176321
GARP2181317710---
GNAT826211---
GRAS141221275211
HB311714392514624
MADS11569541-1
MYB4417273513227-7
NAC3330325223624
PHD8441019---
PLATZ1111-1212-55-
Tify1651111-116-6
Trihelix63396333-
WRKY37325241861367
a Transcription factor. b Total of differentially expressed genes (DEGs). c upregulated. d downregulated. F = flower bud stage; H = half blooming stage; and B = full blooming stage.
Publisher’s Note: MDPI stays neutral with regard to jurisdictional claims in published maps and institutional affiliations.

