Article

Kinematics, Speed, and Anthropometry-Based Ankle Joint Torque Estimation: A Deep Learning Regression Approach

by
Luís Moreira
1,*,
Joana Figueiredo
1,
João Paulo Vilas-Boas
2 and
Cristina Peixoto Santos
1
1
Center for MicroElectroMechanical Systems (CMEMS), University of Minho, 4800-058 Guimarães, Portugal
2
Faculty of Sport, CIFI2D, and Porto Biomechanics Laboratory (LABIOMEP), University of Porto, 4200-450 Porto, Portugal
*
Author to whom correspondence should be addressed.
Machines 2021, 9(8), 154; https://doi.org/10.3390/machines9080154
Submission received: 30 June 2021 / Revised: 29 July 2021 / Accepted: 2 August 2021 / Published: 6 August 2021
(This article belongs to the Special Issue Smart Machines: Applications and Advances in Human Motion Analysis)

Abstract

:
Powered Assistive Devices (PADs) have been proposed to enable repetitive, user-oriented gait rehabilitation. They may include torque controllers that typically require reference joint torque trajectories to determine the most suitable level of assistance. However, a robust approach able to automatically estimate user-oriented reference joint torque trajectories, namely ankle torque, while considering the effects of varying walking speed, body mass, and height on the gait dynamics, is needed. This study evaluates the accuracy and generalization ability of two Deep Learning (DL) regressors (Long-Short Term Memory and Convolutional Neural Network (CNN)) to generate user-oriented reference ankle torque trajectories by innovatively customizing them according to the walking speed (ranging from 1.0 to 4.0 km/h) and users’ body height and mass (ranging from 1.51 to 1.83 m and 52.0 to 83.7 kg, respectively). Furthermore, this study hypothesizes that DL regressors can estimate joint torque without resourcing electromyography signals. CNN was the most robust algorithm (Normalized Root Mean Square Error: 0.70 ± 0.06; Spearman Correlation: 0.89 ± 0.03; Coefficient of Determination: 0.91 ± 0.03). No statistically significant differences were found in CNN accuracy (p-value > 0.05) whether electromyography signals are included as inputs or not, enabling a less obtrusive and accurate setup for torque estimation.

1. Introduction

There is an extreme need to recover the motor function of people with lower limb impairments so they can independently perform their daily living activities, improving their quality of life [1,2,3,4,5,6]. Physical rehabilitation has been pointed out as the most appropriate strategy to face the long-term motor disabilities of neurologically injured patients [7]. Nonetheless, lower limb rehabilitation specialists have in recent years acknowledged the need to deal with: (i) the disadvantages associated with the inter- and intra-therapist variances; and (ii) the absence of precise, user-, and daily-task oriented repeatable movements during therapy.
Robotics-based gait assistance and rehabilitation interventions managed by Powered Assistive Devices (PADs), such as active orthosis and exoskeletons, have been recommended for subjects with long-term locomotor disabilities and impairments [8,9]. According to [10], rehabilitation therapies driven by PADs may improve the patient’s muscular strength, movement coordination, and balance control, fostering the patient’s ambulation and performance for successful locomotion.
Typically, these PADs are controlled by torque controllers ([11,12,13,14,15]) that require joint torque reference trajectories to (i) automatically adapt the assistance that the patient should receive, providing an Assist-As-Needed (AAN) training; or (ii) impose a desired joint motion considering healthy conditions [16]. Generally, these joint torque reference trajectories are obtained from multimodal walking datasets available in the literature. They contain pre-recorded joint trajectories from healthy subjects walking at self-selected speeds (varying between slow, normal, and fast) above force platforms or instrumented treadmills [17,18,19,20].
However, considering the findings reported in [16,21,22,23,24,25,26], there is evidence that lower limb biomechanical parameters (e.g., joint kinematics, torques, and muscle activations) are highly dependent on the subject’s walking speed and anthropometric information (such as body height and mass). Additionally, it is being verified that the typical slower walking speeds of healthy subjects (2.8 km/h) may be higher than the preferred walking speeds of subjects with lower limb impairments (1.6–2.5 km/h) [27]. Thus, the employment of joint torque reference trajectories obtained from available datasets may not be the most suitable method to impose the desired motion, nor to tailor the assistance according to patients’ needs due to the potential bias that can introduce in the gait dynamics given the differences in walking speed.
It is necessary to develop a tool that is able to automatically generate healthy joint torque reference trajectories while avoiding the need to collect joint trajectories for many walking speeds and anthropometric data combinations. Nonetheless, the available methods for joint torque generation still present some issues, such as: (i) they only predict the peak of the joint torque in specific gait cycle phases, not generating the entire trajectory for the full gait motion [22,23,28]; (ii) they do not consider the effects introduced by the subject’s anthropometry [22,28,29,30] and speed [23,29,30,31]; (iii) they depend on several muscle parameters that need to be calibrated to the user’s anthropometric characteristics [31]; (iv) they rely on an expensive and complex sensor setup composed by electromyography (EMG) [29,30] or cameras and force plates systems (in case of data collections [17,18,19,20]).
To the authors’ best knowledge, there is no available automatic method dedicated to the generation of reference joint torque trajectories oriented to the user’s anthropometry and walking speed. Given the successful performance of Long-Short Term Memory (LSTM) and Convolutional Neural Network (CNN) for time-series data and their prominent capacity to model nonlinear walking motion data relationships [23,32,33,34,35,36], this study tackles the challenges mentioned above, extending our previous work [37]. It proposes an automatic, accurate Deep Learning (DL) approach for generating reference ankle joint torque trajectories under healthy conditions according to the user’s walking speed, joint kinematics, and anthropometry, considering a stratified anthropometric distribution. This advance enables the achievement of a user-oriented ankle joint torque reference trajectory by innovatively customizing the trajectories according to the speed, gender, age, body mass, height, and shank and foot length of each subject. The creation of a generalized model is of utmost importance to estimate lower limb joint torque trajectories while avoiding the need for regular data collections every time a user-oriented joint torque is required and facilitating the PAD’s setup and use. The ankle joint was chosen as it is the lower limb joint that is commonly affected by neurological diseases [37,38].
Moreover, most studies focused on AAN training by adjusting the PADs’ assistance according to the user’s joint torque that is estimated in real-time. Most of the algorithms for joint torque estimation fuse EMG data ([29,30]). EMG-based approaches have been left behind since the EMG sensing is prone to fade during long-term use due to (i) movements between the skin and the electrodes; (ii) temperature variations; and (iii) sweating [39,40,41,42]. These phenomena can cause incorrect joint torque estimations, which may compromise the PADs’ assistance efficacy. This motivates the development of joint torque estimation approaches non-dependent on EMG. For this reason, this study aims at a less obtrusive approach for real-time joint torque estimation, versatile to both human motion analysis and robotics-based gait assistance. We hypothesize that the kinematic-, speed-, and anthropometry-driven DL model may output reliable ankle joint torque trajectories without using EMG signals towards simplifying the current setup for real joint torque estimations. Thus, this study proposes an innovative analysis by investigating the statistical relevance and effect of including EMG signals as input in the DL model performance.

2. Materials and Methods

2.1. Data Acquisition

2.1.1. Participants

To build the DL models, a single data collection was needed. The study involved thirteen healthy adult participants (6 males and 7 females) with a mean age of 24.2 ± 1.85 years, a mean body mass of 65.2 ± 10.3 kg, and a mean body height of 1.68 ± 0.12 m), as presented in Table 1. Balanced gender distribution was tackled considering possible biomechanical gender differences [43,44]. Before undergoing the experiments, an explanation of the study’s purpose was provided, and each participant gave written and informed consent according to the ethical conduct of the University of Minho Committee (CICVS 006/2020).
The eligibility criteria consider that the participants must: (i) sign the consent form; (ii) not present any evidence of physical or physiological disorders that could perturb his/her walking pattern; (iii) be older than 18 years old; (iv) present a body mass ranging from 45.0 to 90.0 kg; and (v) present a body height ranging from 1.50 to 1.90 m, covering the mean anthropometric data of adult men and women across countries [45].

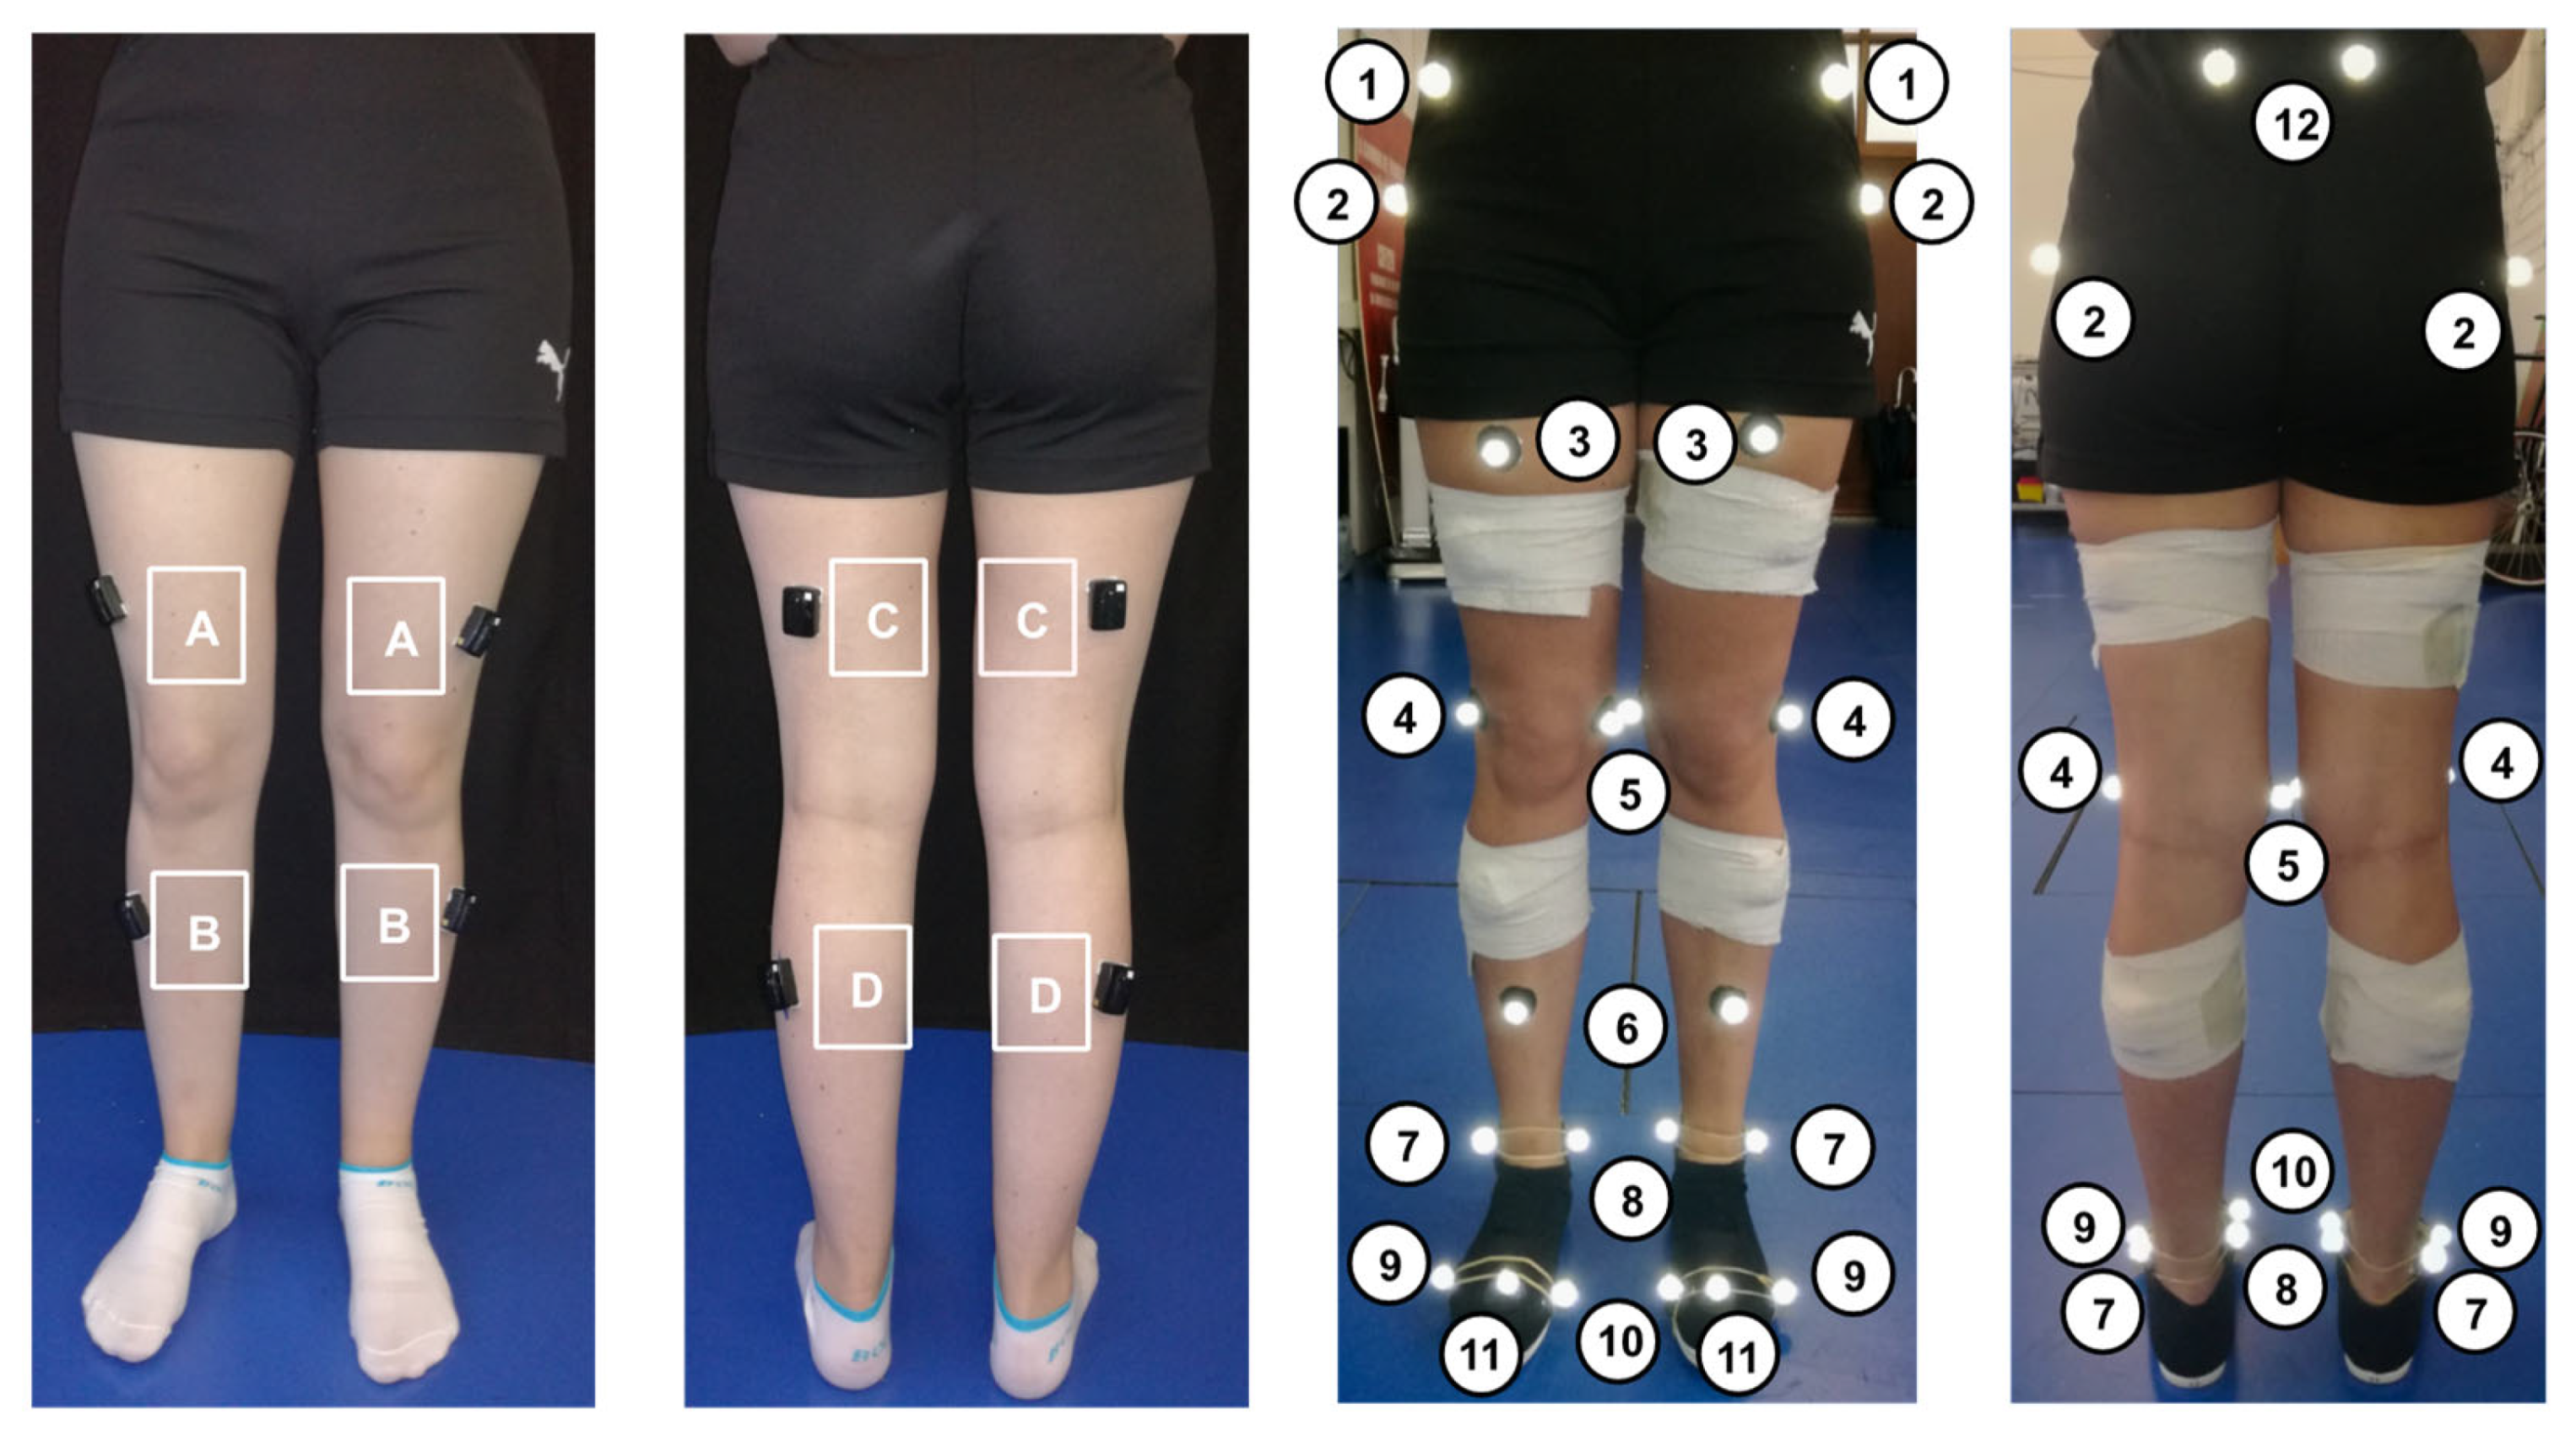
2.1.2. Instrumentation and Data Collection

EMG signals from Tibialis Anterior (TA), Gastrocnemius Lateralis (GAL), Biceps Femoris (BF), and Vastus Lateralis (VL) were acquired at 2000 Hz, using a surface 8—channel wireless EMG system (Delsys, MA, USA). In this respect, 8 EMG electrodes were attached to the participants’ skin according to the SENIAM recommendations (Figure 1) [46].
A twelve-camera motion-capture system (Oqus; Qualisys—Motion Capture System, Göteborg, Sweden) and five force platforms embedded on the floor (FP4060; Bertec, Ohio, OH, USA) were utilized to collect the 3D kinematic motion data and the ground reaction force (GRF) data at 200 Hz, respectively.
The Newington–Hayes marker-set was adopted to determine the kinematic data from the lower limb joints [47]. A total of 12 pairs of retro-reflective markers were used, as presented in Figure 1.

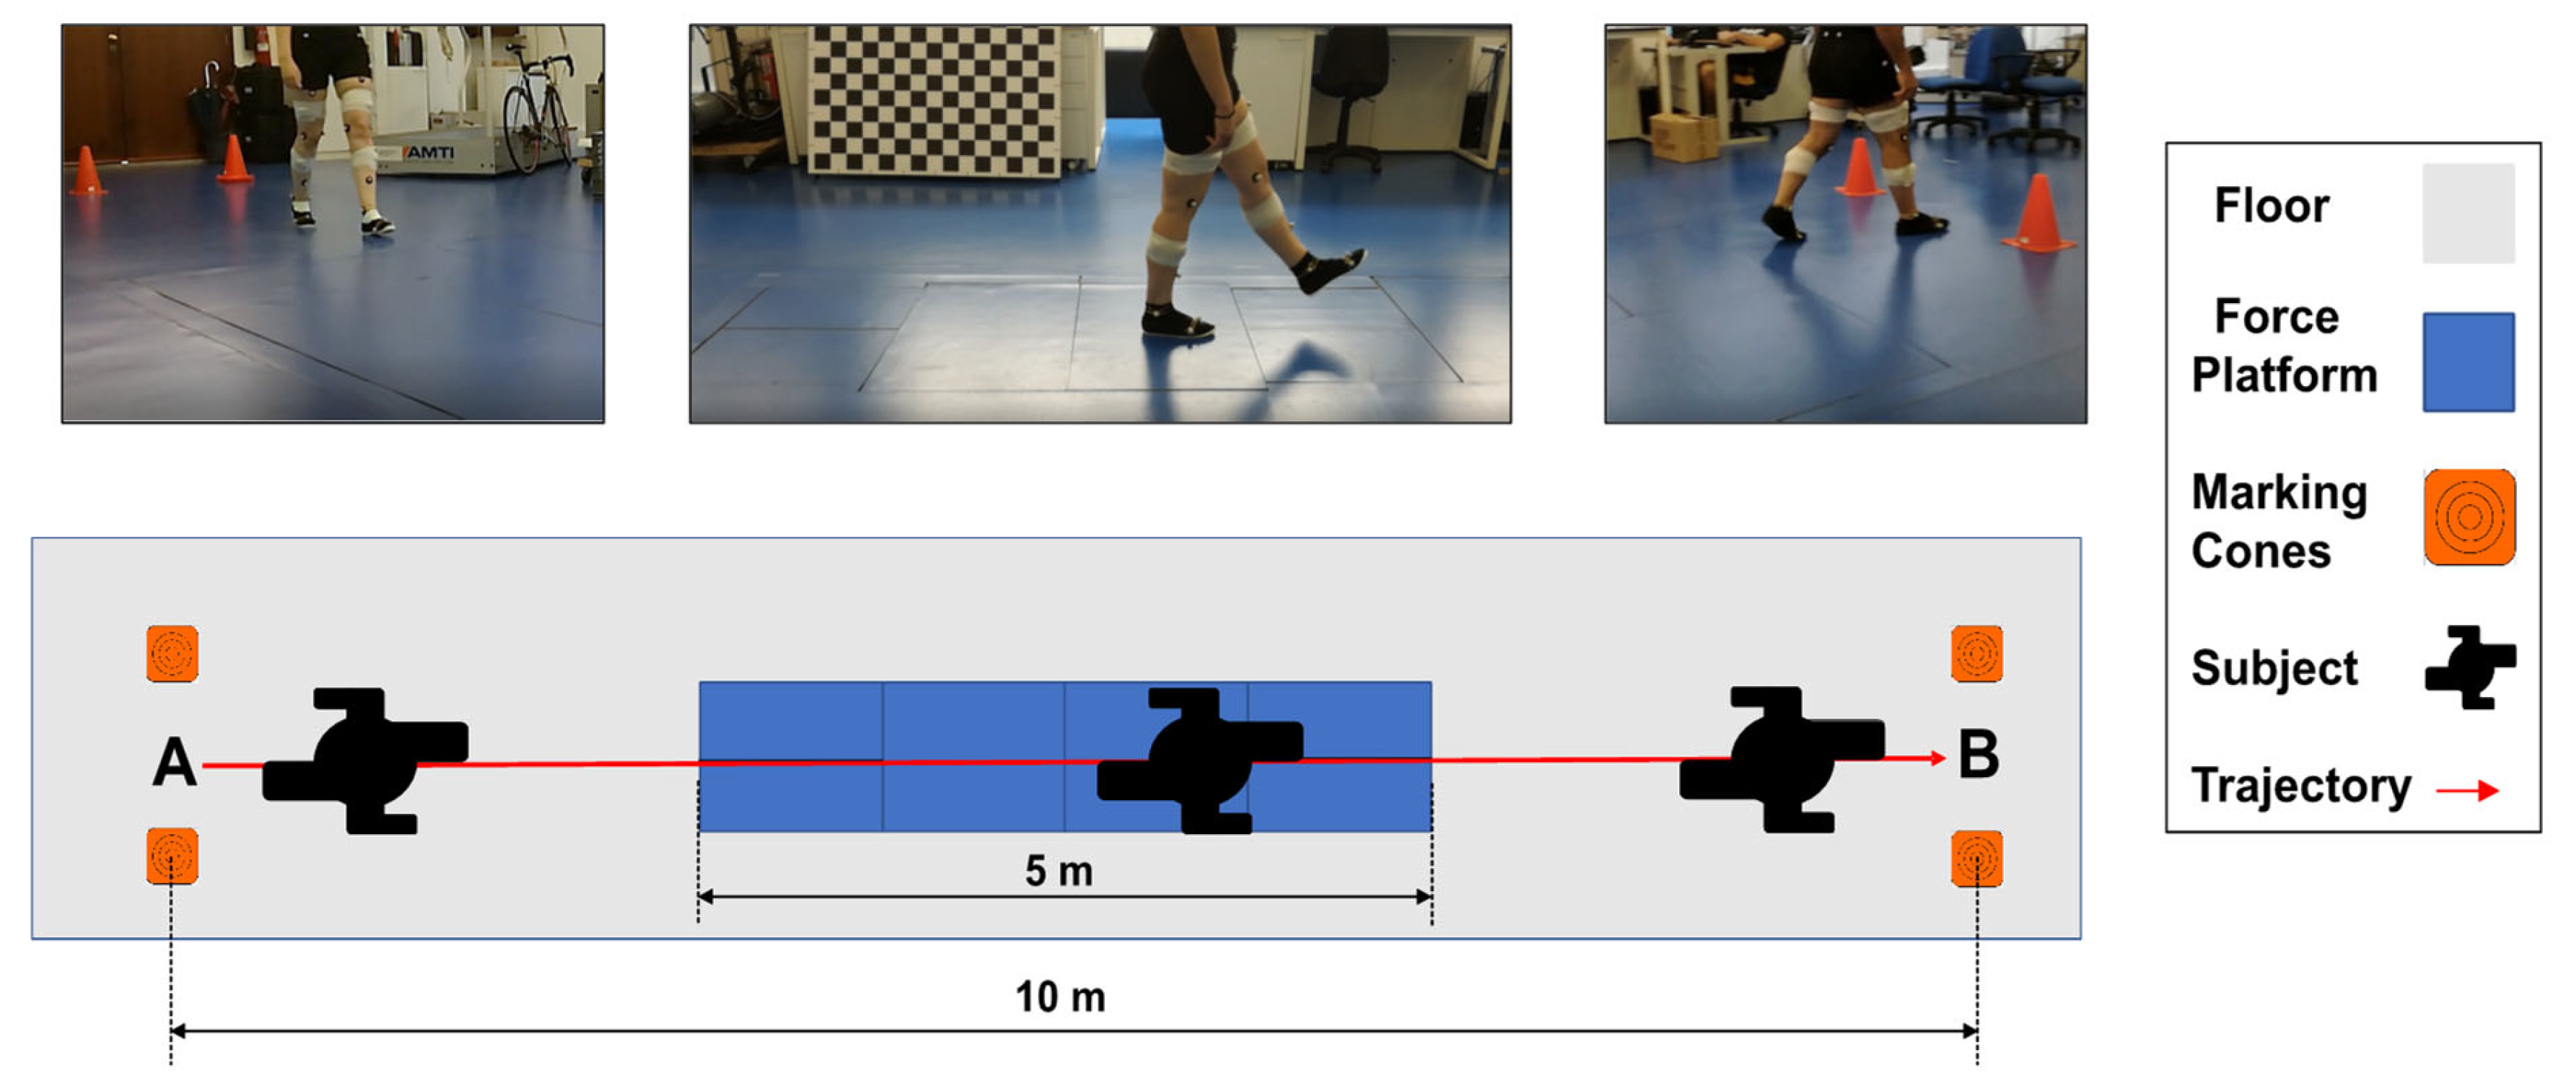
2.1.3. Experimental Protocol

In the beginning, the gender, age, body mass, height, and shank and foot length of each subject was registered. Then, the subjects were asked to perform a standing anatomic-calibration trial during 3 s with both arms crossed in front of the chest, looking ahead, and with both feet aligned with the shoulders, to adjust all the recordings to the subject’s anthropometry. Subsequently, each subject was instructed to perform ten forward walking trials, walking sequentially at seven controlled walking speeds (1.0, 1.5, 2.0, 2.5, 3.0, 3.5, and 4.0 km/h) on a 10 m-flat surface, including five force platforms, as depicted in Figure 2. The speeds were controlled with a metronome. The participants were asked to look ahead and walk naturally according to the beats of the metronome. Further details of the protocol are presented in [48].

2.2. Data Processing

The EMG signals were filtered using a band-pass fourth-order zero-lag Butterworth filter with cutoff frequencies of 20 and 450 Hz. Furthermore, the signals’ envelope was obtained by using the Root Mean Square value with a 300 ms movable window [49].
The 3D marker trajectories registered with the motion-capture system were filtered by the same filter, using a cutoff frequency of 6 Hz [47]. Hereinafter, the filtered 3D marker trajectories, along with the GRF data, were processed in Visual3D software to compute the lower limb joint angles and torques. This computed torque corresponds to the real torque data that were used as ground truth to build DL regression models. The Automatic Gait Events function from the Visual3D software was also used to automatically detect the heel-strike event and segment the data in gait cycle-normalized data. This function considers that the heel strike event corresponds to the instant where the participants’ foot strikes the force platforms. Moreover, all heel-strike detections were visually inspected against GRF’s Z component data to confer robustness to the data segmentation. Every time that the GRF’s Z data component did not start to increase at the heel-strike event by the Visual3D software, the heel-strike instant was manually corrected. Further details are presented in [48]. The raw and the processed data used in this study are available at [48]. Study [48] shows the dataset variability across subjects and speeds.

2.3. Data Preparation

We implemented two approaches to predict the ankle joint torques. The first one considered ankle joint angles, angular velocities, angular accelerations, walking speed, body height and mass, foot and shank length, gender, and age, pursuing the evidence that this anthropometric information improves the model performance [23]. In the second approach, we added the EMG signals from the TA and GAL muscles to the above-mentioned inputs. These two muscles were chosen since they are the most responsible muscle for ankle joint motion [50].
Out of the thirteen subjects that participated in this study, one participant was randomly selected to test the final model. A leave-one-subject-out cross-validation (LOSOCV) method among the remaining twelve subjects was implemented to evaluate the model generalization and optimize the model hyperparameters.

2.4. Implementation of the Regression Models

In this study, LSTM and CNN were applied, tested, and compared by using Matlab® (2021a, The Mathworks, MA, USA).
Regarding the LSTM neural network, the data were organized by sequences. Each sequence, which represents a single gait cycle, was composed of X lines (X can take the values 10 or 12, representing the 10 or 12 inputs with or without EMG signals, respectively) and 250 columns (representing the 250 samples that form a single normalized gait cycle). We conducted an empirical analysis to select (i) the number of neurons per LSTM layer (from 10 to 200); and (ii) the number of LSTM layers (from 1 to 2), based on the findings of [23,36,51]. According to [36,51], the number of neurons should be 5 times the number of output responses (1). In this study, we explore higher values to create a model with enough capacity, while controlling overfitting. The final layer corresponds to a fully connected dense (feedforward) layer, and its number was set to the number of responses to predict, i.e., 1 ([36,51]).
In CNN, we performed a data transformation, treating the inputs as several images [35], being organized into 3D matrices, as follows: width—number of each gait cycle’s samples (250); height—number of inputs (10 or 12); depth—number of gait cycles. In this neural network, we also conducted an empirical analysis to select (a) the kernel size (2 × 2, 5 × 5, and 10 × 10); (b) the number of filters per convolutional layer (8, 16, 32, 64); and (c) the number of convolutional layers (1, 2, 3). This empirical analysis was based on the findings of [52].
In both models, an empirical analysis was applied to select (i) the normalization method (considering the max-min, z-score, and robust normalization methods); (ii) the optimal batch size (from 1 to the maximum number of gait cycles); and (iii) the dropout percentage. In addition, both neural networks’ weights and biases were updated according to an adaptive moment estimation optimization algorithm (ADAM) considering the mean square error (MSE) ([36,51]). Moreover, the activation function used for LSTM and CNN layers was the rectified rectilinear unit (ReLU) considering [36,52].

2.5. Model Evaluation Metrics

The regression model performance was evaluated during the LOSOCV and final model testing procedures. Three metrics were determined, namely Normalized Root Mean Square Error (NRMSE), Spearman correlation (SC), and Coefficient of Determination (R2) between two variables: the predicted and the real ankle joint torque trajectory.
The predictions performed by the final model were also evaluated using the Bland–Altman Plot [53]. Furthermore, we computed the average of the real ankle joint torque data of all gait cycles belonging to the test dataset, resulting in a mean gait cycle and its standard deviation (SD). The same procedure was performed for the predicted ankle joint torques. Additionally, we assessed the computational time (in ms) to predict a single sample. All predictions were performed in a Hewlett-Packard computer with an Intel® Core™ i7-4710MQ CPU @ 2.50 GHz processor and a Random Access Memory with 16.0 GB.

3. Results

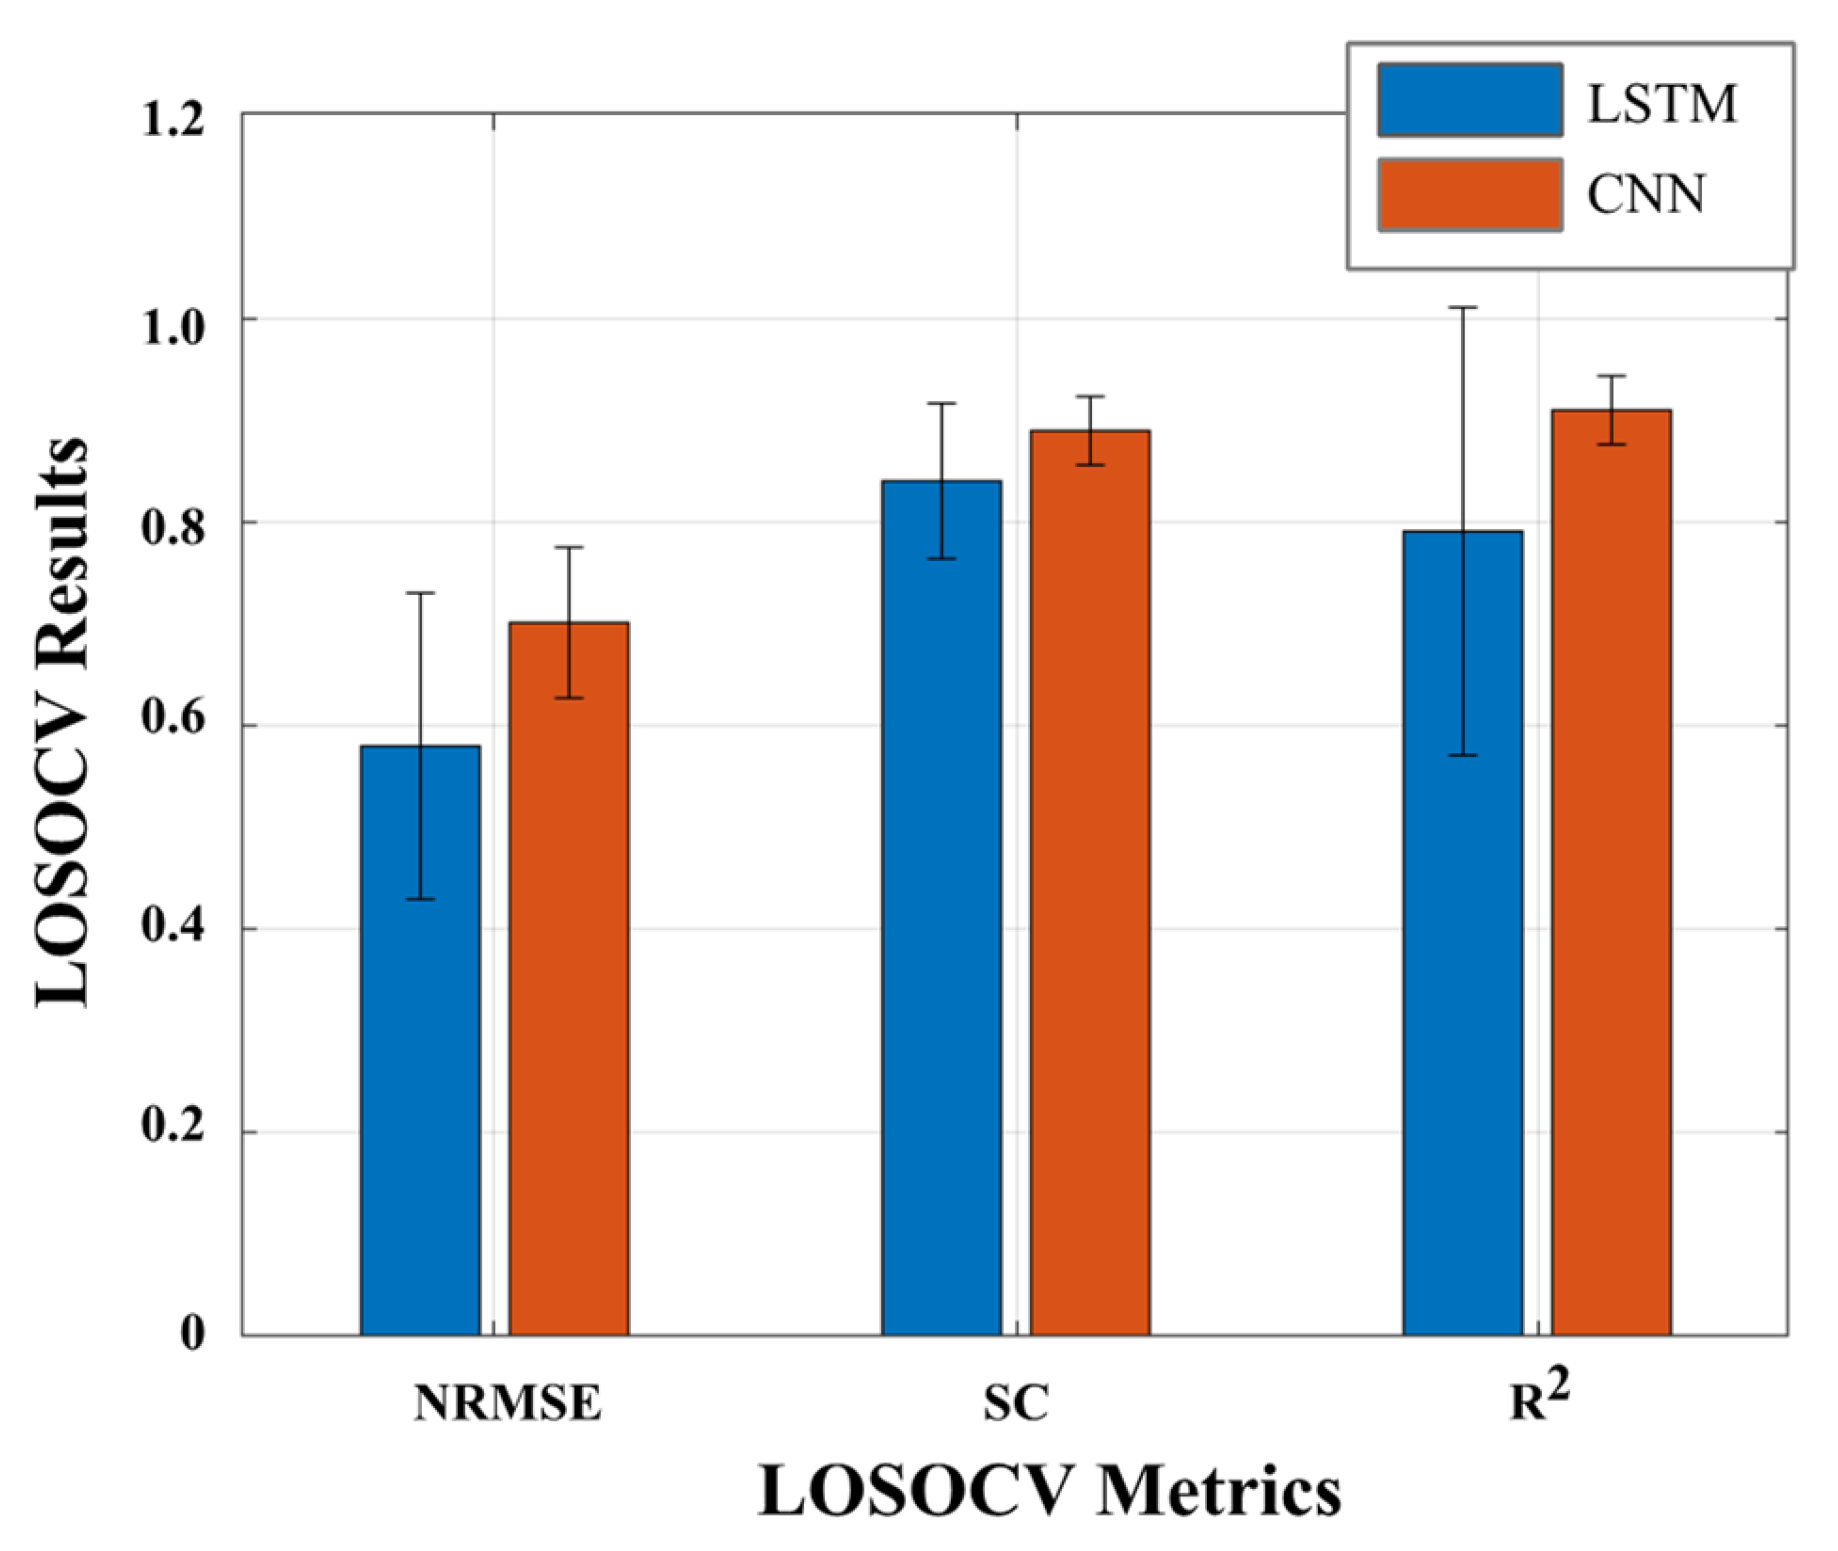
3.1. Comparative Analysis of Regression Models without Using EMG Signals

Table 2 presents the best results achieved for the two explored DL algorithms, for both validation and test conditions, without considering the EMG signals as input. The results presented by the LOSOCV method (depicted in Figure 3) suggest that CNN appears to be the best-fitted regression model to estimate the ankle joint torque trajectories. This DL regressor revealed a higher generalization capability when compared to LSTM since it presents a higher mean and a lower SD in the evaluation metrics (NRMSE, SC, and R2). Regarding the performance achieved in the test dataset (presented in Table 2), both results are within the mean ± SD exhibited in LOSOCV method, which suggests that both models are generalized. CNN revealed a smaller computational time in comparison with LSTM (0.51 ms < 3.7 ms), which suggests its promising application, even in real-time conditions.
Overall, there is a consistency across all findings that the ankle joint torque trajectories predicted by the CNN exhibit a high level of similarity with real trajectories when compared to the predictions made by LSTM.

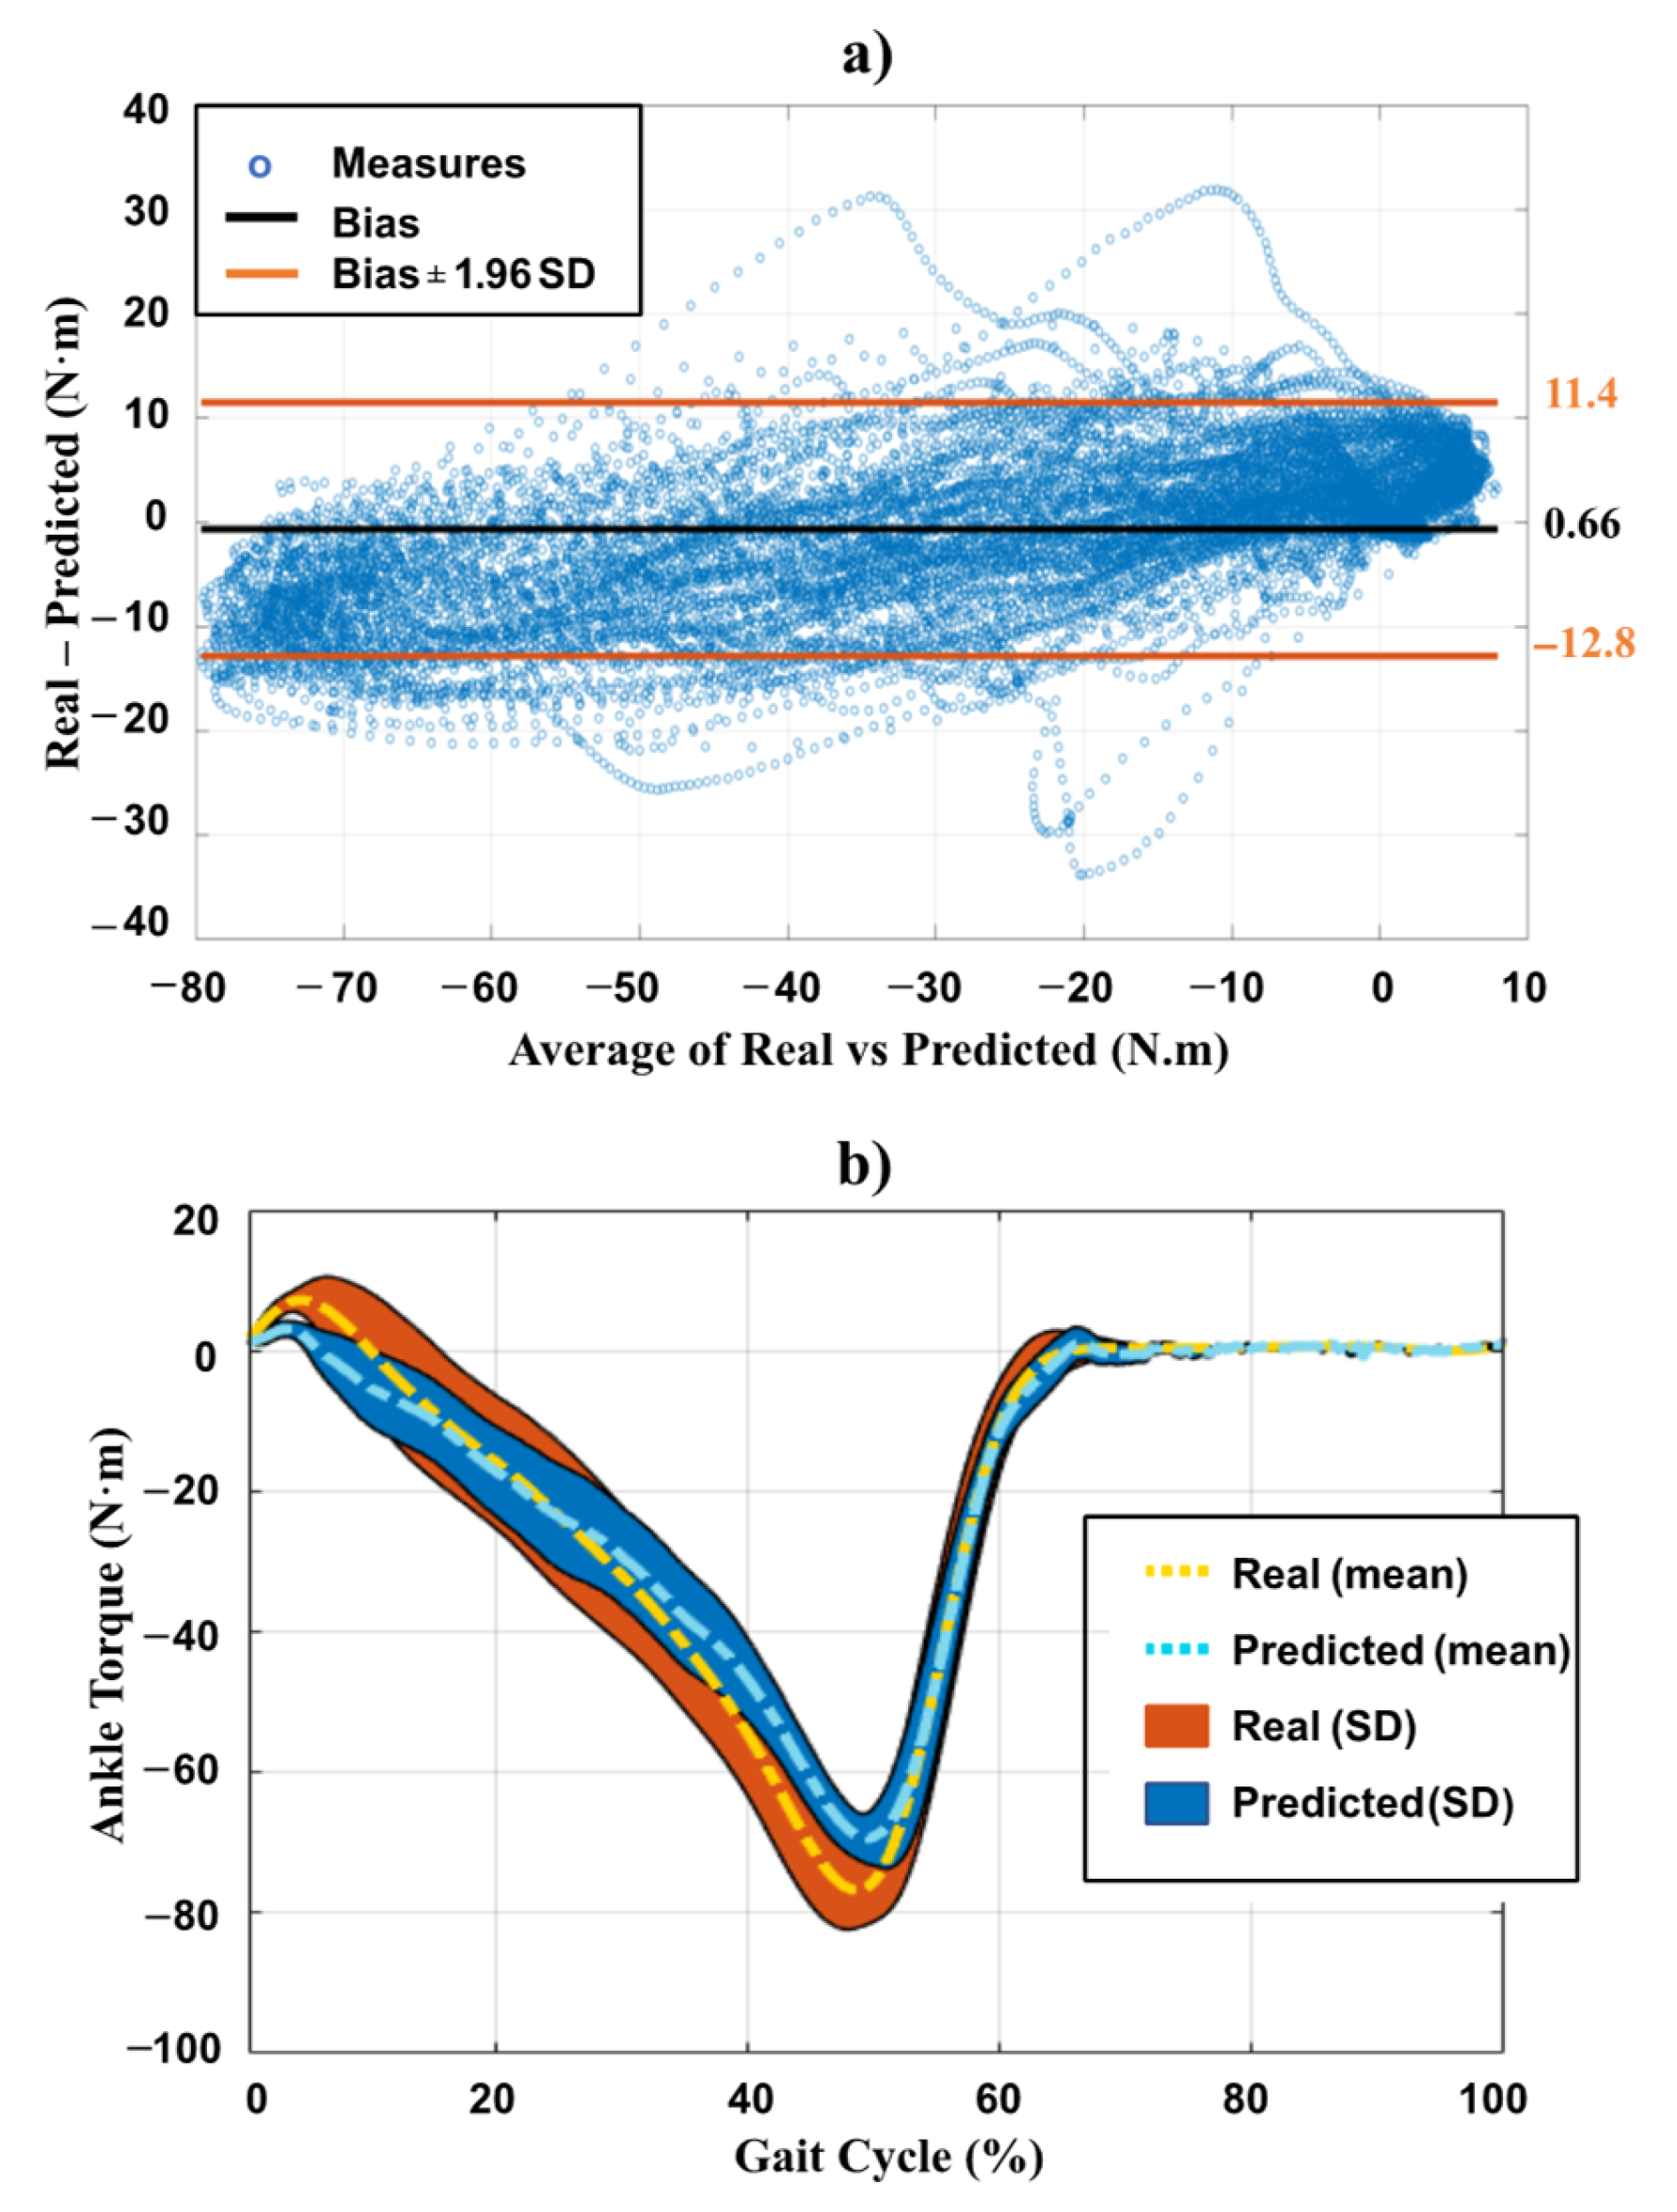
3.2. Detailed Analysis of CNN Performance

Given its prominent capacity to estimate the ankle joint torque trajectories, we compared the predictions performed by CNN to the real ankle joint torque trajectories of the test dataset using the Bland–Altman Plot. The results depicted in Figure 4a show that the predictions made by CNN are closer to the real ankle joint torque trajectories since the majority of the measures are within the limits of agreement, the bias is close to 0 N.m, and the limits of agreement are small.
Furthermore, Figure 4b illustrates the mean and SD values of the real and CNN-based predicted ankle joint torque for the test dataset. These results show that the CNN produced reference ankle joint torque trajectories closely similar to the real ones.

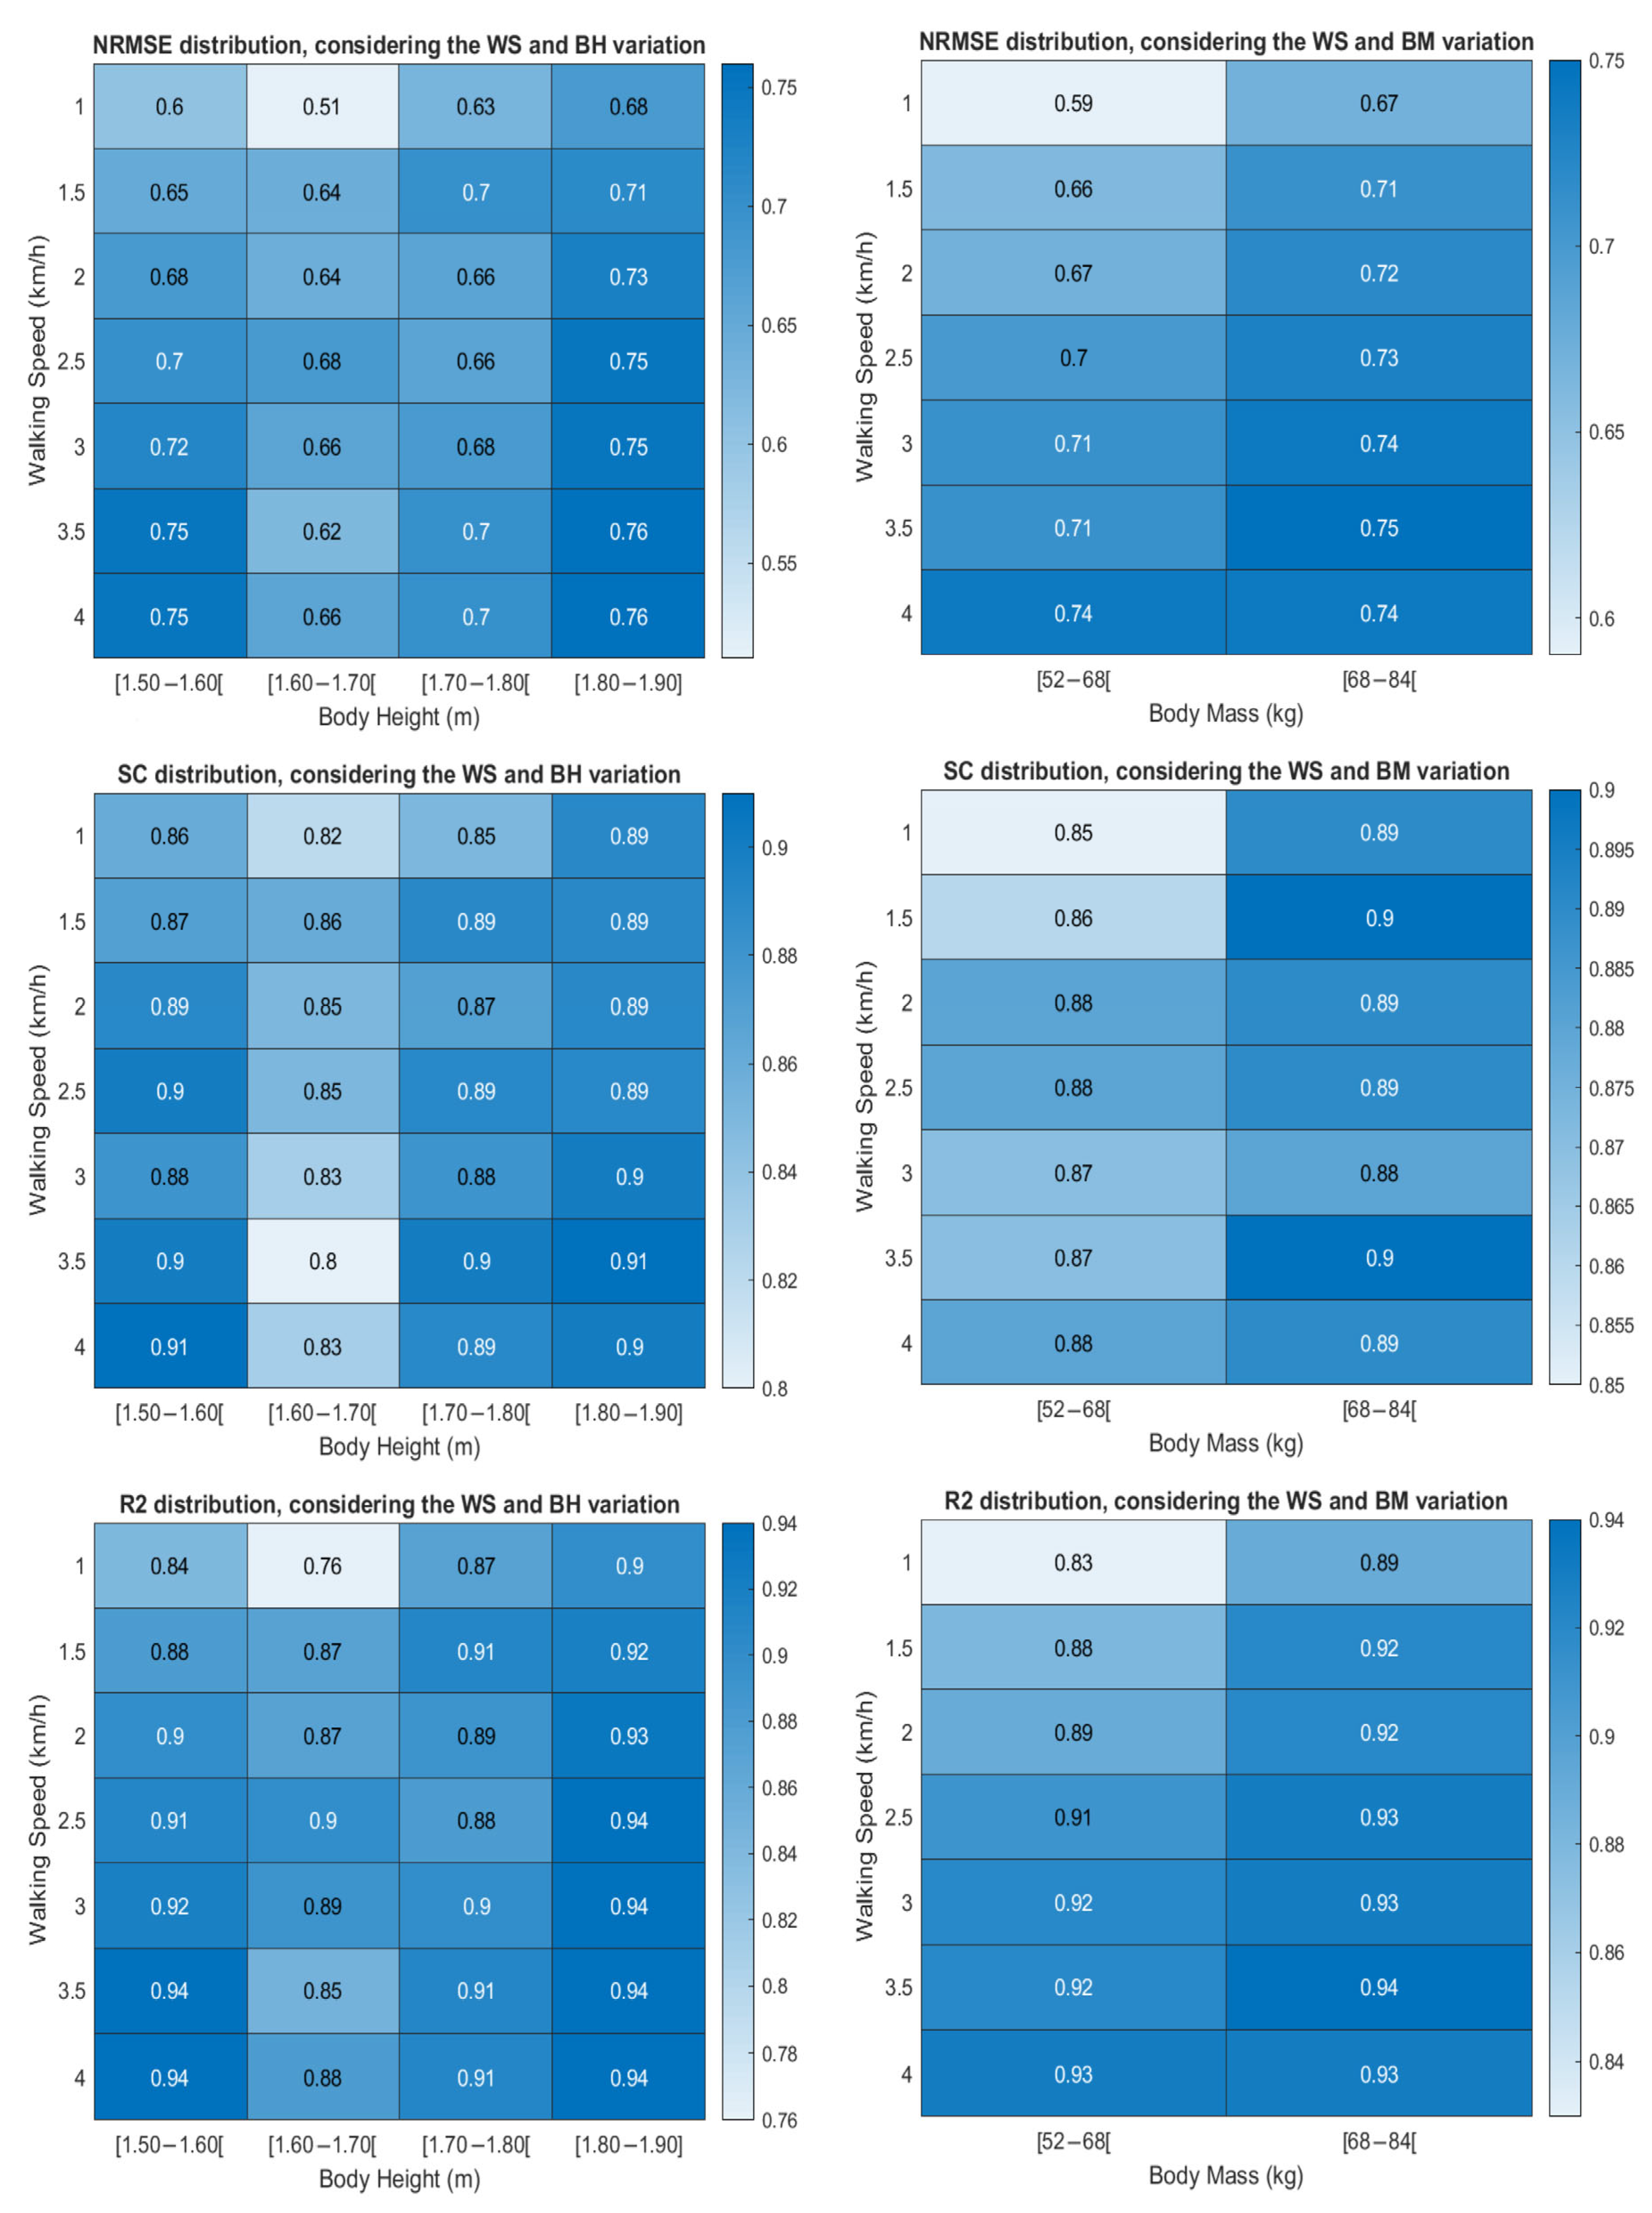
3.3. Walking Speed Versus Body Mass and Height Analysis

We investigated the performance of CNN under variations of walking speed, body mass, and body height, as presented in Figure 5. Visually, the results seem to indicate that the performance of CNN tends to improve as the walking speed increases. Nonetheless, this improvement is minor for each body height or body mass interval since all metrics present values closer to 1 (the desired value to achieve in each evaluation metric). The lower performances were more pronounced for lower values of walking speed. The Friedman test (using a significance level of 5%) was conducted to analyze if the performance in terms of NRMSE, SC, and R2 presented statistically significant differences between the seven walking speeds. This non-parametric test was chosen since the assumptions of normality, homoscedasticity, and the existence of outliers were not achieved for all evaluation metrics. The results, presented in Table A1, show that there are statistically significant differences (p-value < 0.02) in the CNN performance when the participants walked at the lower speed (1.0 km/h) comparatively to the other speeds (2.0, 2.5, 3.0, 3.5, and 4.0 km/h). No significant differences (p-value > 0.05) were found among the other conditions.
Regarding the body height, the results of Figure 5 show that the model exhibited (i) lower performances for subjects with a body height ranging from 1.60 to 1.70 m; and (ii) higher performances for subjects with a body height between 1.80 and 1.90 m. However, based on the results of the Kruskal–Wallis H test (Table A2), there are no statistically significant differences between different body heights for all evaluation metrics and walking speeds (p-value > 0.05). The same finding was reached for the body mass since no statistically significant differences were found between different body mass for all evaluation metrics and walking speeds (p-value > 0.05).

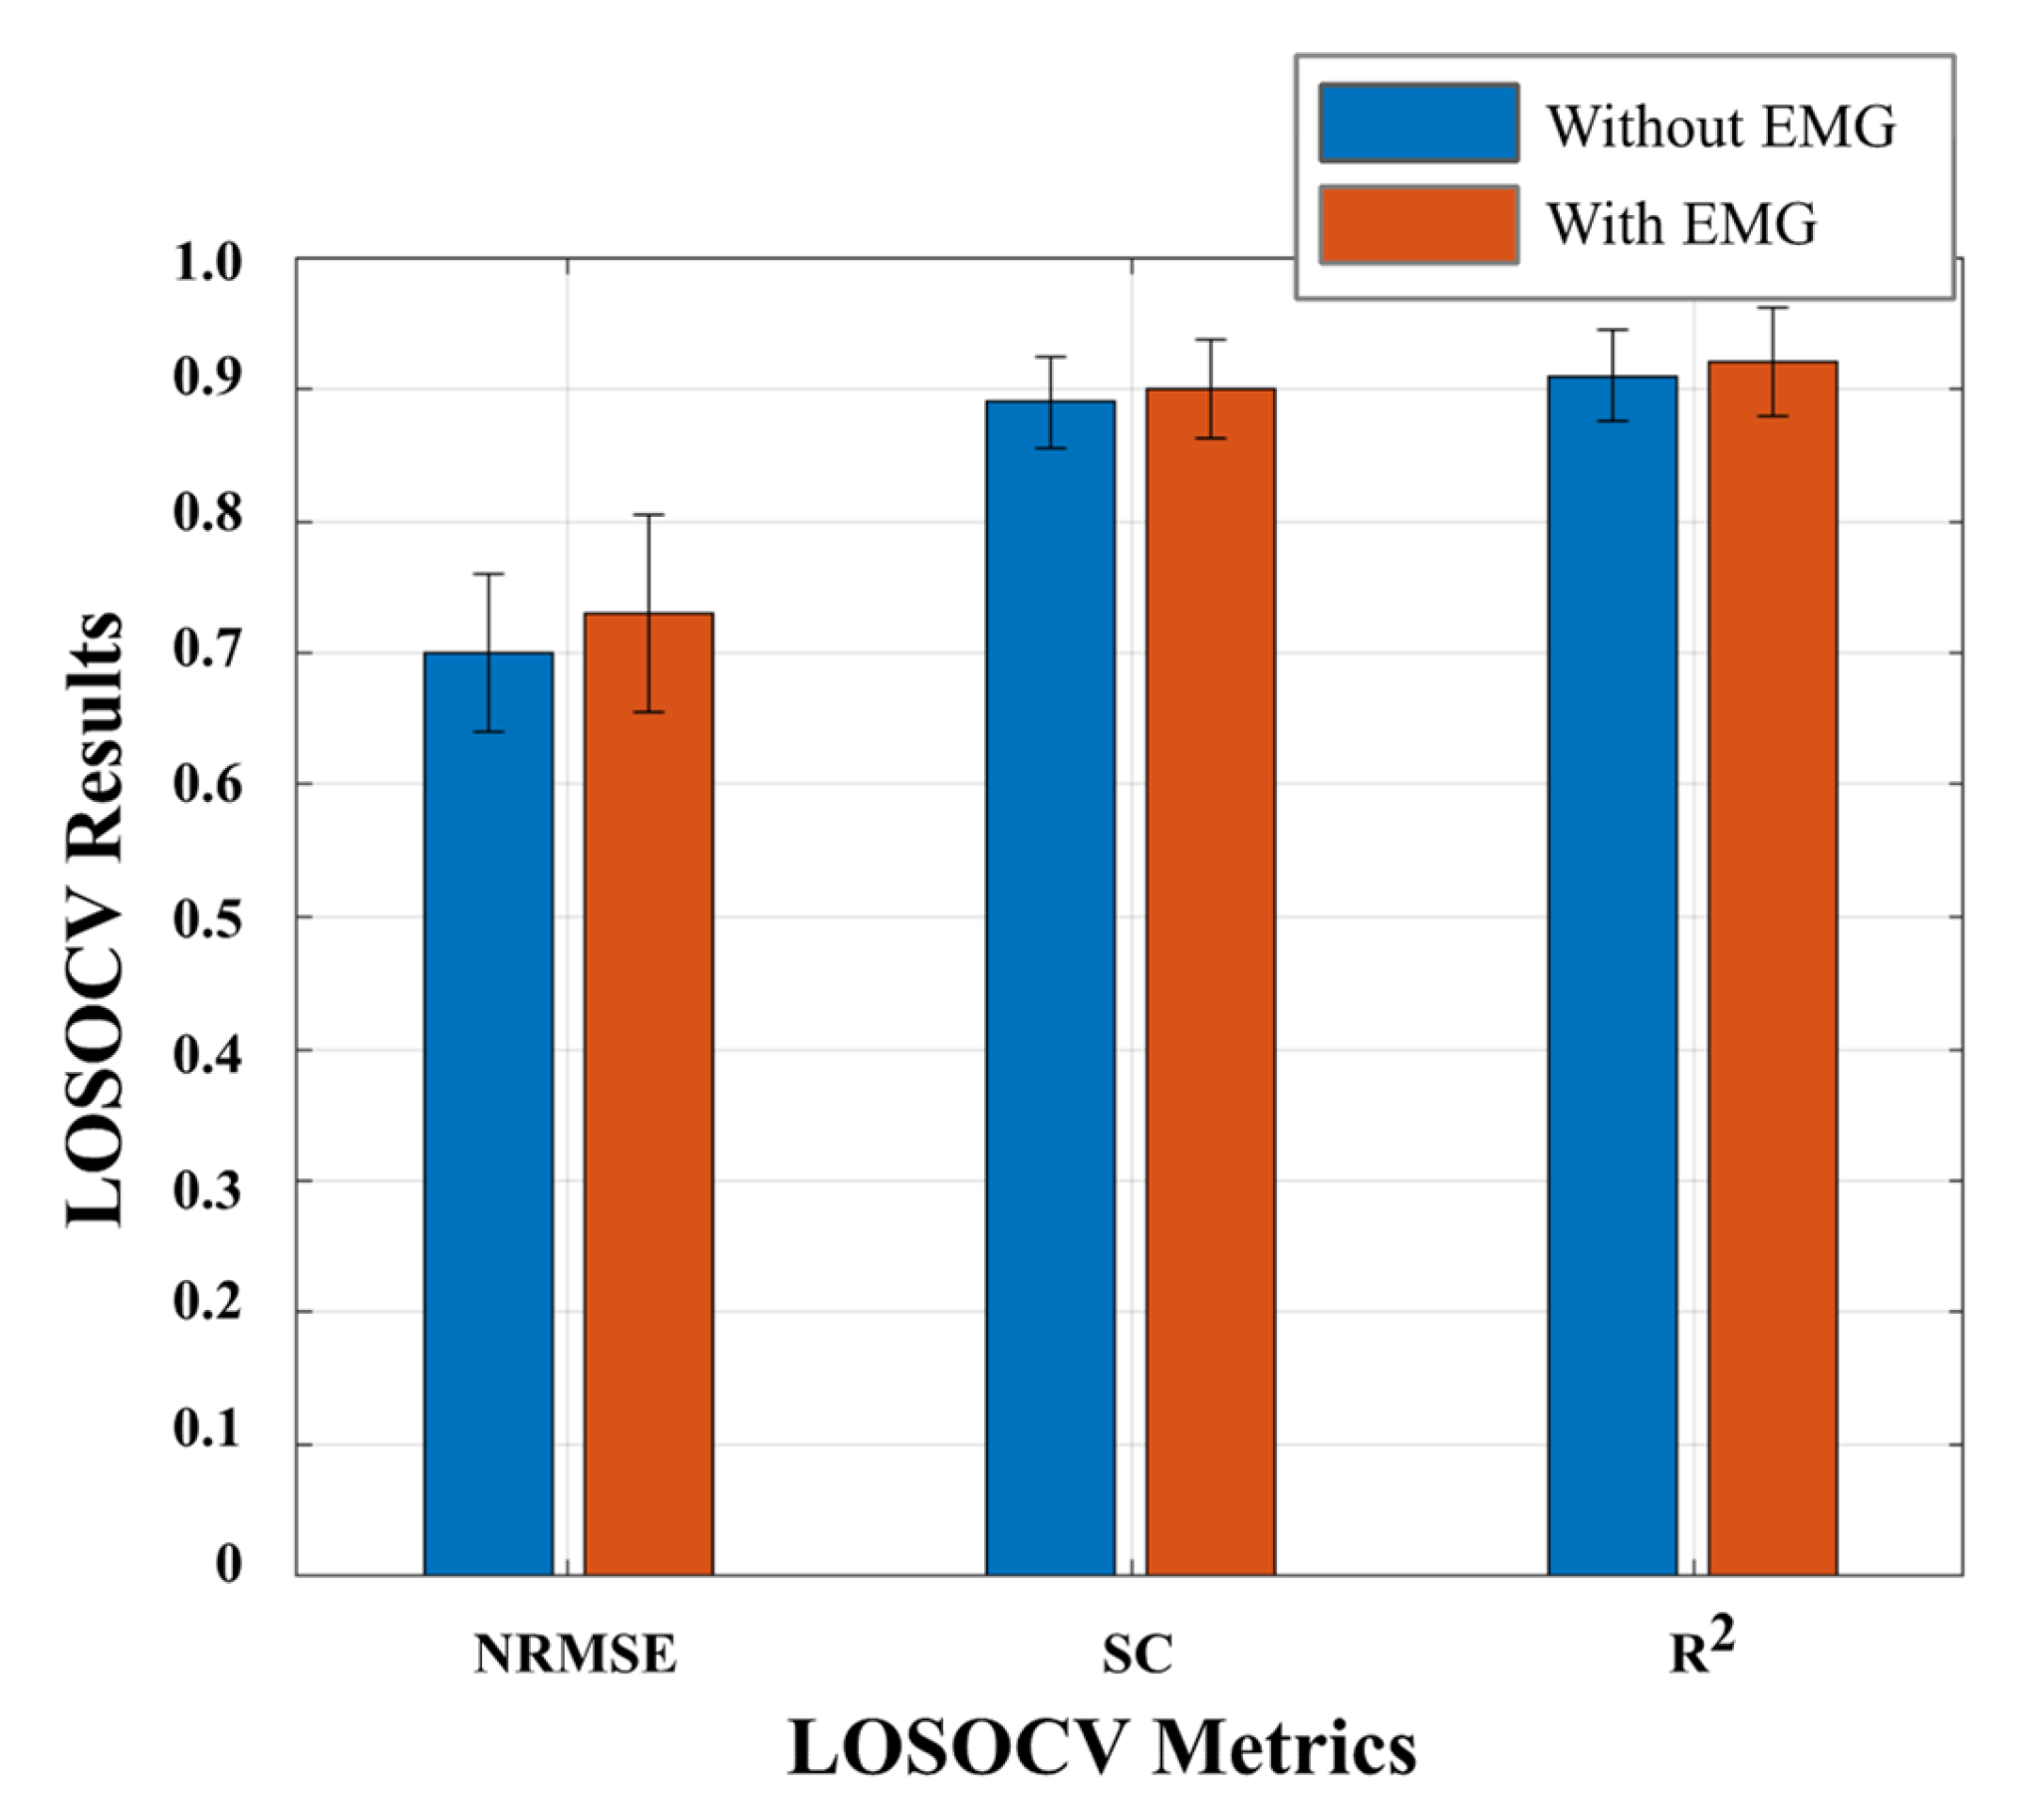
3.4. EMG Inclusion for Ankle Joint Torque Prediction

We investigated the effect of introducing EMG signals from TA and GAL in the ankle joint torque trajectory prediction. The results presented in Table 3 indicate that CNN exhibited a higher performance (a higher mean and a lower SD of NRMSE, SC, and R2) when compared to the results presented by LSTM.
Additionally, we compared the best-fitted CNN model obtained when EMG signals were not used/used as inputs (presented in Table 2 and Table 3, respectively). Figure 6 depicts the results of this comparative analysis. Pursuing the hypothesis that the ankle joint torque trajectories can be accurately estimated without using EMG signals, we performed a statistical analysis to evaluate if the differences presented in Figure 6 were statistically significant. The Shapiro–Wilk normality test showed that all data are parametric, and the assumptions of homoscedasticity and the existence of outliers were accomplished. Thus, a two-tailed and paired t-test was conducted with a level of confidence of 95%. The results indicate that there are no significant differences between both approaches, with a p-value > 0.05 having been achieved for all metrics (NRMSE: p-value = 0.10, SC: p-value = 0.17, and R2: p-value = 0.28).

4. Discussion

This study was developed under the scope of robotics-based gait assistance and rehabilitation, where reference ankle joint torque trajectories are required to provide an AAN training to the patient or to impose a desired healthy joint motion. In parallel, the proposed DL regression models are also useful for a less obtrusive torque estimation, contributing to the human motion analysis field.
The comprehension of the walking speed, body mass, and height effects on lower limb biomechanical parameters is fundamental to determine changes in the gait pattern [16,21,22,24,26,54]. Contributions to the state-of-the-art were centered on the benchmarking analysis of two DL methods to find an accurate and time-effective approach to automatically generate reference ankle joint torque trajectories according to the speed and anthropometric information of the user. This avoids the need for repeated data collections by research teams dedicated to robotic gait assistance.
In this study, we presented a proof-of-concept of DL regressors’ applicability to achieve an accurate and generalized method for estimating ankle torque, considering walking speeds ranging from 1.0 to 4.0 km/h and for subjects with body height and mass varying from 1.51 to 1.83, and from 52.0 to 83.7 kg, respectively. This enables the reference ankle joint torque’s estimation for a widespread population.
The achieved results indicated that CNN yielded the best performances (NRMSE: 0.70 ± 0.06; SC: 0.89 ± 0.03; R2: 0.91 ± 0.03) when compared to those presented by LSTM (NRMSE: 0.58 ± 0.20; SC: 0.84 ± 0.08; R2: 0.79 ± 0.22). In [16], the lowest Correlation Coefficient (R = 0.69) was verified for lower walking speeds. Our study achieved the same results as the ones stated in [16] since the lower performances of CNN were achieved for slower speeds, in which statistically significant differences were found between the performance at 1.0 km/h and the remaining walking speeds (p-value < 0.05). This phenomenon may be associated with greater difficulty in maintaining the equilibrium at slow walking speeds (below 2.0 km/h), as reported by the subjects during the data acquisition since these speeds are less comfortable for healthy humans [55]. Consequently, the walking dynamics suffered modifications, increasing intersubject variability. The inclusion of more subjects might enhance the CNN robustness and generalization to deal with intersubject variabilities, boosting the neural network performance, especially at slow speeds. Nonetheless, according to [27], the preferred walking speeds of individuals with lower limb impairments range from 1.6 km/h to 2.5 km/h. Since no statistically significant differences were found in the CNN performance for this range of walking speeds and higher (p-value > 0.05), its use for generating the reference ankle joint torque trajectories desired for impaired subjects is plausible. Further, no statistically significant differences were found (p-value > 0.05) in the obtained performance across different body heights and mass, which allows us to conclude that the implemented CNN is robust in relation to the body height and body mass variation. This finding empowers the notion that the proposed approach is a promising choice for generating ankle joint torque trajectories for individuals with a body height and mass ranging from 1.51 to 1.83 m and 52.0 to 83.7 kg, respectively.
The results achieved in this study are encouraging when considering the findings presented in previous studies [22,23,28,29,30]. Study [22] reached a R2 of 0.48 for predicting the peak kinetic ankle dorsiflexion torque using linear and quadratic equations. In [28], peak ankle, knee, and hip joint angles and torques were estimated using linear, quadratic second order, and quadratic third order equations. The highest value of R2 for peak ankle joint torque estimation was 0.93. Study [23] estimated ankle, knee, and hip angles and torques for the stance phase using feedforward and LSTM neural networks. A R of 0.98 was achieved for ankle joint torque estimation. Despite presenting different datasets and study conditions, our proposal appears to progress the results achieved in [22,23,28], predicting ankle joint torque trajectories for the full gait cycle with a R2 of 0.91 ± 0.03 (R of 0.95 ± 0.18). The estimation performed for the complete gait cycle is advantageous over the estimation for specific gait events because the torque curve is characterized not only in magnitude but also temporally [15]. Other studies ([29,30]) have reported that a Multilayer Perceptron can estimate knee joint torque trajectories with a R of 0.97 by combining EMG signals with kinematic sensors. Our study predicts ankle joint torque trajectories, achieving a R of 0.95 ± 0.18, based on fewer input data and without the need for complex data acquisitions related to EMG.
Despite offering promising performances, the use of EMG signals can present some practice-related drawbacks, such as (a) the difficulty to maintain the sensors in the same position during the user’s locomotion, which can affect the joint torque estimation over time; (b) the need for an expert-based setup; (c) skin reactions; (d) the measures are affected by temperature variations and sweating [39,40,41,42,56]. From a comparative analysis between the estimation of the ankle joint torque trajectories with and without considering EMG signals as input, significant differences between both approaches were not found (p-value > 0.05). Moreover, the low computational load demonstrated by CNN suggests its promising application, even in real-time conditions. These findings revealed that the proposed speed, kinematic-, speed-, and anthropometry-dependent approach corresponds to a more practical solution than the ones proposed in [22,23,28,29,30] to estimate ankle joint torque trajectories for the full gait cycle and it may simplify the current sensor setup for estimating real joint torque estimations.
However, there is still room for extending the CNN applicability to other conditions by including more participants per each anthropometric category and a wider range of ages, ensuring a balanced body height and mass distribution, which may increase the model performance. Moreover, introducing different locomotion modes (such as ramps or stairs) may be useful for PADs that address personalized assistance in daily living scenarios. The reference joint torque estimation for the remaining lower limb joints, covering an wide range of walking speeds is another future challenge that could be addressed. Special attention should be paid to lower walking speeds, such as 1.0 km/h, since the intra- and inter-variability across individuals is higher and the lower limb joint biomechanics is highly modified, jeopardizing the model’s learning.

5. Conclusions

This study tackles a gap in the state-of-the-art by presenting a DL-based benchmark approach to generate user-oriented healthy reference ankle joint torque trajectories for walking speeds ranging from 1.0 to 4.0 km/h and for subjects with body height and mass varying from 1.51 to 1.83, and from 52.0 to 83.7 kg, respectively. CNN is demonstrated to be the most accurate and time-effective method from a benchmarking analysis with two DL algorithms (LSTM and CNN). The proposed system for joint torque generation avoids the need for repeated data collection by research teams dedicated to robotic gait assistance. From a comparative analysis between the estimation of ankle joint torque trajectories with and without considering EMG signals as input, significant differences between both approaches were not found. This finding revealed that the proposed speed-, kinematic-, and anthropometry-dependent approach corresponds to a more practical solution for ankle joint torque estimation in several applications of human motion analysis.

Author Contributions

L.M. wrote the manuscript, conceived the data collection, and contributed to the elaboration of the software algorithms to process the collected data and apply the Deep Learning Neural Networks. J.F. contributed to data curation, formal analysis, and editing of the manuscript. J.P.V.-B. supervised the study. C.P.S. conceived the methodology and supervised the study, and contributed to the editing of the manuscript. All authors have read and agreed to the published version of the manuscript.

Funding

This work was funded in part by the Fundação para a Ciência e Tecnologia (FCT) with the Reference Scholarship under Grant 2020.05711.BD, and in part by the FEDER Funds through the COMPETE 2020—Programa Operacional Competitividade e Internacionalização (POCI) and P2020 with the Reference Project SmartOs Grant POCI-01-0247-FEDER-039868, and by FCT national funds, under the national support to R&D units grant, through the reference project UIDB/04436/2020 and UIDP/04436/2020.

Institutional Review Board Statement

The study was conducted according to the guidelines of the Declaration of Helsinki, and approved by the Institutional Review Board (or Ethics Committee) of University of Minho (CICVS 006/2020).

Informed Consent Statement

Informed consent was obtained from all subjects involved in the study.

Data Availability Statement

Not applicable.

Acknowledgments

We thank Pedro Fonseca for the assistance in data collection in LABIOMEP—Porto Biomechanics Laboratory, University of Porto, Porto, Portugal.

Conflicts of Interest

The authors declare no conflict of interest.

Appendix A

Table A1 presents the results of the Friedman test (using a significance level of 5%) conducted to analyze the performance of the kinematic-, speed-, and anthropometry-driven CNN in terms of NRMSE, SC, and R2 among the seven walking speeds.
Table A1. The p-value of the related samples test for NRMSE, SC, and R2 variables, considering the different walking speeds and a significance level of 5%. The most representative results appear in bold (p-value < 0.05).
Sample 1–Sample 2MetricZp-Value
1.0–1.5 km/hNRMSE−2.350.02
SC−1.330.18
R2−2.350.02
1.0–2.0 km/hNRMSE−2.590.01
SC−1.570.12
R2−2.430.02
1.0–2.5 km/hNRMSE−2.820.01
SC−1.650.10
R2−2.820.01
1.0–3.0 km/hNRMSE−3.060.00
SC−1.100.27
R2−3.060.00
1.0–3.5 km/hNRMSE−3.060.00
SC−1.260.21
R2−3.060.00
1.0–4.0 km/hNRMSE−3.060.00
SC−1.570.12
R2−3.060.00
1.5–2.0 km/hNRMSE−1.410.16
SC−0.470.64
R2−1.330.18
1.5–2.5 km/hNRMSE−1.260.21
SC0.001.00
R2−1.180.24
1.5–3.0 km/hNRMSE−1.330.18
SC−0.470.64
R2−1.330.18
1.5–3.5 km/hNRMSE−1.330.18
SC−0.470.64
R2−1.260.21
1.5–4.0 km/hNRMSE−1.260.21
SC−0.550.58
R2−1.260.21
2.0–2.5 km/hNRMSE−1.180.24
SC−0.620.53
R2−1.260.21
2.0–3.0 km/hNRMSE−1.020.31
SC−0.470.64
R2−1.180.24
2.0–3.5 km/hNRMSE−1.100.27
SC−0.280.78
R2−1.020.31
2.0–4.0 km/hNRMSE−1.330.18
SC-0.390.70
R2−1.100.27
2.5–3.0 km/hNRMSE−0.080.94
SC−0.780.43
R20.001.00
2.5–3.5 km/hNRMSE−0.710.48
SC−0.470.64
R2−0.080.94
2.5–4.0 km/hNRMSE−0.630.53
SC−0.550.58
R2−0.550.58
3.0–3.5 km/hNRMSE−0.550.58
SC−1.020.31
R2−0.470.64
3.0–4.0 km/hNRMSE−0.940.35
SC−0.630.53
R2−0.780.43
3.5–4.0 km/hNRMSE−1.100.27
SC−0.230.81
R2−0.940.35
Table A2 presents the results of the Kruskal–Wallis H test (using a significance level of 5%) conducted to analyze the performance of the kinematic-, speed-, and anthropometry-driven CNN in terms of NRMSE, SC, and R2 among the different body heights and mass for each walking speed.
Table A2. The p-value of the independent samples test for NRMSE, SC, and R2 variables, considering the different body heights, body mass, and walking speeds, and a significance level of 5%.
Walking SpeedMetricBody HeightBody Mass
Kruskal–Wallis Hp-ValueKruskal–Wallis Hp-Value
1.0 km/hNRMSE5.540.172.380.12
SC5.080.171.110.29
R25.540.142.380.12
1.5 km/hNRMSE1.520.680.800.37
SC1.520.680.800.37
R21.520.680.800.37
2.0 km/hNRMSE3.980.260.320.57
SC5.440.140.160.68
R23.980.260.320.57
2.5 km/hNRMSE2.690.440.530.46
SC4.380.220.060.80
R22.690.440.530.46
3.0 km/hNRMSE3.980.261.110.29
SC4.210.240.010.94
R23.980.261.110.29
3.5 km/hNRMSE4.770.190.800.37
SC4.850.180.010.94
R24.770.190.780.37
4.0 km/hNRMSE3.140.370.010.94
SC4.960.180.060.81
R23.140.370.010.94

References

  1. Johnson, W.; Onuma, O.; Owolabi, M.; Sachdev, S.; Bulletin of World Health Organization. Stroke: A Global Response Is Needed. 2016. Available online: https://www.who.int/bulletin/volumes/94/9/16-181636/en/ (accessed on 5 June 2019).
  2. Johnson, C.O.; Nguyen, M.; Roth, G.A.; Nichols, E.; Alam, T.; Abate, D.; Abd-Allah, F.; Abdelalim, A.; Abraha, H.N.; Abu-Rmeileh, N.M.; et al. Global, regional, and national burden of stroke, 1990–2016: A systematic analysis for the Global Burden of Disease Study 2016. Lancet Neurol. 2019, 18, 439–458. [Google Scholar] [CrossRef] [Green Version]
  3. Rajsic, S.; Gothe, H.; Borba, H.H.; Sroczynski, G.; Vujicic, J.; Toell, T.; Siebert, U. Economic burden of stroke: A systematic review on post-stroke care. Eur. J. Health Econ. 2019, 20, 107–134. [Google Scholar] [CrossRef]
  4. Luengo-Fernandez, R.; Leal, J.; Candio, P.; Violato, M. The Economic Impact of Stroke in Europe: Current Costs of Stroke throughout Europe. Eur. Stroke J. 2019, 5, 17–25. [Google Scholar] [CrossRef] [PubMed]
  5. Li, S.; Francisco, G.E.; Zhou, P. Post-stroke Hemiplegic Gait: New Perspective and Insights. Front. Physiol. 2018, 9, 1021. [Google Scholar] [CrossRef] [PubMed] [Green Version]
  6. Da Saúde, D.G. Programa Nacional de Prevenção e Controlo das Doenças Cardiovasculares. Dgs. 2006, p. 28. Available online: https://www.google.pt/url?sa=t&rct=j&q=&esrc=s&source=web&cd=1&cad=rja&uact=8&ved=0ahUKEwin1rHhmc3MAhUDuhoKHYOvAe4QFggiMAA&url=http://1nj5ms2lli5hdggbe3mm7ms5.wpengine.netdna-cdn.com/files/2015/08/Programa-Nacional-de-Prevencao-das-Doencas-Cardiovasculare (accessed on 4 August 2021).
  7. Tucker, M.R.; Olivier, L.; Pagel, A.; Bleuler, H.; Bouri, M.; Lambercy, O.; Millán, J.D.R.; Riener, R.; Vallery, H.; Gassert, R. Control strategies for active lower extremity prosthetics and orthotics: A review. J. Neuroeng. Rehabil. 2015, 12, 1. [Google Scholar] [CrossRef] [Green Version]
  8. Jamwal, P.K.; Xie, S.Q.; Hussain, S.; Parsons, J.G. An Adaptive Wearable Parallel Robot for the Treatment of Ankle Injuries. IEEE/ASME Trans. Mechatron. 2012, 19, 64–75. [Google Scholar] [CrossRef]
  9. Meng, W.; Liu, Q.; Zhou, Z.; Ai, Q.; Sheng, B.; Xie, S. Recent development of mechanisms and control strategies for robot-assisted lower limb rehabilitation. Mechatronics 2015, 31, 132–145. [Google Scholar] [CrossRef]
  10. Figueiredo, J.S.C. Smart wearable orthosis to assist impaired human walking. Ph.D. Thesis, University of Minho, Braga, Portugal, 2019. [Google Scholar]
  11. Fleischer, C.; Hommel, G. A Human--Exoskeleton Interface Utilizing Electromyography. IEEE Trans. Robot. 2008, 24, 872–882. [Google Scholar] [CrossRef]
  12. Hassani, W.; Mohammed, S.; Rifai, H.; Amirat, Y. EMG based approach for wearer-centered control of a knee joint actuated orthosis. In Proceedings of the 2013 IEEE/RSJ International Conference on Intelligent Robots and Systems, Tokyo, Japan, 3–7 November 2013; pp. 990–995. [Google Scholar]
  13. Hassani, W.; Mohammed, S.; Amirat, Y. Real-Time EMG Driven Lower Limb Actuated Orthosis for Assistance as Needed Movement Strategy. In Proceedings of the Robotics: Science and Systems 2013, Berlin, Germany, 24−28 June 2013. [Google Scholar]
  14. Hassani, W.; Mohammed, S.; Rifaï, H.; Amirat, Y. Powered orthosis for lower limb movements assistance and rehabilitation. Control. Eng. Pract. 2014, 26, 245–253. [Google Scholar] [CrossRef]
  15. Zhang, J.; Cheah, C.C.; Collins, S.H. Experimental comparison of torque control methods on an ankle exoskeleton during human walking. In Proceedings of the 2015 IEEE International Conference on Robotics and Automation (ICRA), Seattle, WA, USA, 26–30 May 2015; pp. 5584–5589. [Google Scholar]
  16. Koopman, B.; van Asseldonk, E.; van der Kooij, H. Speed-dependent reference joint trajectory generation for robotic gait support. J. Biomech. 2014, 47, 1447–1458. [Google Scholar] [CrossRef]
  17. Bogert, A.J.V.D.; Geijtenbeek, T.; Even-Zohar, O.; Steenbrink, F.; Hardin, E.C. A real-time system for biomechanical analysis of human movement and muscle function. Med. Biol. Eng. Comput. 2013, 51, 1069–1077. [Google Scholar] [CrossRef] [Green Version]
  18. Bovi, G.; Rabuffetti, M.; Mazzoleni, P.; Ferrarin, M. A multiple-task gait analysis approach: Kinematic, kinetic and EMG reference data for healthy young and adult subjects. Gait Posture 2011, 33, 6–13. [Google Scholar] [CrossRef] [PubMed]
  19. Lencioni, T.; Carpinella, I.; Rabuffetti, M.; Marzegan, A.; Ferrarin, M. Human kinematic, kinetic and EMG data during different walking and stair ascending and descending tasks. Sci. Data 2019, 6, 309. [Google Scholar] [CrossRef] [Green Version]
  20. Moore, J.K.; Hnat, S.K.; Bogert, A.J.V.D. An elaborate data set on human gait and the effect of mechanical perturbations. PeerJ 2015, 3, e918. [Google Scholar] [CrossRef] [PubMed] [Green Version]
  21. Branco, M.; Santos-Rocha, R.; Vieira, M.F. Biomechanics of Gait during Pregnancy. Sci. World J. 2014, 2014, 1–5. Available online: http://www.hindawi.com/journals/tswj155/2014/527940/ (accessed on 4 August 2021). [CrossRef] [Green Version]
  22. Lelas, J.L.; Merriman, G.J.; Riley, P.O.; Kerrigan, D. Predicting peak kinematic and kinetic parameters from gait speed. Gait Posture 2003, 17, 106–112. [Google Scholar] [CrossRef]
  23. Mundt, M.; Thomsen, W.; Witter, T.; Koeppe, A.; David, S.; Bamer, F.; Potthast, W.; Markert, B. Prediction of lower limb joint angles and moments during gait using artificial neural networks. Med. Biol. Eng. Comput. 2019, 58, 211–225. [Google Scholar] [CrossRef]
  24. Schwartz, M.H.; Rozumalski, A.; Trost, J. The effect of walking speed on the gait of typically developing children. J. Biomech. 2008, 41, 1639–1650. [Google Scholar] [CrossRef] [PubMed]
  25. Silva, F.R.; Muniz, A.M.D.S.; Cerqueira, L.S.; Nadal, J. Biomechanical alterations of gait on overweight subjects. Res. Biomed. Eng. 2018, 34, 291–298. [Google Scholar] [CrossRef]
  26. Stoquart, G.; Detrembleur, C.; Lejeune, T. Effect of speed on kinematic, kinetic, electromyographic and energetic reference values during treadmill walking. Neurophysiol. Clin. Neurophysiol. 2008, 38, 105–116. [Google Scholar] [CrossRef]
  27. Beaman, C.; Peterson, C.; Neptune, R.; Kautz, S. Differences in self-selected and fastest-comfortable walking in post-stroke hemiparetic persons. Gait Posture 2010, 31, 311–316. [Google Scholar] [CrossRef] [Green Version]
  28. Smith, A.J.J.; Lemaire, E.D.; Nantel, J. Lower limb sagittal kinematic and kinetic modeling of very slow walking for gait trajectory scaling. PLoS ONE 2018, 13, e0203934. [Google Scholar] [CrossRef] [Green Version]
  29. Chandrapal, M.; Chen, X.; Wang, W.; Stanke, B.; Le Pape, N. Investigating improvements to neural network based EMG to joint torque estimation. Paladyn J. Behav. Robot. 2011, 2, 185–192. [Google Scholar] [CrossRef]
  30. Hahn, M.E. Feasibility of estimating isokinetic knee torque using a neural network model. J. Biomech. 2007, 40, 1107–1114. [Google Scholar] [CrossRef]
  31. Geyer, H.; Herr, H.M. A Muscle-Reflex Model That Encodes Principles of Legged Mechanics Produces Human Walking Dynamics and Muscle Activities. IEEE Trans. Neural Syst. Rehabil. Eng. 2010, 18, 263–273. [Google Scholar] [CrossRef] [PubMed]
  32. Caldas, R.; Fadel, T.; Buarque, F.; Markert, B. Adaptive predictive systems applied to gait analysis: A systematic review. Gait Posture 2020, 77, 75–82. [Google Scholar] [CrossRef]
  33. Goodfellow, I.; Bengio, Y.; Courville, A. Deep Learning; MIT Press: Cambridge, MA, USA, 2016. [Google Scholar]
  34. Fawaz, H.I.; Forestier, G.; Weber, J.; Idoumghar, L.; Muller, P.-A. Deep learning for time series classification: A review. Data Min. Knowl. Discov. 2019, 33, 917–963. [Google Scholar] [CrossRef] [Green Version]
  35. Skansi, S. Introduction to Deep Learning: From Logical Calculus to Artificial Intelligence; Springer: Berlin/Heidelberg, Germany, 2018; Volume 114. [Google Scholar]
  36. Zaroug, A.; Lai, D.T.H.; Mudie, K.; Begg, R. Lower Limb Kinematics Trajectory Prediction Using Long Short-Term Memory Neural Networks. Front. Bioeng. Biotechnol. 2020, 8, 362. [Google Scholar] [CrossRef]
  37. Moreira, L.; Cerqueira, S.; Figueiredo, J.; Vilas-Boas, J.; Santos, C. AI-based Reference Ankle Joint Torque Trajectory Generation for Robotic Gait Assistance: First Steps. In Proceedings of the 2020 IEEE International Conference on Autonomous Robot Systems and Competitions (ICARSC), Ponta Delgada, Portugal, 15–17 April 2020; pp. 22–27. [Google Scholar]
  38. Balaban, B.; Tok, F. Gait Disturbances in Patients with Stroke. PM&R 2014, 6, 635–642. [Google Scholar] [CrossRef]
  39. Parri, A.; Yuan, K.; Marconi, D.; Yan, T.; Crea, S.; Munih, M.; Lova, R.M.; Vitiello, N.; Wang, Q. Real-Time Hybrid Locomotion Mode Recognition for Lower Limb Wearable Robots. IEEE/ASME Trans. Mechatron. 2017, 22, 2480–2491. [Google Scholar] [CrossRef]
  40. Kim, H.; Shin, Y.J.; Kim, J. Kinematic-based locomotion mode recognition for power augmentation exoskeleton. Int. J. Adv. Robot. Syst. 2017, 14, 1729881417730321. [Google Scholar] [CrossRef]
  41. Zhu, L.; Wang, Z.; Ning, Z.; Zhang, Y.; Liu, Y.; Cao, W.; Wu, X.; Chen, C. A Novel Motion Intention Recognition Approach for Soft Exoskeleton via IMU. Electronics 2020, 9, 2176. [Google Scholar] [CrossRef]
  42. Gong, C.; Xu, D.; Zhou, Z.; Vitiello, N.; Wang, Q. Real-Time On-Board Recognition of Locomotion Modes for an Active Pelvis Orthosis. In Proceedings of the 2018 IEEE-RAS 18th International Conference on Humanoid Robots (Humanoids), Beijing, China, 6–9 November 2018; pp. 346–350. [Google Scholar]
  43. Kim, D.-H.; Cho, C.-Y.; Ryu, J. Real-Time Locomotion Mode Recognition Employing Correlation Feature Analysis Using EMG Pattern. ETRI J. 2014, 36, 99–105. [Google Scholar] [CrossRef]
  44. Kerrigan, D.C.; Todd, M.K.; Della Croce, U. Gender differences in joint biomechanics during walking Normative Study in Young Adults. Am. J. Phys. Med. Rehabil. 1998, 77, 2–7. [Google Scholar] [CrossRef]
  45. Perkins, J.M.; Subramanian, S.; Smith, G.D.; Özaltin, E. Adult height, nutrition, and population health. Nutr. Rev. 2016, 74, 149–165. [Google Scholar] [CrossRef] [Green Version]
  46. Hermens, H.J.; Freriks, B.; Disselhorst-Klug, C.; Rau, G. Development of recommendations for SEMG sensors and sensor placement procedures. J. Electromyogr. Kinesiol. 2000, 10, 361–374. [Google Scholar] [CrossRef]
  47. Moreira, L.; Figueiredo, J.; Fonseca, P.; Vilas-Boas, J.P.; Santos, C.P. Lower limb kinematic, kinetic, and EMG data from young healthy humans during walking at controlled speeds. Sci. Data 2021, 8, 103. [Google Scholar] [CrossRef] [PubMed]
  48. Farfán, F.D.; Politti, J.C.; Felice, C.J. Evaluation of EMG processing techniques using Information Theory. Biomed. Eng. Online 2010, 9, 72. [Google Scholar] [CrossRef] [PubMed] [Green Version]
  49. Rabuffetti, M.; Marzegan, A.; Crippa, A.; Carpinella, I.; Lencioni, T.; Castagna, A.; Ferrarin, M. The LAMB gait analysis protocol: Definition and experimental assessment of operator-related variability. Proc. Inst. Mech. Eng. Part H J. Eng. Med. 2019, 233, 342–353. [Google Scholar] [CrossRef] [PubMed]
  50. Perry, J. Gait Analysis: Normal and Pathological Function; SLACK Incorporated: Thorofare, NJ, USA, 1992. [Google Scholar]
  51. Su, B.; Gutierrez-Farewik, E.M. Gait Trajectory and Gait Phase Prediction Based on an LSTM Network. Sensors 2020, 20, 7127. [Google Scholar] [CrossRef] [PubMed]
  52. Liu, G.; Zhang, L.; Han, B.; Zhang, T.; Wang, Z.; Wei, P. sEMG-Based Continuous Estimation of Knee Joint Angle Using Deep Learning with Convolutional Neural Network. In Proceedings of the 2019 IEEE 15th International Conference on Automation Science and Engineering (CASE), Vancouver, BC, Canada, 22–26 August 2019; Volume 2019, pp. 140–145. [Google Scholar]
  53. Breslow, N. Lessons in biostatistics. Past Present Future Stat. Sci. 2014, 25, 335–347. [Google Scholar]
  54. Silva, L.L.M.E.; De Moura, C.E.M.; De Godoy, J.R.P. A marcha no paciente hemiparético. Universitas: Ciências da Saúde 2005, 3, 261–273. [Google Scholar] [CrossRef]
  55. Hanlon, M.; Anderson, R. Prediction methods to account for the effect of gait speed on lower limb angular kinematics. Gait Posture 2006, 24, 280–287. [Google Scholar] [CrossRef] [PubMed]
  56. De Luca, C.J.; Gilmore, L.D.; Kuznetsov, M.; Roy, S.H. Filtering the surface EMG signal: Movement artifact and baseline noise contamination. J. Biomech. 2010, 43, 1573–1579. [Google Scholar] [CrossRef] [PubMed]
Figure 1. EMG configuration and marker-set adopted: (A) VL; (B) TA; (C) BF; (D) GAL; (1) Anterior superior liiac apine; (2) trochanter; (3) thigh; (4) lateral knee; (5) medial knee; (6) shank; (7) lateral ankle; (8) medial ankle; (9) foot metatarsal 5; (10) foot metatarsal 1; (11) foot metatarsal 2; (12) posterior superior iliac spine.
Machines 09 00154 g001
Figure 2. Data acquisition scenario, in which points A and B represent the beginning and the end positions of each trial, respectively.
Machines 09 00154 g002
Figure 3. LOSOCV results for both DL regression models without using EMG signals.
Machines 09 00154 g003
Figure 4. (a) Bland–Altman plot results; (b) Mean (dashed lines) and SD (filled area) of the real and CNN-based predicted ankle joint torque for the test dataset.
Machines 09 00154 g004
Figure 5. NRMSE, SC, and R2 distribution considering the walking speed (WS) and body height (BH) variation (left), and the WS and body mass (BM) variation (right).
Machines 09 00154 g005
Figure 6. LOSOCV results for both DL regression models using EMG signals.
Machines 09 00154 g006
Table 1. Participants’ demographic and anthropometric information.
IDGenderBody Height (m)Body Mass (kg)Age (Years)Foot Length (m)Shank Length (m)
1Male1.8166.2250.280.42
2Female1.5654.4230.240.38
3Female1.5753.5260.240.39
4Male1.7974.4240.270.44
5Female1.6560.0210.240.39
6Female1.5458.4210.210.35
7Male1.7275.8230.270.41
8Male1.8083.7260.270.44
9Male1.8276.8250.260.42
10Female1.5152.0230.250.40
11Male1.8373.4250.230.46
12Female1.6153.5270.210.32
13Female1.6065.3260.260.34
Mean1.6865.224.20.250.40
Standard Deviation0.1210.31.850.020.04
Table 2. NRMSE, SC, R2, and computational time results for both DL models without using EMG signals.
DL ModelHyperparametersNRMSESCR2Prediction Time (ms/Sample)
LOSOCVTestLOSOCVTestLOSOCVTest
LSTMNumber of neurons1000.58 ± 0.200.710.84 ± 0.080.920.79 ± 0.220.923.7
LSTM layers1
Normalization methodz-score
Batch size20
Dropout (%)50
CNNKernel size2 × 20.70 ± 0.060.760.89 ± 0.030.920.91 ± 0.030.940.51
Number of layers (number of filters)2 (8–16)
Normalization methodRobust
Batch size20
Dropout (%)25
Table 3. NRMSE, SC, R2, and computational time results for both DL models without using EMG signals.
DL ModelHyperparametersNRMSESCR2Prediction Time (ms/Sample)
LOSOCVTestLOSOCVTestLOSOCVTest
LSTMNumber of neurons1000.59 ± 0.150.480.88 ± 0.050.780.81 ± 0.130.734.80
LSTM layers1
Normalization methodz-score
Batch size20
Dropout (%)50
CNNKernel size2 × 20.73 ± 0.080.720.90 ± 0.040.890.92 ± 0.040.920.78
Number of layers (number of filters)2 (8–16)
Normalization methodRobust
Batch size20
Dropout (%)25
Publisher’s Note: MDPI stays neutral with regard to jurisdictional claims in published maps and institutional affiliations.

