1. Introduction
In the conventional loss separation concept [
1,
2,
3], the total power loss can be expressed as the sum of three independent terms, considering the harmonic and rotational fluxes. However, in many cases, the magnetic flux waveform in the laminated core of an electrical machine is not sinusoidal, and the hysteresis loop contains many minor loops [
4,
5,
6,
7]. Therefore, iron loss separation concepts [
1,
2,
3] are insufficient for electric machines with high flux saturation.
In this study, three hysteresis losses were compared. The first hysteresis loss is the frequency separation method [
1,
2,
3], the second method involves counting the number of minor loops, and the third method involves calculating the size of the minor loop based on DC bias. Eddy current losses were compared between the two methods. The first method is based on the loss separation concept [
1,
2,
3], whereas the second analysis method is based on homogenization considering the skin effect. In general, a three-dimensional finite element method (FEM) analysis is required to consider the skin effect. However, using magnetic flux density data obtained from a magnetic field strength test is sufficient for a two-dimensional (2D)-FEM analysis. Therefore, in this study, the JMAG 2D FEM tool was used to perform iron loss analyses of inner permanent magnet synchronous motors (IP-MSMs) comprising high-saturation automotive air conditioner refrigerant compressors.
As shown in
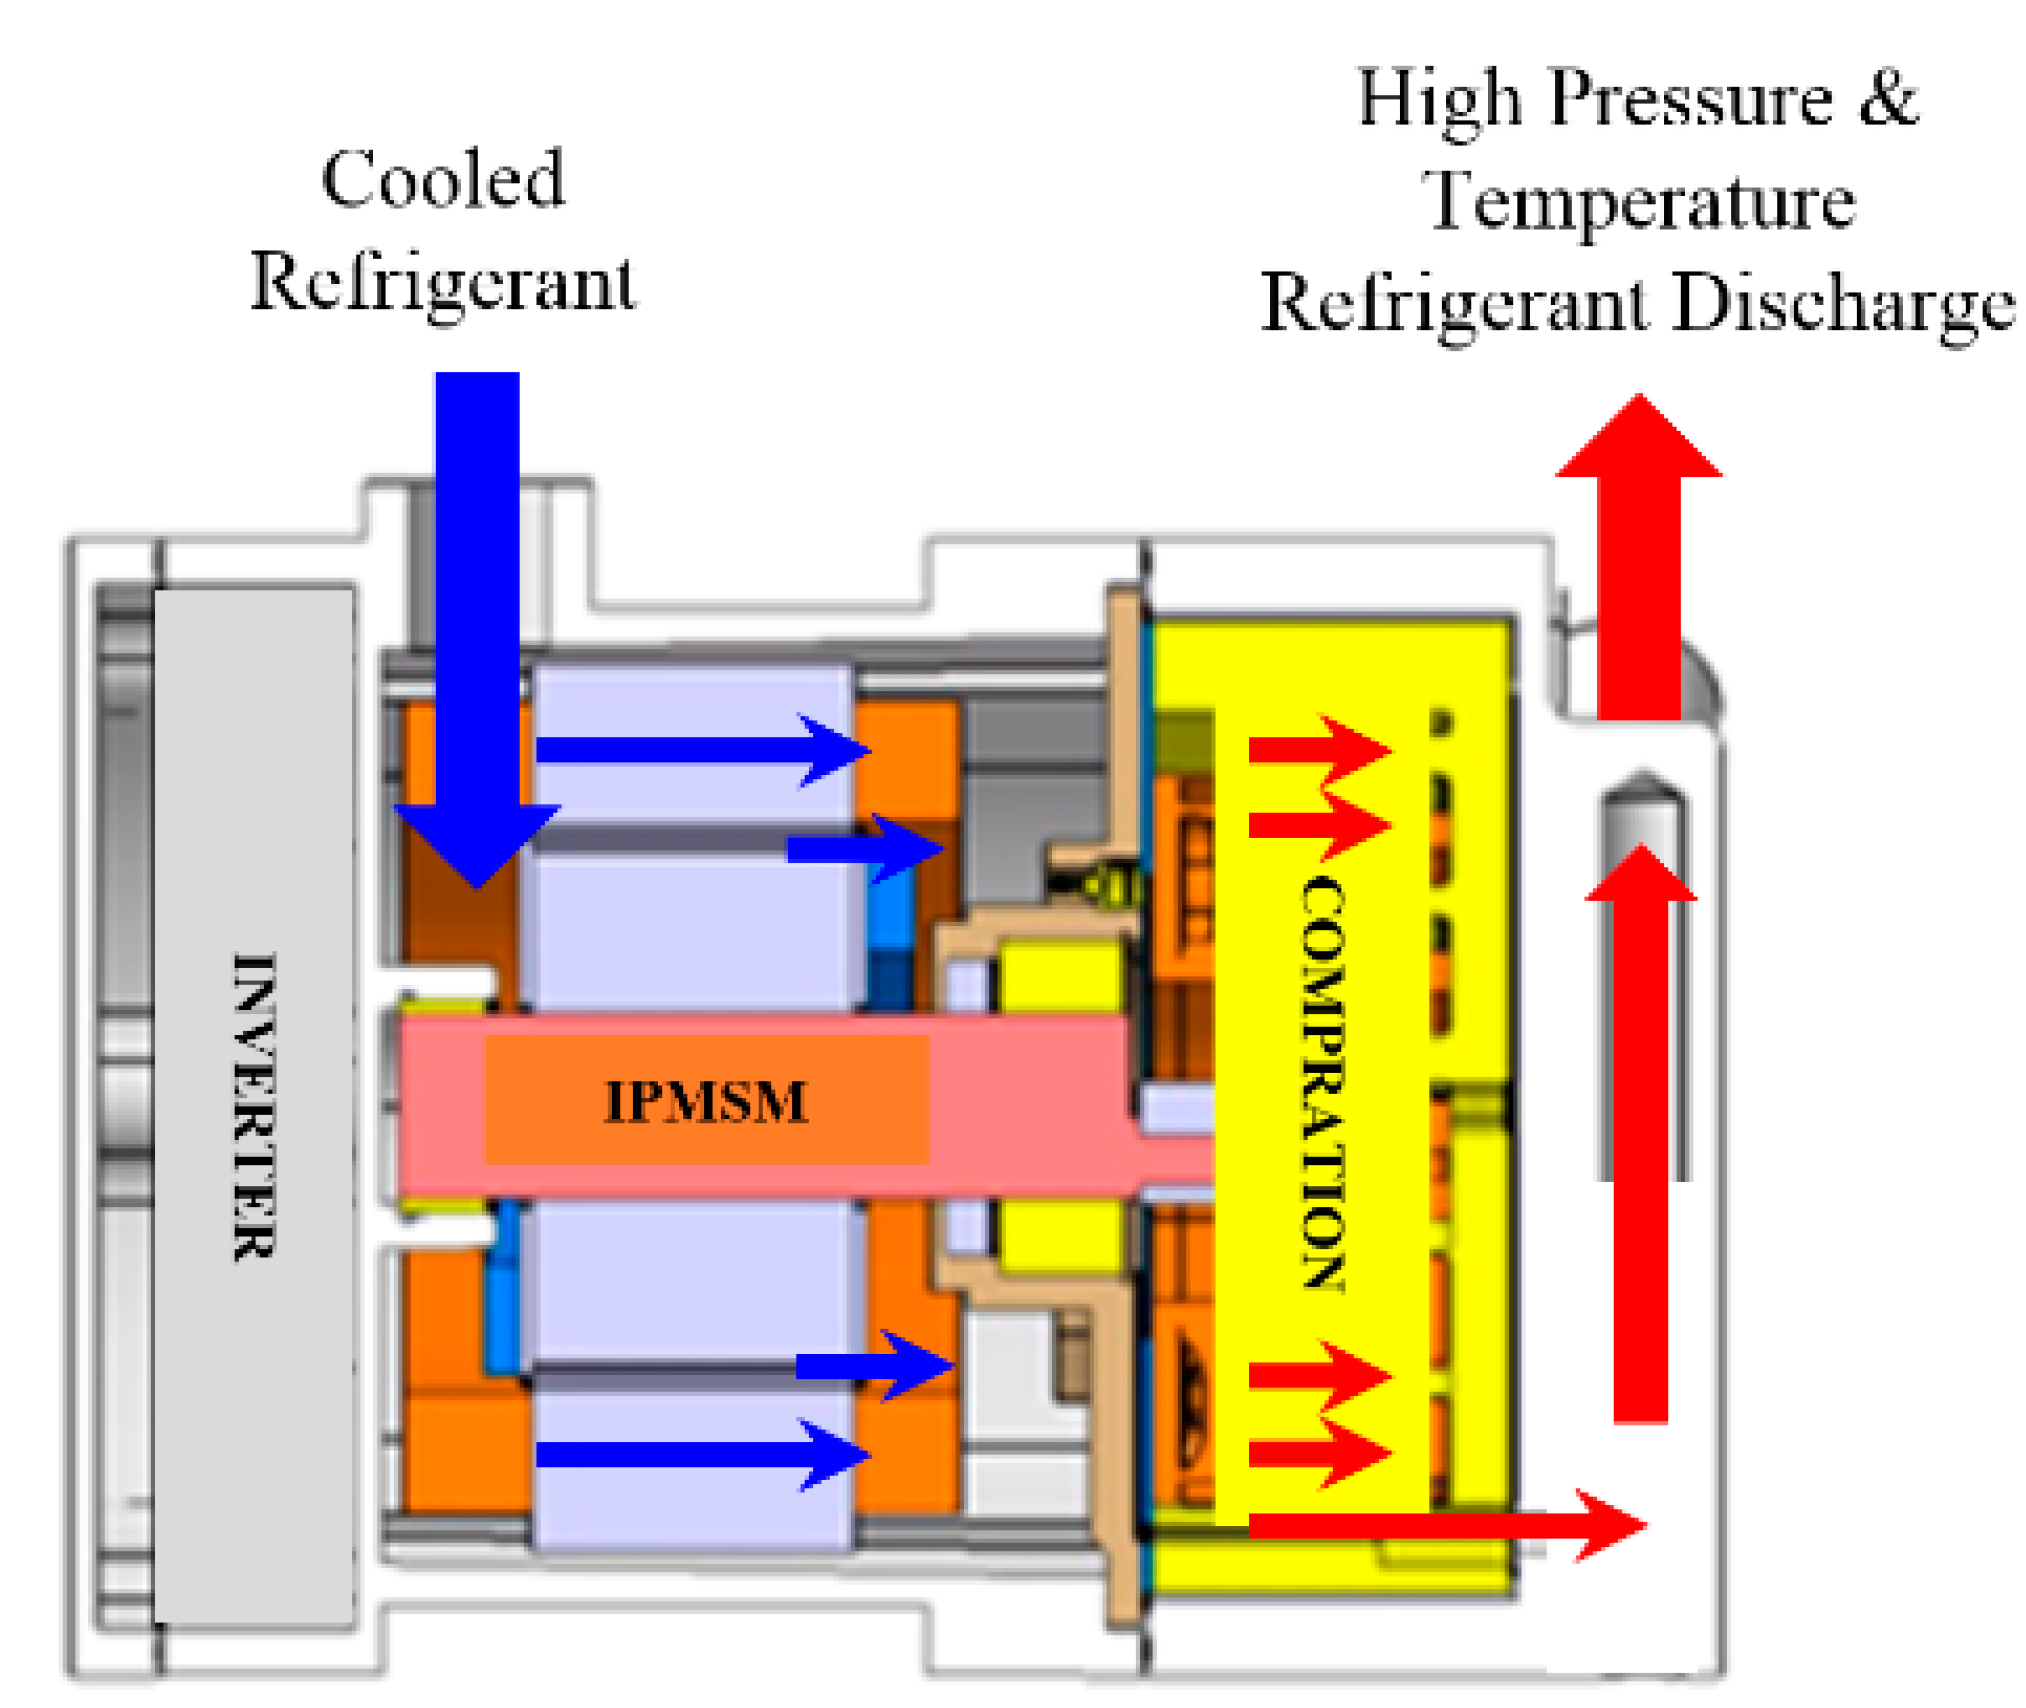
Figure 1, the IPMSM for driving an electric refrigerant compressor can perform cooling through the cold refrigerant directly through the motor; however, it is a typical high saturation magnetic flux density electric machine. This is because the inner permanent magnet rotor structure is applied to ensure high reliability, and a concentrated winding stator with low flow resistance and low power loss is used to achieve high volumetric efficiency in the compression part. Therefore, the proposed three iron loss analysis methods and three different rotor structures were compared with each other to compare the new iron loss analysis characteristics, and the rotor type with the lowest loss in the same concentrated winding stator structure can be determined.
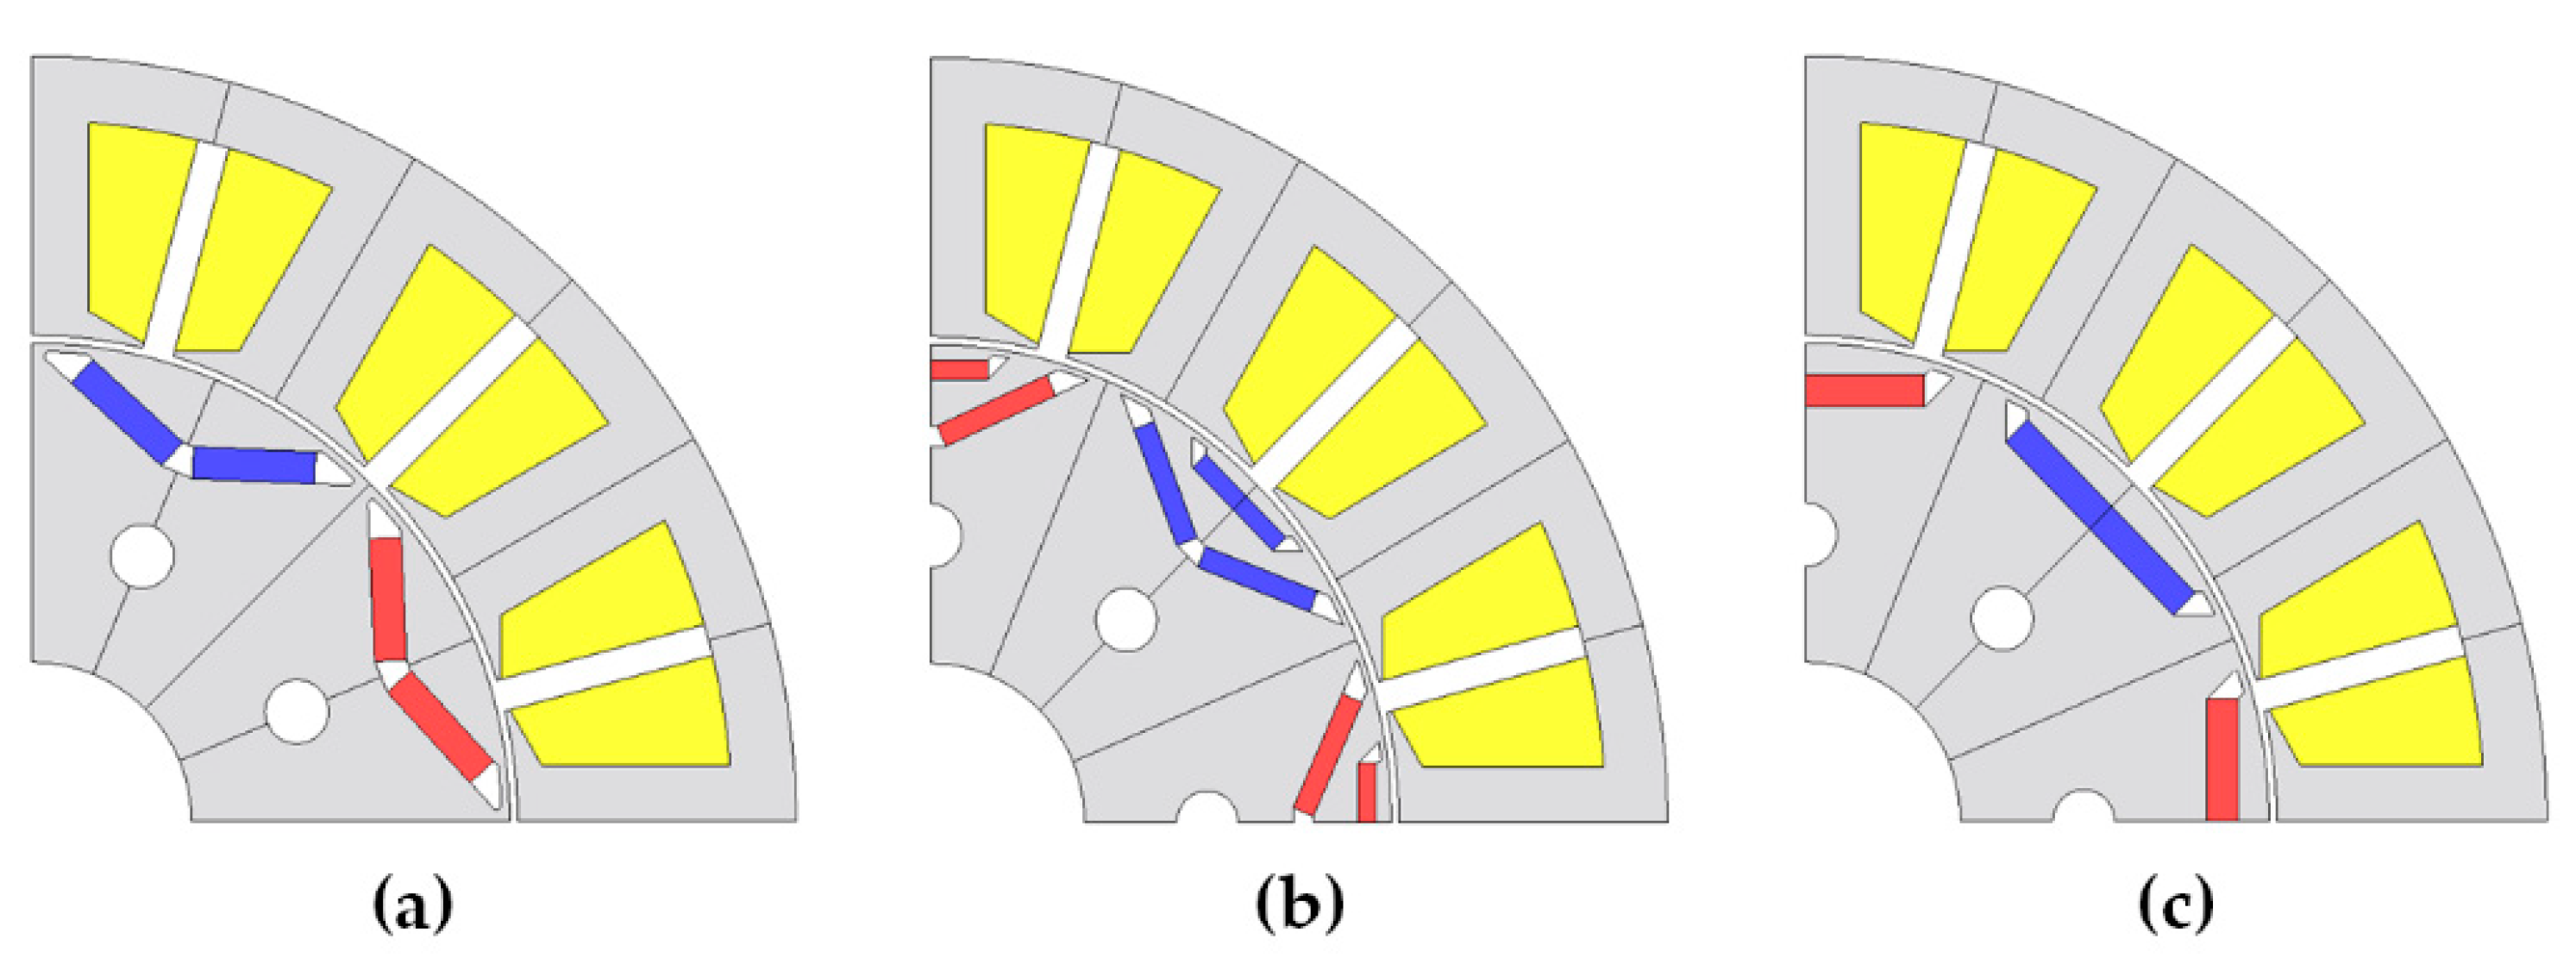
The detailed specifications of the concentrated winding-type IPMSMs for driving the A/C refrigerant compressor are as follows: number of slots in the stator, 12 slots; magnetic wire specification, 28 turns; stator core shape outside diameter, 96 mm; length, 37 mm. The three magnet shapes for comparison were single-V, single-flat (F), and dual-delta (D) magnets. The magnet area for every pole (30.73 mm
2) was identical. The main operation points were 6540, 4905, 3270, and 1635 rpm with a 24 A phase current, and the expected torque was approximately 7.0.
Figure 2 presents the structure of the concentrated windings of the IPMSMs with three types of rotor structures.
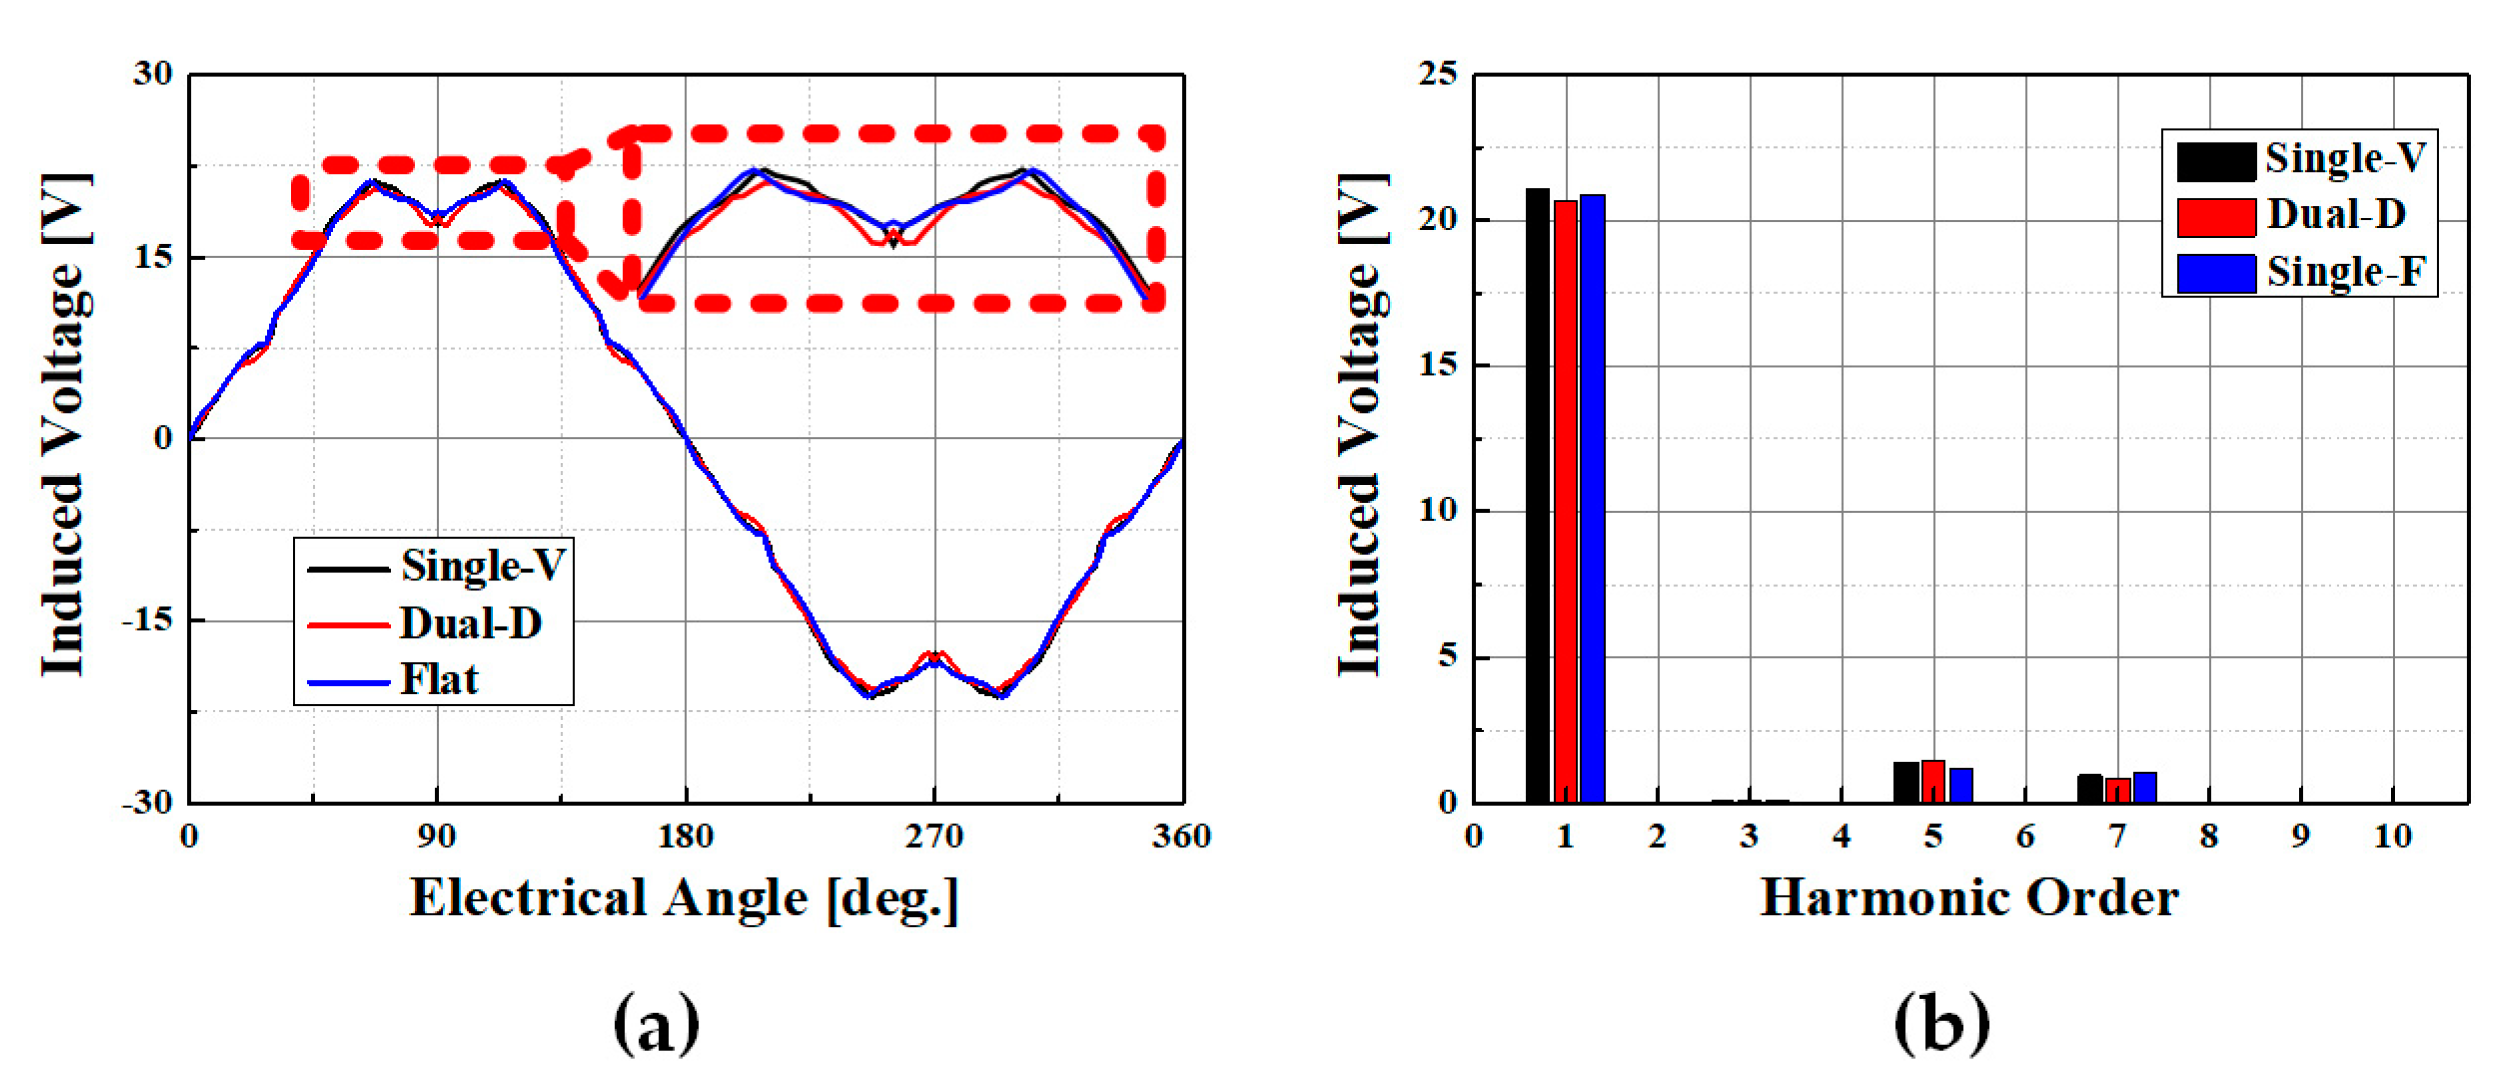
Figure 3a illustrates a comparison of the induced voltages of the three different rotor shapes with identical concentrated winding stators without an input current at 1000 rpm.
Figure 3b shows a fast Fourier transform (FFT) comparison of the frequency domain. The differential of the back electro-motive forces of the three magnet rotor shapes was lower than 0.25%. This is similar to the FFT results.
2. Iron Loss Calculation
2.1. First Iron Method
The CSE is a traditional method for calculating iron loss (1). However, it is constrained to account for all losses in a real laminated magnetic core. The modified Steinmetz equation (MSE) was modified based on the Bertotti model to reconcile this observed discrepancy. The MSE is still a typical and extensively used method for calculating iron loss; however, it requires additional fitting methods. The MSE is expressed as shown in Equation (2) [
2,
3]:
The MSE is a function of flux density and frequency. It is configured with static hysteresis losses Phys, dynamic eddy current losses Peddy, and excess losses Pexs, with their corresponding coefficients ahys, beddy and cexs, respectively. Moreover, f is the frequency, and is the maximum flux density.
In this study, the first iron loss method was based on electromagnetic FEM tools that use the specimen’s iron loss input data. This approach is based on sinusoidal flux conditions using the frequency separation method, and the CSE is fundamental. In other words, iron loss can be classified into two losses:
and
. This former iron loss method is easy, fast, and simple to calculate based on the FFT. However, it can be used to calculate the overall loss for all flux harmonics. The sum of the total iron losses is calculated as the sum of
and
, as shown in Equations (3) and (4) [
8]:
where
and
are the frequency and amplitude of the magnetic flux density of
k orders, respectively;
is the number of elements;
is the element volume;
and
are the coefficients of
and
, respectively.
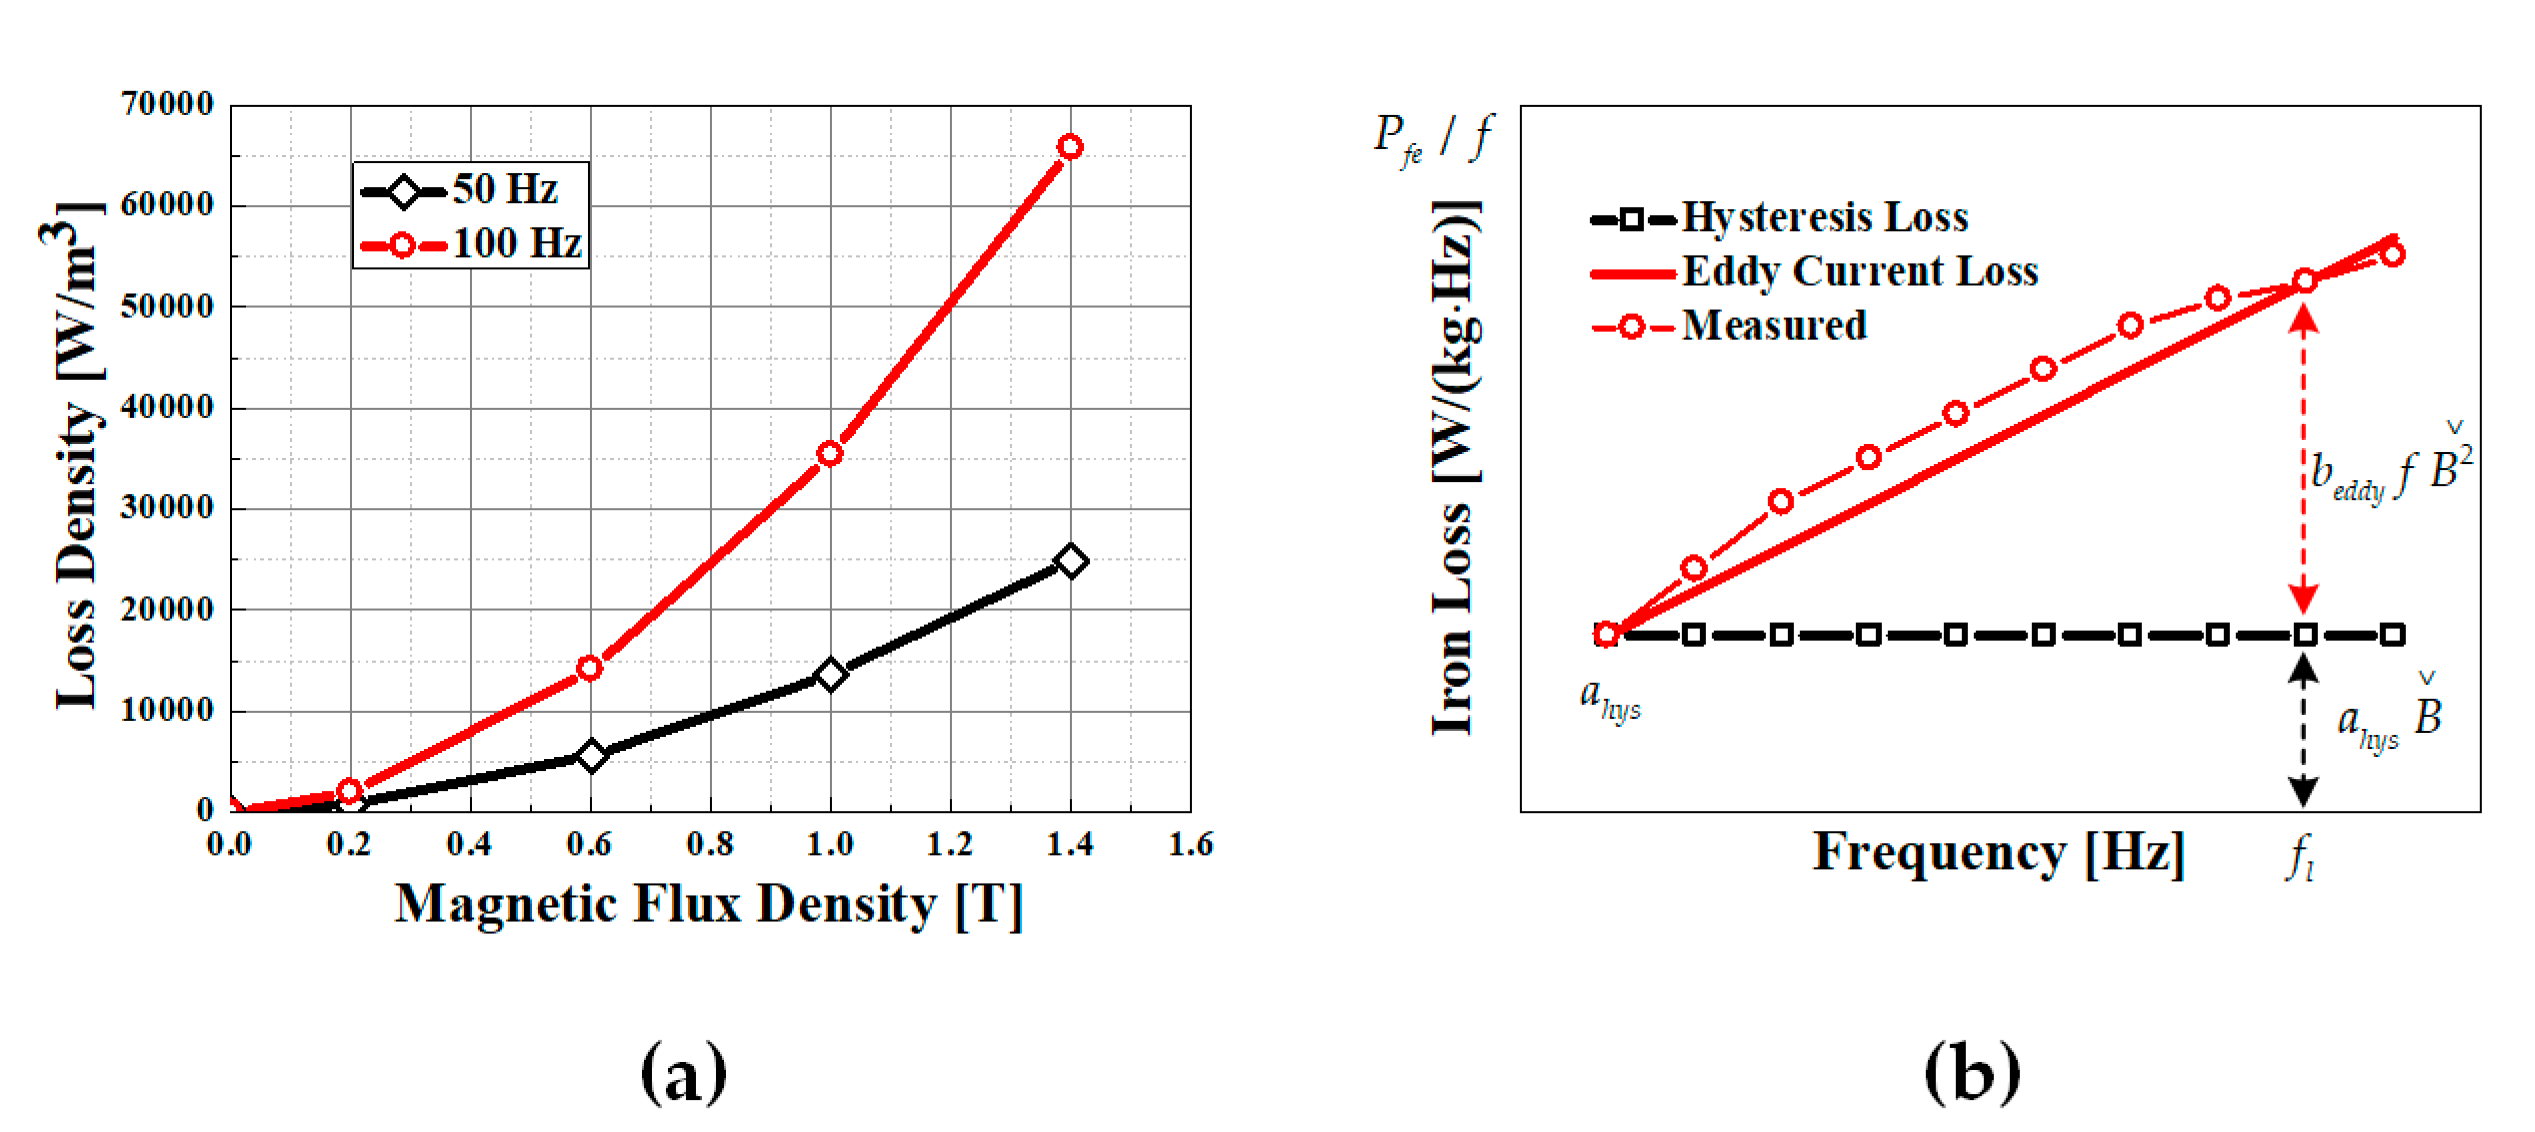
Figure 4a shows the measured iron loss data at two point-frequencies, which were used for other frequency loss estimations.
Figure 4b shows the frequency-separation method. In this graph,
can be simplified and interpolated, as shown in Equation (5):
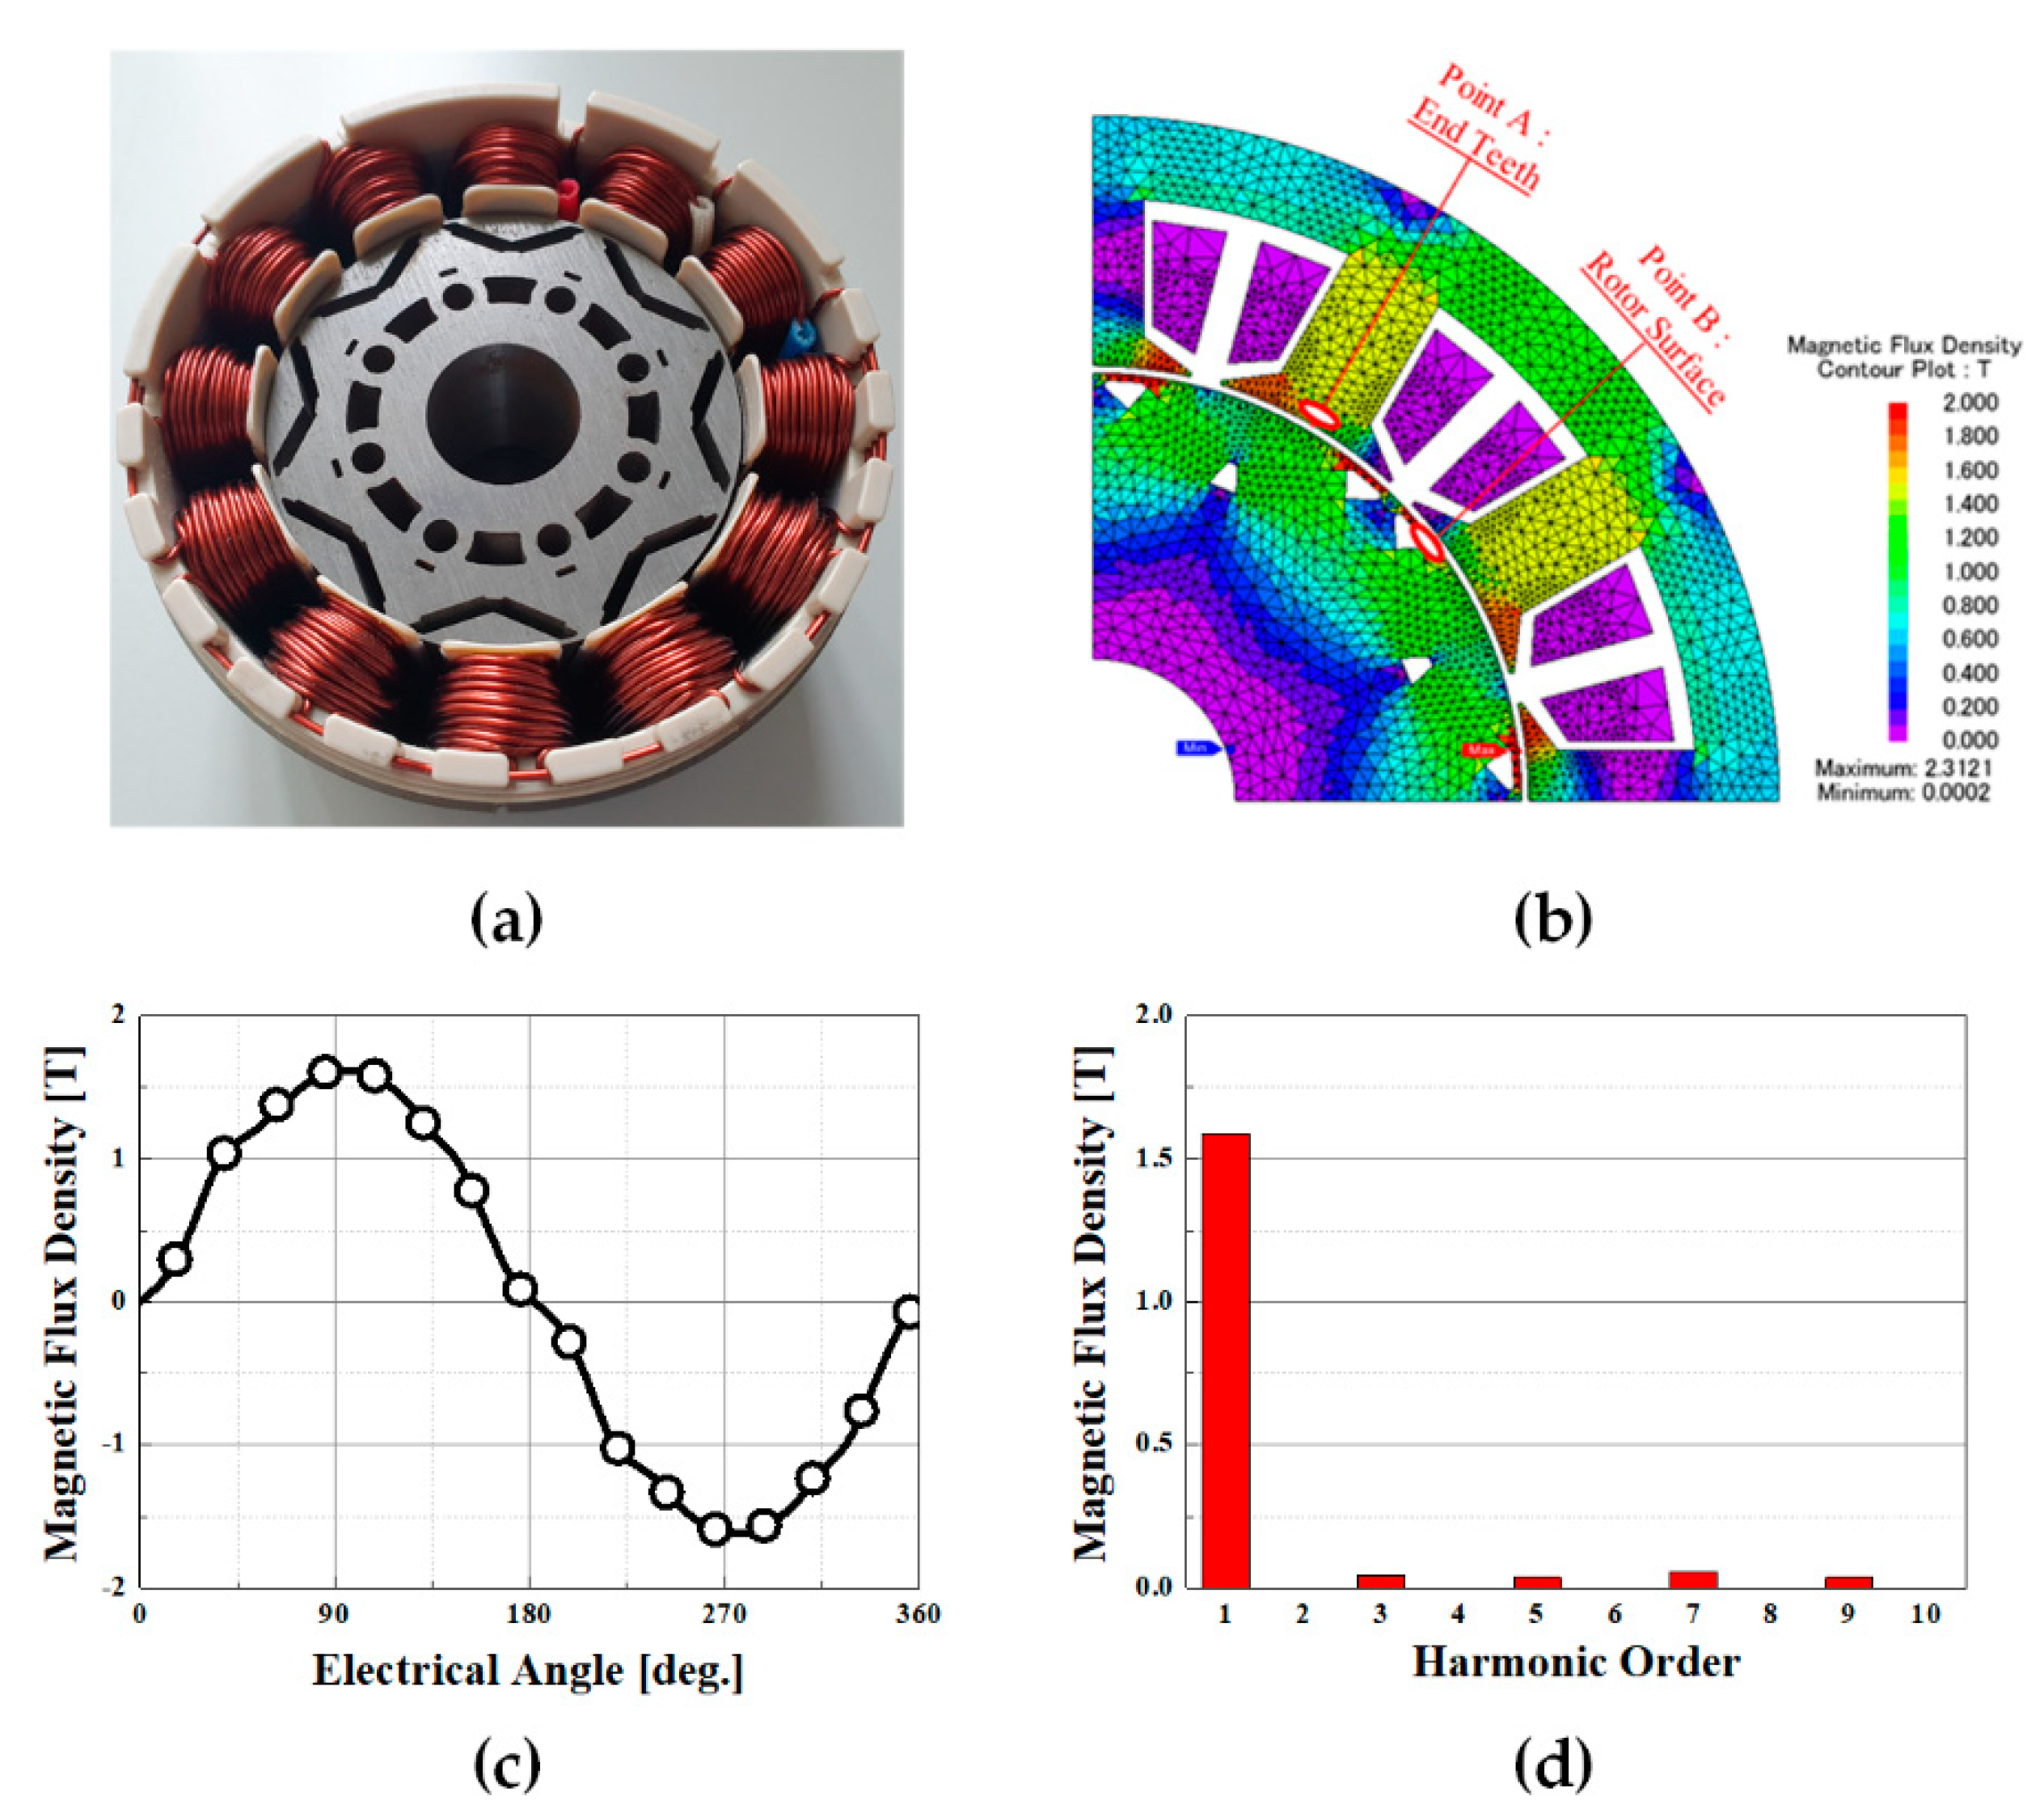
Figure 5a,b show a photograph of a prototype sample and the magnetic flux density distribution in a 2D plane.
Figure 5c,d show the magnetic flux density of point A in the time frame and FFT analysis.
2.2. Second Iron Loss Method
The first method, i.e., the FFT frequency separation method, is simple; however, the minor loop effect caused by harmonics is not considered. Hence, by considering the dynamic hysteresis model, the minor loop effect and excess losses can be considered [
5,
6,
7]. Therefore, the second iron loss calculation method is used to calculate the additional
separately, as shown in Equation (6) [
8]:
where
is the number of loops,
the
-th loop for each component of the magnetic flux density, and
the coefficient of the magnetic flux density.
2.3. Third Iron Loss Method
Calculations for
in the first and second methods were used in the estimation method based on limited high-frequency experimental measurements, even when discrepancy was observed. This is due to the skin effect (
) of the magnetic steel sheet surfaces. Equation (7) expresses the eddy current loss considering the skin effect [
9]:
Here,
(z-plane) is the material thickness,
(x-plane) the width,
(y-plane) the length, and
a constant;
contains
frequencies with amplitudes
and
of the average induction. The skin effect comprises
factors, which are functions of the ratio
of
and
(skin depths depend on frequency). The skin effect can be summarized as follows and is represented as shown in Equations (8) and (9) [
9]:
Summary of skin effect:
- (1)
The skin effect increases with frequency.
- (2)
The decrease in permeability owing to saturation increases the skin depth and increases the eddy current loss.
- (3)
The flux saturation induces harmonic eddy currents.
- (4)
A greater rotation magnetic flux results in a higher saturation and smaller harmonics for the magnetic field and eddy current.
In the third iron loss calculation, is calculated using the eddy current distribution via the homogeneous method considering the skin effect. In addition, is calculated using the area of all loops calculated using the play model, which considers the minor loop DC bias. In the hysteresis loss of the second iron loss, a minor loop can be considered, but the loop size based on the DC bias cannot be considered.
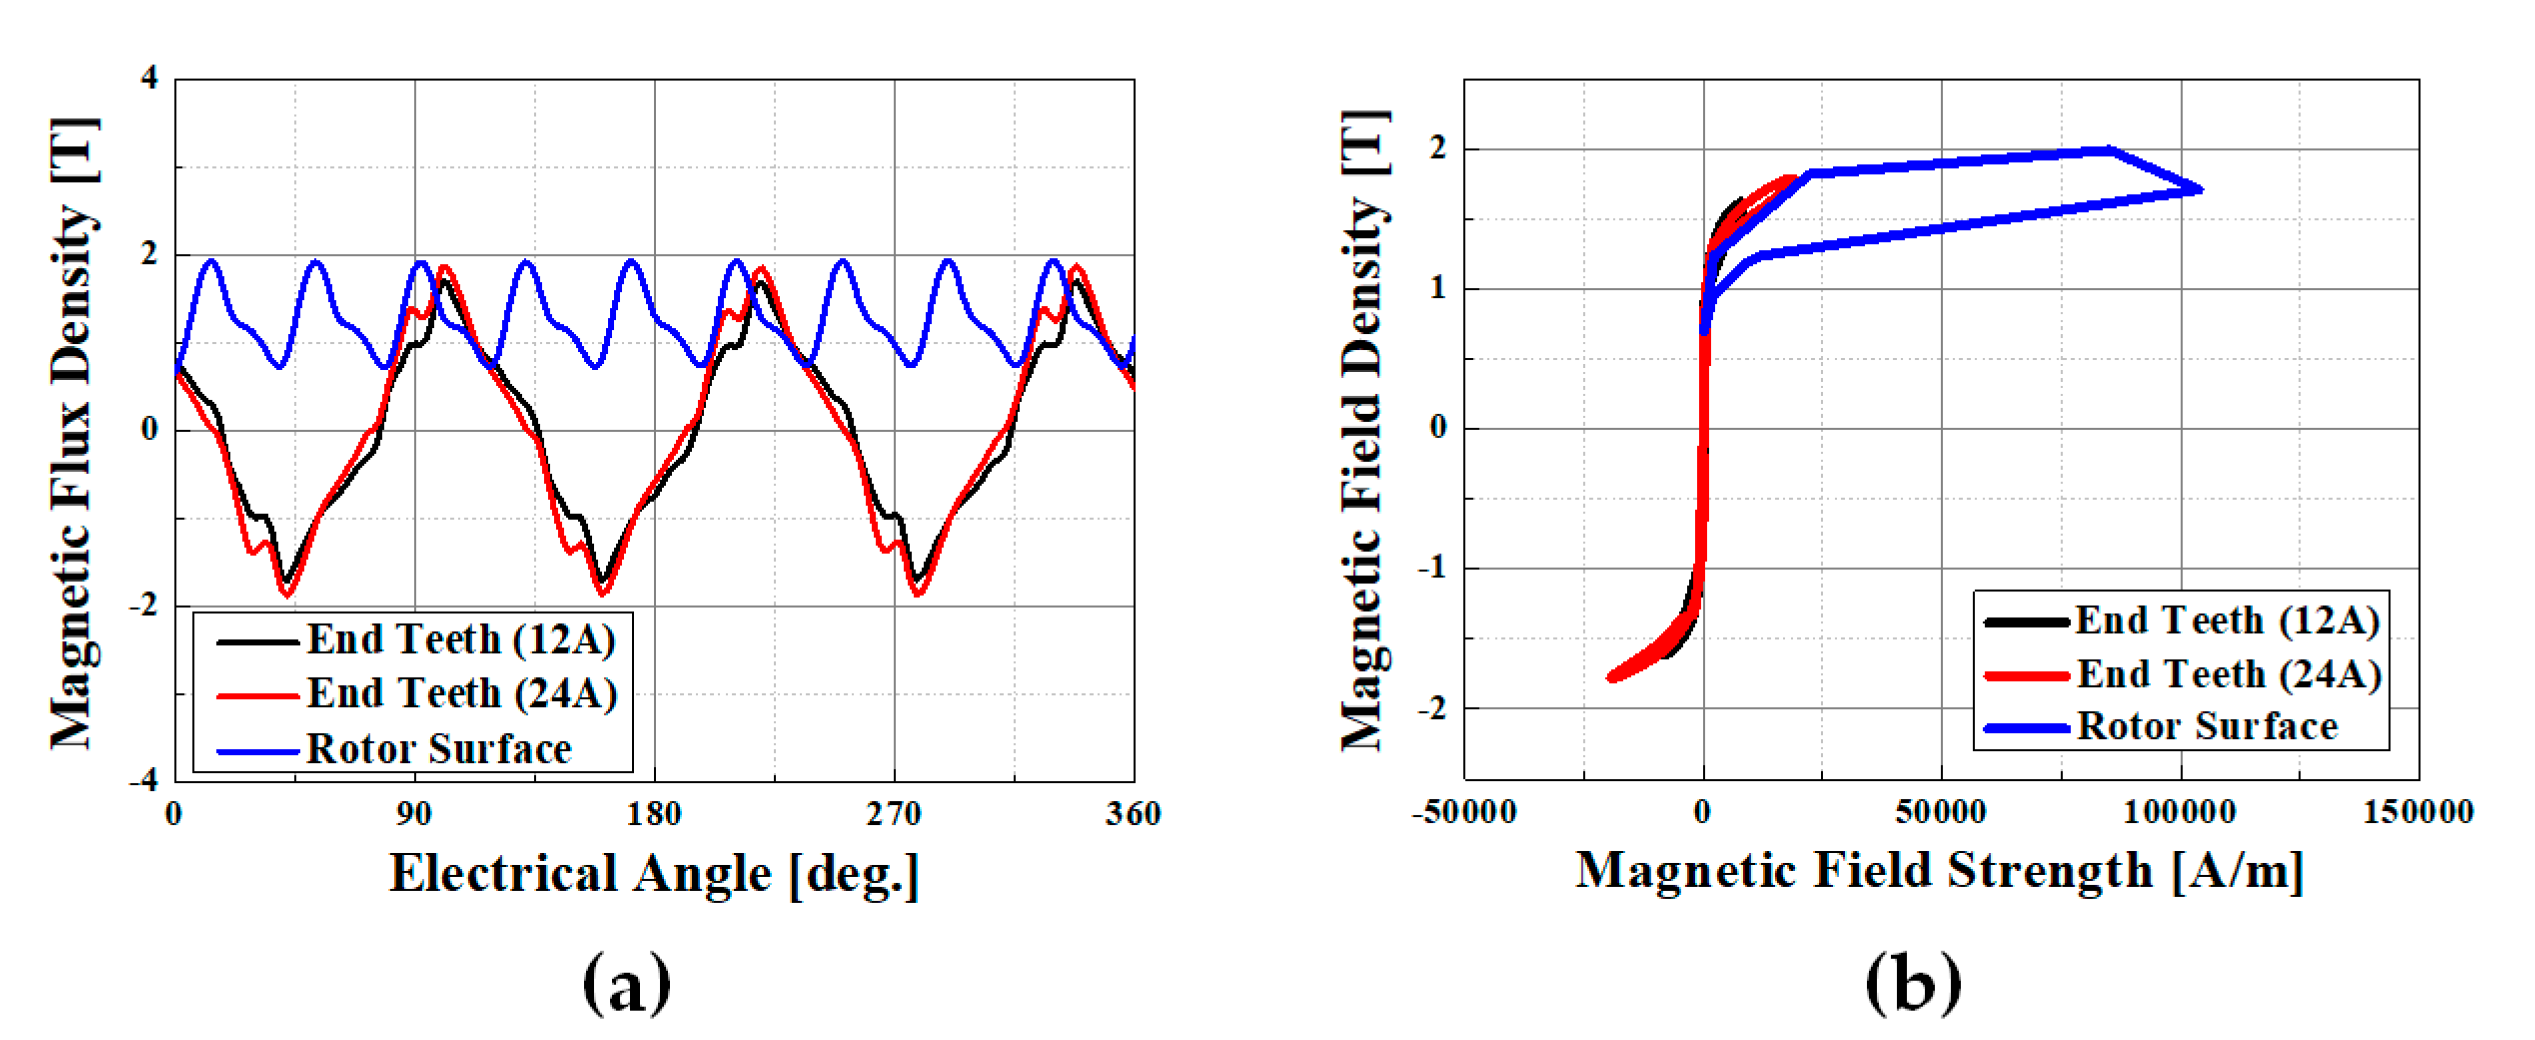
Figure 6a shows the flux density at different (12 A and 24 A) input currents of the stator end-teeth and the rotor surface in the time frame.
Figure 6b shows the B–H loop at that time. Although the alternating flux density on the surface of the rotor was smaller than that of the stators, the B–H loop was much larger than the stator. This DC bias and large loops are characteristic of the IPMSM rotor structure; hence, they should be considered [
10,
11].
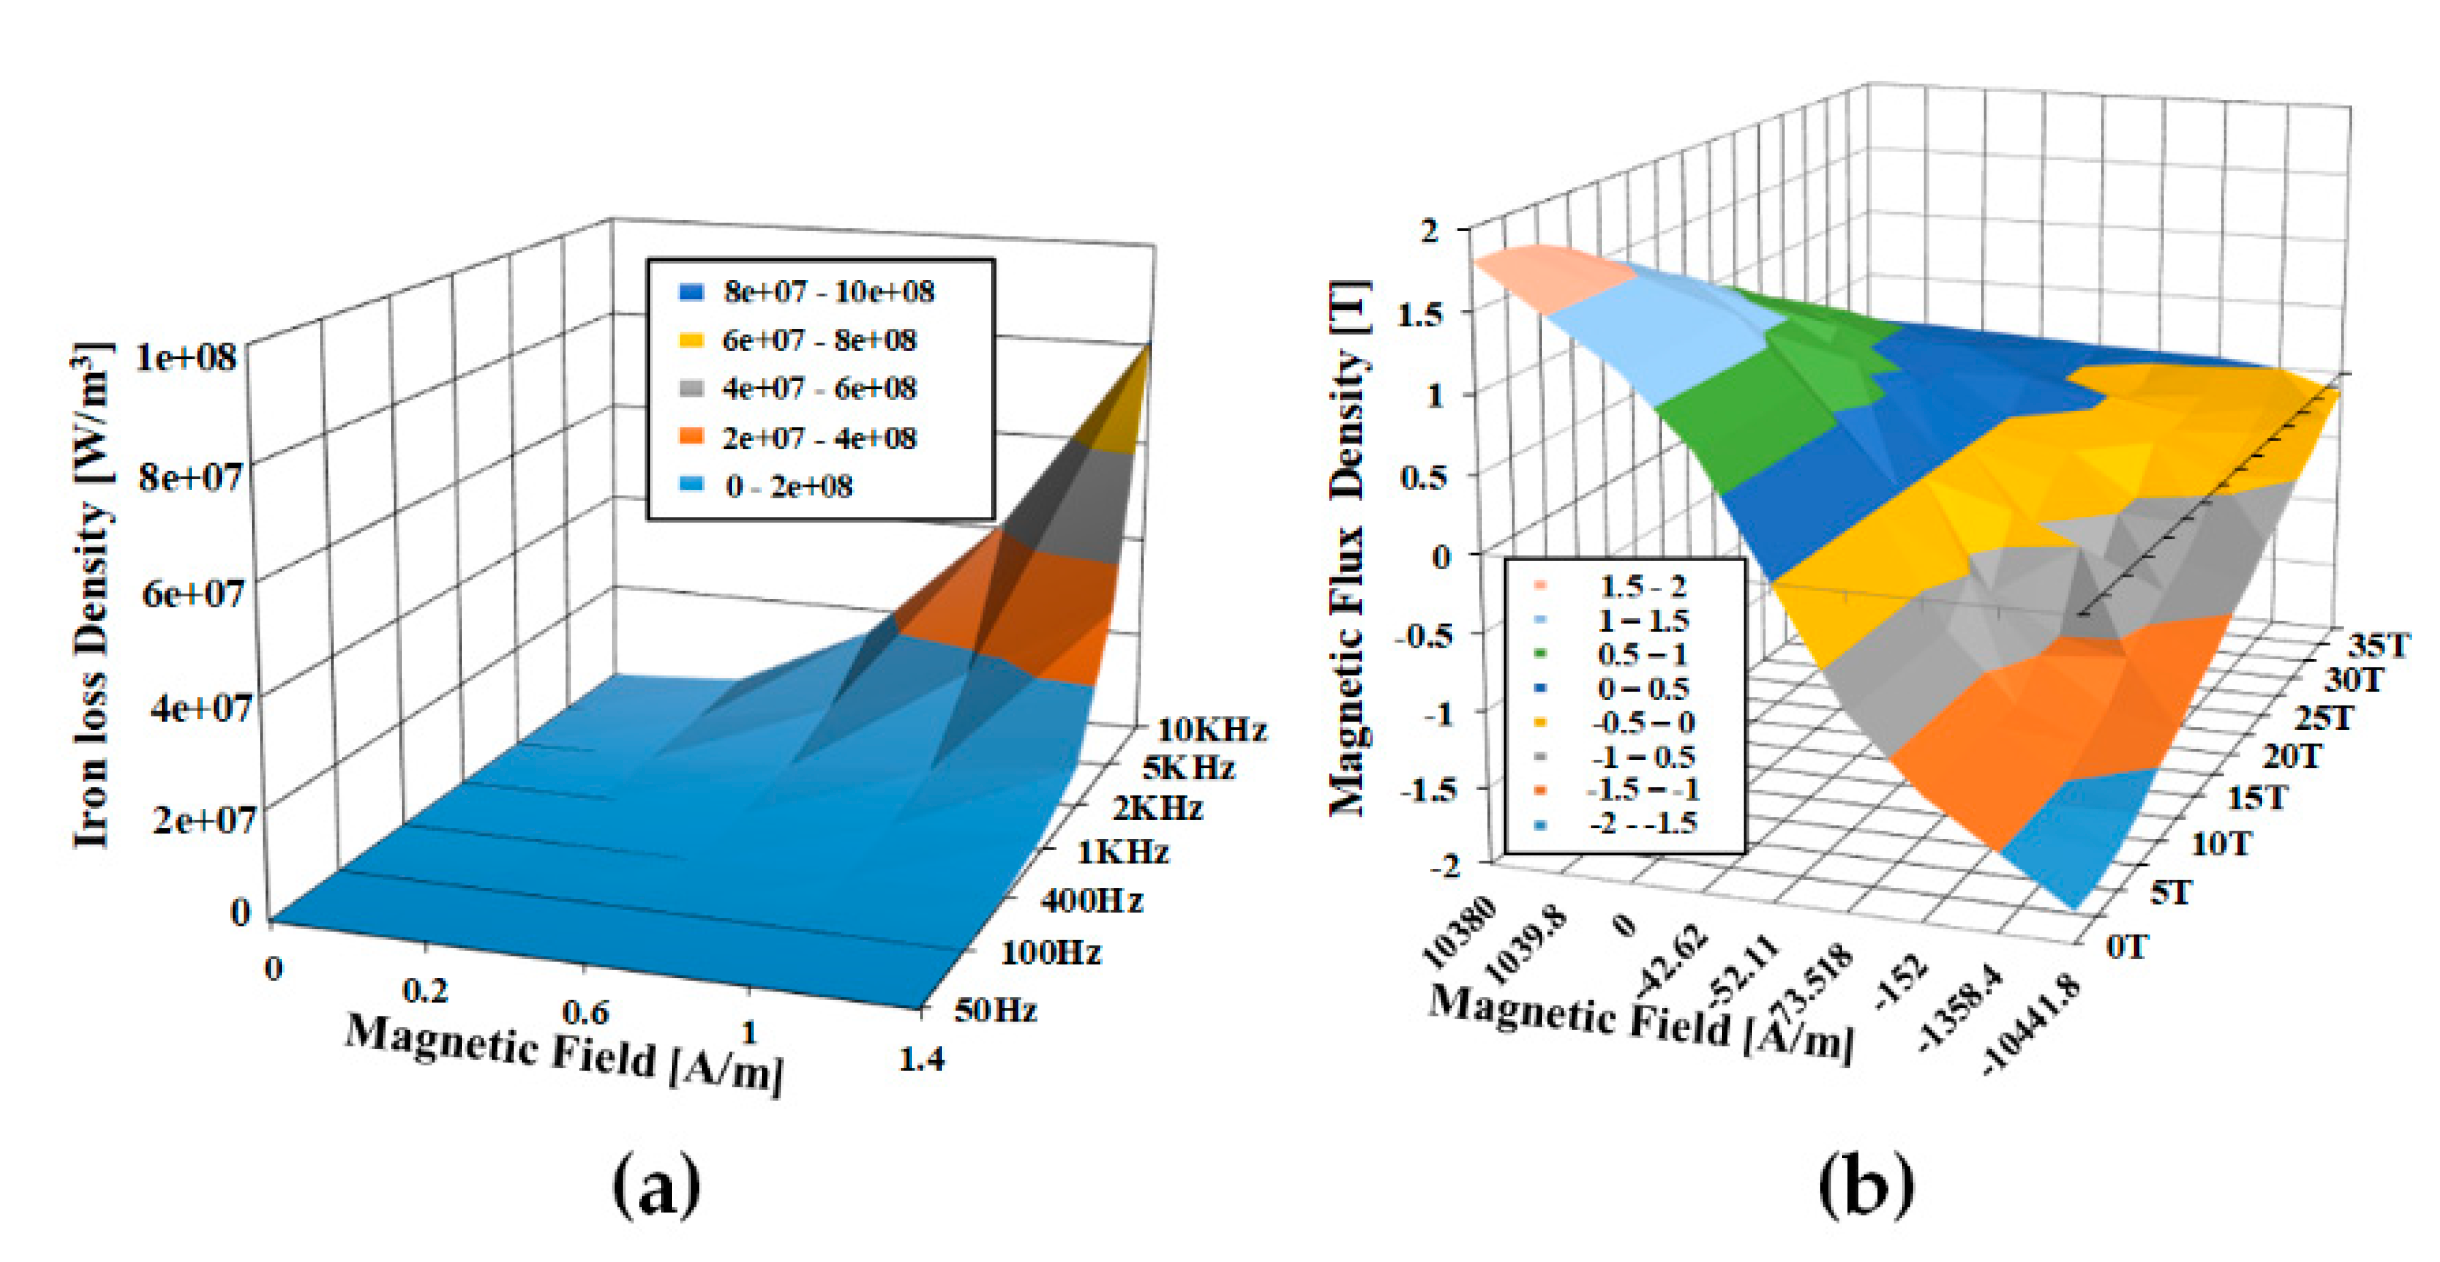
Figure 7a shows the conventional estimation of iron losses. In the estimation, the external input value is assumed to be proportional to the input frequency square. This is the most typically used data-estimation method.
Figure 7b shows the calculated value of the eddy current loss when an AC magnetic field with an amplitude of 0.04T is applied to a 50A470 single plate. The value obtained is not proportional to the squared frequency.
3. Comparison of Study Result
3.1. Comparison of Iron Losses
Figure 8a and
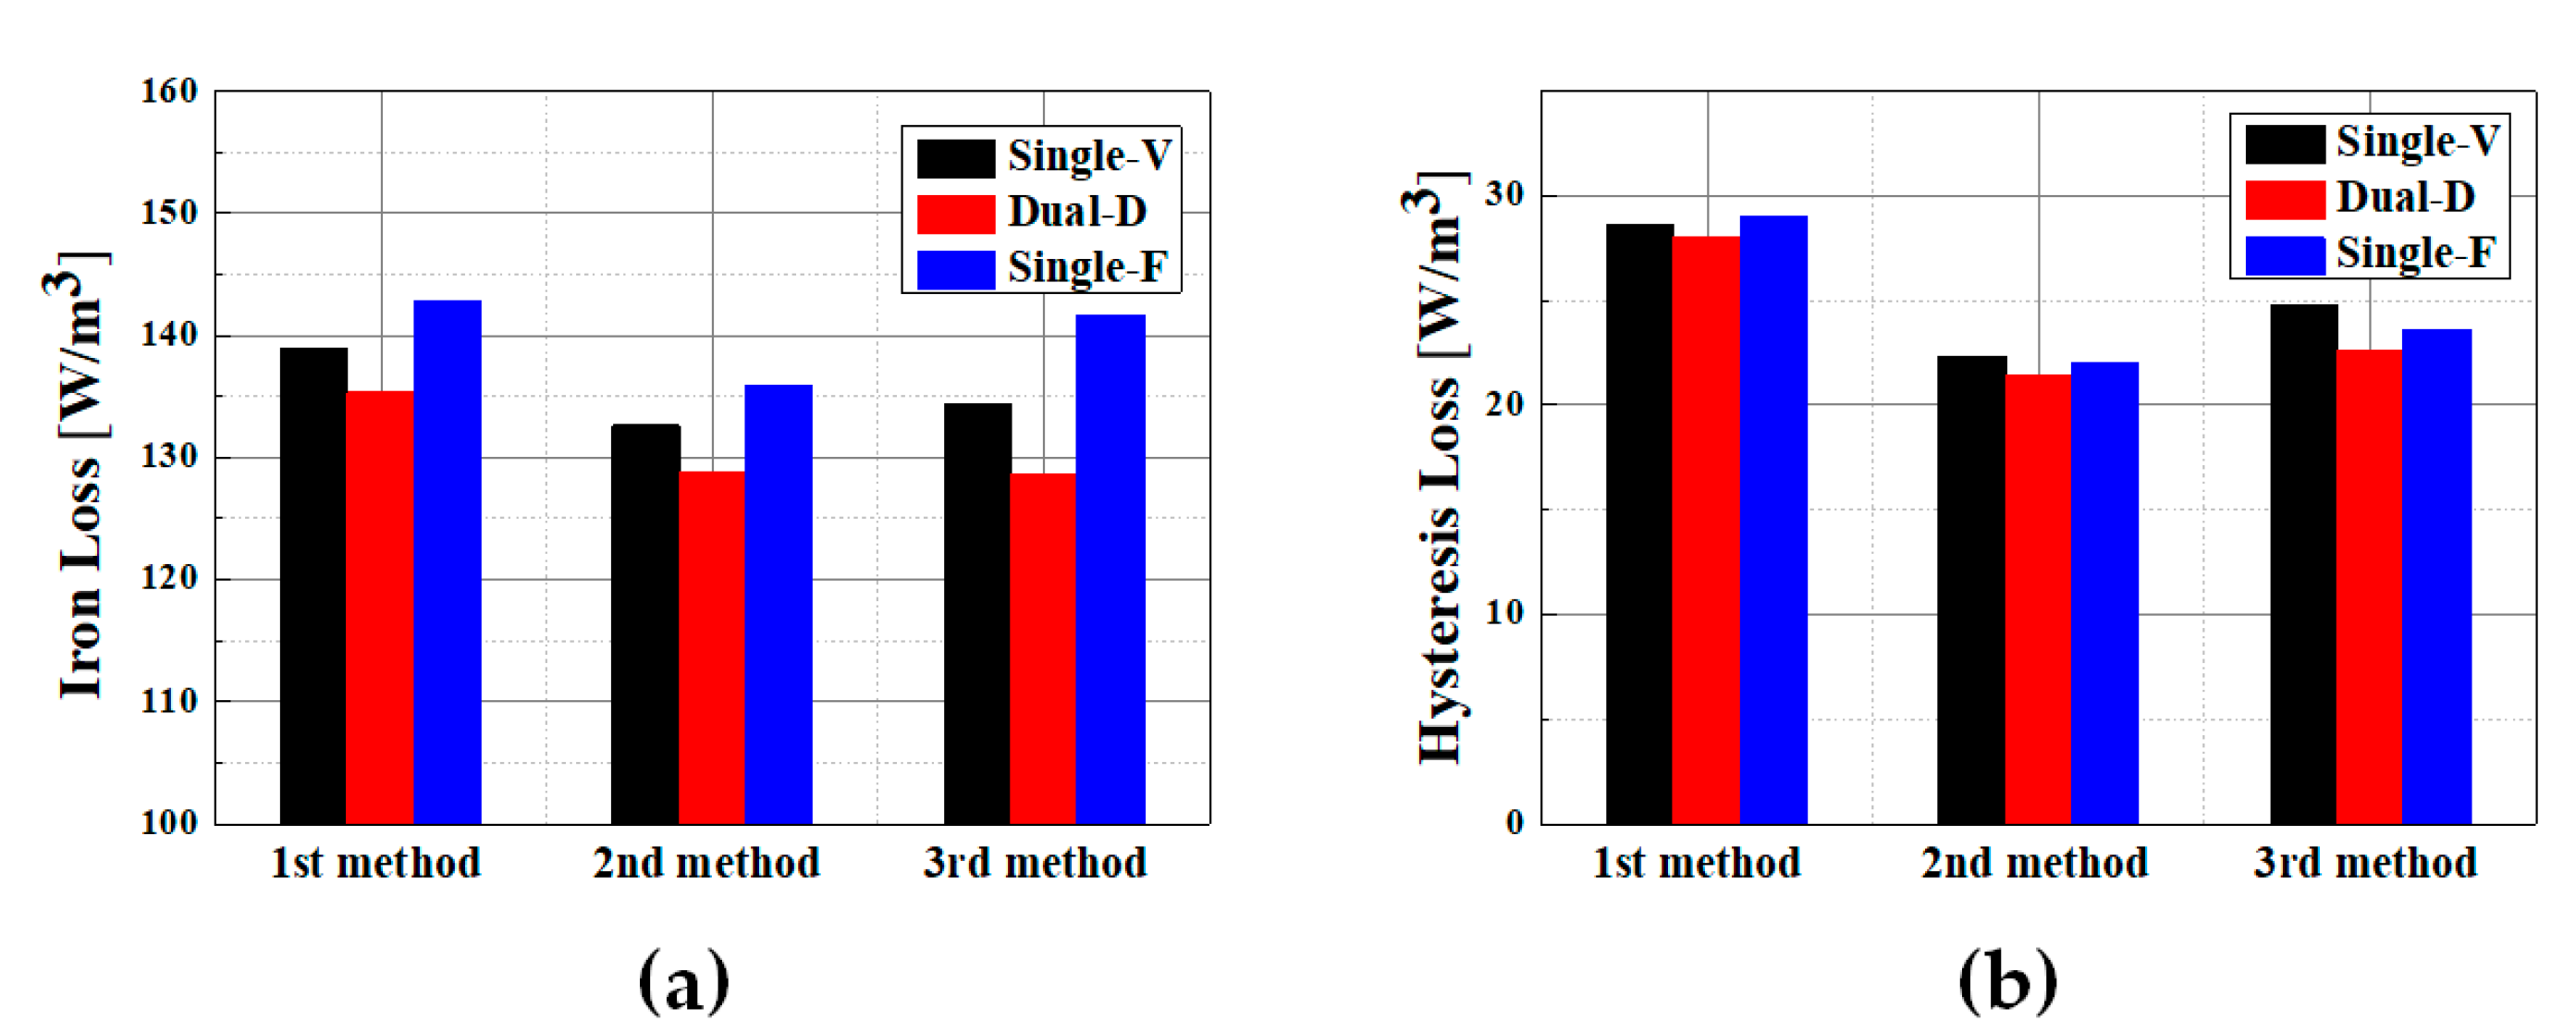
Table 1 shows a comparison of the three (single-V, single-F, and du-al-D) magnet rotor structures based on different iron loss calculations at 6540 rpm and 24 A phase current.
Figure 8b and
Table 2 shows a comparison of the three magnet rotor structures based on different hysteresis loss calculations under the same conditions. In the same stator structure, the iron losses of single-F increased from 5.3 to 9.2% depending on the calculation method compared with dual-D. The single-V losses increased from 2.6 to 4.3% depending on the calculation method compared with dual-D. This comparison shows that the dual-D iron loss may be improved or similar to the other rotor structures in terms of electromagnetic torque generation. However, owing to the coercive force difference between the rotor structure and the magnet, an absolute comparison is not possible. Therefore, a comparison of the procedures prior to the saturation of the operating voltage and overall range is necessary for a trend comparison.
Table 3 shows a comparison of the IPMSM efficiency of three different rotor structure at 6540 rpm and 24 A phase current with three different types of iron losses. When calculating the efficiency, the loss analysis method was used; therefore, the efficiency of the first loss calculation method was lower than that of the second method. This is due to the over consideration of harmonics in the frequency analysis separation method.
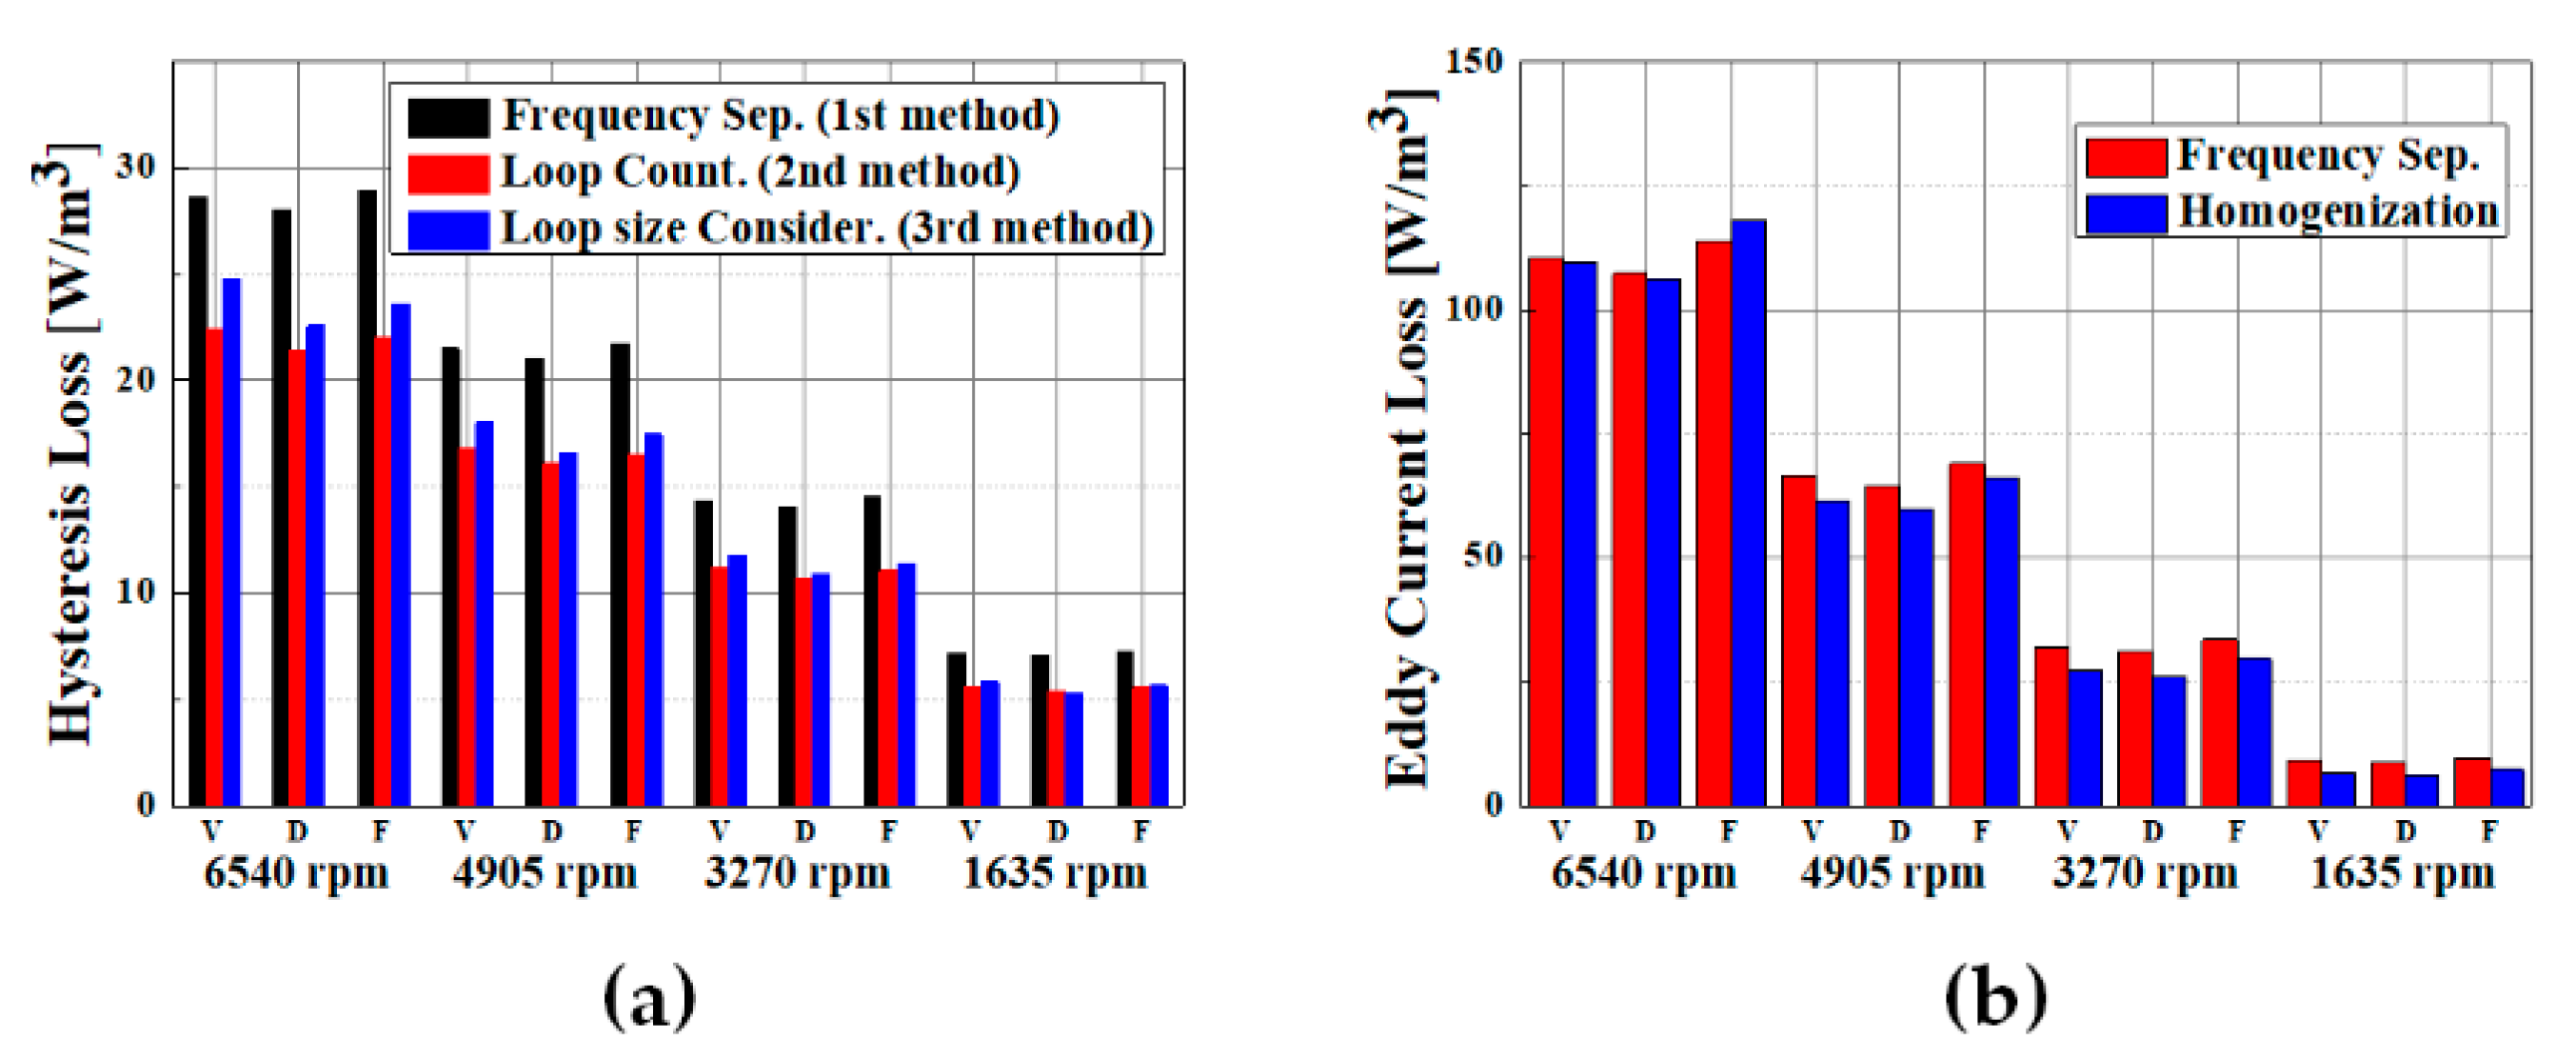
Figure 9a,b show a comparison of the total iron losses for the three hysteresis losses and two different eddy current loss calculation methods at a four-step operating speed. Each point considers the same maximum torque per ampere point at 24 A. The results reveal that the iron loss of single-F in the entire operation range is high, and the total iron loss calculated based on single-F and -V were 2.5–3.4% and 5.2–5.1% higher than that of dual-D, respectively.
3.2. Comparison of Hysteresis Losses
Figure 8b and
Table 2 show a comparison of the hysteresis losses of the different calculation methods at the rated operation point: 6540 rpm and 24 A phase input current. Detail regarding the methods used are as follows:
The first method, which is the frequency-separation method, over-calculates . This result is over-reflected as a loss, which is not only a sinusoidal , but also an FFT with harmonics. The second method, which is the minor loop counting method, can re-duce the excessive analysis based on the hysteresis loop counting method. The third calculation method shows that can be calculated by considering the DC bias and minor loop size.
Figure 9a shows the
calculation results for the four operating speeds. The results show a similar pattern to those shown in
Figure 8b and
Table 2, thereby confirming the suppression of the reflection of excessive
in the frequency-separation method.
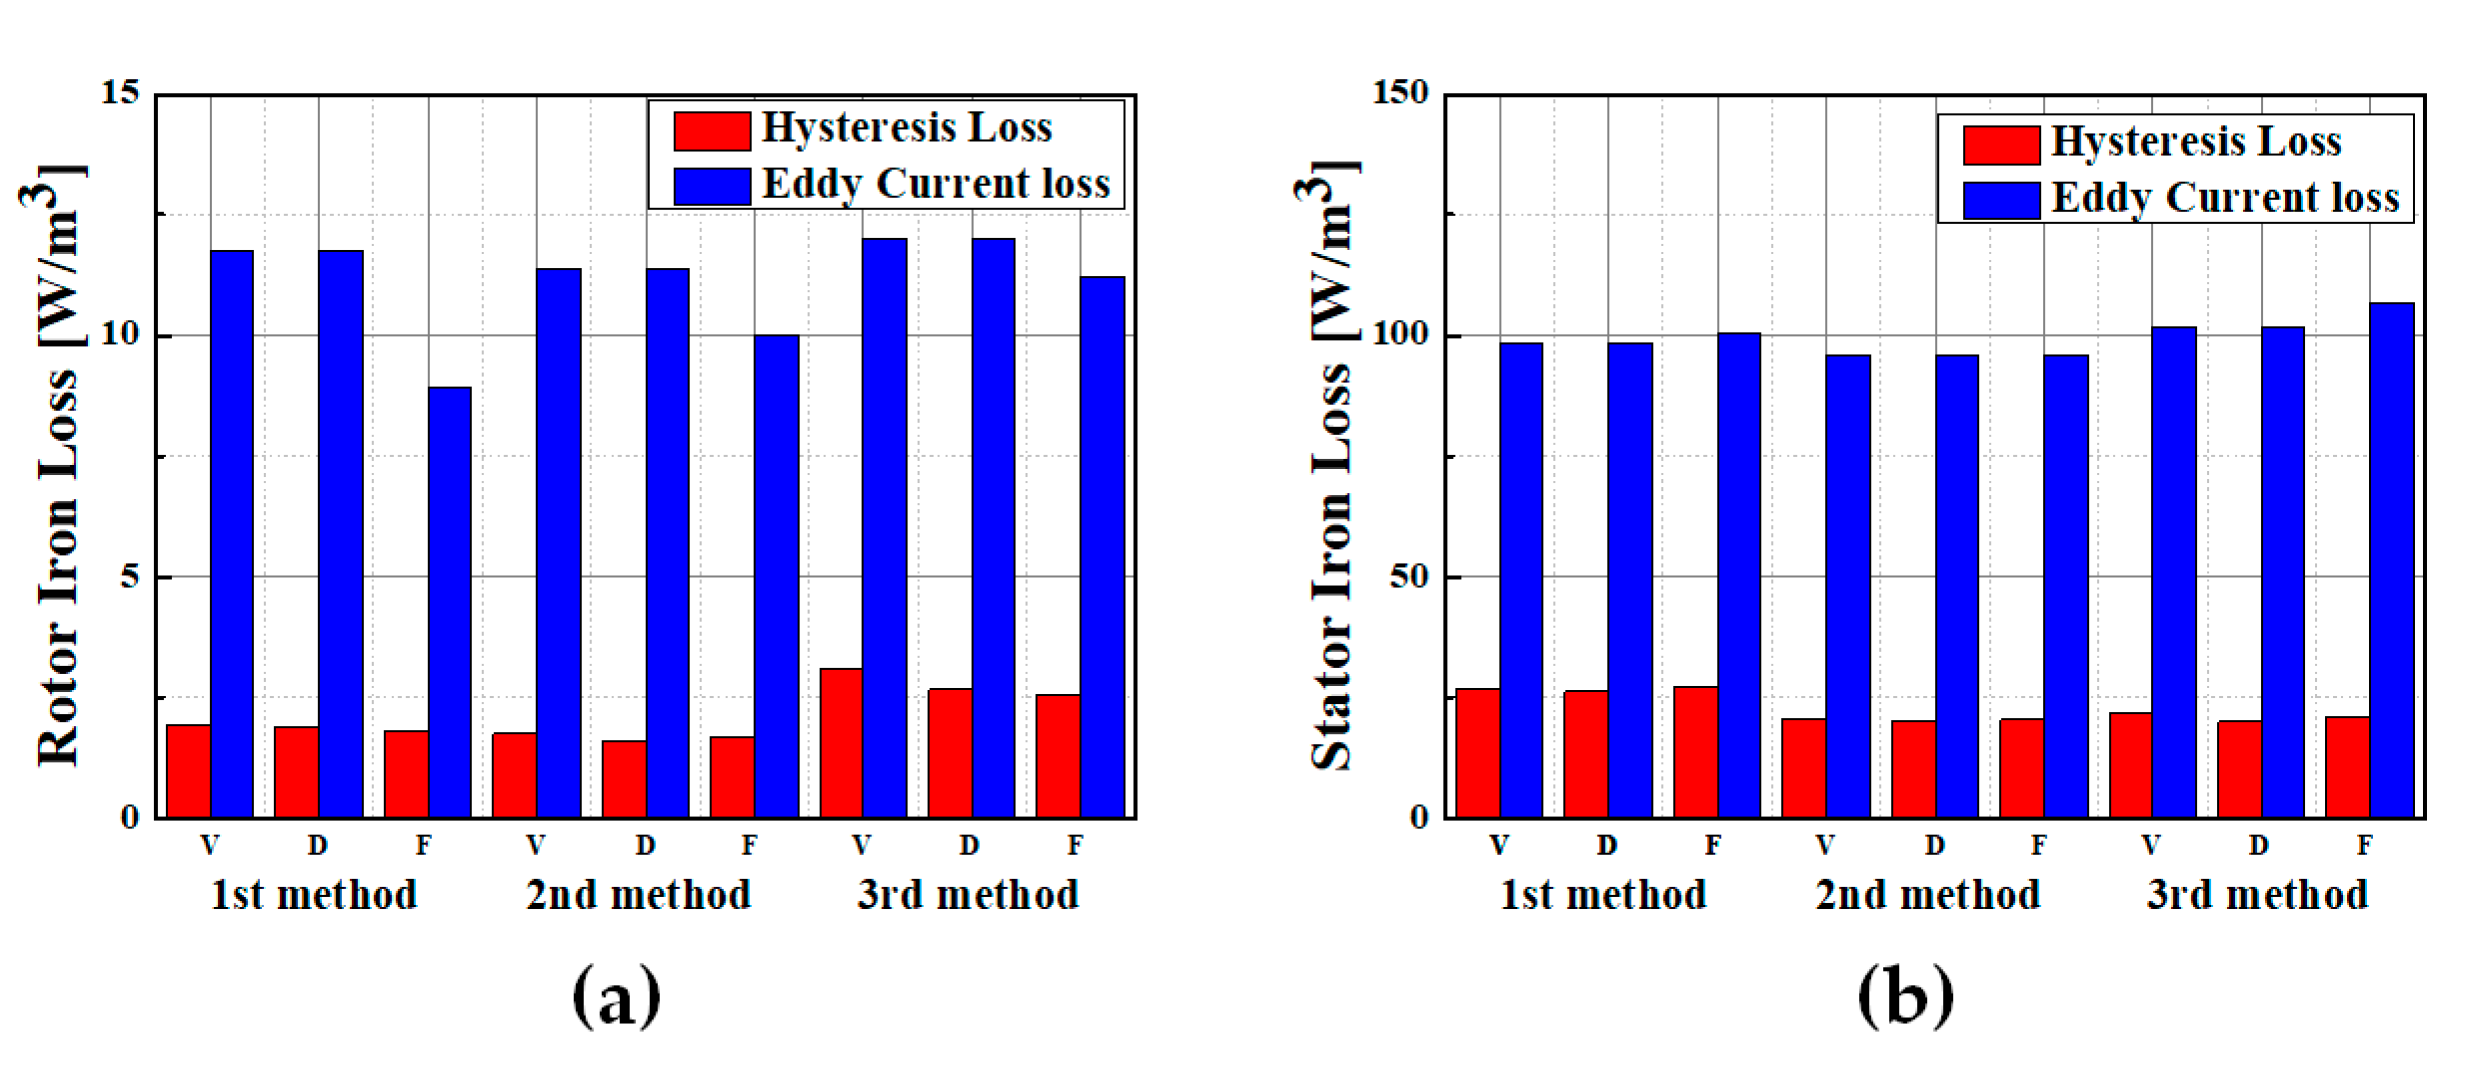
Figure 10a and
Table 4 show the significant effect of the DC bias on the loss of the third
of the rotor. Compared with the second
, an average increase of 66.3% was observed. This indicates that the effect of DC bias is a prominent feature on the IP-MSM rotor surface, as shown in
Figure 6.
Figure 10b and
Table 5 show the limited effect of the DC bias on the third
of the stator. Compared with the second
, an average increase of 2.9% was observed.
3.3. Comparison of Eddy Current Losses
Figure 9b shows a comparison of the eddy current losses at 6540 to 1635 rpm in the operating range. The loss obtained using the frequency separation method was higher than that using the homogenized eddy current loss calculation method. This is due to the iron loss data in
Figure 7a, this is proportional to the square of the input frequency and, this because data had been used the frequency separation method for eddy current loss calculation. At the same time
Figure 9b also shows the calculations result of the homogenization method. In this case, the eddy current loss data from the AC magnetic field in-put conditions in
Figure 7b is used.
4. Conclusions
In this study, two types of comparisons were performed. One was a comparison based on the iron loss analysis method, and the other was a comparison of the iron loss based on the structure of the rotor magnet shape (single-V, single-F, and dual-D).
Table 6 shows the three methods of iron loss and the data used. The first method was simple and fast; however, in resulted in an over-loss calculation. The second method improved the over-loss problem but did not consider the DC bias of the hysteresis minor loop. Therefore, it may be insufficient for calculating the interior permanent-magnet-type concentrated winding motor loss. Finally, the third method indicated that the DC bias of the hysteresis can be considered, and that the over-loss of the eddy current can be improved by considering the skin effect.
The iron losses based on the rotor magnet shape were compared. The same magnet volume was used in the rotors based on the same concentrated winding-type stator structure, pole-slot combination, number of windings, and wire specifications. Therefore, mechanical and copper losses were excluded from this comparison, and the induced voltages under the no-load condition were almost identical. However, the changed reluctance based on the magnet shapes in the rotor can affect the flux density saturation, not only in the iron losses of the rotor, but also in the stator. This was validated using three iron loss calculation methods, and the contribution of harmonic effects by the calculation method and conditions yielded different results. In addition, the DC bias of the hysteresis of all IPMSM rotors was confirmed. In conclusion, in the relative comparison of rotor structure geometries, the single-F magnet rotor structure indicated the greatest iron loss, whereas the dual-D magnet rotor structure indicated the lowest. This comparison of three iron loss analysis methods is beneficial to not only IPMSMs for automotive electric refrigerant compressors, but also to various electric machine iron loss analyses of high magnetic flux saturation Applications.
Author Contributions
J.-Y.C.: conceptualization and review; C.-H.B.: analysis and original draft preparation; H.-S.S.: review and editing. All authors have read and agreed to the published version of the manuscript.
Funding
This research was supported by the Basic Science Research Program through the National Research Foundation of Korea (NRF-2020R1A4A2002021), and this work was supported by the National Foundation of Korea (NRF) grant funded by the Korea government (MSIT). (No.2020R1A2C1007353).
Data Availability Statement
The data presented in this study are available on request from the corresponding author.
Conflicts of Interest
The authors declare no conflict of interest.
References
- Steinmetz, C.P. On the law of hysteresis. IEEE Trans. Amer. Inst. Elect. Eng. 1892, 9, 1–64. [Google Scholar] [CrossRef]
- Berototti, G. General properties of power losses in soft ferromagnetic materials. IEEE Trans. Magn. 1988, 24, 621–630. [Google Scholar] [CrossRef]
- Bertotti, G.; Boglietti, A.; Chiampi, M.; Chiarabaglio, D.; Fiorillo, F.; Lazzari, M. An improved estimation of iron losses in rotating electrical machines. IEEE Trans. Magn. 1991, 27, 5007–5009. [Google Scholar] [CrossRef]
- Moses, A.J.; Shirkoohi, G.H. Iron loss in non-oriented electrical steels under distorted flux conditions. IEEE Trans. Magn. 1987, 23, 3217–3220. [Google Scholar] [CrossRef]
- Lancarotte, M.S.; Goldemberg, C.; Penteado, A.D., Jr. Estimation of FeSi core losses under PWMor DC bias ripple voltage excitations. IEEE Trans. Energy. Convers. 2005, 20, 367–372. [Google Scholar] [CrossRef]
- Aguglia, D.; Neuhaus, M. Laminated magnetic materials losses analysis under non-sinusoidal flux waveforms in power electronics systems. In Proceedings of the 2013 15th European Conference on Power Electronics and Applications (EPE), Lille, France, 2–6 September 2013; pp. 1–8. [Google Scholar]
- Alatawneh, N.; Pillay, P. The minor hysteresis loop under rotating magnetic fields in machine laminations. IEEE Trans. Ind. Appl. 2014, 50, 2544–2553. [Google Scholar] [CrossRef]
- JMAG Version 17—User’s Manual Iron Loss Formulas; JSOL Corporation: Tokyo, Japan, 2017; pp. 1219–1222.
- Gyselinck, J.; Vandevelde, L.; Melkebeek, J.; Dular, P.; Henrotte, F.; Legros, W. Calculation of eddy currents and associated losses in electrical steel laminations. IEEE Trans. Magn. 1999, 35, 1191–1194. [Google Scholar] [CrossRef]
- Taitoda, T.; Takahashi, Y.; Fujiwara, K. Iron loss estimation method for a general hysteresis loop with minor loop. IEEE Trans. Magn. 2015, 51, 8112304. [Google Scholar] [CrossRef]
- Rouve, L.; Ossart, F.; Waeckerle, T.; Kedous-Lebouc, A. Magnetic flux and losses computation in electrical laminations. IEEE Trans. Magn. 1996, 32, 4219–4221. [Google Scholar] [CrossRef]
Figure 1.
The schematic of the eco-friendly automotive AC refrigerant compressor.
Figure 1.
The schematic of the eco-friendly automotive AC refrigerant compressor.
Figure 2.
(a) Single layer V-shape magnet rotor. (b) Dual layer delta-shape magnet rotor. (c) Single layer flat-shape magnet rotor.
Figure 2.
(a) Single layer V-shape magnet rotor. (b) Dual layer delta-shape magnet rotor. (c) Single layer flat-shape magnet rotor.
Figure 3.
(a) Comparison of induced voltage of three different types of rotor shape at 1000 rpm without load. (b) Comparison of induced voltage of fast Fourier transform (FFT).
Figure 3.
(a) Comparison of induced voltage of three different types of rotor shape at 1000 rpm without load. (b) Comparison of induced voltage of fast Fourier transform (FFT).
Figure 4.
(a) Measured iron loss data at 50 kHz and 100 kHz from silicon steel 50PN470. (b) The estimated hysteresis loss factor from two frequencies of iron loss data.
Figure 4.
(a) Measured iron loss data at 50 kHz and 100 kHz from silicon steel 50PN470. (b) The estimated hysteresis loss factor from two frequencies of iron loss data.
Figure 5.
(a) Prototype sample picture of the automotive A/C refrigerant compressor IPMSM. (b) The distribution of magnetic flux density in the 2-D plane. (c) The magnetic flux density of point A in the time frame. (d) FFT analysis of the magnetic flux density in point A.
Figure 5.
(a) Prototype sample picture of the automotive A/C refrigerant compressor IPMSM. (b) The distribution of magnetic flux density in the 2-D plane. (c) The magnetic flux density of point A in the time frame. (d) FFT analysis of the magnetic flux density in point A.
Figure 6.
(a) End teeth flux density with 12 and 24 A peak phase current input conditions in the time frame. V shape inner permanent magnet rotor surface flux density. (b) Comparison of B-H Loops of end teeth and rotor surface.
Figure 6.
(a) End teeth flux density with 12 and 24 A peak phase current input conditions in the time frame. V shape inner permanent magnet rotor surface flux density. (b) Comparison of B-H Loops of end teeth and rotor surface.
Figure 7.
(a) Estimated iron loss data from the external value of proportional to the input frequency square. (b) Magnetic flux density according to the magnetic field strength.
Figure 7.
(a) Estimated iron loss data from the external value of proportional to the input frequency square. (b) Magnetic flux density according to the magnetic field strength.
Figure 8.
Comparison of (a) iron losses and (b) hysteresis losses of three different calculation methods at 6540 rpm, 24 A phase current.
Figure 8.
Comparison of (a) iron losses and (b) hysteresis losses of three different calculation methods at 6540 rpm, 24 A phase current.
Figure 9.
(a) Three different hysteresis loss calculation with 4 steps different operation points. (b) Two different eddy current loss calculation with 4 steps different operation points.
Figure 9.
(a) Three different hysteresis loss calculation with 4 steps different operation points. (b) Two different eddy current loss calculation with 4 steps different operation points.
Figure 10.
Comparison of three (a) rotor and (b) stator structure iron losses using three different calculation methods at 6540 rpm and 24 A phase current.
Figure 10.
Comparison of three (a) rotor and (b) stator structure iron losses using three different calculation methods at 6540 rpm and 24 A phase current.
Table 1.
Comparison of iron losses of three different calculation methods at 6540 rpm, 24 A phase current.
Table 1.
Comparison of iron losses of three different calculation methods at 6540 rpm, 24 A phase current.
| Iron Loss | 1st Method | 2nd Method | 3rd Method |
|---|
| Single-V | 138.93 | 132.68 | 134.38 |
| Dual-D | 135.35 | 128.74 | 128.67 |
| Single-F | 142.86 | 135.89 | 141.69 |
Table 2.
Comparison of hysteresis losses of three different calculation methods at 6540 rpm, 24 A phase current.
Table 2.
Comparison of hysteresis losses of three different calculation methods at 6540 rpm, 24 A phase current.
| Hysteresis Loss | 1st Method
(Frequency Sep.) | 2nd Method
(Loop Count.) | 3rd Method
(Loop Size Consider) |
|---|
| Single-V | 28.62 | 22.37 | 24.81 |
| Dual-D | 28.05 | 21.45 | 22.56 |
| Single-F | 28.99 | 22.02 | 23.61 |
Table 3.
Efficiency comparison of three different rotor structure at 6540 rpm, 24 A phase current based on three different type of iron loss.
Table 3.
Efficiency comparison of three different rotor structure at 6540 rpm, 24 A phase current based on three different type of iron loss.
| Efficiency | 1st Method | 2nd Method | 3rd Method |
|---|
| Single-V | 93.52% | 93.64% | 93.52% |
| Dual-D | 93.44% | 93.57% | 93.47% |
| Single-F | 93.44% | 93.57% | 93.37% |
Table 4.
Comparison of three rotor structure iron losses in rotor using three different calculation method at 6540 rpm and 24 A phase current.
Table 4.
Comparison of three rotor structure iron losses in rotor using three different calculation method at 6540 rpm and 24 A phase current.
| Response Value | 1st Iron Loss | 2nd Iron Loss | 3rd Iron Loss |
|---|
| Single-V | Dual-D | Single-F | Single-V | Dual-D | Single-F | Single-V | Dual-D | Single-F |
|---|
| Eddy current loss | 11.76 | 11.38 | 12.02 | 11.76 | 11.38 | 12.02 | 8.93 | 10.02 | 11.22 |
| Hysteresis loss | 1.92 | 1.89 | 1.80 | 1.75 | 1.58 | 1.67 | 3.10 | 2.65 | 2.57 |
Table 5.
Comparison of three rotor structure iron losses in stator using three different calculation method at 6540 rpm and 24 A phase current.
Table 5.
Comparison of three rotor structure iron losses in stator using three different calculation method at 6540 rpm and 24 A phase current.
| Response Value | 1st Iron Loss | 2nd Iron Loss | 3rd Iron Loss |
|---|
| Single-V | Dual-D | Single-F | Single-V | Dual-D | Single-F | Single-V | Dual-D | Single-F |
|---|
| Eddy current loss | 98.55 | 95.91 | 101.85 | 98.55 | 95.91 | 101.85 | 100.64 | 96.09 | 106.86 |
| Hysteresis loss | 26.71 | 26.16 | 27.19 | 20.63 | 19.87 | 20.35 | 21.71 | 19.91 | 21.04 |
Table 6.
Comparison of three different iron losses calculation methods.
Table 6.
Comparison of three different iron losses calculation methods.
| Iron Loss | 1st Method | 2nd Iron Loss | 3rd Iron Loss |
|---|
| Hysteresis Loss | Method | Frequency Sep. | Loop Count. | Loop Size Consider |
| Data | Iron loss data (FFT) | Iron loss data, DC bias | Loop measurement |
Eddy-current
Loss | Method | Frequency Sep. | Homogenization |
| Data | Iron loss data (FFT) | Electrical resistivity |
| Publisher’s Note: MDPI stays neutral with regard to jurisdictional claims in published maps and institutional affiliations. |
© 2021 by the authors. Licensee MDPI, Basel, Switzerland. This article is an open access article distributed under the terms and conditions of the Creative Commons Attribution (CC BY) license (https://creativecommons.org/licenses/by/4.0/).


