
Experimental Investigation Using Acoustic Emission Technique for Quasi-Static Cracks in Steel Pipes Assessment

 ,
,  ,
,
Abstract
:1. Introduction
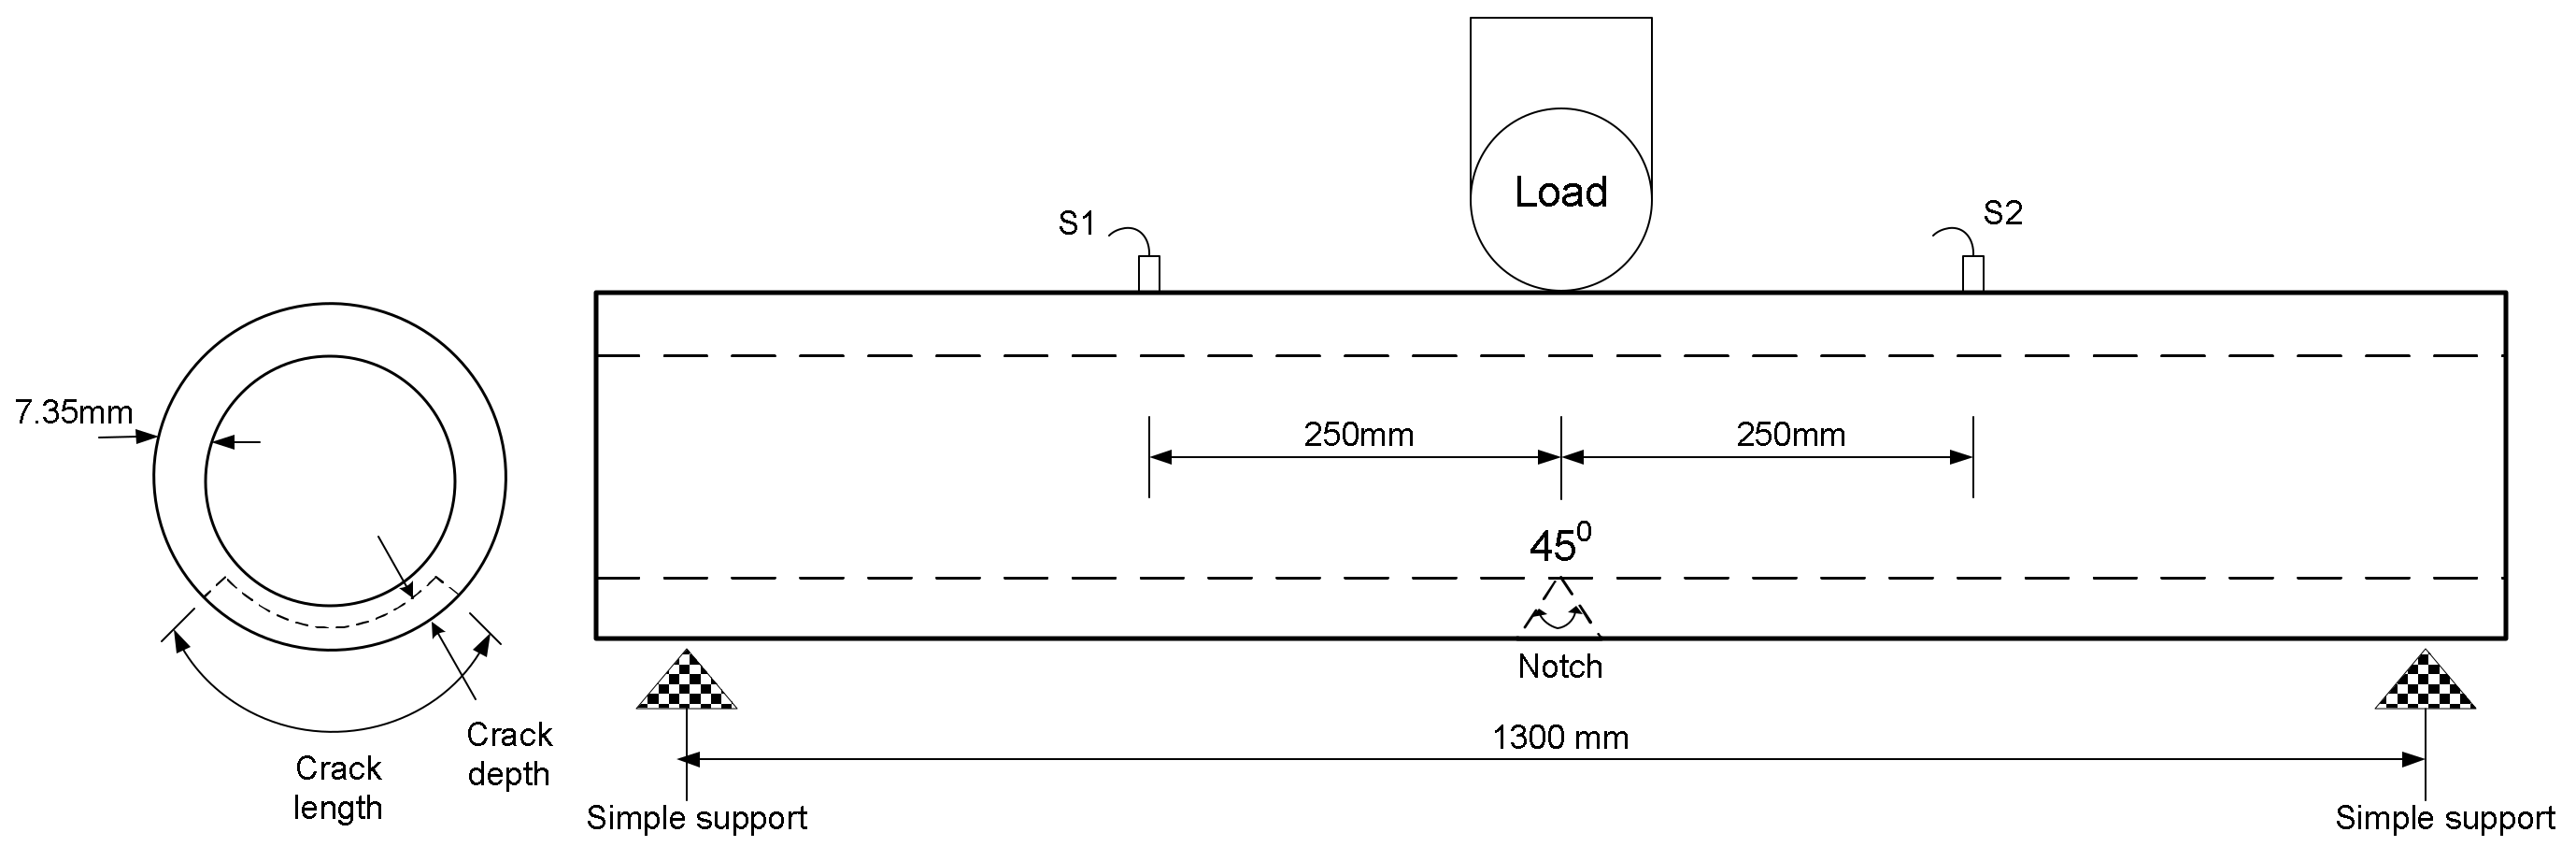
2. Materials and Methods
3. Results and Discussion
4. Conclusions
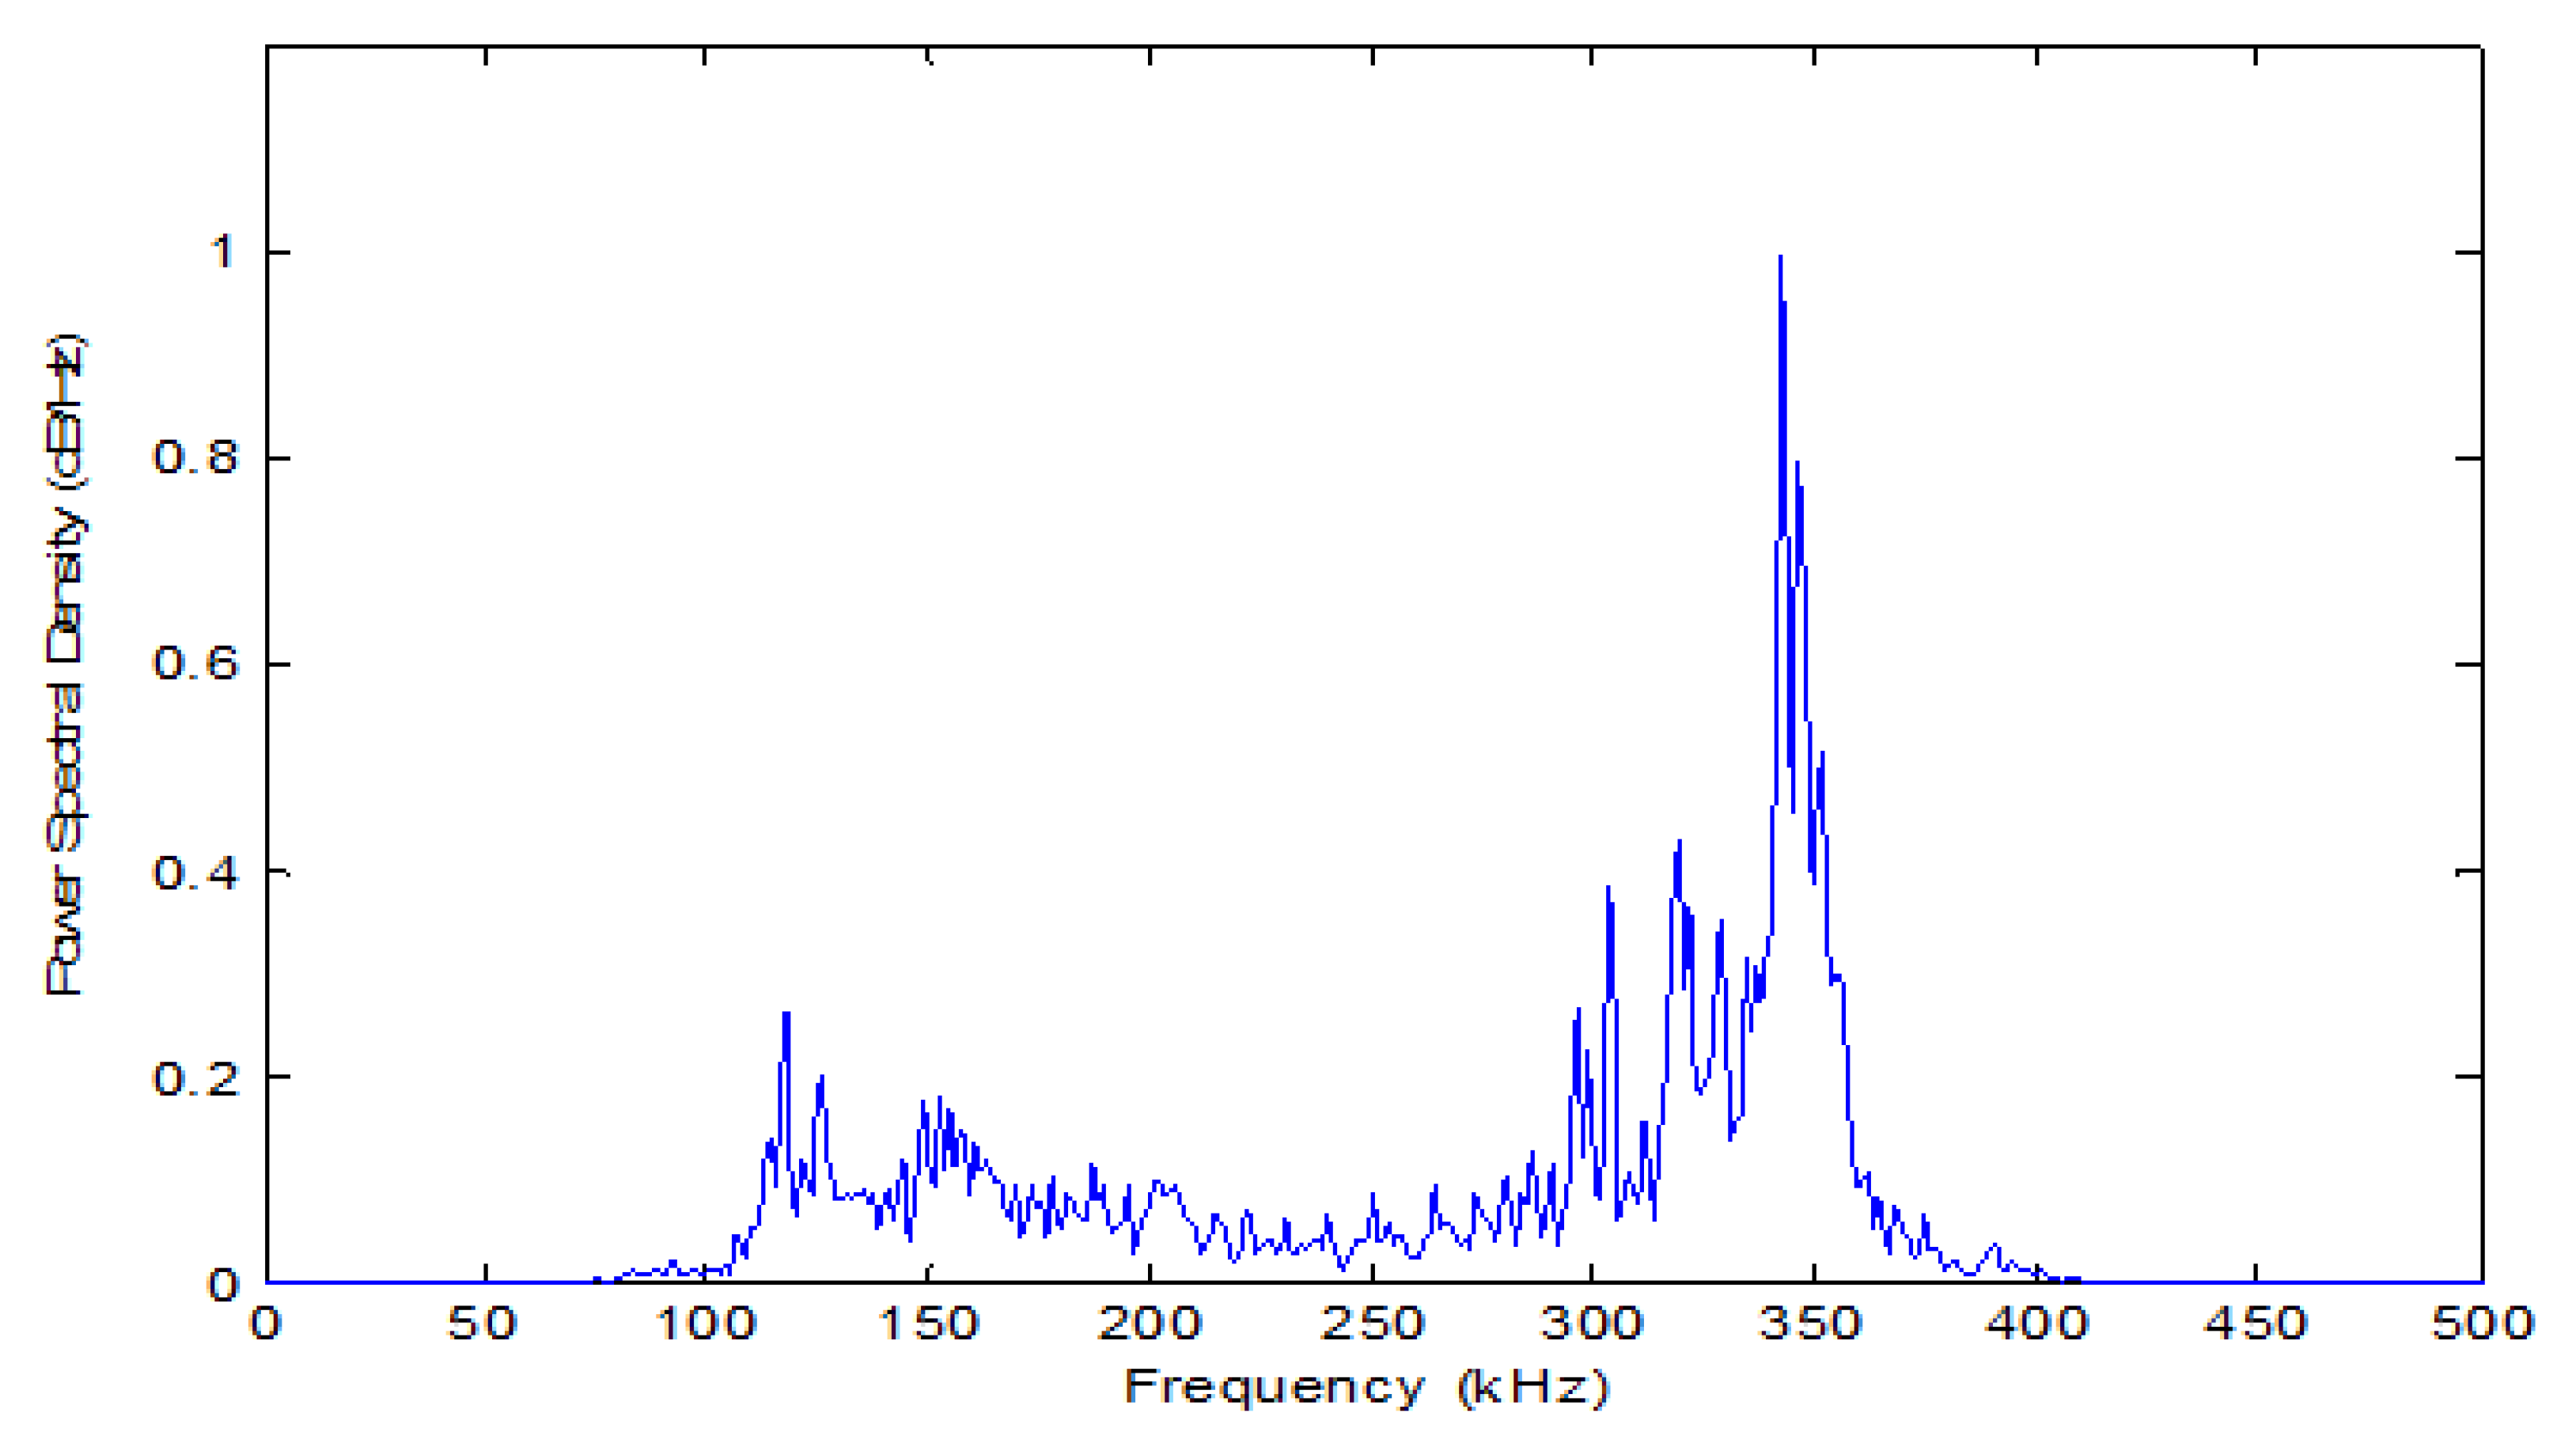
- AE due to crack spreading tends to manifest itself mostly in higher frequencies, with contributions from general plastic deformation, and crack spreading by intense plastic deformation and fracture mechanics.
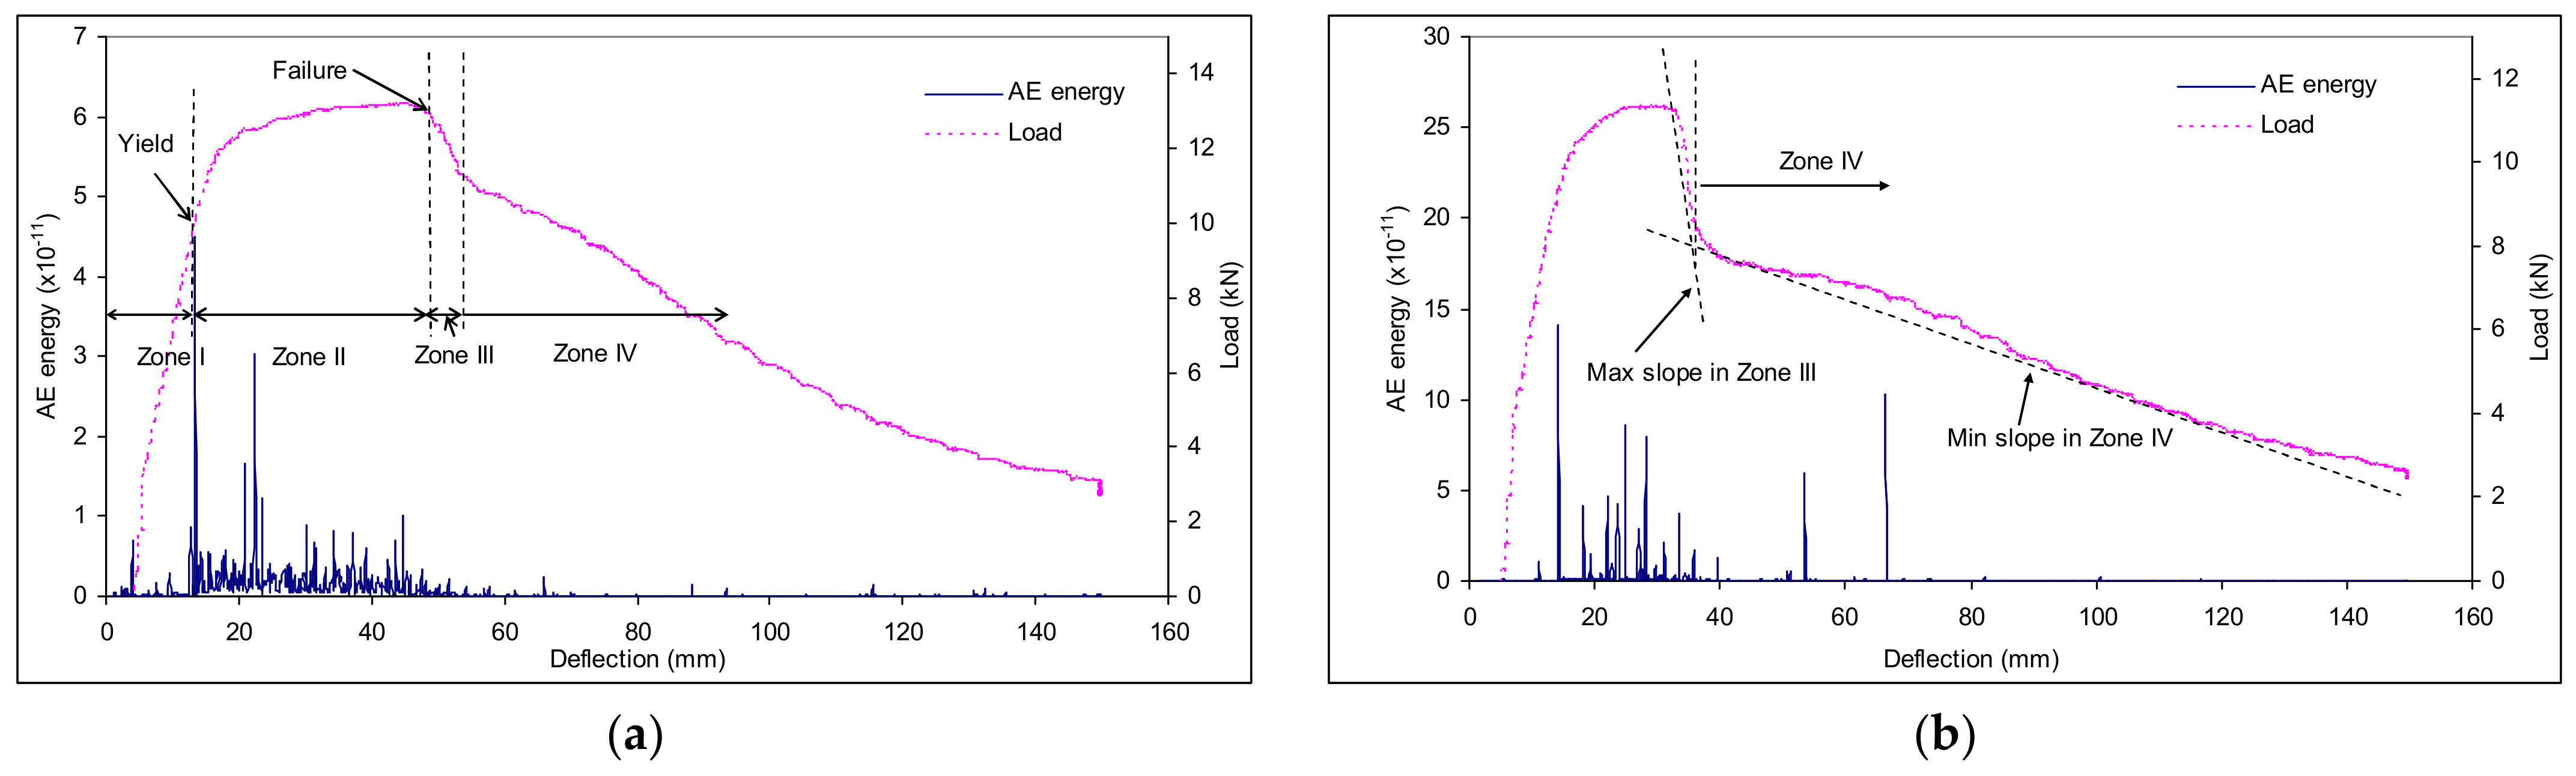
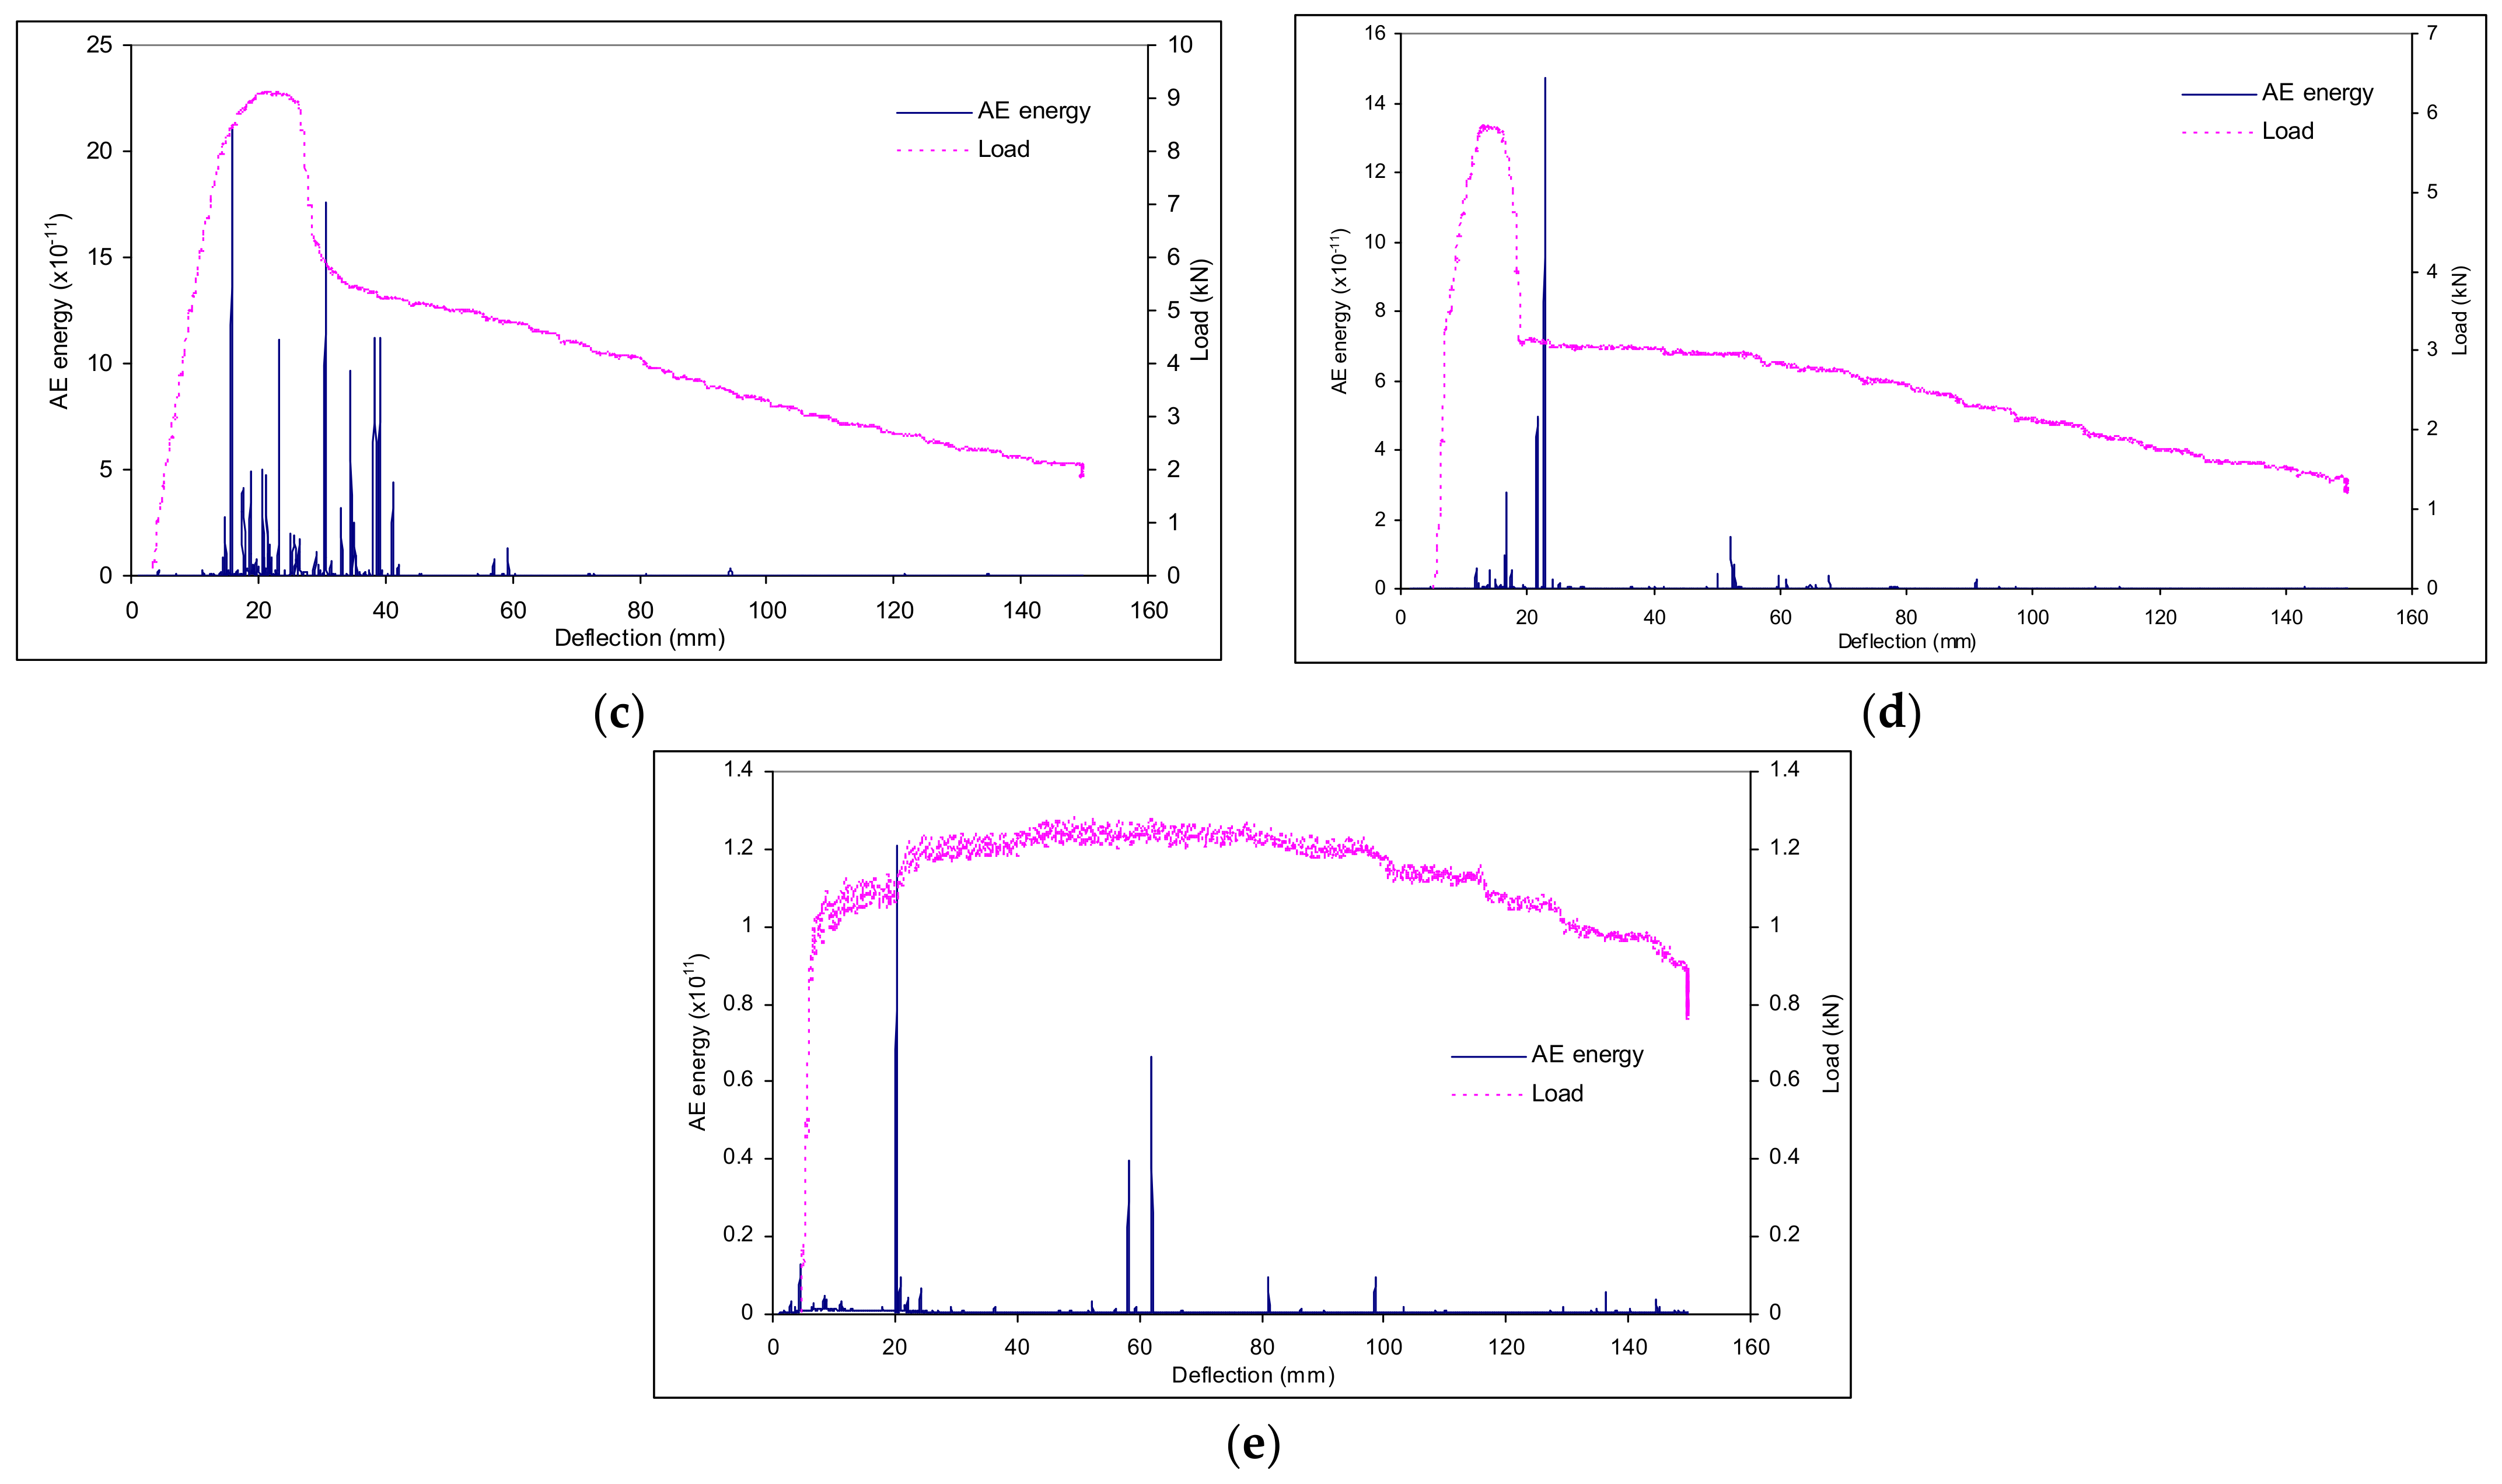
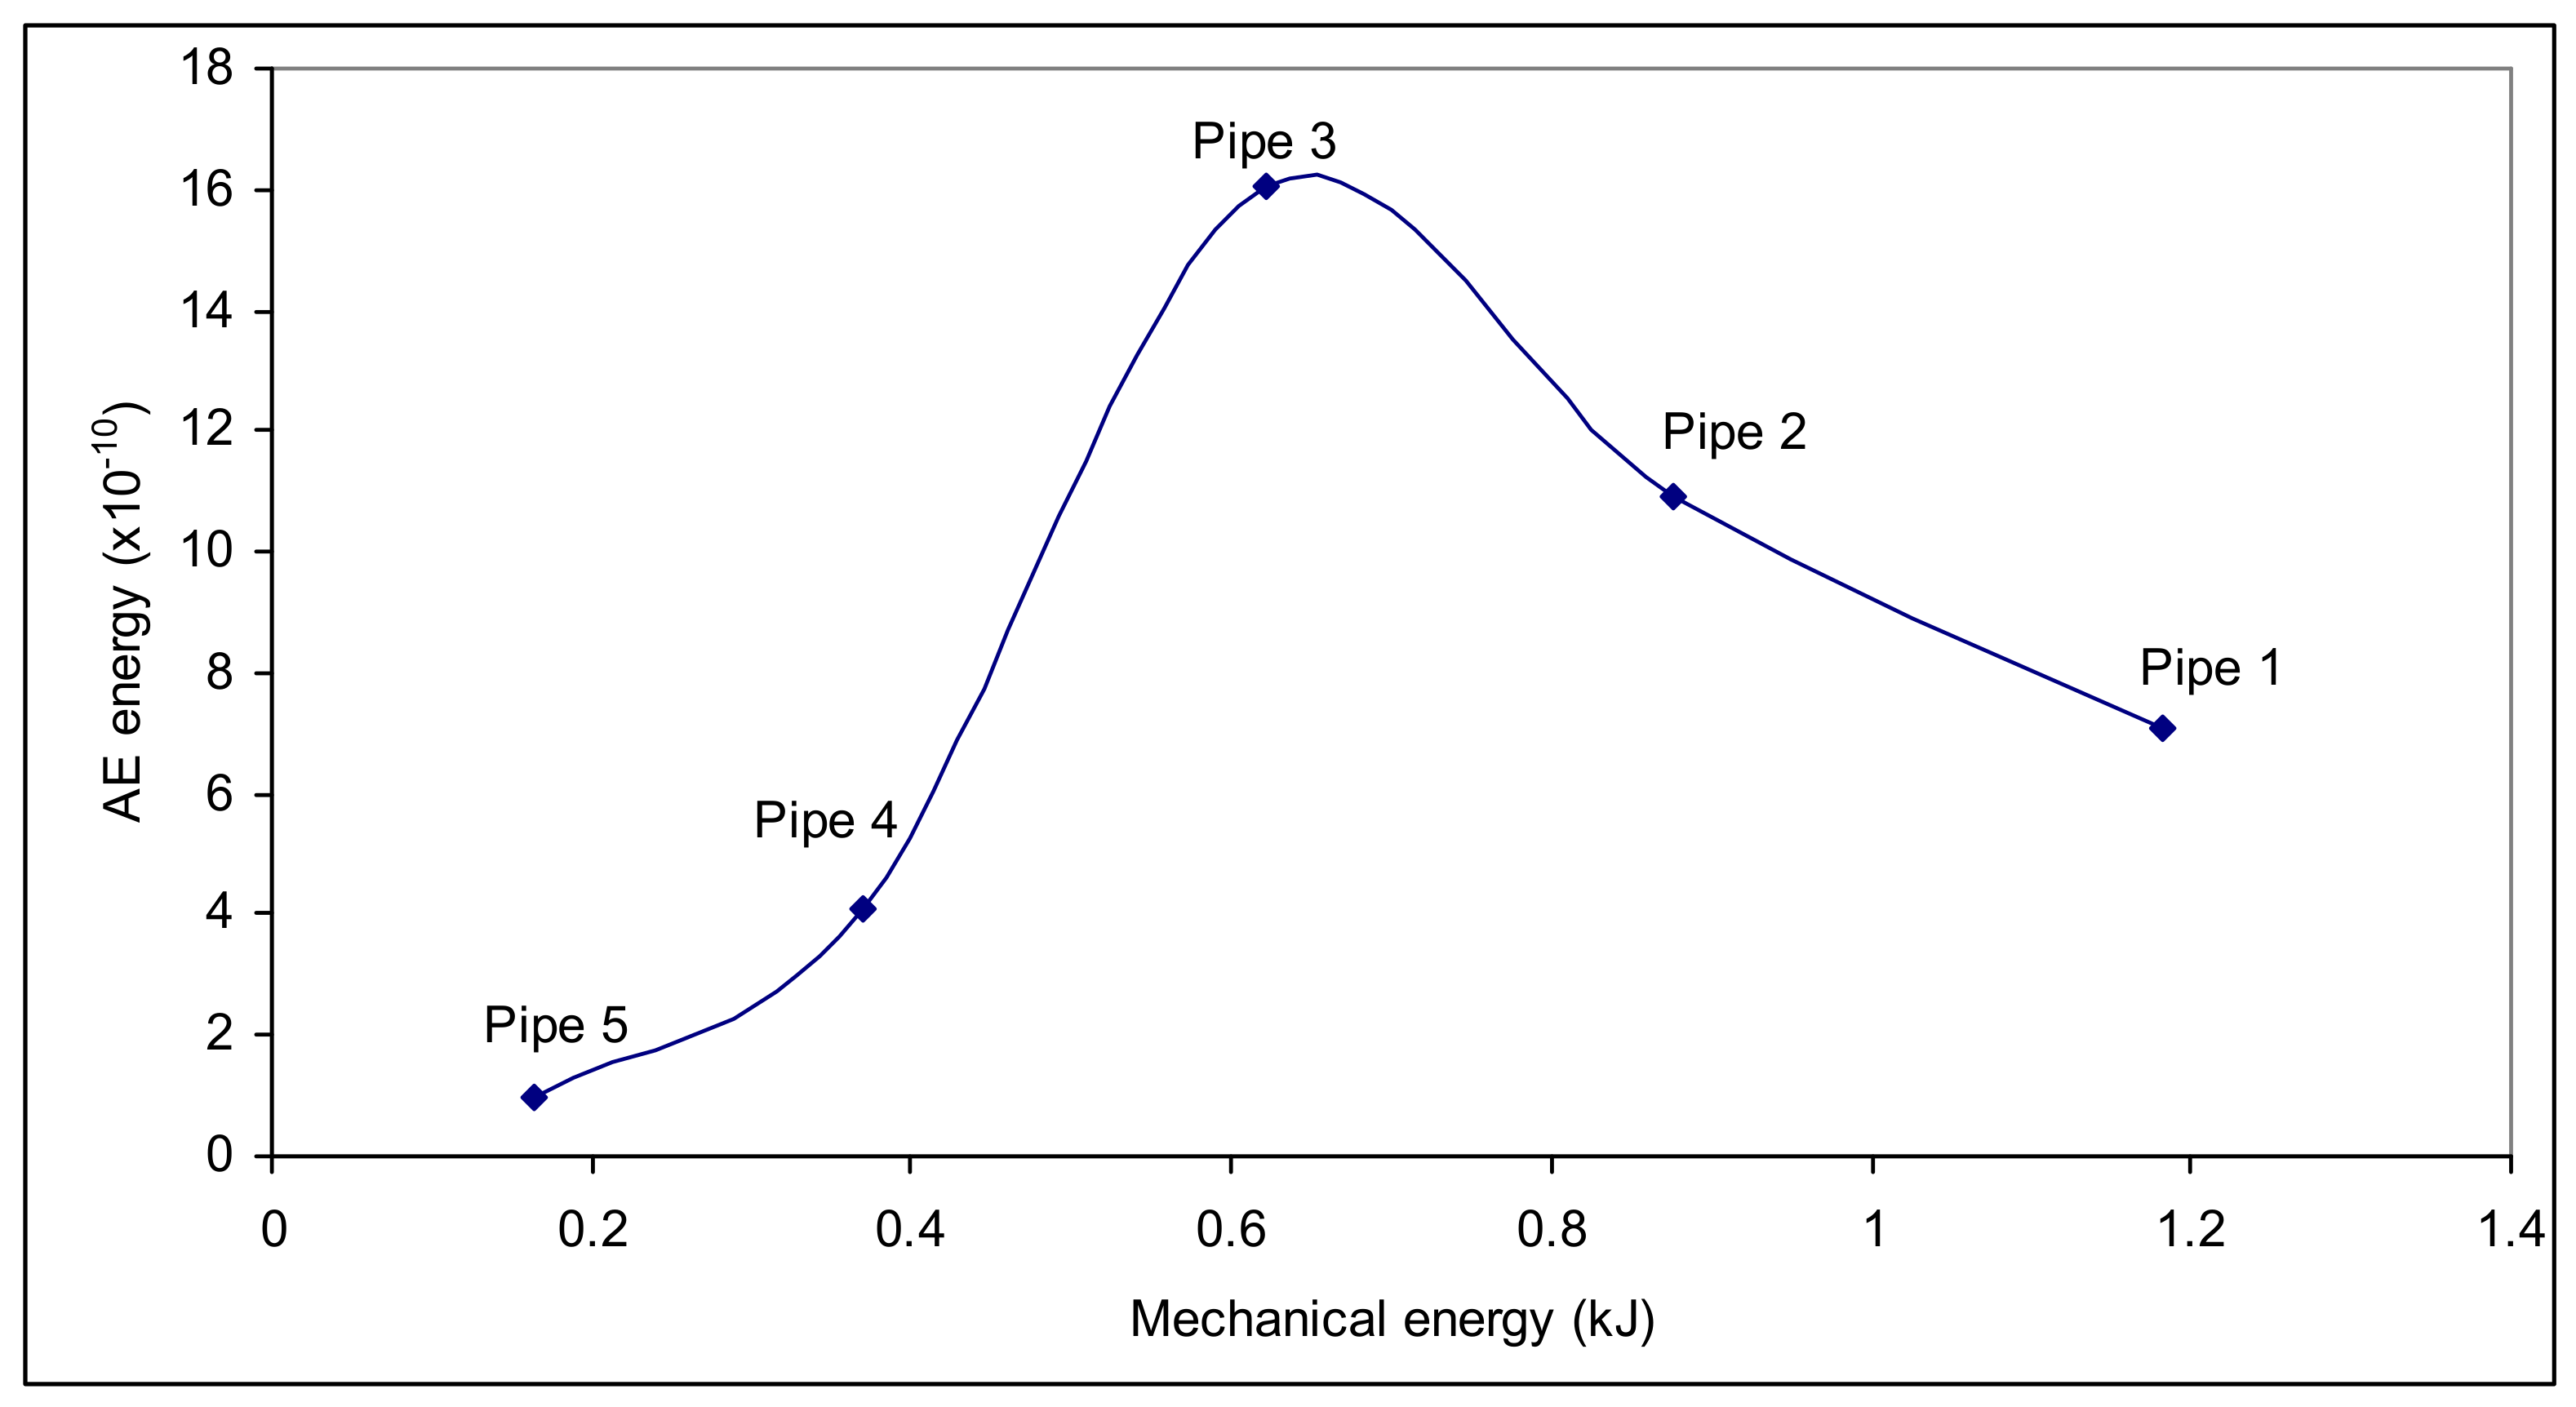
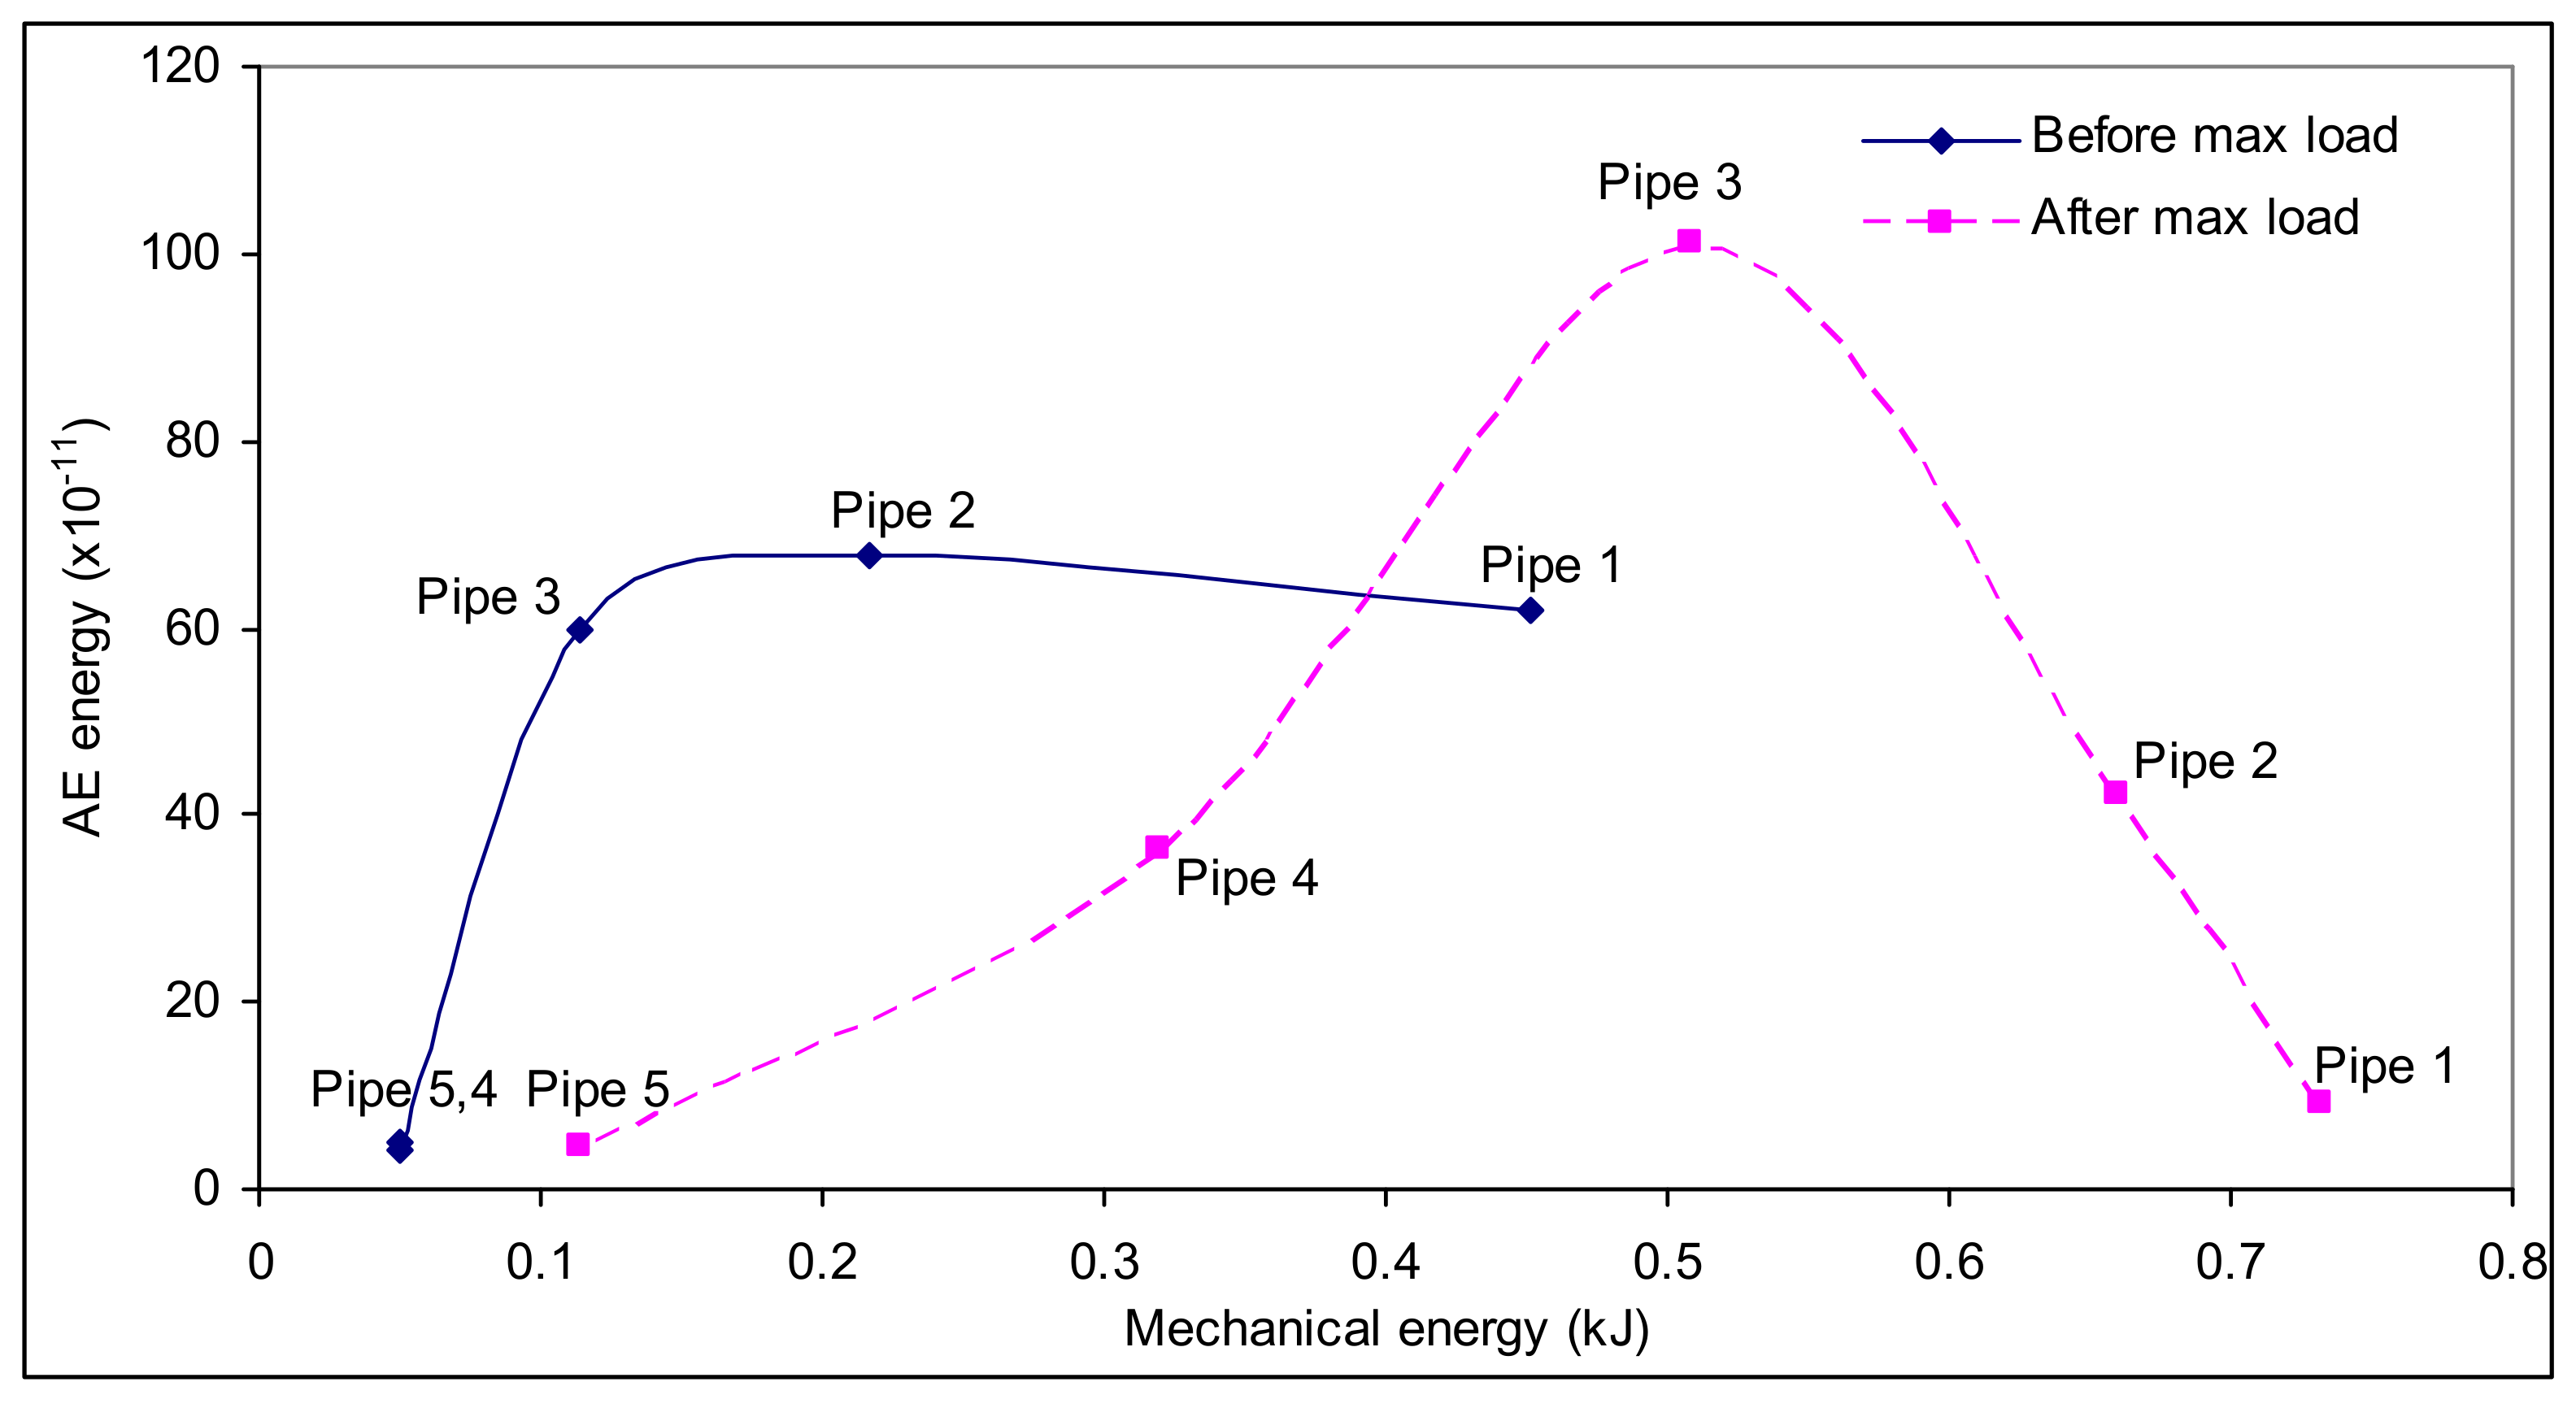
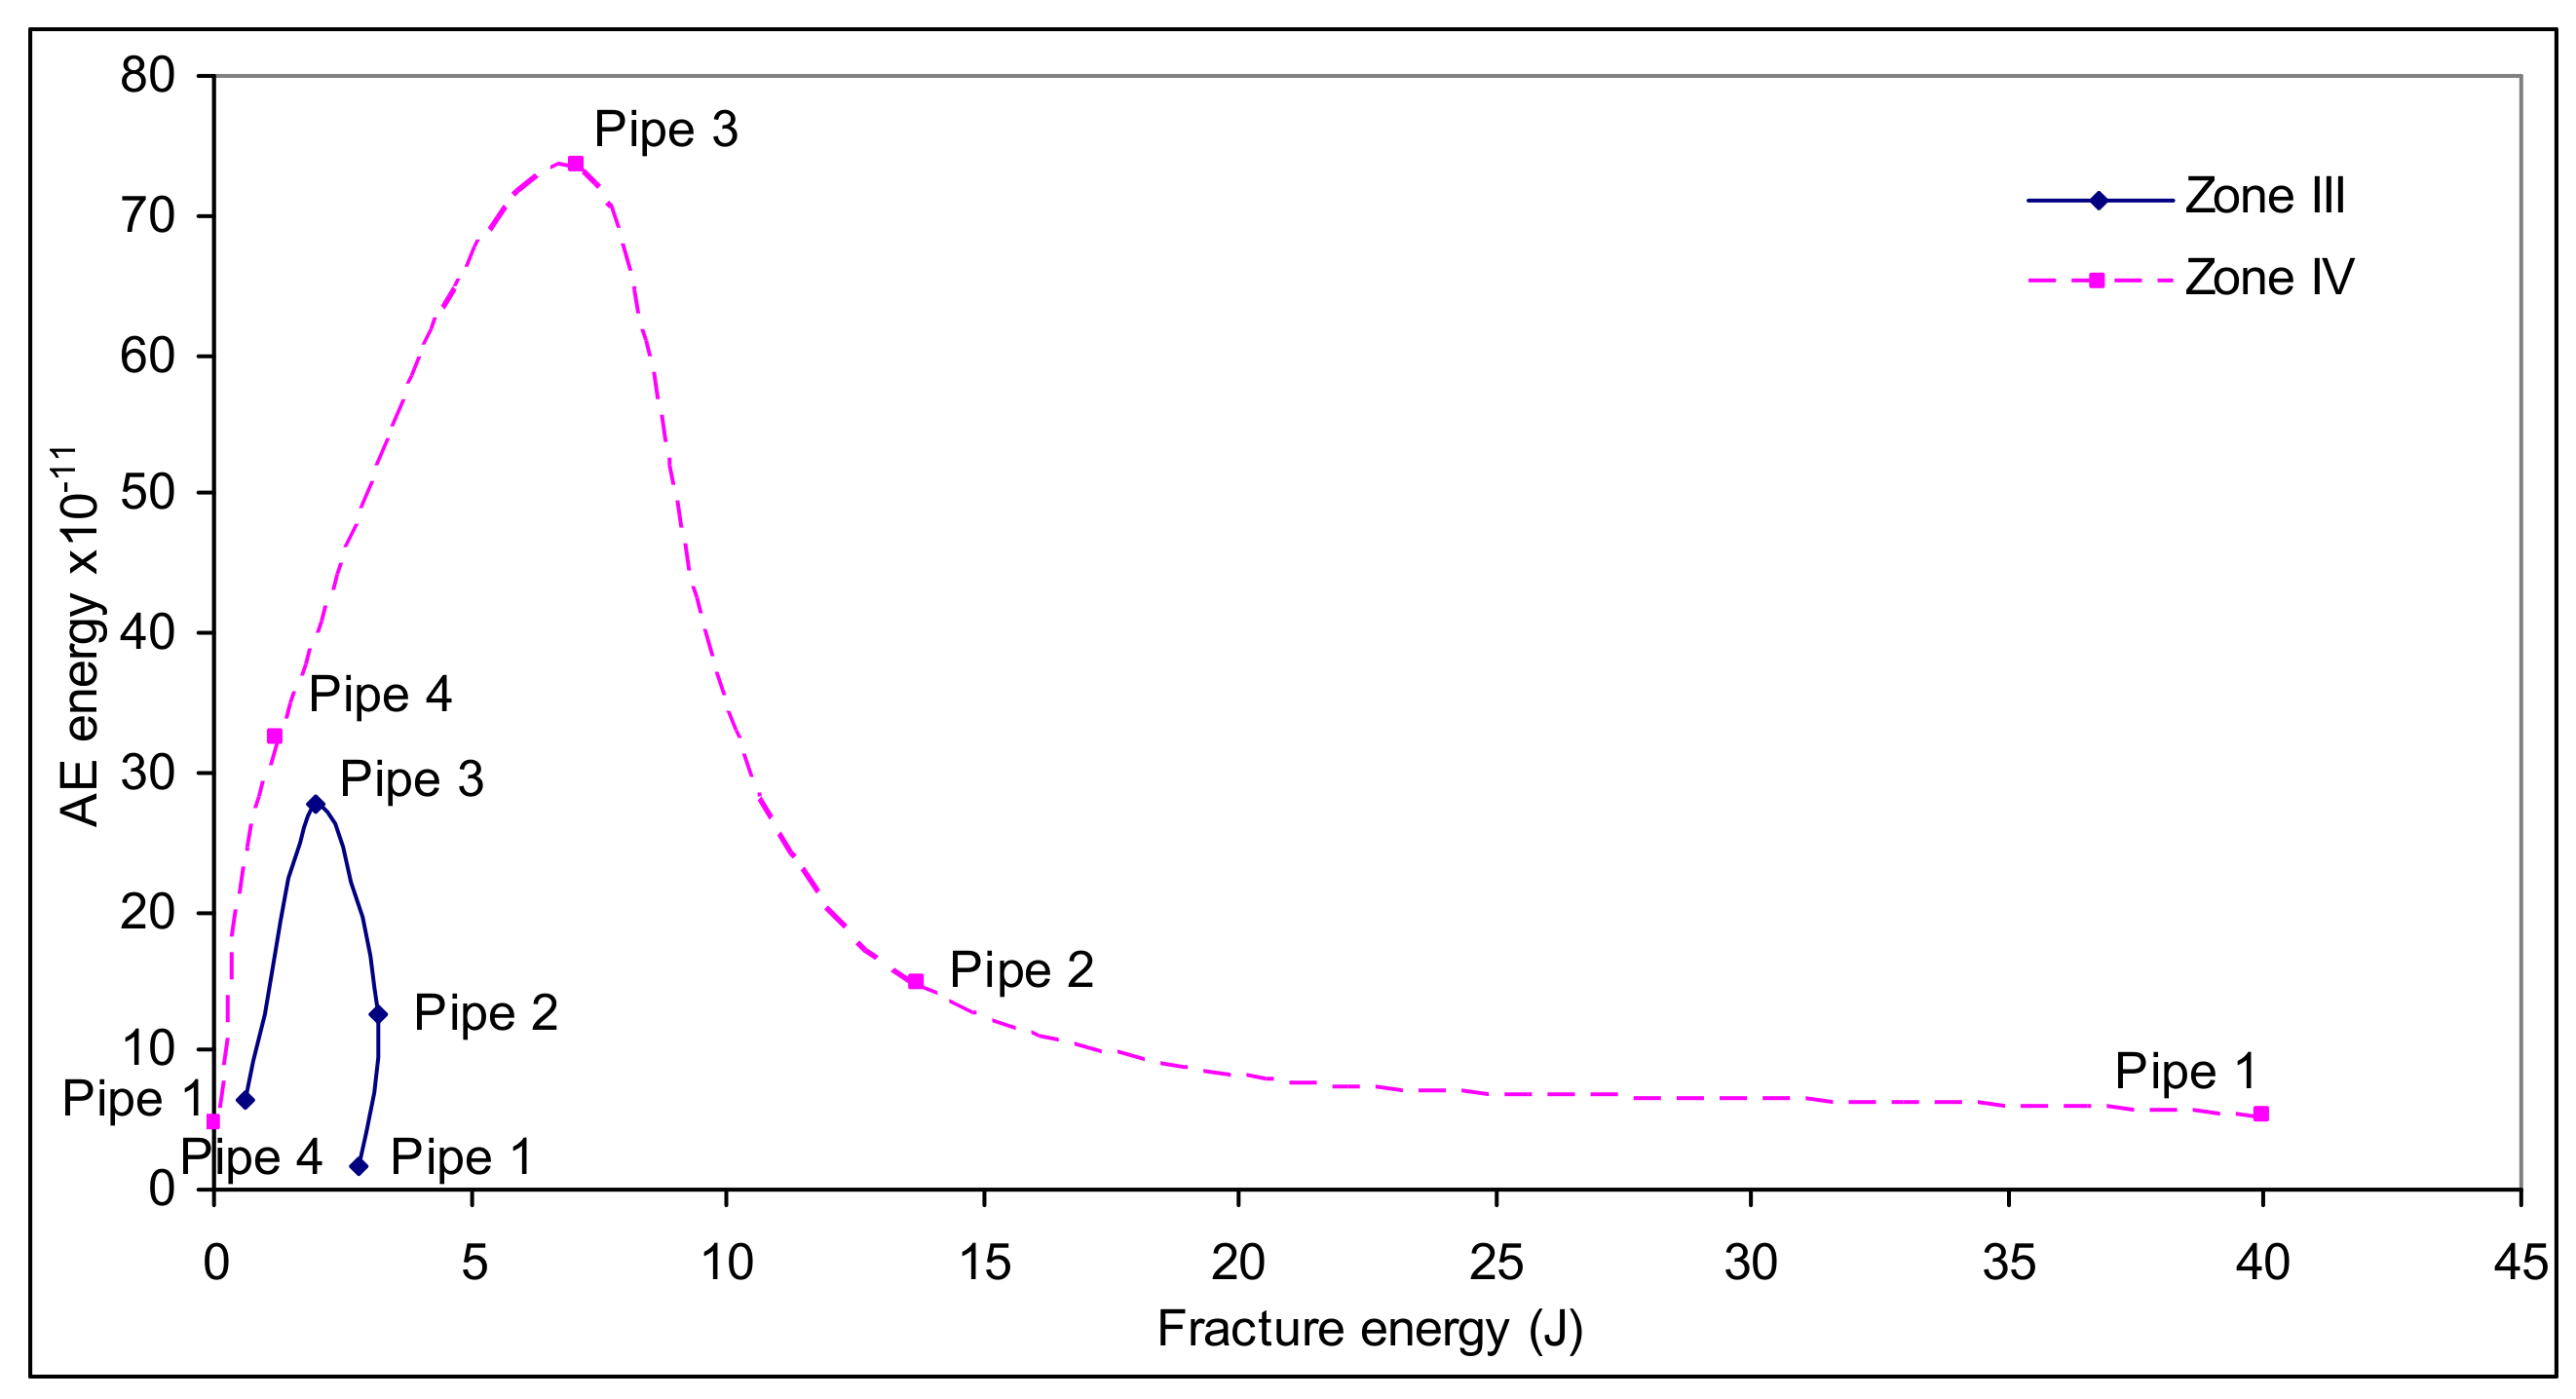
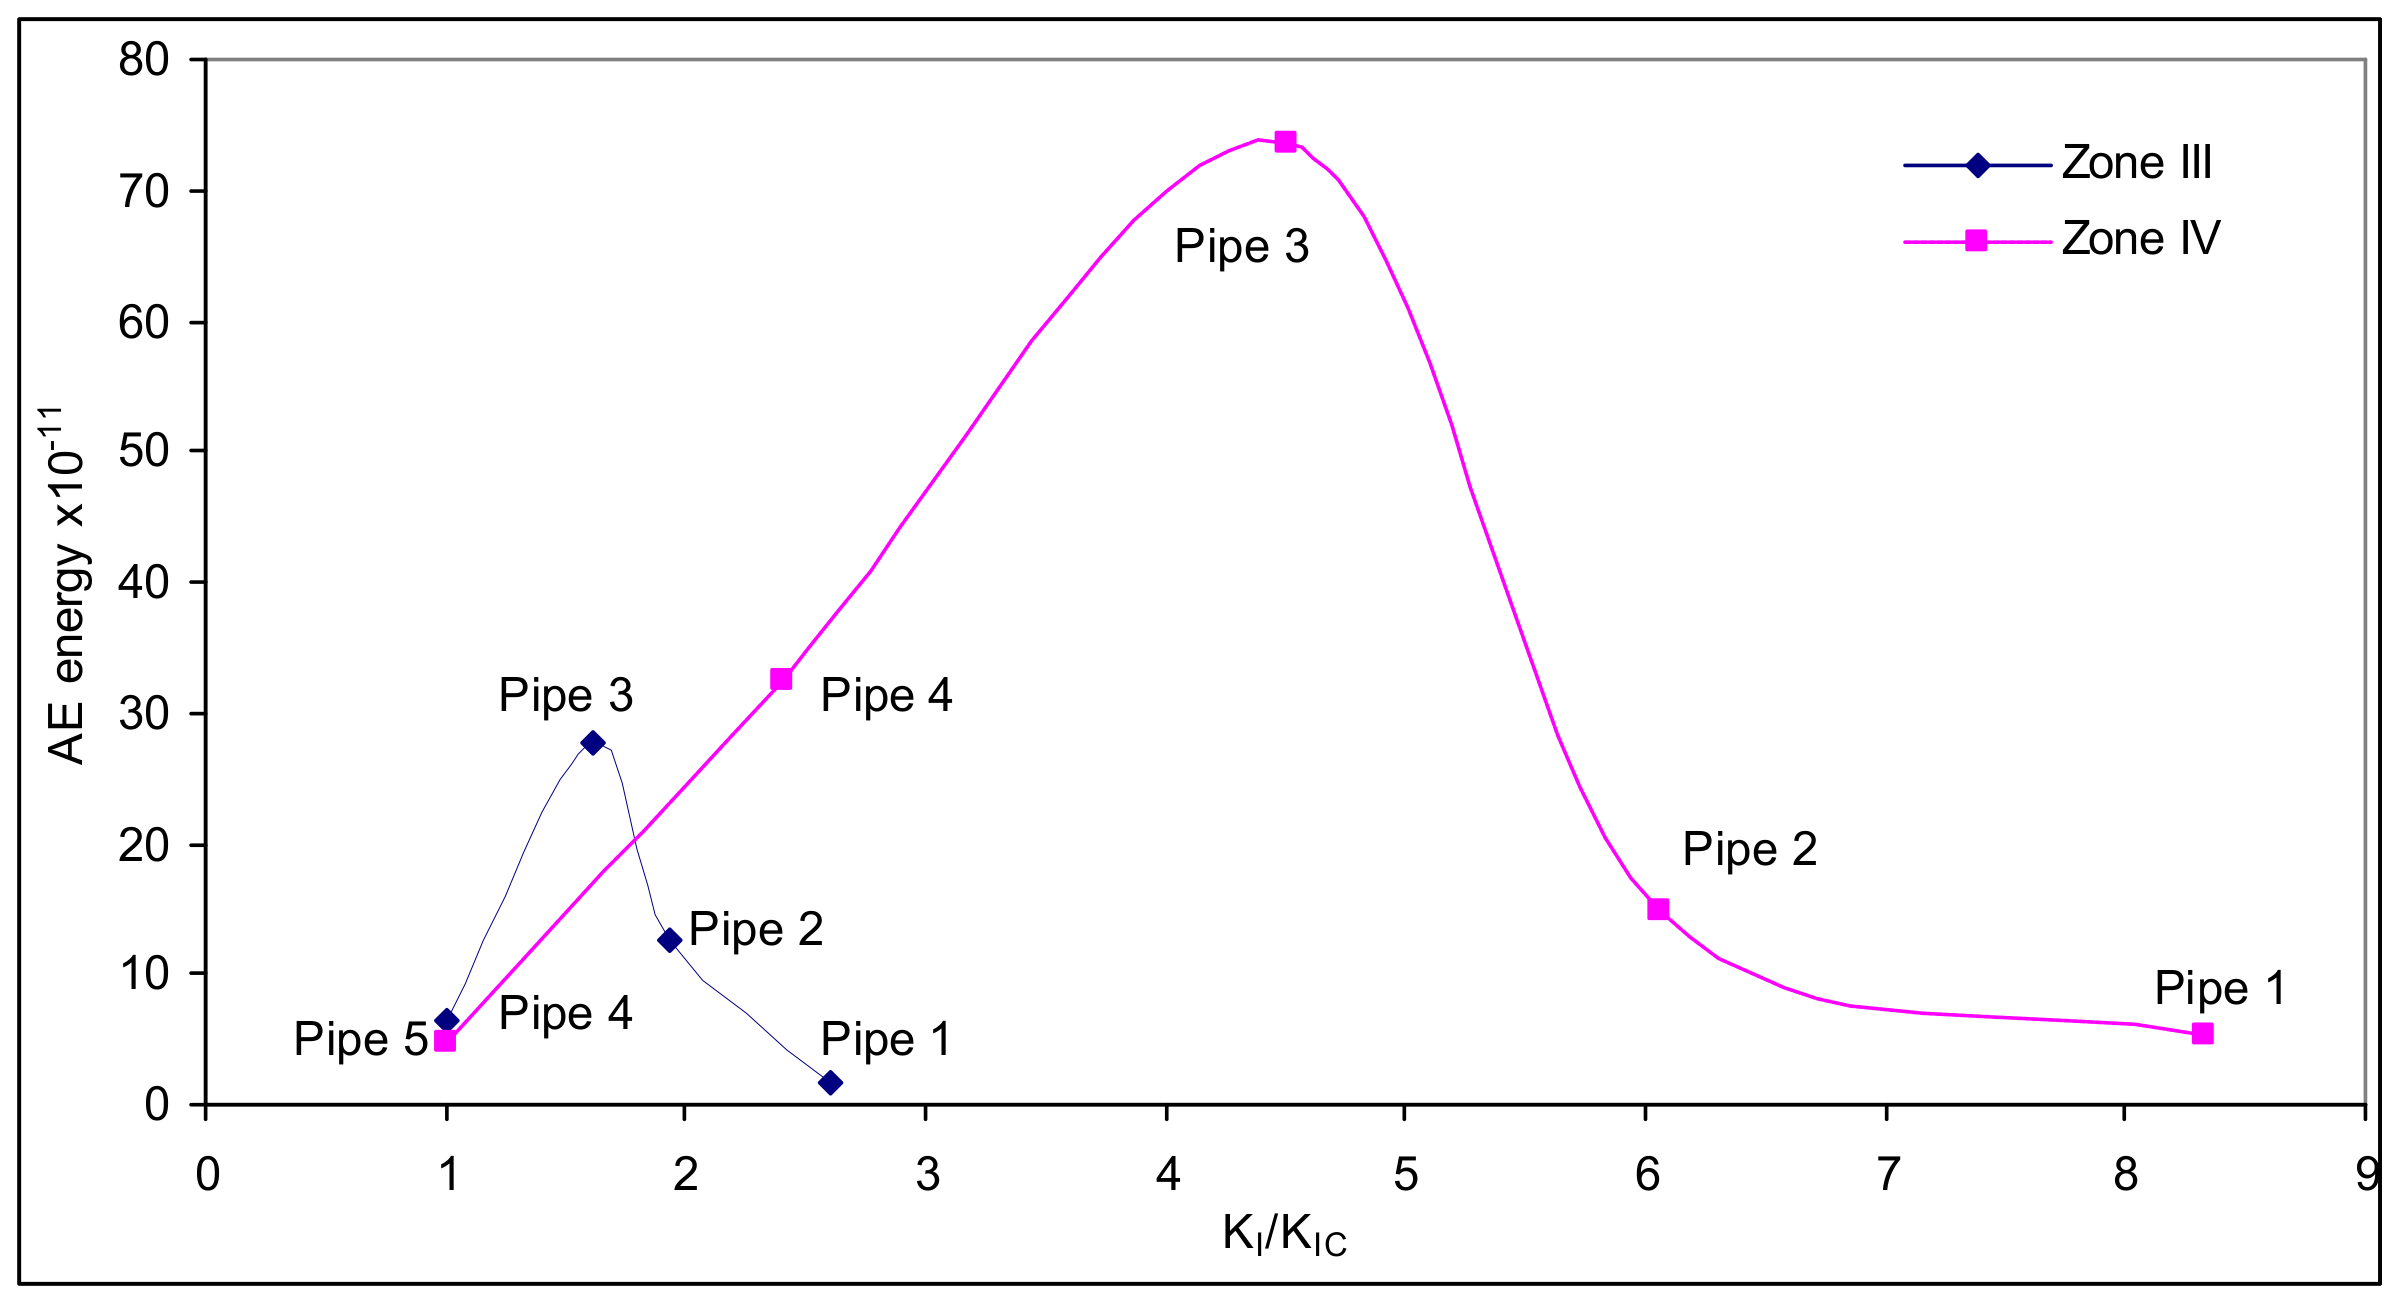
- The cumulative AE energy was mostly produced during periods of intense plastic deformation during the three bending point test, predominantly, the maximum AE energy occurred at the end of Zone I (yield of the pipe section) and the starting of Zone IV (plastic tearing).
- The experiments reported here have spanned the plane-stress/plane-strain transition and, as such, have provided two distinct trends with crack size. The AE energy was sensitive to where the size of crack lay regarding the transition of plane-stress to plane-strain.
- Transitions of the plane-stress to plane-strain have extended and, as such, have supplied two distinct trends with crack size.
- The emitted AE signals due to crack propagation tends to be obvious in higher frequencies, with contributions from general plastic deformation, and the crack propagation by fracture mechanics and extensive plastic deformation.
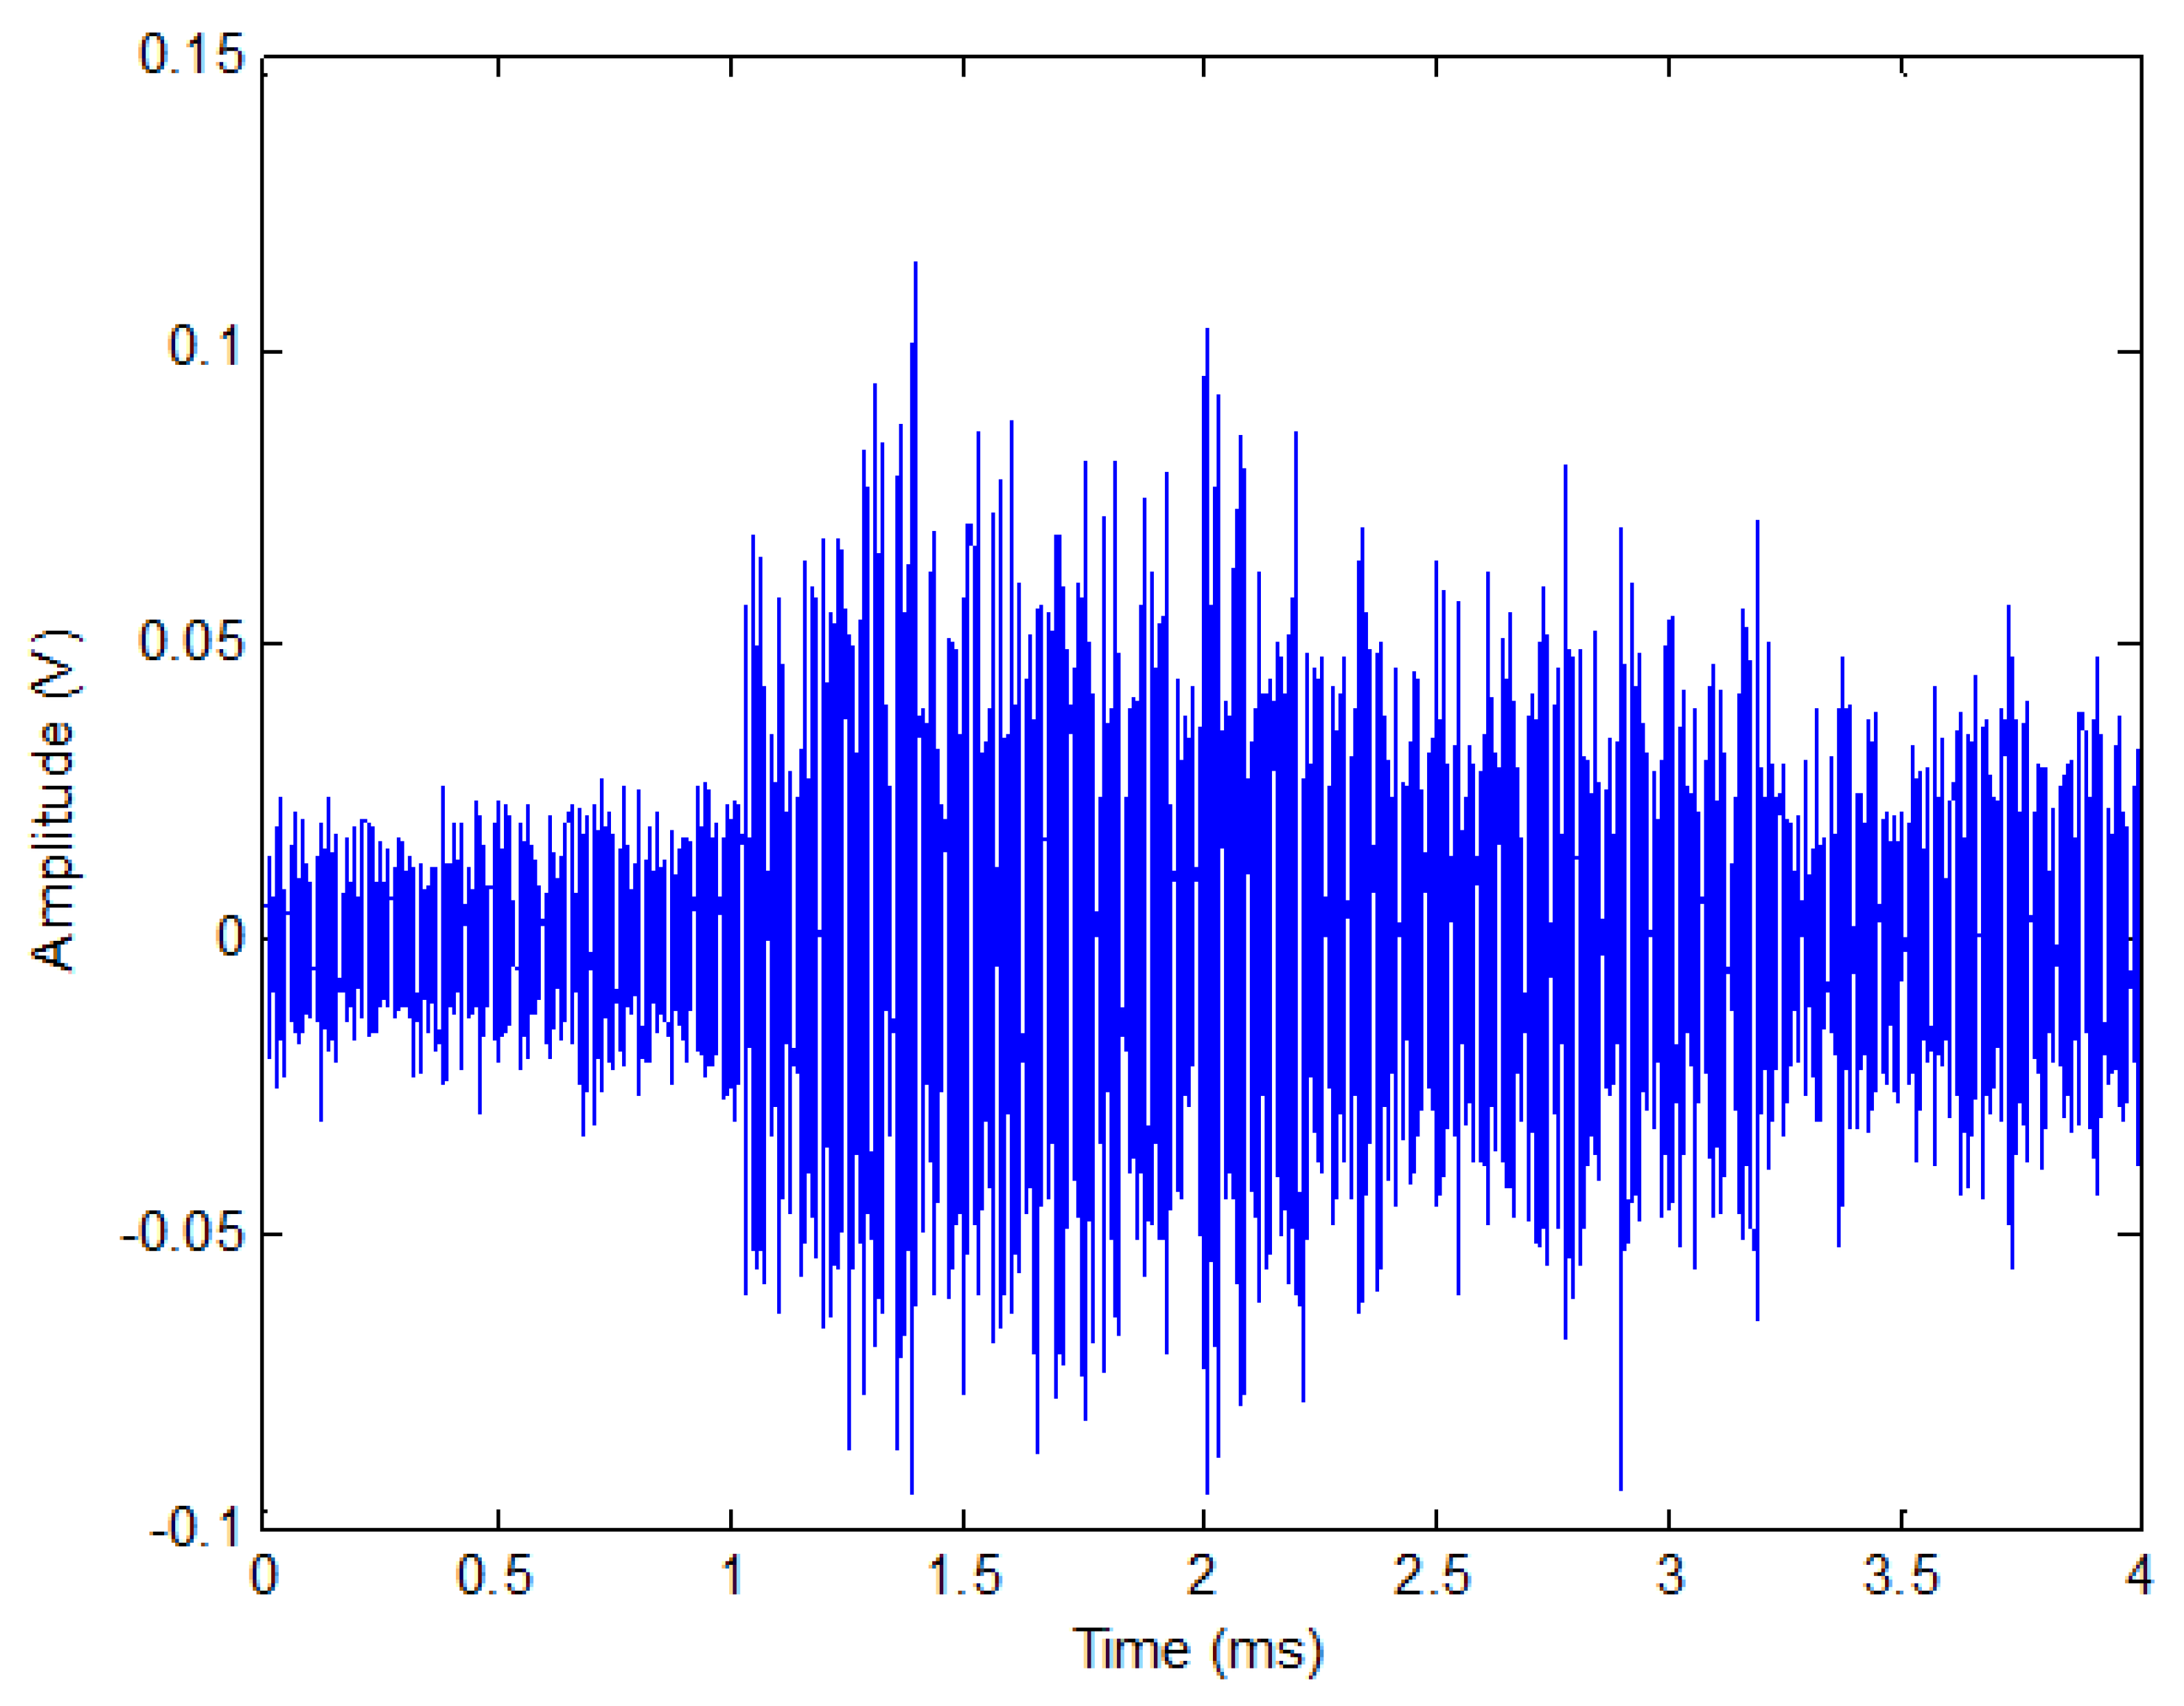
- The time domain can also clearly be used to recognize between these specific crack sizes.
Author Contributions
Funding
Institutional Review Board Statement
Informed Consent Statement
Data Availability Statement
Acknowledgments
Conflicts of Interest
References
- Huang, M.; Jiang, L.; Liaw, P.K.; Brooks, C.R.; Seeley, R.; Klarstrom, D.L. Using acoustic emission in fatigue and fracture materials research. JOM 1998, 50, 1–14. [Google Scholar]
- Kaphle, M.R. Analysis of Acoustic Emission Data for Accurate Damage Assessment for Structural Health Monitoring Applications. Ph.D. Thesis, Queensland University of Technology, Brisbane, Australia, 2012. [Google Scholar]
- Sheahan, T.; Briens, L. Passive acoustic emission monitoring of pellet coat thickness in a fluidized bed. Powder Technol. 2015, 286, 172–180. [Google Scholar] [CrossRef]
- Buckley, K.; Venkatesan, G.; West, D.; Kaveh, M. Detection and characterization of cracks for failure monitoring and diagnostics. In Proceedings of the 1996 IEEE International Conference on Acoustics, Speech, and Signal Processing Conference Proceedings, Atlanta, GA, USA, IEEE, 9–19 May 1996; pp. 2738–2741. [Google Scholar] [CrossRef]
- Wood, B.; Harris, R. Structural integrity and remnant life evaluation of pressure equipment from acoustic emission monitoring. Int. J. Press. Vessel. Pip. 2000, 77, 125–132. [Google Scholar] [CrossRef]
- Von Stebut, J. Multi-mode scratch testing—a European standards, measurements and testing study. Surf. Coat. Technol. 2005, 200, 346–350. [Google Scholar] [CrossRef]
- Boyd, J.W.; Varley, J. The uses of passive measurement of acoustic emissions from chemical engineering processes. Chem. Eng. Sci. 2001, 56, 1749–1767. [Google Scholar] [CrossRef]
- Richter, H.; Böhmert, J.; Viehrig, H.-W. The use of acoustic emission to determine characteristic dynamic strength and toughness properties of steel. Nucl. Eng. Des. 1999, 188, 241–254. [Google Scholar] [CrossRef]
- Shehadeh, M.; Abdou, W.; Steel, J.A.; Reuben, R.L. Aspects of acoustic emission attenuation in steel pipes subject to different internal and external environments. Proc. Inst. Mech. Eng. Part E J. Process. Mech. Eng. 2008, 222, 41–54. [Google Scholar] [CrossRef]
- Kim, Y.H.; Lee, S.; Kim, H.C. Attenuation and dispersion of elastic waves in multi-phase materials. J. Phys. D Appl. Phys. 1991, 24, 1722–1728. [Google Scholar] [CrossRef]
- Aggelis, D.G.; Matikas, T.E. Effect of plate wave dispersion on the acoustic emission parameters in metals. Comput. Struct. 2012, 98–99, 17–22. [Google Scholar] [CrossRef]
- Sedlák, P.; Hirose, Y.; Khan, S.A.; Enoki, M.; Sikula, J. New automatic localization technique of acoustic emission signals in thin metal plates. Ultrasonics 2009, 49, 254–262. [Google Scholar] [CrossRef]
- Brepta, R.; Vales, F.; Červ, J.; Tikal, B. Rayleigh wave dispersion due to spatial (FEM) discretization of a thin elastic solid having non-curved boundary. Comput. Struct. 1996, 58, 1233–1244. [Google Scholar] [CrossRef]
- Rose, J. Interface waves. In Ultrasonic Waves in Solid Media; Cambridge University Press: Cambridge, CA, USA, 2004; pp. 132–135. [Google Scholar]
- Brown, J.A.; Vendra, L.J.; Rabiei, A. Bending Properties of Al-Steel and Steel-Steel Composite Metal Foams. Met. Mater. Trans. A 2010, 41, 2784–2793. [Google Scholar] [CrossRef]
- Hoang, T.D.; Herbelot, C.; Imad, A. Rupture and damage mechanism analysis of a bolted assembly using coupling techniques between A.E. and D.I.C. Eng. Struct. 2010, 32, 2793–2803. [Google Scholar] [CrossRef]
- Roberts, T.; Talebzadeh, M. Acoustic emission monitoring of fatigue crack propagation. J. Constr. Steel Res. 2003, 59, 695–712. [Google Scholar] [CrossRef]
- Boschetto, A.; Quadrini, F. Powder size measurement by acoustic emission. Measurement 2011, 44, 290–297. [Google Scholar] [CrossRef]
- Aggelis, D.; Kordatos, E.; Matikas, T. Acoustic emission for fatigue damage characterization in metal plates. Mech. Res. Commun. 2011, 38, 106–110. [Google Scholar] [CrossRef]
- Han, Z.; Luo, H.; Cao, J.; Wang, H. Acoustic emission during fatigue crack propagation in a micro-alloyed steel and welds. Mater. Sci. Eng. A 2011, 528, 7751–7756. [Google Scholar] [CrossRef]
- Singh, S.K.; Srinivasan, K.; Chakraborty, D. Acoustic emission studies on metallic specimen under tensile loading. Mater. Des. 2003, 24, 471–481. [Google Scholar] [CrossRef]
- Baudouin, P.; Houbaert, Y. The study of a uniaxial deformation effect on the magnetic properties of a non-oriented electrical steel using acoustic emission characterization. J. Magn. Magn. Mater. 2002, 246, 247–253. [Google Scholar] [CrossRef]
- Hao, S.; Ramalingam, S.; Klamecki, B. Acoustic emission monitoring of sheet metal forming: Characterization of the transducer, the work material and the process. J. Mater. Process. Technol. 2000, 101, 124–136. [Google Scholar] [CrossRef]
- Carolan, T.A.; Kidd, S.R.; Hand, D.P.; Wilcox, S.J.; Wilkinson, P.; Barton, J.S.; Jones, J.D.C.; Reuben, R.L. Acoustic emission monitoring of tool wear during the face milling of steels and aluminium alloys using a fibre optic sensor. Part 2: Frequency analysis. Proc. Inst. Mech. Eng. Part B J. Eng. Manuf. 1997, 211, 311–319. [Google Scholar] [CrossRef]
- Dunegan, H.; Harris, D.; Teleman, A. Detection of fatigue crack growth by acoustic emission techniques. Ultrasonics 1971, 9, 124. [Google Scholar] [CrossRef]
- Palmer, I.; Heald, P. The application of acoustic emission measurements to fracture mechanics. Mater. Sci. Eng. 1973, 11, 181–184. [Google Scholar] [CrossRef]
- Mukhopadhyay, C.; Jayakumar, T.; Raj, B.; Ray, K. The influence of notch on the acoustic emission generated during tensile testing of nuclear grade AISI type 304 stainless steel. Mater. Sci. Eng. A 2000, 276, 83–90. [Google Scholar] [CrossRef]
- Radon, J.; Pollock, A. Acoustic emissions and energy transfer during crack propagation. Eng. Fract. Mech. 1972, 4, 295–310. [Google Scholar] [CrossRef]
- Muralidhara, S.; Prasad, B.R.; Eskandari, H.; Karihaloo, B. Fracture process zone size and true fracture energy of concrete using acoustic emission. Constr. Build. Mater. 2010, 24, 479–486. [Google Scholar] [CrossRef]
- Wu, S.; Ge, H.; Wang, X.; Meng, F. Shale failure processes and spatial distribution of fractures obtained by AE monitoring. J. Nat. Gas Sci. Eng. 2017, 41, 82–92. [Google Scholar] [CrossRef]
- Sagar, R.V.; Prasad, B.R. An experimental study on acoustic emission energy as a quantitative measure of size independent specific fracture energy of concrete beams. Constr. Build. Mater. 2011, 25, 2349–2357. [Google Scholar] [CrossRef]
- Lindley, T.; Palmer, I.; Richards, C. Acoustic emission monitoring of fatigue crack growth. Mater. Sci. Eng. 1978, 32, 1–15. [Google Scholar] [CrossRef]
- Bassim, M.; Houssny-Emam, M. Acoustic emission during the low cycle fatigue of AISI 4340 steel. Mater. Sci. Eng. 1984, 68, 79–83. [Google Scholar] [CrossRef]
- Hartbower, C.E.; Morais, C.F.; Reuter, W.G.; Crimmins, P. Acoustic emission from low-cycle high-stress-intensity fatigue. Eng. Fract. Mech. 1973, 5, 765–789. [Google Scholar] [CrossRef]
- Shehadeh, M.F.; Abdel Geliel, M.; El-Araby, A. Buckling detection within subsea pipeline laying using Acoustic Emission technique. In Proceedings of the 29th European Conference on Acoustic Emission Testing (EWGAE), Vienna, Austria, 8–10 September 2010. [Google Scholar]
- Abdel-Geliel, M.; Shehadeh, M.F.; El-Araby, A. Pipeline bending detection using Acoustic Emission system. In Proceedings of the 17th International congress on sound and vibration (ICSV), Cairo, Egypt, 18–22 July 2010. [Google Scholar]
- Shehadeh, M.; Elghamry, M.; Steel, J.A.; Reuben, R.L. AE source location in long steel pipes using cross-correlation and wavelet transforms. In Proceedings of the 17th Congress of Condition Monitoring and Diagnostic Engineering Management, COMADEM, Cambridge, UK, 2–5 July 2004; pp. 250–259. [Google Scholar]
- Shehadeh, M.; Steel, J.A.; Reuben, R.L. Acoustic Emission Source Location for Steel Pipe and Pipeline Applications: The Role of Arrival Time Estimation. Proc. Inst. Mech. Eng. Part E J. Process. Mech. Eng. 2006, 220, 121–133. [Google Scholar] [CrossRef]
- Shehadeh, M.F.; Elbatran, A.H.; Mehanna, A.; Steel, J.A.; Reuben, R.L. Evaluation of Acoustic Emission Source Location in Long Steel Pipes for Continuous and Semi-continuous Sources. J. Nondestruct. Eval. 2019, 38, 40. [Google Scholar] [CrossRef]
- Zhang, L.; Enpei, C.; Okudan, G.; Ozevin, D. Phased Acoustic Emission Sensor Array for Determining Radial and Axial Position of Defects in Pipe-like Structures. J. Acoust. Emiss. 2019, 36, 1–2. [Google Scholar]
- Miller, A. Review of limit loads of structures containing defects. Int. J. Press. Vessel. Pip. 1988, 32, 197–327. [Google Scholar] [CrossRef]
- British Standard. Guidance on Methods for Assessing the Acceptability of Flaws in Metallic Structures. BS 7910; British Standard Institution: London, UK, 1999; pp. 157–165. [Google Scholar]


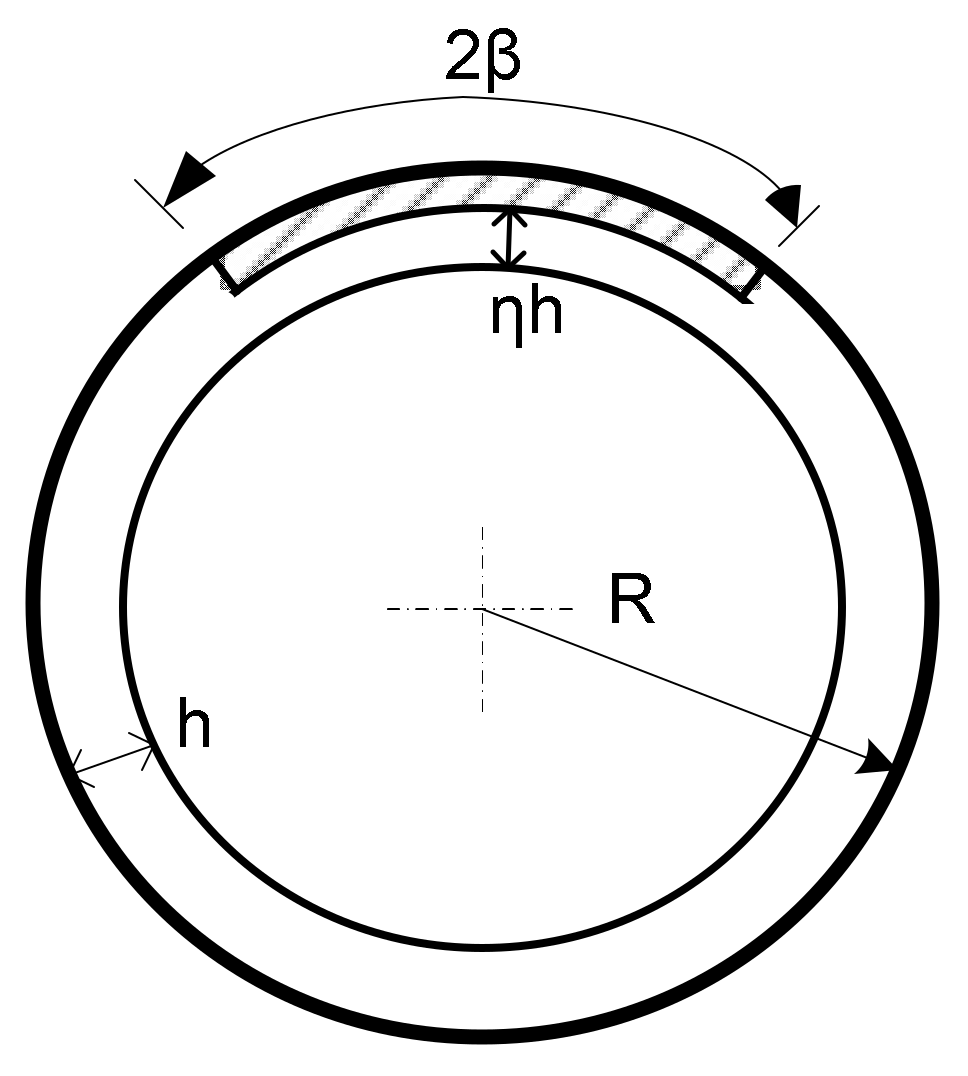
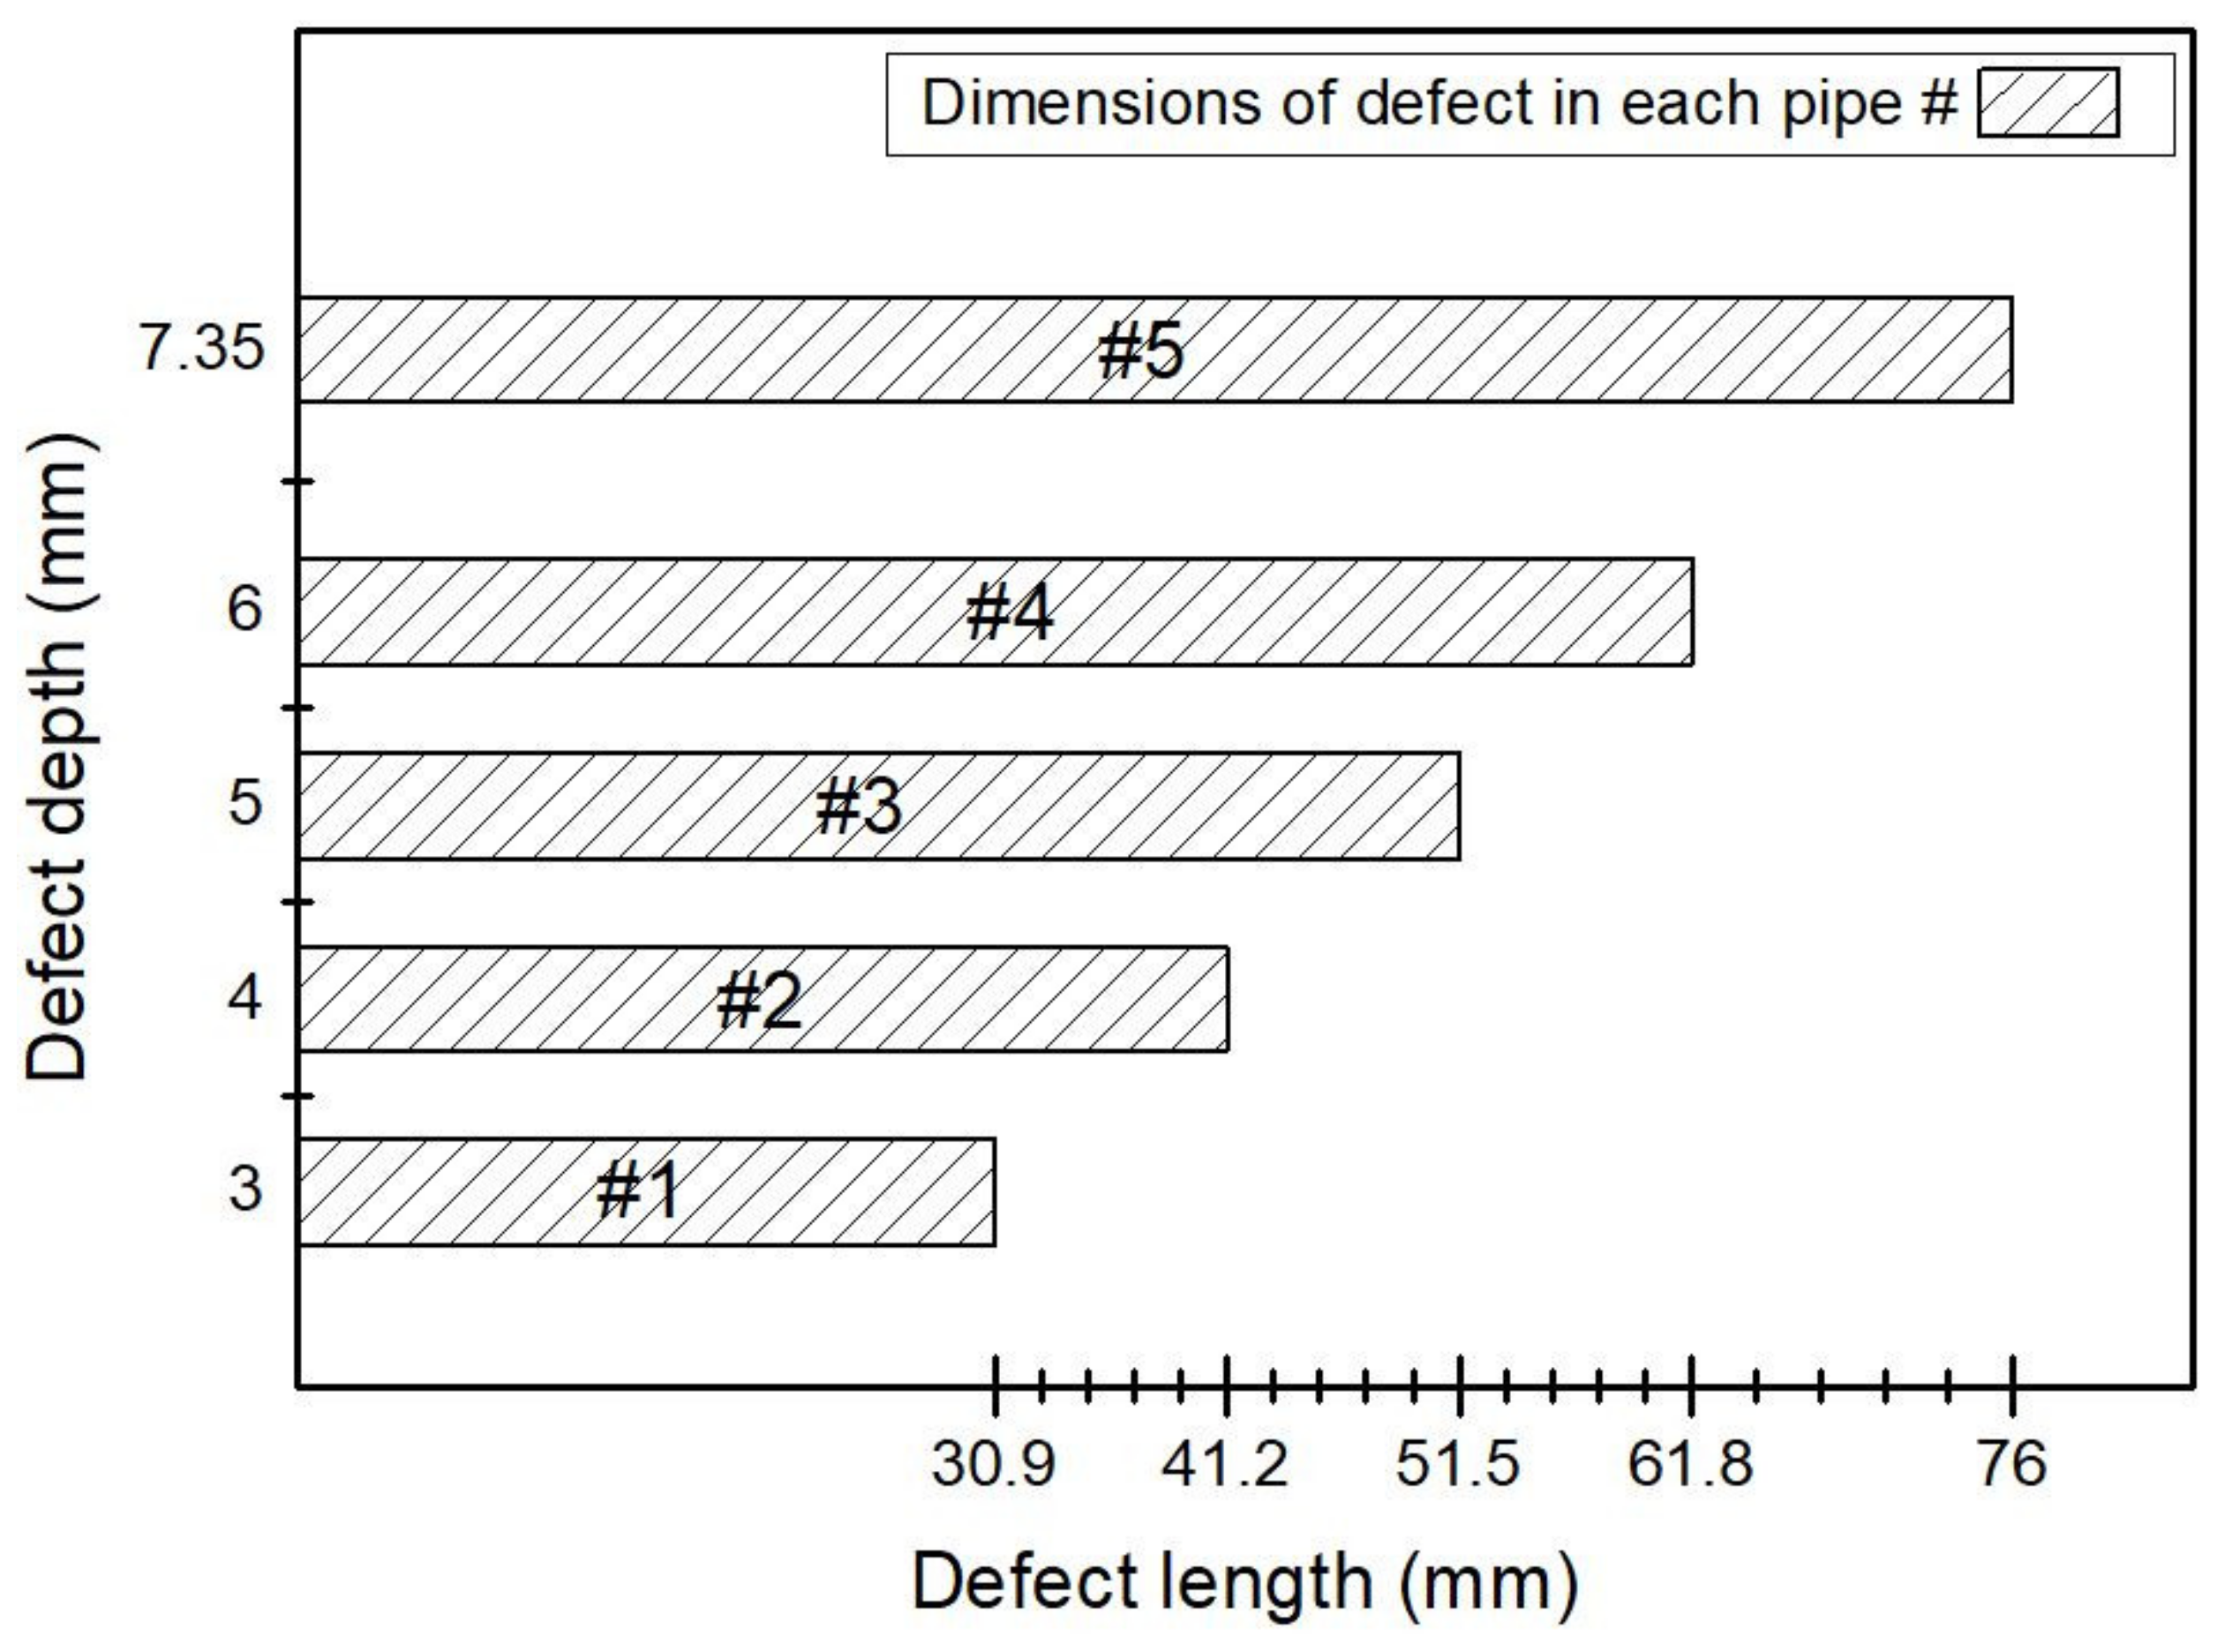
| Pipe Number | Collapse Moment (kN·m) | Ligament Length (mm) | ηh (mm) |
|---|---|---|---|
| 1 | 4.75 | 30.90 | 4.35 |
| 2 | 4.17 | 41.20 | 3.35 |
| 3 | 3.47 | 51.50 | 2.35 |
| 4 | 2.95 | 61.80 | 1.35 |
| 5 | 1.13 | 76.00 | 0.00 |
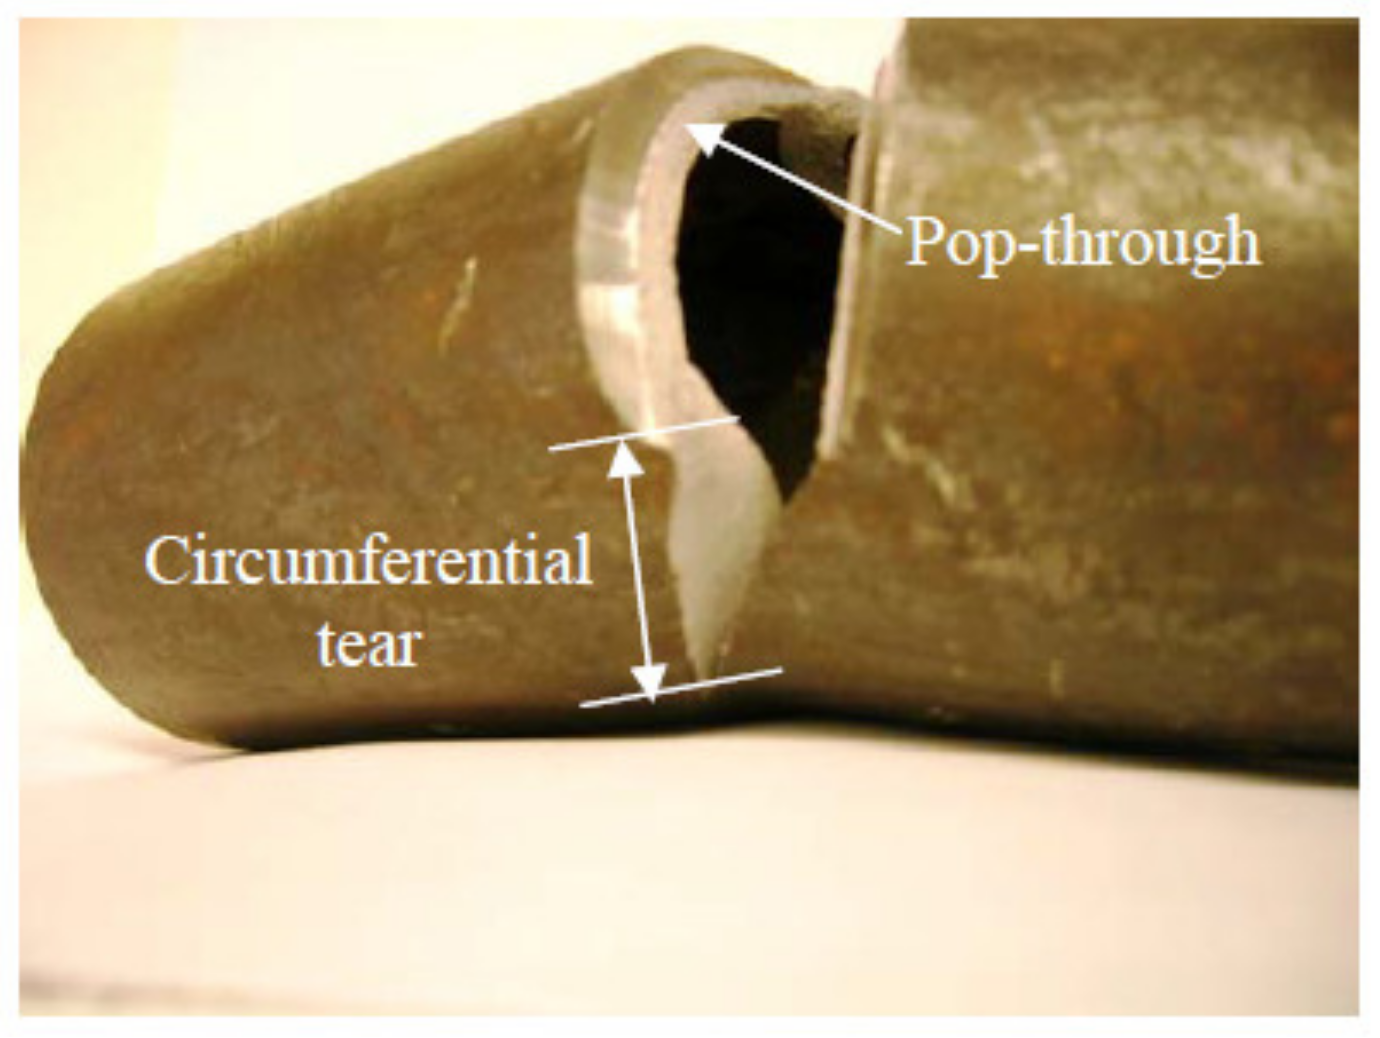
| Pipe 1 | Pipe 2 | Pipe 3 | Pipe 4 | Pipe 5 | |
|---|---|---|---|---|---|
| Pop-through | 8.22 | 3.9 | 1.9 | 0.6 | - |
| Circumferential tearing | 65.5 | 34.7 | 19 | 5.4 | 0.9 |
Publisher’s Note: MDPI stays neutral with regard to jurisdictional claims in published maps and institutional affiliations. |
© 2021 by the authors. Licensee MDPI, Basel, Switzerland. This article is an open access article distributed under the terms and conditions of the Creative Commons Attribution (CC BY) license (http://creativecommons.org/licenses/by/4.0/).
Share and Cite
Shehadeh, M.; Osman, A.; Elbatran, A.A.; Steel, J.; Reuben, R. Experimental Investigation Using Acoustic Emission Technique for Quasi-Static Cracks in Steel Pipes Assessment. Machines 2021, 9, 73. https://doi.org/10.3390/machines9040073
Shehadeh M, Osman A, Elbatran AA, Steel J, Reuben R. Experimental Investigation Using Acoustic Emission Technique for Quasi-Static Cracks in Steel Pipes Assessment. Machines. 2021; 9(4):73. https://doi.org/10.3390/machines9040073
Chicago/Turabian StyleShehadeh, Mohamed, Ahmed Osman, Aly Abdelbaky Elbatran, John Steel, and Robert Reuben. 2021. "Experimental Investigation Using Acoustic Emission Technique for Quasi-Static Cracks in Steel Pipes Assessment" Machines 9, no. 4: 73. https://doi.org/10.3390/machines9040073