1. Introduction
Petroleum is a mixture of organic compounds formed by the anaerobic decomposition of organic sediments in natural geological cavities or wells. The extraction techniques significantly modify its composition, adding an aqueous phase not miscible with the organic mixture and producing a complex emulsion [
1]. Water is a contaminant in all oil derivatives, decreasing the quality of the resulting fuels [
2], also implying higher pollution, which is a hindrance to the processes of transport, storage, and distillation. In addition, the water carries a wide variety of mineral solutes (sea salt, magnesium, and silicon, mainly) that damage pipes, valves, and pumps. The water is withdrawn from the raw oil, inducing coalescence, a process that consists of merging two or more droplets during contact to form a larger droplet [
3,
4]. This process may be enhanced by chemical substances. The final water content is a critical parameter in the subsequent petrochemical processing.
Characterization techniques for emulsions include electron and light microscopy, light and neutron scattering, electrical conductivity, and nuclear magnetic resonance [
5,
6]. Most of these techniques are only suitable for diluted and non-opaque emulsions, conditions not met by water-in-crude oil emulsions [
6]. Other common methods for determining water content in crude oil, such as centrifugation [
7], Karl Fisher’s distillation, and grinding methods [
8], require extracting a sample from the pipeline for further processing in a laboratory. These laboratory tests are time consuming and delay the processing and transportation of crude oil.
The real-time monitoring of water concentration before and after the coalescence process is of particular interest to the petrochemical industry [
1]. Ultrasound can be useful for characterizing emulsions because it is robust, relatively inexpensive, easy to operate, allows characterizing opaque liquids and it provides in-line and real-time monitoring of emulsion stability evolution using a multi-backscattering sensor [
9] and sand production monitoring using a wideband vibration sensor [
10]. Ultrasound-based techniques have been used for characterizing liquids, such as edible oils, honey, polymer resins and motor oils [
11,
12,
13], as well as for process monitoring, such as polymer and concrete curing [
14,
15]. As regards wave generation and reception methods, the literature reports the use of compact thick-film piezoelectric transducers [
16], laser techniques for both the generation and reception of ultrasonic pulses [
17] and conventional ultrasonic transducers [
18].
In the case of multi-phase fluids, ultrasonic techniques have been used to characterize and to monitor some physical properties of emulsions, suspensions and slurries [
19,
20,
21]. Other interesting works deal with the monitoring of a multiphase oil-water-gas flow directly in a pipe [
18] and the detection of oily contaminants in water courses [
22]. These works show the interest in the subject and the variety of possible approaches.
Water-in-crude oil emulsions showed a water concentration in a volume of
for droplet size distribution ranging from 0.4
m to 40
m [
23] and a water concentration in a volume of up to
for droplet size distribution from 1
m to 10
m [
1,
5]. This characteristic, in addition to a high variation in their chemical composition, could lead to a dispersive medium with high attenuation. Under these conditions, the best approach must be the monitoring of an average acoustic parameter at a suitable operating frequency. Ultrasonic spectroscopy allows the determination of the distribution of droplet sizes and concentration by measuring the propagation velocity and attenuation spectra [
24,
25]. This is a well-established technique, useful in monomodal droplet size distribution, and restricted to diluted emulsions (volume fraction of the dispersed phase is less than
) [
26]. In a recent work [
27], the authors used acoustic models and measured attenuation spectra to estimate the droplet size distribution in water-in-sunflower oil emulsions. They reported droplet size distributions of 0.4–5, 0.4–8, 0.4–15, 0.4–12 and 0.4–100
m for water volume fractions of 0.1, 0.2, 0.3, 0.4 and 0.5, respectively. The droplet size distribution results of the ultrasonic spectroscopy for emulsions of moderate concentrations up to 20% were very close to the experimental data obtained by using laser diffraction.
The measurement of the propagation velocity of ultrasonic waves has been used to infer the physical properties of water-in-crude oil emulsions. In 2021, a novel multi-backscattering sensor with a simple signal processing methodology, which allows the measurement of the propagation velocity, was proposed to monitor water-in-crude-oil emulsions [
28]. The ultrasonic multiple-backscattering sensor consists of a 3.5-MHz transducer and a set of thin cylindrical scatterers located in the near field. The results from this experimental arrangement showed an almost linear behavior of the propagation velocity over a volumetric water concentration from
to
. This interesting result was corroborated in the present work.
This paper presents an ultrasonic technique to estimate water concentration in water-in-crude oil emulsions. The working principle is the determination of the time of flight of ultrasonic waves between two custom-made transducers. The sensing device developed was initially tested with static samples to establish the measurement methodology. Other measurements were carried out with the sample being stirred by a laboratory mixer. This was done to maximize the droplet interaction, accelerating the coalescence process. The main motivation is the development of compact, inexpensive, and chemically and mechanically resistant devices, which could be attached to pipes or valves in the oil process lines for on-line and real-time monitoring.
2. Theoretical Background
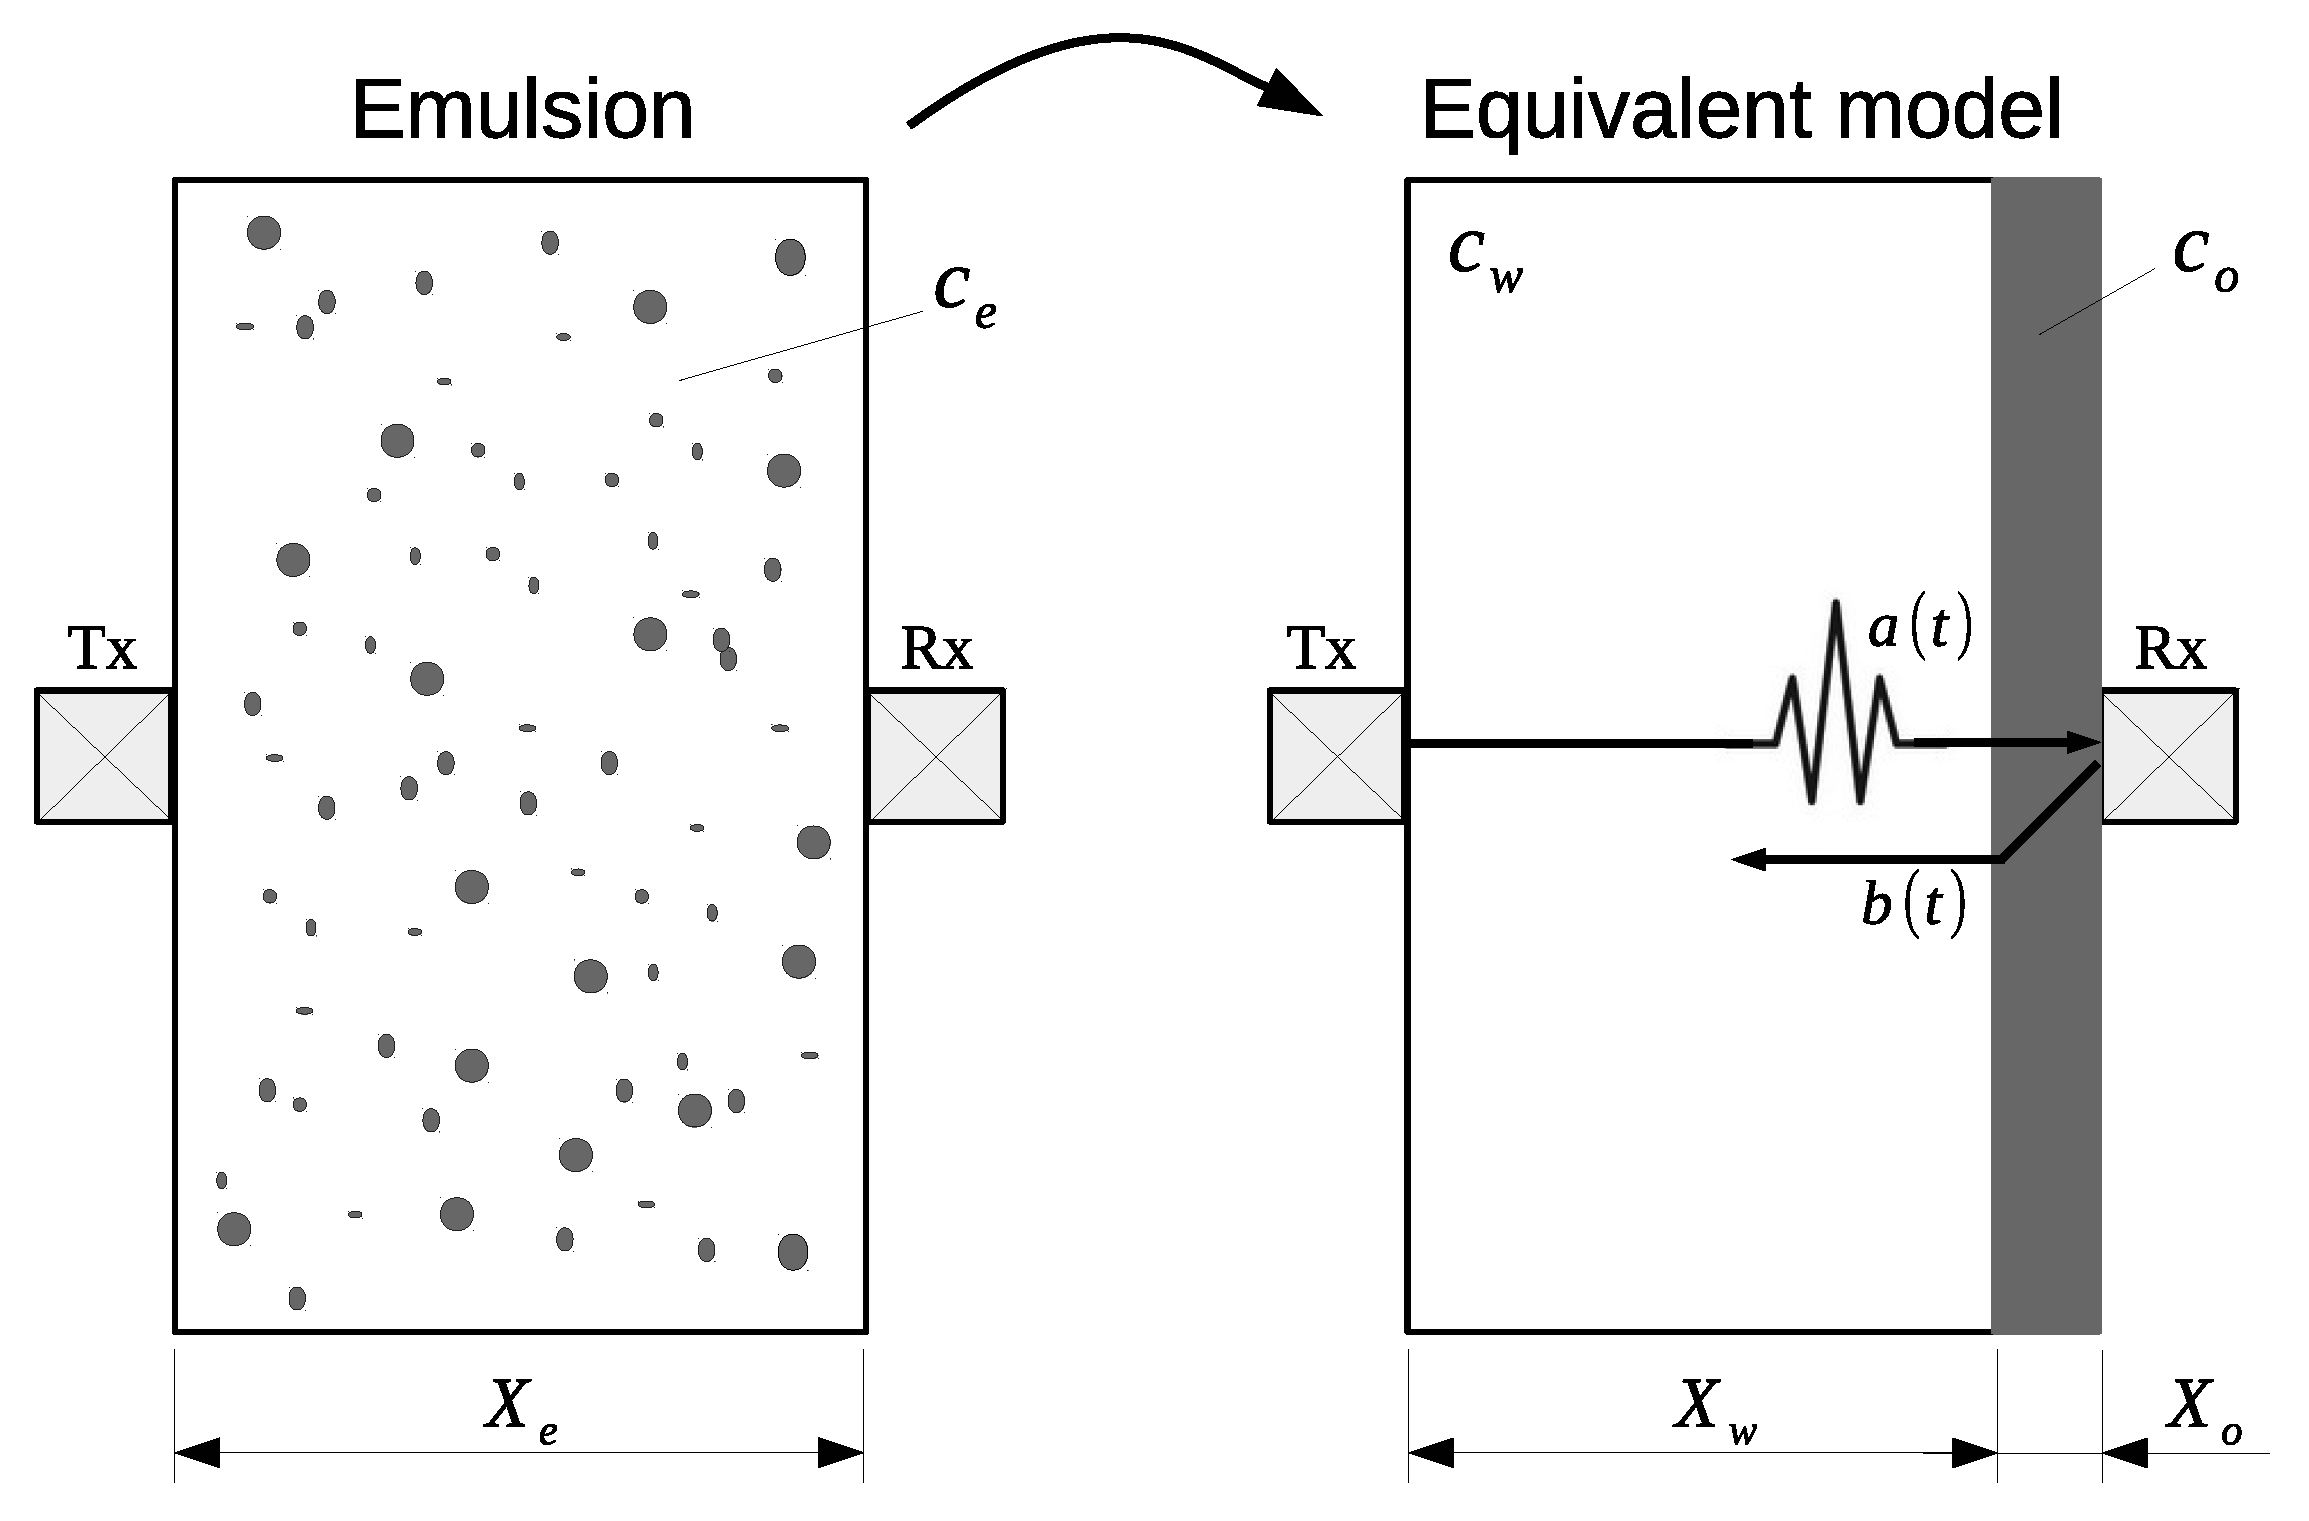
Although emulsions are classified as continuous materials, they have local effects that generate a complex acoustic behavior. If the mean diameter of the dispersed phase droplets is smaller than the wavelength, the local acoustic phenomena converge to a wavefront traveling through the mixture with constant velocity. In this case, a simple acoustic propagation model relates the propagation velocity and the concentration, establishing that the total propagation time of an ultrasonic wave through a heterogeneous mixture is the sum of the times in each phase [
29] (see
Figure 1):
where
t is the propagation time,
X is the wave path length,
c is the propagation velocity and subscripts
e,
w and
o refer to emulsion, water and oil, respectively. The relationship between propagation velocity
c in the emulsion and water volume fraction
is:
Figure 1 also shows the ultrasonic transducer arrangement, composed of an emitter/receiver (Tx) and a receiver (Rx) and reflector. Transducer Tx is used in pulse-echo mode while transducer Rx operates as a receiver. The excitation of Tx generates wave
that propagates through the sample and reaches Rx. The part of the wave reflected from the Rx face generates signal
, which returns to Tx. This configuration allows the correlation of
a(
t) and
b(
t) with a shortest path (
) between them and minimizes the insertion loss reflections by using other materials (steel or aluminum). As distance
is known, time delay
between signals
and
allows the determination of propagation velocity
in the emulsion.
3. Materials and Methods
3.1. Ultrasonic Probe
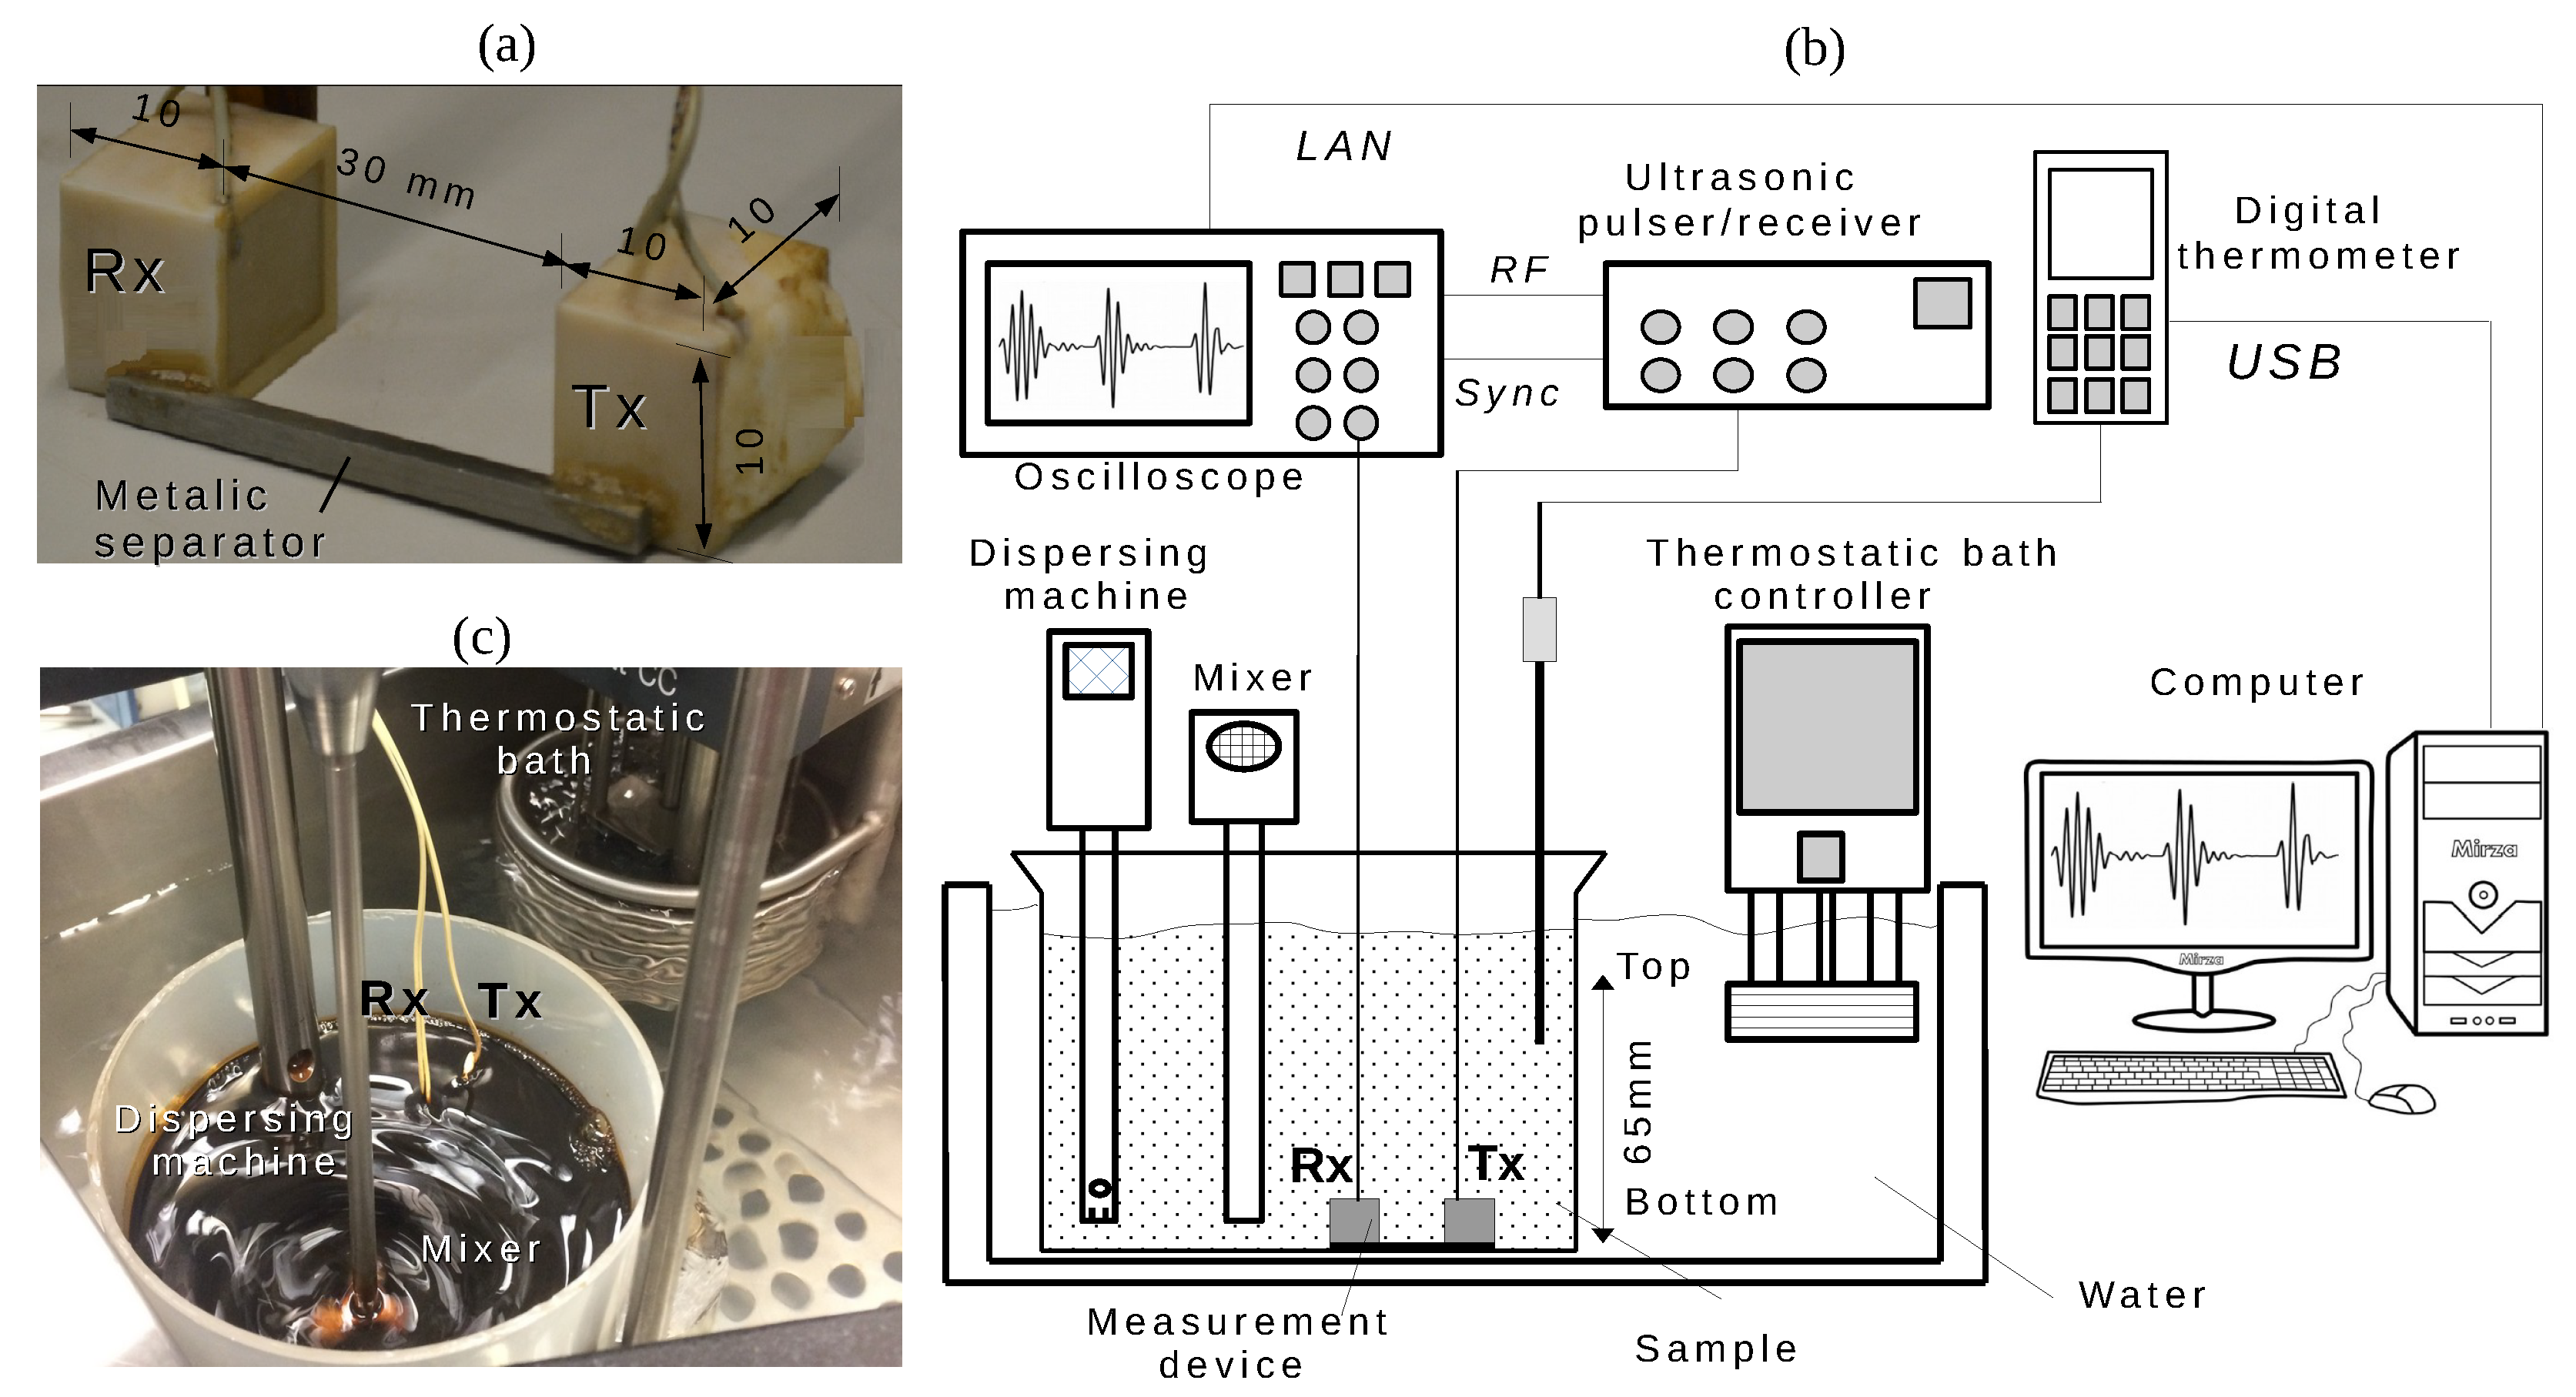
The measurement probe, shown in
Figure 2a, was manufactured using two square piezoelectric ceramics (10 mm sides and
mm thickness) of Pz37 (Ferroperm Piezoceramics A/S, Kvistgard, Denmark). The resulting transducers were tuned close to 3 MHz. Each probe transducer was manufactured in an ABS housing made in a 3D printer. The backing layer was made of epoxy resin (Araldite GY 279BR and Aradur HY 9BR, Huntsman, Brazil, in a ratio 10:1 by weight) mixed with alumina powder (1
m, Buehler, IL, USA) in a concentration of 30% by weight to increase the attenuation in the backing layer, avoiding the overlapping signals in reception and increasing the axial resolution. The matching layer was made with the same epoxy resin used in the backing layer, but without alumina powder, such that the matching was not complete. This way, the receptor can receive part of the energy but still reflect part of it to the emitter. There is a compromise here, because the pair of transducers can be used interchangeably (emitter or receptor). The matching layer thickness was approximately a quarter wavelength (
mm). The transducer elements were aligned with a metallic spacer to ensure good parallelism. The distance between the transducers was 30 mm, for acoustic echoes not to overlap when inserted into water. The propagation velocity in water is a well known property [
30,
31,
32,
33,
34]. Then, the ultrasonic sensor was calibrated using distilled water as a reference substance. The calibration provides a more accurate value of the distance between transducers Rx and Tx, which is required in the signal processing algorithm. Both transducers were tested in emission and in reception mode with slight differences in the measured delay.
3.2. Experimental Setup
Figure 2b shows a schematic representation of the experimental setup. The emitter transducer (Tx), working in pulse-echo mode, was connected to an ultrasonic pulser/receiver (Olympus Panametrics model 5077-PR, Waltham, MA, USA), and the receiver transducer (Rx) was directly connected to a channel of the oscilloscope. The digital oscilloscope (Agilent Technologies, model 5042, Santa Clara, CA, USA) was used to digitize the ultrasonic signals. The sample temperature was measured using a digital thermometer (DeltaOHM, model HD2107.2, Caselle di Selvazzano (PD), Italy). Both the oscilloscope and the digital thermometer were connected to a desktop computer allowing the simultaneous acquisition and storage of the ultrasonic signals and temperature via LAN network.
The temperature of the experiment was controlled by a thermostatic bath (Huber, CC-106A) with an accuracy of 0.1 °C. The emulsion was stored in an 800-mL beaker partially immersed in the thermostatic bath. The ultrasonic sensor and the thermometer were inserted into the beaker. For homogenizing the emulsion, a dispersing machine (IKA Labortechnick, model T25, Staufen, Germany) was used at 8600 rpm. In addition, a 200-rpm mixer (Fisatom, model 711, São Paulo—SP, Brazil) was used to agitate the sample when measurements with moving fluid were desired. The mixer and emulsifier blades were completely inserted in the fluid to reduce the effect of air bubbles.
Figure 2c shows an image of the experiment in the thermostatic bath. The sample can be seen spinning by the action of the mixer.
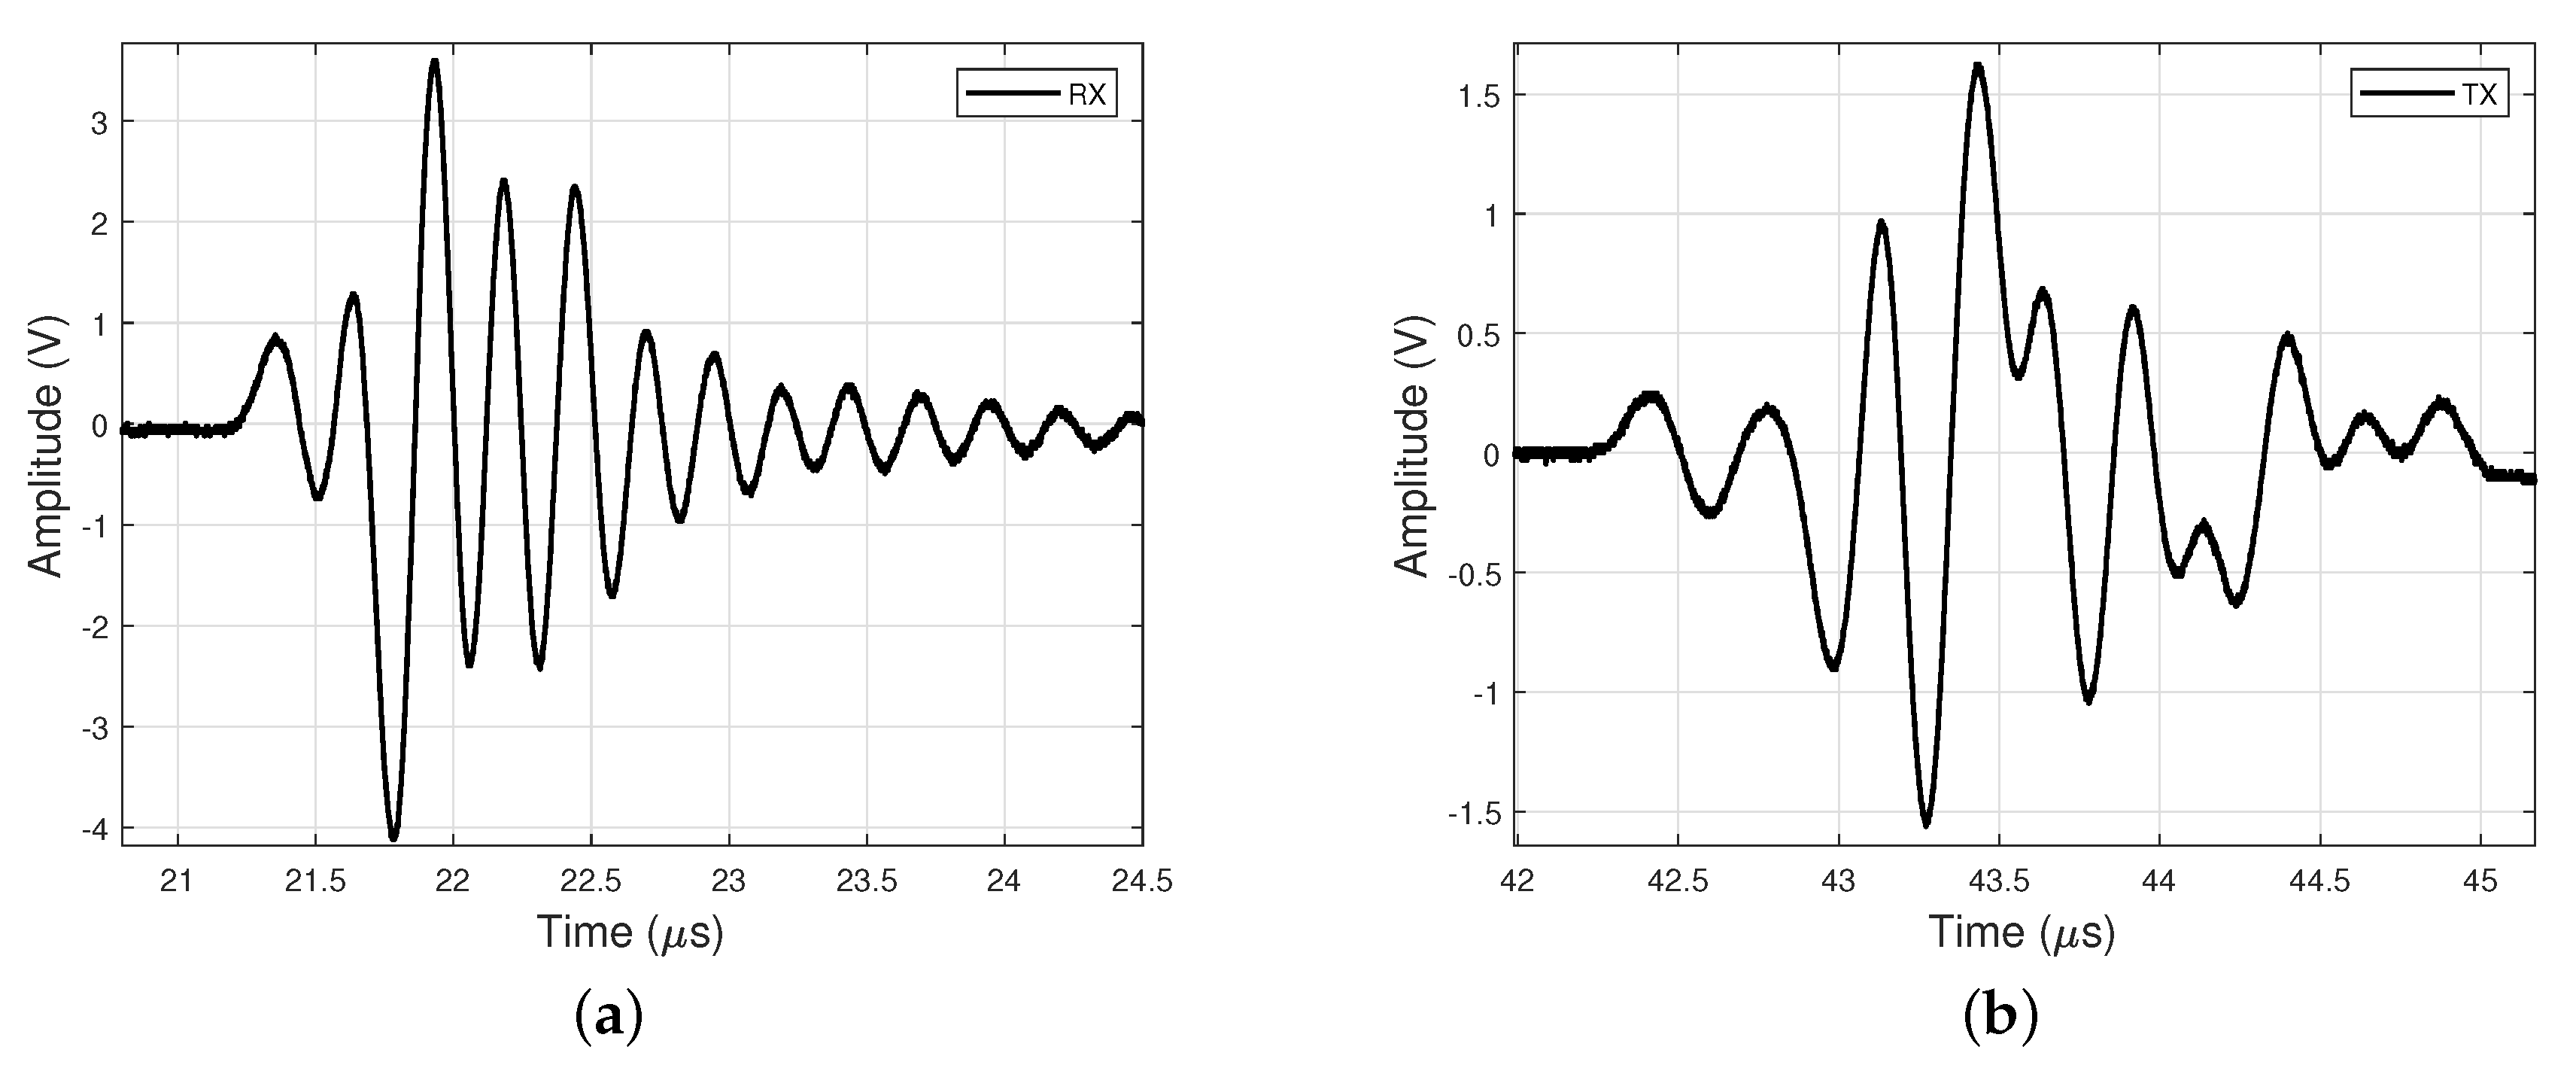
Figure 3 shows the waveforms of the ultrasonic pulses received by both the Rx and Tx transducers in pure water. The signal received by Tx has a different waveform and has a lower amplitude when compared to the signal received by Rx. The lower amplitude can be attributed to the energy loss inside transducer Rx, which is a good receiver. Reverberation inside the transducer layers results in a set of signals that are added to produce the distorted waveform reflected by Rx and received by Tx.
Salt-water mixtures of different concentrations were used to test the measurement setup. The tests were carried out at 25 °C and the results were compared with others reported in the literature [
30]. In the experiment, successive concentrations were obtained by adding 5 g of salt to a solution previously prepared. It started with 300 g of water and ended by achieving a salt concentration of
by weight. The solutions for each concentration were mixed for 150 s to completely dissolve the salt. At rest, ultrasonic signals were acquired to determine the propagation velocity of each solution. This procedure was repeated three times, and the averages and standard deviations of the propagation velocities were obtained.
3.3. Experimental Procedure
In petrochemical processes, measurements are required under flow conditions. The flow can affect the path of the acoustic waves, distorting the recorded signals. Experiments carried out at rest and with stirring allow comparison of the stability of the measurements obtained in these conditions. In this work, the flow condition was simulated by a stirring impeller (mixer) with three blades of radius 30 mm placed inside a beaker of diameter of 150 mm. The angular velocity of the mixer was 200 rpm, a relatively low value to reduce the probability of cavitation in the sample, which could lead to the evaporation of the most volatile compounds in the crude oil.
The first experimental procedure used to test the emulsions started by pouring 300 mL of crude oil (30.5° API, well LL83, Mangaratiba, Petrobras, Brazil) into a beaker partially immersed in the thermal bath. The amount of water required for the desired concentration was added to the beaker. The dispersing machine (8600 rpm) was turned on for 80 s. Then, the mixture was left to stand for 40 s to minimize the effect of the heat and most air bubbles generated by the dispersing machine. The ultrasonic sensor was placed on the bottom of the beaker. Finally, 310 acquisitions, considering ultrasonic signals and temperature data, were taken during approximately 160 min. The measurement process was carried out for three water volume fractions () at 25 °C. All these measurements were repeated with the mixer turned on at 200 rpm.
For the concentration of
, the experiments were repeated with the emulsion samples at rest and in motion with the probe positioned close to the top surface of the emulsion (65 mm from the bottom of the beaker,
Figure 2b). For the signals to be acquired, the mixer was turned off for static measurements in the sample and turned on for moving measurements in the same sample.
To test a greater amount of concentration, a second experimental procedure was carried out. The measurements of water-in-crude oil emulsion were performed in the range of water volume fraction from 0 to 0.4 and three different temperatures (20, 25 and 30 °C). Each measurement was made after adding water to a previously prepared emulsion and turning on the dispersing machine for 80 s, obtaining a new concentration. The emulsification process of the samples, followed by a rest period, was the same as the first experimental procedure described above, but in this case, only 30 ultrasonic signals were acquired during 110 s. The measurements were repeated with the mixer turned on at 200 rpm. For each temperature, two samples were used for static acquisitions. After that, for each of the same three temperatures, two samples were used for dynamic acquisitions (mixer turned on at 200 rpm).
4. Results and Discussion
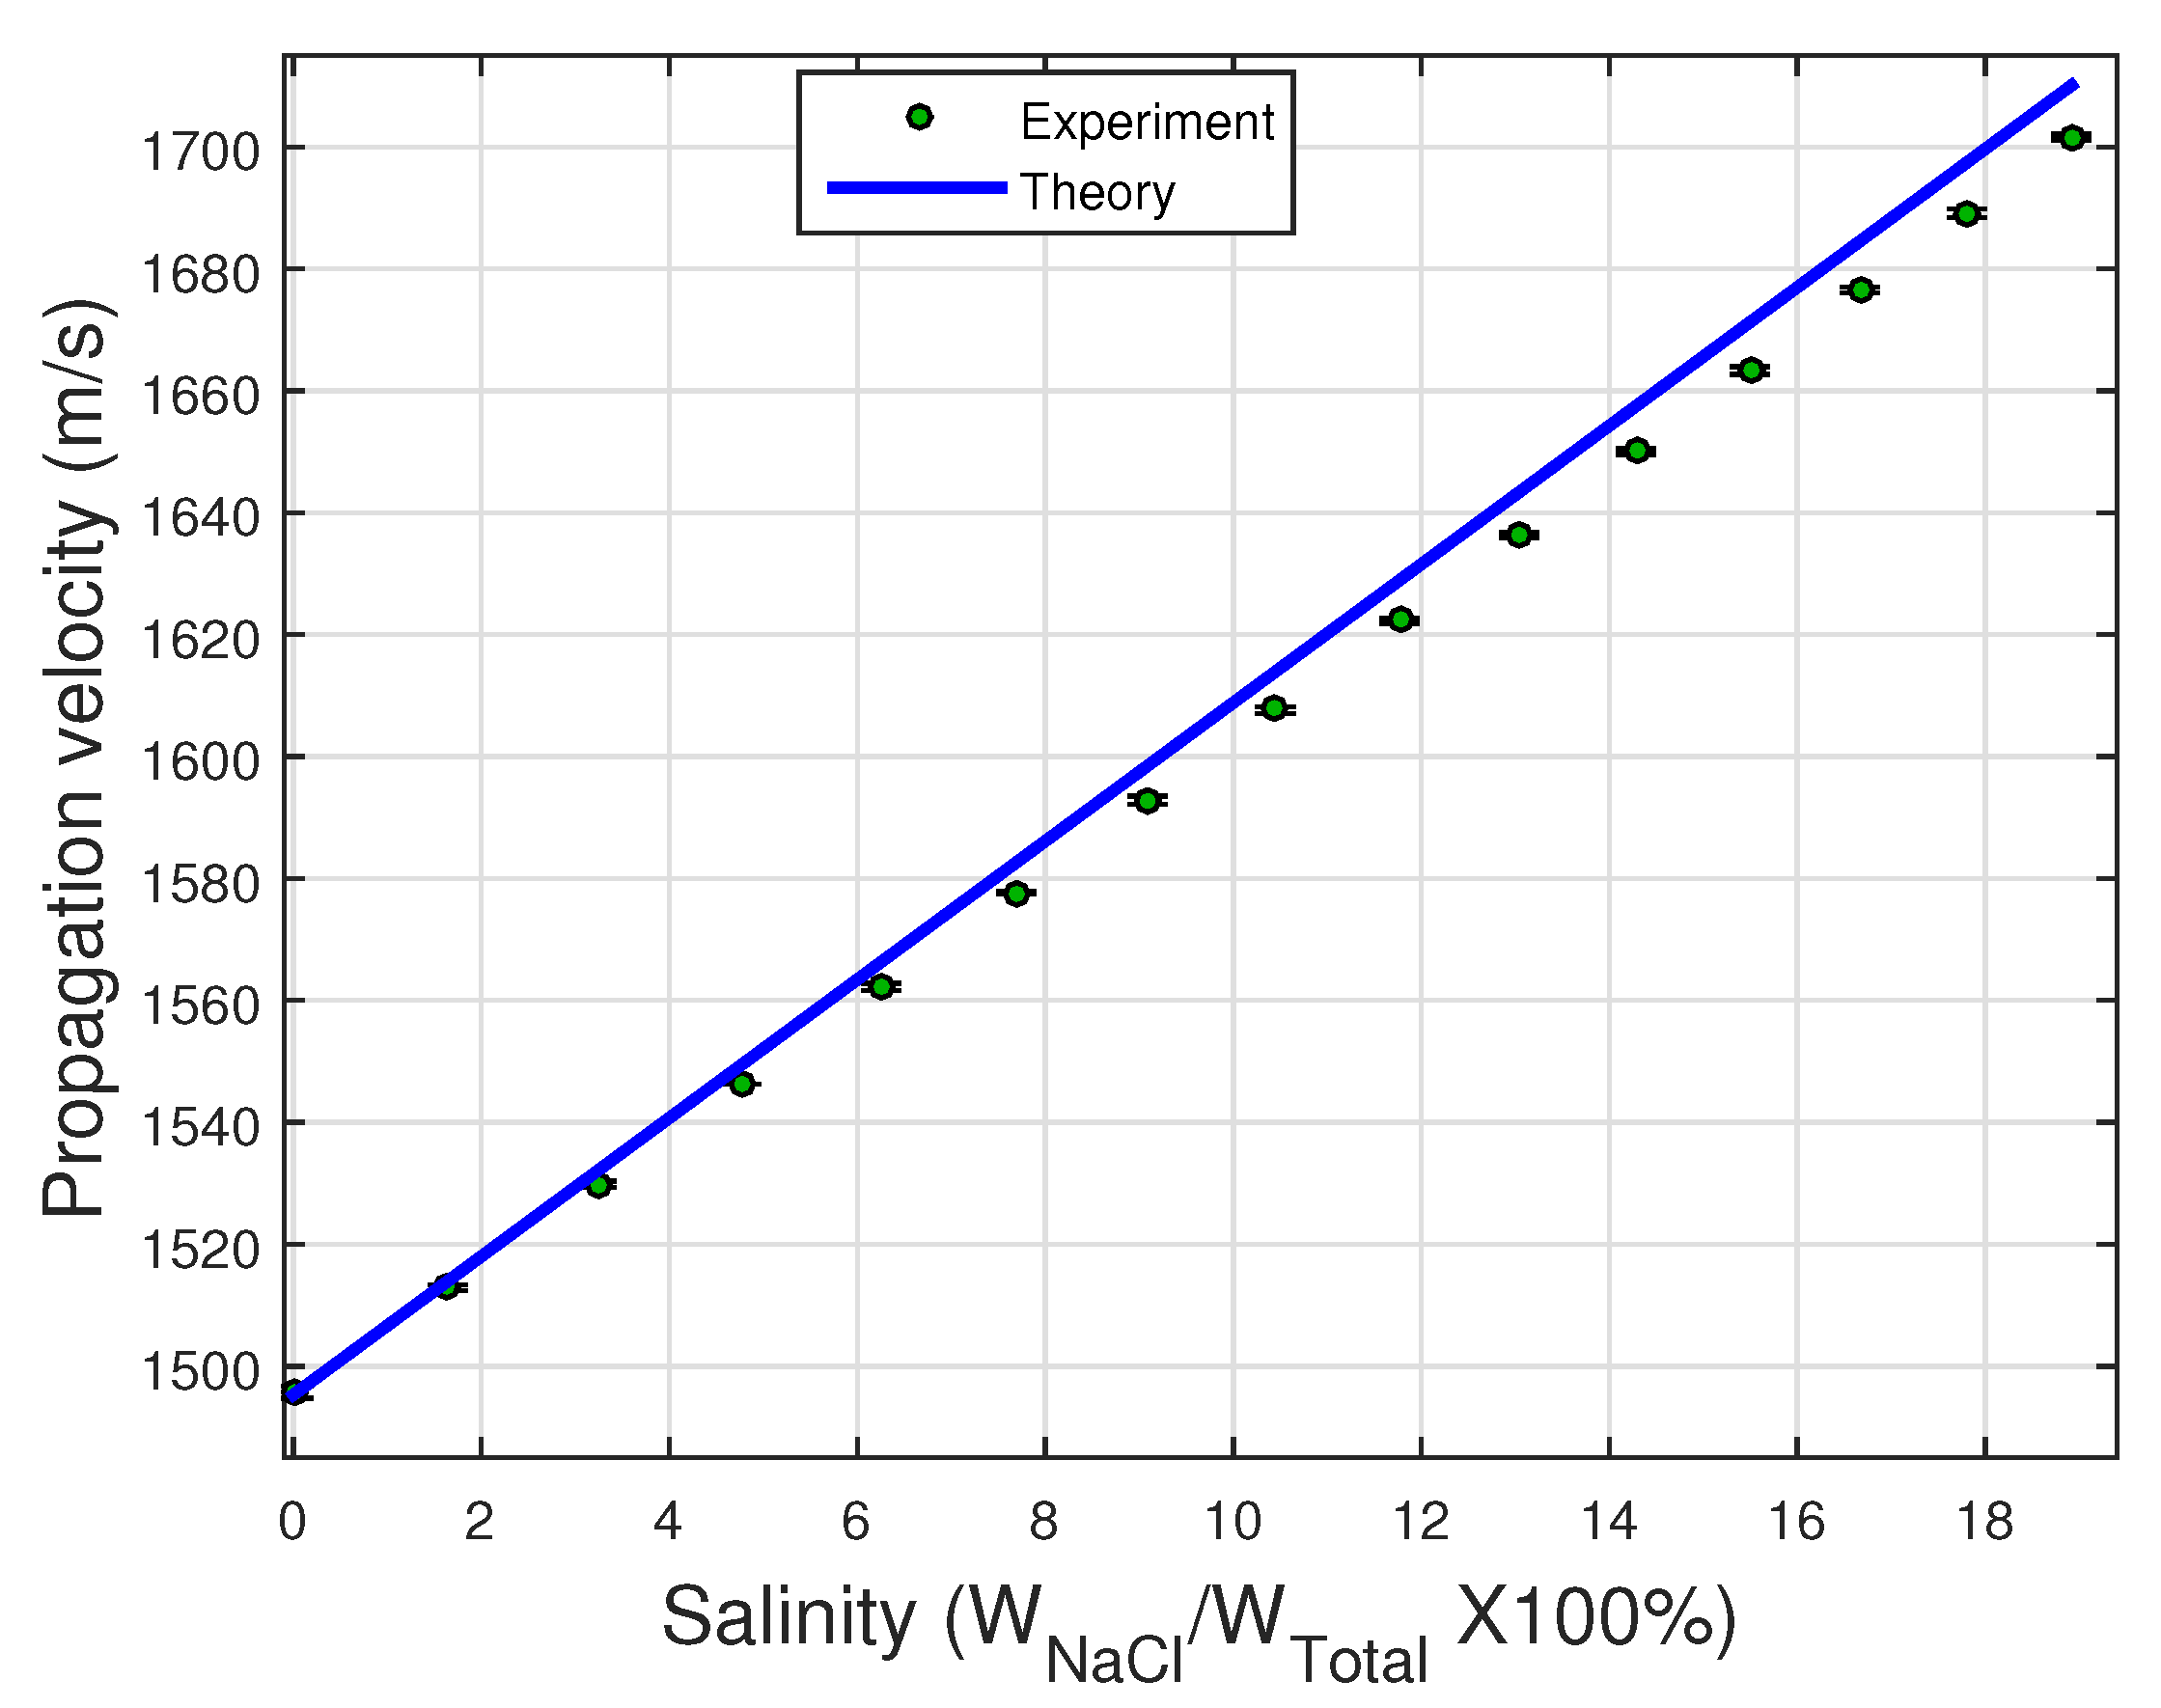
In
Figure 4, the propagation velocities measured for salt-water mixtures were plotted as a function of the salt concentration and were compared with the theoretical velocity curve [
35]. The measurements obtained by the ultrasonic sensor are in good agreement with the values in the literature [
30] and the standard deviation is small. The linear behavior of the propagation velocity as a function of salt content was confirmed. However, there is a difference in the slope, although the maximum deviation between the theoretical and experimental cases is 0.6% at the highest concentration (19% by weight). These results show the measurement technique has good agreement in the case of solutions.
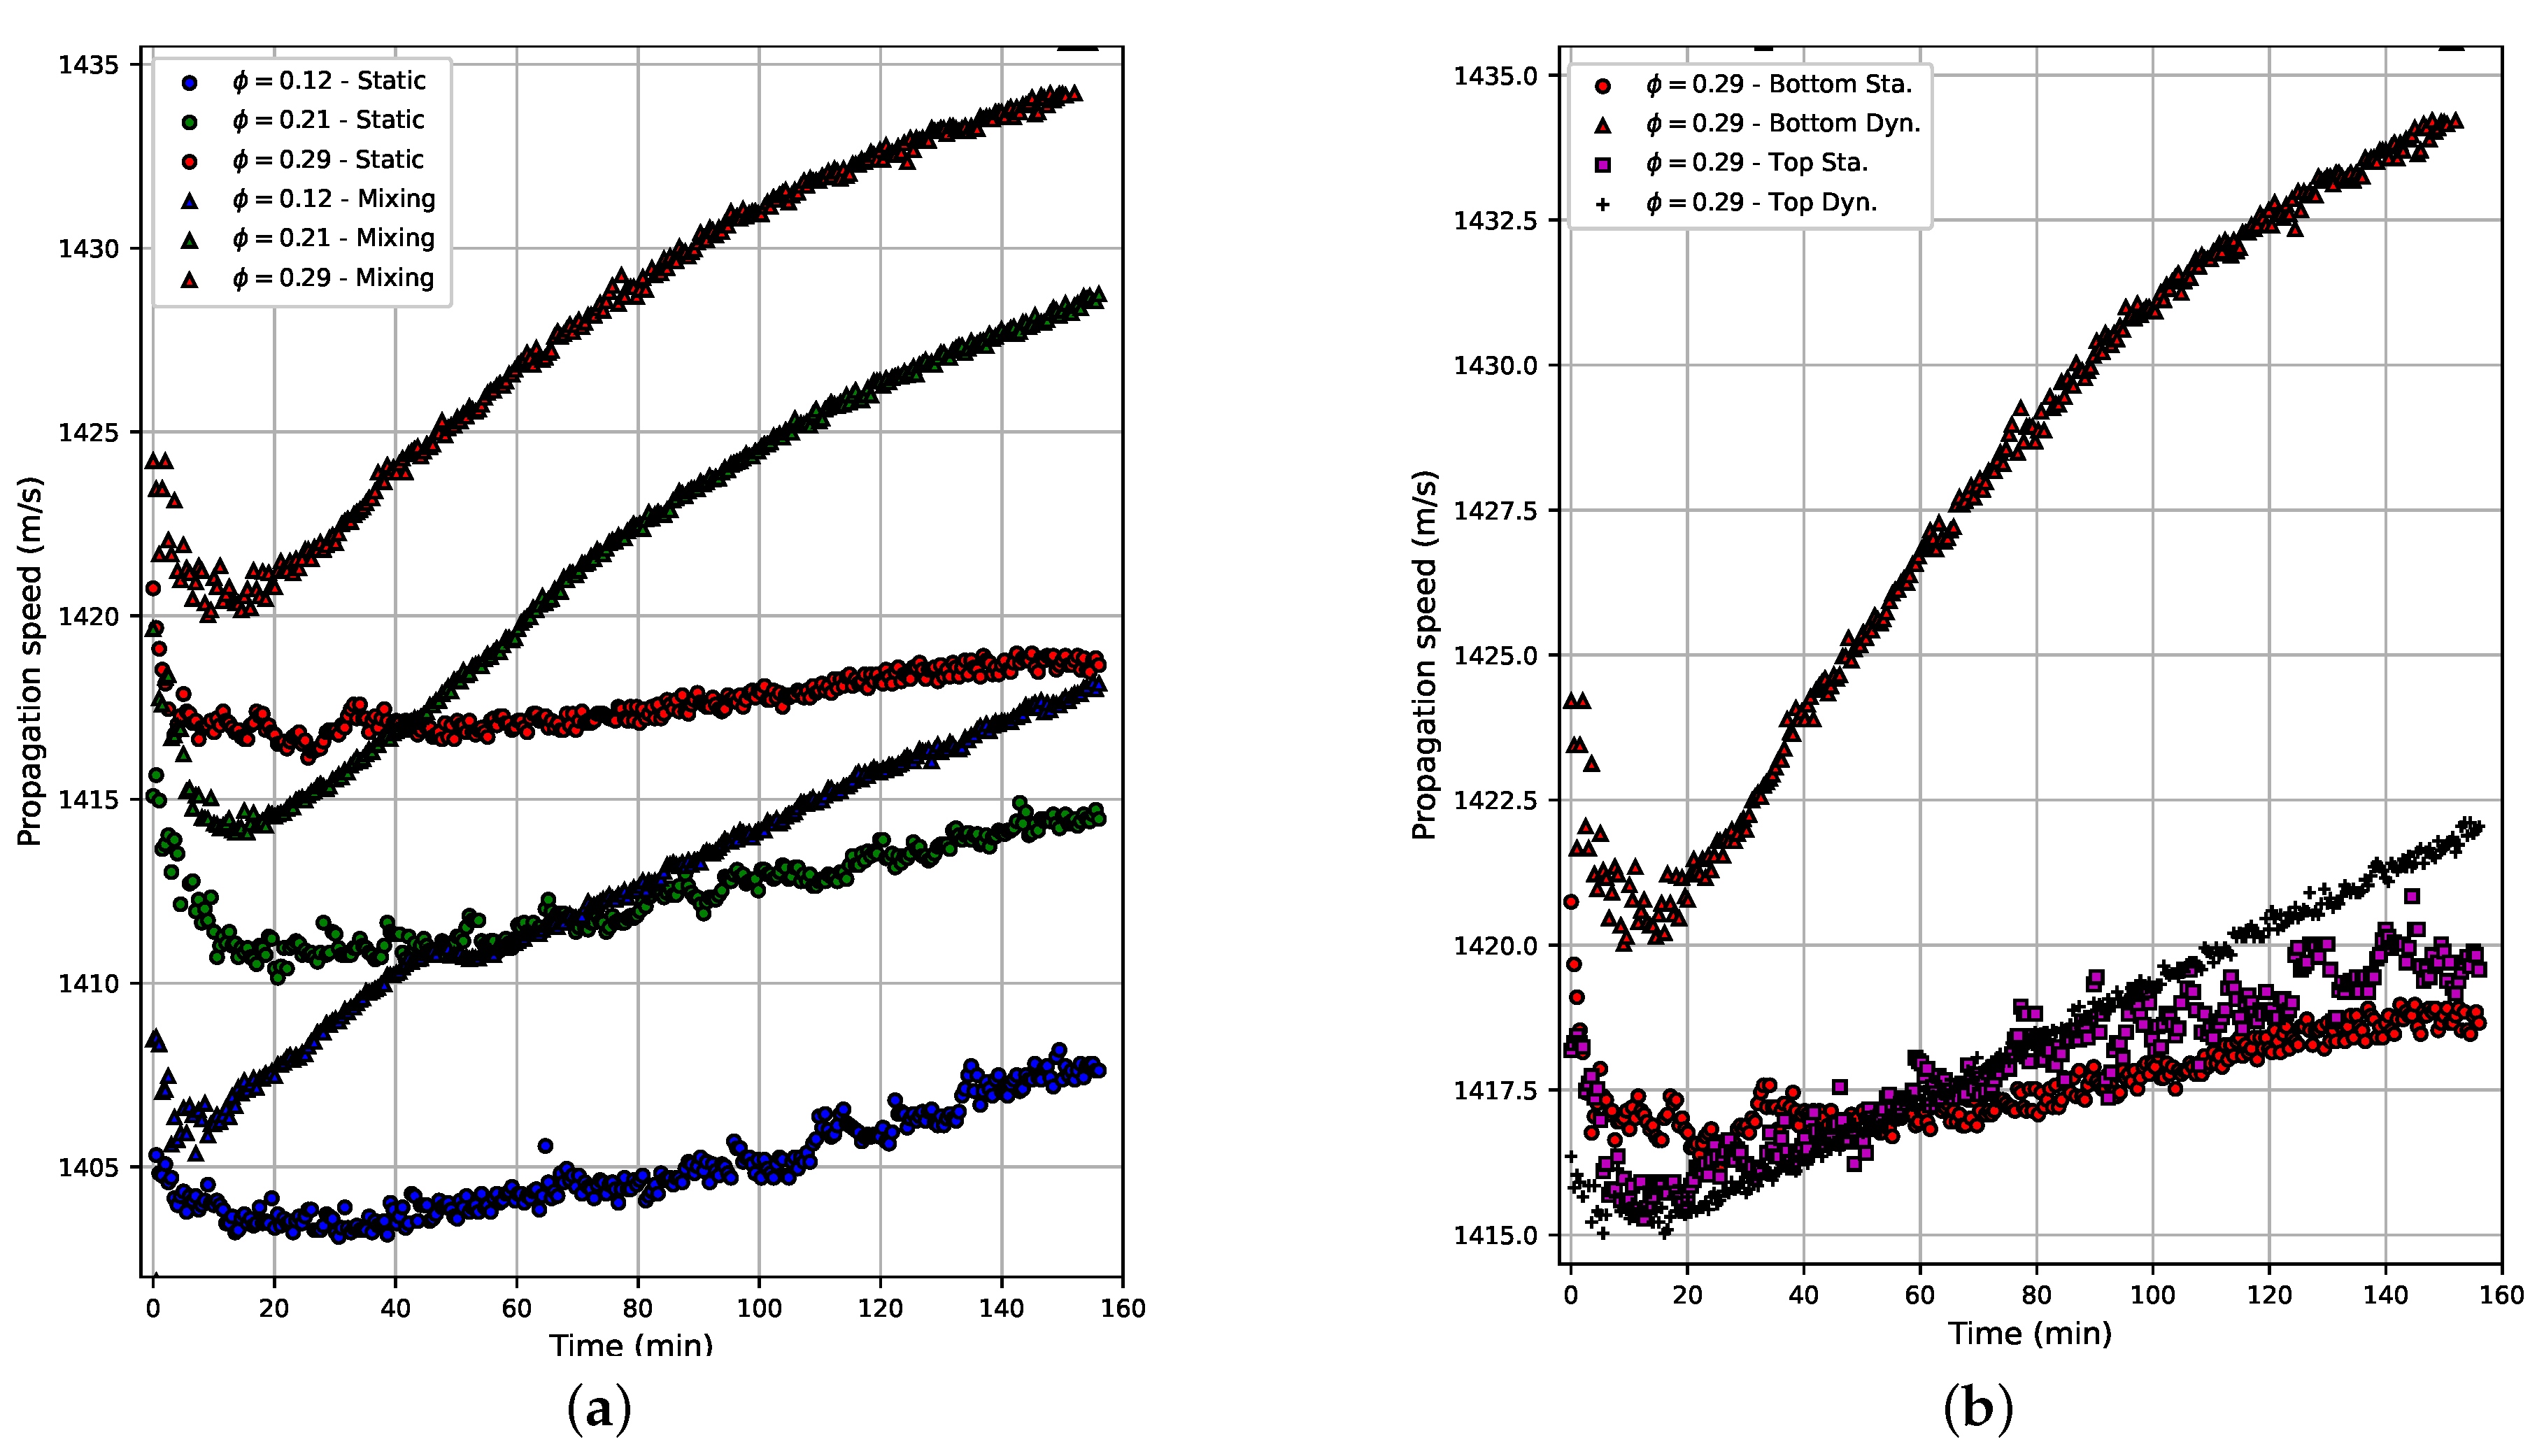
Figure 5a shows the propagation velocity in the emulsion as a function of the acquisition time. The acquisition time was 160 min, beginning when the rest time ends (40 s). The results for three concentrations (
) and for both the static and moving cases are shown. In all these cases, a reduction in propagation velocity is observed in the first 10–20 min. From the minimum value observed at the beginning of the curve, the velocity rises; at the end of the acquisition time, there is an increase of
and
for the static and moving cases, respectively. This increase in velocity is relatively small and can be explained by physical changes in the emulsion, mainly coalescence. The behavior is similar in all three concentrations. However, it is evident that a steady state value was not reached at the end of the acquisition time.
Figure 5b shows the propagation velocity as a function of the acquisition time for the transducer placed at the top (close to the free surface of the sample) and at the bottom of the beaker, and for static and moving cases. Measurements at the top and bottom of static and moving samples were performed using a water volume fraction of
. The results show that, in the static case, the propagation velocity curves are almost identical for both sensor positions, whereas in the case of the emulsion under stirring, the curves were different. When the sensor is located at the bottom of the container, the propagation velocity is slightly higher throughout the experiment. Furthermore, after the minimum value presented at the beginning of the curve, the propagation velocity value increases at a higher rate than in the other three cases and presents less dispersion than in the static case. When the sensor is located at the top, the curve is similar to that observed in the static case. The increase in velocity after the minimum value is linear and presents less dispersion.
The propagation velocity increased at a higher rate in the moving emulsion with the sensor located at the bottom of the container, when compared to the moving emulsion with the sensor located at the top. This happened due to the increase in coalescence. The movement of the emulsion increases the probability of the water droplets to collide and merge, generating larger water droplets that move towards the bottom of the container under the action of gravity [
36].
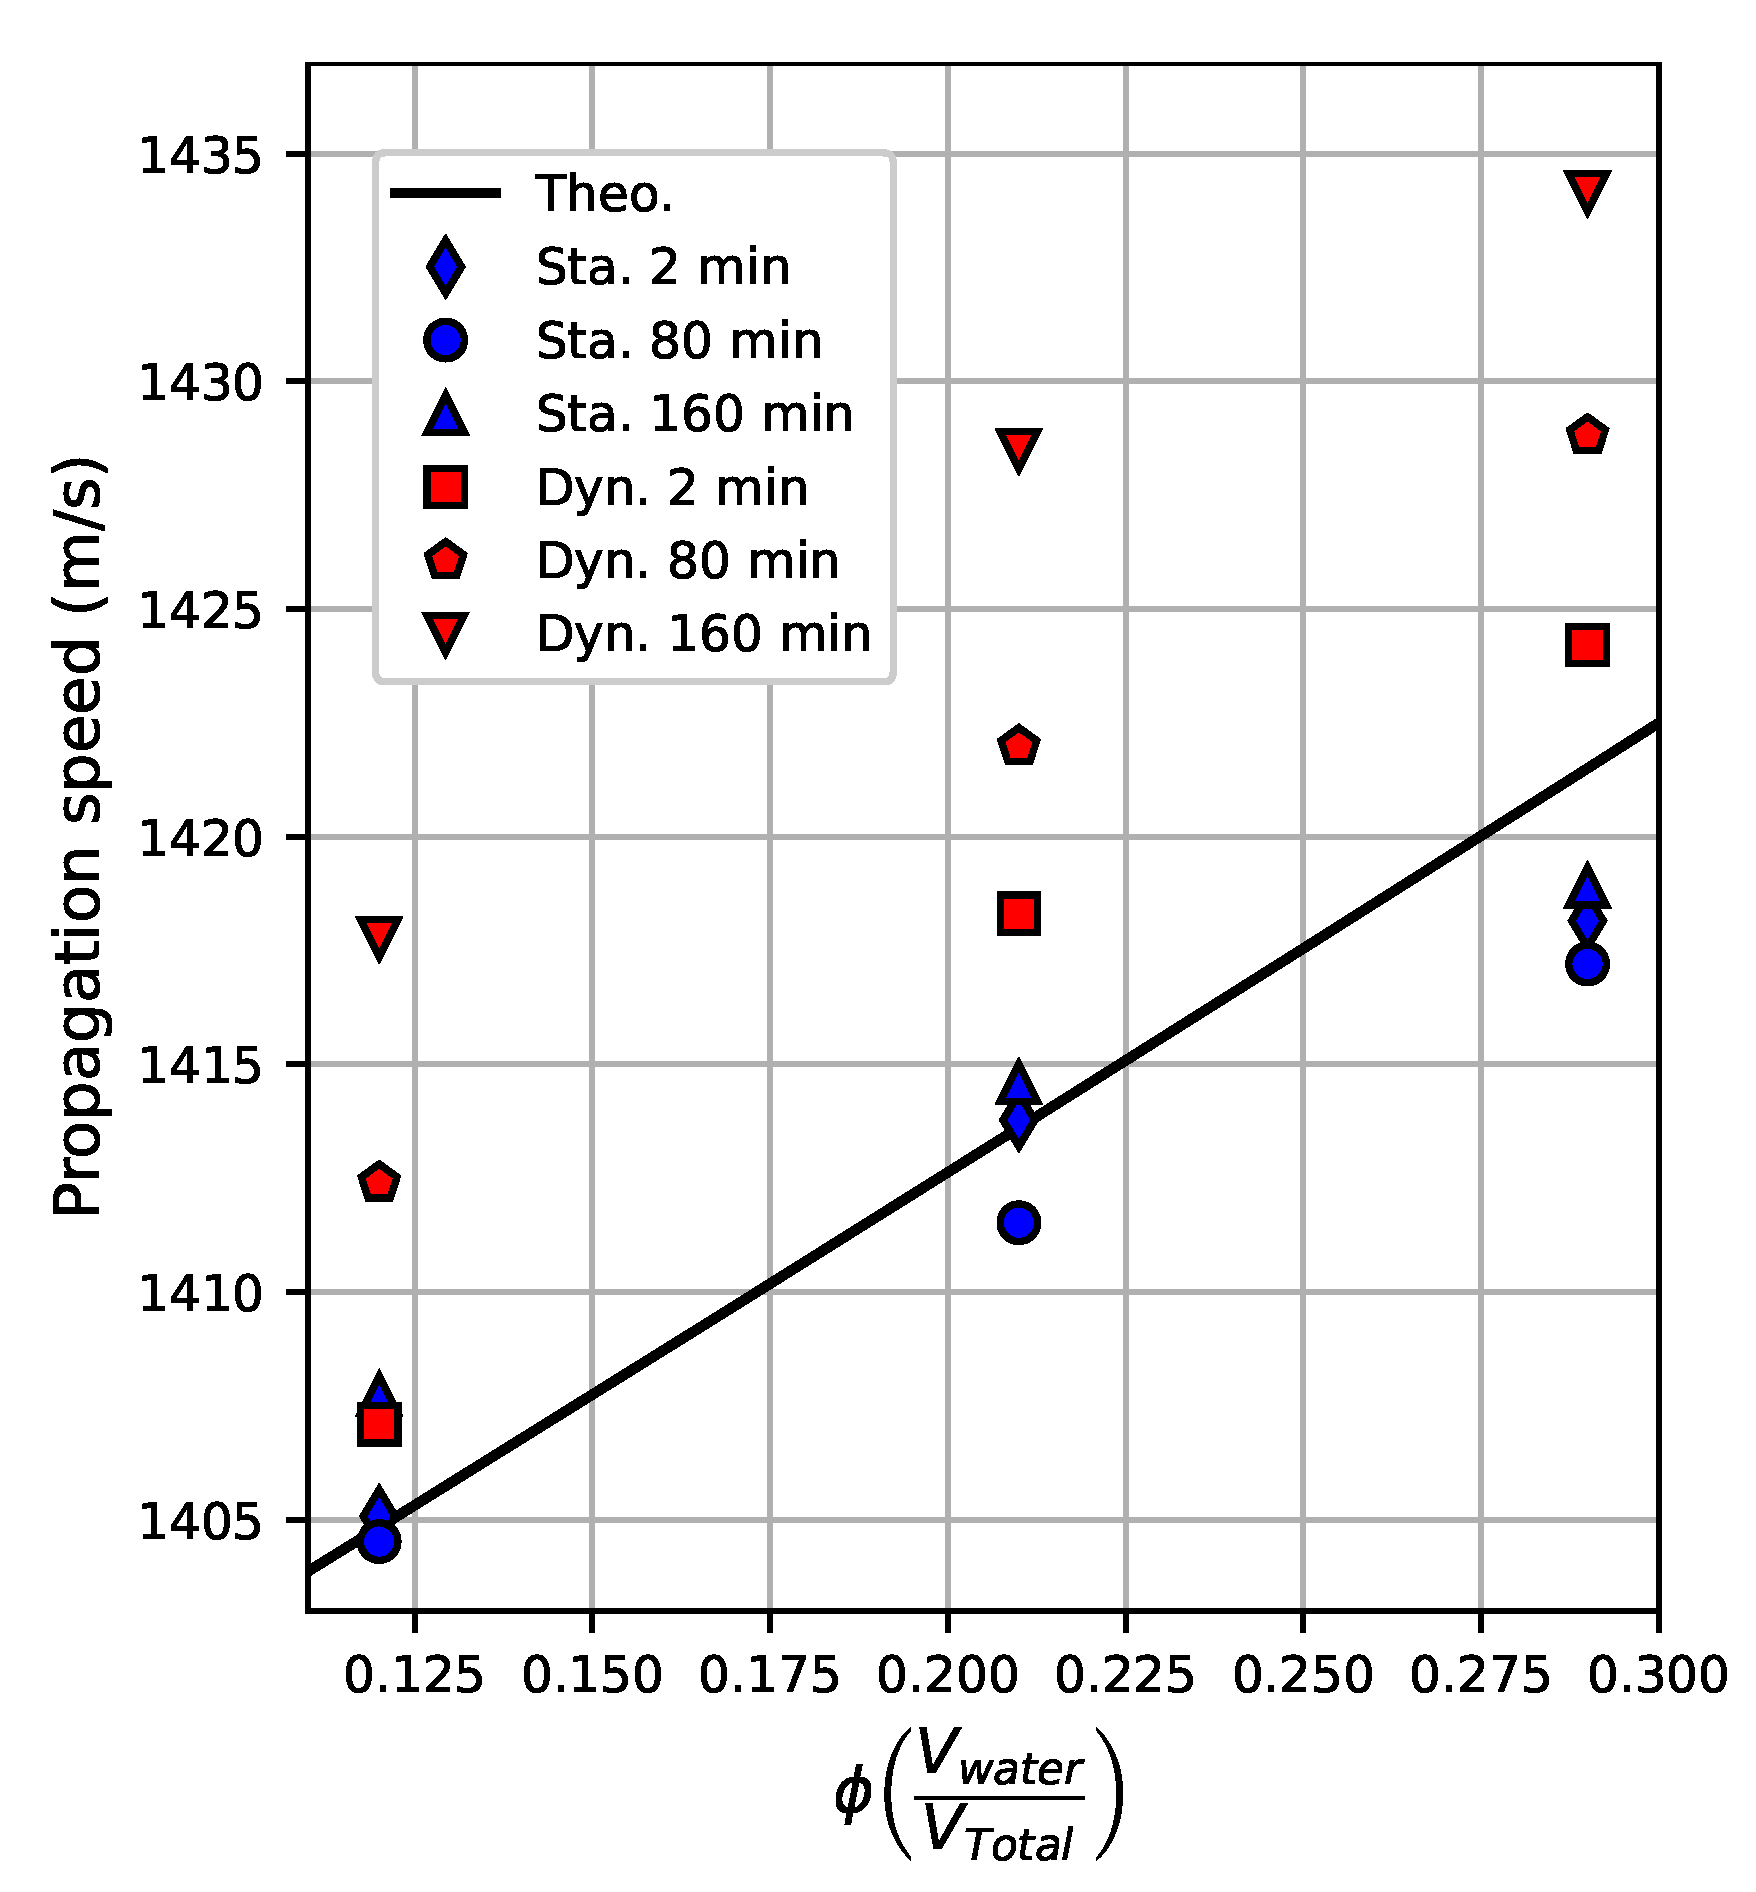
Figure 6 shows the propagation velocity in the emulsions as a function of water volume fraction (
ϕ = 0.12, 0.21 and 0.29) at three time instants (
min) for both static and moving cases. The theoretical propagation velocity according to the Urick mixture model is shown as a solid line. The results for the static case are closer to the theoretical behavior than the moving case for all instants of time. With the mixer turned on (in the motion case), an almost constant velocity difference (offset value) that depends on time is observed. At the first time instant (2 min), the velocity values have a maximum difference of just
% with respect to the theoretical values. Thus, to ensure that the emulsion concentration does not change due to coalescence, the characterization could be carried out two minutes after the emulsification process and the rest time.
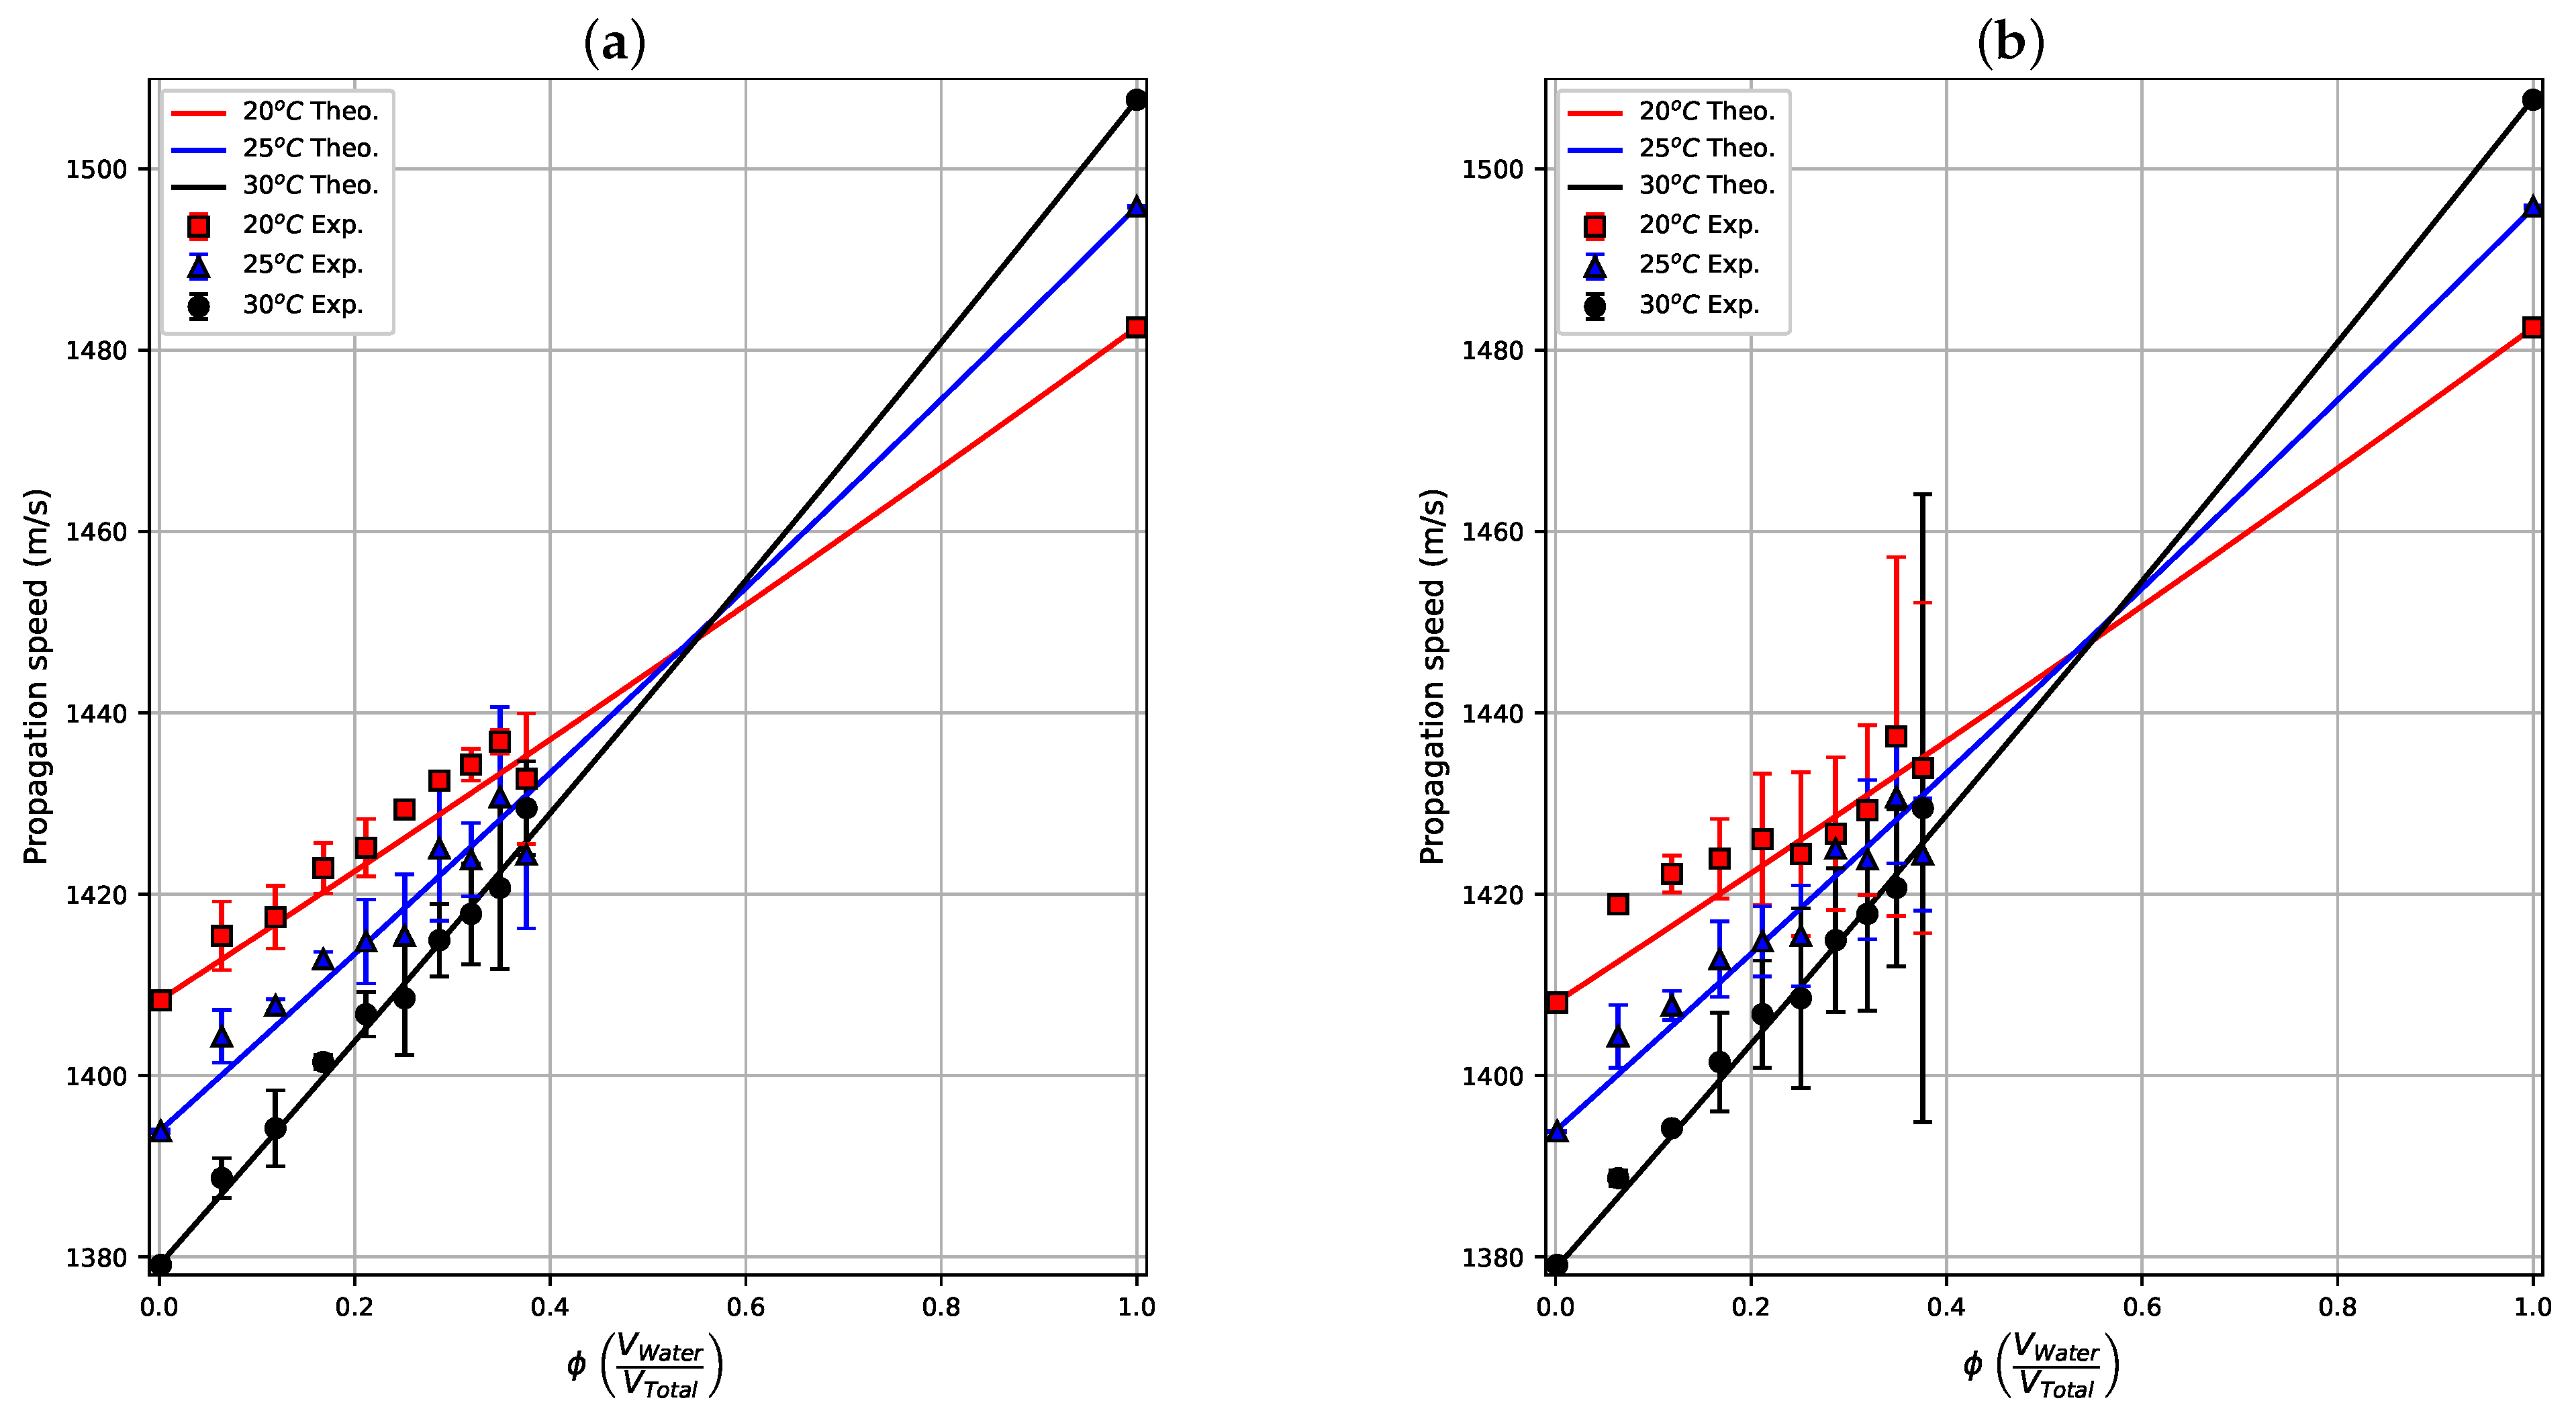
Figure 7a shows the average of the 30 measurements taken during the first 110 s (after emulsification and resting steps) at three temperatures for the static case. The measurement results were compared with their respective theoretical curves obtained with Urick’s model (solid lines). The results are in agreement with the theoretical values, showing the same almost linear trend of the model and allowing a clear differentiation of measurements at the three temperatures. The differences in the mean values of the propagation velocity between static and in-motion emulsions (see
Figure 7b) at the same concentration are less than
%. These results show that the difference in the propagation velocity of static and moving emulsions is small when the characterization is made immediately after the emulsification and resting (40 s) processes ends. The propagation velocities measured at 20 °C and 25 °C (red square and blue triangle data) in the static emulsions are similar to the experimental results of propagation velocity in water-in-crude-oil emulsions shown in [
28], in which the sensor uses a single transducer, a set of steel bars as a reflector and its volume is ten times greater in comparison to the prototype proposed herein. The same base crude oil used to produce the samples here were used in [
28], but there the experiments were carried out at 22 °C with water content from
to
, with an ultrasonic multiple-backscattering sensor.
The results from the emulsion in motion showed greater standard deviations at the highest water concentrations. This behavior shows greater instability of the physical properties of the emulsion at these concentrations. Tests carried out with the mixer turned on and with a blade tip speed greater than 1 m/s showed widely dispersed results (not shown here) for all concentrations.
In the case of moving samples, the propagation velocity variations in the emulsions for may be a consequence of the formation of water droplets with sizes close to wavelength, increasing the acoustic diffraction. This effect can also increase when temperature or flow velocity increases because the organic gases dissolved in the oil can form bubbles that can affect the wave propagation.
In
Figure 5a, the tested emulsions were prepared from mixtures of pure oil and water. In
Figure 7a,b, the tested samples were prepared by adding water to the emulsion previously used, obtaining new concentrations. In
Figure 5a, the propagation velocity values for
, 0.21 and 0.29 obtained during the first 5 min at 25 °C are similar to those obtained for the same concentrations at 25 °C in
Figure 7 (blue triangles). Although the method of emulsion preparation was different from the results presented in
Figure 5a and
Figure 7, close values were obtained, suggesting that the droplet behavior is similar regardless of the method of emulsion preparation.
5. Conclusions
A feasibility study of the real-time estimation by ultrasound of the water content in oil in static and moving emulsions, taking into account the temperature effect, was presented. The methodology employed made it possible to measure the emulsion properties under the proposed conditions. The presented technique is a variation of acoustic characterization of materials, widely used in liquids and solids. It allows the measurement of water content emulsified with crude oil, showing results close to those described by the Urick model. Water concentration measurements in stirring emulsions show a greater standard deviation compared to emulsions at rest. However, the mean velocity values are similar for both static and moving emulsions. Although this technique is not useful to obtain the correct instantaneous values of water concentration before 3 min after emulsification, an average of 30 measurements or more, obtained over that initial stage, could allow the measurement. The measuring accuracy of samples at different temperatures can be significantly increased in static emulsions. The depth positioning of the probe is relevant in the case of movement.
The determination of the water concentration in the emulsions within small time intervals (minutes) in relation to other methods (hours) indicates that the acoustic technique proposed herein could be useful for monitoring water in crude oil emulsions in real-time, before and after the induced coalescence processes that occur in the petrochemical industry.


 ,
, 


