4.1. Neural Network-Based Methods
The study presents a literature review concerning the AI methods of fault detection and diagnosis that are neural network based.
Table 1 presents a summary of the different methods presented in the subsection, pointing out the main contribution of each reviewed literature.
In [
80], a simple and effective Bayesian neural network (BNN) model for estimating power losses in PV plants owing to soiling was devised. Four models were built based on the Bayesian neural network (BNN) to assess the performance of two plants for dirty and clean module conditions under standard test conditions (STCs). The loss due to the soiling impact is shown by the difference in the STC power between the two conditions. The study found that utilizing a BNN model rather than a polynomial model for calculating the STC power of a PV system is more successful due to various factors that affect the polynomial model’s performance, including the database size.
Figure 2 presents a schematic diagram of the BNNs used for calculating the STC power, consisting of an input layer (which has solar irradiance and cell temperature as input), a single hidden layer (estimated during the training process), and an output layer (which provides the STC power output produced by the plant). Bayesian regularization, a process of updating the weight and bias values according to the Levenberg-Marquardt optimization technique, which helps in reducing a combination of squared errors and weights, and determining the correct combination to produce a network that generalizes well, can greatly improve the generalization ability of neural networks [
81]. BNN is basically back propagation (BP) with an additional ridge parameter added to the objective function [
80]. The study provides an important contribution as it helps the operation and maintenance personnel in decision making between washing cost and losses in energy production.
In order to successfully detect and categorize PV array faults, the authors of [
82] employed a deep two-dimensional convolutional neural network (CNN) to extract features from two-dimensional scalograms generated from the PV system data. The study took into account five different fault scenarios as well as the use of MPPT. There are two variations of the proposed method. First, the last layers of a pre-trained AlexNet CNN [
83] are fine-tuned to generate a six-way classifier in the first configuration. In the second configuration, features are extracted from a specific layer of a pre-trained AlexNet and then combined with a classical classifier. The suggested model’s performance is compared to machine learning- and deep learning-based models. The suggested method surpasses the previous methods in terms of detection accuracies for both noisy and noiseless data, according to the authors. They also illustrated the need of representative and discriminative features for categorizing errors (rather than using raw data), especially in noisy environments. Automatic feature extraction based on deep learning has been found to be superior to manual feature extraction. In order to better explain the proposed method,
Figure 3 presents a flowchart showing the proposed PV array fault diagnosis method and existing methods. Another neural network-based method of fault detection and diagnosis in solar PV systems, which uses Elman neural network (ENN), is presented in [
84]. The study examines the implicit mining link between original data and fault types, develops multiple hypothesis models, and analyzes the mean and variance of diagnostic errors to determine which diagnostic model is optimal. The suggested fault diagnosis approach based on ENN overcomes the problem of PV system multi-source and multi-type defect identification by minimizing the number of sensors, which only collects PV operation data and data from the atmospheric environment.
The main contribution of [
66] is the proposition of a technique for isolating and identifying faults that occur in the PV system, and its implementation into a field programmable gate array (FPGA) with real-life application effects. The proposed approach detects and diagnoses faults that occur in PV bypass diodes, cells, modules, and strings. It accomplishes this by examining a set of parameters, such as current, voltage, and the number of peaks in the I-V characteristics that indicate normal and abnormal PV system operation. Two separate algorithms are used in this strategy. The first algorithm isolates defects with different combination attributes using a signal threshold approach. The second technique uses an ANN-based approach to identify errors that have the same mix of features. The approach is low-cost and easily adaptable to large-scale PV systems. The block diagram of the proposed fault detection technique based on the threshold approach and ANN is presented in
Figure 4.
A method for detecting the islanding phenomenon in the PV system was introduced in [
85]. To detect islanding actions, the method employs a multi-variable method based on an extended neural network that combines passive and active detection modes. The method combines the extension theory’s extension distance with a neural network’s learning, recalling, generalization, and parallel computing capabilities. The study used an extension neural network to distinguish between power quality interference (voltage swells, voltage dips, power harmonics, and voltage flickers) and actual islanding operations at the grid power end, in order for the islanding phenomenon detection system to cut off the load correctly and promptly when a real islanding operation occurs. The detection algorithm is created and translated using a PSIM software package based on the C language and written in dynamic-link library (DLL) modules. The signals sent by DLL are passed back to the controller to complete the islanding detection control. An enhanced machine learning based approach for the detection and diagnosis of short-circuit faults, and a complete disconnection of the string from an array in the DC side of the grid-connected PV system is presented in [
86]. The process uses a probabilistic neural network (PNN) classifier with one diode model (ODM) and a parameter extraction method to create a trustworthy model of a real-world PV system. Two PNN classifiers are used in the proposed method, one is for detecting fault occurrences and the other for diagnosing the type of fault. There are four stages to the method: Array parameter extraction; experimental model validation; elaboration of database of both healthy and problematic operations; and network design, training, and testing based on the best-so-far ABC algorithm. The contribution of this study is highlighted in the model’s ability to detect a fault, while also pinpointing its origin. However, for the method to be effective, the high-quality database which is not always readily available, is required to deal with classification problems. To deal with this issue, the authors suggested having in place a trusted simulation model, which is able to mimic the exact healthy and faulty behaviors of a PV system. Another PNN-based intelligent method for PV system health monitoring was proposed in [
56], which can detect and categorize short- and open-circuit faults in real time, as well as locate the faulted PV string in a grid-connected PV system. To detect and diagnose faults, the suggested technique uses data obtained from various sensors in PV systems, such as voltage, current, irradiation, and temperature which are used to deliver information on fault occurrence. The PNN used in the method has four layers: The input layer (the number of neurons in the layer represents the number of training and testing samples); the hidden layer (whose pattern units are equal to the training set sample space); the summation layer (the number of neurons is equal to the number of sample space classes); and the output layer or the decision layer (containing one neuron which provides the classification decision). Moreover, it was developed and validated in computer programs utilizing a novel approach to PV system modeling that only requires data from the manufacturer’s datasheets provided under normal operating cell temperature conditions (NOCT) and STCs. The modeling approach is an improvement to the previous approaches where STC conditions, I-V characteristics or NOCT conditions are used but never combined together. This systematically builds a relationship between the ideality factor, thermal voltage, and series resistance with the PV module temperature using the manufacturers’ datasheet elements. The PV system simulation model is then used to implement and validate the PNN-based detection model and classification method. The authors of [
87] explored real time online fault detection for PV modules under partial shading conditions. The approach suggested in the paper is an intelligent method that uses artificial neural networks (ANN) to estimate the output PV current and voltage under varying operating conditions utilizing solar irradiance and cell temperature meteorological factors. Since it performs the real time correlation of estimated performances with the measured performances under variable conditions, the method can also be used to detect the possible anomalies in PV modules. The model proposed is independent of the measured PV module performance which makes its system of fault detection autonomous.
Figure 5 depicts the fault detection flowchart of the proposed method. The results of the study show that the proposed method can accurately estimate the output and detect any decrease in output power without requiring any complex calculations or mathematical models. However, it does necessitate that the ANN be trained on a regular basis in order to accurately estimate the output parameters. The approach could also be used in PV arrays or large-scale PV plants, as well as in low-cost microcontrollers for real-time applications.
According to the authors in [
88], few data collecting systems in solar power plants focus on intelligent reasoning of the plant’s state, despite the fact that the data of these collecting systems offer a wide range of capabilities. To tackle this problem, the authors presented a description of a novel data acquisition system. A Bayesian belief network-based (BNN) fault detection and diagnostic system was then built, which analyzes the acquired data for the existence of faults and intelligent reasons for potential causes of the detected faults. The BNN-based model uses a graphical representation of a problem in the form of a hierarchical network, with nodes representing random variables and directed arcs expressing the probability regarding the dependencies between these variables. Each node has a set of states, each with a probability distribution associated with it. Each arc reflects a conditional probability based on the preceding nodes. A node’s state could be as simple as true or false in the most basic scenario. In a more complicated instance, the set of states could include multiple discrete states, such as low, medium, high, and very high. The measurements obtained by a BBN-based inference engine produce a change in the probability values in the respective nodes, which impacts the connected nodes in the network and leads to the automatic derivation of a decision on the likely reason of a failure. By developing a framework for analyzing sensor results and translating them to a Bayesian belief network using the Netica API, the system lays the groundwork for future advancements. The Fault Identification for Nasa Exploration Missions and Navigation (FINEMAN) system was developed as an integrated package with four main components: A connectivity interface for remotely retrieving data from the plant’s data acquisition system; a preprocessor for relevant measurement selection; a fault injector for failure testing simulation; and a Netica implemented BBN interface engine. The research adopted in [
64] was also ANN-based, and unlike in [
87], where ANN was used for the PV module under partial shading conditions, the approach in [
64] utilized AI technology for automatic MPPT fault detection and failure type judgement. The method requires five features (solar irradiation, installed capacity, MPPT power, MPPT voltage, and MPPT current) for machine learning. Each inverter’s MPPT performance is gathered and modeled using a machine learning algorithm rather than a rule-based programming approach. In addition, an inefficient MPPT is discovered by comparing the real and expected power output. Moreover, faulty equipment is automatically recognized, a knowledge-based system determines the type of failure, and an alarm with the failure diagnostic is communicated to the user by a mobile device or email. The field sites collect data on power production every 5 min. As a result, the entire computation and communication process in the system takes only 5 min to complete. Using this AI method, the authors were able to efficiently manage hundreds of projects at the same time, while also optimizing O&M performance with minimal work and resources. A novel algorithm utilizing the genetic algorithm to optimize the topology of ANN was introduced in [
72]. The new algorithm is an online optimized neural network-based fault diagnostic and repairing system, aimed at providing a solution to the problem of complexity and high costs, associated with the other fault detection methods. The method offers the following factors: High speed diagnostic process as it diagnoses multiple faults in parallel; can remotely replace faulty components with good ones; can be used for modern complex PV systems; and has the ability to partition the PV panel into sub-areas. As a result, the diagnostic procedure is divided into two parts. The first is concerned with identifying the failure where the proposed method diagnoses a PV system using a genetic algorithm to optimize the topology structure of the neural network. The system is implemented in five steps: (1) Chromosome representation, which uses binary digits for topology network representation; (2) initial population, which is constructed from random individual sizes; (3) cross operator, which combines the parents to obtain two offspring using the uniform crossover; (4) mutation operation, where random mutation is used for genetic algorithm; and (5) fitness function, which is used to minimize the error value of the neural network representing the fitness function of the genetic algorithm. The second part of the proposed method is solely concerned with determining the cause of the failed area by dividing the structure of the PV system into three modules (the PV panel module, the charger module, and the battery module). Following this step, the ANN is trained with multiple types of faults for the three divided PV system structures and then the ANN begins the diagnostic process. When the proposed technique’s results were compared to fuzzy-based and classic neural network-based diagnostic systems, it was discovered that the proposed method produced better results. The authors of [
89] presented a neural network-based method for modeling the relationship (MPP) of a shaded PV array and environmental parameters (solar irradiance, sun angle, ambient temperature) in non-uniform settings. Similar to the shading factor, this neural-network-based function can characterize the shadow impacts on a solar PV array over time. As a result, the neural network model is able to eliminate the inaccuracy produced by the shading factor’s complex calculation. In contrast to the prior efforts that only address the uniform shadow on the PV array, this method considers the non-uniform shadow and illumination. The proposed method’s procedure is as follows:
The shadow ratio is defined by the solar height and solar azimuth angles, which may be simply calculated from the time of day for a specific geographic location. Therefore, the neural network’s inputs are the sun’s irradiation levels, angle, and ambient temperature. The neural network’s output has the highest solar PV array output power.
Experimental data are acquired by taking measurements numerous times a day, for several days, while the solar PV array is partially shaded by a nearby object. One set of measured data is used to train the neural network, while the other is used to test it. The neural network’s accuracy in estimating the PV array’s maximum output power is tested using the test data.
With low computational effort, the neural network can forecast the output power of solar PV arrays at any solar irradiation level, at any time of day, and at varied ambient temperatures over a long period of time.
Table 1.
Summary of neural network-based methods.
Table 1.
Summary of neural network-based methods.
| Authors | Reference | Year | Contribution |
|---|
| A.M. Pavan, A. Mellit, D. De Pieri, S.A. Kalogitou | [80] | 2013 | Evaluation of the effect of soiling in large PV plants using BNN and regression polynomial |
| F. Aziz, A. Ul Haq, S. Ahmad, Y. Mahmoud, M. Jalal, U. Ali | [82] | 2020 | Classification of line-line fault, open-circuit fault, partial shading, and arc fault using the convolutional neural net |
| G. Liu, W. Yu | [84] | 2018 | Diagnosis of open-circuit fault, overall shading effect, and partial shading effect using the Elman neural net |
| W. Chine, A. Mellit, V. Lughi, A. Malek, G. Sulligoi, A.M Pavan | [66] | 2016 | Identification of eight different faults using ANN |
| K.H. Chao, C.L Chiu, C.J. Li, Y.C. Chang | [85] | 2011 | Islanding phenomenon detection in PV systems using ANN |
| E. Garoudja, A. Chouder, K. Kara, S. Silvestre | [86] | 2017 | Detection and diagnosis of faults in the DC side of PV systems using the probabilistic neural network |
| M.N. Akram, S. Lotfifard | [56] | 2015 | Modeling and health monitoring of the DC side of PV systems using the probabilistic neural network |
| H. Mekki, A. Mellit, H. Salhi | [87] | 2016 | ANN based modeling and fault detection of partially shaded PV modules |
| A. Coleman, J. Zalewski | [88] | 2011 | Intelligent fault detection and diagnosis in the PV system using the Bayesian belief network |
| M. Chang, C. Hsu | [64] | 2019 | PV O&M optimization using ANN |
| A. H. Mohamed, A.M. Nassar | [72] | 2015 | PV system fault diagnosis using the genetic algorithm-optimized ANN |
| D.D. Nguyen, B. Lehman, S. Kamarthi | [89] | 2009 | Performance evaluation and shadow effects in PV arrays using ANN |
| D. Riley, J. Johnson | [90] | 2012 | Prognostics and health management of PV systems using ANN |
The authors of [
90] proposed a PV prognostics and health management (PHM) technique. The system was created to track the health of photovoltaic systems, measure degeneration, and provide maintenance recommendations. It employs a system-specific ANN model, which eliminates the need for prior knowledge of system components and design. Two detection techniques were tested in order to better monitor the health of the PV system. The energy loss fault detection system uses a neural network model to compare the sum of power loss over a lengthy period of time. An alarm threshold can be set to detect the long-term effects, such as soiling or material degradation, and alert the user to the need for maintenance. In the event of a catastrophic system failure, such as the loss of a string of modules or an inverter failure, the acute fault detection technique examines the potential of the PV system performing below model expectations and should warn the user. When the two techniques are combined, the short- and long-term PV system defects can be detected. The metrics of the two combined methods can also be used for pre-emptive inspection and maintenance, as they allow the system operator to identify the PV system failure precursors linked to failure modes.
4.2. Regression-Based Methods
In this subsection, PV system fault detection methods that are regression-based are reviewed.
Table 2 summarizes these methods, highlighting their main contributions.
For the detection of abnormal situations in the PV system, a novel approach has been employed in [
91] based on regression and SVM, to compute the ideal power generation, which takes into account all of the three categories of failures in PV systems, namely failures of PV modules, inverters, and other components. Furthermore, the proposed method makes use of variables that are already present in a small-scale PV system, eliminating the need for the installation of extra expensive sensory equipment. Power, voltage, and current are collected from the power conversion system (PCS). Solar irradiance on the surface of the PV panels is measured with a pyranometer, and ambient and PV cell temperatures are monitored with a thermometer. As a result, the suggested PV abnormal condition detection system can be efficiently used in a small-scale PV system or as an early warning system for the PV operator/owner to undertake further system inspections. Merged regression and support vector machine (SVM) models were used to create the PV abnormal condition detection system. The regression model is used to calculate the expected power generation for each solar irradiation, which is then fed into the SVM model. The SVM model, on the other hand, uses numerous variables, including the expected power generation, which is generated from the regression model to determine the abnormal condition of the PV system. Since the data used as the model’s input variable is acquired from the PCS, the proposed model does not require the installation of extra measurement devices and can be constructed at minimal cost. The detection system’s accuracy is also increased by taking into account the daylight time and interactions between the independent variables, as well as using the multi-stage k-fold cross-validation technique. The proposed detection system is evaluated using real data from a PV site, and the findings show that it can successfully discern between normal and abnormal PV system conditions using basic measures. The authors in [
92] proposed a condition monitoring technique based on an online regression PV array performance model, in which PV array production, POA irradiance, and module temperature/maximum power (MPP) measurements are collected during the system’s initial learning phase and used to automatically parameterize the system online using regression modeling. After the model has been automatically parameterized and optimized using the regression modeling methods, the condition monitoring system enters the normal operating phase, in which the performance model is used to anticipate the PV array’s power production. The authors claimed that using projected and measured PV array output power values, the condition monitoring system based on the Sandia array performance model (SAPM) [
92,
93], could detect power losses in the PV array of larger than 5%. When compared to the existing model-based condition monitoring systems, the suggested method is unique in that it can take advantage of the I-V scanning capabilities of a new generation of commercial PV inverters [
92], according to the authors. Using the real MPP collected from the I-V curve, as well as the ambient condition sensors, the system can generate an accurate performance model of the PV array in question during field operation. The authors’ proposed method has the following advantages: Simple commissioning and operation requirements; potential applicability to a wide range of PV system configurations; and it does not require modeling and testing of the PV array prior to installation. It does, however, have an initial commissioning phase where ambient conditions and array MPP measurements are used for the automatic commissioning of the PV array.
Figure 6 presents the condition monitoring systems’ learning or commissioning phase.
Unlike Reference [
92], which only used a regression model, Reference [
94] used a combination of linear regression and artificial neural networks, as well as solar irradiation, ambient temperature, and maximum power point (MPP) characteristic variables of PV modules obtained from I-V tracers at the PV installation site, to predict the performance of soiled PV modules. In the study, two methods (linear regression and neural networks) were used in modeling the output of soiled PV panels. In the first method, multiple linear models were created based on the last cleaning cycle time stamp, thus predicting the panel’s output as a function of solar irradiance. In the second method, the neural network, date, time, and irradiance, and sometimes, the temperature data were utilized and information was inputted to predict the output of the solar panel. In both methods, PV panel generation predictions were used to have high accuracies. Another regression based fault detection model is presented in [
95]. The study proposed a smart algorithm for the diagnosis and prognosis of reversed polarity fault in PV generators, utilizing a hybrid optimization of a support vector regression (SVR) technique by a k-NN regression tool (k-NNR). The main contribution of the study included the development of a smart prognosis algorithm that detects, locates, and characterizes a reversed polarity fault at the cell, bypass, and string levels. For data processing in a linear space, the SVR requires a kernel function in order for the data to be transformed in a new greater dimension space. To overcome the SVR output indetermination, the study utilizes k-NNR for predicting the approximate value of the SVR undetermined output. The method was validated using 50 samples of a typical generator and the results showed homogeneous and reliable predictions.
Table 2.
Summary of regression-based methods.
Table 2.
Summary of regression-based methods.
| Authors | Reference | Year | Contribution |
|---|
| F.H. Jufri, S. Oh, J. Jung | [91] | 2019 | Detection of abnormal conditions in PV systems using the combined regression and support vector machine |
| S. Spataru, D. Sera, T. Kerekes, R. Teodorescu | [92] | 2013 | Condition monitoring of PV array based on the online regression model |
| S. Shapsough, R. Dhaouadi, I. Zualkernan | [94] | 2018 | Predicting the performance of soiled PV modules using the linear regression and BP neural network |
| W. Rezgui, N.K. Mouss, M.D. Mouss, M. Benbouzhid | [95] | 2014 | Reversed polarity fault prognosis in PV generators using the regression algorithm |
4.3. Decision Tree-Based Methods
The study also presents a review of the AI methods of fault detection and diagnosis that are decision tree-based.
Table 3 shows a summary of the methods presented in the subsection, with an outline of the main contribution of each literature.
A number of fault detection and diagnosis methods that are decision tree-based are provided in [
67,
96,
97]. In [
67], failure detection routines (FDRs), that use obtained datasets of grid-tied PV systems to accurately obtain and classify exhibited faults, were created. The FDRs are made of two stages, namely the fault detection stage, which uses a comparative algorithm for the detection of anomalies between the measured and simulated electrical measurements of a PV system; and a statistical algorithm for the identification of outliers, discrepancies, and normal system operation limits. The failure classification stage is otherwise called the decision stage, where developed logic and decision trees are used to perform the classification process. The failure detection stage included a comparing algorithm that discovered disparities between the measured and simulated electrical measurements on the dc side, which were obtained using empirical parametric models for each point. Significant variations between the measured and simulated parameters, indicating a noteworthy performance gap, were classified as failures. The obtained incident global irradiance at the POA, PV system specs, and module temperature were required as inputs for the detection algorithm utilized in this study. Another comparative method utilized in the study is three-sigma limit method. When typical operation limitations set by defined criteria were exceeded, failures were recognized using this approach. The upper and lower control limits in statistical quality control charts were set using three-sigma limits (a statistical calculation that refers to data within three standard deviations of the average), which are commonly used to set the upper and lower control limits in statistical quality control charts. To establish and display the researched operation and boundaries, control charts were used. The typical operation limitations of the PV monitoring system were calculated by dividing the measured and simulated electrical data by the ratio. According to the PV production model, the ratio was used to determine how close the measurements were to their calculated values. The closer the ratio was to 1, the closer the measured parameters were to the modelled values. Since the system performance is affected by sunlight levels, an extra step is performed. To decrease the high bias errors occurring at low irradiance levels, the datasets were filtered at global irradiance levels >50 W/m
2. In the statistical failure detection approach, the local outlier factor (LOF) algorithm was used to find the density-based local outliers. With LOF, each point’s local density is compared to its k-nearest neighbors (k-NN), and if the point’s density is significantly lower than its neighbors, then the point is in a sparser region than its neighbors, indicating that it is an outlier. Moreover, outlier testing was done using the Bonferroni outlier test algorithm. Based on the linear regression model of the observed and simulated dc power of the array, this program returns the Bonferroni
p-value for the most extreme observation. In addition, the seasonal hybrid extreme studentized deviates (S-H-ESD) algorithm was used to find anomalies in a time series dataset that follows an approximately normal distribution. The S-H-ESD technique is an extension of the generalized extreme studentized deviates (ESD) algorithm that uses the time series decomposition and robust statistical measures in conjunction with ESD to detect both global and local anomalies [
98]. For the detected failure classification, logic and decision trees were developed. In addition, the decision trees were trained using continuous samples divided in a 70:30% train to test the set ratio utilizing the acquired datasets that included the feature patterns seen during normal and faulty operations. Moreover, they were produced using supervised learning procedures. The accuracy of the proposed FDRs for fault detection and classification was demonstrated in the obtained results for three fault types (inverter failure, bypass diode faults, and partial shading fault), which showed that accuracy rates of 98.7, 95.3, and 96.6% were recorded for inverter failure, bypass fault, and partial shading, respectively. The authors in [
96] presented a decision tree-based fault detection and classification for the PV array with an easy and straightforward model training process. Under the creation of a decision tree model for an experimental PV system in both normal and faulty working situations, the authors employed the PV array voltage, current, operating temperature, and irradiance as attributes for the training and test sets. The collected data and pre-processed training set are chosen at random from the experimental data and utilized to create the decision tree model using the WEKA software [
99], after which the model is evaluated and validated on unseen real data. Fast training and classification phases, explicit interpretation, and straightforward implementation as an algorithm are all advantages of the proposed decision tree paradigm. Another benefit of the model is that it can detect problems in real time, with detection accuracy ranging from 93.56 to 99.98% and classification accuracy ranging from 85.43 to 99.8%, depending on the model’s size. The authors of [
97] proposed a defect detection and diagnostic technique for grid connected PV systems (GCPVS) based on the C4.5 decision tree algorithm (which is one of the most popular machine learning algorithms for classification problems [
97]), in which a non-parametric model is utilized to forecast the state of the GCPVS through a learning task. Three numerical attributes (ambient temperature, irradiation, and power ratio) which are calculated from the measured and estimated power, as well as two targets (the first of which is either a healthy or a faulty state for detection, and the second of which contains four classes of labels named free fault, string fault, short-circuit fault or line-line fault for diagnosis) are chosen to form the final used data. The dataset was divided into two halves, with 66% utilized for learning and 34% for testing. Then, over the course of 5 days, additional data were collected to measure the robustness, effectiveness, and efficiency of both models. The dataset is required for the learning process in order to construct the decision tree. As a result, an acquisition system is developed to be able to record and store data, such as climatic variation, as well as electrical variables, such as current, voltage, and power at the MPP. Three attributes are chosen, including temperature ambient, irradiation, and the power ratio, which is calculated from the estimated power by the Sandia model and the measured power of GCPVS production. The Sandia model is an empirical relationship that is used to estimate the generated power from a system in a healthy state at MPP using STC data. Since this model has unknown parameters, the flower pollination algorithm (FPA) is used to find the optimal parameter values that correspond to the smallest root mean square error between the estimated Sandia output and the measured power. As a result of the high correlation between the power ratio and the system state, a nominal property called target is constructed as a class label in each instance data in order to accurately forecast these errors. Two major approaches lead to the construction phase. To begin, a splitting criteria is used to select the best split attribute. Thereafter, the tree grows in length as this technique is repeated iteratively in order to categorize all of the instances or to verify one of the stopping criteria. Then, once the tree model has been obtained, a pruning process is carried out to remove the unneeded sub-trees in order to minimize the overfitting phenomena, which can result in a reduction in model complexity due to the reduced tree size. According to the test findings, the models have a great prediction performance in the detection with high accuracy, while the diagnostic model has an accuracy of 99.8%.
Table 3.
Summary of decision tree-based methods.
Table 3.
Summary of decision tree-based methods.
| Authors | Reference | Year | Contribution |
|---|
| A. Livera, G. Makrides, J. Sutterlueti, G.E. Georghiou | [67] | 2017 | Advanced failure detection algorithm and PV performance outlier decision classification |
| Y. Zhao, L. Yang, B. Lehman, J.F. De Palma, J. Mosesian, R. Lyons | [96] | 2012 | Detection and classification of PV array faults based on the decision tree algorithm |
| R. Benkercha, S. Moulahoum | [97] | 2018 | C4.5 decision tree algorithm-based fault detection and diagnosis for grid-connected PV systems |
4.4. Support Vector Machine-Based Methods
The methods reviewed in this subsection are support vector machine-based.
Table 4 presents a summary of these methods as well as their contributions.
The authors of [
100,
101] suggested a system based on support vector machines (SVM) and k-NN tools with the goal of building a fault detection and diagnosis algorithm for PV generators. The algorithms are smart, according to the authors, since they are a hybridization of the SVM approach and the k-NN tool, which are used to improve the classification rate against observations on the classifier itself. The systems’ originality is in the construction of a smart classifier based on collected data from the control system, as well as the fault identification and localization of short-circuits in a cell, bypass, and blocking diodes. First, the proposed method utilizes the SVM algorithm, which is a two-class classification technique that seeks hyper-plane separating positive examples from negative ones by ensuring that there is a maximum margin between the nearest positive and negative examples. This ensures that the idea may be applied to new situations, as new examples may not be as similar to those used to determine the hyperplane, but may be on either side of the border. The selection of support vectors, which reflect the discriminate vectors by which the hyper-plane is determined, is a benefit of this method. Only those supporting vectors are utilized to assign a new case, and the examples used in the hyper-plane search are no longer required. Second, k-NN which is a simple and straightforward approach, and does not require learning is utilized to compare new examples of unknown class to old examples in its database. Then, for this new example, k-NN chooses a majority class among its nearest neighbors. In summary, the method uses the activation function of the SVM of Gaussian type and the Euclidean distance between the gravity centers of database observations of the k-NN method. The obtained simulation results, using the proposed smart algorithm in both literatures, exhibit a high classification rate and low error rate. However, the algorithms take a longer processing period due to the mathematical computations. Therefore, future works should focus on improving this aspect of the algorithms. The authors of [
48] proposed an algorithm to improve the detection accuracy of line-to-line faults in PV arrays that occur under a wide range of situations, such as low irradiance conditions, high impedance faults, and low mismatch faults. The algorithm is based on pattern recognition (multi-resolution signal decomposition (MSD)) and machine learning techniques (two-stage SVM classifier). It takes advantage of the MSD technique for the extraction of the feature space of line-to-line faults, while the SVM part is essentially for decision making. The system does not require numerous sensors, since it uses measurements of the overall voltage and current of the PV array, thus making it an economical and fast option. It detects line-to-line defects quickly and accurately, and it can be combined with fault location techniques to solve faults quickly. The MSD stage performs digital signal processing (DSP), allowing for the simultaneous time and frequency analysis of a signal, such as the analysis of both stationary and transient components of power quality disturbance. The SVM stage, on the other hand, is carried out to improve accuracy. The two-stage SVM is a binary classifier, which requires training utilizing a minimal amount of historic data from the tested PV system. The authors suggest that the proposed method is not limited to line-line faults only and could be used for the detection of other PV system faults. A method for detecting problems and monitoring the state of PV modules using a two-class data fusion method is introduced in [
102]. The approach was created by combining monitoring data from sensor nodes in wireless sensor networks (WSNs) at a monitoring center with a new semi-supervised support vector machine (SVM) classifier, devised and trained using the monitoring center’s existing sun irradiance big data. The monitoring center was created in order to access various monitoring data from various PV power stations, and multiple applications were created to use the envisioned system in various platforms. In this paper, a wireless monitoring subnetwork was created to retrieve crucial data from PV modules in power stations, such as the current, voltage, and temperature. The monitoring data received from each sensor was fused by a sink node with sunlight intensity information, and the fusion results were provided to the monitoring center over Internet networks. The data received from the sink node were parsed using the data access interface, and the data from the parsing process was double-checked using the outlier detection technique. The Cloud management module, which was also in charge of data security transmission between the Cloud and the applications, retained the regular data in the private Cloud. The authors built a semi-supervised SVM classifier using historical monitoring sunlight intensity data, which was employed in the outlier identification and solar power forecast algorithms. An outlier identification technique is designed using the prediction model provided by the trained classifier to identify and locate PV module faults by computing the average value of the problematic data. Furthermore, the authors employed a novel application of the PGKA technique to ensure the security of data transmission between the Cloud and apps. The fact that this approach does not require third-party certification to maintain file encryption and encryption keys is an apparent benefit. Despite the fact that this research focuses on crucial PV power station challenges, there is still a long way to go in terms of gathering PV power station data and intelligence properly.
Table 4.
Summary of SVM-based methods.
Table 4.
Summary of SVM-based methods.
| Authors | Reference | Year | Contribution |
|---|
| W. Rezgui, H. Mouss, K. Mouss, M.D. Mouss, M. Benbouzid | [100] | 2014 | Short-circuit fault diagnosis in PV generators using a smart SVM algorithm |
| W. Rezgui, N.K. Mouss L.H. Mouss, M.D. Mouss, Y. Amirat, M. Benbouzid | [101] | 2014 | Short-circuit and impedance faults smart diagnosis in PV generators using the k-NN optimized SVM classifier |
| T. Hu, M. Zheng, J. Tan, L. Zhu, W. Miao | [102] | 2015 | PV system intelligent monitoring based on solar irradiance big data and wireless sensor networks |
4.5. Neuro-Fuzzy-Based Methods
This subsection presents a review of AI methods of fault detection and diagnosis that are based on the neuro-fuzzy technique.
Table 5 presents a summary of the methods as well as their contributions.
The authors of [
103] proposed an intelligent system for automatic fault detection in PV fields based on the Takagi-Sugeno-Kahn fuzzy rule-based system (TSK-FRBS) [
104]. The method is based on the analysis of recorded voltages and currents collected from a PV plant’s inverter. The TSK-FRBS is a power estimator module that estimates the PV field’s immediate power production in normal operating conditions (using temperature and irradiance input signals to assess the DC power that the PV plant should produce) and compares it to the real power to check for differences. If there is a large disparity between the two power sources, an alarm signal is issued. In this circumstance, the TSK-FRBS has two advantages. First, it can describe complicated system behaviors without requiring the use of a mathematical model. Second, it is able to deal with noisy and vague data. The schematics of the proposed intelligent system, which is connected to a PV system is shown in
Figure 7. It consists of the data acquisition module, the detection module, and the diagnosis module, in a multi-array inverter PV plant. The acquisition module measures the temperature and solar irradiance on the PV plant in real time and extracts the DC current and voltage observed on the respective array from each MPPT. Sensors mounted on the PV field can be used to measure temperature and solar irradiation. They can also be obtained via a remote database linked to a weather station. Then, the acquisition module feeds these measured data to the detection module. The detection module estimates the DC power that each array should output if no fault occurs using these data from the acquisition module. This module compares the estimated and measured powers and generates an alert signal in correspondence with the arrays that provided a lower power than the estimated one; if the difference exceeds a threshold. Finally, the alert signals are sent to the diagnosis module, which can automatically provide information on the type of fault that occurred.
The authors of [
105] noted that numerous literatures have proposed methods of shadow detection and the reconfiguration of an array. In addition, most of these methods use the voltage, current, and power information to achieve this. The authors saw that monitoring these factors was time consuming and tiresome. Therefore, they presented a novel and effective method of shadow detection for the reconfiguration process, which will help increase the energy production of PV arrays, based on the fuzzy logic and computer vision. The method detects the edge of the object region on the panel from images taken with a camera. Using the background subtraction and object detection method, it then converts the background and foreground image into a grey image format. Object edge detection is performed after the determination of the updated mechanism, which is based on background subtraction and illumination variability. First, dilation and erosion operations are applied to the binary mask in order to determine the object region edge. The image’s noise is reduced by these techniques. Following that step, using the Canny edge detection approach, the edges of the objects on the binary image are detected. The final stage in the determination of the subject borders on an image is to use the search and draw contour procedures to determine the related object regions. A relevant pixel region is created for each region whose side information is identified. Finally, the proposed method uses a fuzzy decision-making mechanism to classify the object region as a shadow region utilizing brightness and color distortion values of the object as input parameters. When employed as an input parameter for the reconfiguration operations, the proposed method has a success rate of 98% and increases energy usage performance by roughly 10–15%. The arc defect detection technique described in [
106] has a minimal computational requirement, and can function with most of the conventional analog-digital converters (ADC) found in microcontrollers, making it useful in PV applications. When using an inverter rather than a solo device, the algorithm produces better results. This algorithm’s integration is also a cost-effective way to detect arc faults and improve the PV system long-term safety. The short- and long-term measurement results are promising, but further long-term experiments are needed to fine-tune the device for phenomena that have yet to be identified. In the proposed method, the detection algorithm uses three indicators, namely frequency analysis, peak detection, and observation of the operating point, as parameters for fault detection. When an arc fault occurs, the indicators display a particular behavior. However, it is not always the same. The signal energy increases slowly at times and quickly at others. When an arc fault occurs in a small plant, the trip is apparent, but not in a large plant. Due to the haziness of the situation, the authors employed fuzzy logic to detect an arc defect. Furthermore, fuzzy logic makes it easier to incorporate the experiences of experts who are unfamiliar with the algorithm. Four sub-detectors, which are followed by the master fuzzy arc fault detector (MFAFD), are created to keep an overview of rules and input variables. Theses sub-detectors are the peak evaluator sub-detector (PESD), which analyzes all of the peaks and delivers a mass output proportional to the probability, indicating that this peak is from an arc fault; window near sub-detector (WNSD), which analyzes the change signal energy over a short timeframe; window wide sub-detector (WWSD), which analyzes the long-term signal energy and can be used when there is no abrupt signal energy growth; and power analyzer sub-detector (PASD), which supervises the power change. Outputs of the four sub-detectors serve as input for the MFAFD. The MFAFD outputs a number between 0 and 1, which represents the mass for the arc fault probability. An arc fault is detected if this probability exceeds a predefined threshold. The authors of [
107] presented a method for detecting increases in series resistance using a fuzzy classifier that can distinguish between the increasing series losses and partial shadow situations for resistances greater than 400 W/m
2. As shown in
Figure 8, an optional shadow detection algorithm acting before the increased series losses detection system, which could improve the detection accuracy of the system, is also implemented in the diagnostic system. This strategy is especially significant, since the increased series losses and partial shadow circumstances are difficult to discern, as they diminish a PV system’s peak output and fill factor. Rather than the controlled laboratory circumstances, the study focuses on estimating the increased series resistance in the field. The method has been tested using experimental measurements. In addition, it has shown good detection rates across a wide range of irradiance levels, as well as in the presence of diverse sizes and patterns of partial shadows. Moreover, the authors showed that a dedicated partial shadow detection algorithm, implemented in the diagnostic system and functioning prior to the higher series losses detection method, improves the overall system’s detection accuracy.
Under low irradiance conditions, the DC side short-circuit faults in PV arrays consisting of multiple PV panels connected in a series/parallel configuration are nearly undetectable, especially when the MPPT algorithm is in use. In addition, if they go undetected, these faults can significantly reduce the output energy of PV systems, damage the panels, and potentially cause fire hazards. To avoid this, the authors of [
108] present a fault detection scheme based on a pattern recognition approach that uses a multi-resolution signal decomposition technique to extract the necessary features, which is then used by a fuzzy inference system to assess whether a defect has occurred. PV array output volts and currents, as well as solar irradiation, are the system’s inputs. The multi-resolution signal decomposition technique is used to extract four unique features depending on the above inputs. Following that step, the retrieved characteristics are supplied into the fuzzy inference system, which generates a scalar number based on carefully built membership functions and the associated rule base. Decisions are based on these results. The amount of this output determines whether a line-to-line, line-to-ground or none-of-the-above fault has occurred. In simulation and experiment-based case studies, the performance of the proposed method is demonstrated. Defect identification becomes increasingly difficult when the percentage of fault impedance or mismatch declines. The program also revealed one unintentional operation for a typical case, in which the irradiance had changed drastically within a short period of time, which is unusual in real-world systems. The promising performance of the proposed algorithm is supported by the experimental results. Line-to-line and line-to-ground faults are usually detected using this method. Open-circuits and hot-spot heating, for example, are two further types of PV array faults. As a result, the applicable algorithms for a more exact classification of additional PV concerns could be applied in parallel with or later phases of the detection system. Fuzzy logic-based algorithms are presented in [
109,
110] to detect the malfunctioning PV modules and partial shadowing circumstances that influence the DC-side of grid-connected PV systems. The authors’ algorithm is made up of six layers that work in a sequential order. Input parameters make up the first layer (solar irradiance and module temperature). The theoretical performance analysis of the grid-connected PV system is generated using the LabVIEW virtual instrumentation program in the second layer. The power and voltage ratios are determined in the third layer, and high and low detection limits are set in the fourth layer, which is utilized to apply the 3rd-order polynomial regression model to the power and voltage ratios. The fifth layer contains the input parameters of the examined grid-connected PV systems, as well as the 3rd-order polynomial detection restrictions. If the measured voltage ratio vs. the measured power ratio is outside of the detection limits, the data will be processed by the sixth layer (which is the last layer), which contains the fuzzy logic categorization system. The suggested method’s innovation is proved by the fact that it provides a simple, dependable, and fast fuzzy logic classification system that can be employed with a variety of grid-connected PV systems. The algorithm is also unique in that it is based on fluctuations in the voltage and power of the grid-connected PV system. Few fault diagnosis techniques are capable of being implemented on integrated circuits, according to Sufyan Samara and Emad Natsheh’s study [
65], and these procedures require expensive and complicated hardware. The authors introduced a unique effective and implementable defect diagnosis approach based on the AI nonlinear autoregressive exogenous NARX neural network and Sugeno fuzzy inference to try to solve this problem. The program employs the Sugeno fuzzy network to isolate and classify errors in PV systems. The NARX network is used to estimate the PV system’s maximum output power based on the real-time measured output and surrounding conditions, which is then used by the fuzzy inference algorithm to detect and categorize errors that may develop in the PV system. The algorithm has been demonstrated to work on a low-cost microcontroller. The suggested algorithm will be able to detect a variety of flaws in the PV system, including open- and short-circuit degradation, faulty MPPT, and PS issues. Furthermore, the proposed algorithm can capture non-linear patterns between predictors, such as radiation and temperature, as well as other non-linear correlations of patterns between predictors, to calculate the precise moment of maximum power for the PV system. The actual sensed PV system output power, anticipated PV system output power, and sensed surrounding conditions are all required for fuzzy inference. Using an AI NARX-based neural network, the PV system’s output power is projected. The authors concluded that the ability of the proposed method to efficiently diagnose several PV system faults is an important step in achieving a complete system that can diagnose large PV system faults.
Table 5.
Summary of neuro-fuzzy-based methods.
Table 5.
Summary of neuro-fuzzy-based methods.
| Authors | Reference | Year | Contribution |
|---|
| P. Ducange, M. Fazzolari, B. Lazzerini, F. Marcelloni | [103] | 2011 | Intelligent system for the detection of PV system faults based on TSK-FRBS |
| K. Karakose, K. Firildak | [105] | 2014 | Shadow detection system based on fuzzy logic using the obtained PV array images |
| B. Grichting, J. Goette, and M. Jacomet | [106] | 2015 | Arc fault detection algorithm in PV systems based on the cascaded fuzzy logic |
| S. Spataru, D. Sera, T. Kerekes, R. Teodorescu | [107] | 2012 | Increased series losses detection in the PV array based on fuzzy inference systems |
| Z. Yi, A.H. Etemadi | [108] | 2017 | Detection of PV system faults based on the multi-resolution signal decomposition and fuzzy inference system |
| M. Dhimish, V. Holmes, B. Mehrdadi, M. Dales | [109] | 2017 | PV system diagnostic technique based on the six layer detection algorithm |
| M. Dhimish, V. Holmes, B. Mehrdadi, M. Dales, P. Mather | [110] | 2017 | Fault detection in PV systems based on the theoretical curves modeling and fuzzy classification system |
| S. Samara, E. Natsheh | [65] | 2020 | Using the NARX network and linguistic fuzzy rule-based system to diagnose PV panel faults |
4.6. Wavelet-Based Methods
In this subsection, the wavelet-based methods are reviewed. A summary of the method contributions presented in the literature is shown in
Table 6.
The authors in [
111] proposed a system that was designed and tested at various load currents, DC source voltages, and arc lengths to analyze the impact of each parameter on the DC arc, with the goal of providing a thorough understanding of arc behavior that could occur in DC networks. Based on the findings, a detection technique that uses both the time domain and time frequency domain characteristics to distinguish between the DC arc fault and normal conditions has been presented. A simple calculation approach for the arc current variation is utilized to portray the chaotic and dynamic nature of the DC arc physical process. The current variation can indicate different stages of arcing and is used to recognize DC arc faults. Moreover, wavelet decomposition is applied to the arc current signal. The normalized RMS value of wavelet decomposition coefficients demonstrates the ability to detect the arc fault. Finally, a comprehensive DC arc detection algorithm is created using the current change from the time domain analysis and the normalized RMS value from the wavelet analysis. A Texas Instrument’s Digital Signal Processors (TI DSP) chip, which has a clock frequency of 150 MHz and has gained popularity in power electronic applications, is used to implement the detection method in the hardware. In the proposed method, the maximum and minimum currents are updated every time new data is inputted at each timer cycle, and the difference in the current is registered at the
nth cycle. The value of
n is determined by the length of the time window and sampling frequency. Detection accuracy is enhanced if a longer time window is achieved, as it makes the RMS versus time waveform smoother. A long time window, however, leads to a longer time response. When the amount of data points is excessive, the actual implementation must be adjusted to ensure that the calculation load is within the capabilities of the available microprocessor. The wavelet coefficients are calculated by sending a signal through low-pass and high-pass filters, as well as down sampling it by two. The filters are dependent on the used wavelet and are consistent throughout the entire level decomposition. As a result, the detection algorithm can be implemented on a microprocessor in the time domain using convolution and down sampling. The filtering procedure for the first-level DWT to obtain
Coefl1 is carried out every two timer intervals, for which two new data points are available at this time. The second-level DWT coefficients (
Coefl2 and
Coefh2) are calculated whenever two new coefficients from the first-level DWT are received. As the filtering operation was performed for every timer interval instead, this method cuts the calculation load by half. In the main function, the ultimate decision is taken. The main function’s flag changes to 1 at the conclusion of each time window. Only two square roots, one division, and two comparisons are performed in the main function, which takes 80 clock cycles in total, according to the benchmarks of the C28x floating point unit fast RTS library. With a clock frequency of 150 MHz, the main function’s computation time at the conclusion of each
Tsw = 25 ms is less than 1 μs, which is negligible. As a result, the detection time is mostly determined by the length of the time window. The results of the studies reveal that the detection algorithm is capable of delivering an alarm in a timely manner following the initiation of an arc fault. Typical operations, such as load changes, can also generate nuisance tripping, which can be reduced with this detection system. In [
112], a modified wavelet-based technique termed the wavelet packet transform (WPT) was developed for the detection of diverse disturbances caused by faults in grid-connected solar PV systems. The study continued to evaluate the proposed WPT approach to methods based on the ordinary wavelet transform (WT) under various operating settings. In addition, qualitative and quantitative evaluations suggest that the WPT outperforms WT in terms of detection performance. The WPT uses a set of low-pass and high-pass filters to breakdown the signal retrieved at PCC. It gives both approximate and precise coefficients. Moreover, it extensively decomposes both components in order to determine the signal’s frequency agreements. The breakdown procedure carried out in both components is what gives them their value. Wavelet transforms, on the other hand, do only a one-sided decomposition, segmenting only the low-pass frequency components and not the high-pass frequency components. When WT is subjected to noisy or transitory environments, this feature can compromise its performance. In [
113], wavelet transformations were used to offer an online fault detection method for power conditioning systems (PCS). Switch open faults and over harmonics are detected using a multi-level decomposition wavelet transform approach. Using the normalized standard deviation of the wavelet coefficient, a quick and accurate diagnostic function is also achievable, allowing the suggested method to detect islanding conditions. Simple calculations (a time correlation generated by sequential multiplication and addition) and exact diagnostic capabilities of fault identification with good simulation outputs to check and evaluate its claims characterize the method’s algorithm. The multi-level decomposition wavelet transform provides the method’s straightforward calculation characteristic. At each wavelet tree level, the algorithm extracts wavelet coefficients from the measured signal, and errors are discovered and categorized using the wavelet coefficient changes. Using a three-level MLD tree, the fault detection technique was created for PCS fault scenarios. Switch open and over harmonic are the two scenarios considered. The PCS uses a semiconductor switch, such as a field effect transistor (FET) or an IGBT, to convert DC solar voltage to AC grid current. The switch open can be attributed to a switching device failure, whereas the over harmonic can be attributed to a controller or sensor failure. The cases of switch short faults are not taken into account here. The system is protected by the over-current limiting function or melting fuse when the switches are in short fault, and the PCS ceases running. The PCS current has a distorted waveform when the switches are open faulted, and it continues to provide high order harmonics to the grid. An UP and DOWN switch failure in the inverter bridge might be categorized as an open switch problem. The authors of [
114] used the discrete wavelet transform (DWT) to analyze the traced I-V curve of a residential PV system and define these coordinated points in the related diagnosis effort. The DWT was utilized to implement the fault diagnosis of residential PV systems as a preprocessing tool. It enables feature extraction through signal decomposition and noise reduction. The reduced short-circuiting current of partially shaded cells is represented by the vertical height or current in a PV string identified by the DWT method, whilst the horizontal or voltage distance from the VOC to the inflex is connected to the number of bypassed modules. The approach is divided into two sections, namely passive and active. In the passive diagnosis section, a residue signal is generated by comparing the measured PV power signal and simulated model in real time to monitor the alarm signal and abnormal condition in the system, using the model base fault diagnosis technique. After the manifest and certainty error signals have been determined, the flash test is used as the active and second portion of the test procedure. During this phase, the step load is separated from the PV and power generation, and the MPPT mode of the inverter is interrupted. The I-V curve of the PV array is tracked and logged by modifying the inverter switching pattern for a deeper inspection and interpretation. The model provided in [
115] for the defect diagnosis of PV arrays was improved using improved wavelet neural networks, wavelet neural networks, and back propagation neural networks. The training technique now includes a Gaussian function, which is utilized as an activation function, an additional momentum mechanism, and an adaptive learning rate method. The conclusion is taken from simulation findings that the proposed technique in this study is capable of efficiently diagnosing the PV array problem with good performance accuracy, convergence time, and stability under the identical conditions of the network input and desired output. The proposed fault diagnosis algorithm is summarized in
Figure 9. Four PV system fault types are diagnosed using the model, namely short-circuit, open-circuit, abnormal degradation, and partial shading. There are five network output layer variables since the system requires the precise diagnosis of four types of problems and no fault condition. The selection of the number of hidden layer nodes in a neural network is a difficult topic with no theoretical foundation to follow. The number of hidden layer nodes is critical to the network’s success. If the number is too little, we may not acquire a network from training, implying that the network’s robustness is poor and its anti-noise ability is weak, making it unable to recognize models that have never been seen before. If the hidden layer’s node number is too big, the learning time will be too long, and the error will not be minimal. Furthermore, there could be an issue with overfitting. As a result, based on an empirical equation, the trial and error method is commonly employed to identify the appropriate number of concealed nodes.
In [
116], a wavelet optimized exponentially weighted moving average (WOEWMA) monitoring technique based on the principal component analysis (PCA) was created. The presented monitoring approach combines the advantages of exponentially weighted moving averages, MOO, and wavelet representation. MOO is used to tackle the challenge of determining the best strategy for minimizing both the missed detection rate (MDR) and the false alarm rate (FAR). Apart from the decorrelation of auto-correlated observations, the wavelet representation increases the monitoring performance by lowering MDR and FAR, as well as obtaining the exact deterministic features. The proposed method is appropriate for real-time implementation due to its quick calculation time. This approach is robust in a range of faulty conditions, including single and multiple (cascade and simultaneous) occurrences, and can detect faults in both the DC and AC conversion sections. The proposed method has several advantages, including dynamic multiscale representation to extract accurate features and de-correlate auto-correlated measurements; the PCA technique to model PV systems; the EWMA of two parameters in OEWMA are optimized using the multi-objective optimization; and the WOEWMA chart can detect smaller fault shifts, thereby improving the PV model monitoring.
Table 6.
Summary of wavelet-based methods.
Table 6.
Summary of wavelet-based methods.
| Authors | Reference | Year | Contribution |
|---|
| X. Yao, L. Herrera, S. Ji, K, Zou, J. Wang | [111] | 2014 | Detection of DC arc fault based on the characteristic study and time-domain discrete wavelet transform |
| P.K. Ray, A. Mohanty, B.K. Panigrahi, P.K. Rout | [112] | 2018 | Fault analysis in solar PV system based on the modified wavelet transform |
| I.S. Kim | [113] | 2016 | Online fault detection algorithm in PV system based on the wavelet transform |
| M. Davarifar, A. Rabhi, A. Hajjaji, E. Kamal, Z. Daneshifar | [114] | 2014 | Partial shading fault diagnosis based on the discrete wavelet transform |
| X. Li, P. Yang, J. Ni, J. Zhao | [115] | 2014 | Improved wavelet neural network algorithm-based method of fault diagnosis in PV array |
| M. Mansouri, A. Al-khazraji, M. Hajji, M.F. Harkat, H. Nounou, M. Nounou | [116] | 2017 | Wavelet optimized EWMA-based fault detection method for the PV system application |
4.7. Other Methods
This subsection groups all the other reviewed faults that were not classified in any of the six groups. A summary of the contribution of the reviewed methods is presented in
Table 7.
The approaches, that use graph-based semi-supervised learning (GBSSL) for fault identification and diagnosis in PV arrays, are available here [
13,
117]. The authors of [
117] presented a sound technique based on GBSSL for recognizing, classifying, locating, and fixing errors in PV arrays, which was improved by expanding the diagnostic space of the GBSSL algorithm and adding more class labels. The model detects and locates a failure, temporarily isolating the system in order for it to continue to operate normally until the problem is resolved. The authors adjusted the way the data were normalized in order to increase the system’s ability of finding the unlearned defects, and they were able to detect faults that the algorithm could not detect at first. The functionality of the system to feed the required energy after the defect was eliminated was tested using an interleaved boost converter, and it was discovered that the maximum voltage loss in a standard condition is 1 V, demonstrating the model’s high efficiency. The proposed model in [
117] was an improvement of a previous model proposed in [
13] by the addition of the fault location element and higher fault detection and classification accuracy. The early stage of the algorithm starts with the extraction of a limited number of labeled data with their class labels serving as initial value data and fed into the model. Both the faulted and fault-free data are included in this dataset. To achieve the fault-prone labeled data, faults are purposefully introduced into the system, and the parameters are measured and stored for each data. The data are measured and stored in the fault-free mode in the same way as it is in the normal mode. An important advantage of the proposed GBSSL method is that it only requires a small amount of data for the learning process. To detect PV system faults, the current of all rows of solar cells, as well as the overall voltage of the panel, are constantly measured at any time (this is accomplished by installing 10 current sensors in each row of cells and one voltage sensor at the PV system’s output points). As a result, each dataset contains 11 parameters, 10 of which are currents flowing across the cell’s rows and one of which is the system’s total voltage. In the modeling process, the parameters required to implement the GBSSL algorithm are entered. On the other hand, the authors of [
118] proposed an intelligent defect diagnostic approach for PV arrays based on a kernel extreme learning machine (ELM) optimized simulating annealing (SA) algorithm with an improved radial basis function (RBF). Short-circuit faults, aging faults, and shadow faults are among the faults discovered by the proposed method. The results obtained were above 90%, showing that the SA-RBF-ELM fault classification is accurate and stable. According to the acquired simulation findings, the suggested model has three key advantages: (1) The optimal fitness value of the PV array and the model parameters used, as one of the characteristic factors of neural network learning, considerably increase the fault detection accuracy of the four fault kinds described; (2) the RBF-ELM kernel function has strong learning and classification capabilities, making it suitable for detecting and classifying PV array faults; and (3) the SA algorithm can quickly optimize the parameters of the RBF-ELM fault diagnostic model, significantly improving the RBF-ELM model’s training accuracy and testing precision. The algorithm proposed is a derivative of the basic ELM algorithm, with kernel function limit learning machine features, which improve its ability to solve the problem of regression prediction leading to higher accuracy and faster calculations. The RBF-ELM model contains a regularization coefficient (C) and radial width (α), which affects the algorithms’ performance. The RBF-ELM fault model’s training accuracy is employed as the optimization objective function, and the coefficients C and α are the parameters that must be tuned. The simulated annealing approach is then utilized to optimize the parameters of the RBF-ELM fault model, resulting in optimal training and test accuracy for each time. A diagnostic technique for PV systems was developed in [
119] using the learning method to take each PV site’s condition into account. The technique employs the diagnostic criteria database to analyze the data acquired from the PV system. The special features of the proposed technique include updating the diagnostic criteria, making it possible to detect normal or abnormal operating conditions of a PV system; the detection of shadow on modules and the pyranometer using the sophisticated verification (SV) method [
120]; and the maintenance advice provided by an expert system according to the precise diagnosis. The ratio of acquired data to reference data is calculated to diagnose the system’s normality or abnormality. The ratio approaches “1” when actual and average meteorological data are close. For example, when the summer generated power ratio is “1” and the winter generated power ratio is “0.7,” a winter shadow or snow on the modules is assumed. The criterion for diagnosis in this situation is “1”. The contribution of the proposed method is highlighted in its features, as follows: By updating the diagnostic criteria, it is now feasible to diagnose the normality or abnormality of PV systems, while taking into account the PV system’s characteristics, as well as the climate; where a shadow appears on the modules or pyranometer is determined using the SV approach and hourly data analysis; and maintenance recommendations are also given based on the diagnosis outcome. The simulation results of the proposed technique suggest that it offers quick and proper maintenance advice within a short detection period. In [
121], a simple short-circuit and open-circuit fault detection approach for PV systems was suggested based on the evaluation of three coefficients. The suggested technique has two steps. First, an offline simulated model for extracting the variation boundaries of the three coefficients for each faulty operation. Second, an online comparison model for comparing real measured coefficients to the simulated coefficients from the offline step. Three coefficients have been established for each fault type in order to detect and diagnose both short-circuit and open- circuit faults, namely the current coefficient, the voltage coefficient, and the power coefficient. The offline step is aimed at extracting the three coefficients’ variation boundaries for each type of fault. In order to achieve this, three other operations are conducted. By bringing the detected parameters to a PSIM/MATLAB co-simulation, you may simulate both the healthy and flawed scenarios under a few climatic situations. For each simulated instance, the goal of this stage is to extract a few MPP coordinates. Based on the given equations, determine the three coefficients for each fault situation, then by adding a ±2% offset to the three derived coefficients, you may extract the variation boundaries for each defective type. For the online step, using the various sensors, both the meteorological conditions and MPP values may be detected and monitored during the actual operation of a PV system. The three actual onsite coefficients will be calculated using these measures. Finally, a comparison is made between the real onsite coefficients and the variation boundaries of each faulty case that was previously stored during the offline process. To conclude, the faults detection task will be carried out based on the real onsite monitored power coefficients measured, in a way that if their value exceeds a set threshold, a DC side fault alarm will be triggered. In addition, the faults’ type will be determined by comparing the three real onsite coefficients with the variation boundaries of each simulated faulty case. The proposed method is straightforward, efficient, and does not necessitate a large amount of training data. the authors of [
71] presented a data-driven anomaly detection and classification system that can accurately detect and categorize a wide range of PV system anomalies. The method consists of two stages. First, the local context-aware detection (LCAD), which is a hierarchical context-aware anomaly detection using supervised learning, and is aimed at identifying possible anomalies in PV strings with current characteristics that are different from the other PV strings under similar environmental conditions. Second, the remote context-aware detection (RCAD), which is a hierarchical context-aware anomaly detection using supervised learning, and is aimed at identifying possible anomalies in PV strings with current characteristics that are different from solar PV farms and benefit from a combination of LCAD and GCAD to detect anomalies at the string level. First, the domain-specific features are designed. To reduce computation complexity and increase classification performance, the multimodal properties are carefully generated and extracted. Then, with the purpose of developing an accurate classification model that is suitable for specific categorization situations, a multimodal model training technique is constructed. The effectiveness, robustness, cost-, and computing efficiency of the suggested strategy are proved by the results of trials conducted over time. The proposed method has the following advantages: A more robust method against irradiance and weather variations that can accurately detect different anomalies without pre-labelled data; 90.2% detection accuracy for the top 100 anomalies that are otherwise nearly undetectable under low irradiance or weather with high cloud cover; the use of SCADA data to classify commonly occurring anomalies at the plant level; and cost- and computation-efficient as it uses readily available data of existing PV systems. Numerous machine learning-based fault detection methods have the following problems, according to the authors in [
122]. Fault diagnosis performance is limited due to the insufficient monitored information. Moreover, fault diagnosis models are inefficient to train and update, and labeled fault data samples are difficult to obtain by field experiments. The authors proposed a method with the aim of overcoming these problems and three features were addressed. The first is based on important points and model parameters collected from I-V characteristic curves and environmental factors that are observed. An effective and efficient feature vector of seven dimensions is proposed as input of the model. The second is an emerging kernel based on extreme learning machine (KELM), which features extremely fast learning speed and good generalization performance, utilized to automatically establish the fault diagnosis model. The Nelder-Mead simplex (NMS) optimization method is employed to optimize the KELM parameters, which affect the classification performance. The final aspect is an improved accurate SIMULINK-based PV modeling approach for a laboratory PV array to facilitate the fault simulation and data sample acquisition. There are six steps leading to the establishment of the proposed model, as shown in
Figure 10.
The data samples for each fault condition should cover a wide range of operational irradiance and temperature, in order to make the fault diagnosis model suitable for a variety of operating settings. To begin, certain SIMULINK simulation experiments were used to obtain labeled data samples of normal and problematic situations. Then, on the real laboratory PV array, some field experiments were conducted to achieve some experimentally labeled data samples. Finally, the fault diagnostic model is established using the optimized KELM, which is evaluated and analyzed using both simulated and experimental data samples with known fault kinds. The proposed KELM-based fault detection model is promising in real-time applications due to its exceptionally fast learning speed, simplicity, and high generalization performance. The authors are attempting to apply the fault diagnosis model in digital signal processor (DSP) based embedded real-time systems, in conjunction with an integrated rapid I-V tester that is currently in development. The authors of [
123] presented outlier detection rules based on instantaneous PV string current monitoring for failure detection. It is a command to monitor PV functioning and discover faults that may go undetected by overcurrent protection devices (OCPD). Three outlier identification rules were devised and compared by the authors, namely the three-sigma rule, Hampel identifier, and boxplot rule. Weather measurement or model training are not required with the suggested strategy. The Hampel identifier performs well in cases with extremely high contamination levels (33.3% in this investigation), while the boxplot rule performs better under PV faults in cases with relatively high contamination levels (12.5% in the case of this study). The model’s reliability improves as the number of PV measurements rises. Despite the fact that the outlier identification methods in this study are based on PV-string level measurements, the authors claim that the proposed approaches should be straightforward to implement with minor modifications on any PV installation level. If the assumption is made that the solar irradiation is identical on the same PV level, the outlier rules can be applied on the PV-module or sub-array level, for example. Aside from the PV string current, the measurement could include PV insulation impedance, output power or energy yield, all of which are commonly used PV metrics. This may provide extra flexibility to fault detection methods. To overcome the limitations of conventional wired monitoring systems, such as physical constraints during data cable laying, high installation and maintenance costs, and reduction in the system lifespan due to the over exposure to extreme weather conditions, a Zigbee-based wireless monitoring system was developed in [
124] to replace the conventional systems for online monitoring of parameters, such as temperature, irradiation, PV power output, and grid inverter power output, in grid-connected PV system applications. Moreover, it is equipped with a control function for remote system monitoring and a user-friendly web application, in order for the monitored data to be easily accessible via the Internet. Although the simulation results were satisfactory, the authors pointed out the limitations of the proposed method. These limitations include: (1) The proposed method is location specific. Therefore, before implementing the system in other locations with significantly different weather conditions, the weather factor needs to be taken into consideration. (2) The program used was developed based on the available software and programming language familiar to the authors. In [
125], a failure diagnostic algorithm based on an online distributed monitoring system of a PV array of Zigbee wireless sensors network and a genetic algorithm optimization based BP neural network was investigated. The Zigbee wireless network system monitors each module’s output current, voltage, and irradiation, as well as the environment’s temperature and irradiation. In addition, a simulation PV module is set up, based on which typical problems are simulated and fault training samples are obtained. The fault sample data are then utilized to build and train a generic algorithm optimized BP neural network diagnosis model, which is subsequently used to detect four different PV array operating states (normal, abnormal aging, short-circuit, shadow). Since an open-circuit problem is noticed during the data collecting phase, it is not considered one of the diagnosis model’s outputs. According to the simulation data, the proposed defection system has a high level of accuracy. Operators or managers can log in to verify the parameters of each PV module and use the designed mechanism to quickly discover the problematic PV module. In relation to the PV energy conversion system (PVECS), the authors of [
126] presented a fault detection system using a fractional-order color relation classifier. The output power degradation is used to monitor the physical circumstances associated with changes in the circuitry of a PV array, such as grounded faults, mismatch faults, bridged faults between two PV panels, and open-circuit faults, using an electrical inspection method. The over-current and ground fault prevention devices can also be used to isolate failures on the AC side. As a result, the grid connection side fault impact can be reduced. Iterative calculations are not required to update the parameters of the inference model in the flexible and inferential model. As a result, it can handle the complexity of an adjustable mechanism in a relatively short design cycle. Embedded system approaches can then be used to implement the proposed detection model. The suggested approach can detect normal conditions, mismatch faults, and four common electrical defects on the DC side, according to the simulation results. For solar radiation of 0.4–1.0 kW/m
2 and temperatures of 25–40 °C, the suggested detection model has an average accuracy of 88.23% in identifying the fault under low/high solar radiation and various temperatures. The authors of [
127] presented another interesting fault detection and diagnosis method based on a laterally primed adaptive resonance theory (LAPART) neural network. It is a low-cost way of automatically detecting and diagnosing PV system issues. The LAPART algorithm was taught how to detect fault states using real-world data that were classified as normal system behavior. The algorithm was then given new data and three-fault data points for an initial test. The system was given synthetic data to examine its performance over a statistically significant month-long dataset, and it was able to correctly identify flaws within the dataset. The LAPART algorithm’s accuracy is determined by its ability to deliver a high likelihood of detection, while reducing false alarms. The number of true positive values generated by the FDD process is compared to the total number of actual positive values to determine the likelihood of detection. The LAPART architecture combines two fuzzy adaptive resonance theory (ART) algorithms to build a system for predicting outcomes based on the learnt associations. The single fuzzy ART algorithm’s fundamental equations include category selection, match criterion, and learning. The goal is to create the optimal template matrix for the provided dataset. The approach employs category selection to discover the existing template matrix that best matches the provided input. In addition, for fast learning applications, the free parameter is frequently set to 10-7. The match criterion then checks to verify if the template matrix and input that is compared fulfill the user-defined vigilance parameter criterion. Depending on the level of intricacy requested, the vigilance free parameter can range from 0 to 1. A high vigilance value of 0.9, for example, yields high complexity but limited generality, whereas a low parameter of 0.5 yields the opposite. Finally, if it passes, the template is changed to reflect what has been learned. The LAPART algorithm is created by linking the two fuzzy ARTs (FARTs), which is seen graphically in
Figure 11. The L matrix, which connects the A and B templates, connects the A and B FARTs. Each FART has its own set of vigilance settings, and inputs are delivered to both the A and B sides at the same time during the learning process. The A and B sides work together to generate and update the templates, while also forming links. Testing inputs are only applied to the A side after the training is complete, allowing them to resonate with the already acquired templates. The L matrix’s relationships are then used to link with the B side and generate the prediction results.
The approach provided in [
128] is based on monitoring the PV array’s output power and is suitable for low irradiance, high impedance, and low mismatch fault circumstances. The irregularity of the time series of the normalized fault-imposed component of PV power is measured using entropy-based complexity as the fault detection criterion. Weather disturbances and partial shade can cause many array faults, which the proposed method can identify. It is applicable to both grid-connected and islanded PV systems and does not require a training set or prior knowledge of the PV array. Moreover, it is an economical strategy as it does not require costly sensors, relying only on the central IED to process the PV voltage and current measurements. The irregularity of the fault imposed power time series is measured by the sample entropy. The study uses the sample entropy-based complexity as the PV array fault detection index (FDI), since the complexity of time series data more effectively captures the behavior of a nonlinear system. The fault-imposed component of the PV array power is zero during the normal operation. As a result, the time series of moving data windows is regular. Therefore, SampEn is equal to zero. The fault-imposed power samples in each moving data window of N points are not identical when the solar irradiance or temperature varies, but they are fairly close together, since weather disturbances are not severe. As a result, FDI will be near-zero in this situation. When a fault develops in the PV array, however, the fault-imposed power samples rapidly shift. As a result, the normal fault-imposed power samples differ dramatically from the post-fault ones. Therefore, non-repetitive patterns can be found in the moving data windows during the initial milliseconds of fault transients, and the estimated SampEn is not zero. The issue is recognized when FDI rises to a non-zero value. It may be concluded that FDI for normal occurrences is approximately zero, whereas FDI for fault events is non-zero. A defined threshold is used to discriminate between non-zero FDI values under fault situations and near-zero FDI values during weather disturbances and partial shadings. As a result, determining the fault detection threshold is simple. It can considerably reduce nuisance tripping. Several experiments that were carried out validate the proposed fault detection algorithm’s simplicity, sensitivity, scalability, resilience, and adaptability.
Table 7.
Summary of other methods.
Table 7.
Summary of other methods.
| Authors | Reference | Year | Contribution |
|---|
| Y. Zhao, R. Ball, J. Mosesian, J. De Palma, B. Lehman | [13] | 2015 | Graph-based semi-supervised learning algorithm for PV fault detection and classification |
| H. Momeni, N. Sadoogi, M. Farrokhifar, H.F. Gharibeh | [117] | 2020 | Graph-based semi-supervised learning method of PV array fault diagnosis and correction |
| Y. Wu, Z. Chen, L. Wu, P. Lin, S. Cheng, P. Lu | [118] | 2017 | SA-RBF kernel extreme learning machine-based intelligent fault diagnosis for PV array |
| Y. Yagi et al. | [119] | 2003 | Diagnostic technology and expert system for PV system using the learning method |
| E. Garoudja, K. Kara, A. Chouder, S. Silvestre, S. Kichou | [121] | 2016 | Short- and open-circuit fault detection in PV system based on the offline and online evaluation of measured coefficient |
| Y. Zhao, Q. Liu, D. Li, D. Kang, Q. Lu, L. Shang | [71] | 2019 | Hierarchical context-aware anomaly detection using the unsupervised learning and multimodal anomaly classification method |
| Z. Chen, L. Wu, S. Cheng, P. Lin, Y. Wu, W. Lin | [122] | 2017 | Optimized kernel extreme learning machine and I-V characteristics based intelligent fault diagnosis in PV array |
| Y. Zhao, B. Lehman, R. Ball, J. Mosesian, J.F. De Palma | [123] | 2013 | Outlier detection based rules for solar PV array fault detection |
| F. Shariff, N.A. Rahim, W.P. Hew | [124] | 2015 | Online monitoring of grid-connected PV system based on the Zigbee data acquisition system |
| H. Lin, Z. Chen, L. Wu, P. Lin, S. Cheng | [125] | 2015 | Online monitoring and fault diagnosis of PV array based on the genetic algorithm optimized BP neural network |
| C.L. Kuo, J.L. Chen, S.J. Chen, C.C. Kao, H.T. Yau, C.H. Lin | [126] | 2017 | PV energy conversion system fault detection using the fractional order color relation classifier |
| C.B. Jones, J.S. Stein, S. Gonzalez, B.H. King | [127] | 2015 | Photovoltaic system fault detection and diagnostics using the laterally primed adaptive resonance theory neural network |
| A. Khoshnami, I. Sadeghkhani | [128] | 2018 | PV array fault detection based on sample entropy |


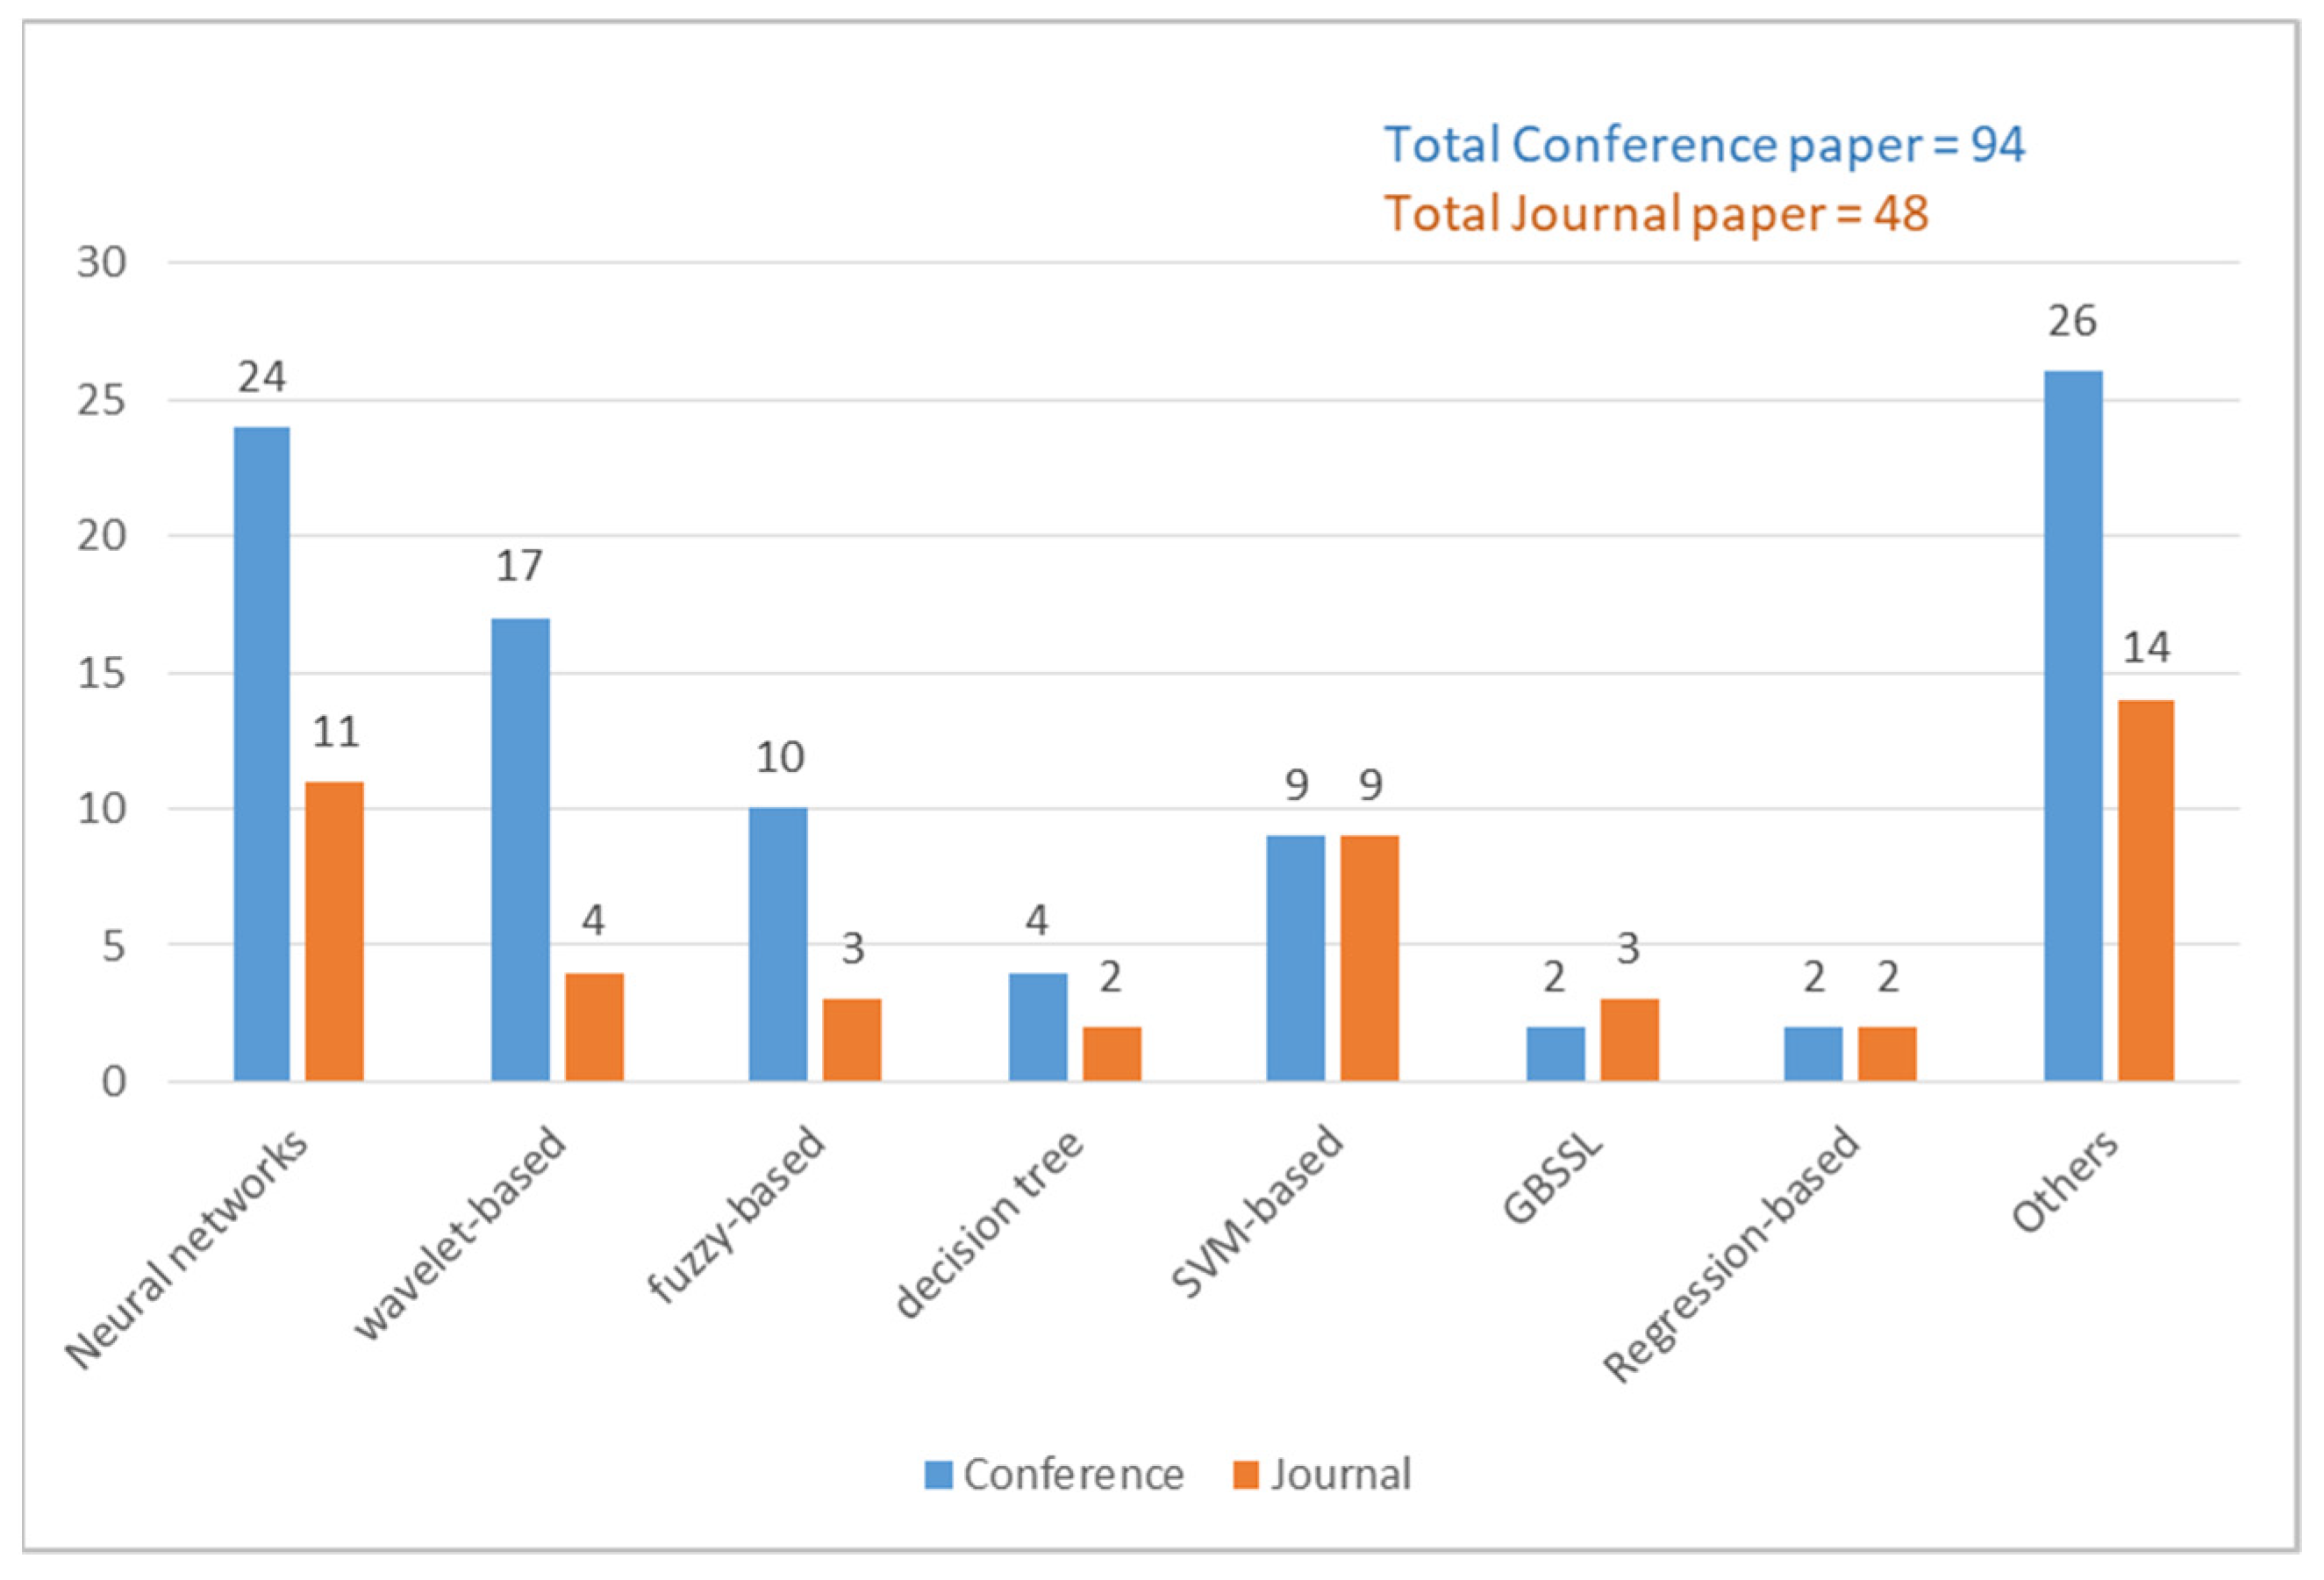
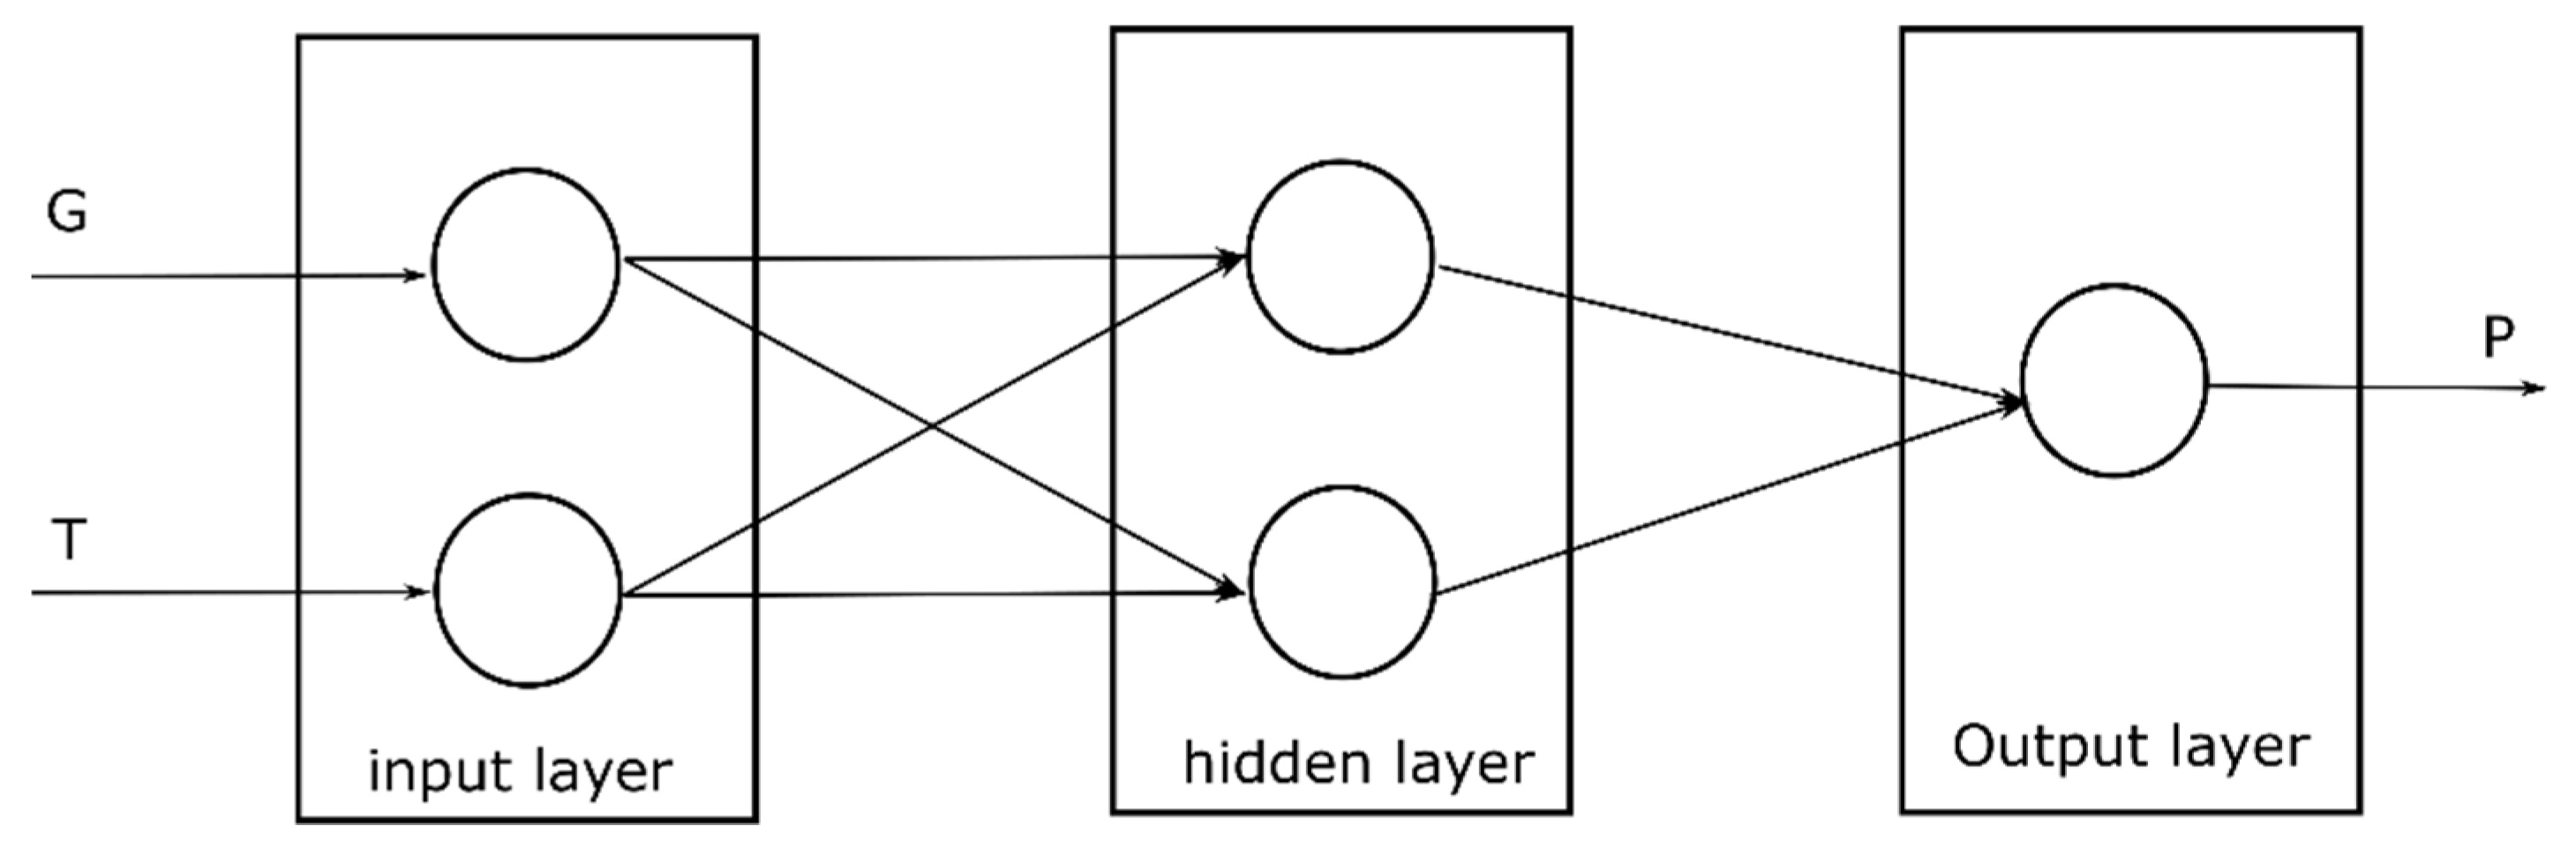
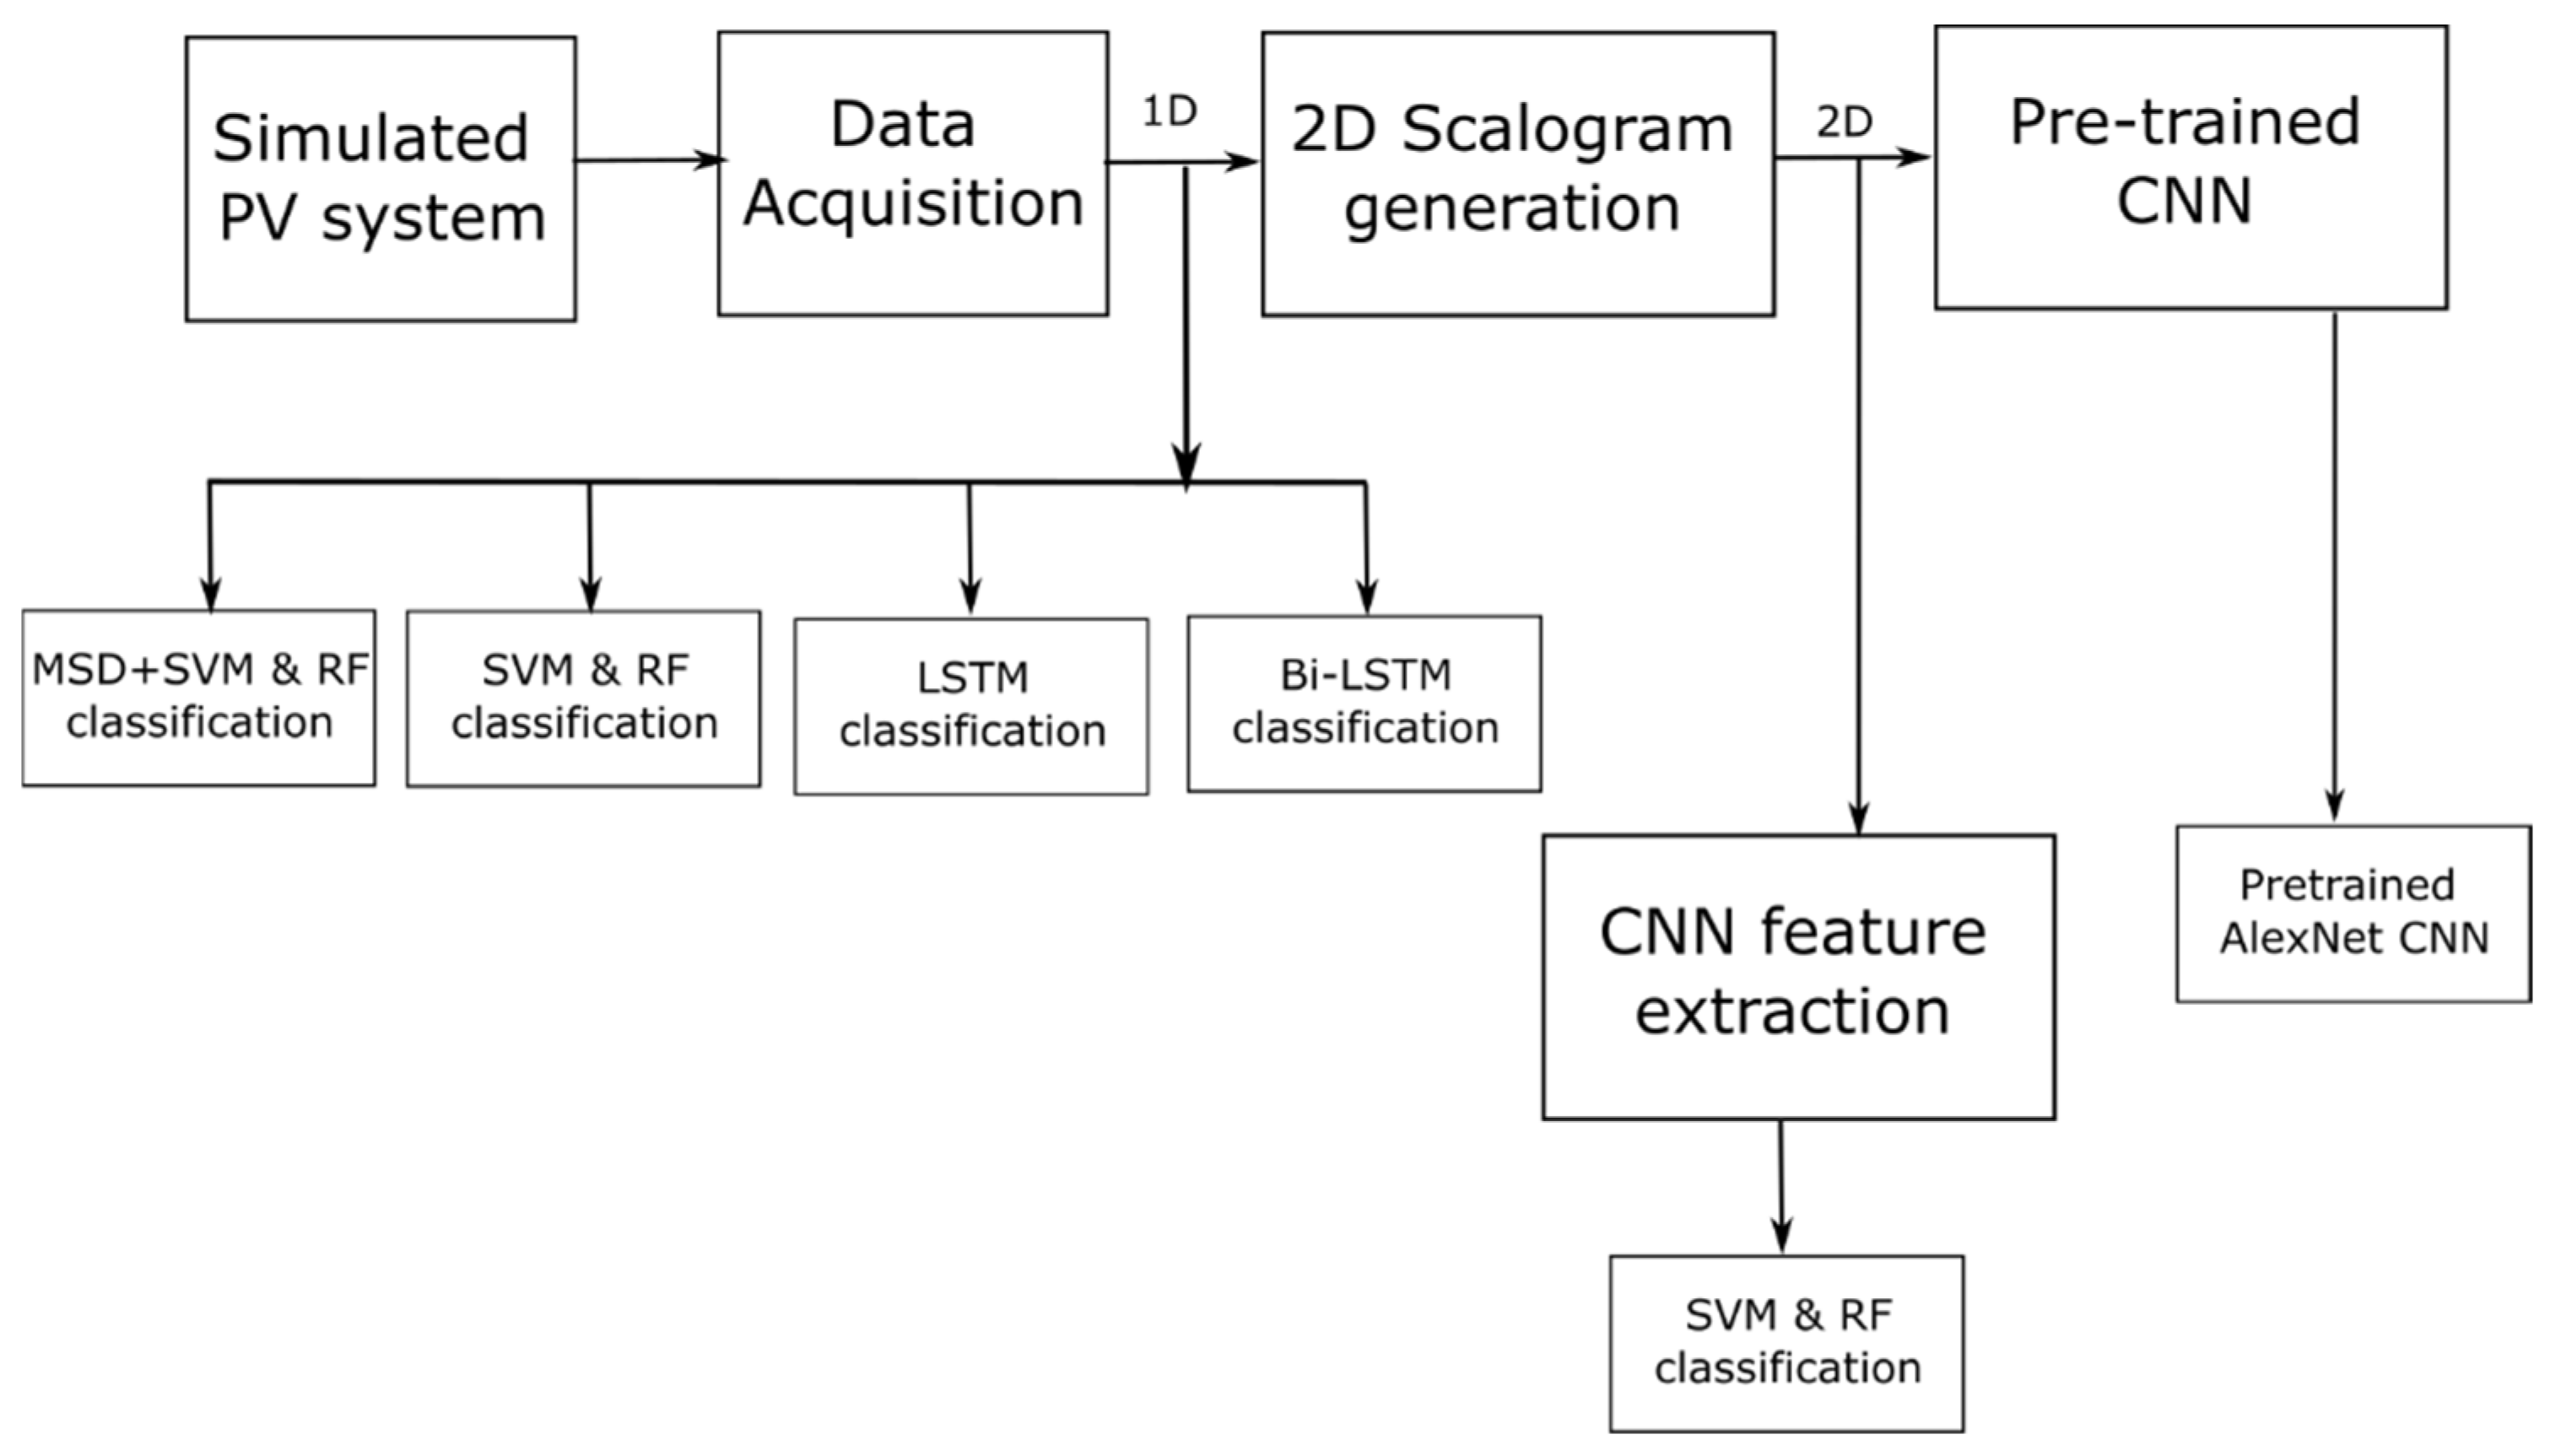
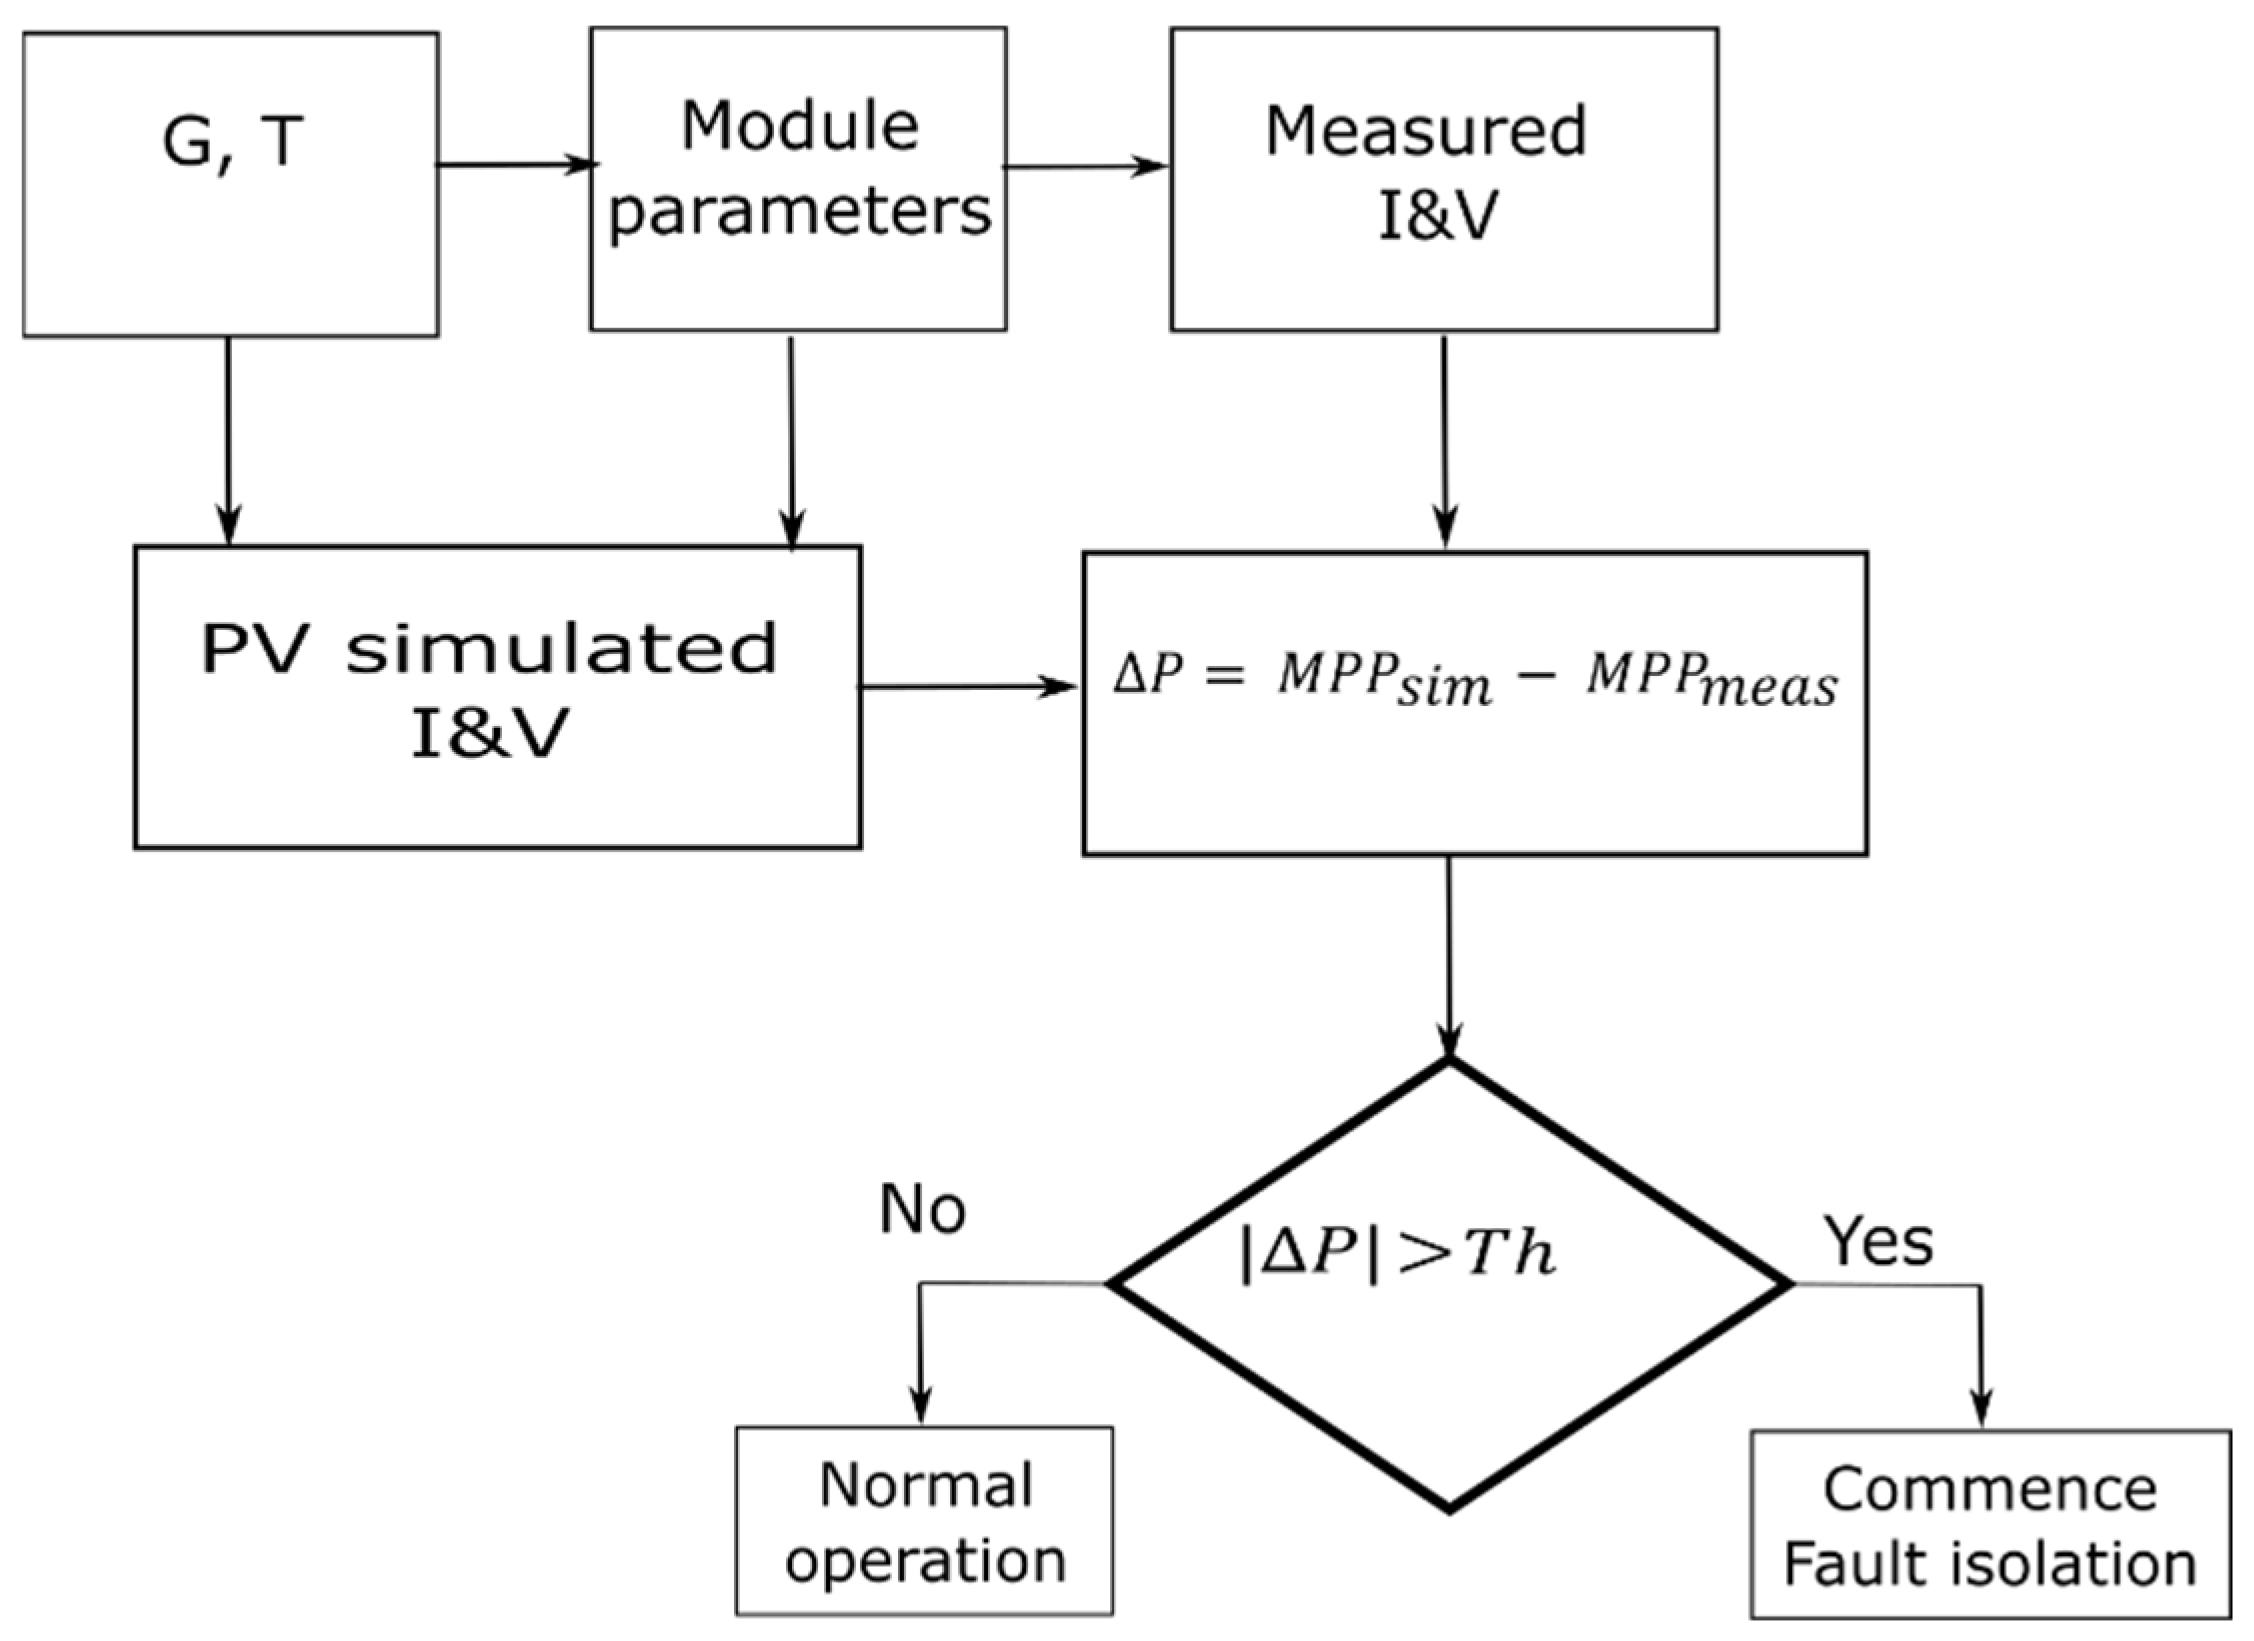
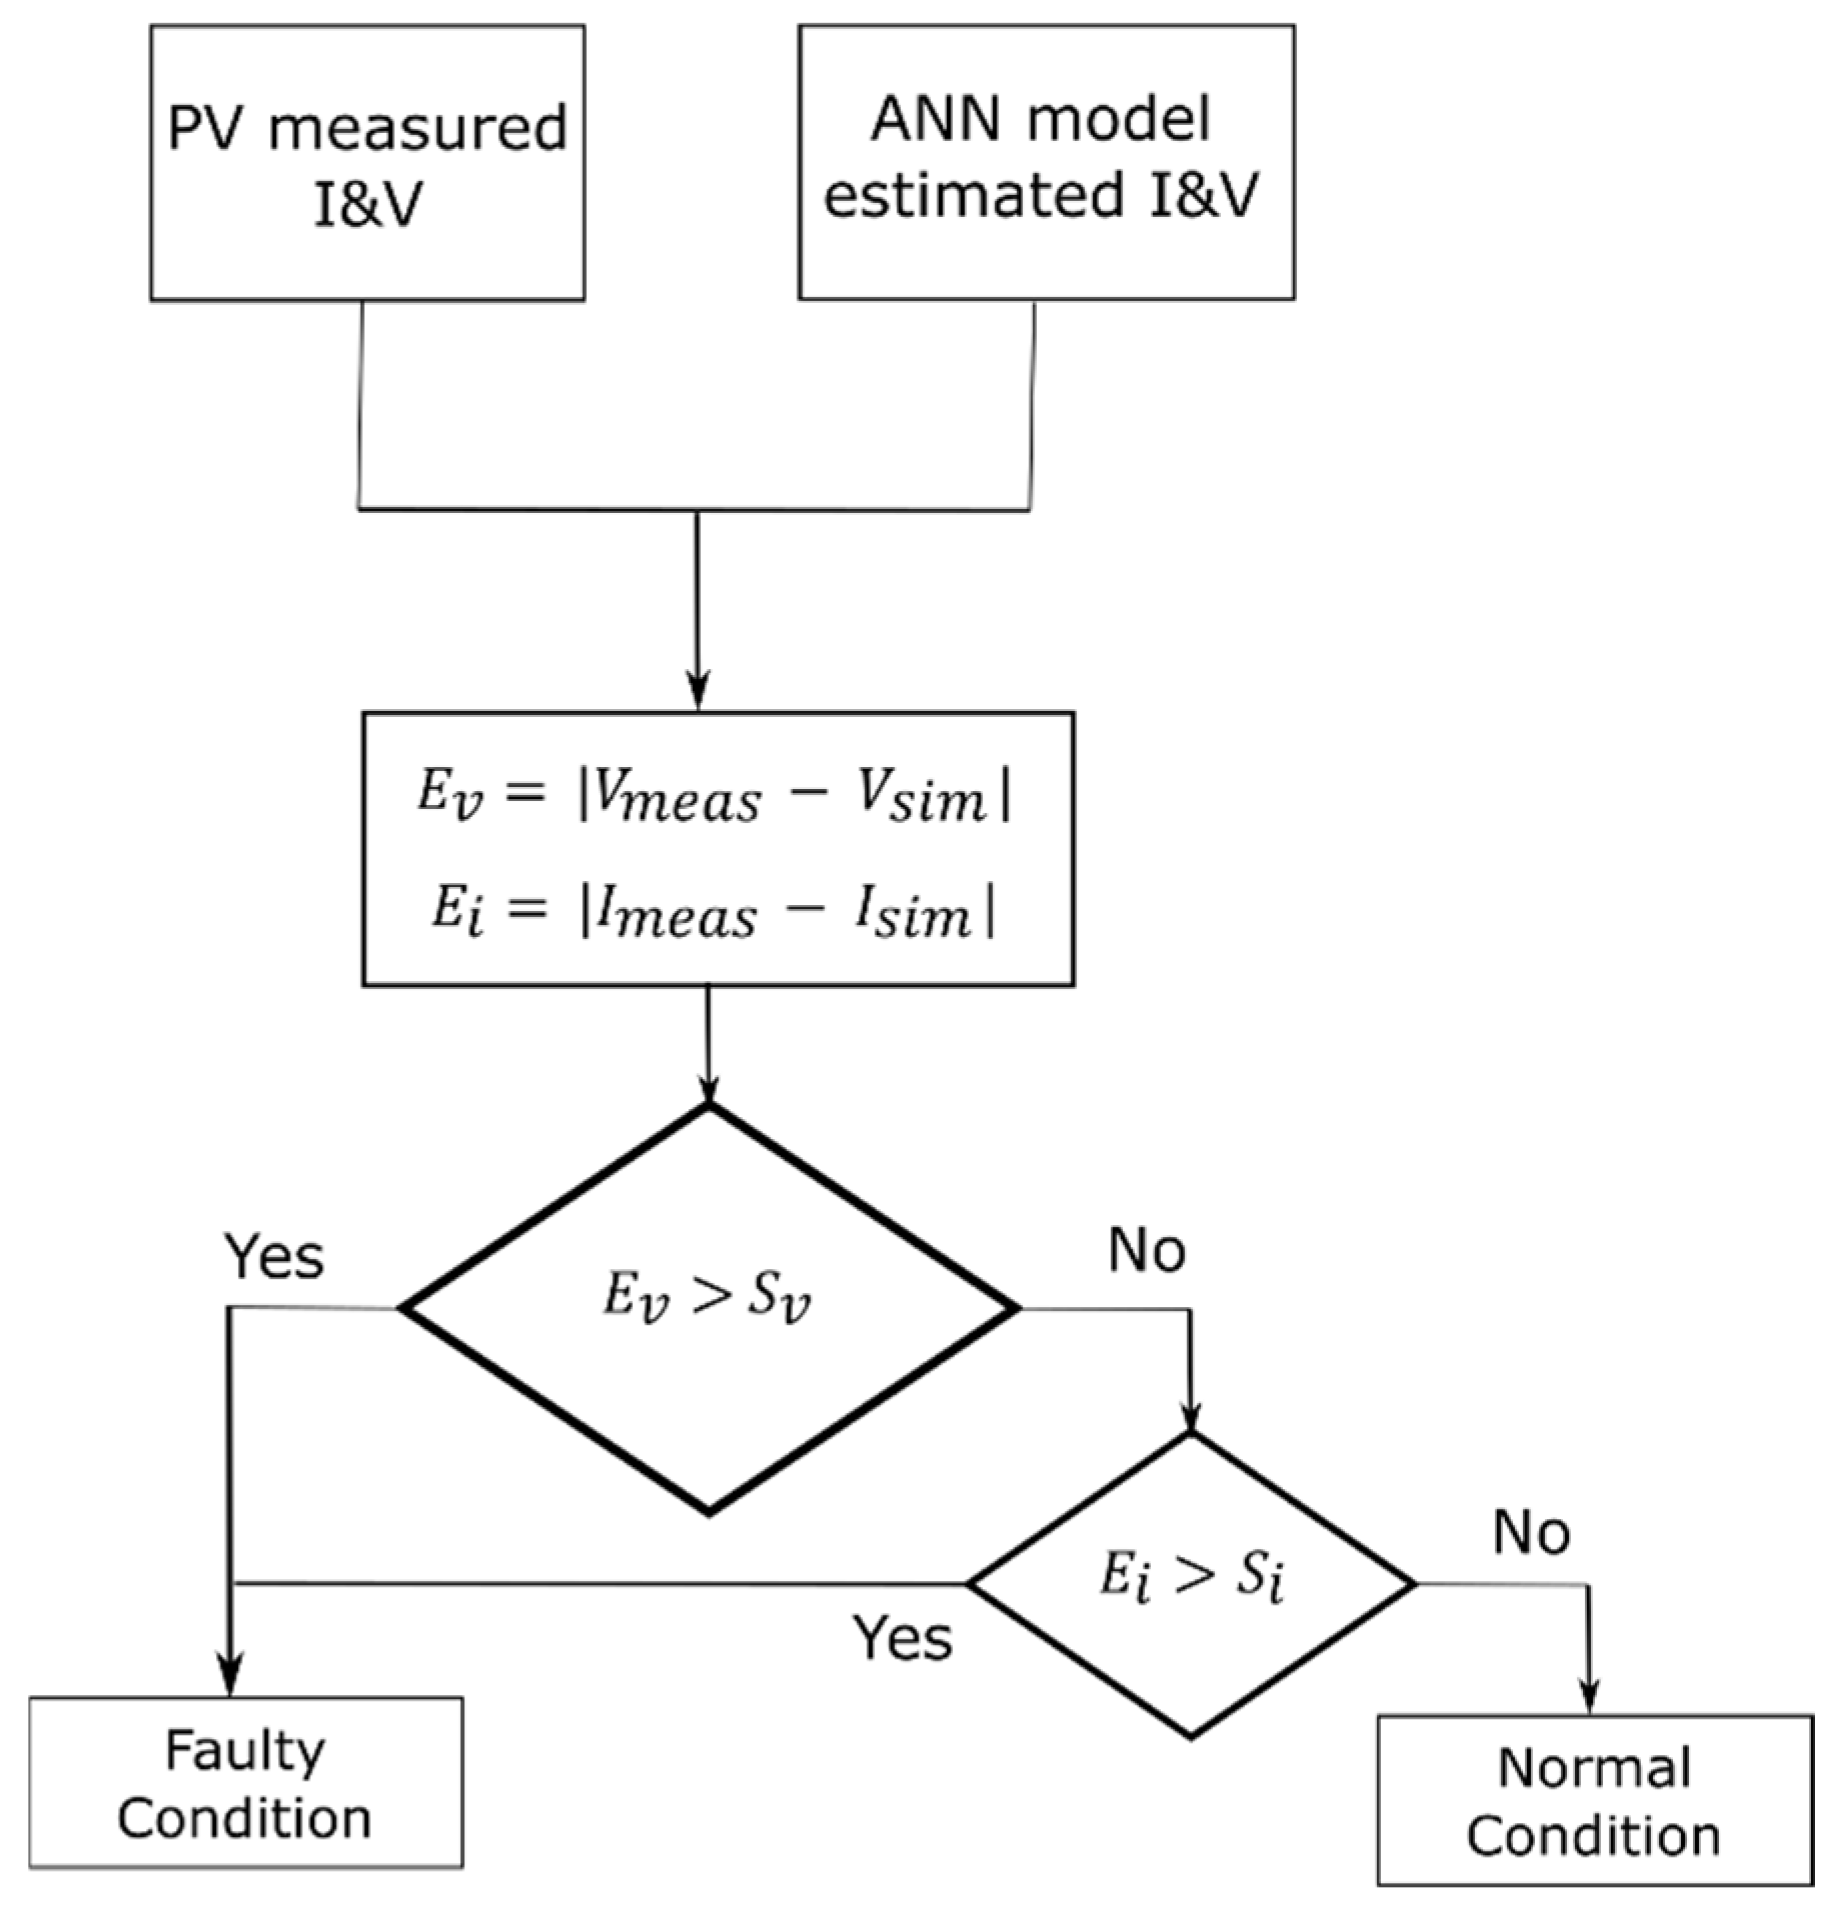
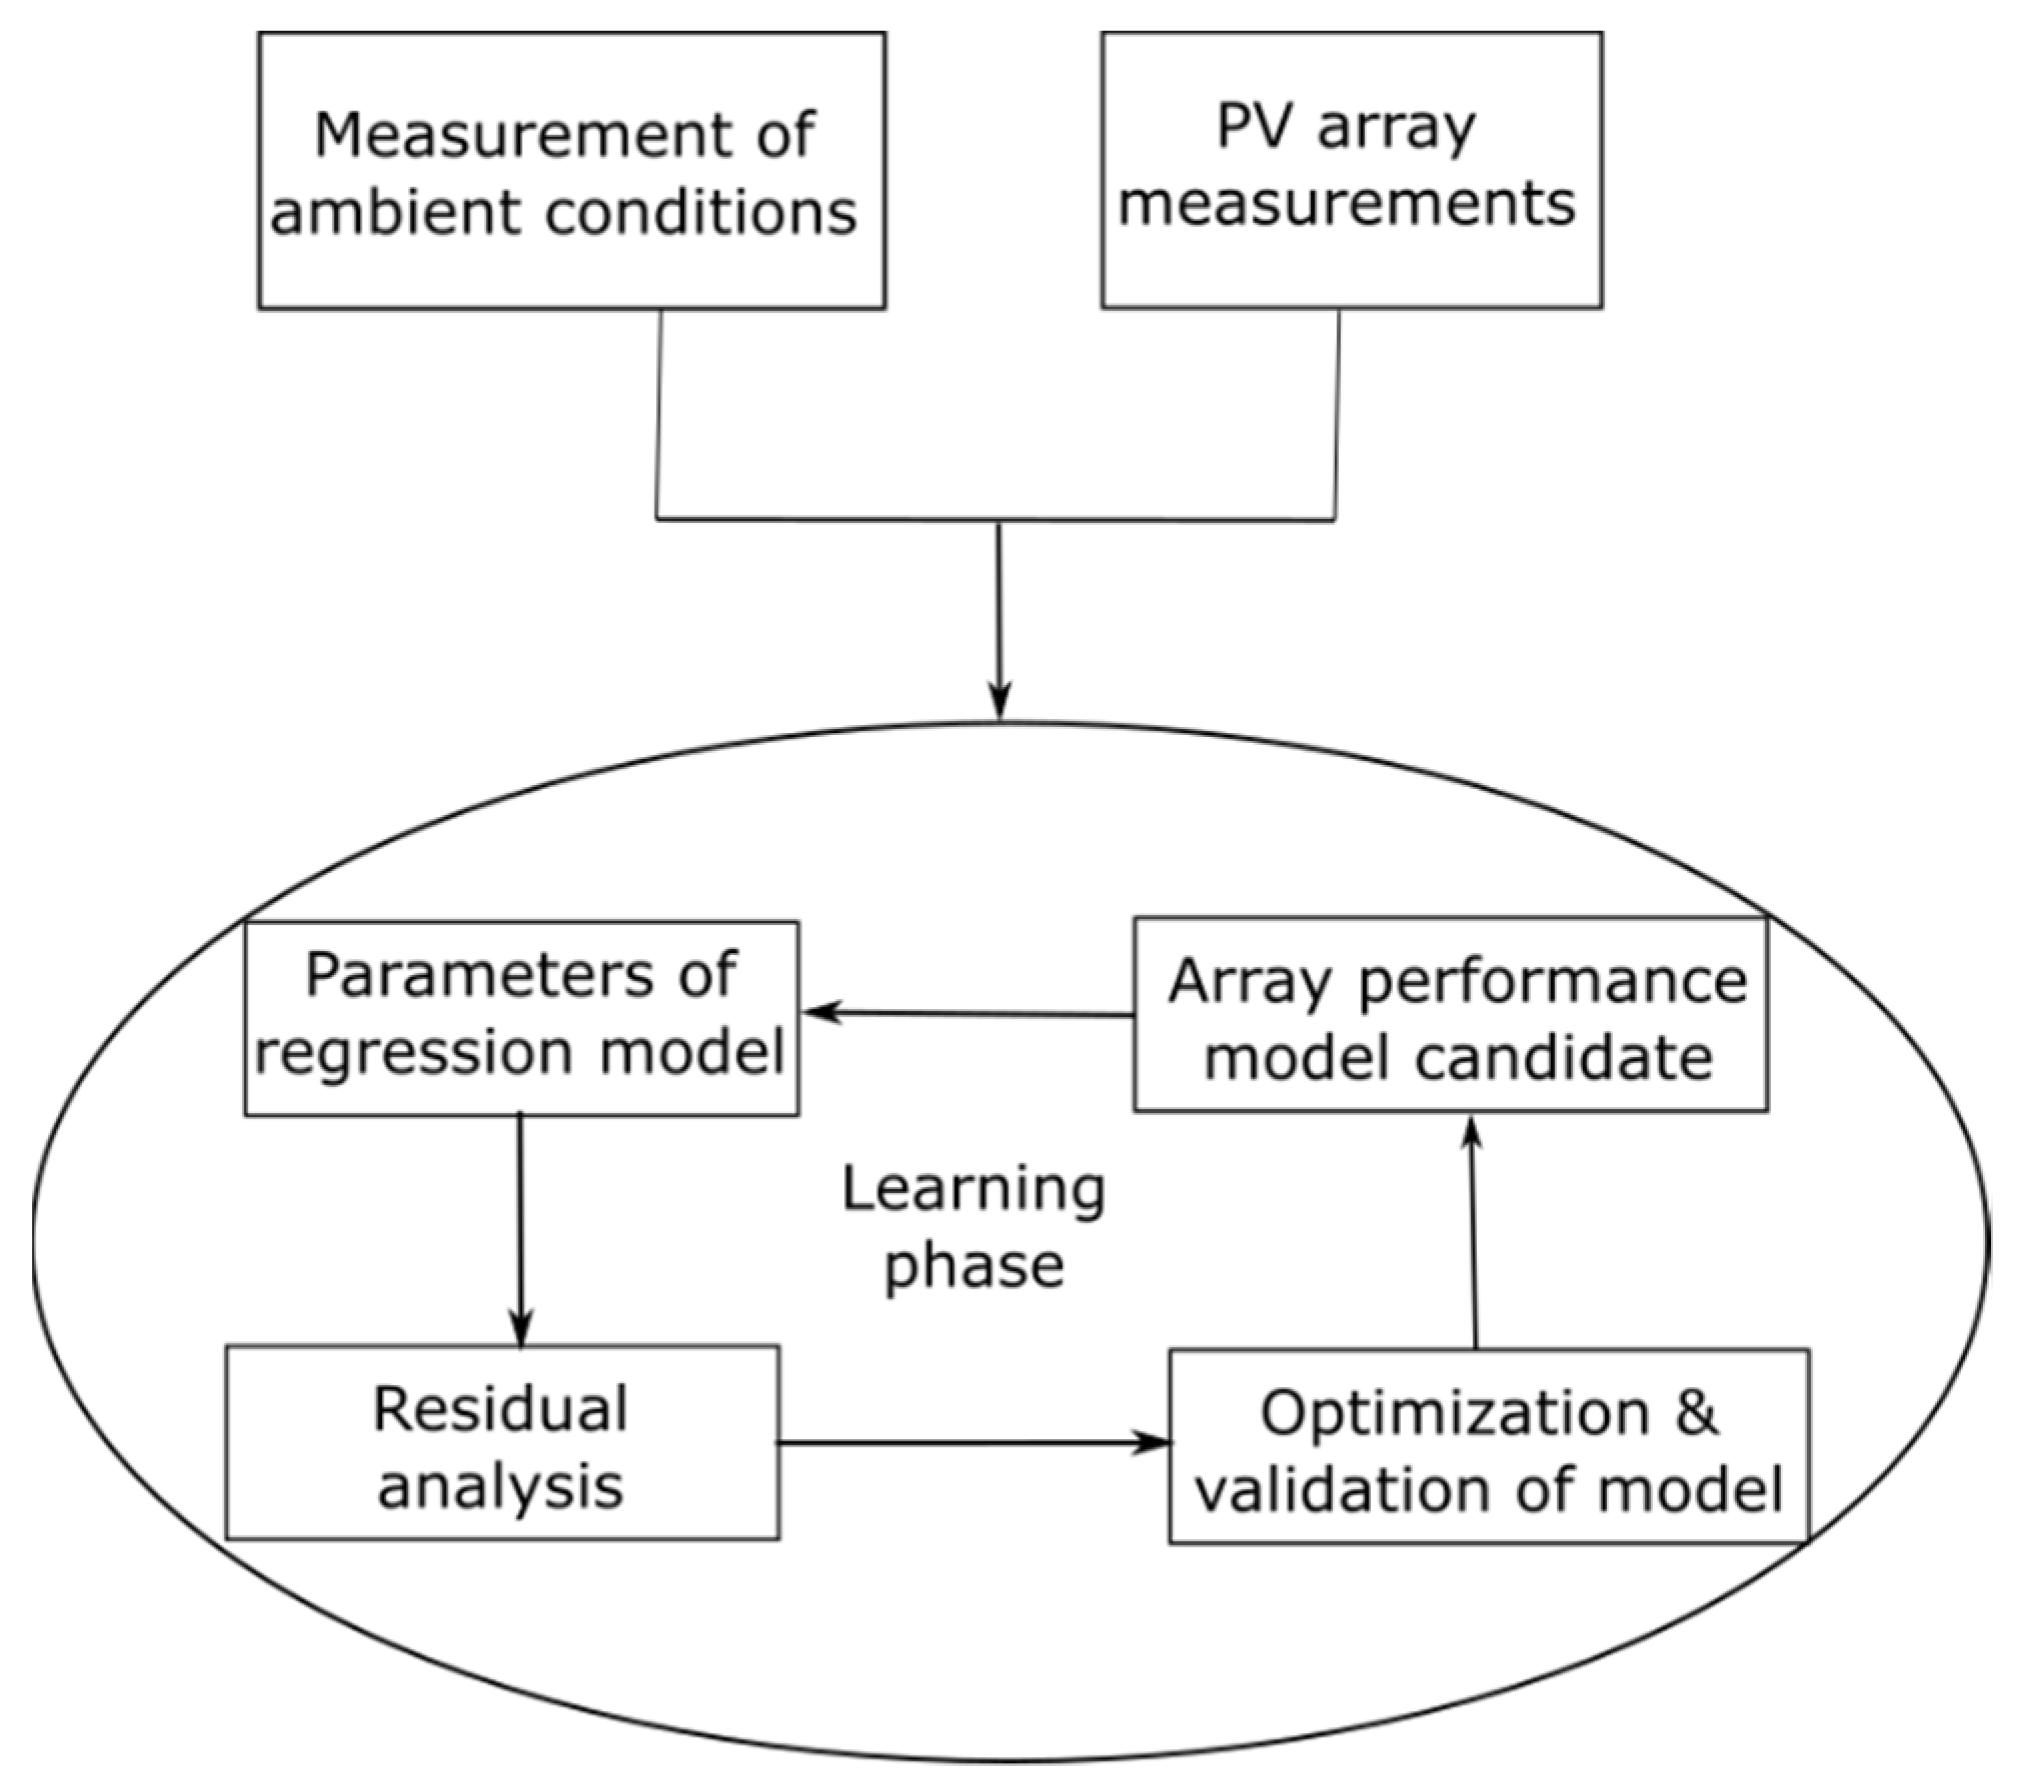
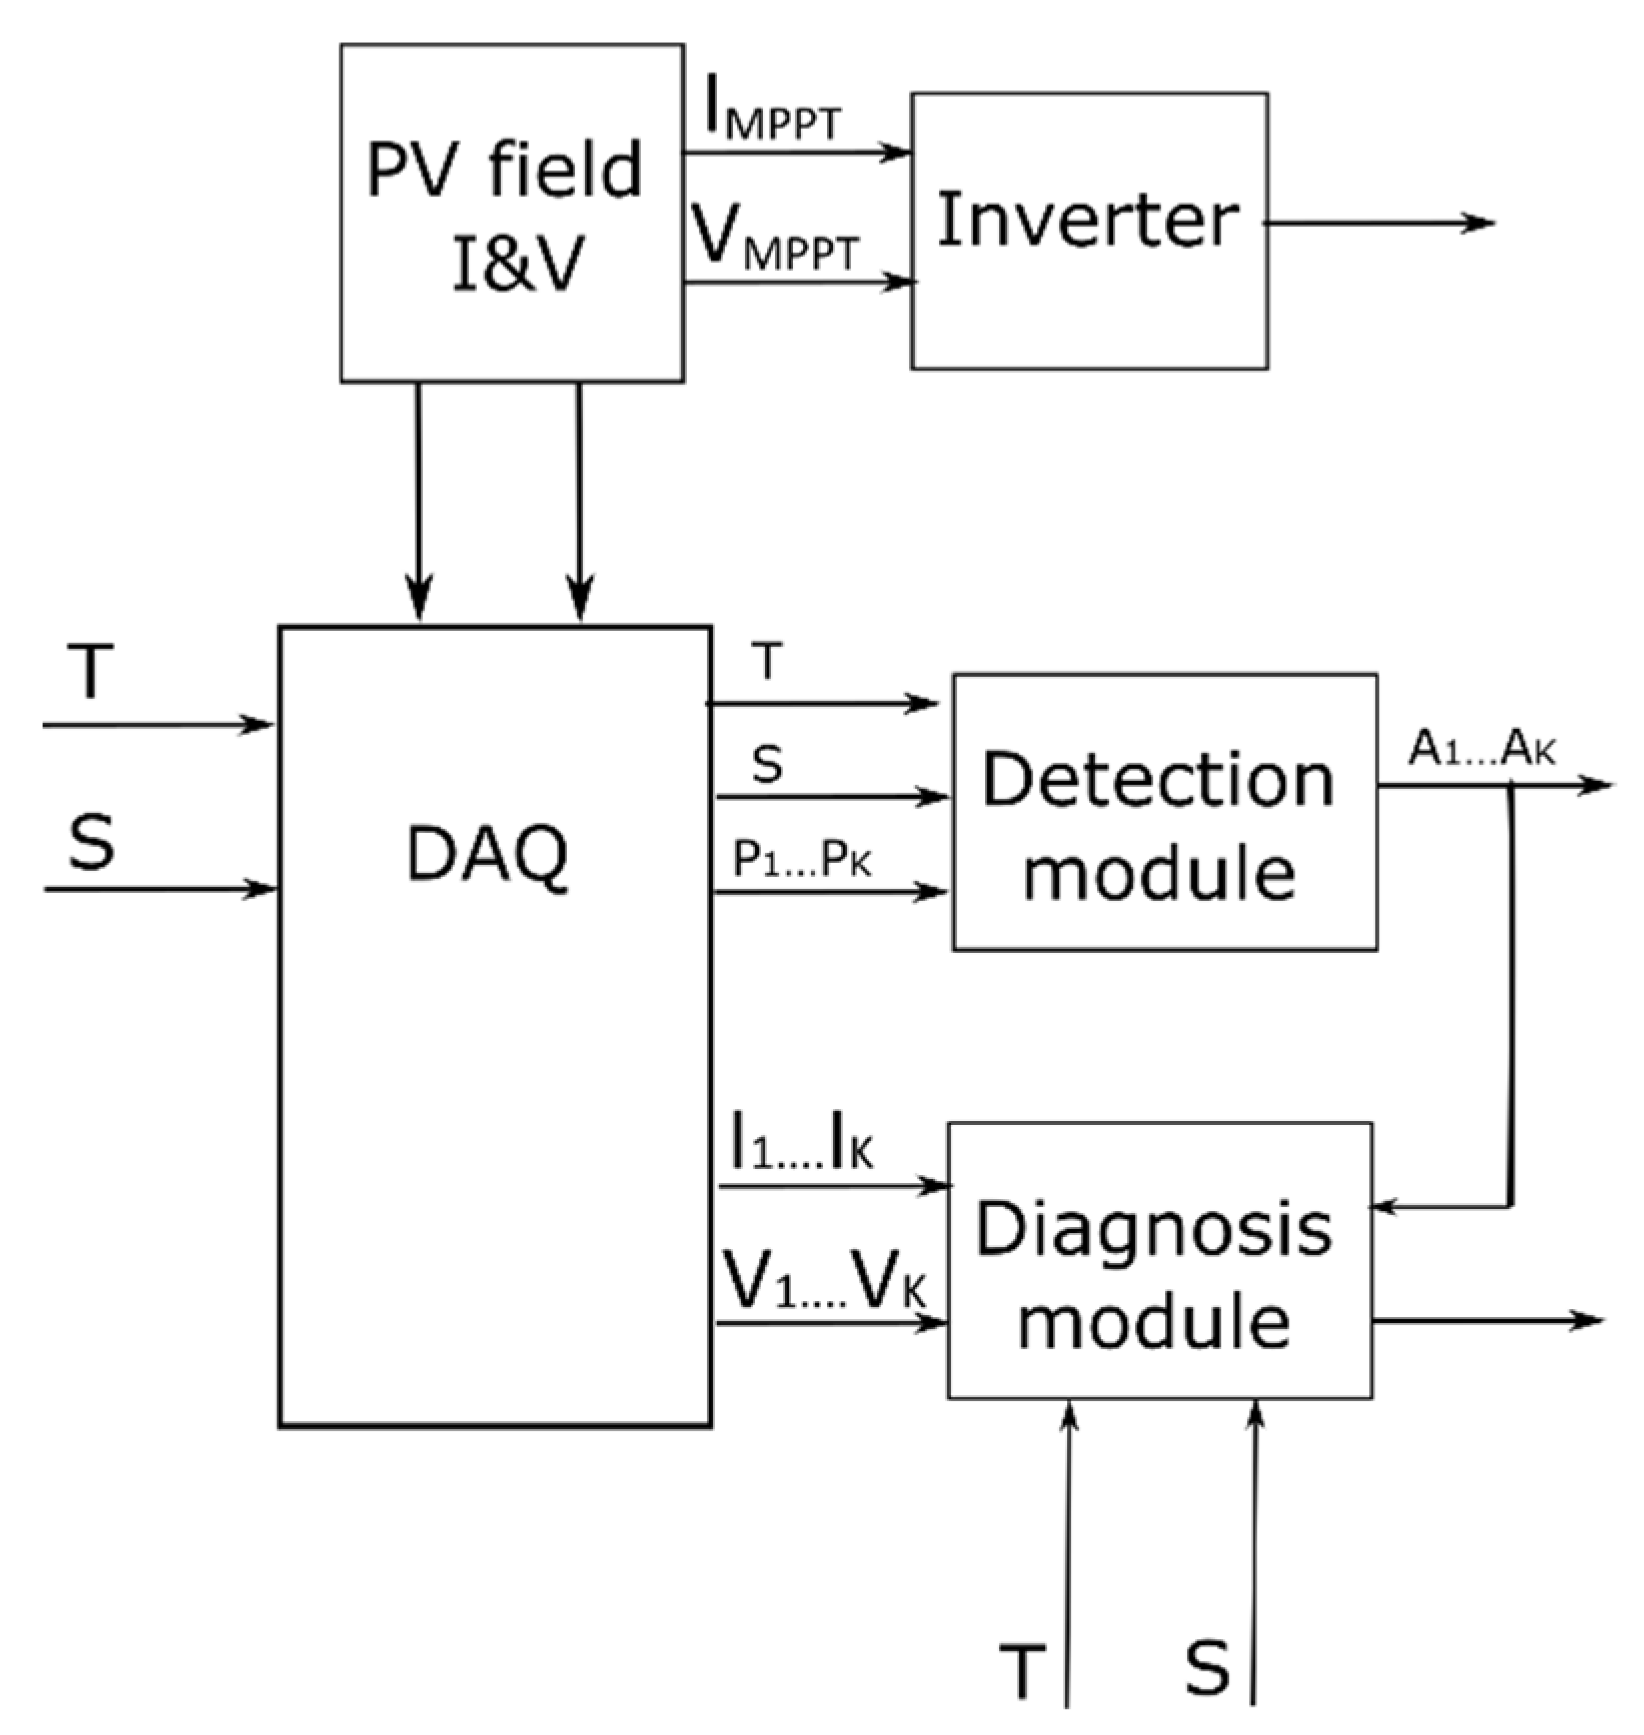
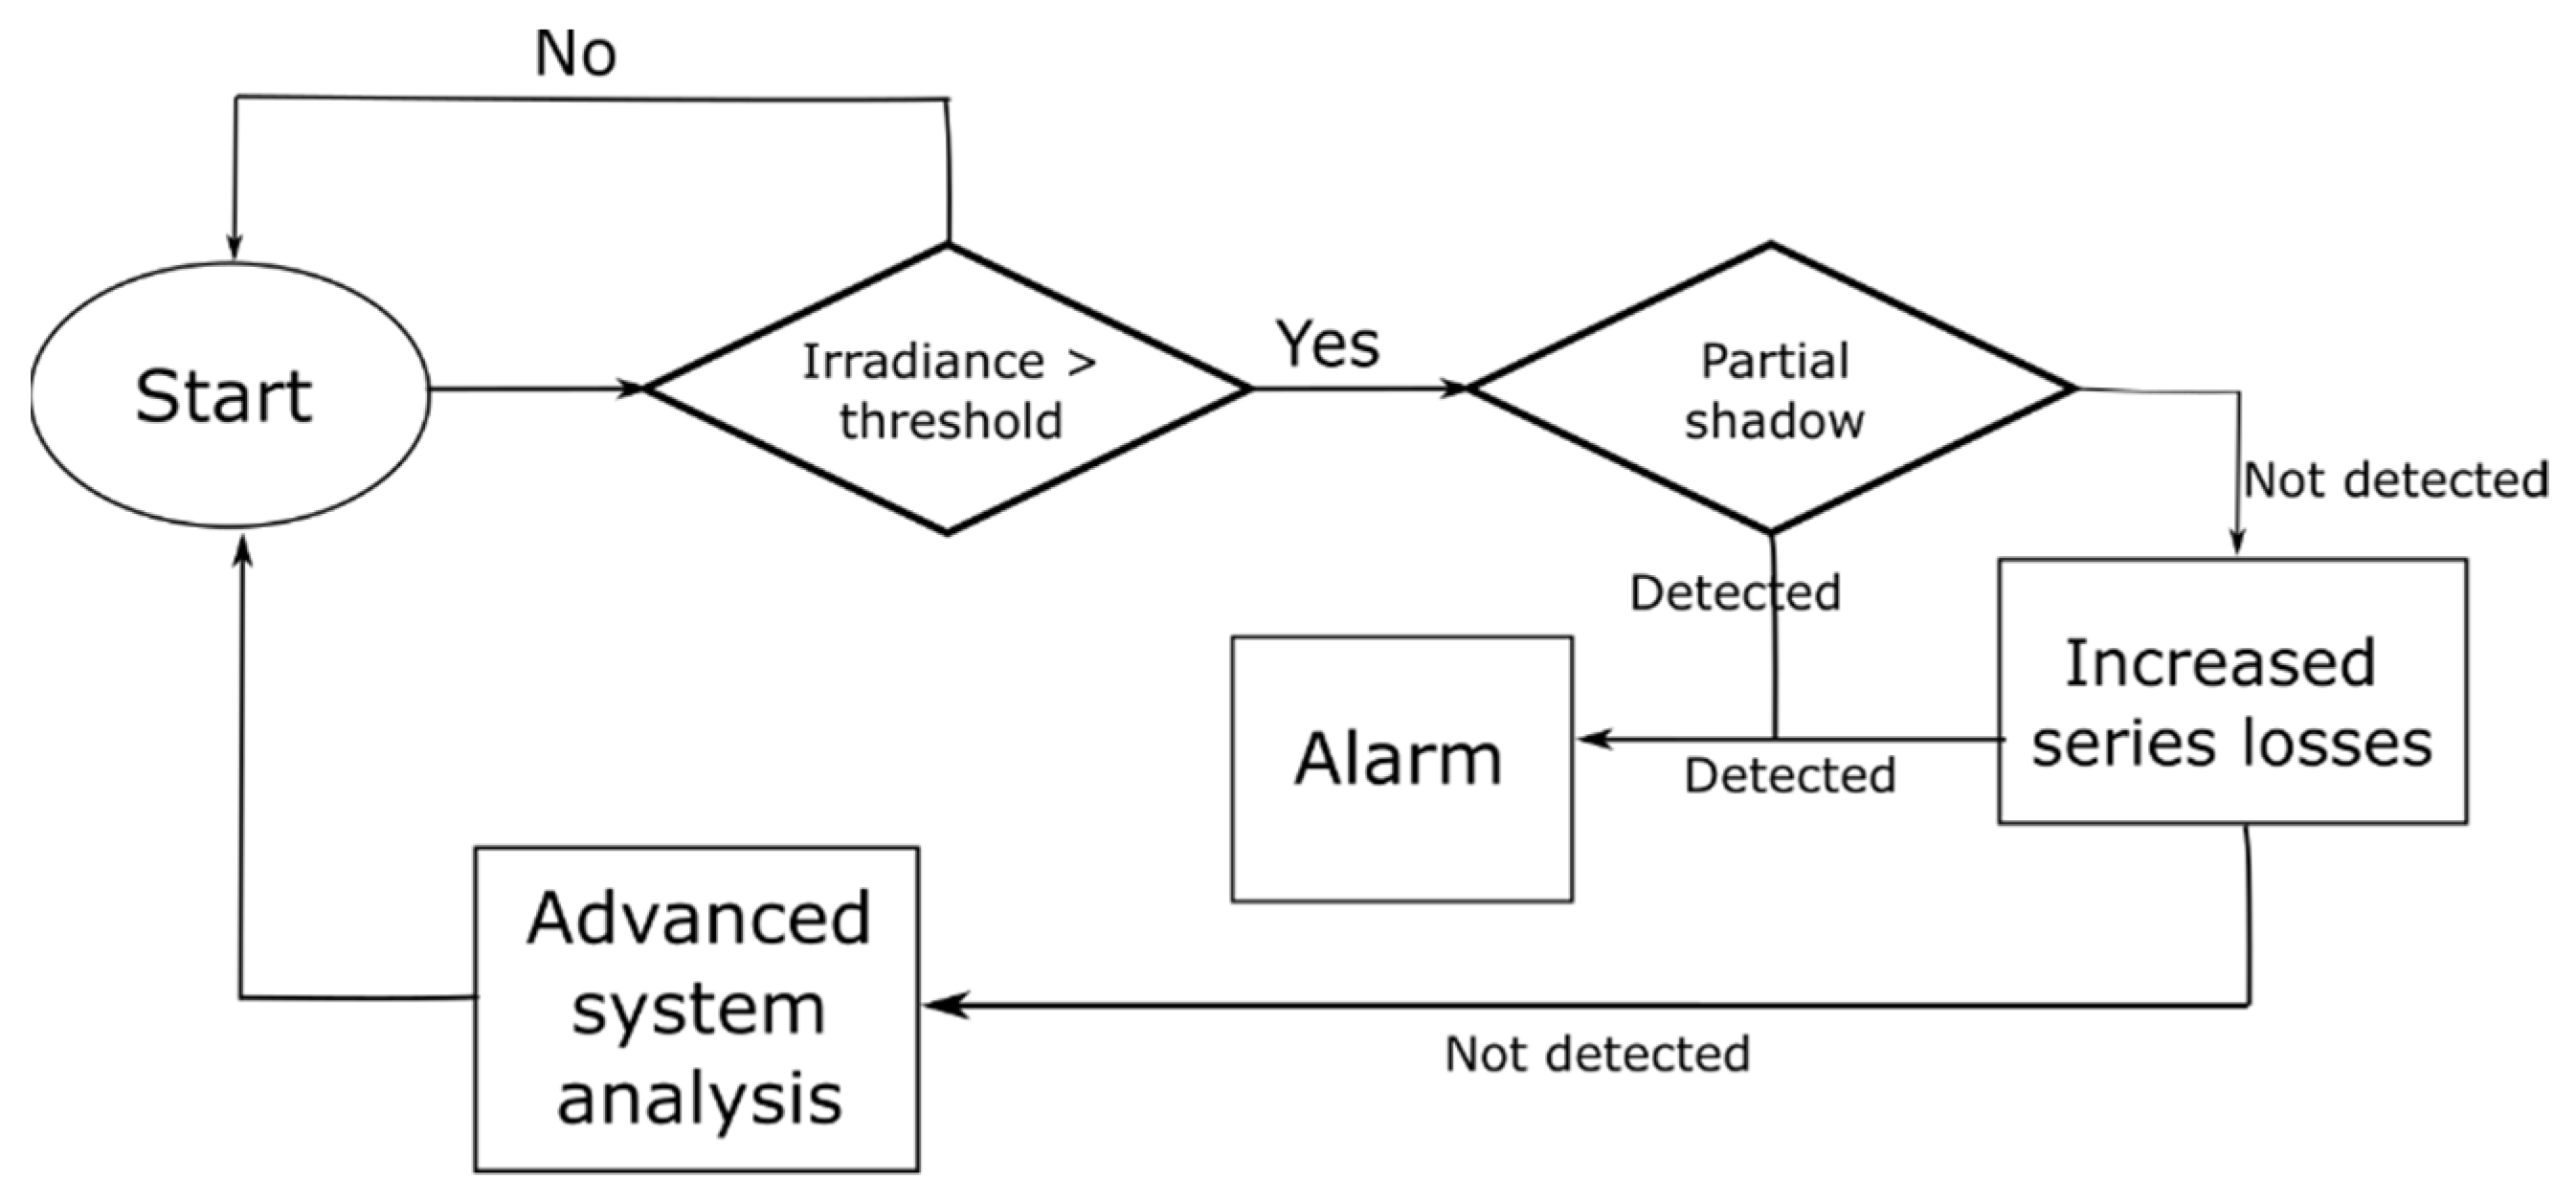
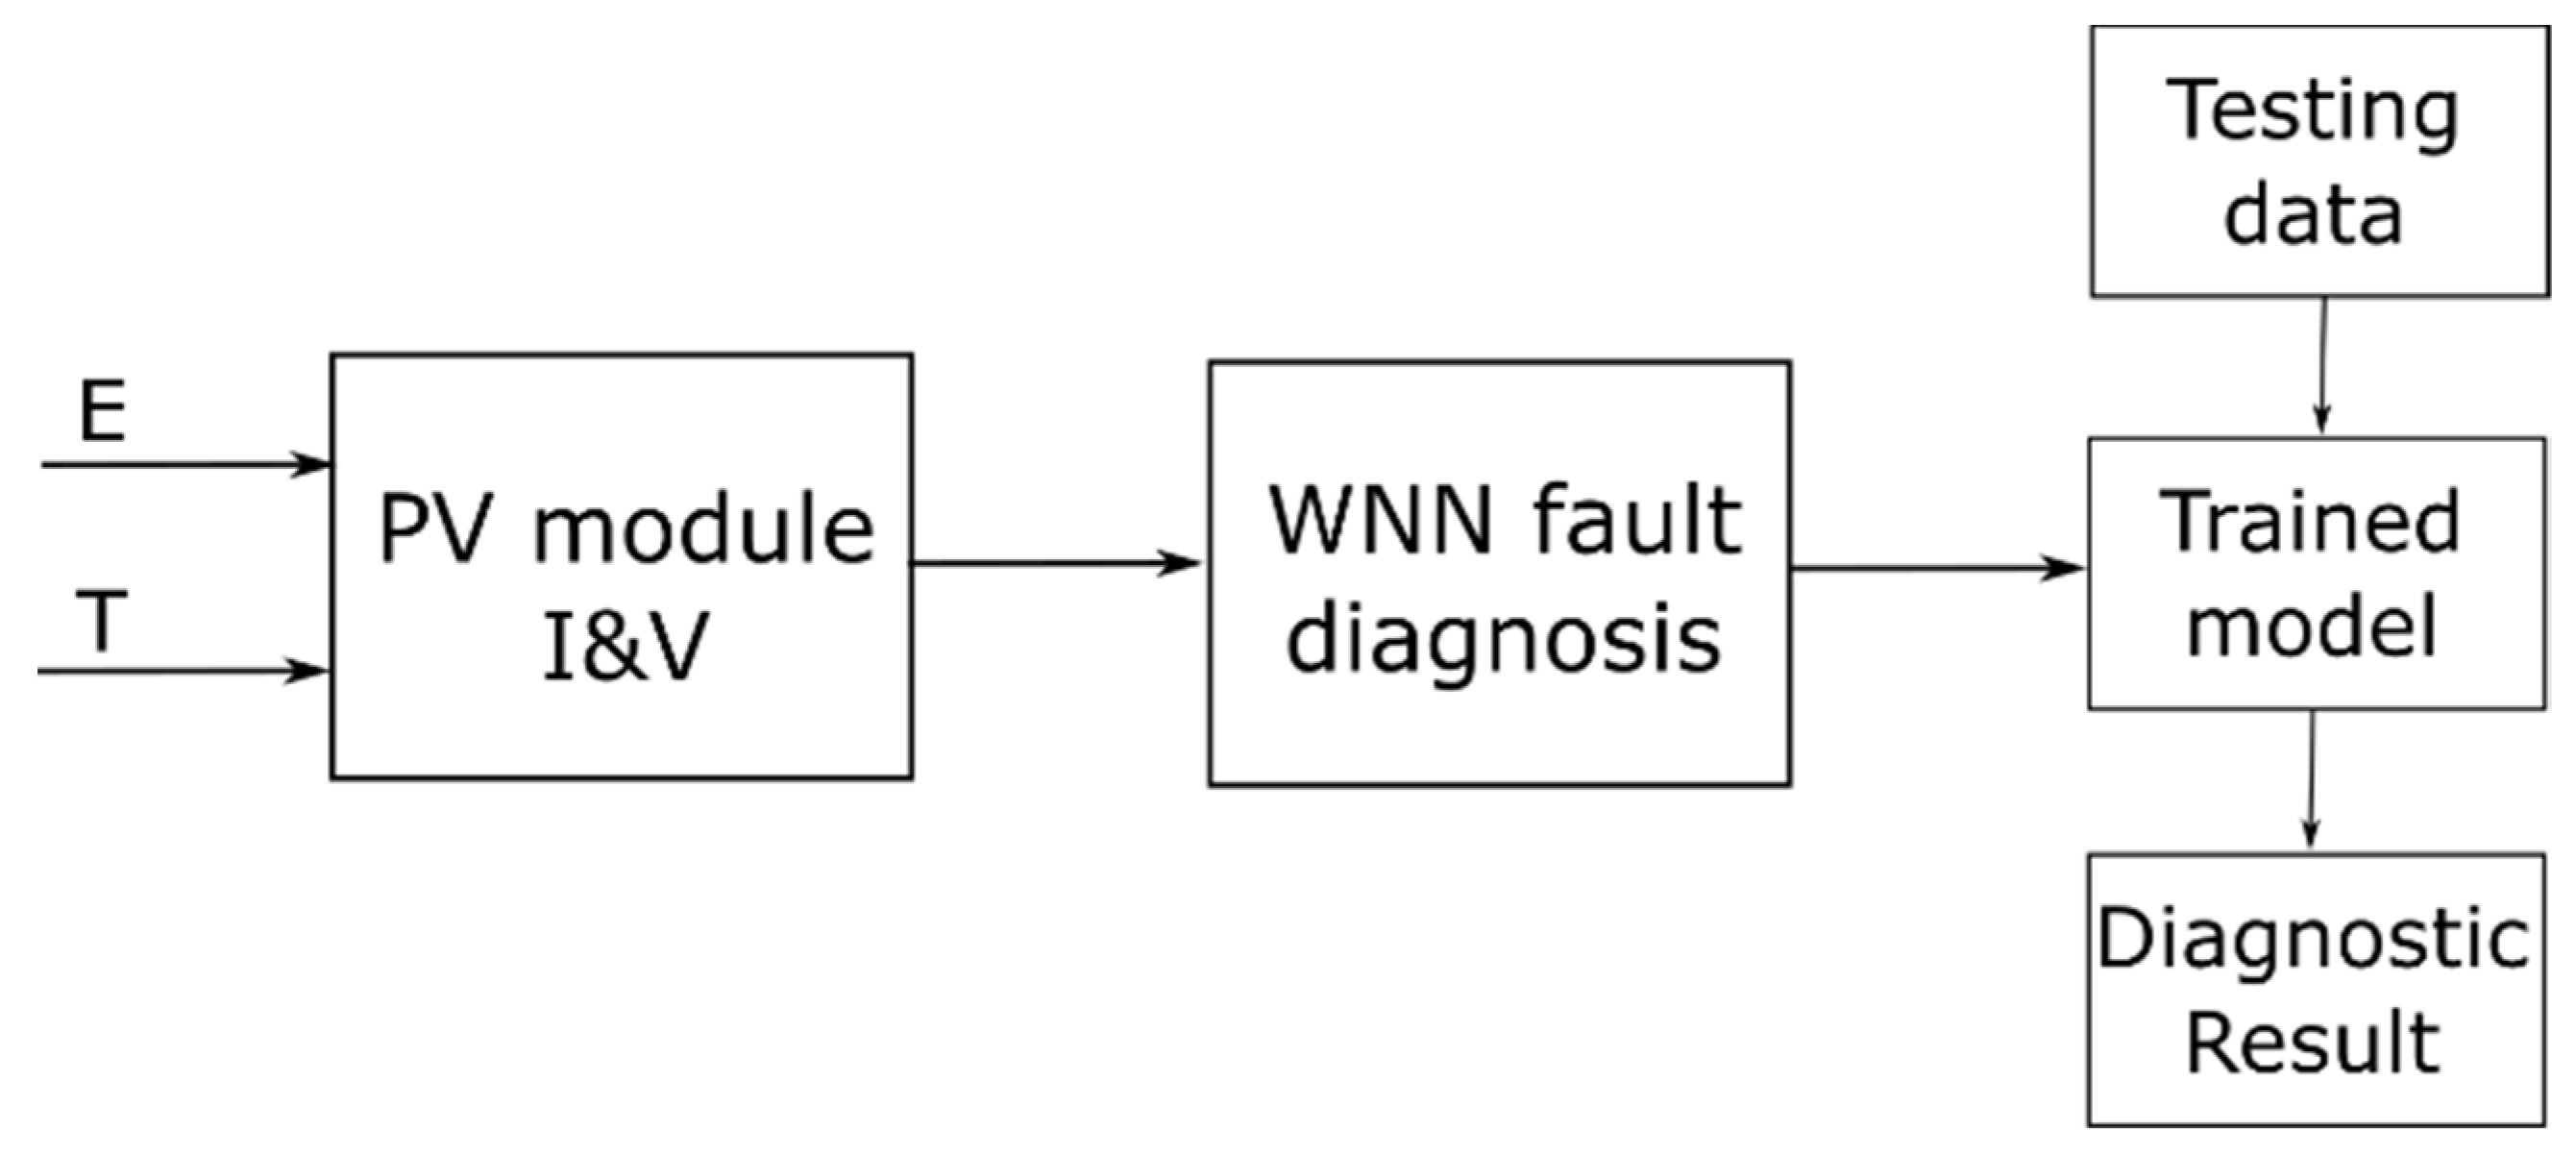
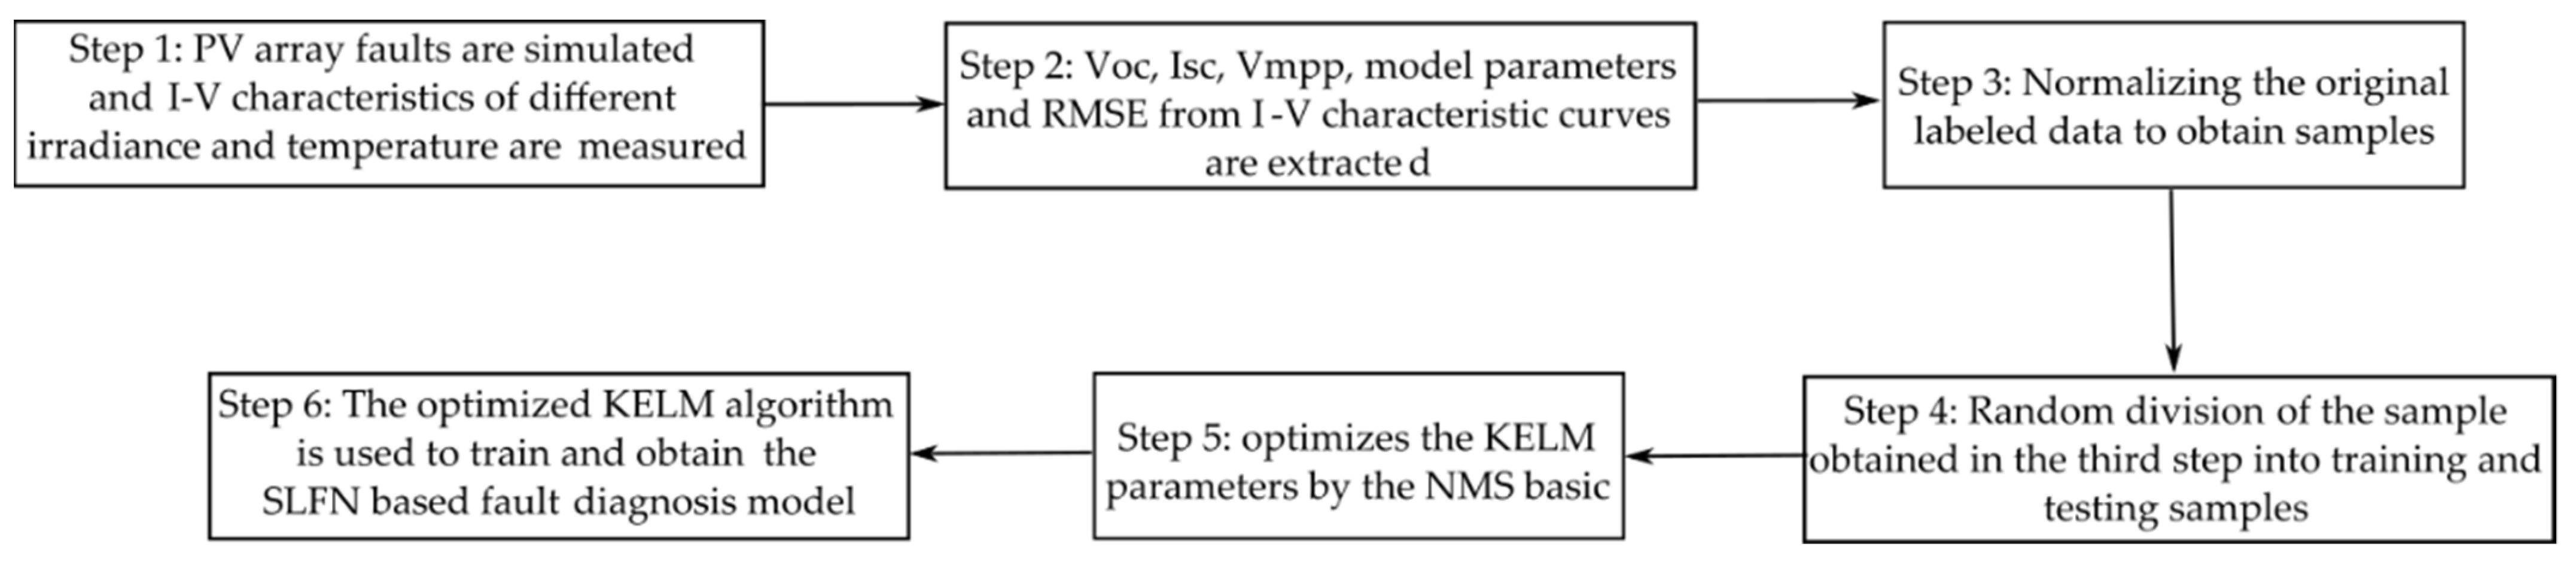
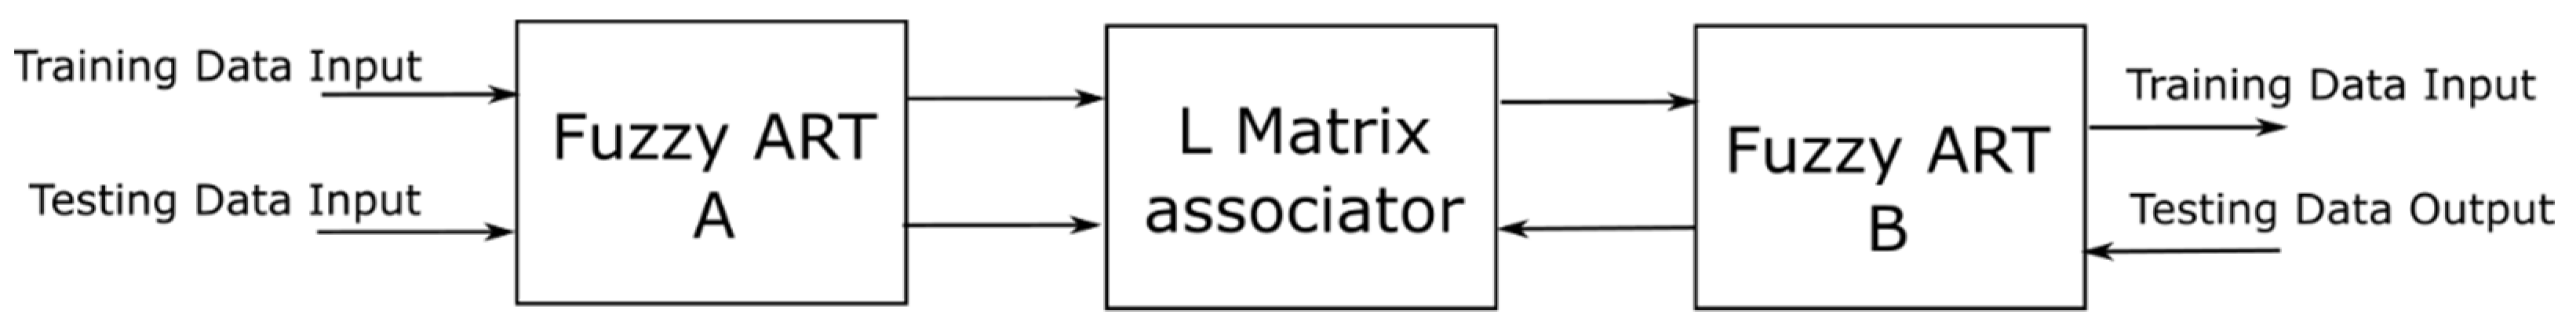


