
Visual Place Recognition in Changing Environments with Sequence Representations on the Distance-Space Domain

 ,
,  , and
, and 
Abstract
:1. Introduction
- Introducing a process for data manipulation in the distance-space domain, with a view to solve the vPR problem;
- Offering a concept for a descriptor-agnostic procedure for long-term vPR practices, utilizing multiple sequential observations and generalizing place-specific representations into different and unseen environments;
- Providing insights about the utilization of image sequences for scene representations;
- Using multiple datasets to evaluate the behavior of the proposed method under different situations, such as velocity and viewpoint fluctuations, varied environments, as well as observed conditions, etc.
2. Related Work
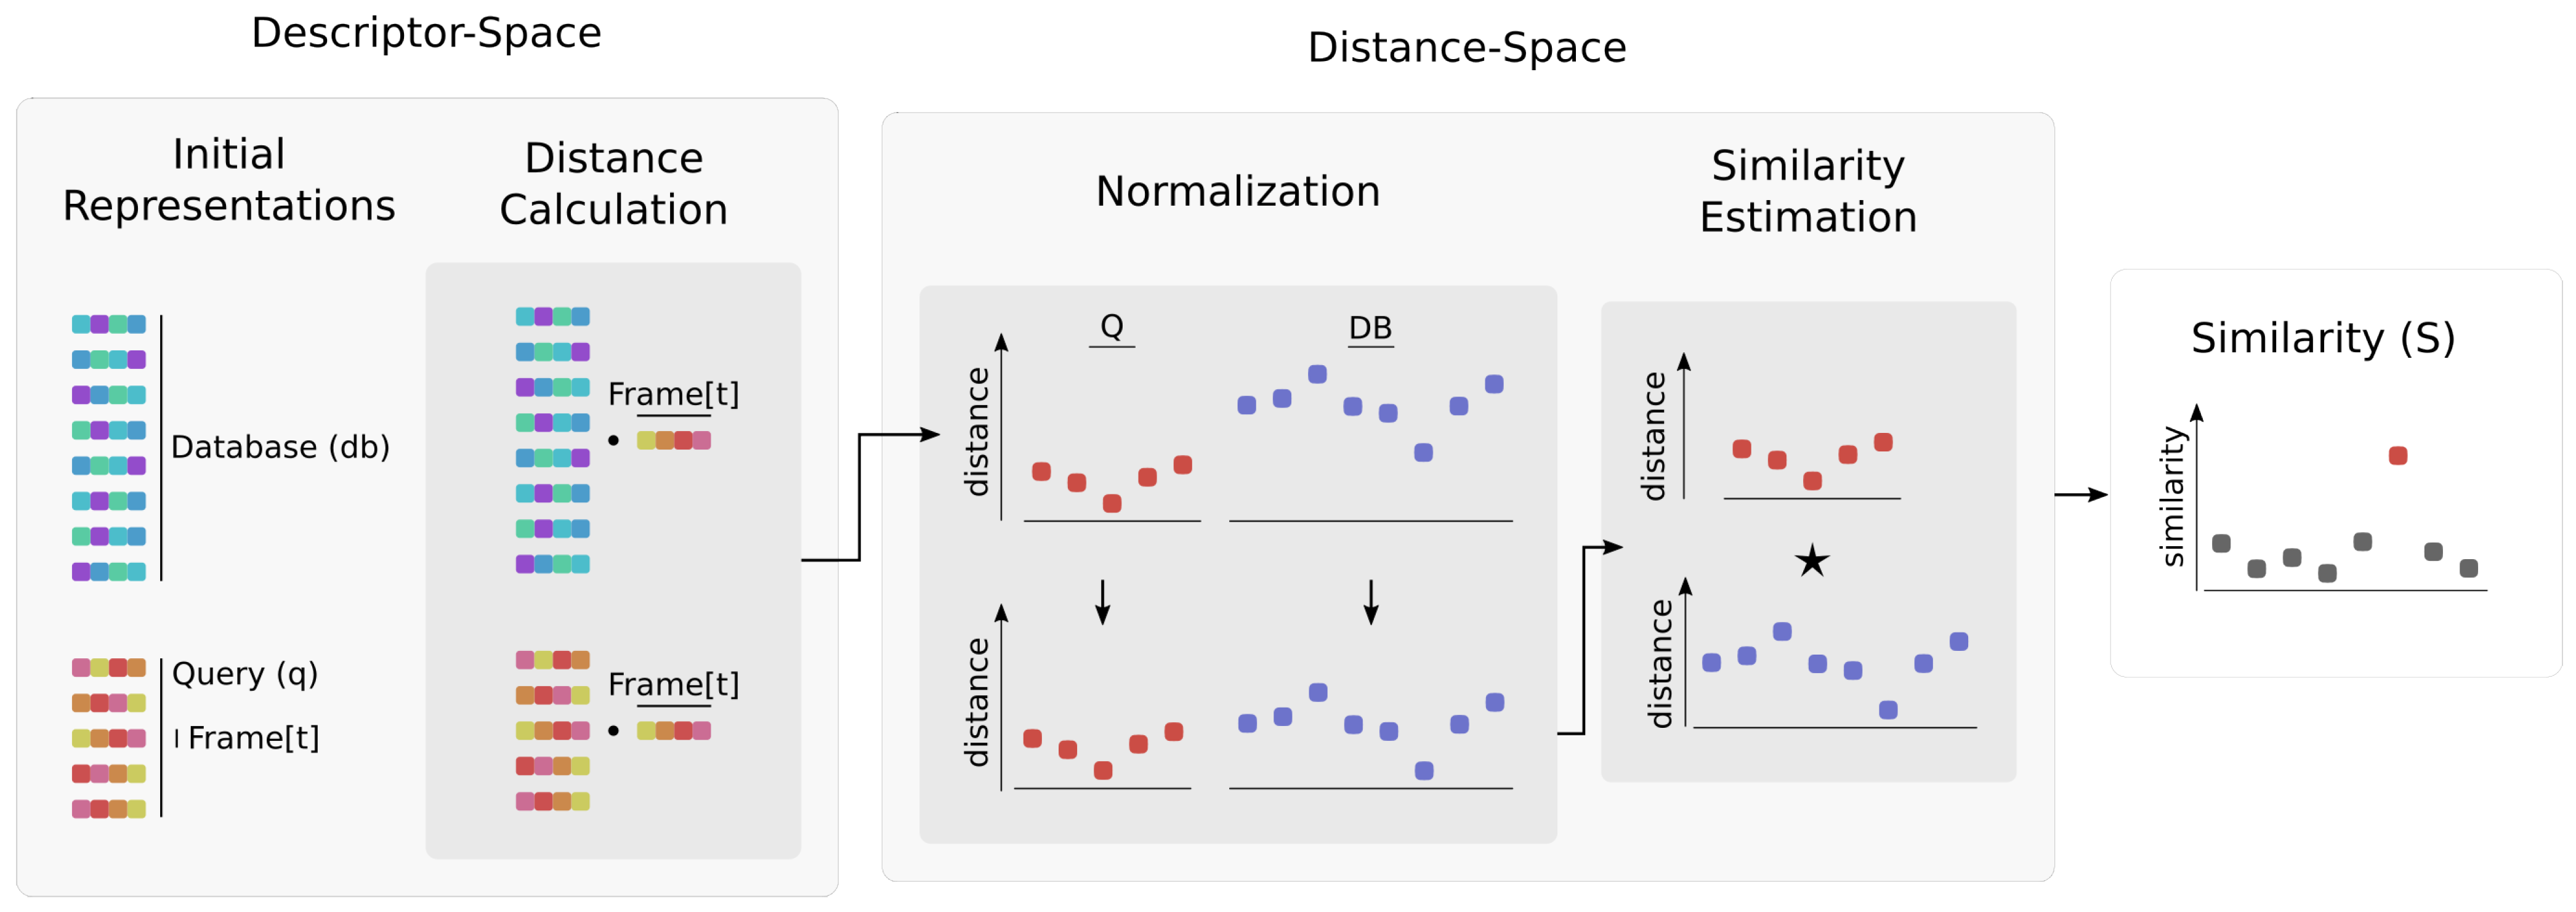
3. Method
3.1. Intuition
3.2. Implementation
4. Evaluation
4.1. Datasets
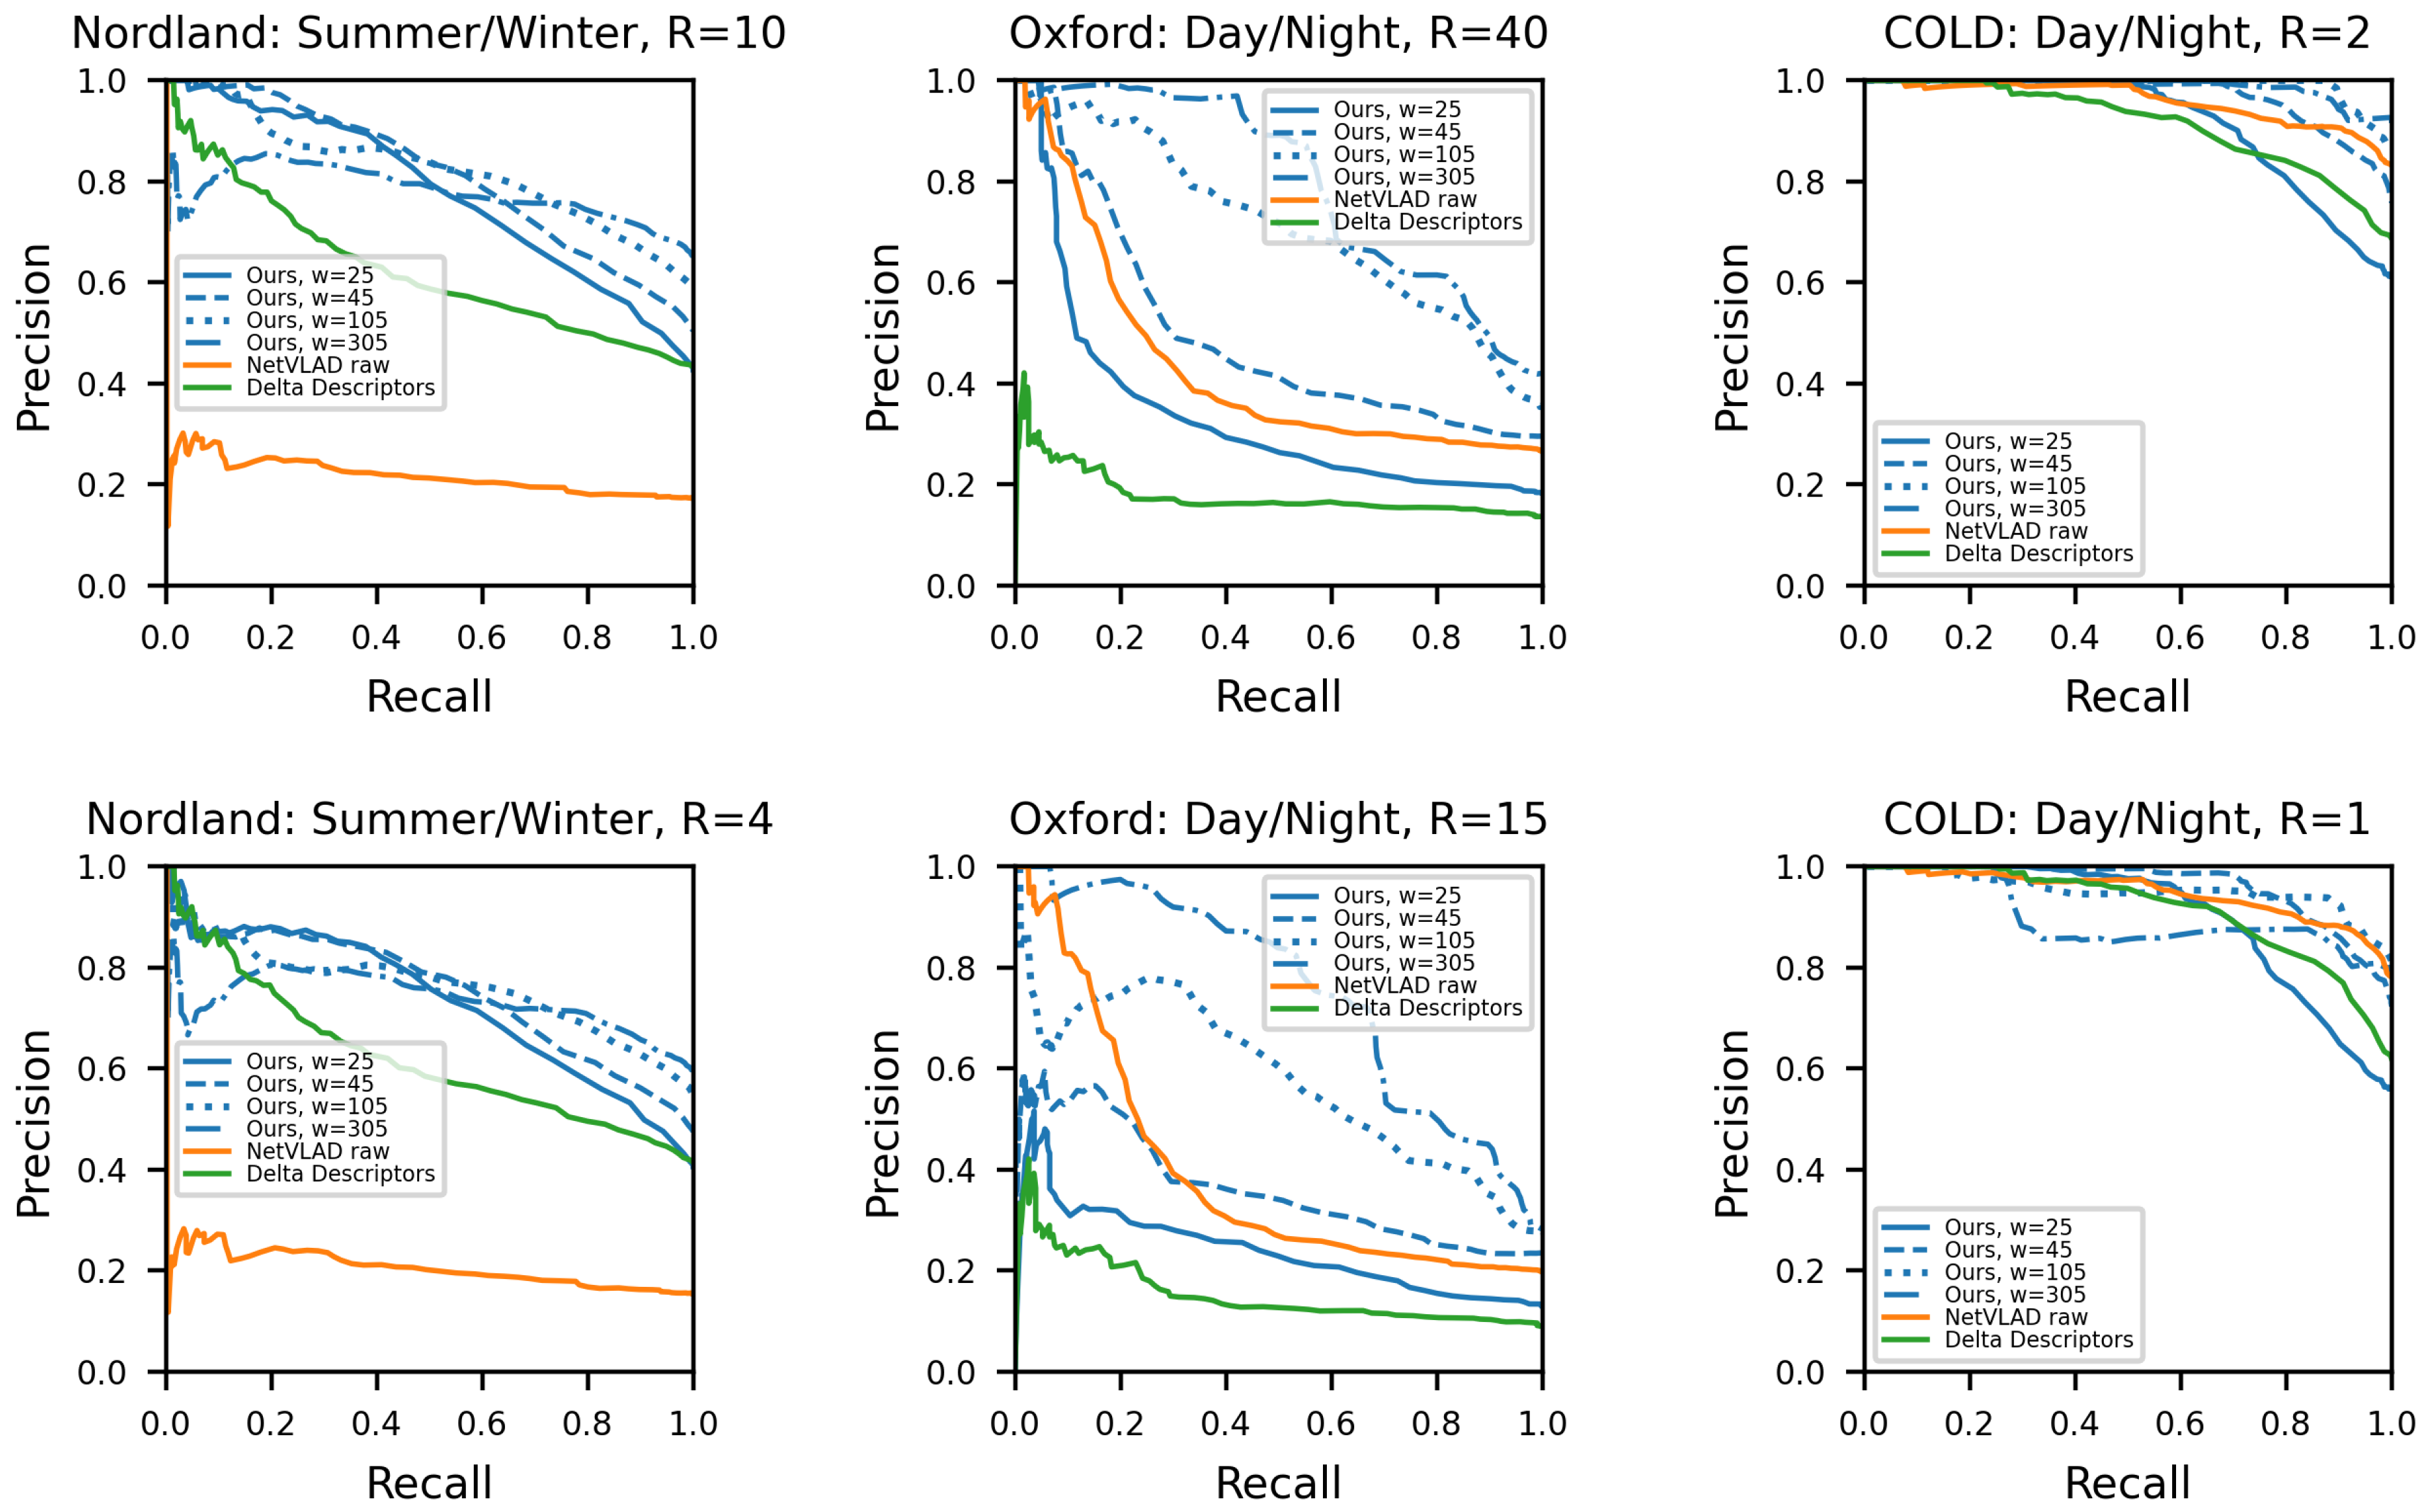
- The Nordland dataset: to evaluate the framework’s resilience in recognizing visual scenes under different seasonal conditions, the Nordland dataset [12] was employed. Its content features front-facing images of a 729 km long railway journey, captured in four seasons. Moreover, due to the rail-moving camera, this dataset minimizes the viewpoint variations between each trajectory. For this evaluation, we selected the test partitions [8] of the summer and winter trajectories, each comprising of 3450 synchronized frames.
- The Oxford dataset: in contrast to the one-to-one image correspondence of the Nordland tracks, the Oxford RobotCar dataset [10,29] contains routes from the central Oxford with inconsistent velocities and viewpoints. The data were captured by a car-mounted sensor during different conditions. From the available data, we chose the central view of the front-facing camera of the day and night trajectories (parts 01 of 2015-02-17-14-42-12 and 2014-12-16-18-44-24, respectively). Moreover, due to faulty GPS signal, we discarded the first 2000 frames, resulting in two routes, each one consisting of 4000 images. Within the trajectory, the mean traveled distance between two successive frames is 0.26 m.
- The COLD dataset: unlike the above-mentioned datasets, the COLD collection (sequence 1 of the Freiburg set) [30] comprises of indoor routes, depicting an office-like environment at different time periods. Similar to the Oxford dataset, its trajectories are asynchronous and they exhibit several viewpoint mutations. Within this work, we selected the sunny and night instances, containing 1598 and 1911 images, respectively, with a mean step distance equal to 0.04 m.
4.2. Metrics
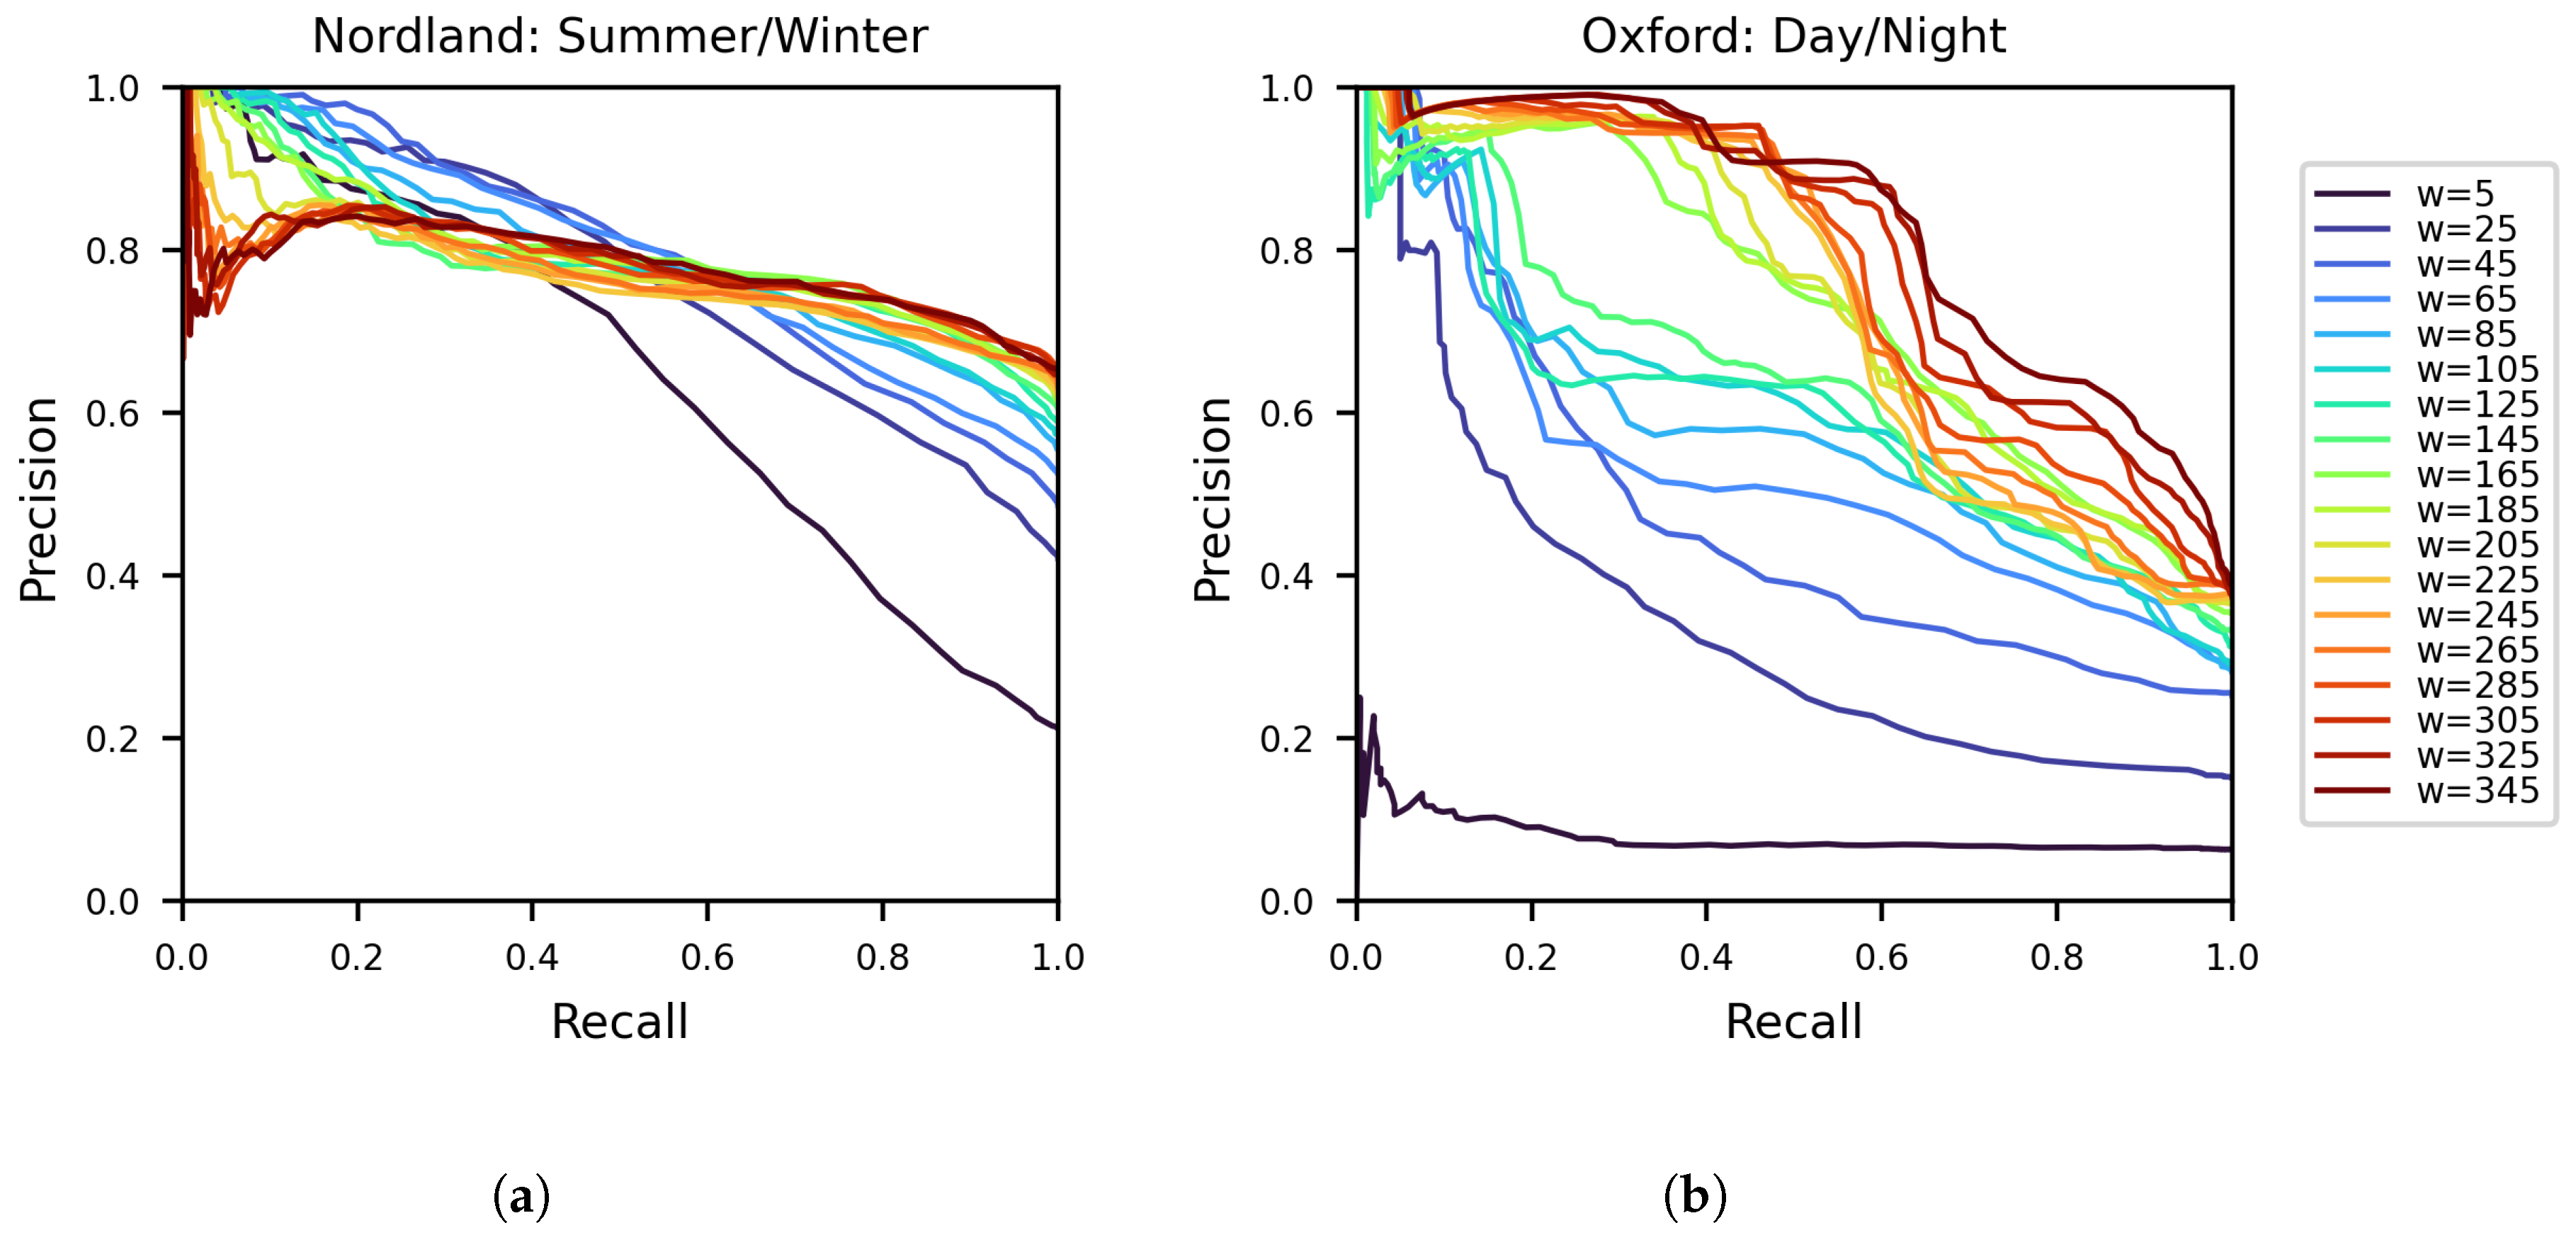
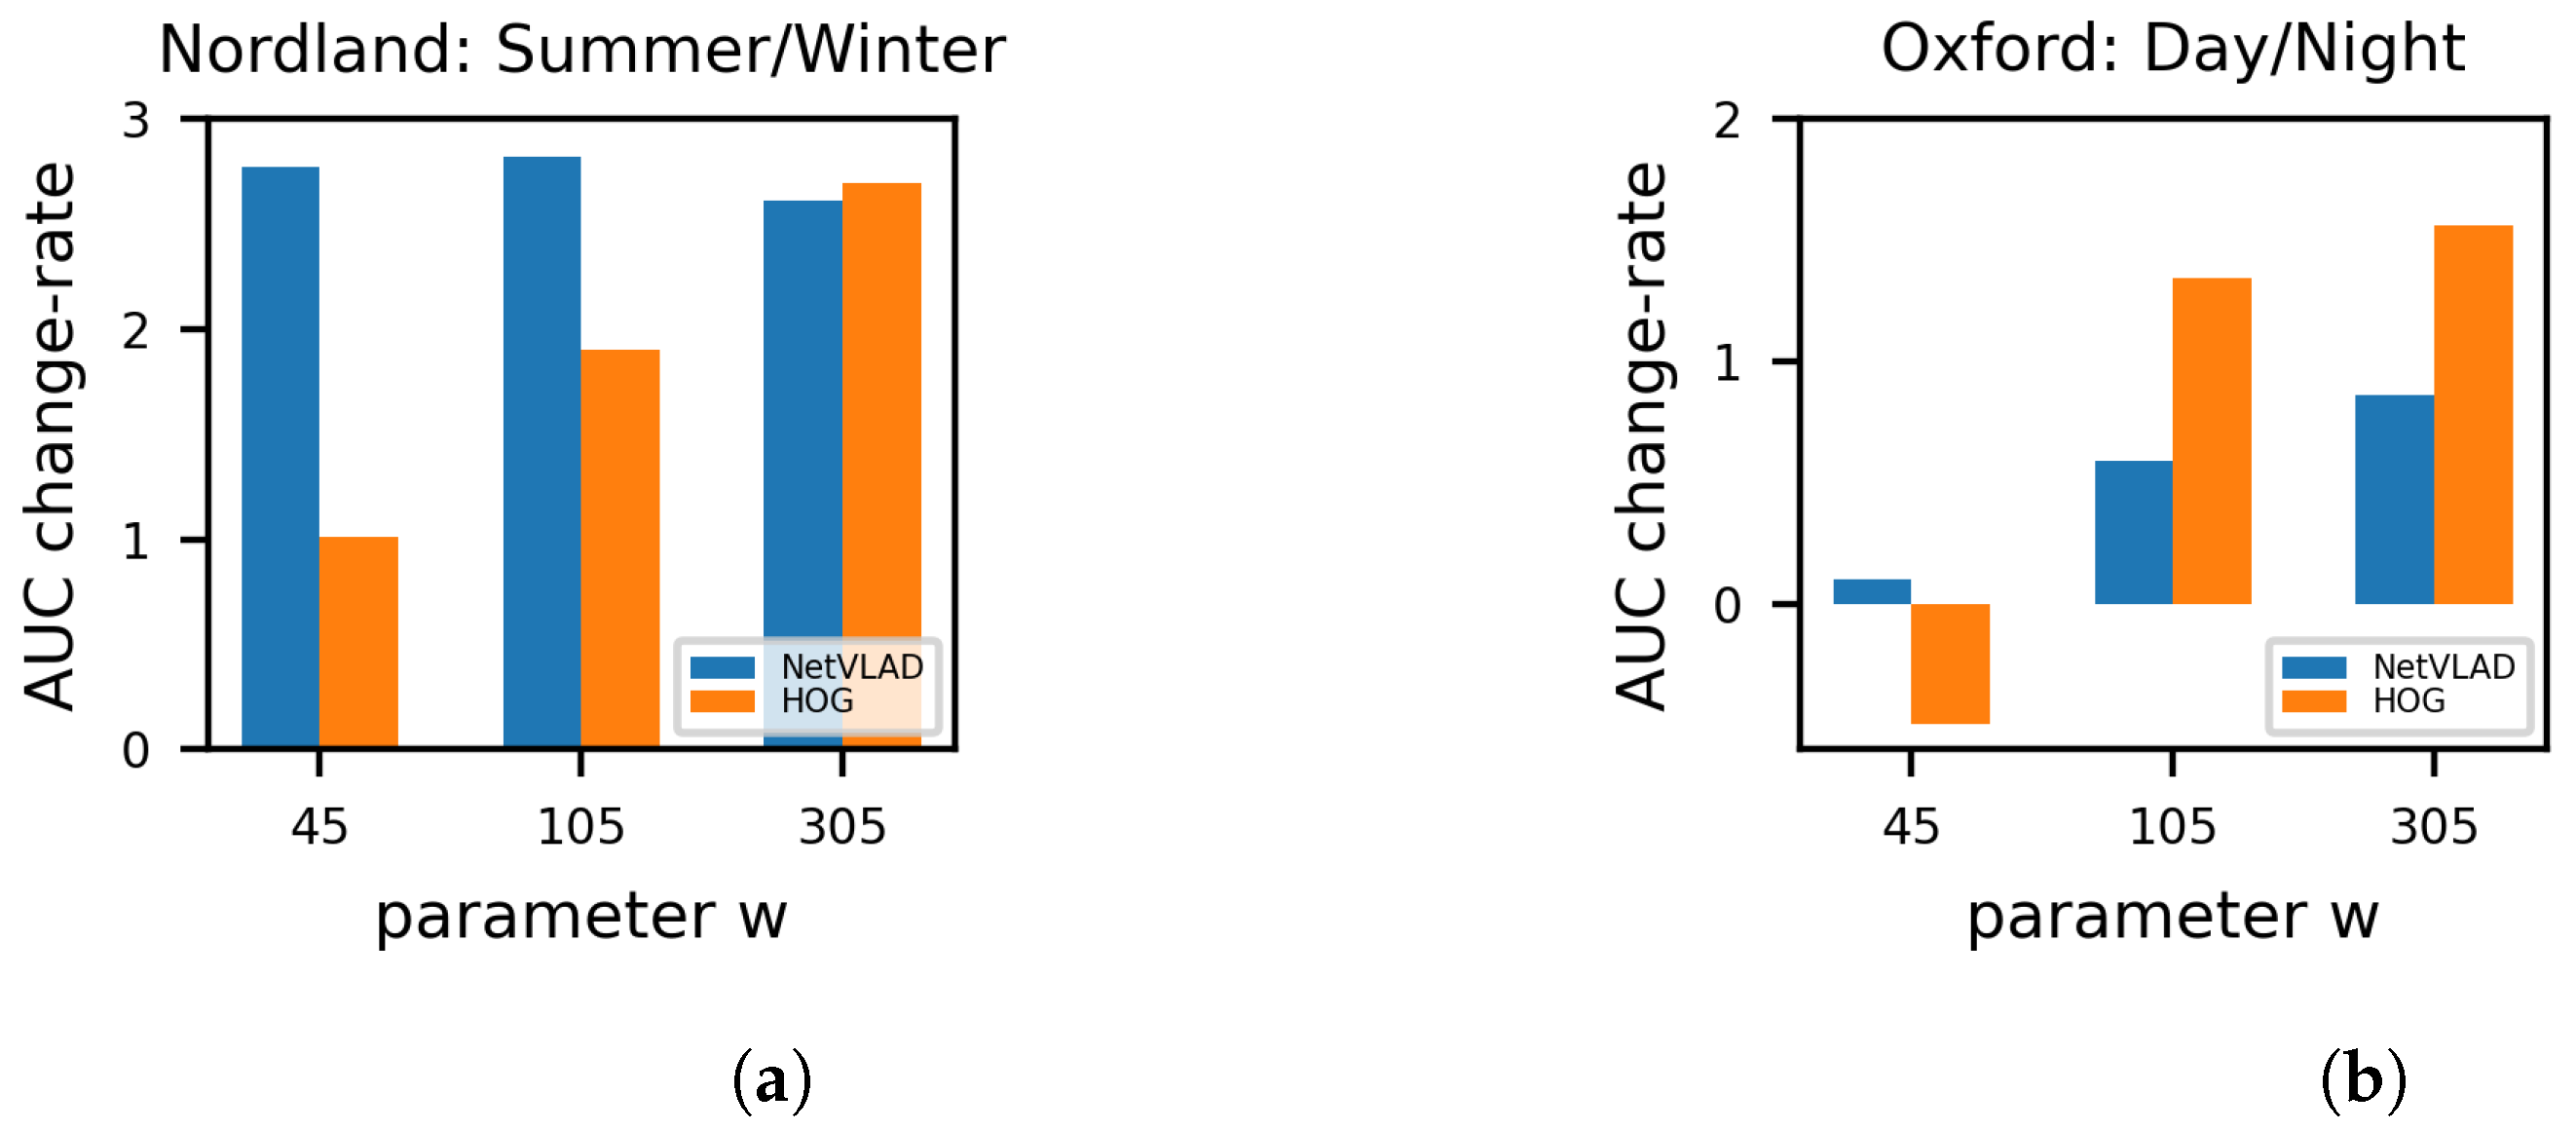
4.3. The Parameter w
4.4. Different Descriptors
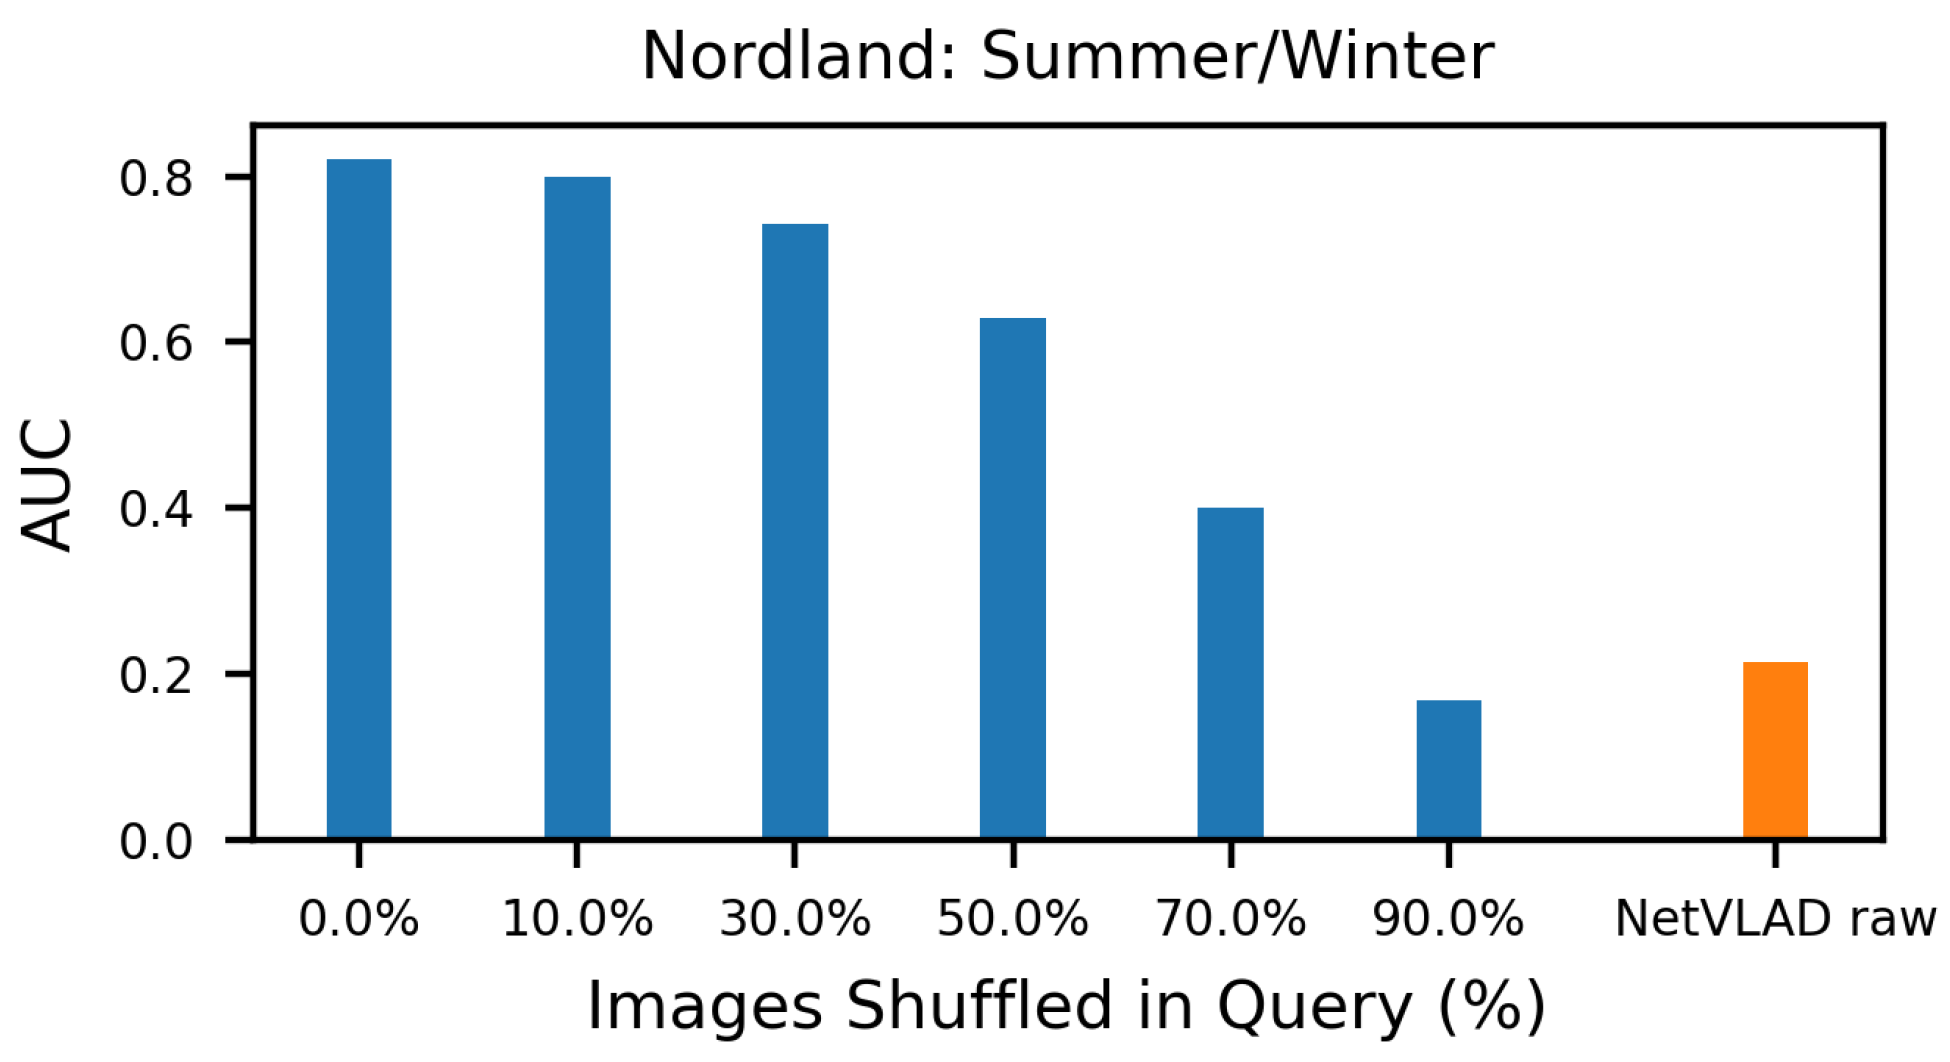
4.5. Sequence Shuffling
4.6. Execution Time
4.7. Comparison with State-of-the-Art
4.8. Query Window as a Time Trace
5. Conclusions
Author Contributions
Funding
Data Availability Statement
Conflicts of Interest
References
- Yang, B.; Zhang, Y. Localization and Tracking of Closely-Spaced Human Targets Based on Infrared Sensors. Infrared Phys. Technol. 2022, 123, 104176. [Google Scholar] [CrossRef]
- Cadena, C.; Carlone, L.; Carrillo, H.; Latif, Y.; Scaramuzza, D.; Neira, J.; Reid, I.; Leonard, J.J. Past, Present, and Future of Simultaneous Localization and Mapping: Toward the Robust-Perception Age. IEEE Trans. Robot. 2016, 32, 1309–1332. [Google Scholar] [CrossRef]
- Yin, W.; He, K.; Xu, D.; Luo, Y.; Gong, J. Significant Target Analysis and Detail Preserving Based Infrared and Visible Image Fusion. Infrared Phys. Technol. 2022, 121, 104041. [Google Scholar] [CrossRef]
- Yu, D.; Lin, S.; Lu, X.; Wang, B.; Li, D.; Wang, Y. A Multi-Band Image Synchronous Fusion Method Based on Saliency. Infrared Phys. Technol. 2022, 127, 104466. [Google Scholar] [CrossRef]
- Masone, C.; Caputo, B. A Survey on Deep Visual Place Recognition. IEEE Access 2021, 9, 19516–19547. [Google Scholar] [CrossRef]
- Lowry, S.; Sunderhauf, N.; Newman, P.; Leonard, J.J.; Cox, D.; Corke, P.; Milford, M.J. Visual Place Recognition: A Survey. IEEE Trans. Robot. 2016, 32, 1–19. [Google Scholar] [CrossRef]
- Tsintotas, K.A.; Bampis, L.; Gasteratos, A. The Revisiting Problem in Simultaneous Localization and Mapping: A Survey on Visual Loop Closure Detection. IEEE Trans. Intell. Transp. Syst. 2022, 23, 1–25. [Google Scholar] [CrossRef]
- Olid, D.; Fácil, J.M.; Civera, J. Single-View Place Recognition under Seasonal Changes. In Proceedings of the 2018 IEEE International Conference on Intelligent Robots and Systems, 10th Planning, Perception and Navigation for Intelligent Vehicles Workshop, Madrid, Spain, 1–5 October 2018. [Google Scholar]
- Osman, H.; Darwish, N.; Bayoumi, A. PlaceNet: A Multi-Scale Semantic-Aware Model for Visual Loop Closure Detection. Eng. Appl. Artif. Intell. 2023, 119, 105797. [Google Scholar] [CrossRef]
- Maddern, W.; Pascoe, G.; Linegar, C.; Newman, P. 1 Year, 1000 Km: The Oxford RobotCar Dataset. Int. J. Robot. Res. 2017, 36, 3–15. [Google Scholar] [CrossRef]
- Milford, M.J.; Wyeth, G.F. SeqSLAM: Visual Route-Based Navigation for Sunny Summer Days and Stormy Winter Nights. In Proceedings of the 2012 IEEE International Conference on Robotics and Automation, St. Paul, MI, USA, 14–18 May 2012; pp. 1643–1649. [Google Scholar] [CrossRef]
- Sunderhauf, N.; Neubert, P.; Protzel, P. Are We There Yet? Challenging SeqSLAM on a 3000 Km Journey Across All Four Seasons. In Proceedings of the ICRA 2013 Workshop on Long-Term Autonomy, Karlsruhe, Germany, 6–10 May 2013; p. 3. [Google Scholar]
- Lowe, D.G. Distinctive Image Features from Scale-Invariant Keypoints. Int. J. Comput. Vis. 2004, 60, 91–110. [Google Scholar] [CrossRef]
- Galvez-López, D.; Tardos, J.D. Bags of Binary Words for Fast Place Recognition in Image Sequences. IEEE Trans. Robot. 2012, 28, 1188–1197. [Google Scholar] [CrossRef]
- Sivic, J.; Zisserman, A. Video Google: A Text Retrieval Approach to Object Matching in Videos. In Proceedings of the Ninth IEEE International Conference on Computer Vision, Nice, France, 13–16 October 2003; Volume 2, pp. 1470–1477. [Google Scholar] [CrossRef]
- Sünderhauf, N.; Shirazi, S.; Jacobson, A.; Pepperell, E.; Dayoub, F.; Upcroft, B.; Milford, M. Place Recognition with ConvNet Landmarks: Viewpoint-Robust, Condition-Robust, Training-Free. In Proceedings of the Robotics: Science and Systems XI, Rome, Italy, 13–17 July 2015; pp. 1–10. [Google Scholar] [CrossRef]
- Zaffar, M.; Ehsan, S.; Milford, M.; McDonald-Maier, K. CoHOG: A Light-Weight, Compute-Efficient, and Training-Free Visual Place Recognition Technique for Changing Environments. IEEE Robot. Autom. Lett. 2020, 5, 1835–1842. [Google Scholar] [CrossRef]
- Arandjelovic, R.; Gronat, P.; Torii, A.; Pajdla, T.; Sivic, J. NetVLAD: CNN Architecture for Weakly Supervised Place Recognition. In Proceedings of the IEEE Conference on Computer Vision and Pattern Recognition, Las Vegas, NV, USA, 26 June–1 July 2016; pp. 5297–5307. [Google Scholar]
- Gao, P.; Zhang, H. Long-Term Place Recognition through Worst-case Graph Matching to Integrate Landmark Appearances and Spatial Relationships. In Proceedings of the 2020 IEEE International Conference on Robotics and Automation, Paris, France, 31 May–31 August 2020; pp. 1070–1076. [Google Scholar] [CrossRef]
- Khaliq, A.; Ehsan, S.; Chen, Z.; Milford, M.; McDonald-Maier, K. A Holistic Visual Place Recognition Approach Using Lightweight CNNs for Significant ViewPoint and Appearance Changes. IEEE Trans. Robot. 2020, 36, 561–569. [Google Scholar] [CrossRef]
- Papapetros, I.T.; Balaska, V.; Gasteratos, A. Visual Loop-Closure Detection via Prominent Feature Tracking. J. Intell. Robot. Syst. 2022, 104, 54. [Google Scholar] [CrossRef]
- Tsintotas, K.A.; Bampis, L.; Gasteratos, A. Modest-Vocabulary Loop-Closure Detection with Incremental Bag of Tracked Words. Robot. Auton. Syst. 2021, 141, 103782. [Google Scholar] [CrossRef]
- Bampis, L.; Amanatiadis, A.; Gasteratos, A. Fast Loop-Closure Detection Using Visual-Word-Vectors from Image Sequences. Int. J. Robot. Res. 2018, 37, 62–82. [Google Scholar] [CrossRef]
- Diamantas, S.; Dasgupta, P. Optical Flow-Based Place Recognition: Bridging the Gap Between Simulation and Real-World Experiments. In Proceedings of the 2022 IEEE 12th Annual Computing and Communication Workshop and Conference, Virtual, 26–29 January 2022; pp. 619–624. [Google Scholar] [CrossRef]
- Garg, S.; Harwood, B.; Anand, G.; Milford, M. Delta Descriptors: Change-Based Place Representation for Robust Visual Localization. IEEE Robot. Autom. Lett. 2020, 5, 5120–5127. [Google Scholar] [CrossRef]
- Tsintotas, K.A.; Bampis, L.; Gasteratos, A. Probabilistic Appearance-Based Place Recognition through Bag of Tracked Words. IEEE Robot. Autom. Lett. 2019, 4, 1737–1744. [Google Scholar] [CrossRef]
- Bampis, L.; Gasteratos, A. Sequence-Based Visual Place Recognition: A Scale-Space Approach for Boundary Detection. Auton. Robot. 2021, 45, 505–518. [Google Scholar] [CrossRef]
- Kreyszig, E. Data Analysis. Probability Theory. In Advanced Engineering Mathematics, 10th ed.; Wiley: Hoboken, NJ, USA, 2011; p. 1014. [Google Scholar]
- Barnes, D.; Gadd, M.; Murcutt, P.; Newman, P.; Posner, I. The Oxford Radar RobotCar Dataset: A Radar Extension to the Oxford RobotCar Dataset. In Proceedings of the 2020 IEEE International Conference on Robotics and Automation, Paris, France, 31 May–31 August 2020; pp. 6433–6438. [Google Scholar] [CrossRef]
- Pronobis, A.; Caputo, B. COLD: The CoSy Localization Database. Int. J. Robot. Res. 2009, 28, 588–594. [Google Scholar] [CrossRef]
- Buckland, M.; Gey, F. The Relationship between Recall and Precision. J. Am. Soc. Inf. Sci. 1994, 45, 12–19. [Google Scholar] [CrossRef]
- Hausler, S.; Garg, S.; Xu, M.; Milford, M.; Fischer, T. Patch-NetVLAD: Multi-Scale Fusion of Locally-Global Descriptors for Place Recognition. In Proceedings of the IEEE/CVF Conference on Computer Vision and Pattern Recognition, Nashville, TN, USA, 20–25 June 2021; pp. 14141–14152. [Google Scholar]
- Khaliq, A.; Milford, M.; Garg, S. MultiRes-NetVLAD: Augmenting Place Recognition Training with Low-Resolution Imagery. IEEE Robot. Autom. Lett. 2022, 7, 3882–3889. [Google Scholar] [CrossRef]
- Dalal, N.; Triggs, B. Histograms of Oriented Gradients for Human Detection. In Proceedings of the 2005 IEEE Computer Society Conference on Computer Vision and Pattern Recognition, San Diego, CA, USA, 20–26 June 2005; Volume 1, pp. 886–893. [Google Scholar] [CrossRef]
- Lowry, S.; Andreasson, H. Lightweight, Viewpoint-Invariant Visual Place Recognition in Changing Environments. IEEE Robot. Autom. Lett. 2018, 3, 957–964. [Google Scholar] [CrossRef]
- Han, F.; Yang, X.; Deng, Y.; Rentschler, M.; Yang, D.; Zhang, H. SRAL: Shared Representative Appearance Learning for Long-Term Visual Place Recognition. IEEE Robot. Autom. Lett. 2017, 2, 1172–1179. [Google Scholar] [CrossRef]


| ± (ms) | |
|---|---|
| Distance Calculation | 17.76 ± 0.55 |
| Normalization | 0.28 ± 0.04 |
| Similarity Estimation | 0.26 ± 0.08 |
| Total | 18.31± 0.68 |
| Nordland | Oxford | COLD | Nordland | Oxford | COLD | |
|---|---|---|---|---|---|---|
| R = 10 | R = 40 | R = 2 | R = 4 | R = 15 | R = 1 | |
| Delta Descriptors | 0.626 | 0.166 | 0.913 | 0.621 | 0.147 | 0.914 |
| NetVLAD raw | 0.215 | 0.438 | 0.957 | 0.203 | 0.401 | 0.946 |
| Ours w = 25 | 0.767 | 0.351 | 0.914 | 0.725 | 0.267 | 0.898 |
| Ours w = 45 | 0.813 | 0.499 | 0.969 | 0.752 | 0.367 | 0.961 |
| Ours w = 105 | 0.823 | 0.714 | 0.990 | 0.760 | 0.580 | 0.951 |
| Ours w = 305 | 0.779 | 0.799 | 0.988 | 0.736 | 0.751 | 0.896 |
| Nordland | Oxford | COLD | Nordland | Oxford | COLD | |
|---|---|---|---|---|---|---|
| R = 10 | R = 40 | R = 2 | R = 4 | R = 15 | R = 1 | |
| w = 25 | 0.664 | 0.415 | 0.914 | 0.602 | 0.381 | 0.753 |
| w = 45 | 0.642 | 0.618 | 0.913 | 0.590 | 0.483 | 0.686 |
| w = 105 | 0.735 | 0.497 | 0.693 | 0.687 | 0.372 | 0.352 |
| w = 305 | 0.848 | 0.577 | 0.455 | 0.825 | 0.225 | 0.384 |
Disclaimer/Publisher’s Note: The statements, opinions and data contained in all publications are solely those of the individual author(s) and contributor(s) and not of MDPI and/or the editor(s). MDPI and/or the editor(s) disclaim responsibility for any injury to people or property resulting from any ideas, methods, instructions or products referred to in the content. |
© 2023 by the authors. Licensee MDPI, Basel, Switzerland. This article is an open access article distributed under the terms and conditions of the Creative Commons Attribution (CC BY) license (https://creativecommons.org/licenses/by/4.0/).
Share and Cite
Papapetros, I.T.; Kansizoglou, I.; Bampis, L.; Gasteratos, A. Visual Place Recognition in Changing Environments with Sequence Representations on the Distance-Space Domain. Machines 2023, 11, 558. https://doi.org/10.3390/machines11050558
Papapetros IT, Kansizoglou I, Bampis L, Gasteratos A. Visual Place Recognition in Changing Environments with Sequence Representations on the Distance-Space Domain. Machines. 2023; 11(5):558. https://doi.org/10.3390/machines11050558
Chicago/Turabian StylePapapetros, Ioannis Tsampikos, Ioannis Kansizoglou, Loukas Bampis, and Antonios Gasteratos. 2023. "Visual Place Recognition in Changing Environments with Sequence Representations on the Distance-Space Domain" Machines 11, no. 5: 558. https://doi.org/10.3390/machines11050558