
Fault Diagnosis of Mine Ventilator Bearing Based on Improved Variational Mode Decomposition and Density Peak Clustering
Abstract
:1. Introduction
2. The Proposed Method
2.1. Improved Variational Mode Decomposition
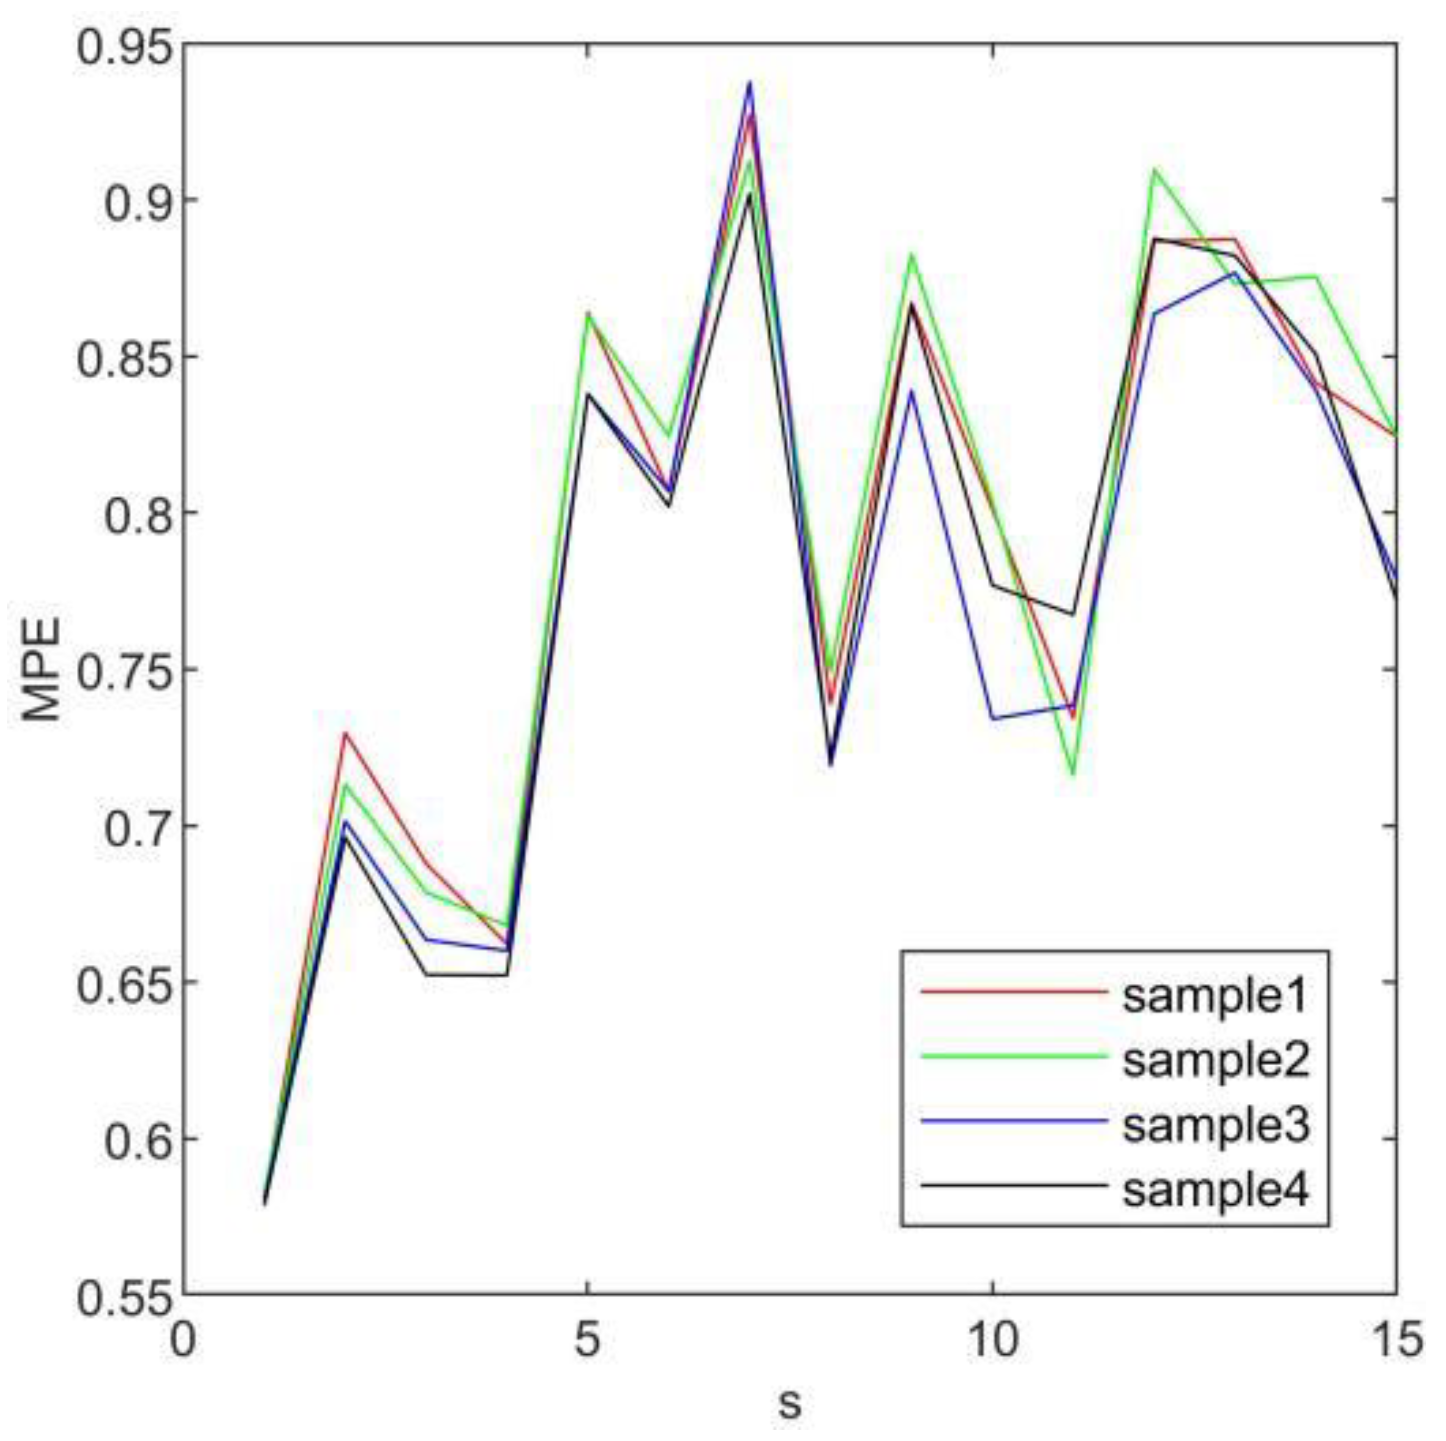
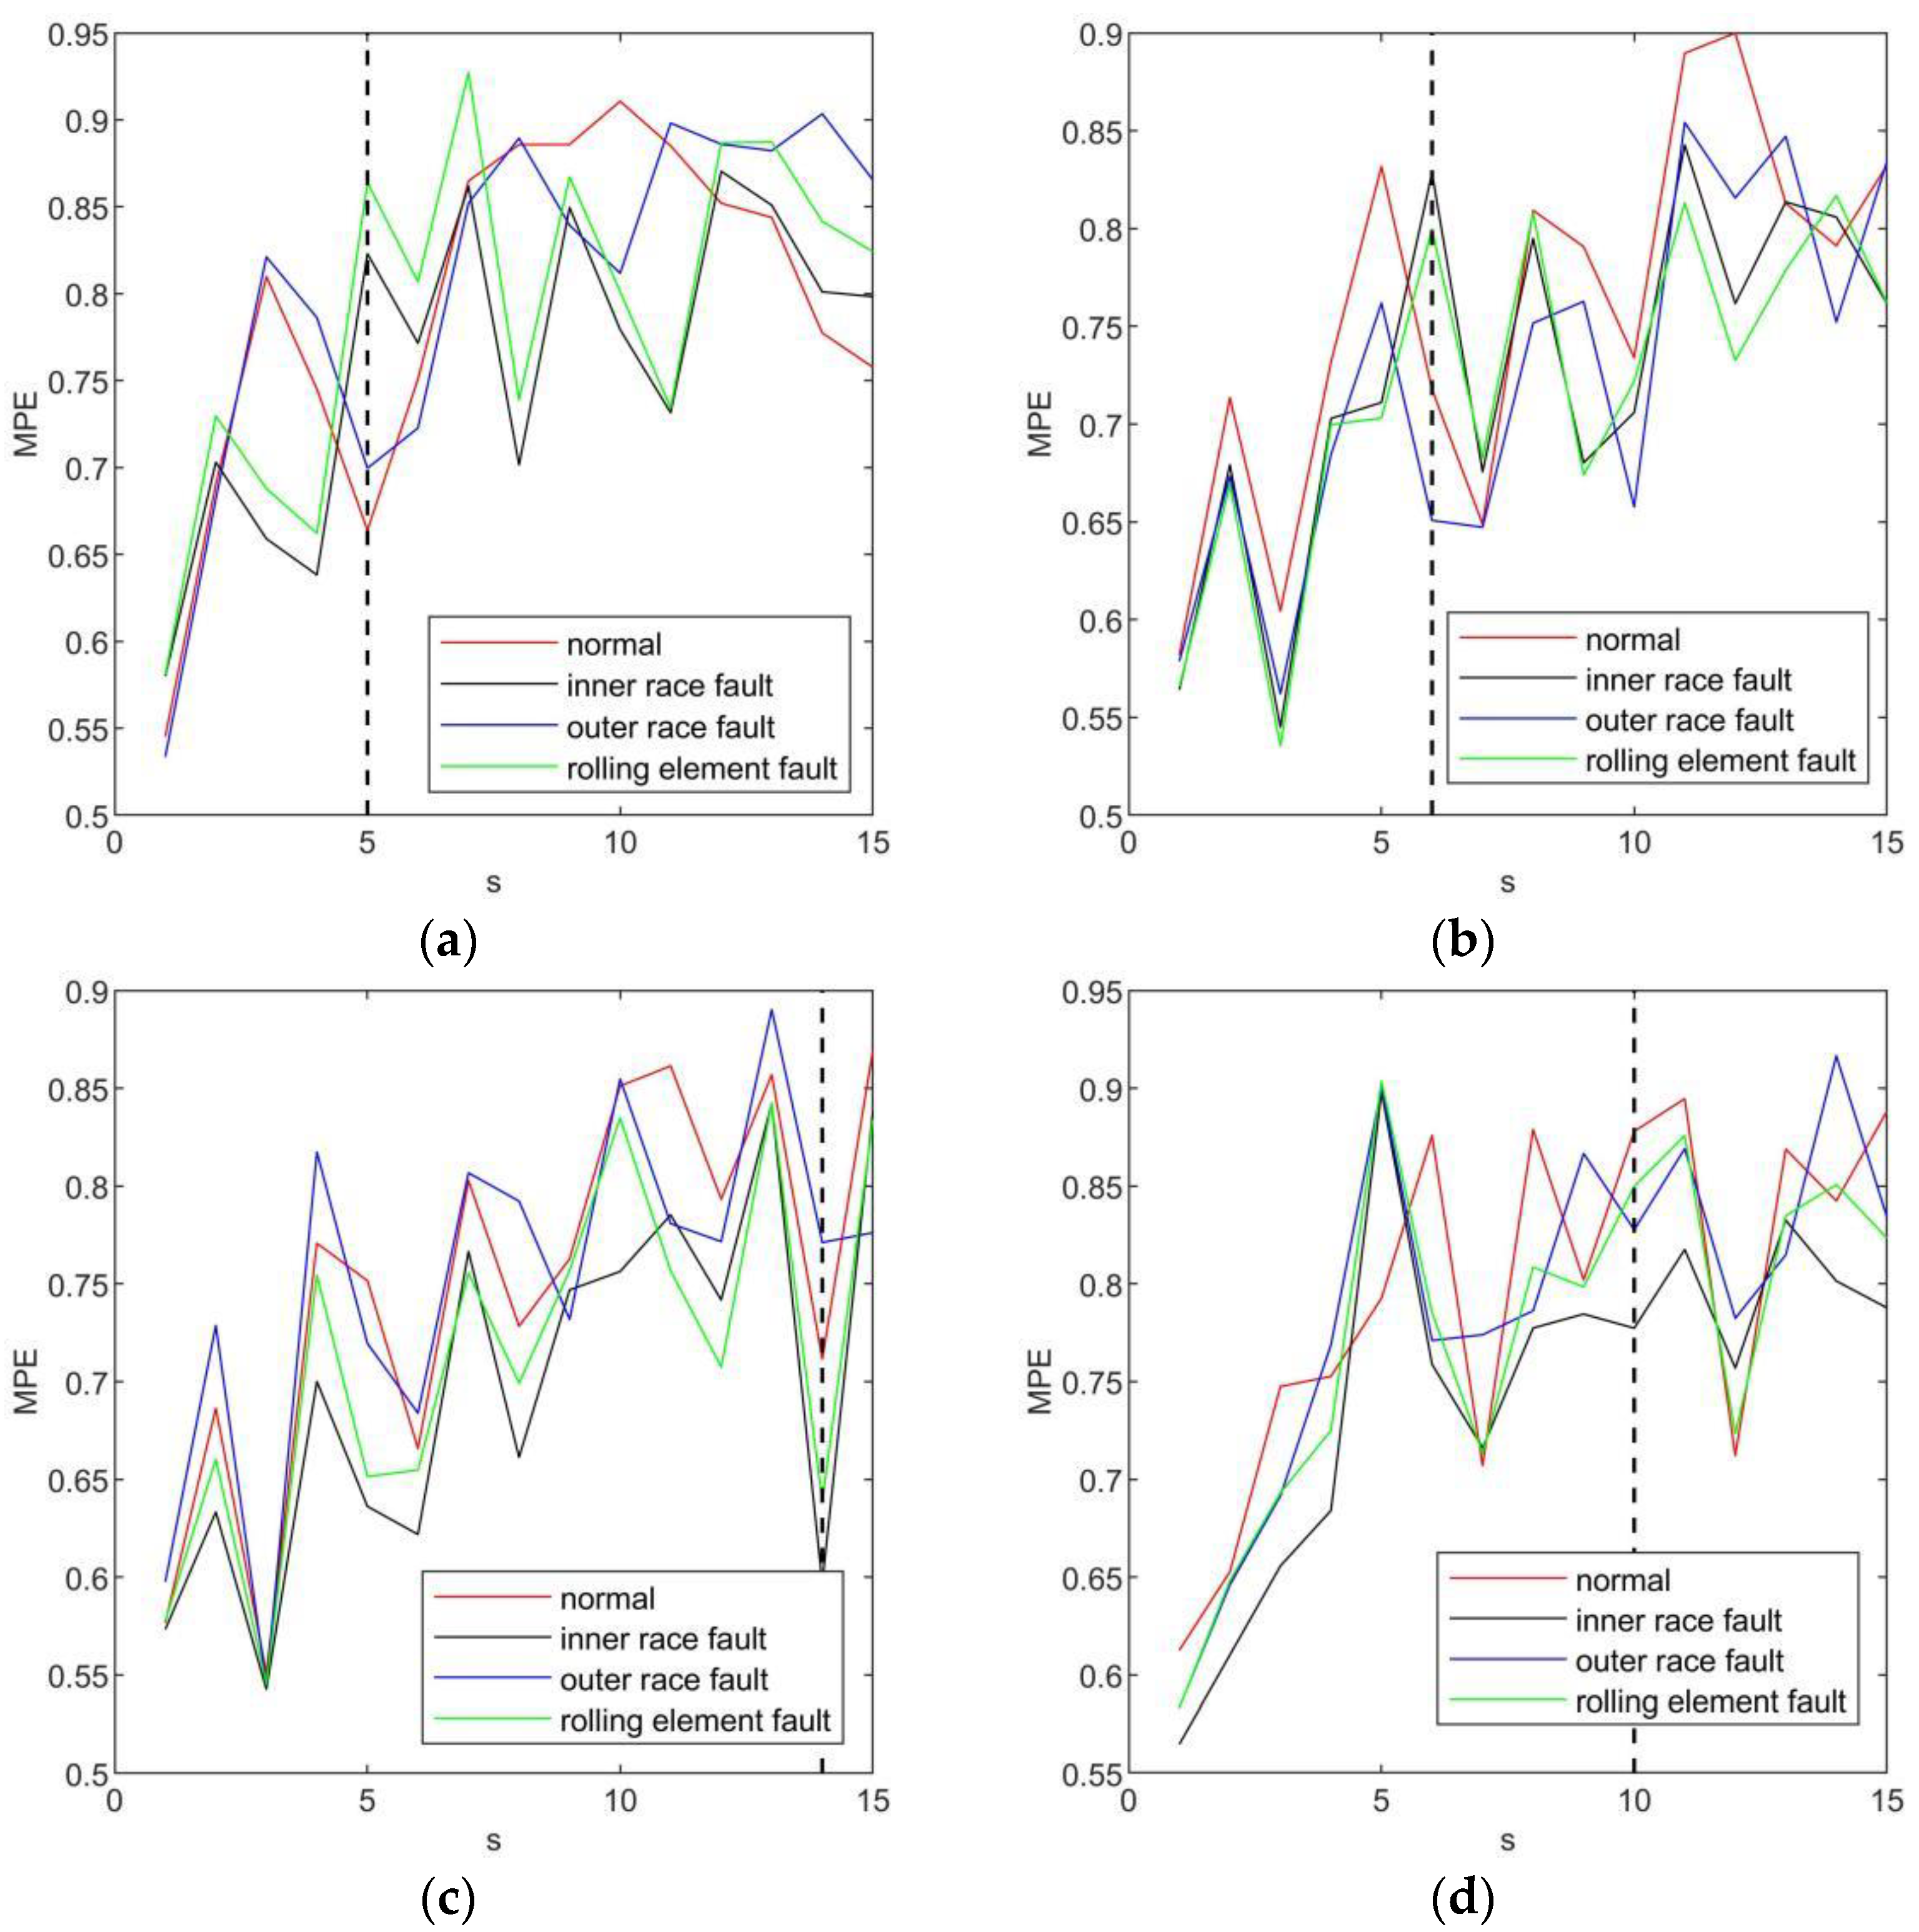
2.2. Multiscale Permutation Entropy and Dimension Reduction
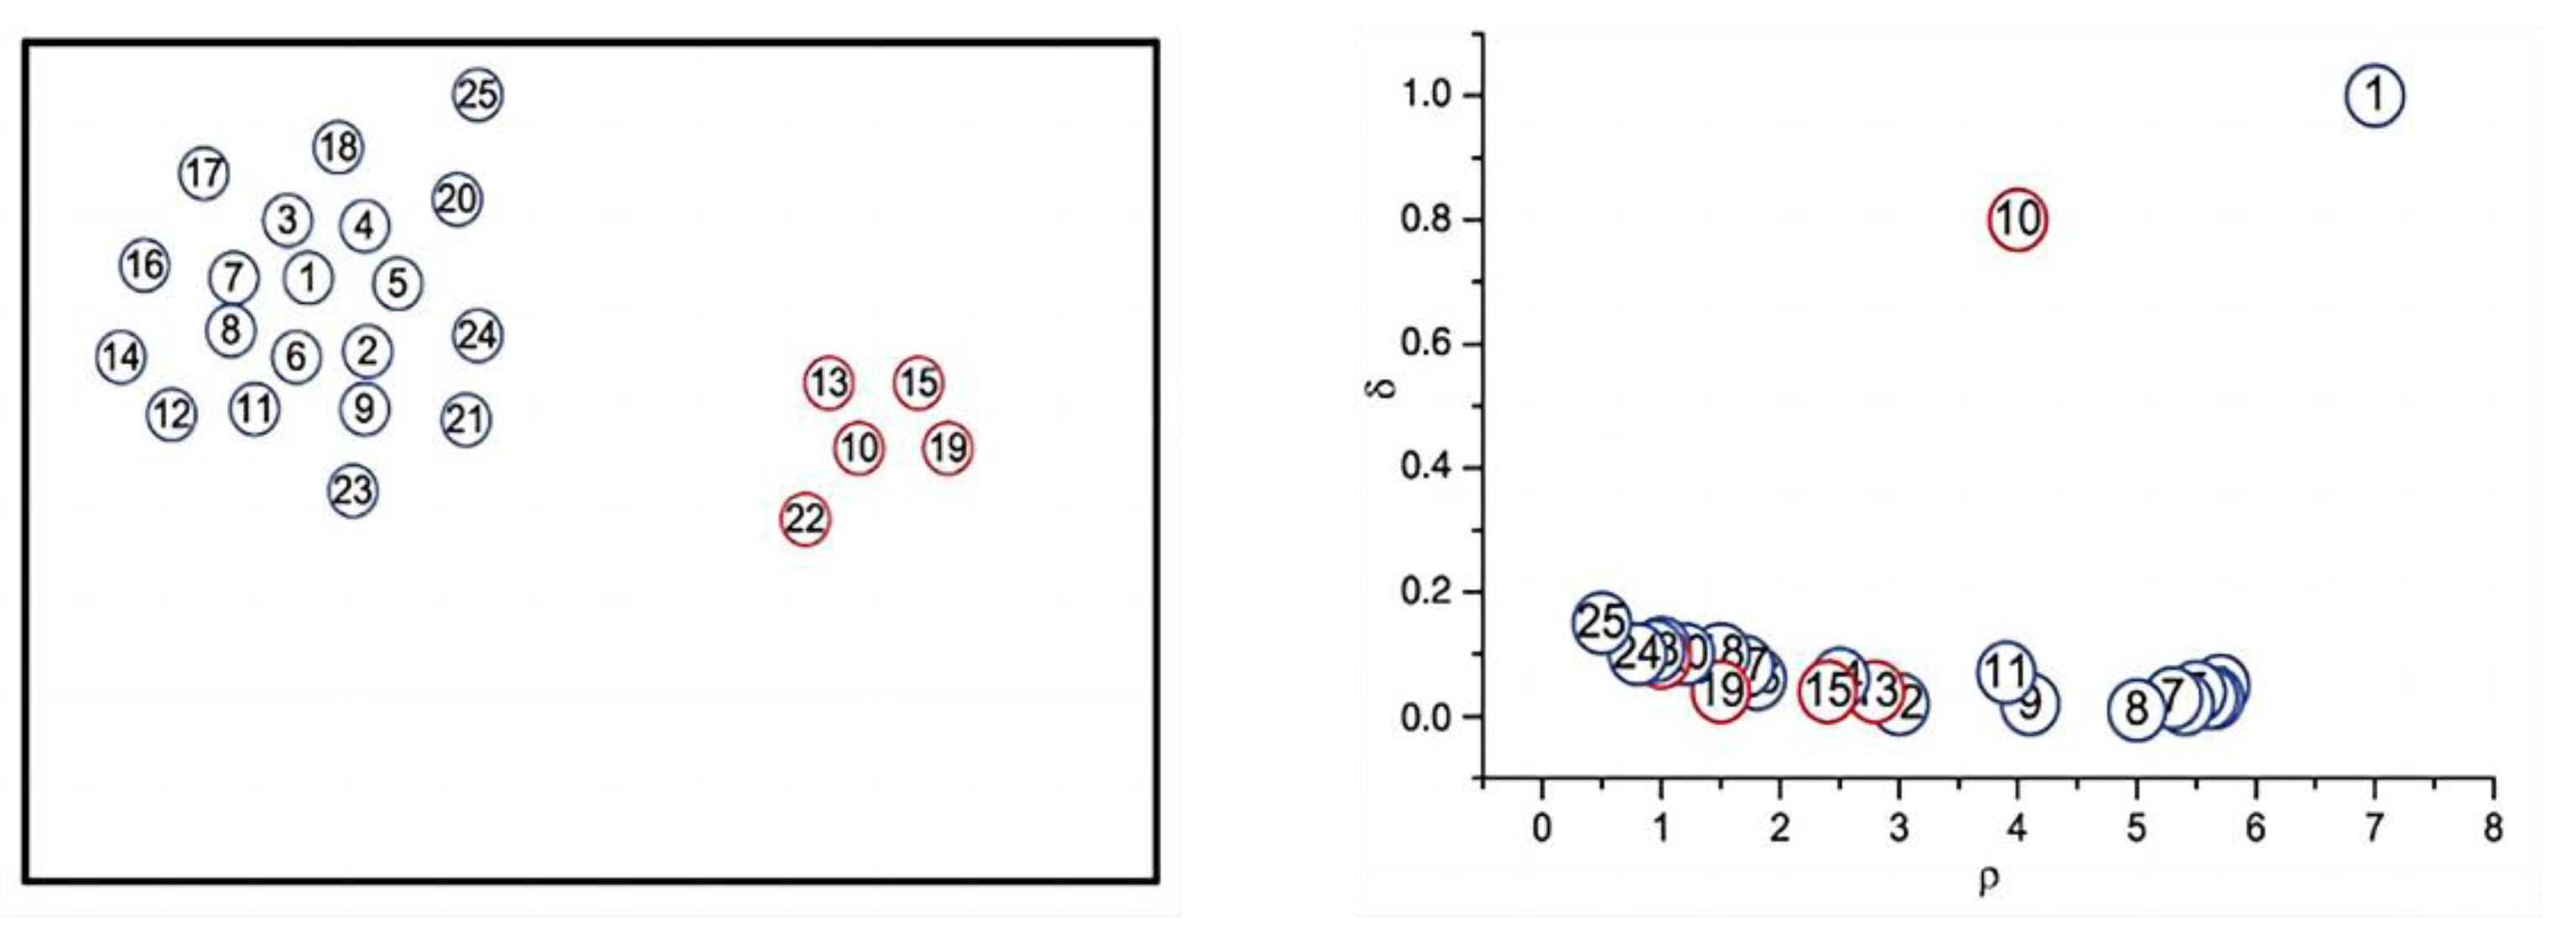
2.3. Density Peak Clustering
- (1)
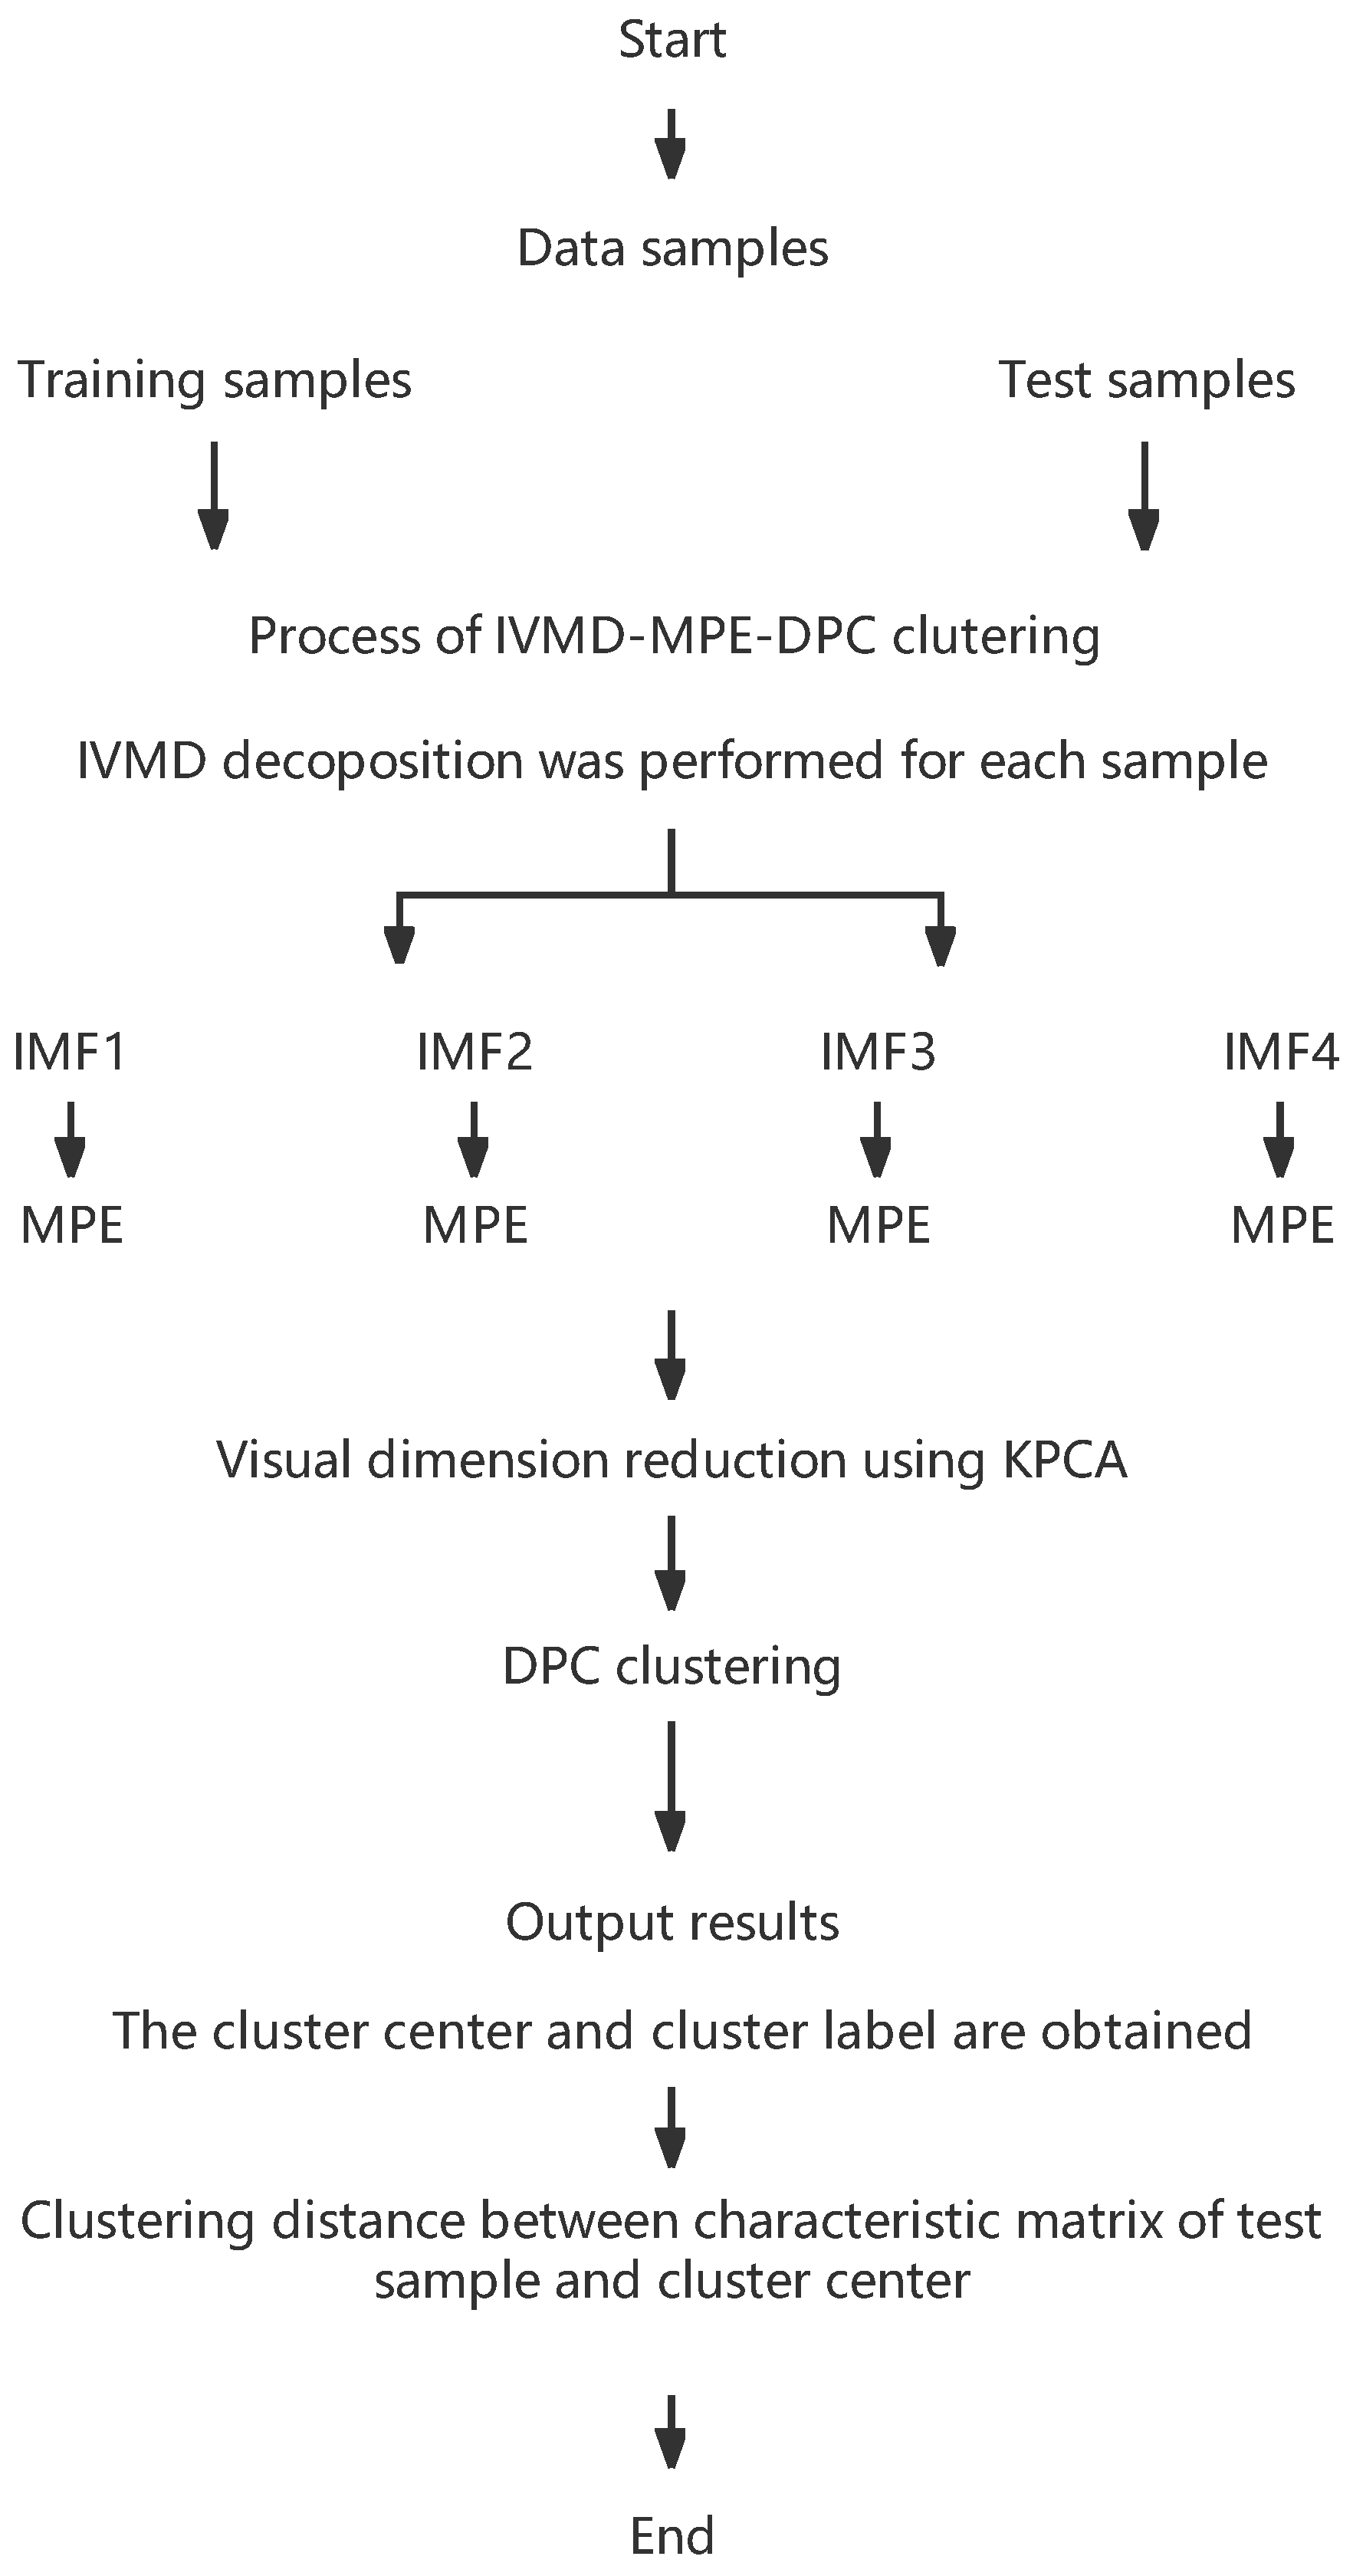
- Establish characteristic matrix. Select the original vibration signal to form time series x = (x1, x2,…, xn), and each time series x is processed with IVMD. The third to sixth intrinsic mode functions form a matrix. The characteristic matrix is constructed by computing the multi-scale permutation entropy of each IMF.
- (2)
- The characteristic matrix’s dimension is decreased with the help of KPCA. Projecting the feature matrix onto a two-dimensional space, we then use the two primary components with the greatest contribution rate to build a feature matrix in the two-dimensional space.
- (3)
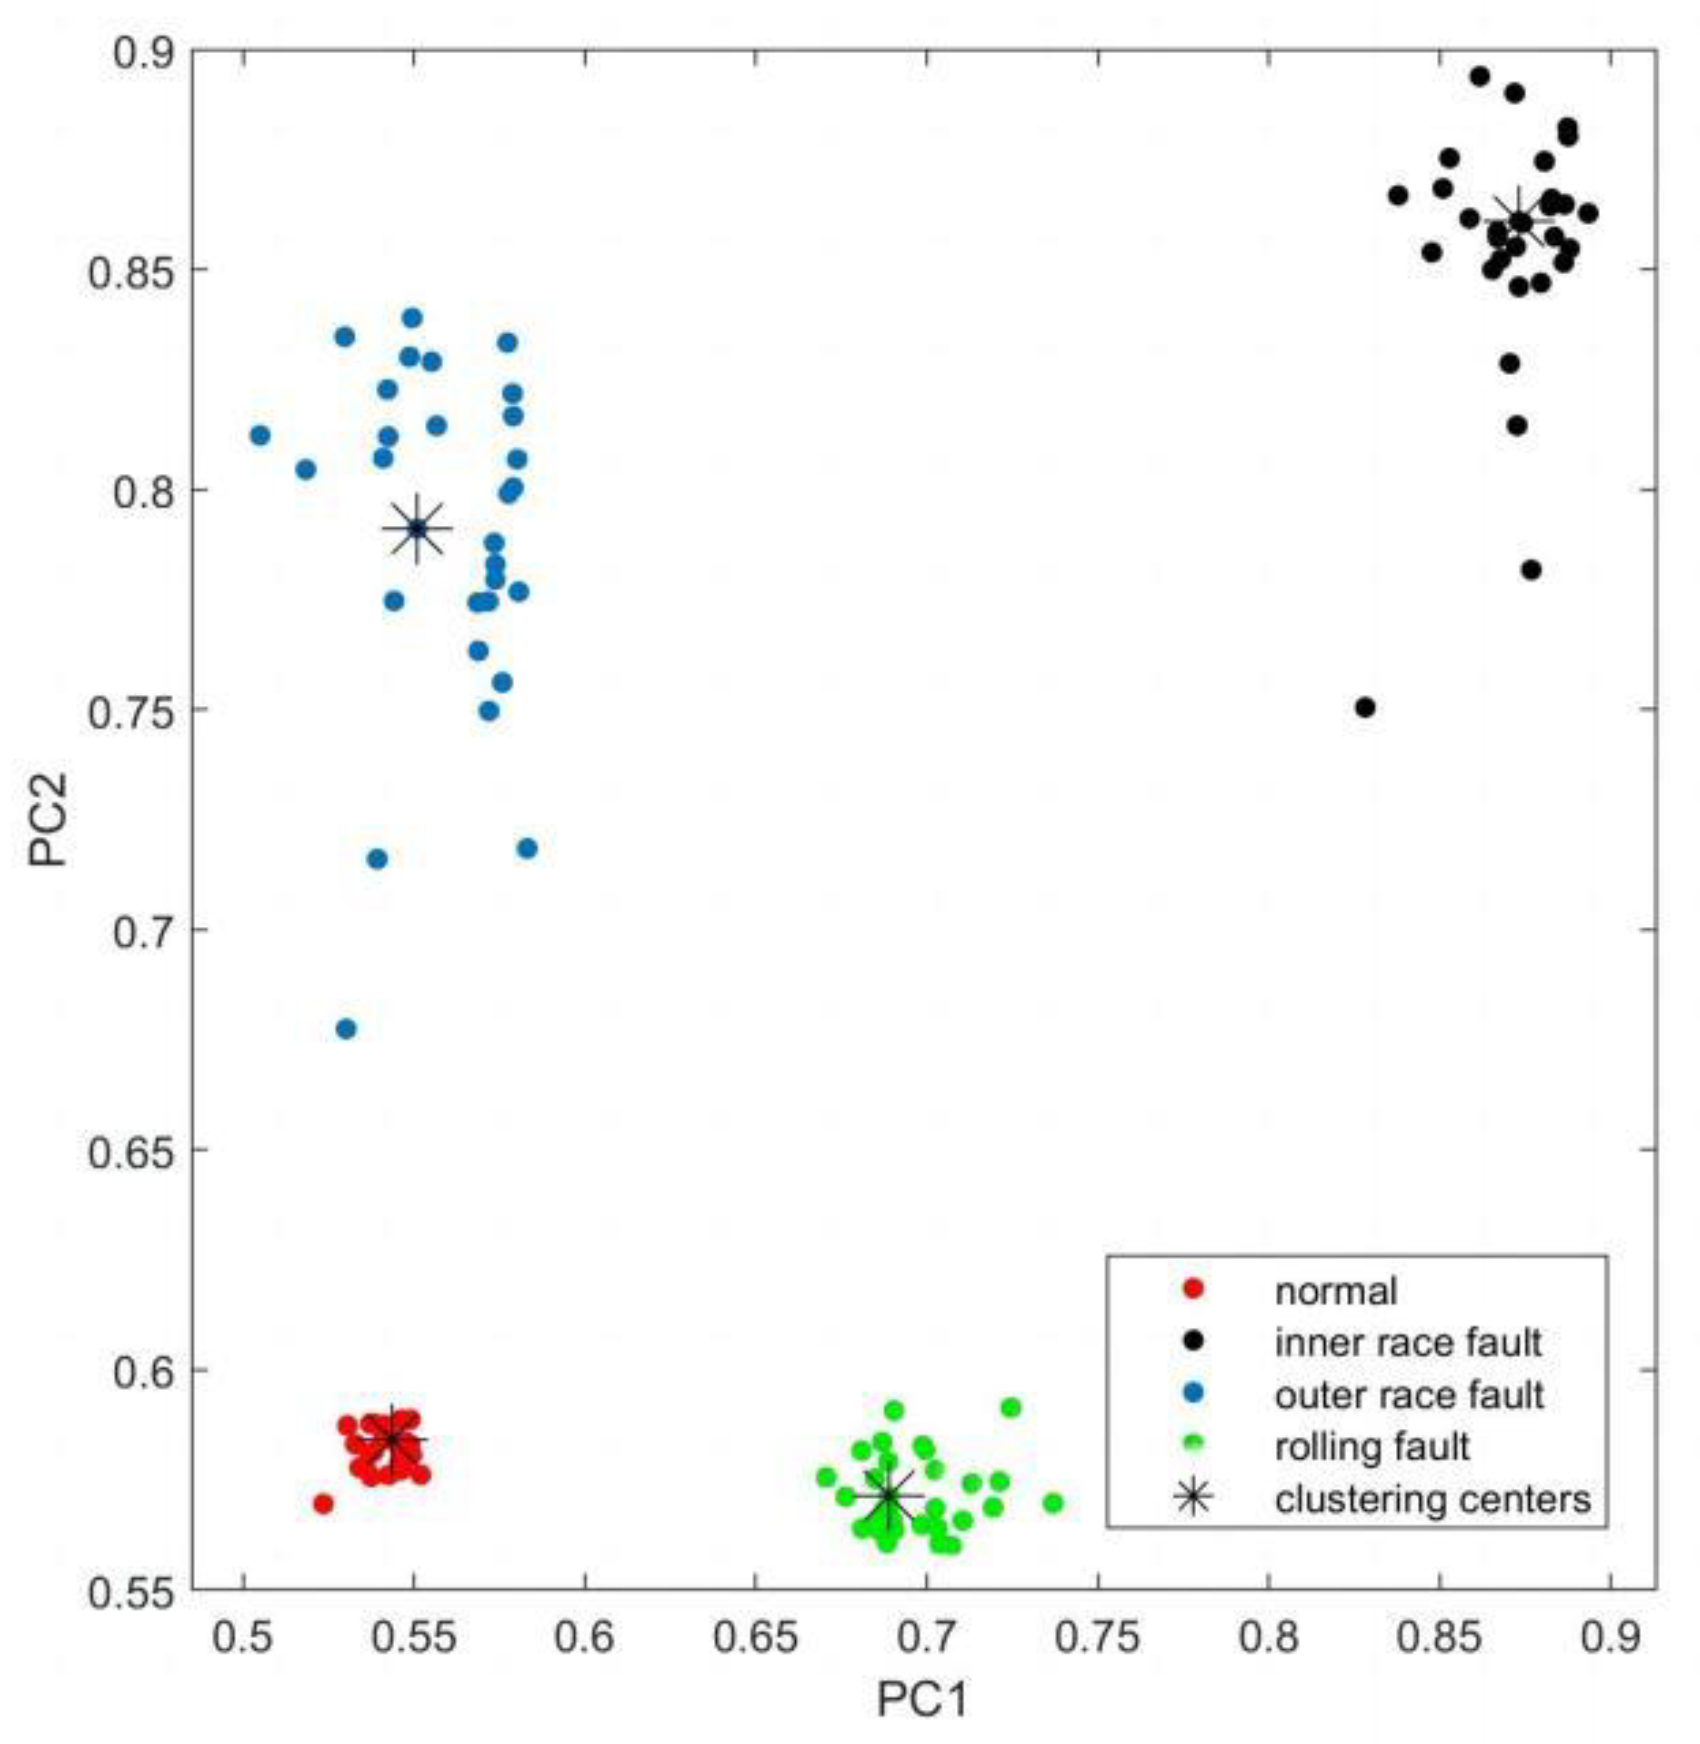
- Training evaluation model. The training set composed of principal components is input into the DPC classifier to obtain the cluster category and cluster center.
- (4)
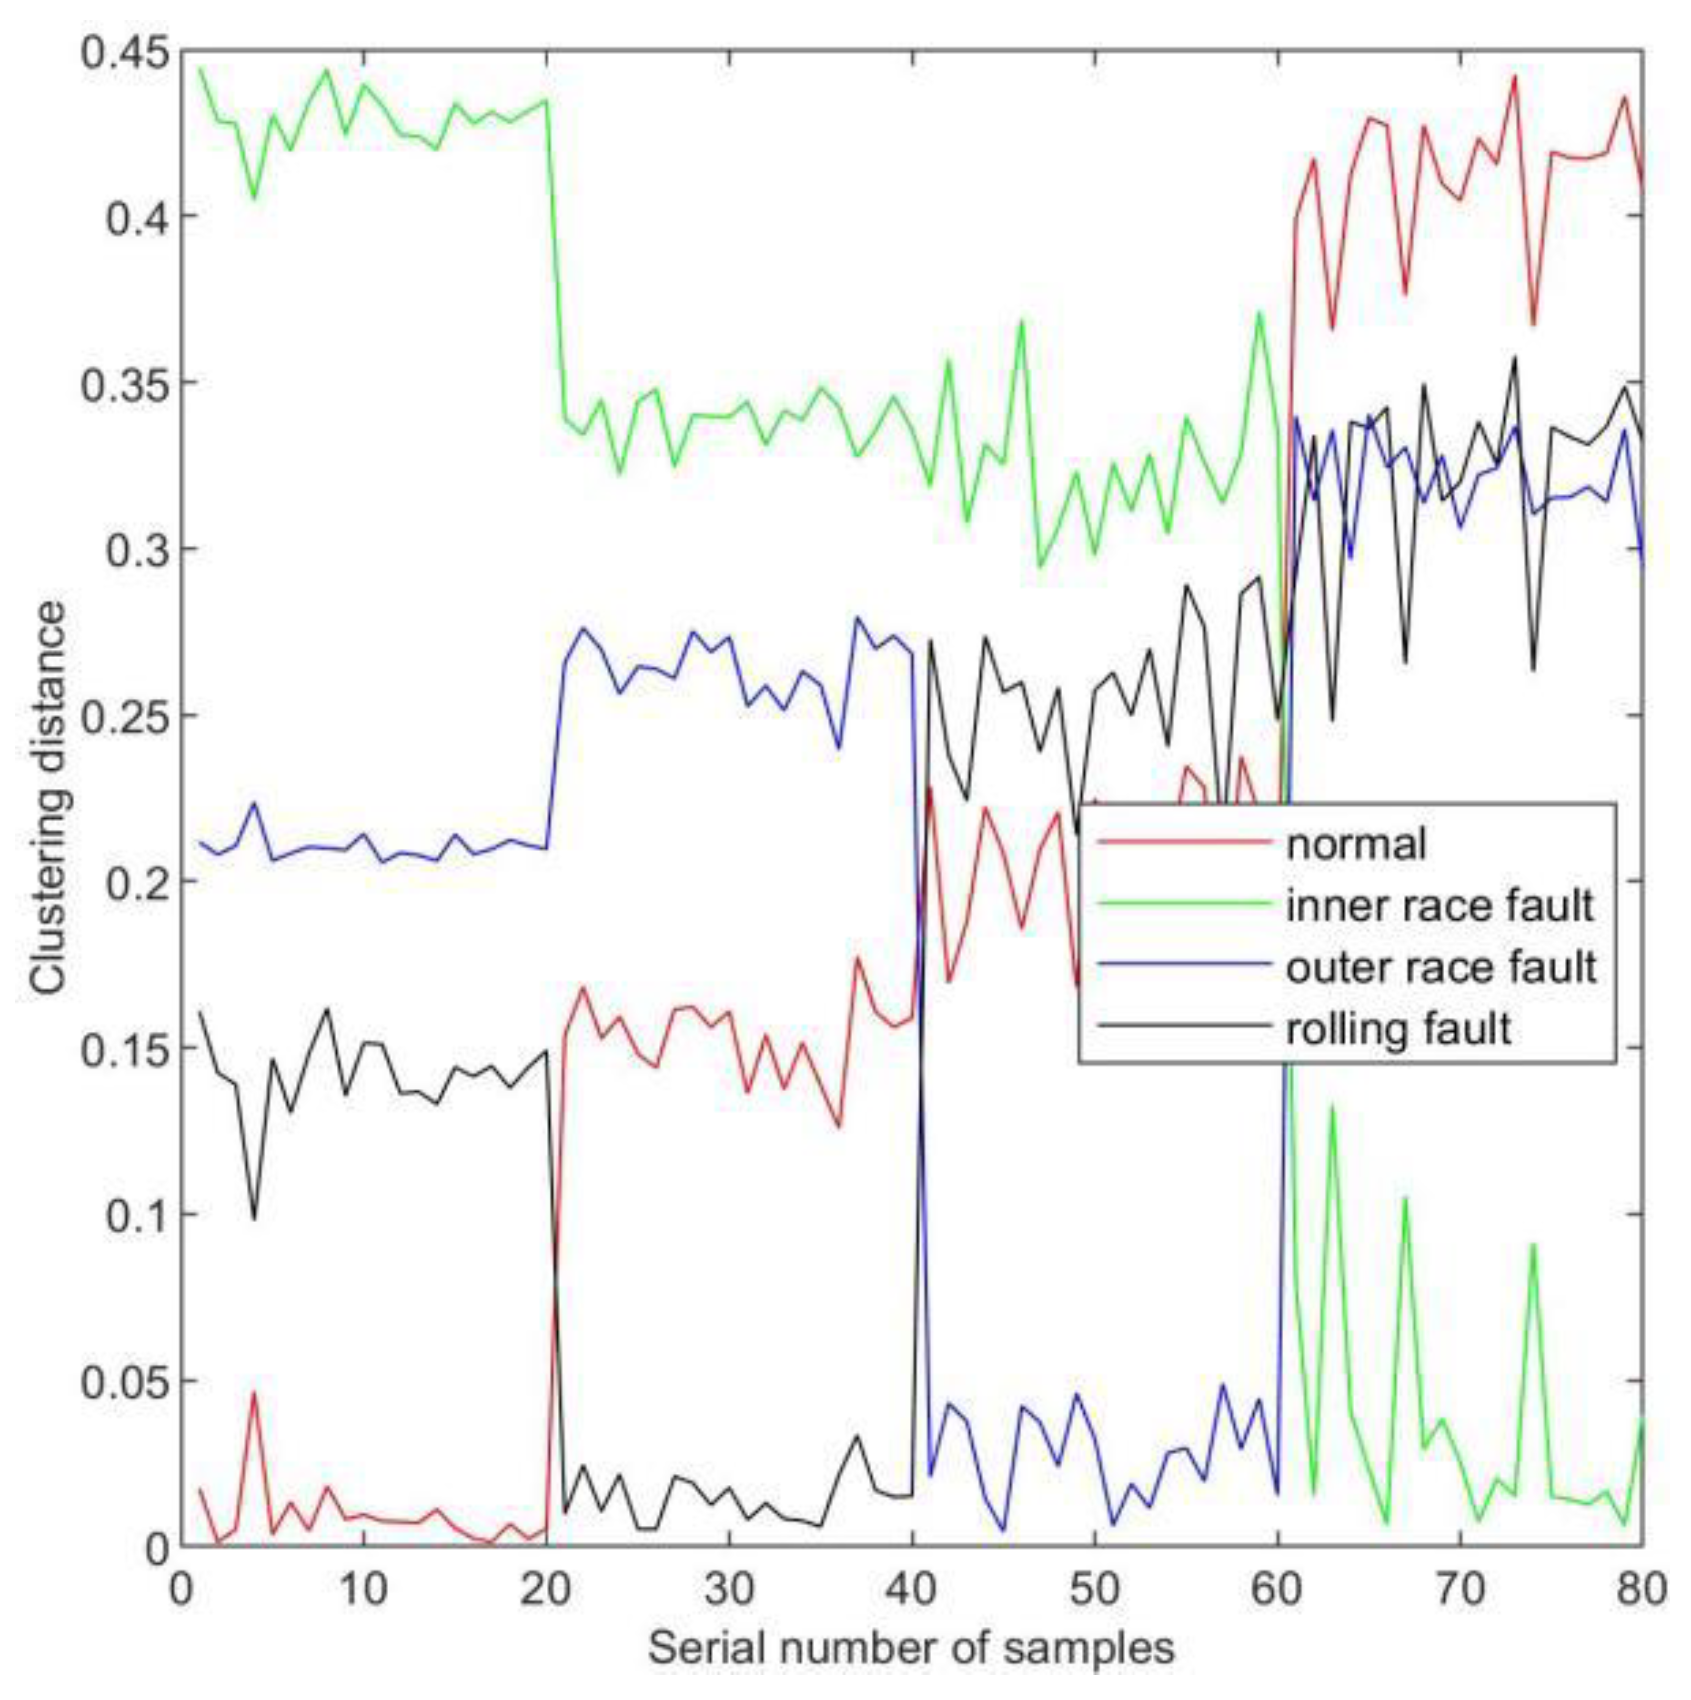
- Use a test set to confirm. Replicate steps 1 and 2, then feed the trained DPC classifier the test set’s main component matrix. The clustering distance between the test samples and the cluster center of the training set is used to categorize test samples.
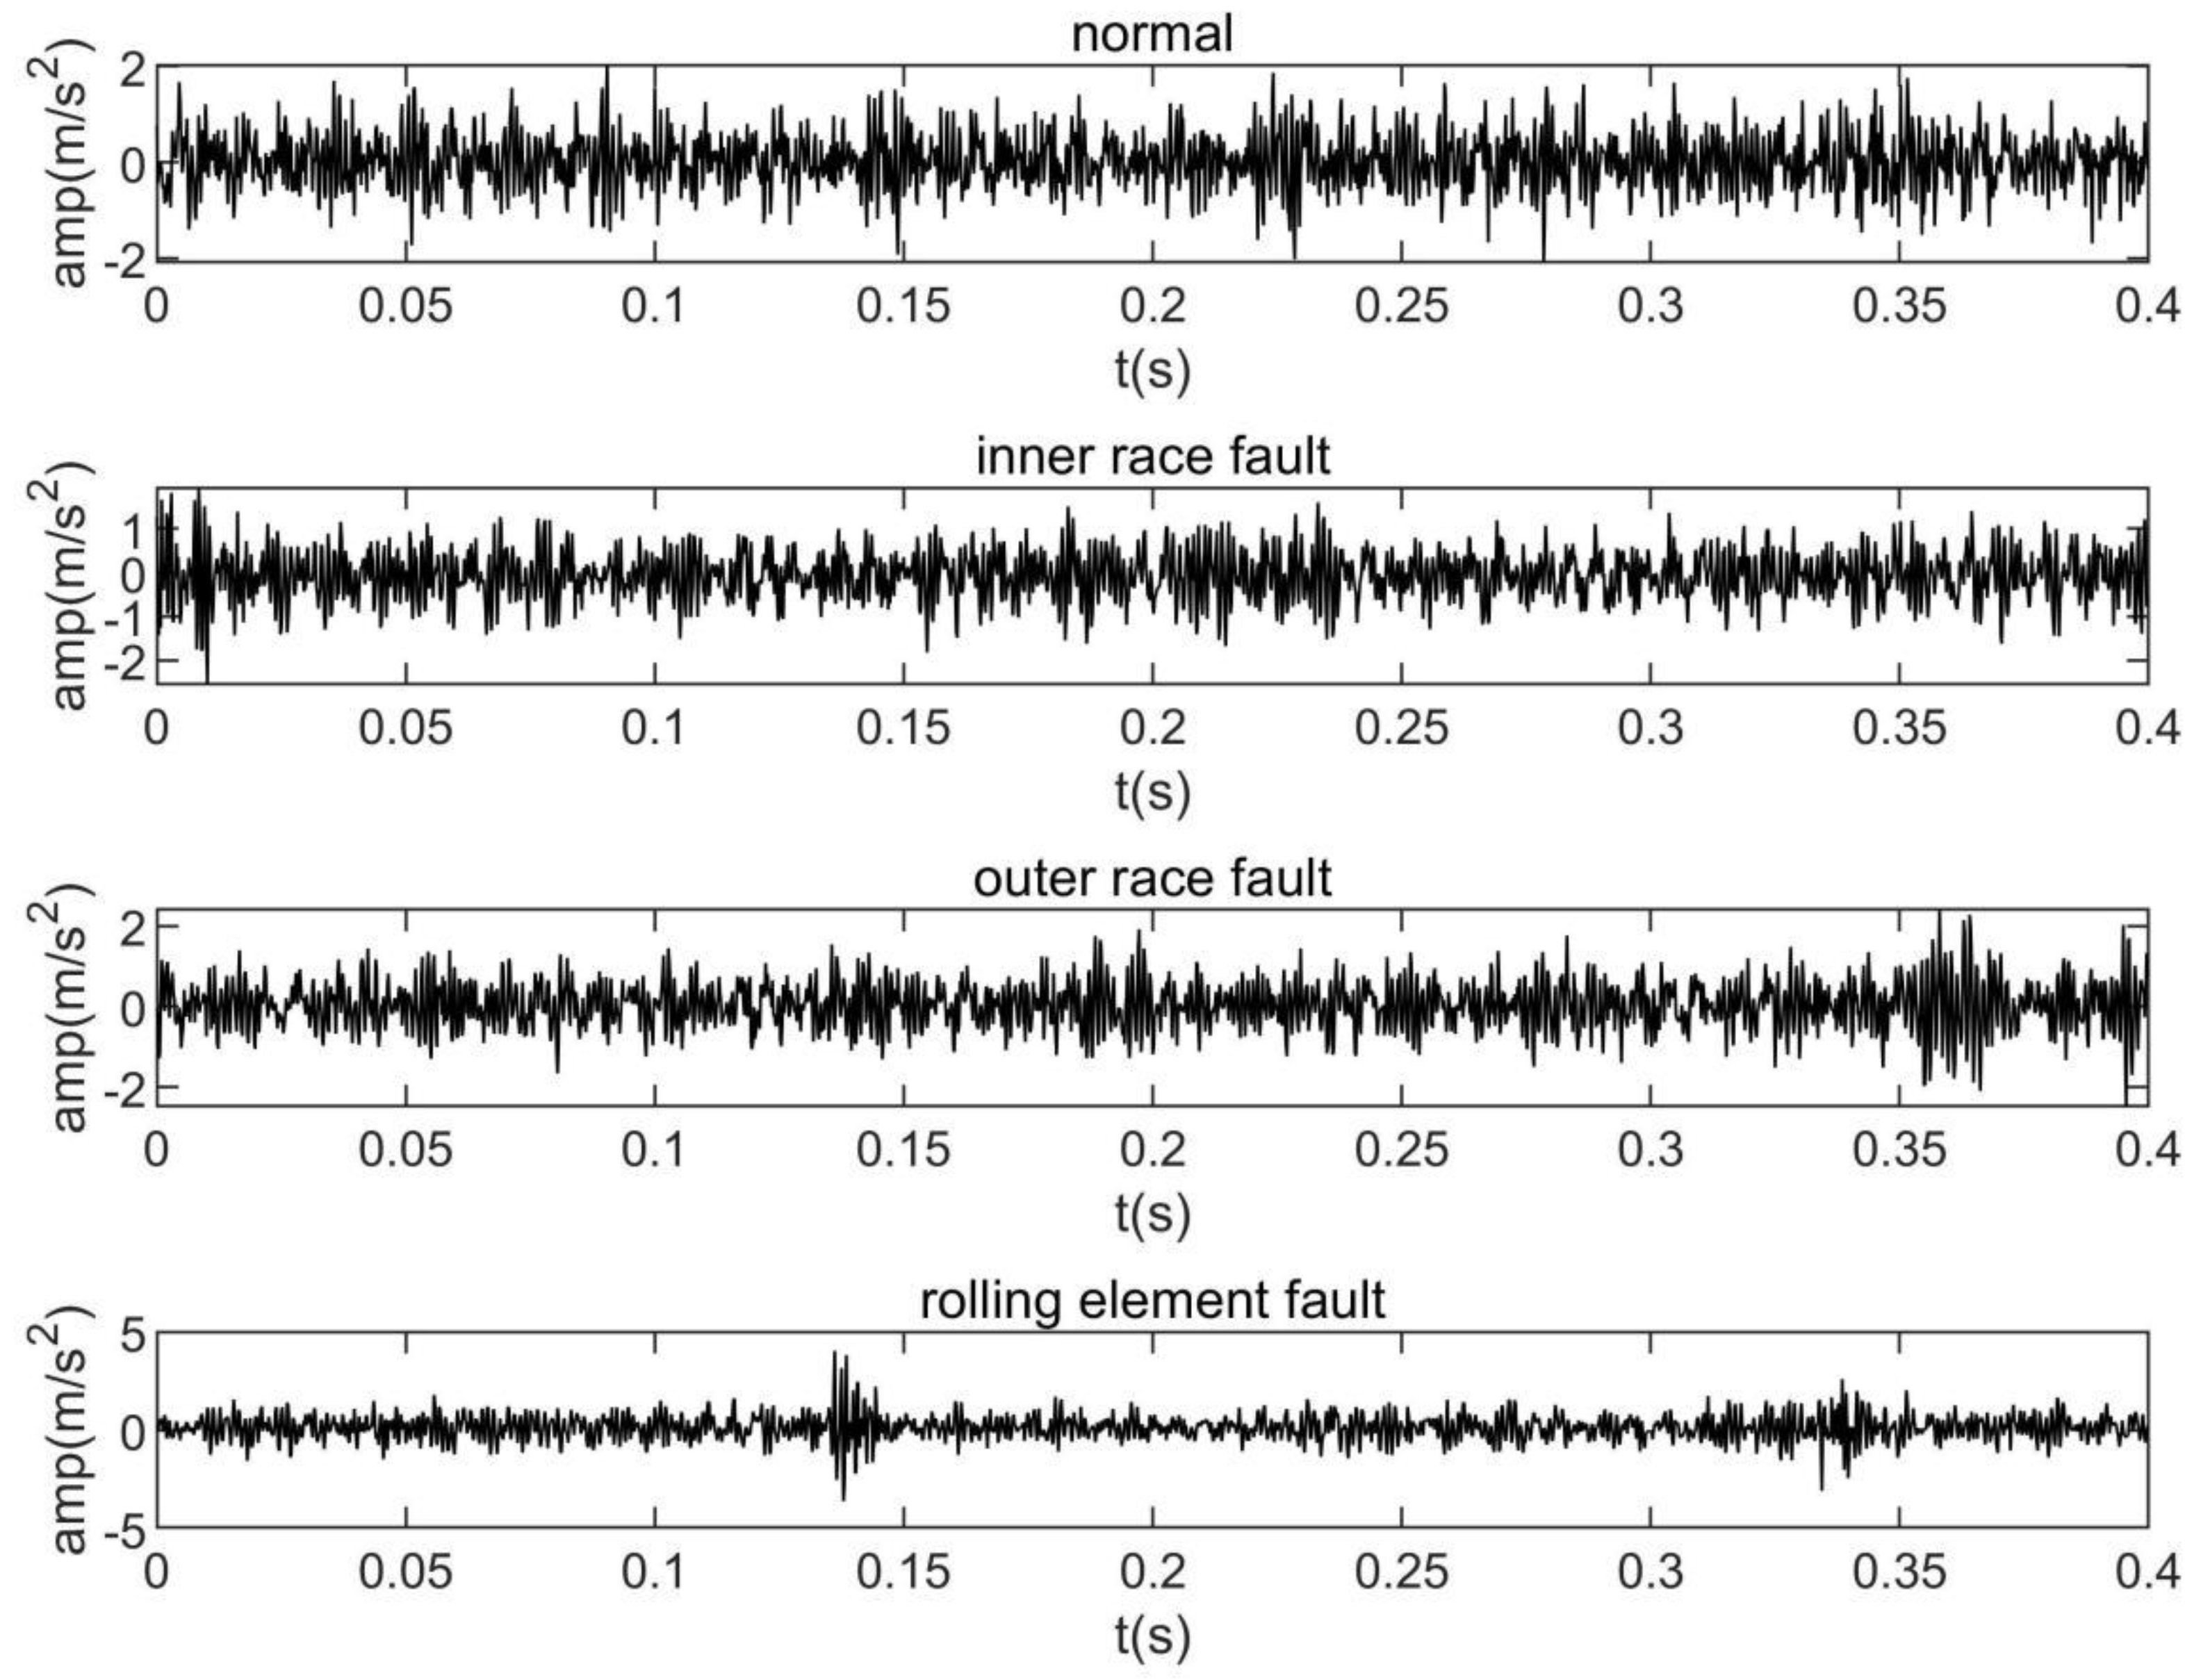
3. Experiment and Results
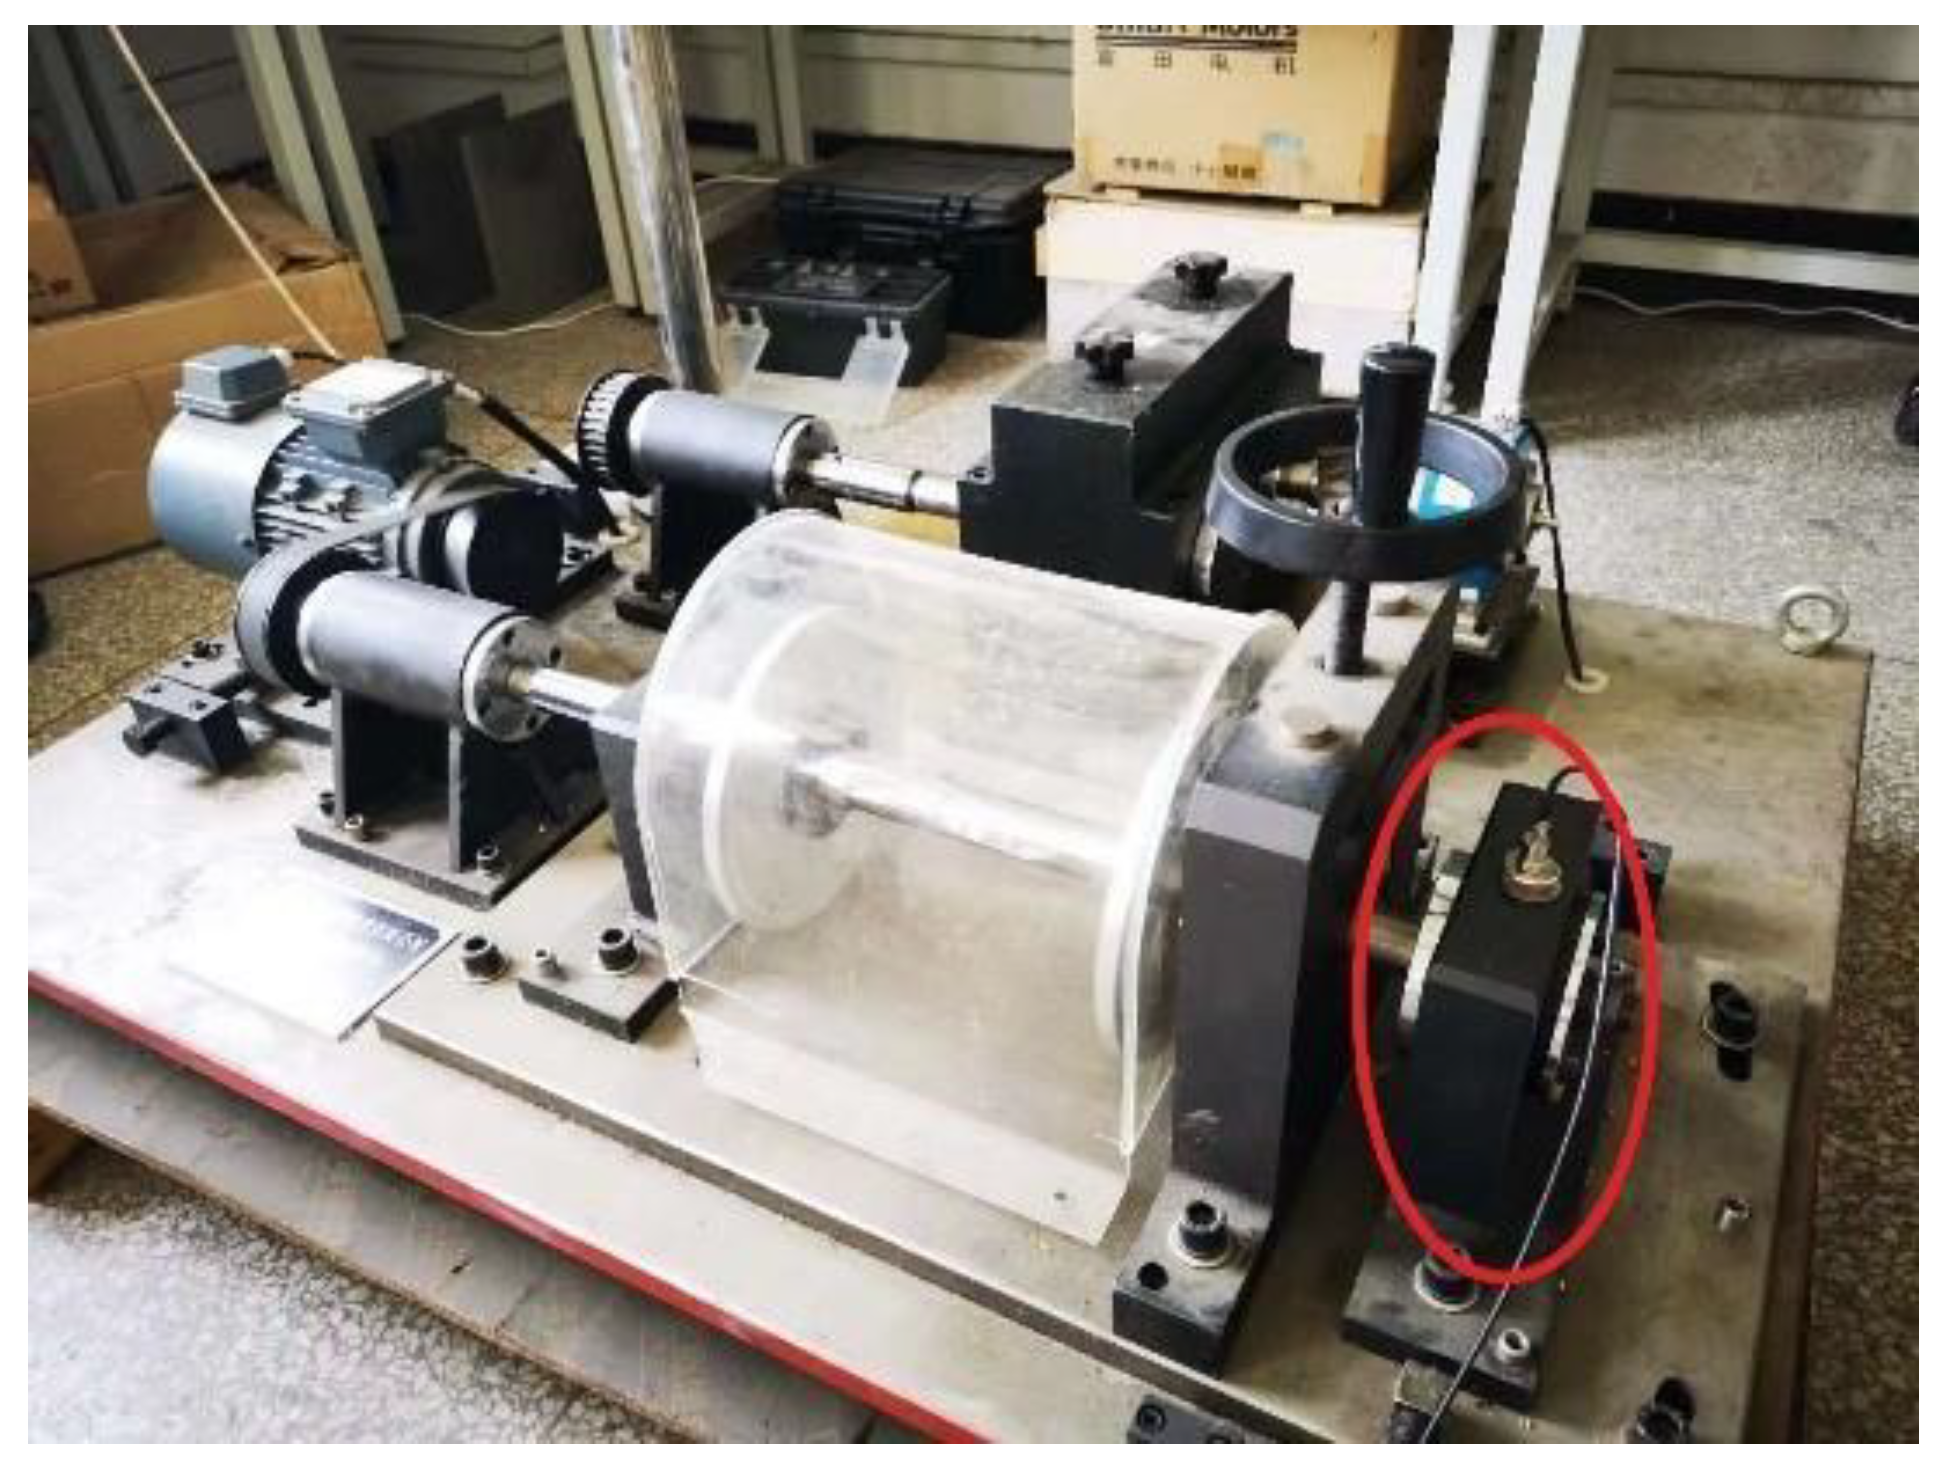
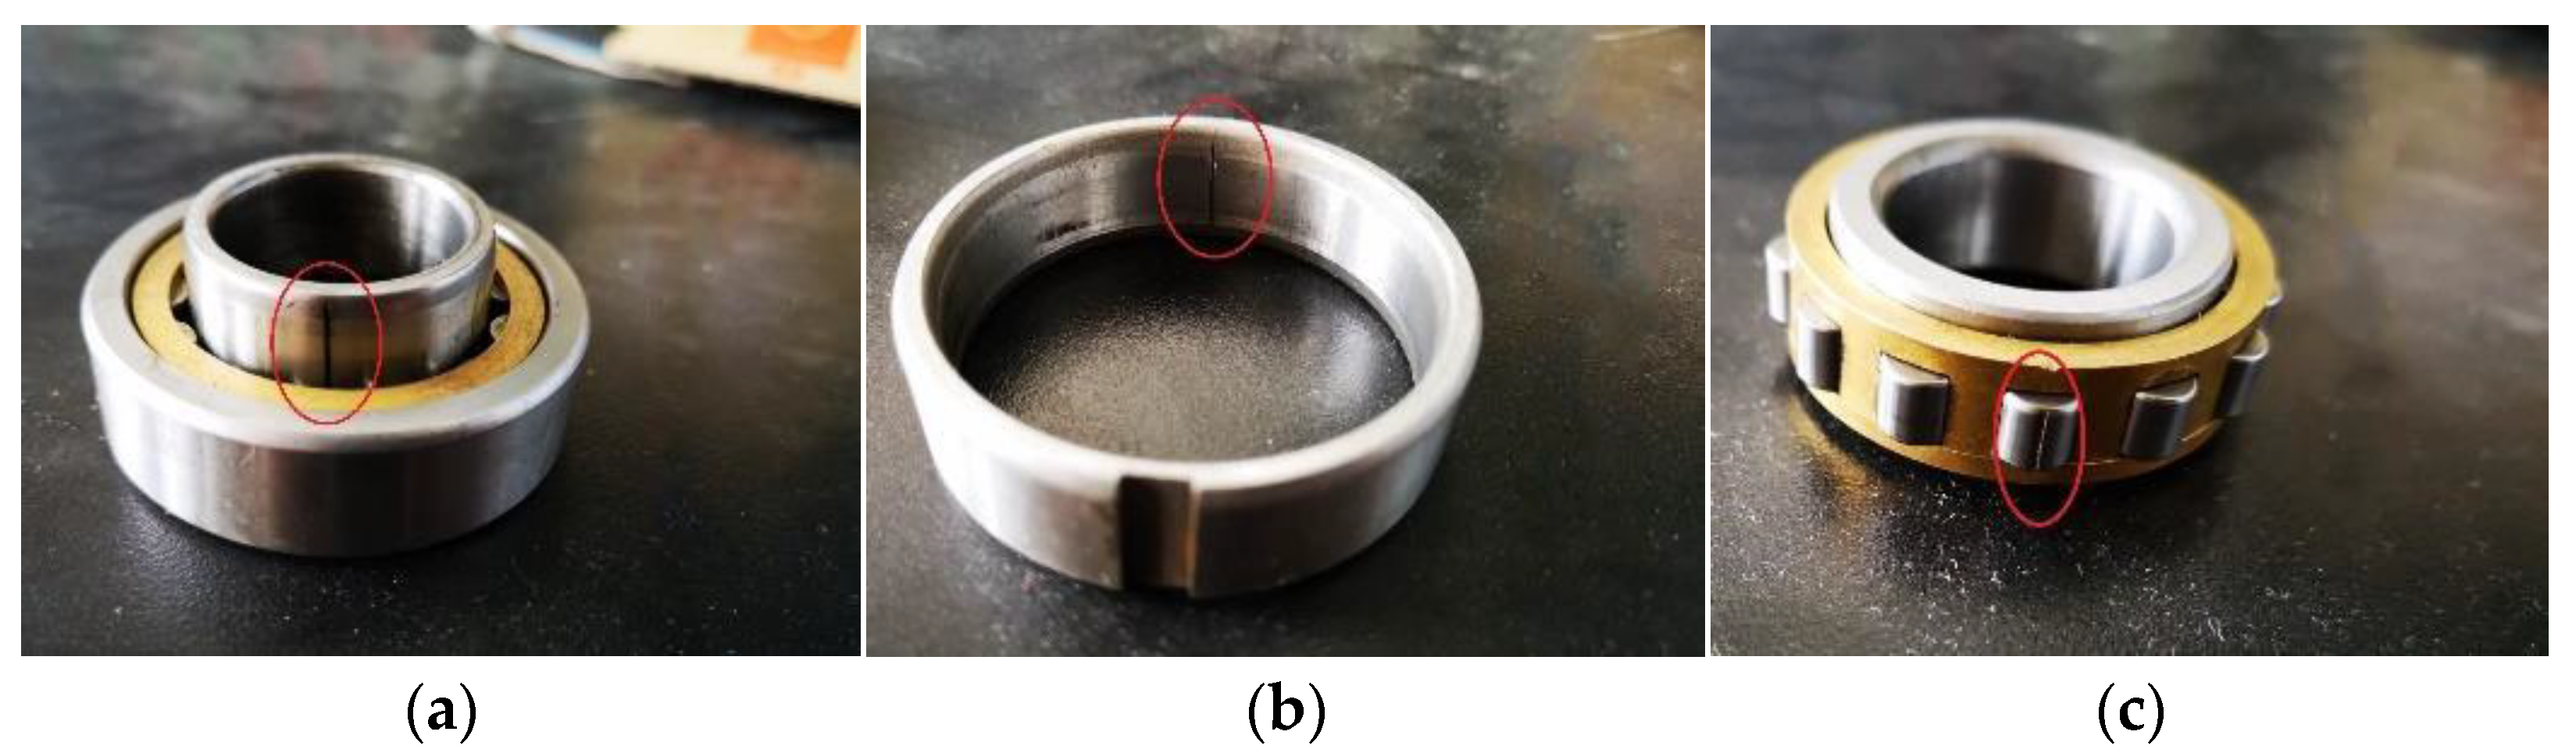
3.1. Experimental Platform
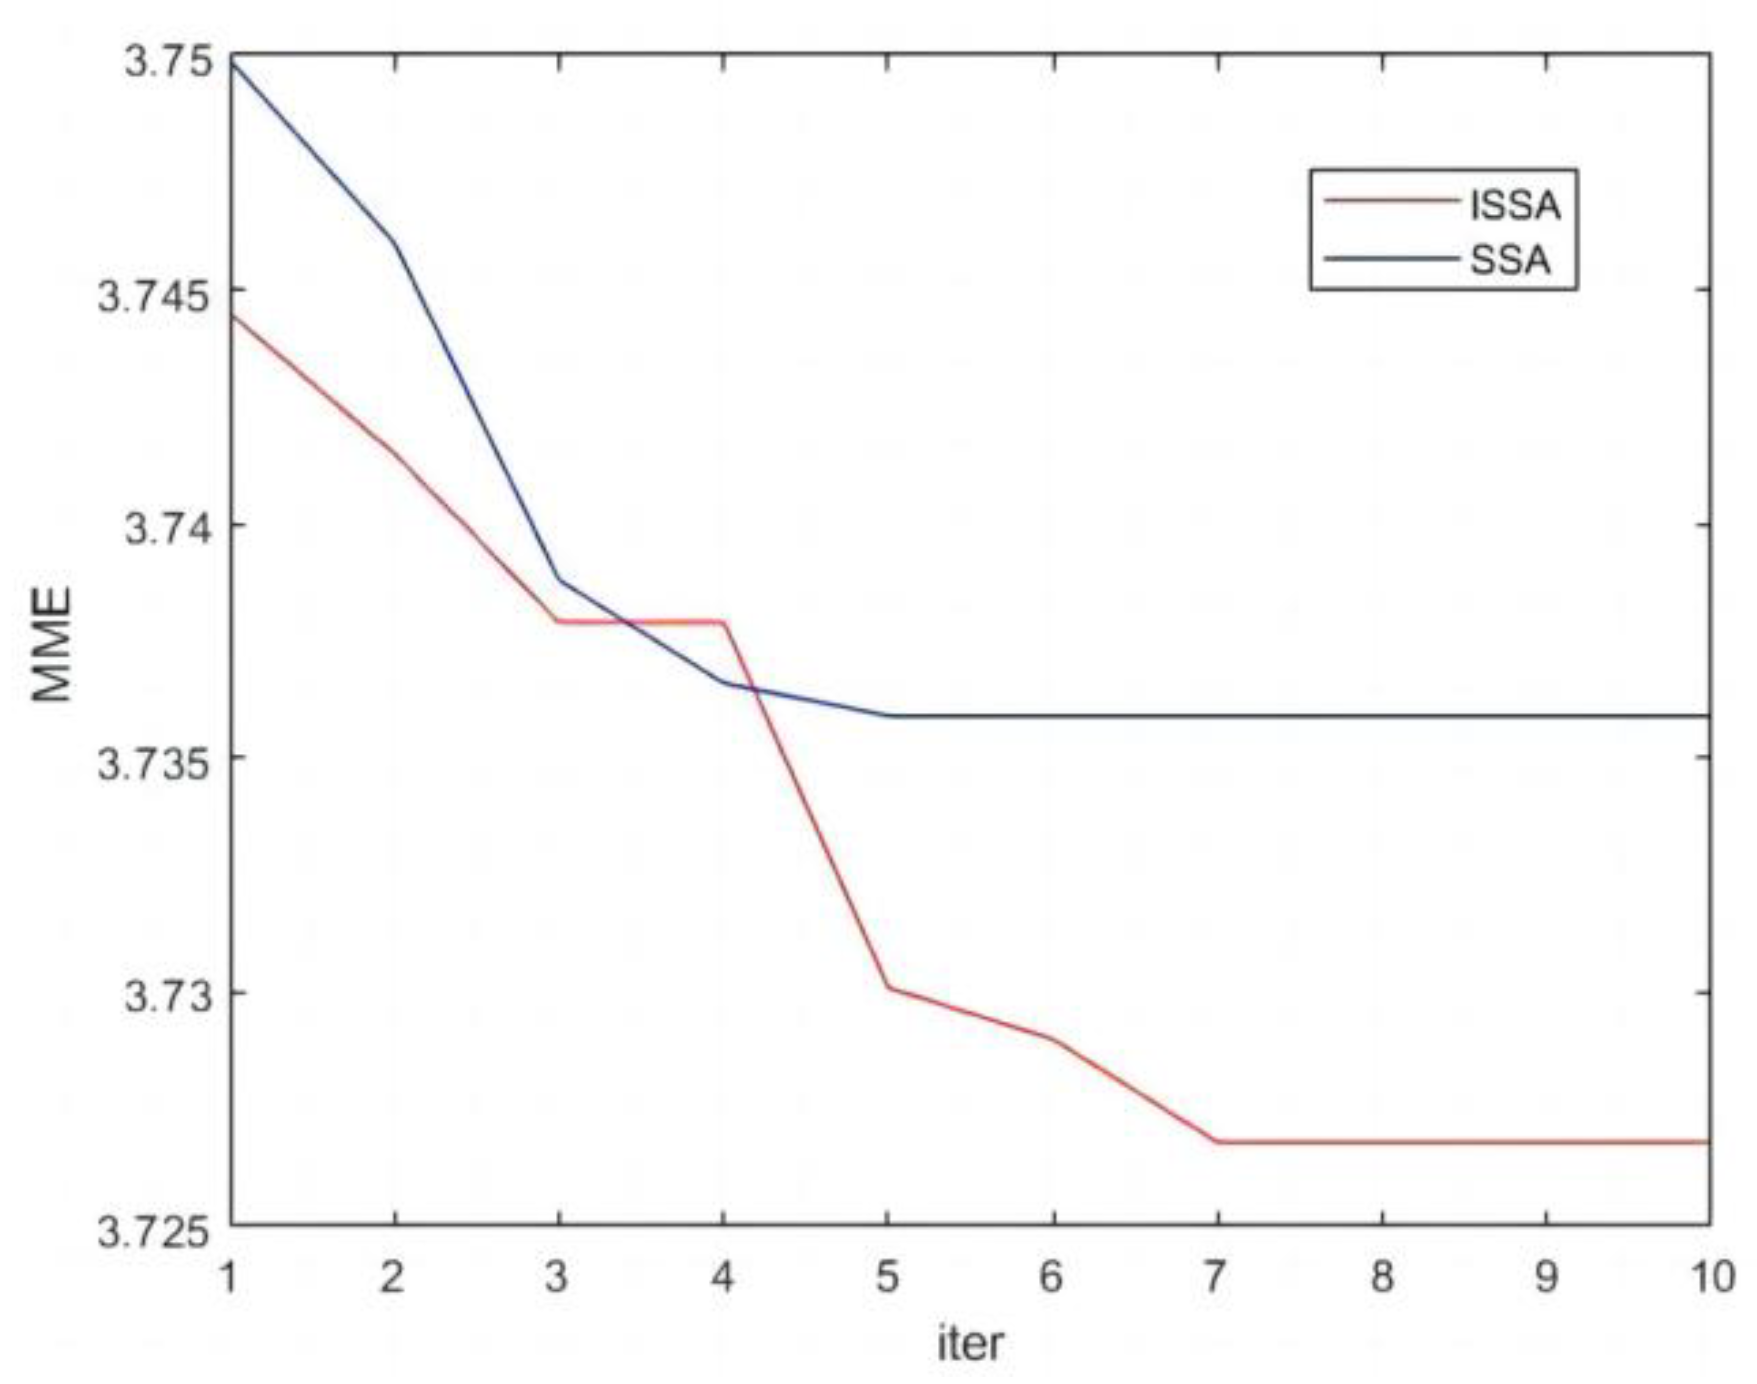
3.2. Results and Discussion
4. Conclusions
Author Contributions
Funding
Data Availability Statement
Acknowledgments
Conflicts of Interest
References
- Bian, L.; Sun, H.; He, H.; Liu, C.; Guan, Z. Research on Fault Diagnosis of Mine Ventilator Bearing based on Cross Entropy Algorithm. In Proceedings of the 2020 35th Youth Academic Annual Conference of Chinese Association of Automation (YAC), Zhanjiang, China, 16–18 October 2020. [Google Scholar]
- Li, J.; Chen, W.; Han, K.; Wang, Q. Fault Diagnosis of Rolling Bearing Based on GA-VMD and Improved WOA-LSSVM. IEEE Access 2020, 8, 166753–166767. [Google Scholar] [CrossRef]
- Li, Y.; Xu, M.; Wei, Y.; Huang, W. A new rolling bearing fault diagnosis method based on multiscale permutation entropy and improved support vector machine based binary tree. Measurement 2015, 77, 80–94. [Google Scholar] [CrossRef]
- Zhang, X.; Wang, H.; Ren, M.; He, M.; Jin, L. Rolling Bearing Fault Diagnosis Based on Multiscale Permutation Entropy and SOA-SVM. Machines 2022, 10, 485. [Google Scholar] [CrossRef]
- Zhang, X.; Miao, Q.; Zhang, H.; Wang, L. A parameter-adaptive VMD method based on grasshopper optimization algorithm to analyze vibration signals from rotating machinery. Mech. Syst. Signal Process. 2018, 108, 58–72. [Google Scholar] [CrossRef]
- Ma, H.; Tong, Q.; Zhang, Y. Applications of Optimization Parameters VMD to Fault Diagnosis of Rolling Bearings. Zhongguo Jixie Gongcheng China Mech. Eng. 2018, 29, 390–397. [Google Scholar]
- Guo, Z.; Liu, M.; Wang, Y.; Qin, H. A New Fault Diagnosis Classifier for Rolling Bearing United Multi-Scale Permutation Entropy Optimize VMD and Cuckoo Search SVM. IEEE Access 2020, 8, 153610–153629. [Google Scholar] [CrossRef]
- Wang, M.; Wang, W.; Zeng, J.; Zhang, Y. An Integrated Method Based on Sparrow Search Algorithm Improved Variational Mode Decomposition and Support Vector Machine for Fault Diagnosis of Rolling Bearing. J. Vib. Eng. Technol. 2022, 10, 2893–2904. [Google Scholar] [CrossRef]
- Richman, J.S.; Moorman, J.R. Physiological time-series analysis using approximate entropy and sample entropy. Am. J. Physiol. 2000, 278, H2039–H2049. [Google Scholar] [CrossRef] [Green Version]
- Bandt, C.; Pompe, B. Permutation Entropy: A Natural Complexity Measure for Time Series. Phys. Rev. Lett. 2002, 88, 174102. [Google Scholar] [CrossRef]
- Costa, M.; Goldberger, A.L.; Peng, C.K. Multiscale Entropy Analysis of Complex Physiologic Time Series. Phys. Rev. Lett. 2007, 89, 705–708. [Google Scholar] [CrossRef] [Green Version]
- Aziz, W.; Arif, M. Multiscale Permutation Entropy of Physiological Time Series. In Proceedings of the International Multitopic Conference, Karachi, Pakistan, 23–24 December 2005. [Google Scholar]
- An, G.; Tong, Q.; Zhang, Y.; Liu, R.; Li, W.; Cao, J.; Lin, Y. An Improved Variational Mode Decomposition and Its Application on Fault Feature Extraction of Rolling Element Bearing. Energies 2021, 14, 1079. [Google Scholar] [CrossRef]
- Tian, J.; Morillo, C.; Azarian, M.H.; Pecht, M. Motor Bearing Fault Detection Using Spectral Kurtosis-Based Feature Extraction Coupled With K-Nearest Neighbor Distance Analysis. IEEE Trans. Ind. Electron. 2016, 63, 1793–1803. [Google Scholar] [CrossRef]
- Ting-Ting, X.; Yan, Z.; Zong, M.; Xiao-Lin, G. A fault diagnosis method of rolling bearing based on VMD Tsallis entropy and FCM clustering. Multimed. Tools Appl. 2020, 79, 30069–30085. [Google Scholar] [CrossRef]
- Shu, S.C.; Han, D. Approach for a hydraulic pump’s feature extraction based on multiscale optimal fuzzy entropy. J. Vib. Shock. 2016. [Google Scholar]
- Zhang, X.; Zhang, M.; Wan, S.T.; He, Y.L.; Wang, X.L. A bearing fault diagnosis method based on multiscale dispersion entropy and GG clustering. Measurement 2021, 185, 110023. (In English) [Google Scholar] [CrossRef]
- Wu, S.D.; Wu, P.H.; Wu, C.W.; Ding, J.J.; Wang, C.C. Bearing Fault Diagnosis Based on Multiscale Permutation Entropy and Support Vector Machine. Entropy 2012, 14, 1343–1356. [Google Scholar] [CrossRef] [Green Version]
- Yan, X.; Jia, M.; Xiang, L. Compound fault diagnosis of rotating machinery based on OVMD and a 1.5-dimension envelope spectrum. Meas. Sci. Technol 2016, 27, 075002. [Google Scholar] [CrossRef]
- Zhongliang, L.; Baoping, T.; Yi, Z.; Chuande, Z. A Novel Method for Mechanical Fault Diagnosis Based on Variational Mode Decomposition and Multikernel Support Vector Machine. Shock. Vib. 2016, 2016, 3196465. [Google Scholar]
- Wu, C.; Fu, X.; Pei, J.; Dong, Z. A Novel Sparrow Search Algorithm for the Traveling Salesman Problem. IEEE Access 2021, 9, 153456–153471. [Google Scholar] [CrossRef]
- Yu, Y.; Cheng, J.; Kang, Z. An ensemble local means decomposition method and its application to local rub-impact fault diagnosis of the rotor systems. Measurement 2012, 45, 561–570. [Google Scholar]
- Campeau, W.; Simons, A.M.; Stevens, B. The evolutionary maintenance of Lévy flight foraging: A numerical simulation. PLOS Comput. Biol. 2021, 18, e1009490. [Google Scholar]
- Gao, S.; Wang, Q.; Zhang, Y. Rolling Bearing Fault Diagnosis Based on CEEMDAN and Refined Composite Multi-Scale Fuzzy Entropy. IEEE Trans. Instrum. Meas. 2021, 23, 259. [Google Scholar]
- Dragomiretskiy, K.; Zosso, D. Variational Mode Decomposition. IEEE Trans. Signal Process. 2014, 62, 531–544. [Google Scholar] [CrossRef]
- He, C.; Wu, T.; Gu, R.; Jin, Z.; Ma, R.; Qu, H. Rolling bearing fault diagnosis based on composite multiscale permutation entropy and reverse cognitive fruit fly optimization algorithm—Extreme learning machine. Measurement 2021, 173, 108636. [Google Scholar] [CrossRef]
- Hou, J.; Wu, Y.; Gong, H.; Ahmad, A.S.; Liu, L. A Novel Intelligent Method for Bearing Fault Diagnosis Based on EEMD Permutation Entropy and GG Clustering. Appl. Sci. 2020, 10, 386. [Google Scholar] [CrossRef] [Green Version]
- Shengqiang, W.U.; Jiang, W.; Zhao, L. Research on KPCA Fault Diagnosis Method Based on Sound Signal. Mach. Tool Hydraul. 2016. [Google Scholar]
- Dai, C.; Liu, Z.; Hu, K.; Huang, K. Fault diagnosis approach of traction transformers in high-speed railway combining kernel principal component analysis with random forest. IET Electr. Syst. Trans. 2016, 6, 202–206. [Google Scholar] [CrossRef]
- Ziwen, G.U.; Peng, L.I.; Xun, L.; Yixuan, Y.U.; Xin, S.; Min, C.A.O. A Multi-Granularity Density Peak Clustering Algorithm Based on Variational Mode Decomposition. Chin. J. Electron. 2021, 30, 658–668. [Google Scholar] [CrossRef]
- Zhang, W.; Zhou, W.; Luo, J. Mining And Application of User Behavior Pattern Based on Operation And Maintenance Data. In Proceedings of the 2019 IFIP/IEEE Symposium on Integrated Network and Service Management (IM), Washington, DC, USA, 8–12 April 2019. [Google Scholar]


| Signal Type | Motor Load (HP) | Motor Speed (rpm) |
|---|---|---|
| NOR | 0 | 1500 |
| IF | ||
| OF | ||
| RF |
| Normal | Inner race | Outer Race | Rolling Element | |
|---|---|---|---|---|
| K | 11 | 11 | 11 | 11 |
| α | 2761 | 2822 | 3995 | 2257 |
| dc | 0.05 | 0.06 | 0.07 | 0.08 | 0.09 |
| DBI | 0.2196 | 0.2176 | 0.2174 | 0.2189 | 0.2237 |
| Cluster Center 1 | Cluster Center 2 | Cluster Center 3 | Cluster Center 4 | |
|---|---|---|---|---|
| PC1 | 0.5435 | 0.6889 | 0.5510 | 0.8732 |
| PC2 | 0.5842 | 0.5713 | 0.7911 | 0.8609 |
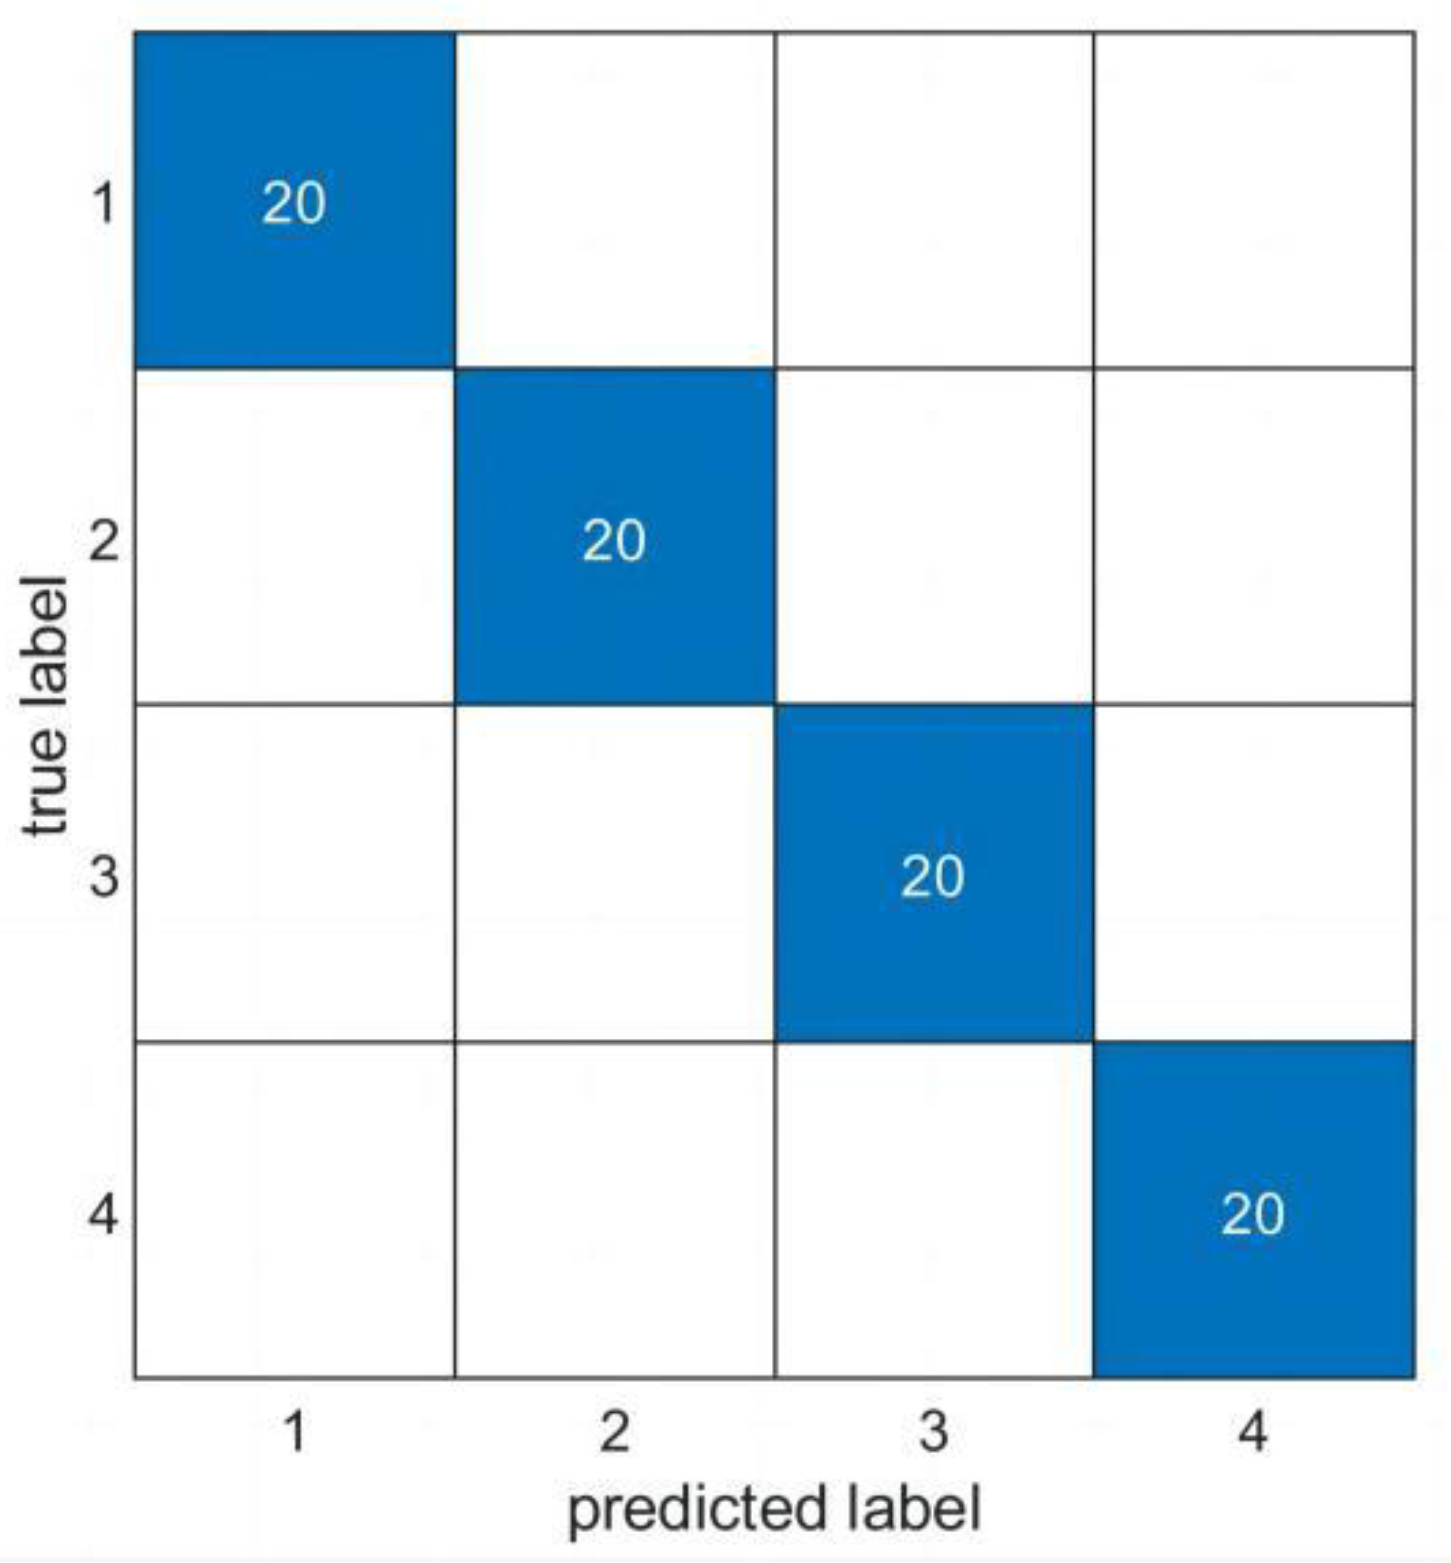
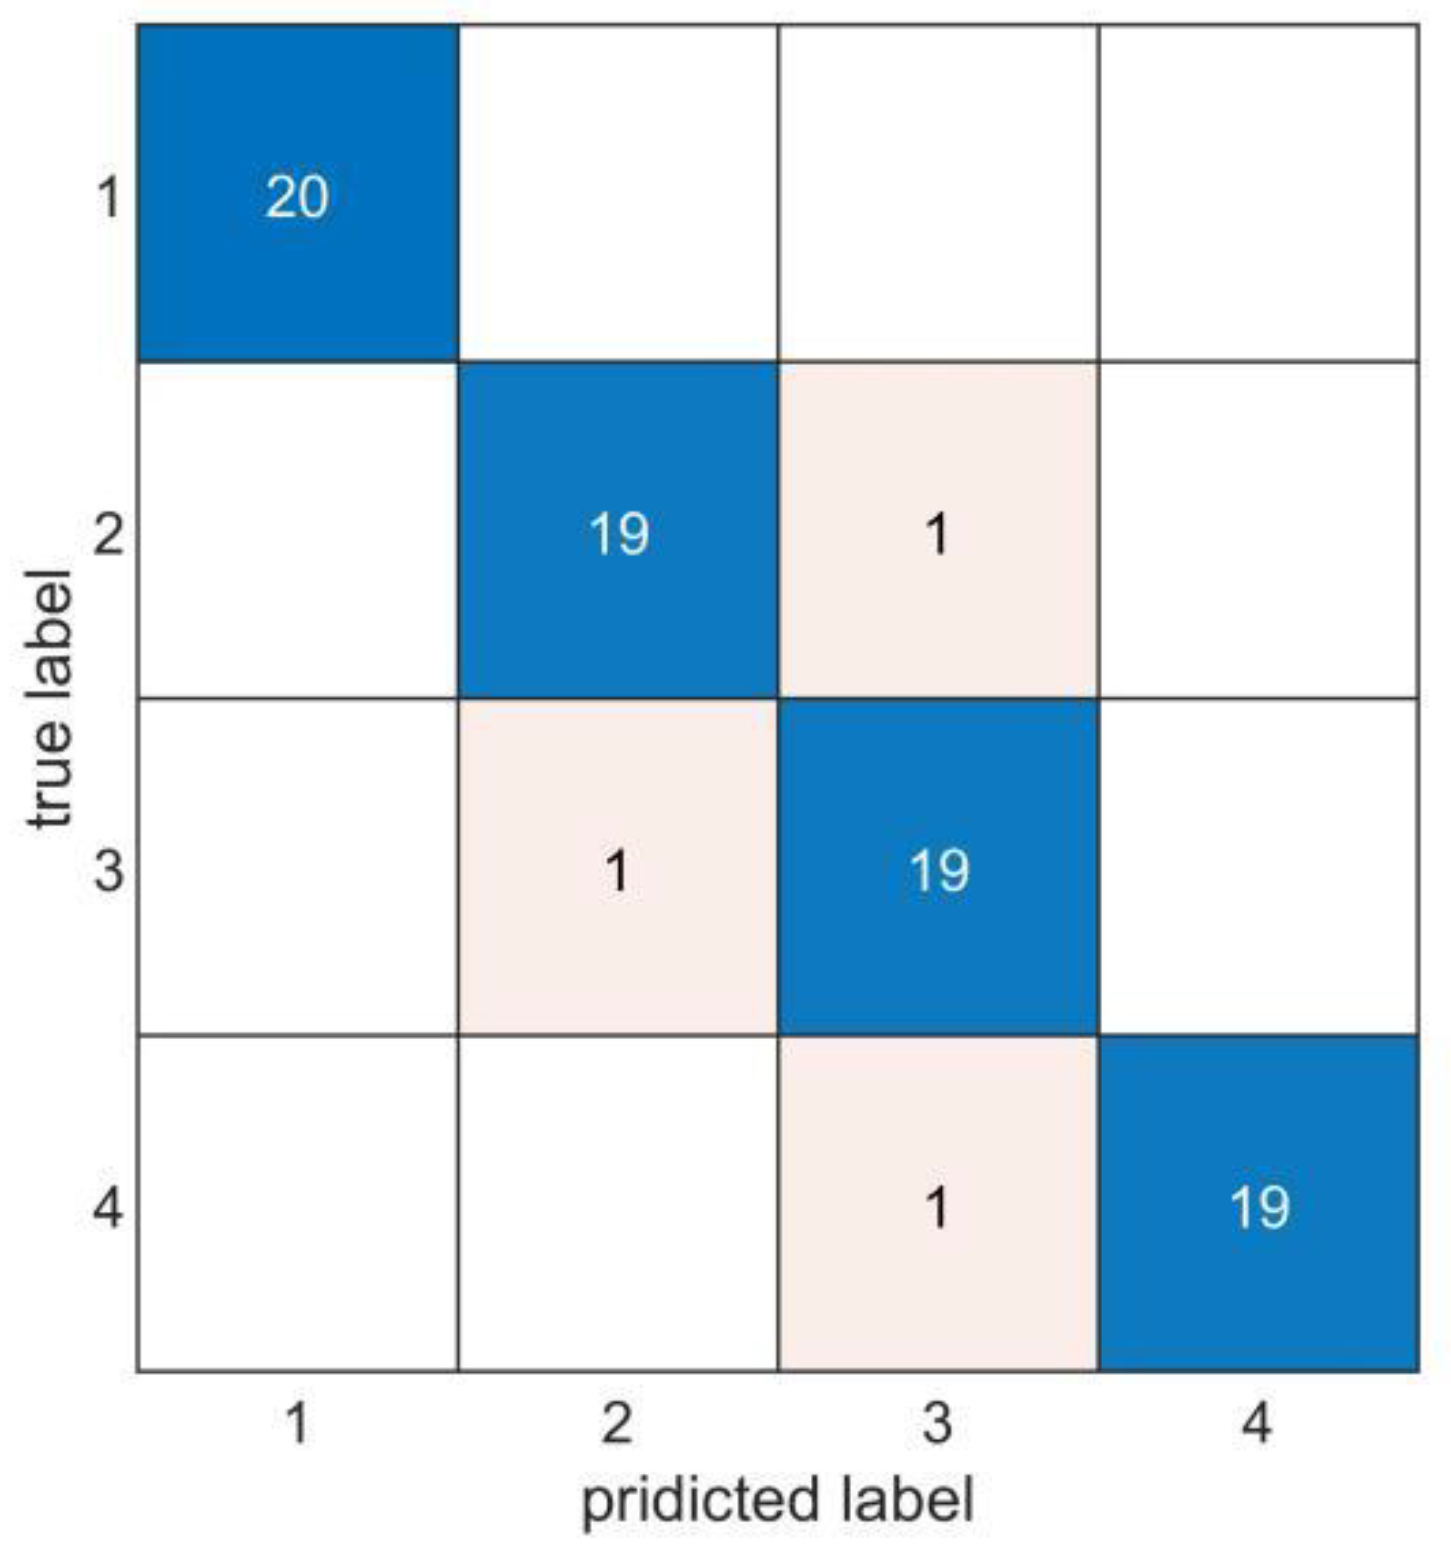
| Classifier | DPC | SVM | ELM | KNN |
|---|---|---|---|---|
| Average accuracy | 99.25% | 97.75% | 96.25% | 97.37% |
Disclaimer/Publisher’s Note: The statements, opinions and data contained in all publications are solely those of the individual author(s) and contributor(s) and not of MDPI and/or the editor(s). MDPI and/or the editor(s) disclaim responsibility for any injury to people or property resulting from any ideas, methods, instructions or products referred to in the content. |
© 2022 by the authors. Licensee MDPI, Basel, Switzerland. This article is an open access article distributed under the terms and conditions of the Creative Commons Attribution (CC BY) license (https://creativecommons.org/licenses/by/4.0/).
Share and Cite
Zhang, X.; Wang, H.; Li, X.; Gao, S.; Guo, K.; Wei, Y. Fault Diagnosis of Mine Ventilator Bearing Based on Improved Variational Mode Decomposition and Density Peak Clustering. Machines 2023, 11, 27. https://doi.org/10.3390/machines11010027
Zhang X, Wang H, Li X, Gao S, Guo K, Wei Y. Fault Diagnosis of Mine Ventilator Bearing Based on Improved Variational Mode Decomposition and Density Peak Clustering. Machines. 2023; 11(1):27. https://doi.org/10.3390/machines11010027
Chicago/Turabian StyleZhang, Xi, Hongju Wang, Xuehui Li, Shoujun Gao, Kui Guo, and Yingle Wei. 2023. "Fault Diagnosis of Mine Ventilator Bearing Based on Improved Variational Mode Decomposition and Density Peak Clustering" Machines 11, no. 1: 27. https://doi.org/10.3390/machines11010027