
Carré Phase Shifting Algorithm for Wavelength Scanning Interferometry


Abstract
:1. Introduction
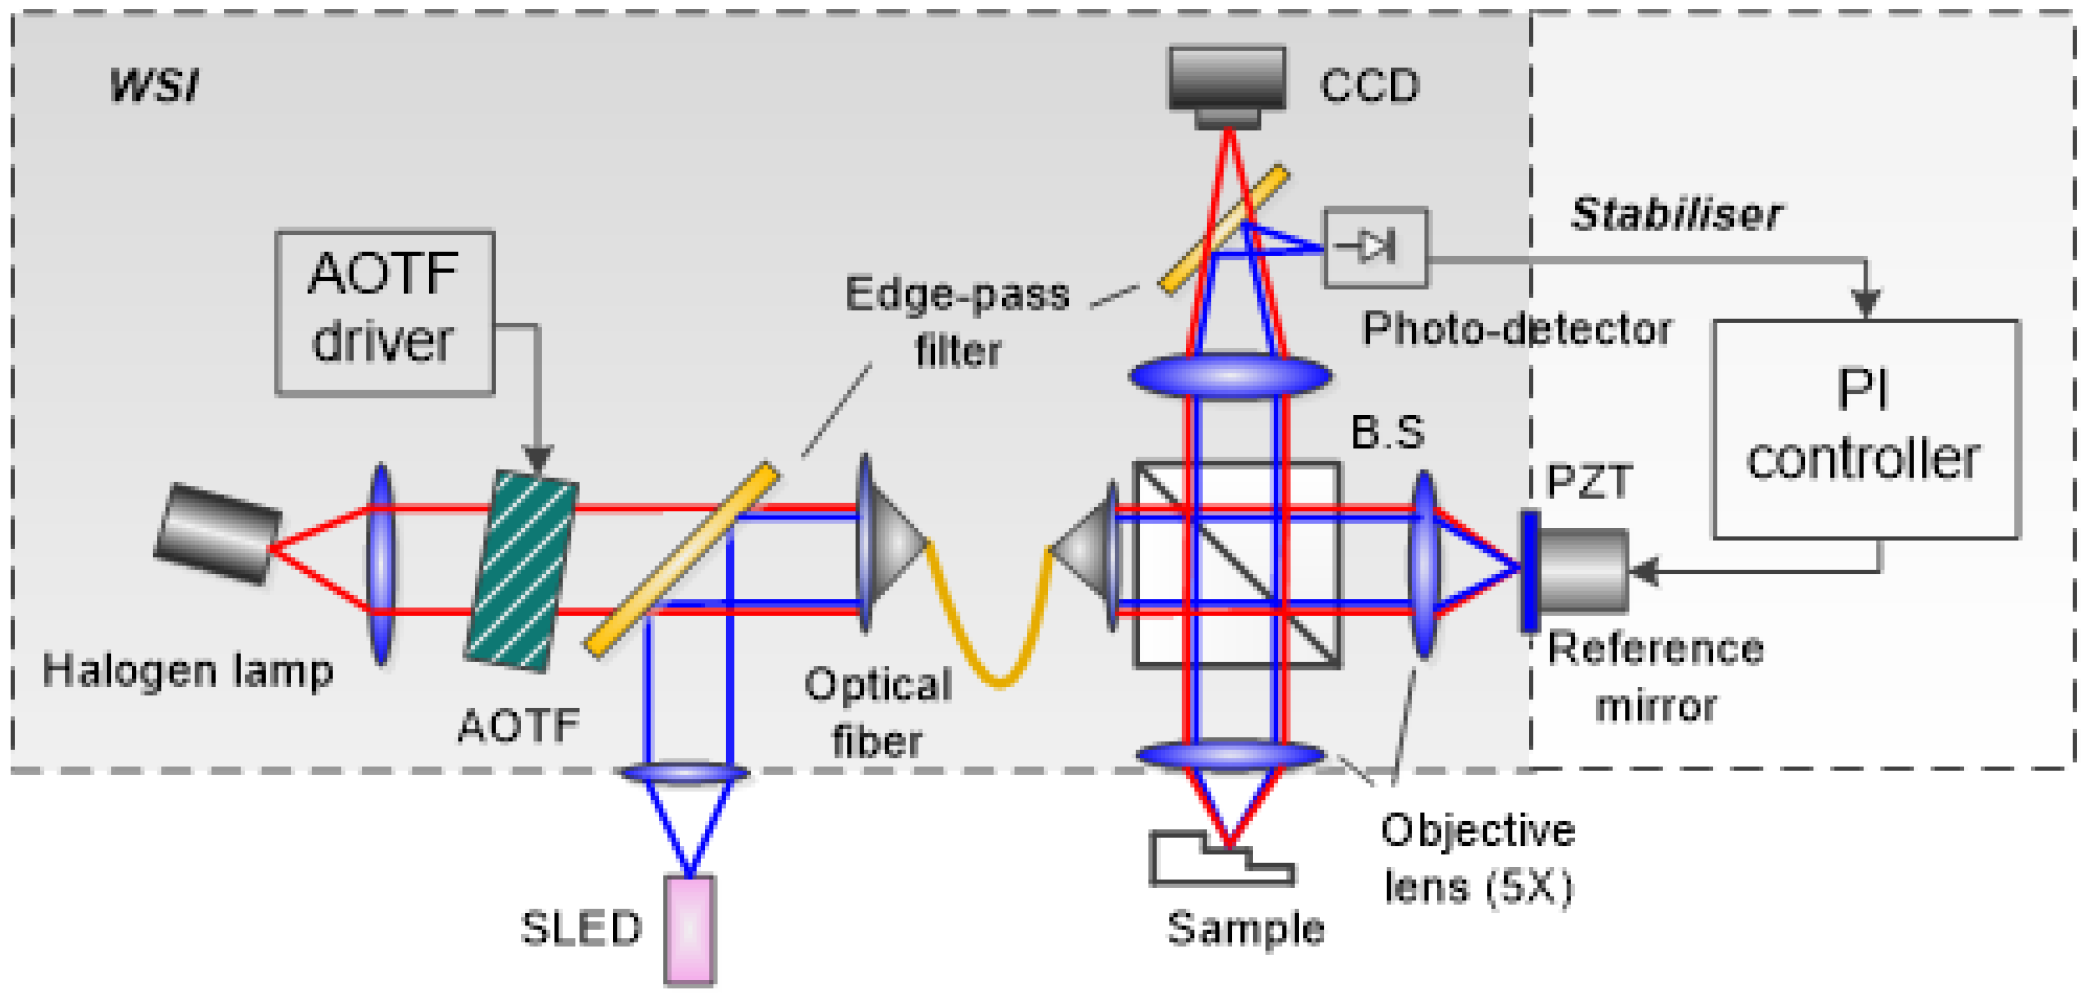
2. WSI Overview
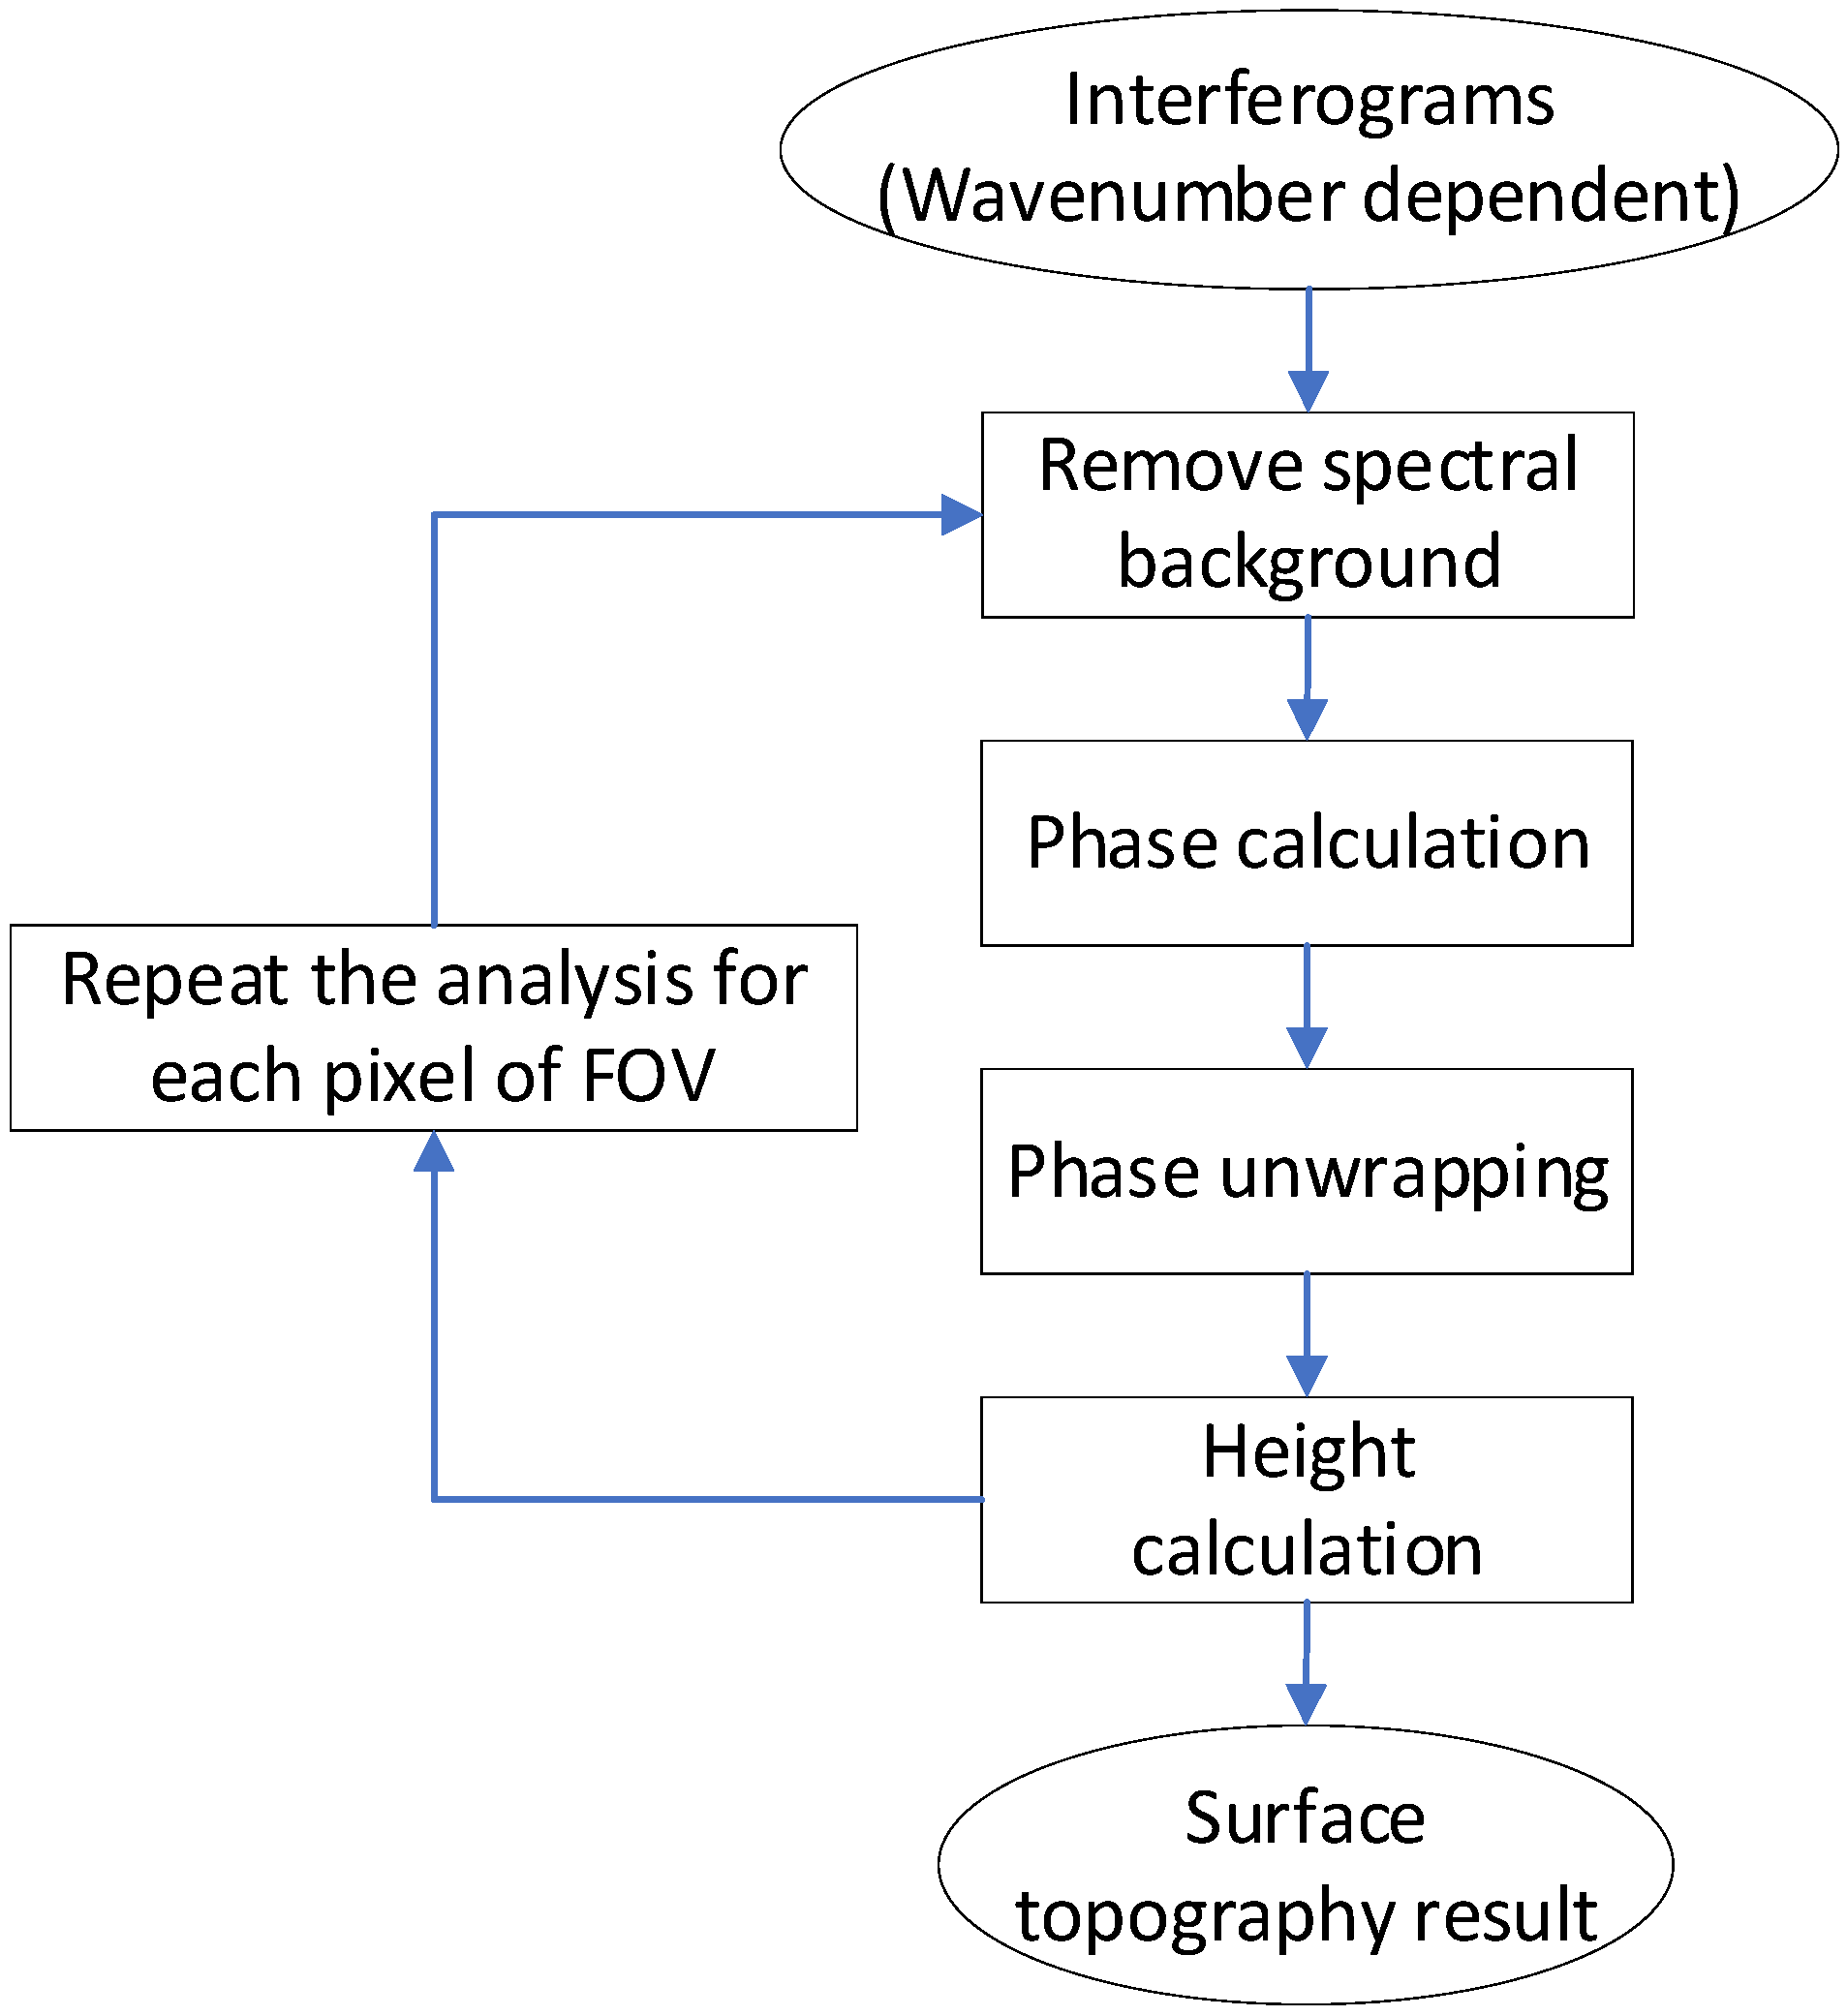
3. CLS Algorithm
4. Numerical Simulation and Measurement Results
5. Conclusions
Author Contributions
Funding
Institutional Review Board Statement
Informed Consent Statement
Data Availability Statement
Conflicts of Interest
References
- Jiang, X.; Scott, P.J.; Whitehouse, D.J.; Blunt, L. Paradigm shifts in surface metrology. Part II. The current shift. Proc. Math. Phys. Eng. 2007, 463, 2071–2099. [Google Scholar] [CrossRef] [Green Version]
- Søndergaard, R.R.; Hösel, M.; Krebs, F.C. Roll-to-Roll fabrication of large area functional organic materials. J. Polym. Sci. B Polym. Phys. 2013, 51, 16–34. [Google Scholar] [CrossRef]
- Deck, L. Vibration-resistant phase-shifting interferometry. Appl. Opt. 1996, 35, 6655–6662. [Google Scholar] [CrossRef] [PubMed]
- Deck, L.; De Groot, P. High-speed noncontact profiler based on scanning white-light interferometry. Appl. Opt. 1994, 33, 7334–7338. [Google Scholar] [CrossRef] [PubMed]
- Gao, F.; Muhamedsalih, H.; Jiang, X. Surface and thickness measurement of a transparent film using wavelength scanning interferometry. Opt. Express 2012, 20, 21450–21456. [Google Scholar] [CrossRef] [Green Version]
- Yamamoto, A.; Kuo, C.C.; Sunouchi, K.; Wada, S.; Yamaguchi, I.; Tashiro, H. Surface shape measurement by wavelength scanning interferometry using an electronically tuned Ti: Sapphire laser. Opt. Rev. 2001, 8, 59–63. [Google Scholar] [CrossRef]
- Takeda, M. Fourier fringe analysis and its application to metrology of extreme physical phenomena: A review. Appl. Opt. 2013, 52, 20–29. [Google Scholar] [CrossRef]
- Kemao, Q. Windowed Fourier transform for fringe pattern analysis. Appl. Opt. 2004, 43, 2695–2702. [Google Scholar] [CrossRef]
- Schwider, J.; Zhou, L. Dispersive interferometric profilometer. Opt. Lett. 1994, 19, 995–997. [Google Scholar] [CrossRef]
- Debnath, S.K.; Kothiyal, M.P.; Kim, S.W. Evaluation of spectral phase in spectrally resolved white-light interferometry: Comparative study of single-frame techniques. Opt. Lasers Eng. 2009, 47, 1125–1130. [Google Scholar] [CrossRef]
- Takeda, M.; Ina, H.; Kobayashi, S. Fourier-transform method of fringe-pattern analysis for computer-based topography and interferometry. JosA 1982, 72, 156–160. [Google Scholar] [CrossRef]
- Wu, D.; Liang, F.; Kang, C.; Fang, F. Performance Analysis of Surface Reconstruction Algorithms in Vertical Scanning Interferometry Based on Coherence Envelope Detection. Micromachines 2021, 12, 164. [Google Scholar] [CrossRef] [PubMed]
- Kim, Y.; Hibino, K.; Sugita, N.; Mitsuishi, M. Surface profile measurement of a highly reflective silicon wafer by phase-shifting interferometry. Appl. Opt. 2015, 54, 4207–4213. [Google Scholar] [CrossRef]
- Creath, K. V phase-measurement interferometry techniques. Prog. Opt. 1988, 26, 349–393. [Google Scholar]
- Miao, F.; Ahn, S.; Moon, Y.H.; Kim, Y. Surface profilometry of silicon wafers using wavelength-tuned phase-shifting interferometry. J. Mech. Sci. Technol. 2019, 33, 5327–5335. [Google Scholar] [CrossRef]
- Kim, S.; Kim, Y.; Hibino, K.; Sugita, N.; Mitsuishi, M. Wavelength-tuning interferometry with suppression of dispersive error. Optik 2021, 247, 167993. [Google Scholar] [CrossRef]
- Su, S.; Zhong, P.; Tang, X.; Li, Z.; Zhai, T.; Li, N.; Zheng, W. A high-precision automatic phase shifting algorithm with wavelength tuning. In Proceedings of the 24th National Laser Conference & Fifteenth National Conference on Laser Technology and Optoelectronics, Shanghai, China, 17–20 October 2020. [Google Scholar]
- Harris, F.J. On the use of windows for harmonic analysis with the discrete Fourier transform. Proc. IEEE 1978, 66, 51–83. [Google Scholar] [CrossRef]
- Berryman, F.; Pynsent, P.; Cubillo, J. The effect of windowing in Fourier transforms profilometry applied to noisy images. Opt. Lasers Eng. 2004, 41, 815–825. [Google Scholar] [CrossRef]
- Wang, M.; Du, G.; Zhou, C.; Si, S.; Lei, Z.; Li, X.; Li, Y. Precise and fast phase wraps reduction in fringe projection profilometry. J. Modern Opt. 2017, 64, 1862–1869. [Google Scholar] [CrossRef] [Green Version]
- Zhang, T.; Gao, F.; Muhamedsalih, H.; Lou, S.; Martin, H.; Jiang, X. Improvement of the fringe analysis algorithm for wavelength scanning interferometry based on filter parameter optimization. Appl. Opt. 2018, 57, 2227–2234. [Google Scholar] [CrossRef]
- Jiang, X.; Wang, K.; Gao, F.; Muhamedsalih, H. Fast surface measurement using wavelength scanning interferometry with compensation of environmental noise. Appl. Opt. 2010, 49, 2903–2909. [Google Scholar] [CrossRef] [Green Version]
- Tian, X.; Tu, X.; Zhang, J.; Spires, O.; Brock, N.; Pau, S.; Liang, R. Snapshot multi-wavelength interference microscope. Opt. Express 2018, 26, 18279–18291. [Google Scholar] [CrossRef] [PubMed] [Green Version]
- Mehta, D.S.; Saito, S.; Hinosugi, H.; Takeda, M.; Kurokawa, T. Spectral interference Mirau microscope with an acousto-optic tunable filter for three-dimensional surface profilometry. Appl. Opt. 2003, 42, 1296–1305. [Google Scholar] [CrossRef] [PubMed]
- Muhamedsalih, H.; Gao, F.; Jiang, X. Comparison study of algorithms and accuracy in the wavelength scanning interferometry. Appl. Opt. 2012, 51, 8854–8862. [Google Scholar] [CrossRef] [Green Version]
- Kafri, O. Fundamental limit on accuracy in interferometry. Opt. Lett. 1989, 14, 657–658. [Google Scholar] [CrossRef] [PubMed]
- Larkin, K.G. Efficient nonlinear algorithm for envelope detection in white light interferometry. JOSA A 1996, 13, 832–843. [Google Scholar] [CrossRef] [Green Version]
- Roy, M.; Schmit, J.; Hariharan, P. White-light interference microscopy: Minimization of spurious diffraction effects by geometric phase-shifting. Opt. Express 2009, 17, 4495–4499. [Google Scholar] [CrossRef]
- Harasaki, A.; Schmit, J.; Wyant, J.C. Improved vertical-scanning interferometry. Appl. Opt. 2000, 39, 2107–2115. [Google Scholar] [CrossRef] [Green Version]
- De Groot, P.; de Lega, X.C.; Kramer, J.; Turzhitsky, M. Determination of fringe order in white-light interference microscopy. Appl. Opt. 2002, 41, 4571–4578. [Google Scholar] [CrossRef]
- Sandoz, P.; Tribillon, G.; Perrin, H. High-resolution profilometry by using phase calculation algorithms for spectroscopic analysis of white-light interferograms. J. Mod. Opt. 1996, 43, 701–708. [Google Scholar] [CrossRef]
- Muhamedsalih, H. Investigation of Wavelength Scanning Interferometry for Embedded Metrology. Ph.D. Thesis, University of Huddersfield, Huddersfield, UK, May 2013; p. 64. [Google Scholar]
- Carré, P. Installation et utilisation du comparateur photoélectrique et interférentiel du Bureau International des Poids et Mesures. Metrologia 1966, 2, 13. [Google Scholar] [CrossRef]
- Elrawemi, M.; Blunt, L.; Fleming, L.; Bird, D.; Robbins, D.; Sweeney, F. Modelling water vapour permeability through atomic layer deposition coated photovoltaic barrier defects. Thin Solid Films 2014, 570, 101–106. [Google Scholar] [CrossRef] [Green Version]
- Lehmann, P.; Tereschenko, S.; Xie, W. Fundamental aspects of resolution and precision in vertical scanning white-light interferometry. Surf. Topogr. Metrol. Prop. 2016, 4, 24004. [Google Scholar] [CrossRef] [Green Version]


Publisher’s Note: MDPI stays neutral with regard to jurisdictional claims in published maps and institutional affiliations. |
© 2022 by the authors. Licensee MDPI, Basel, Switzerland. This article is an open access article distributed under the terms and conditions of the Creative Commons Attribution (CC BY) license (https://creativecommons.org/licenses/by/4.0/).
Share and Cite
Muhamedsalih, H.; Tang, D.; Kumar, P.; Jiang, X. Carré Phase Shifting Algorithm for Wavelength Scanning Interferometry. Machines 2022, 10, 116. https://doi.org/10.3390/machines10020116
Muhamedsalih H, Tang D, Kumar P, Jiang X. Carré Phase Shifting Algorithm for Wavelength Scanning Interferometry. Machines. 2022; 10(2):116. https://doi.org/10.3390/machines10020116
Chicago/Turabian StyleMuhamedsalih, Hussam, Dawei Tang, Prashant Kumar, and Xiangqian Jiang. 2022. "Carré Phase Shifting Algorithm for Wavelength Scanning Interferometry" Machines 10, no. 2: 116. https://doi.org/10.3390/machines10020116