Article

Numerical Simulation of the Lightning Leader Development and Upward Leader Initiation for Rotating Wind Turbine

1
State Key Laboratory of Alternate Electrical Power System with Renewable Energy Sources, North China Electric Power University, Beijing 102206, China
2
Department of Electronic & Electrical Engineering, The University of Strathclyde, Glasgow G1 1XQ, UK
*
Author to whom correspondence should be addressed.
Machines 2022, 10(2), 115; https://doi.org/10.3390/machines10020115
Submission received: 7 January 2022 / Revised: 30 January 2022 / Accepted: 31 January 2022 / Published: 4 February 2022
(This article belongs to the Special Issue Advances in Wind and Solar Energy Generation)

Abstract

:
Lightning accidents seriously threaten safe operation of wind turbines because the influence mechanisms of wind turbine rotation on corona and upward leader initiation are, so far, not clear. A three-dimensional stochastic evolution model of the lightning downward leader was established by combining the dielectric breakdown model and the lightning current shunt method, according to which the charge density distribution of leader branches was determined. The corona and leader initiation mechanisms of rotating wind turbine were studied based on the 3D drift and diffusion model of ion flow in the neighboring space of a rotating wind turbine. The results show that due to blade rotation, the charged particles are unevenly distributed near the blade tip and the contours are in a strip-like shape. As the rotating speed increases, the blade tip is more susceptible to initiating corona discharge. Combining the three-dimensional stochastic development model of the lightning downward leader and ion distribution model near a rotating wind turbine, the initiation direction of the upward leader was analyzed, and in 66% of cases, the initiation direction of the upward leader on the blade tip was on the back side of the blade rotation.

1. Introduction

The development of large wind farms is the strategic direction of the power system to support the realization of “peak CO2 emission and carbon neutrality”. In recent years, the installed capacity of wind power has increased rapidly. Wind farms are usually located in prominent positions, and wind turbines are prone to be threatened by lightning strikes with their tall structures. With the increasing proportion of wind power generation, the reliability of wind turbine (WT) operation is directly related to the safety and stability of the entire power system.
While in the blade manufacturing process, the blades are installed for a relatively complete lightning attachment system; however, the WT still fails to obtain effective lightning protection. This is because the lightning protection system of the blades is mainly designed based on the lightning attachment mechanism of the static WT, without taking into account the rotation effect of the WT. Observation data from wind farms indicate that the blades are mostly in a rotating state when lightning strikes them [1], and the rotation aggravates the damage from the lightning strikes to the blades. Ishii [2] observed an offshore wind farm with 12 WTs for a period of 5 years and found that rotating WTs are more susceptible to lightning strikes than static WTs when the blade angle exceeds 30 degrees. Montanyà [3] concluded that rotating WTs are more prone to initiate the upward leader based on 3D lightning observation arrays and the wind farm data of lightning strikes.
Scholars have carried out research on the lightning development and attachment mechanism of rotating WT. Gu et al. [4] conducted rod–plane air gap discharge experiments in which the whole process of leader propagation was observed and the streamer area in front of the leader was geometrically defined, which contributed to the study of the stochastic process of downward lightning. Alonso et al. [5] established a three-dimensional model of the WT and calculated the background electric field using 3-layer thundercloud geometric structure model established by Malan and calculated the initiation of the upward leader on the blade tip in the thundercloud environment. It was further discovered that the field strength in the space near the rotating blade is much higher than that at the static stage, and it was concluded that the blade is more vulnerable to lightning strikes under rotation. Montanyà [3] characterized the ion distribution near the blade tip of a rotating WT and claimed that the space charge near the blade tip is pulled into an arc-shaped region due to the rotation of the blade. Wang et al. [6] carried out long gap discharge experiments for scaled rotating WT to simulate the actual lightning process of WT and found that as the WT rotation speed increases, with longer gaps, it is easier for the gap between the blade tip and the high-voltage electrode to break down, whereas when the gap is less than 2 m, the gap is more difficult to break down. In order to further study the actual effect of WT rotation on the discharge process of the blade tip, Qu et al. [7] calculated the charge distribution close to a single blade receptor of a WT under the influence of a thundercloud’s electric field and analyzed the effect of wind speed on the space charge distribution. It was concluded that the wind speed has positive correlation with the corona current on the receptor. However, the actual WT was not modeled, and it did not directly reflect the actual situation of WT rotation. The distribution of space charged ions further influences the corona discharge near the blade tip. However, this is not sufficient for the analysis of the space charge distribution near the blade tip of the rotating WT at present, and it is still necessary to further conduct the calculation of the spatial–temporal distribution of the space charge near the rotating WT and to further analyze the rotation effect on the blade tip discharge.
Under the effects of a thundercloud induced electric field and the lightning downward leader (DL), the corona discharge initiated on the blade tip will further develop into the upward leader. Xiao et al. [8,9] established a 3D ion flow calculation model of transmission lines which provides a reference for the study on the ion flow distribution near rotating WT. Berendt et al. [10] studied the influence of airflow on the discharge characteristics of DC negative corona in needle-plate gaps and concluded that either transverse or longitudinal airflow has influence on corona discharge characteristics. However, the rotation effect of WTon corona initiation remains to be studied. Li et al. [11] conducted a DC corona discharge experiment for scaled WT and concluded that the rotation effect of WT on corona discharge is focused on the variation of the ion distribution. However, quantitative calculation of ion flow in the neighboring space of rotating WT remains to be further conducted. For the study related to the upward leader propagation of WT, researchers have also carried out related explorations. Warner [12] performed optical observations of the upward leader onset process of ground buildings using high-speed cameras and obtained the development characteristics and evolution speed of the two-dimensional upward leader, but his observations are for stationary buildings and cannot reflect the initiation process of the upward leader from actual WT. Ma et al. [13] modeled and analyzed the onset process of the upward leader for stationary turbines and generalized the upward leader onset criterion for stationary turbines for engineering applications; however, the criterion did not consider the effect of WT rotation and it was assumed that the onset and development process of the upward leader were constantly upward toward the thundercloud, which could not reflect the effect of rotation on the upward leader. Jiang et al. [14] analyzed the optical characteristics of natural lightning and established a two-dimensional lightning development and attachment model for ground buildings. Typical leader development and connection patterns of ground buildings were simulated, and the influence of the lateral distance of a downward lighting leader on the attachment process of leaders was analyzed. However, due to the special structure of WT, the study could not be directly applied on the analysis of WT, either.
In this paper, a three-dimensional numerical model of the spatial–temporal distribution of charged particles close to rotating turbine blades was established. By coupling the rotating effects of WT, the space charge distribution near WT was numerically analyzed and the corona onset influenced by WT was further studied. Combining the 3D stochastic development model of the lightning downward leader and ion distribution model near rotating WT, the initiation process of the upward leader from the blade tip was analyzed. The research will provide a theoretical basis for protecting rotating WT from lightning.

2. Numerical Model of Corona Initiation on Rotating Wind Turbine under Thunderclouds

2.1. Drift and Diffusion Model of Space Charged Particles near Rotating Wind Turbine

The blade tip of a WT is usually made of metal and grounded by a metal wire called a down-conductor. Therefore, under the effect of a thundercloud-induced E-field, the gas molecules’ ionization will occur near the metallic blade tip and then generate corona discharge. With the development of wind generation, the longest blade length can exceed 100 m. The fastest linear velocity of the blade tip can exceed 120 m/s, which is close to the mobility speed of charged particles in the air near the blade tip under the effect of the thundercloud-induced E-field. Thus, blade rotation will have an effect on the distribution of charged particles near the blade tip, which, in turn, will have an effect on the corona initiation.
The gas molecules in the air will ionize near the blade tip and form charged particles under thunderclouds, and these charged particles may combine with the air aerosol particles and become positive-polarity aerosol particles or negative-polarity aerosol particles.
As 90% of the natural cloud-to-ground (CG) lightning is negative and under the negative thundercloud, negatively charged particles can be neglected in the discharge process. Therefore, the particles near the WT blades are simplified into three types, namely, positive n+, positive aerosol particles N+ and air aerosol particles N0. The discharge process is simplified to the interaction of n+, N+ and N0, which is described by the set of drift and diffusion equations shown below [15]:
n + t = D 2 n + ( n + μ n + E ) k n + N 0 n + N 0 N + t = D 2 N + ( N + μ N + E ) + k n + N 0 n + N 0 N 0 t = D 2 N 0 k n + N 0 n + N 0
where the value of diffusion coefficient D is 1 m2/s, n+ is small positive ions, N0 represents neutral aerosol particles in the atmosphere and N+ is positive aerosol particles; μn+ represents the mobility of n+, taken as 1.5 × 10⁻⁴ m2·s−1·V−1, while μN+ represents the mobility of N+ as 1.5 × 10⁻⁶ m2·s−1·V−1. K n + N 0 is the attachment coefficient of n+ to N0, taken as 2.9 × 10⁻¹² m3·s−1. The parameters described above were referenced from the atmospheric electricity research [16]. E represents the electric field of the calculation model which is calculated by the Poisson equation:
E = 2 Φ = e ( n + + N + ) ε 0
where Φ represents the potential, ε0 is the vacuum dielectric constant and e is elementary charge.
A 3D rotating WT model was established using the finite element software COMSOL Multiphysics, and the geometric model is shown in Figure 1. Since 90% of CG lightning in nature has negative polarity, E-field strength of the thundercloud was set to −40 kV/m for this paper. The WT model was established according to the actual operating WT’s geometry, and since the blade tip is a metal structure, the rotating impeller has a lightning shielding effect on the WT tower under the thundercloud. Therefore, the role of the tower was ignored during modeling, and only the impeller structure of the WT was established. According to the geometric parameters of a 2.5 MW WT, a 3D model of a WT was established in the coordinate origin. The hub height of the WT was set to 80 m from the ground, while the blade length was 50 m. Moreover, the blade tip was set as aluminum, and its radius of curvature was 10 cm. The computational solution boundary should be much larger than the WT model size so as to avoid the influence of scale effect. At the same time, the computational overhead caused by a large computational domain should be considered, so the computational solution area was set to 500 m in diameter and the height of the thundercloud was set to 1000 m.
It is assumed that no ionization or other ion activities have occurred at the initial stage of calculation, so the air is considered electrically neutral. Therefore, the initial values of n+ and N+ were set to 0. The initial value of N0 set to 10 11 / m 3 refers to the data in clear weather [17].
The area of the WT impeller was set as the rotating computational domain, while the area outside the impeller was the stationary computational domain. The two areas were divided into separate meshes, and a continuity boundary condition was set at their junction to make a continuous transition between numerical computation and mesh dissection. In the model, the center of the rotation domain coincides with the center of the impeller. The wind turbine rotation speed nR was set in the same range of 6~20 rpm as in normal operation. Because the solution process includes the rotation behavior of the meshes’ domain, the rotation speed of the blade is implicit in the rotating calculation process. In order to reduce the computational overhead and, at the same time, ensure the accuracy of the calculation, the whole calculation area was divided into sub-regional meshes. An extremely fine mesh size (from min. 0.01 m to max. 0.05 m) was set on the surface on the blade tips, while a fine mesh size (from min. 0.05 m to max. 0.5 m) was set on the remaining surface of the wind turbine. Mesh sizes from min. 0.5 m to max. 10 m in the space of the rotating domain were adopted, while larger mesh sizes (from min. 5 m to max. 50 m) were set in the stationary domain outside the rotating domain of the impeller. In addition, to avoid numerical discontinuities at the rotating boundary, similarly sized mesh structures were set at the boundary of the rotating and stationary domains.

2.2. Validation of the Simulation Model

To verify the validity of the ion flow calculation of the rotating wind turbine, a long gap corona discharge experiment platform of a scaled rotating WT was designed, as shown in Figure 2. A plate electrode with size of 3 m × 2 m was designed to simulate the thundercloud-induced E-field. The tower of the WT had a height of 1.8 m, while the blades were 1.05 m. The blade tips were made of aluminum and grounded through the down-conductor. By hanging the plate electrode with high DC voltage at a height of 2.5 m from the nacelle and by measuring the corona current flowing through the grounding line, the quantity of space charge near the blade tip was obtained. The current coil had a frequency range from 10 kHz to 30 Mhz, which satisfied the requirement of corona current measurement. To prevent the plate electrode from generating corona discharge that interfered with the measurement results, the edges of electrode were rounded. Moreover, to eliminate the high frequency interferences generated by the switch devices in the speed controller, input and output filters were employed.
A DC voltage of −50 kV was applied to the plate electrode. A continuous and repetitive pulse discharge pattern of corona was generated when the blade remained static under the HV electrode, as shown in Figure 3.
However, every time when the blade tip rotated to the area below the HV electrode, the corona pulse discharge formed as the E-field on blade tip got stronger than the corona initiation field, thus forming a periodic discharge pattern. Moreover, the periodic sound of corona discharge was audible as the WT rotated. The measured periodic corona discharge signals from the rotating blades were obtained when the linear velocity of the blade tip was controlled at 3 m/s, as shown in Figure 4. As indicated in Figure 4, the corona discharge at the blade tip during the rotation of the WT was characterized by periodic clusters of discharge pulses. Every 3 pulse clusters represented one turn of rotation of the impeller, and the total corona discharge Qr for one rotation of the WT can be characterized by integrating 3 consecutive pulse clusters. Considering the symmetry of the three blades, the corona charge at the blade tip during the rotation of a single blade from a 0-degree to a 60-degree angle, with respect to the axis of the tower, was Qr/6.
The corona current at the blade tip of the WT during rotation was measured when the linear speed of the tip was 3 m/s, 5 m/s, 8 m/s and 10 m/s. The measurement was repeated five times for each linear speed condition. The scale of the simulation was reduced to the size of the experimental platform with the same geometry parameters. Moreover, the evolution of space charge near the blade tip during the rotation of the blade from the vertical direction to a 60-degree angle at different linear velocities was simulated. The total corona charge during the process was obtained, and the comparison with the experimental results is shown in Figure 5.
As can be seen from Figure 5, the simulation results were in agreement with the measurement results. However, in the case of larger linear velocity of the blade tip, the measured results were slightly lower than the simulated results because the corona space charge is difficult to fully flow into the grounding line while the rotational speed increases.

2.3. Simulation Results

2.3.1. Distortion Effect of Space Charge on Spatial Electric Field

Due to the effect of the negative thundercloud, positively charged particles are generated near the WT tip. The distribution of positively charged particles (the total of n+ and N+) is calculated by taking a 1 m long intercept line vertically upward from the blade tip, as shown in Figure 6a. It can be seen that the positively charged particles accumulate in the close area (0.1 m) above the blade tip, while the density of charged particles decreases rapidly in the area greater than 0.1 m above the blade tip.
Space charge has a distorting effect on the E-field near the WT tip, and the results of calculating the space electric field near the blade tip with and without the influence of space charge are shown in Figure 6b, which shows that the accumulation of space charge significantly weakens the electric field strength near the blade tip, which weakens the ionization near the blade tip and makes it more difficult to form corona discharge compared to the case without the influence of space charge. Moreover, because the density of positive particles farther away from the blade tip decreases rapidly, the distortion effect on the electric field is weakened, so there is no significant distortion of the space electric field.

2.3.2. The Distribution of Ion Flow in the Neighboring Domain of Rotating Wind Turbine

Without the influence of space charge, the E-field strength of the blade tip shows a periodic variation of rotation angle [18], as shown in Figure 7. The solid line in the figure shows the actual E-field of the blade tip after considering the shielding effect between the blades.
Due to the periodicity and symmetry of the E-field variation with the rotational angle on the blade tip and considering the computational cost of the ion flow model, the calculation was carried out for the case when Blade No. 1 is at a rotation angle of 0° to 60° with respect to the z-axis.
Under the combined influence of the thundercloud electric field and the blade rotation effect, the charged particles drift under the effect of the thundercloud-induced E-field on the one hand and form an asymmetric distribution under the influence of the blade rotation effect on the other hand. In the y-z direction (the direction perpendicular to the impeller), the spatial distribution of charged particles is symmetrical. Therefore, considering only the impeller rotation effect on the distribution of charged particles, the x-z cross section through the tip of the blade is intercepted and the spatial and temporal variation of charged particles on this cross section is analyzed, as shown in Figure 8.
In the process of blade rotation from 0 degrees, the contour shape of a charged particle changes from circle-like to ellipse-like, dragged by the blade tip with the increasing rotation angle, as shown in Figure 9. The charged particle density decreases rapidly along the front side of the blade rotation, while a dense area is shown along the back side of the blade rotation as a stripe-like distribution.
The space potential near the rotating WT is also changed by the influence of the space charge distribution, as shown in Figure 10b by the red arrow. Due to the influence of the thundercloud-induced E-field and the rotation effect, positive particles accumulate at the back side of the blade rotation, which causes a positive space potential region. Moreover, the ionization will be more active in this area, resulting in a high E-field area, as shown in Figure 10c.

2.3.3. The Influence Mechanism of Wind Turbine Rotation on Corona Initiation

Compared with the static case of the blade, the rotation of the blade makes the distribution of the space charge near the tip of the blade more non-uniform. In order to analyze the difference in the effect of space charge on the electric field distortion near the blade in both rotational and static stages, the space charge distributions above the blade tip along the z-axis were calculated at same blade angle in the two cases. The comparison is shown in Figure 11.
According to Figure 11, compared with the static case, the rotating blade decreases the number density of positive ions, which are already 1 order of magnitude lower, at 1.5 m, than the static case. Due to the reduction in charged particle density, the shielding effect of space charge near the rotating blade is weakened and the corona discharge is more easily initiated on the WT blade tip.
As the rotational speed of the WT increases, the dragging effect of the blade tip on the charged particles is more obvious. Charged particles migrate farther away from the rotating blade so that the charge accumulation near the blade tip is reduced, with a weakened shielding effect on the electric field. Therefore, as the rotational speed of the WT increases, the E-field at the blade tip has a tendency to decrease. The variation curves of the E-field at the blade tip with the rotation angle at different rotational speeds are shown in Figure 12.
At the beginning of the rotation, the angle between the blade and z-axis is small, and the space charge migration and its own movement are not yet sufficient, so the space charge gathers near the blade tip. At this time, the E-field strength of the blade surface is mainly affected by the space charge. As the space charge moves farther away from the blade tip, its weakening effect on the E-field near the blade tip gradually decreases, which shows that the E-field strength on the blade surface increases with the increase in the rotation angle. However, when the blade rotates to a larger angle, the drift and diffusion process of charged particles gets more comprehensive so that the space charge does not gather at the blade tip. At this point, the E-field strength of the blade surface is mainly affected by the thundercloud-induced E-field. With the increase in the rotation angle, the E-field strength of the blade tip surface gradually decreases.
In addition, the rotation angle of the E-field maximum at the blade tip (marked by the red arrow in Figure 12) appears varied at different rotational speeds. The rotation angle of the E-field maximum decreases from 35 degrees to 8.6 degrees as the rotational speed increases from 6 rpm to 20 rpm.
Due to the ionization of charged particles occurring near the metal tip, corona discharge initiates near the tip of blade. Under the thundercloud-induced E-field and the shielding effect of space charge, the E-field on the tip surface changes. Moreover, while it grows beyond the field strength of corona initiation, corona discharge is initiated. The E-field for corona initiation is calculated by the Peek formula [19]:
E cor = E 0 δ ( 1 + c 1 r tip )
where rtip is the curvature radius of the blade tip, with the value of 0.1 m in this study, δ represents the relative density of air, with the value of 1, and E0 and c1 are empirical constants with values of 2.7 × 10 6 V / m and 0.054 m0.5, respectively.
When the rotational speed is 6 rpm, the E-field maximum on the blade tip is 2.81 MV/m, which is less than the corona initiation field strength (3.16 MV/m, calculated by Equation (3)) on the blade tip. Therefore, it is difficult to initiate corona discharge. As for the rotating speed exceeding 9 rpm, the E-field maximum will exceed the field strength of corona initiation at a rotation angle of 20 degree. The angle range of corona initiation on the blade tip grows with the increase in rotational speed. When the rotational speed is 12 rpm, within the range from 6.2 degrees to 31.5 degrees of the rotation angle, the E-field on the blade tip is higher than the E-field of corona initiation; thus, corona discharge will be initiated. At 15 rpm, corona discharge can be initiated on the blade tip within a rotation angle from 3.6 degrees to 37.3 degrees. However, when the rotational speed is up to 20 rpm, the surface of the blade tip reaches the E-field of corona initiation within a rotation angle from 2.7 degrees to 60 degrees.

3. Three-Dimensional Stochastic Evolution Model of Lightning Downward Leader

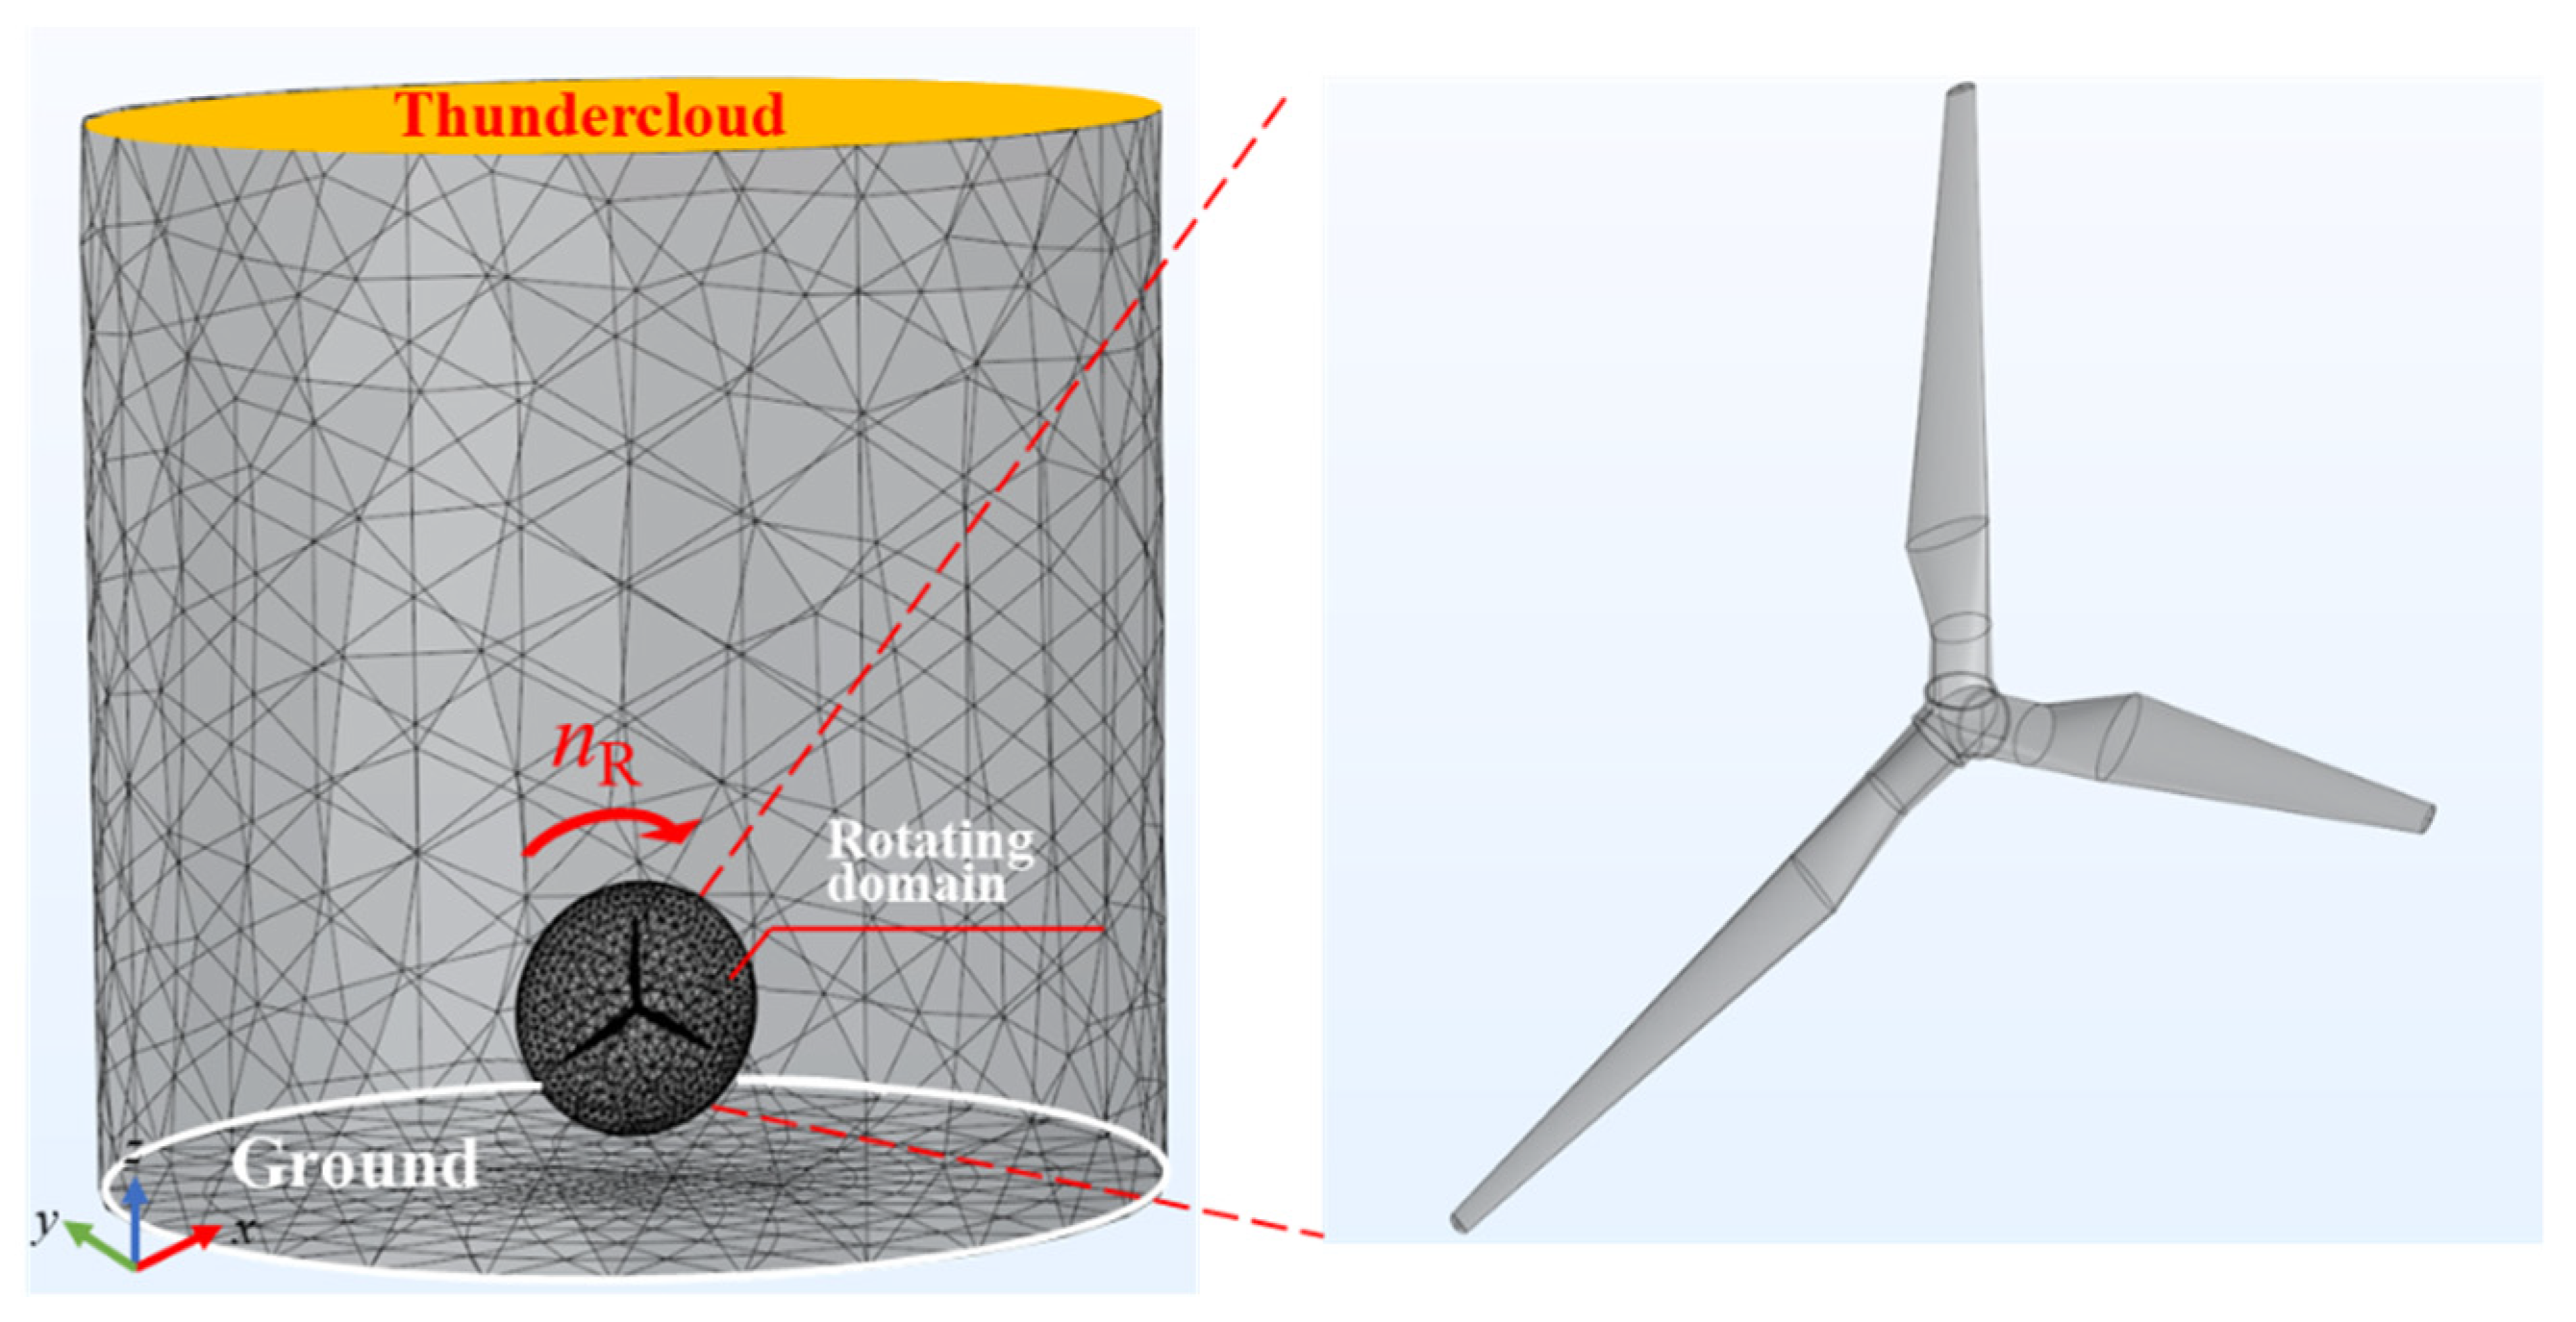
A thundercloud will form a cloud-to-cloud (CC) flash or cloud-to-ground (CG) flash. The characteristics of the lightning downward leader channel have an important influence on the upward leader initiation of the wind turbine. On the one hand, the channel charge in the downward leader affects the distribution of the spatial E-field and further affects the initiation process of the upward leader. On the other hand, the stochastic characteristics of branches of downward leaders affect the interception position of the upward leader to the downward leader. Therefore, it is of great significance to establish a reasonable lightning downward channel model in order to accurately simulate the leader initiation process of the rotating WT.
As 90% of lightning in nature is of negative polarity, a three-dimensional model of the stochastic development process for the negative lightning downward leader was established in this paper. When the downward leader is far from the grounding structure, there is little impact caused by its branches. Therefore, it was assumed that the lightning develops vertically downwards from the thundercloud to the height 1000 m and then develops randomly.

3.1. Three-Dimensional Development Process of Lightning Branches

The lightning leader is usually a branching development, with multiple discharge branches forming a structure similar to tree-like branches. The potential development point of a branch leader was determined based on the dielectric breakdown model [
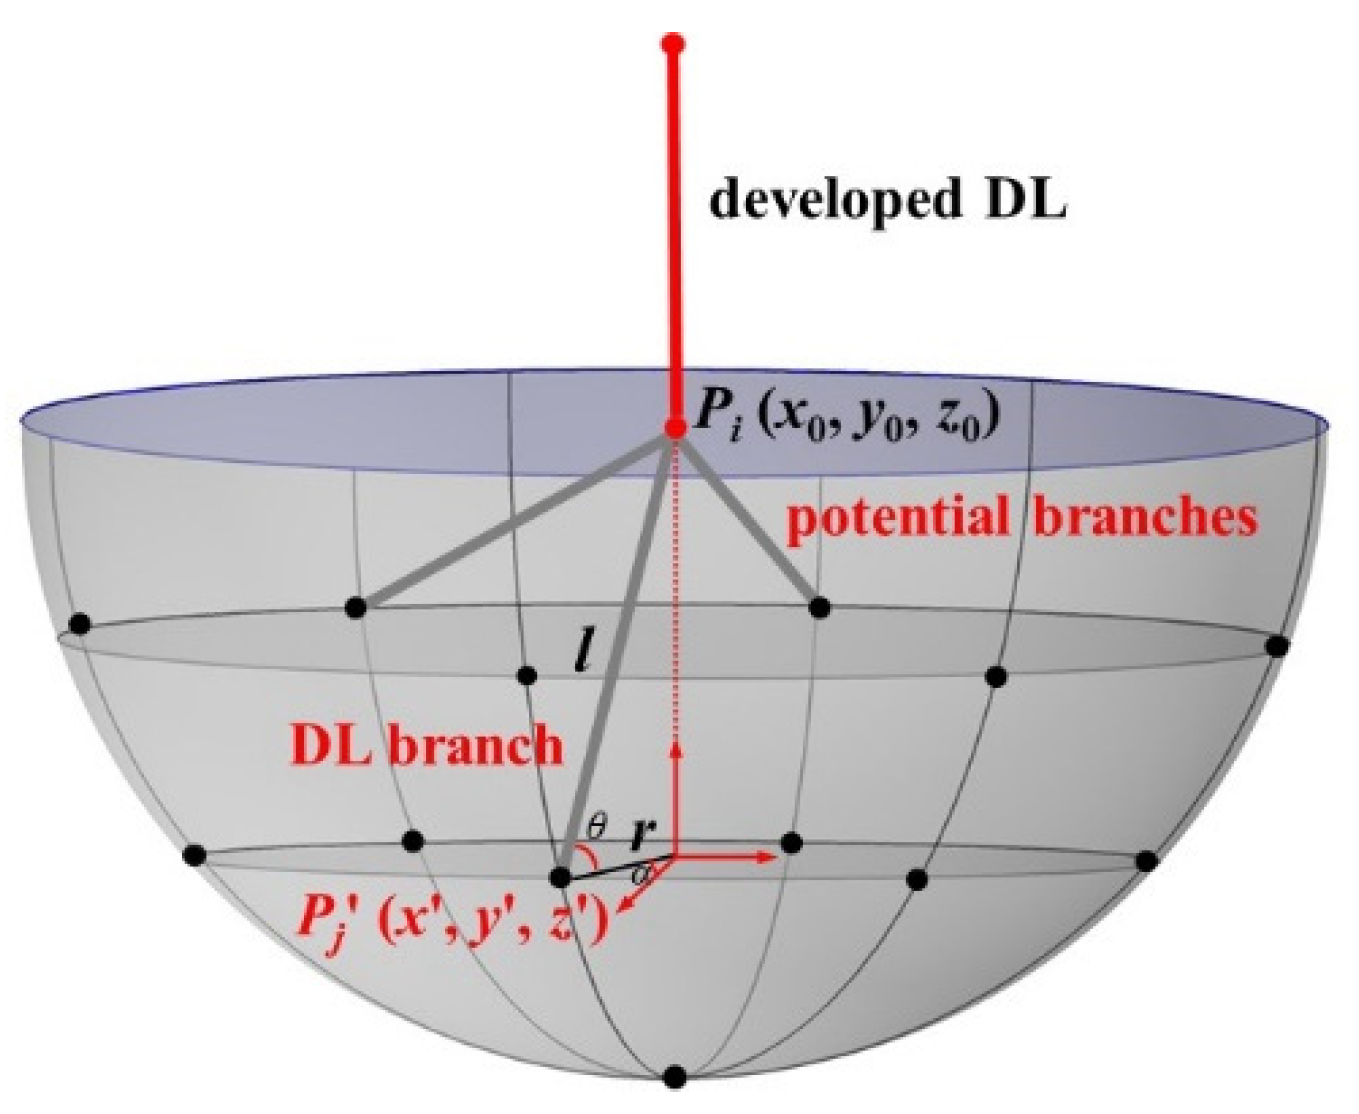
20]. As shown in Figure 13, the developed leader is represented by a solid red line, while the potential leader is represented by a gray line. Supposing the downward leader to develop to the point Pi (x0, y0, z0), the next potential development points of the branch leaders were distributed on the hemisphere with Pi as the center of the sphere and the step length (taken as 10 m) as the radius, represented by black dots in Figure 13. Assuming that the angle between the potential branch leader and the vertical was less than 60 degrees, for calculation purposes, 25 developing points were uniformly dispersed on the sphere surface.
Furthermore, the coordinate of potential development point Pj (x′, y′, z′) can be calculated by Equation (4):
{ x = x 0 r cos α y = y 0 r sin α z = z 0 l sin θ r = l cos θ
where α is the angle between the developing branch on the x-y plane and the x axis, θ is the angle between the developing branch on the y-z plane and the y-axis, r is the length of the developing branch on the x-y plane and l is the step length of the lightning branch, taken as 10 m.
Hence, the breakdown probability from the developed point to the potential point can be calculated by Equation (5):
P i j = ( E ( P i , P j ) ) / ( E ( P i , P j ) )
where E(Pi, Pj) is the average electric field strength between the developed point Pi and the potential development point Pj.
By adopting the critical electric field threshold Eth for air breakdown [21], it was considered that only when the electric field between the developed point and the potential point is greater than the threshold, the lightning branch is probable to develop. The development probability Pi-j was calculated by Equation (6) [20]:
P i j = ( E ( P i , P j ) E th ) ( E ( P i , P j ) E th ) )
where Eth is the E-field threshold of dielectric breakdown with 500 kV/m.
In order to characterize the stochastic development process of the three-dimensional downward leader, a series of stochastic numbers from 0 to 1 generated uniformly was to weight the field strength E(Pi, Pj) between each potential point Pj and the developed point Pi, so as to obtain the stochastic development probability of the branch leader of each potential point. If the stochastic development probabilities of the potential points were within δ, it was considered that the branches developed at the same time step. δ was taken as 5% in this paper.

3.2. Channel Charge Density of Leader Branches

The channel charge of the branches was further characterized so as to iteratively calculate the spatial electric field affected by the coupling effect of the thundercloud and the stepped downward leader. By integrating the current waveform of the return stroke of CG lightning, the charge density ρ of the downward leader channel was obtained according to Equation (7) [22]:
{ ρ ( ξ ) = a 0 ( 1 ξ H c z 0 ) G ( z 0 ) I 0 + I 0 ( a + b ξ ) 1 + c ξ + d ξ 2 H ( z 0 ) G ( z 0 ) = 1 ( z 0 H c ) H ( z 0 ) = 0.3 α + 0.7 β α = e z 0 10 75 β = G ( z 0 )
where ρ(ξ) represents the charge density inside the leader channel, C/m; z0 represents the height of the lightning leader’s head, m; Hc is the height of the thundercloud, taken as 4 km; ξ is the distance from a certain point in the downward leader channel to the leader’s head, m; I0 is the magnitude of the first return current, kA, and the coefficients are: a0 = 1.476 × 10⁻⁵, a = 4.857 × 10⁻⁵, b = 3.9097 × 10⁻⁶, c = 0.522 and d = 3.73 × 10⁻³.
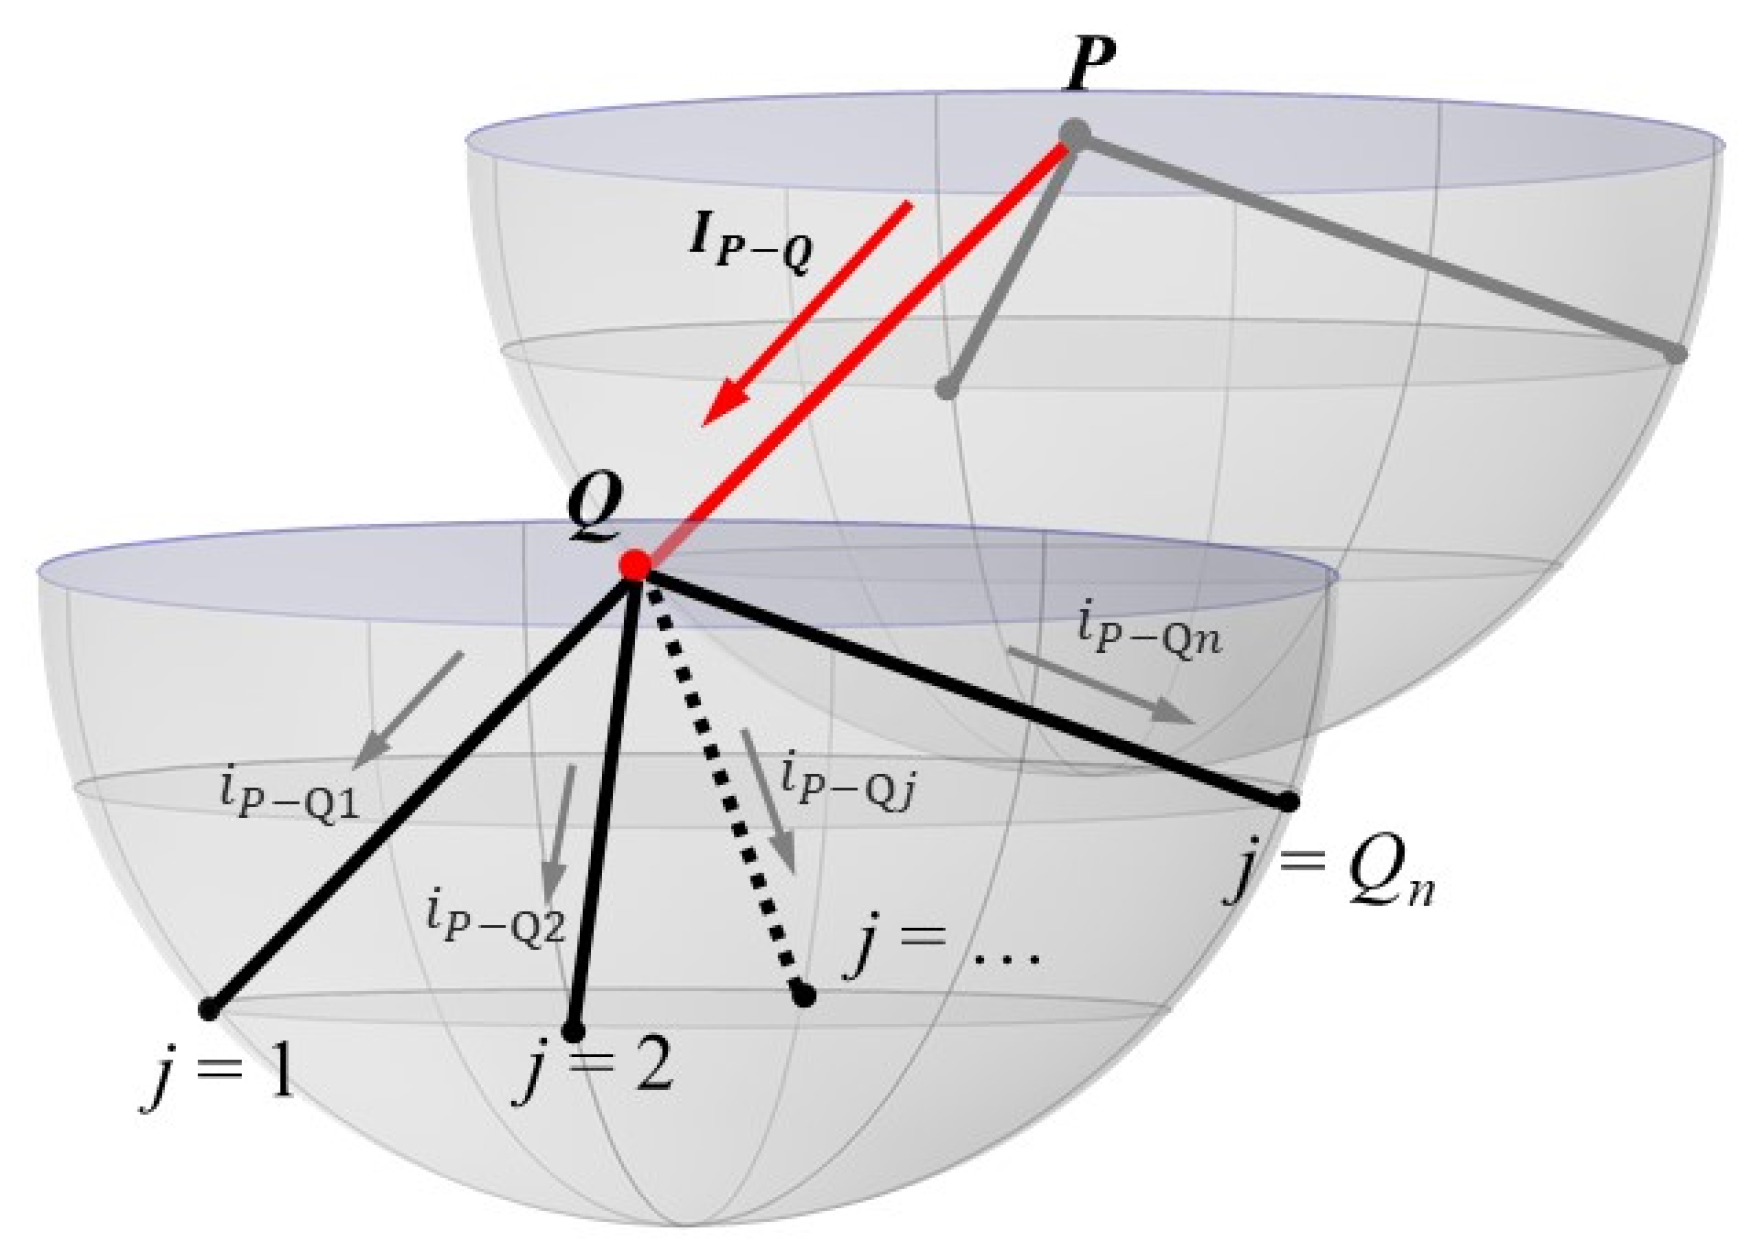
Considering the development process of the leader branch after the downward leader develops to a certain point Q, it was calculated that there were Qn branch leaders developed from this point. The development diagram is shown in Figure 14.
Assuming that the channel impedances of the lightning branches remain unchanged, the lightning current Ip is considered to shunt in the branches [23], that is, the lightning current injected into a branch development point is proportional to the potential difference and is distributed among the branches developed from that point. The charge densities of the branches developed from point Q were calculated by Equation (8):
{ ρ P Q j = ρ ( ξ , z 0 - Q j , I P Q j ) I P Q j = k P Q j · I P Q k P Q j = U Q j j = 1 j = Q n U Q j
where ρ P Q j is the channel charge density of the branch Qj developed from point Q, C/m; IP-Qj is the current through the branch Qj, kA; kP-Qj is the shunt coefficient; z0-Qj is the height of the head of the branch Qj from the ground, m; IP-Q is the total current injected into the Q point, kA; UQj is the potential difference between the two ends of the branch Qj, V, and Qn is the number of downward leader branches developed from the Q point.

3.3. The Verification by Box Dimension Method

Combining the finite element simulation software COMSOL Multiphysics and MATLAB, the numerical simulation of the 3D stochastic development process of the lightning downward leader was conducted. The stochastic coordinates of the branch leaders were determined in MATLAB, while the leader’s charge model was established in COMSOL, and the spatial E-field was further iteratively calculated accordingly.
The fractal dimension was employed to depict the morphological characteristics of branched lightning. Moreover, the box dimension method was adopted to calculate the fractal dimension. Selecting squares with different side lengths lb (measurement scales) as the reference grid dividing plane in turn, and recording the number of squares that can completely cover the lightning discharge channel as N(lb), the fractal dimension Df of the lightning development graph is expressed as Equation (9) [24]:
D f = lim l b 0 ln N ( l b ) ln ( 1 / l b )
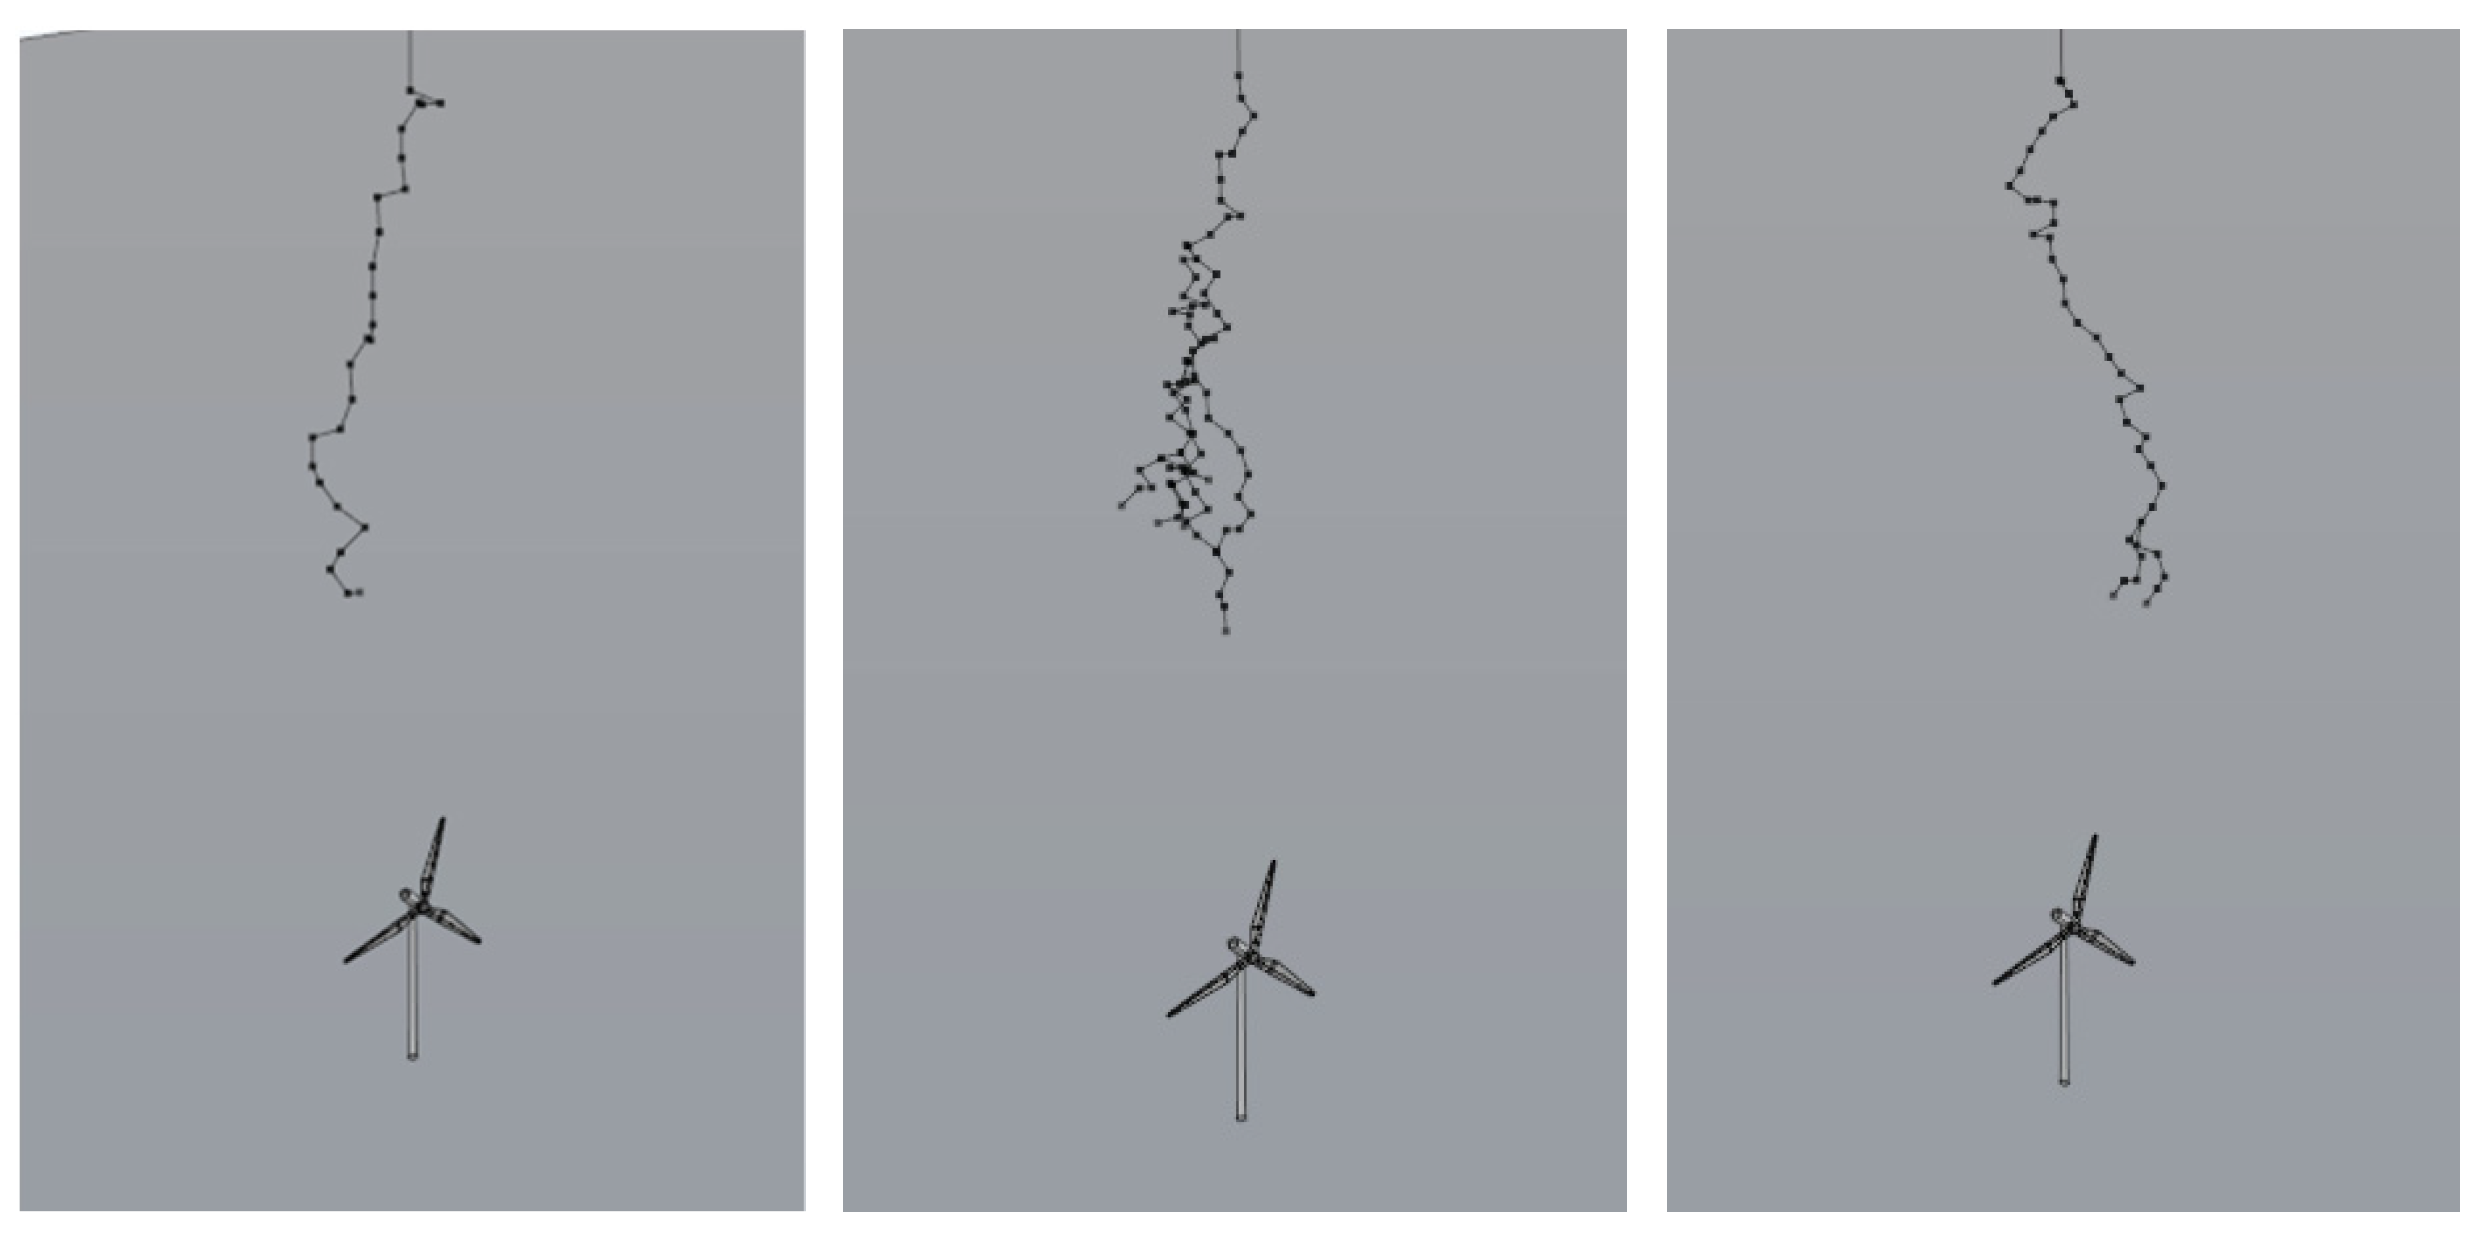
According to the observation data, for typical geometry of natural lightning, the fractal dimension is between 1.1 and 1.4. Based on this method, the fractal dimensions Df of the lightning shapes were calculated. The 100-times-repeated simulation showed that 94% of the Df were between 1.1 and 1.4, with an average of 1.23. The simulation result was in agreement with the fractal dimension calculated by the lightning data in the field observation, which verified the validation of the model.
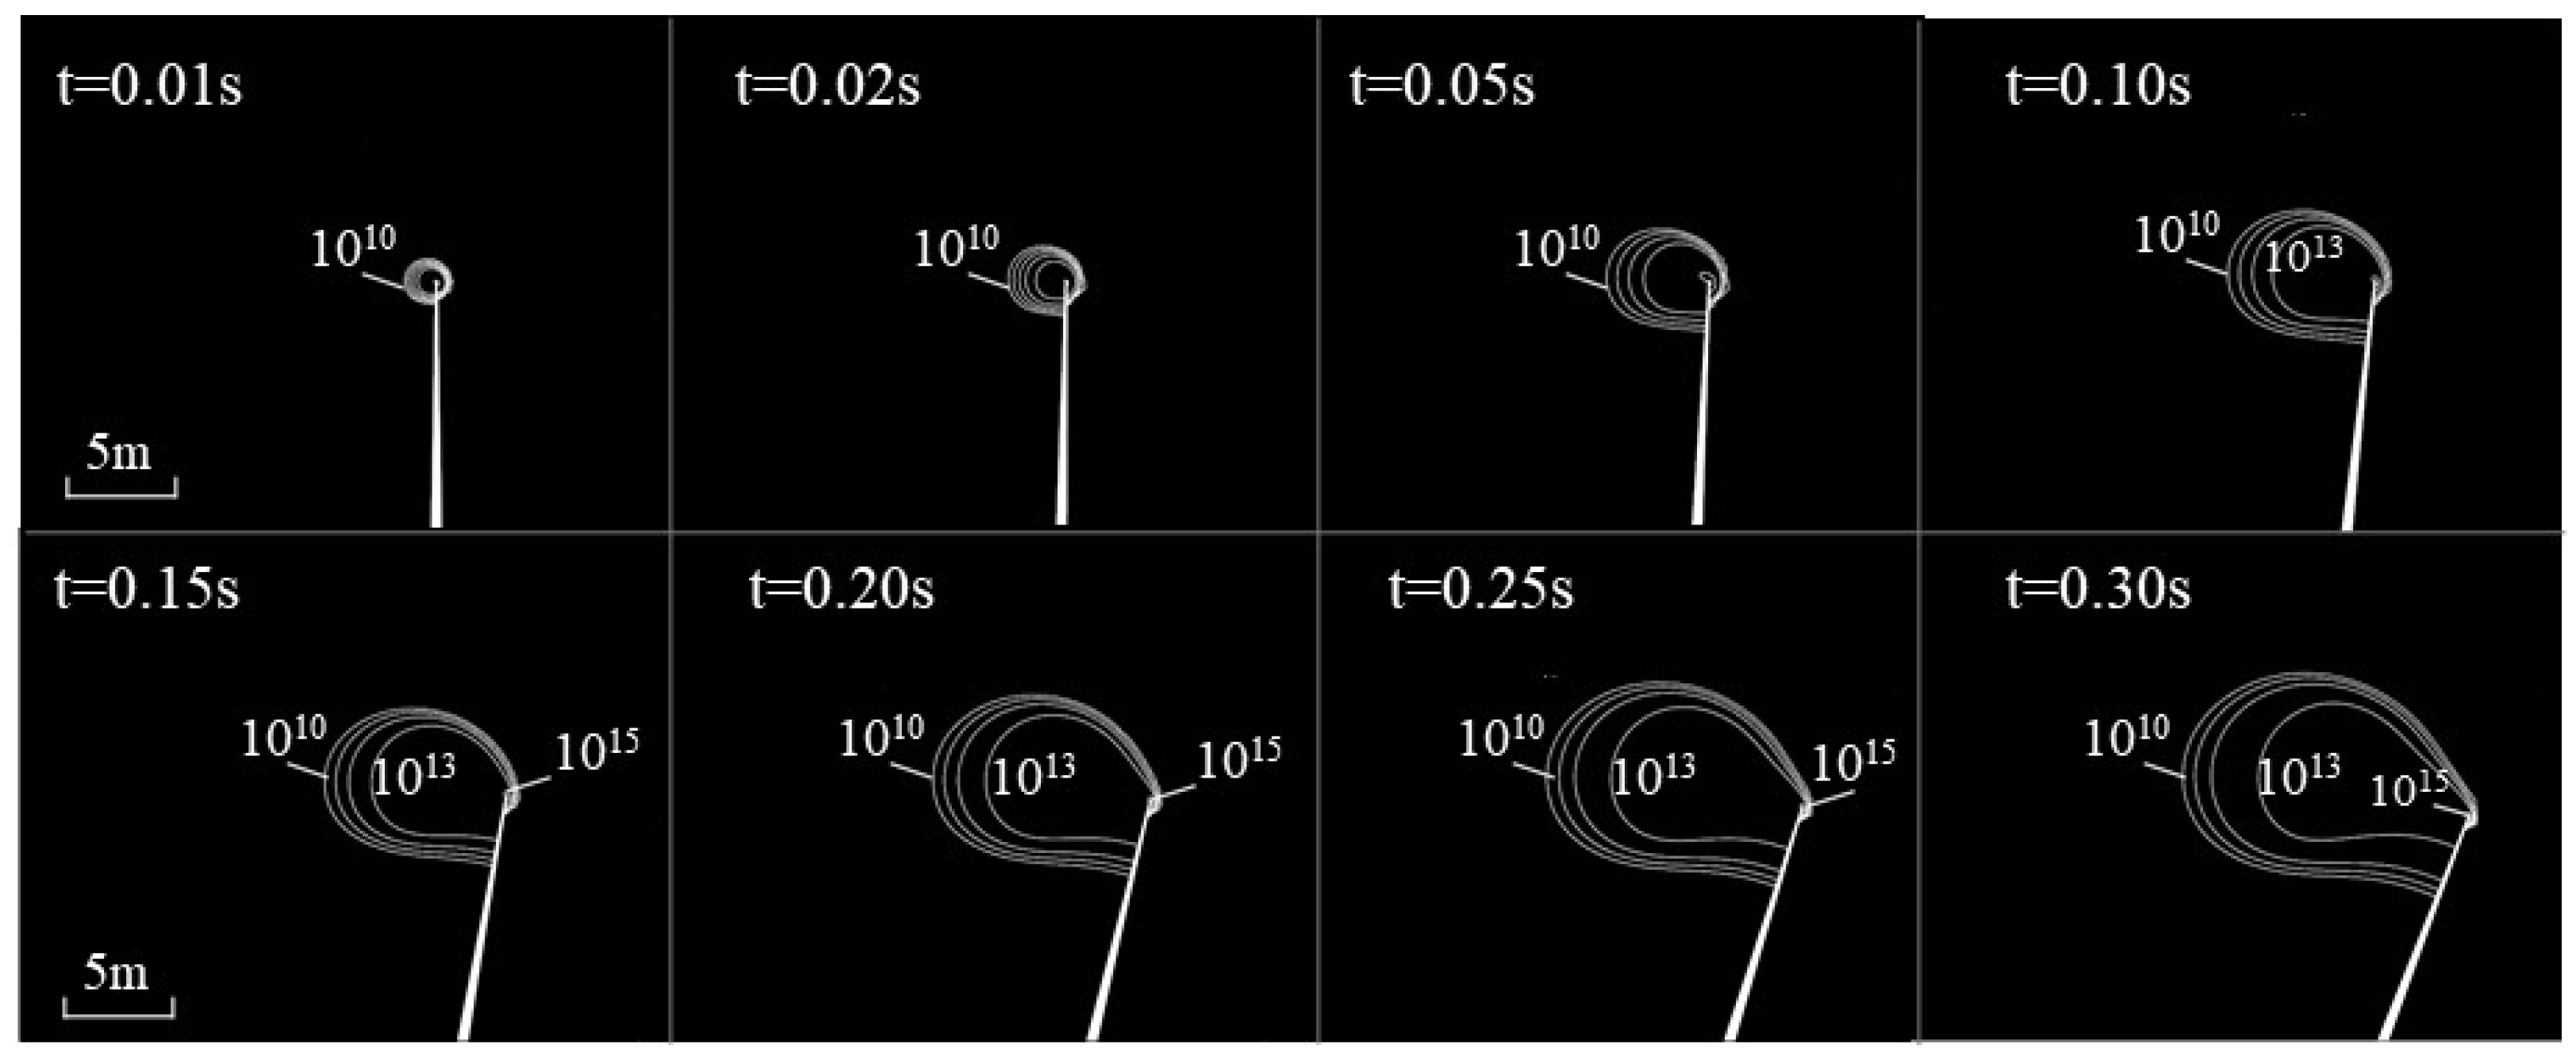
The fractal dimension reflects the density of space occupied by lightning branches to a certain extent. Since the downward leader develops in the manner of random tree-like branches, the obtained lightning downward leader pattern was different each time. The three-dimensional random development simulation results of a typical lightning downward leader are shown in Figure 15.

4. The Initiation Process of the Upward Leader from a Rotating Wind Turbine

It is known that the rotation of a WT will affect the distribution of charged particles in the neighborhood of the blade tip. However, since the development speed of the leader is in the magnitude of 105–106 m/s, compared to the development process of the leader, the rotating WT can be regarded as an instantaneous static state. The rotation of the WT will affect the spatial distribution of charged particles in the neighborhood of the blade tip, which, in turn, affects the distribution of field strength near the blade tip. Therefore, the influence of rotation on the initiation of the leader is reflected in the initial direction of the upward leader.
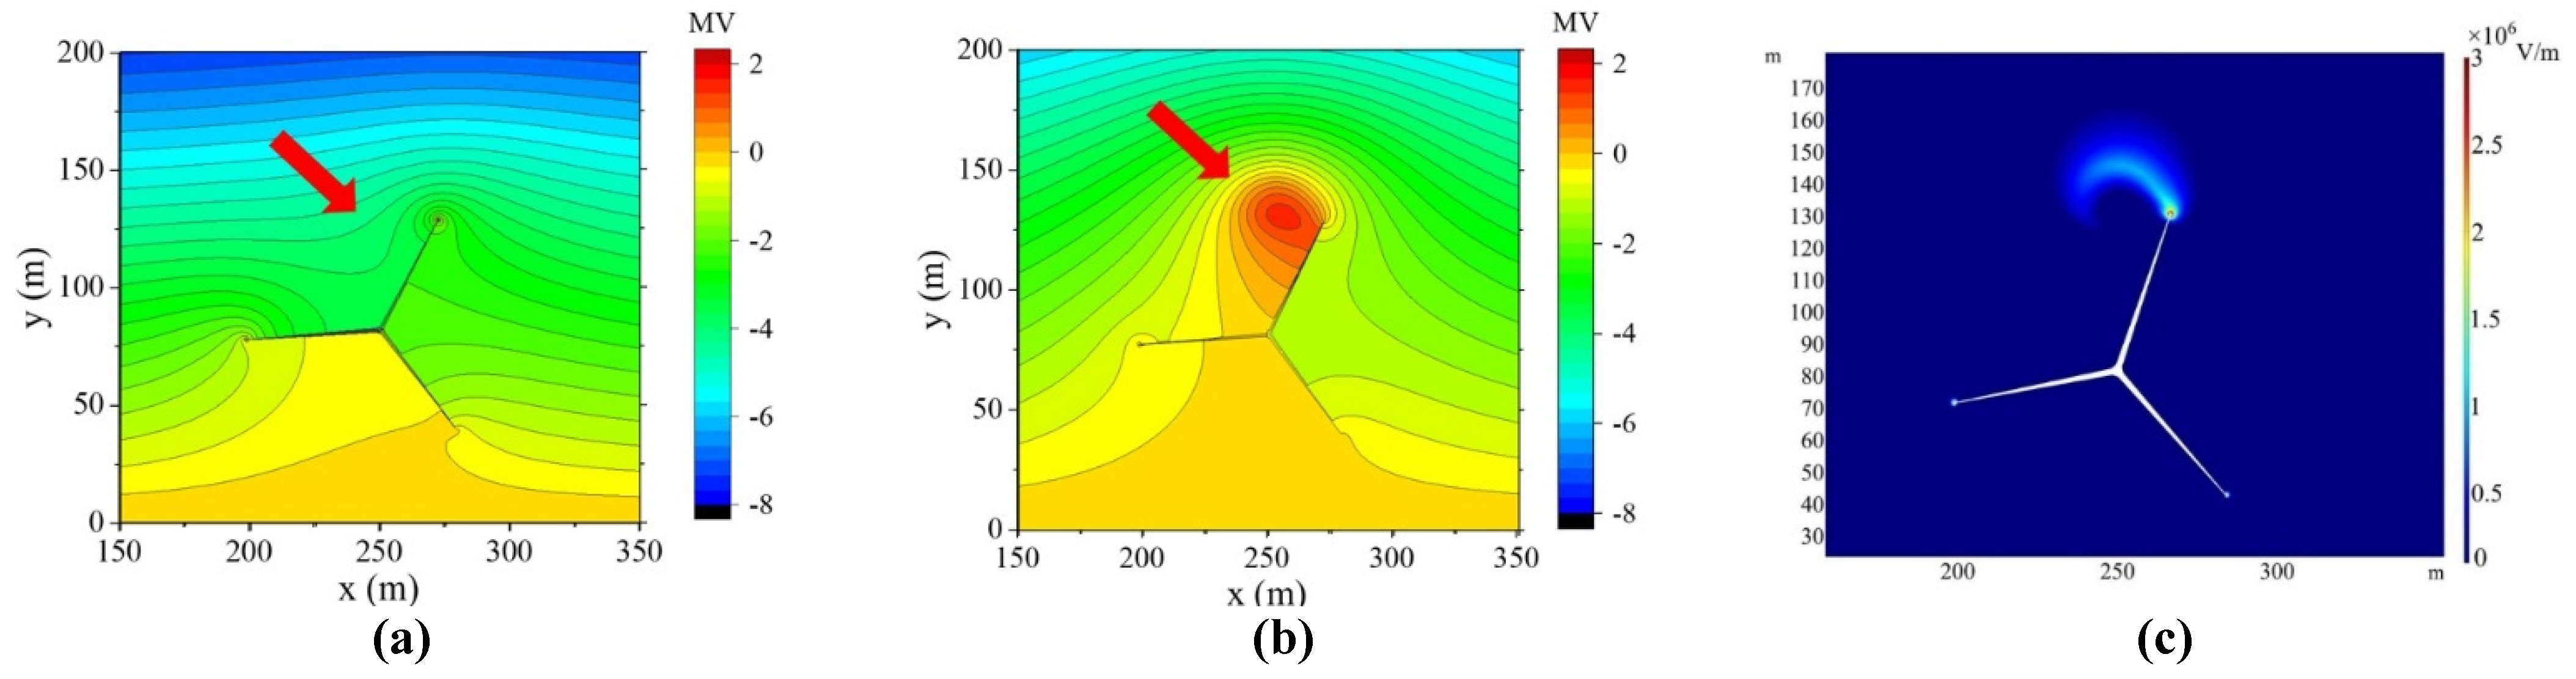
As for stationary WT, the initiation direction of the upward leader is assumed to be vertically upward from the blade tip. With the influence of the thundercloud-induced E-field and the downward leader, on the one hand, the distribution of electric field lines near the blade tip is more uneven than that of a stationary WT due to the rotation of the WT; on the other hand, the dynamic development process of the downward leader also constantly affects the neighboring E-field of the WT, which makes it more difficult to determine the initiation direction of the upward leader.
In electric fields, the charged particles move along the direction of the electric field lines. Under the influence of the thundercloud-induced E-field and the downward leader, the moving direction of the charged particles during the development of the corona near the blade tip affects the development of the unstable leader direction and further determines the initiation direction of the stable upward leader. Therefore, the initiation direction of the upward leader is defined as the tangent direction of the electric field line from the blade tip. The calculation results showed that there are three cases of upward initiation direction, as shown in Figure 16.
The first case is that the electric field lines start from the blade tip and develop in the opposite direction of the blade rotation, and the initiation direction of the upward leader is on the back side of the blade rotation accordingly. The second case shows that the electric field lines from the blade tip are distributed on the front side of blade rotation and the initiation direction of the upward leader is on the front side of the blade rotation. In the third situation, the electric field lines of the blade tip develop on the both back side and the front side of rotation, while the initiation direction of the upward leader needs to be further determined according to E-field strength of both sides.
Once the corona discharge near the tip is formed and the initiation direction of the upward leader is determined, the initiation of the upward leader is divided into two steps: unstable upward leader initiation and stable upward leader formation [25].
The criterion of initiation of the unstable upward leader is that the amount of space charge in the corona area ΔQ(0) exceeds 1μC. This is because the energy required for the initiation of the upward leader comes from the collision and energy conversion of the charged particles at the root of corona, so the initiation of the unstable upward leader depends on the initial space charge in the corona area. The initial charge ΔQ(0) in the corona area is as Equation (10):
Δ Q ( 0 ) = e V c ( n + + N + ) d V c
where e is the amount of elementary charge and Vc is the three-dimensional area of corona discharge, which is set as a hemispherical area with the radius of 1 m.
By employing the criterion of stable leader initiation [25,26] proposed by Becerra, the initiation process of the stable upward leader is determined by the principle that after several iterations, if the upward leader length lL(i + 1) exceeds 2 m, the stable upward leader initiates; if the leader no longer develops after many iterations, it is considered that the stable upward leader fails to initiate. The length of lL(i + 1) is determined by Equation (11) [25]:
{ U tip ( i ) = E l L ( i ) + E x 0 ln ( E str E E str E E e l L ( i ) x 0 ) U c ( i ) = U tip ( i ) + E str ( l l L ( i ) ) Δ Q ( i ) = K Q l L ( i ) l S ( i ) ( U c ( i ) ( l ) U c ( i 1 ) ( l ) ) d l l L ( i + 1 ) = l L ( i ) + Δ Q ( i ) q L
where Utip(i) refers to the potential of the leader head at the ith step’s calculation; Uc(i) is the potential of the corona discharge area in front of leader head; ΔQ(i), refers to the charge quantity of corona area in front of leader head at the ith step; lL(i) is the length of the upward leader at the ith step, and lL(0) was set to x0; lS(i) is the total length of the leader and corona area; l represents the distance along the discharge axis from the blade tip; Estr is the initial average field strength of the corona discharge area, taken as 450 kV/m; E is the quasi-stable average field strength of leader area with a value of 50 kV/m; x0 is the initial length of the upward leader, assumed to be 0.05 m; kQ is a geometric factor which characterizes the ratio between ΔQ(i) and the electric potential distortion of the corona area, taken as 3.5 × 10⁻¹¹ C/(V·m), and qL is the required charge quantity per-unit length for leader development, taken as 65μ C/m
Combining the analysis of Section 2 and Section 3, the ion flow distribution near the rotating blade tip under a thundercloud and the stochastic process of lightning DL were clearly described. Moreover, in this section, the initiation process of the upward leader of the rotating WT was characterized accordingly. To simulate the whole process from ion flow distribution, corona initiation and lightning DL development to upward leader initiation from the blade tip, the following assumptions were proposed in the calculation process:
(a)
The spatial–temporal distribution of space charge near the blade tip was calculated without consideration of lightning DL.
(b)
Since the WT blades can be at any angle when the downward leader starts to develop, for calculation purposes, it was assumed that the lightning downward leader started to develop when the corona initiated on the blade tip.
(c)
In the development process of the downward leader, the linear velocity of the blade tip of the turbine was negligible compared to the development speed of the downward leader, and the turbine was considered to be stationary.
The simulation process of the upward leader initiation from the rotating blade tip is described as follows:
(1)
Construct the geometric model. Input the parameters and variables, build the geometric model of wind turbine, set the boundary conditions and generate meshes of calculation domain.
(2)
Calculate the corona initiation of rotating blade. Input rotation speed of wind turbine and calculate the rotational angle when corona initiates on blade tip, combining Equations (1)–(3) and dynamic mesh method.
(3)
Advancement of stochastic lightning DL. Assume that the wind turbine stays static once lightning DL develops. Calculate the advancement process of lightning DL according to the method proposed in Section 3.
(4)
Determine if the stable upward leader initiates from blade tip. Calculate the distribution of E-field lines and determine the pattern of potential initiation direction of upward leader. Calculate and analyze whether the stable upward leader initiates from blade tip, combining Equations (10) and (11).
(5)
The simulation process completes when stable upward leader initiates from blade tip; otherwise, return to step (3).
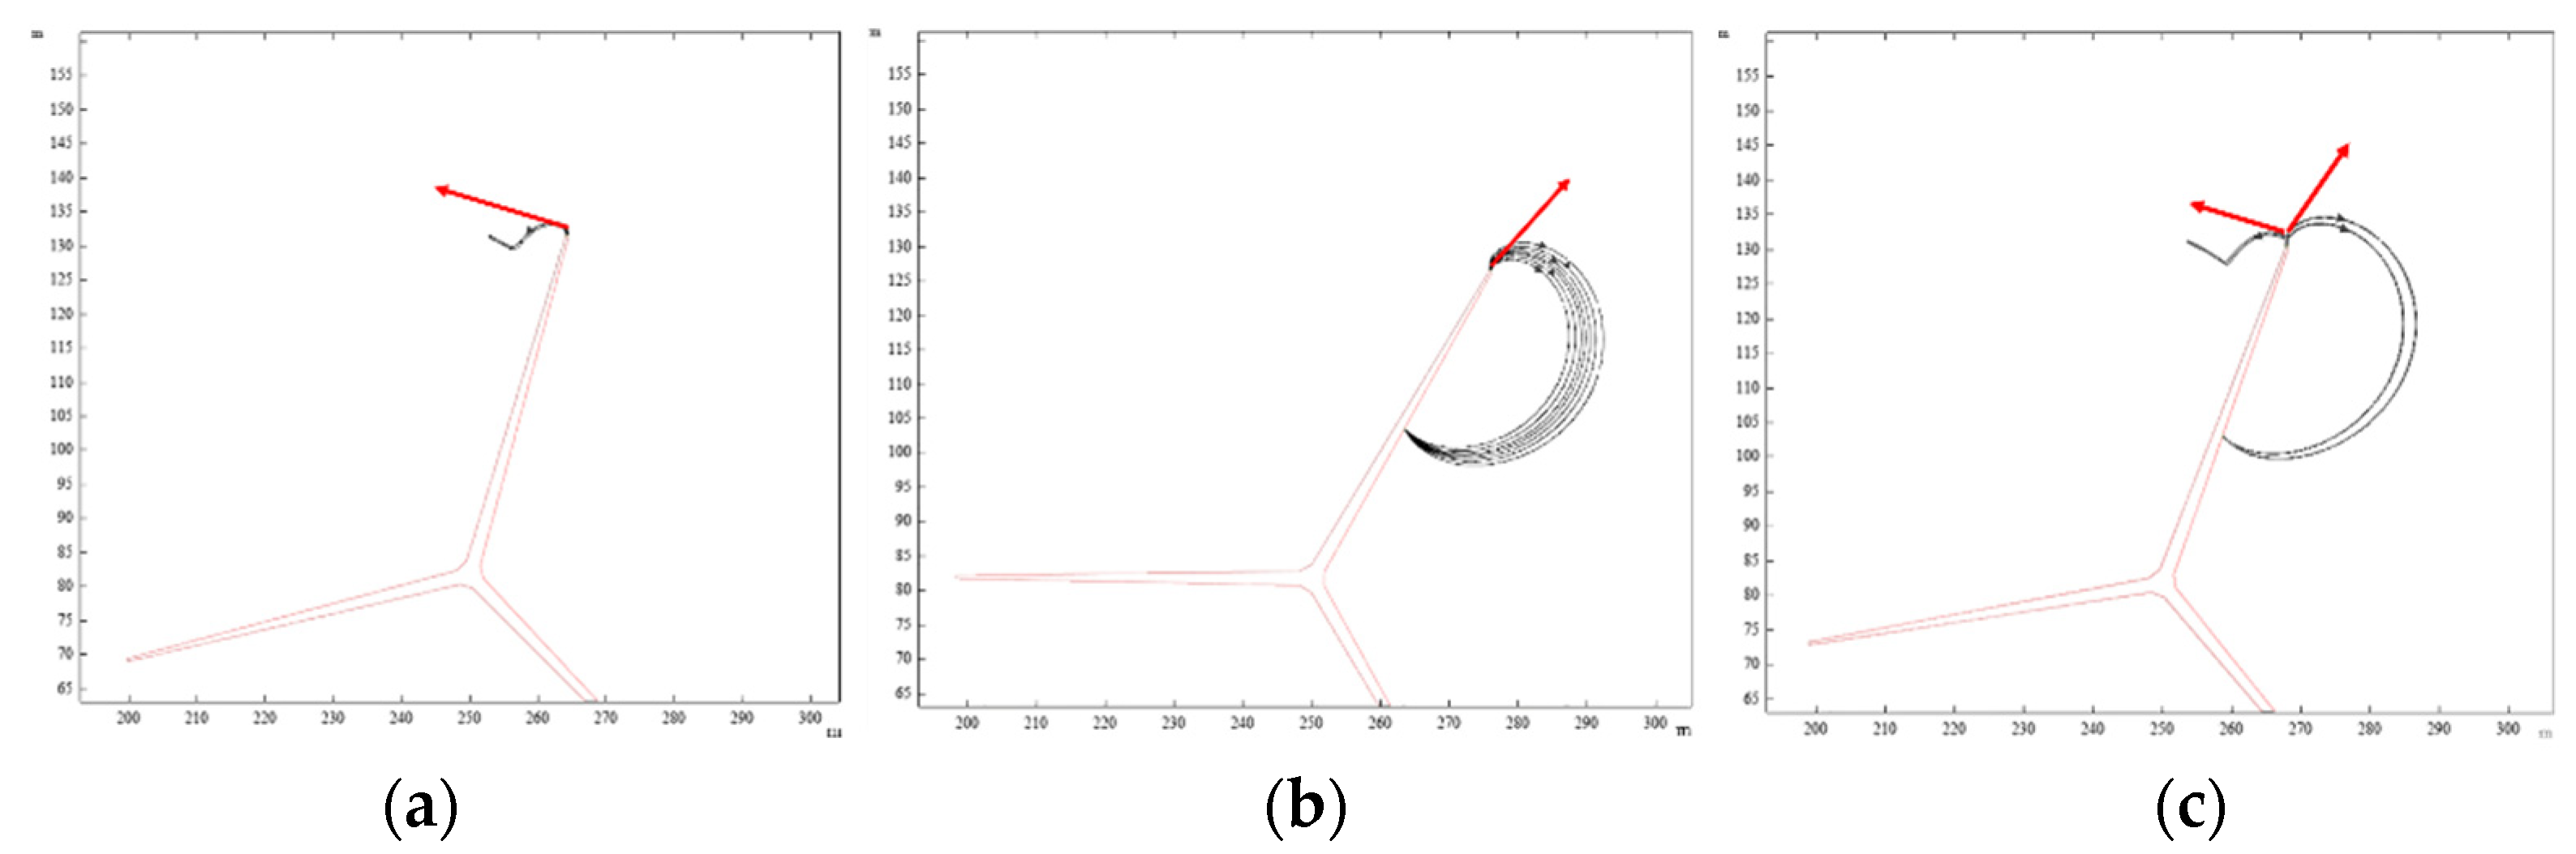
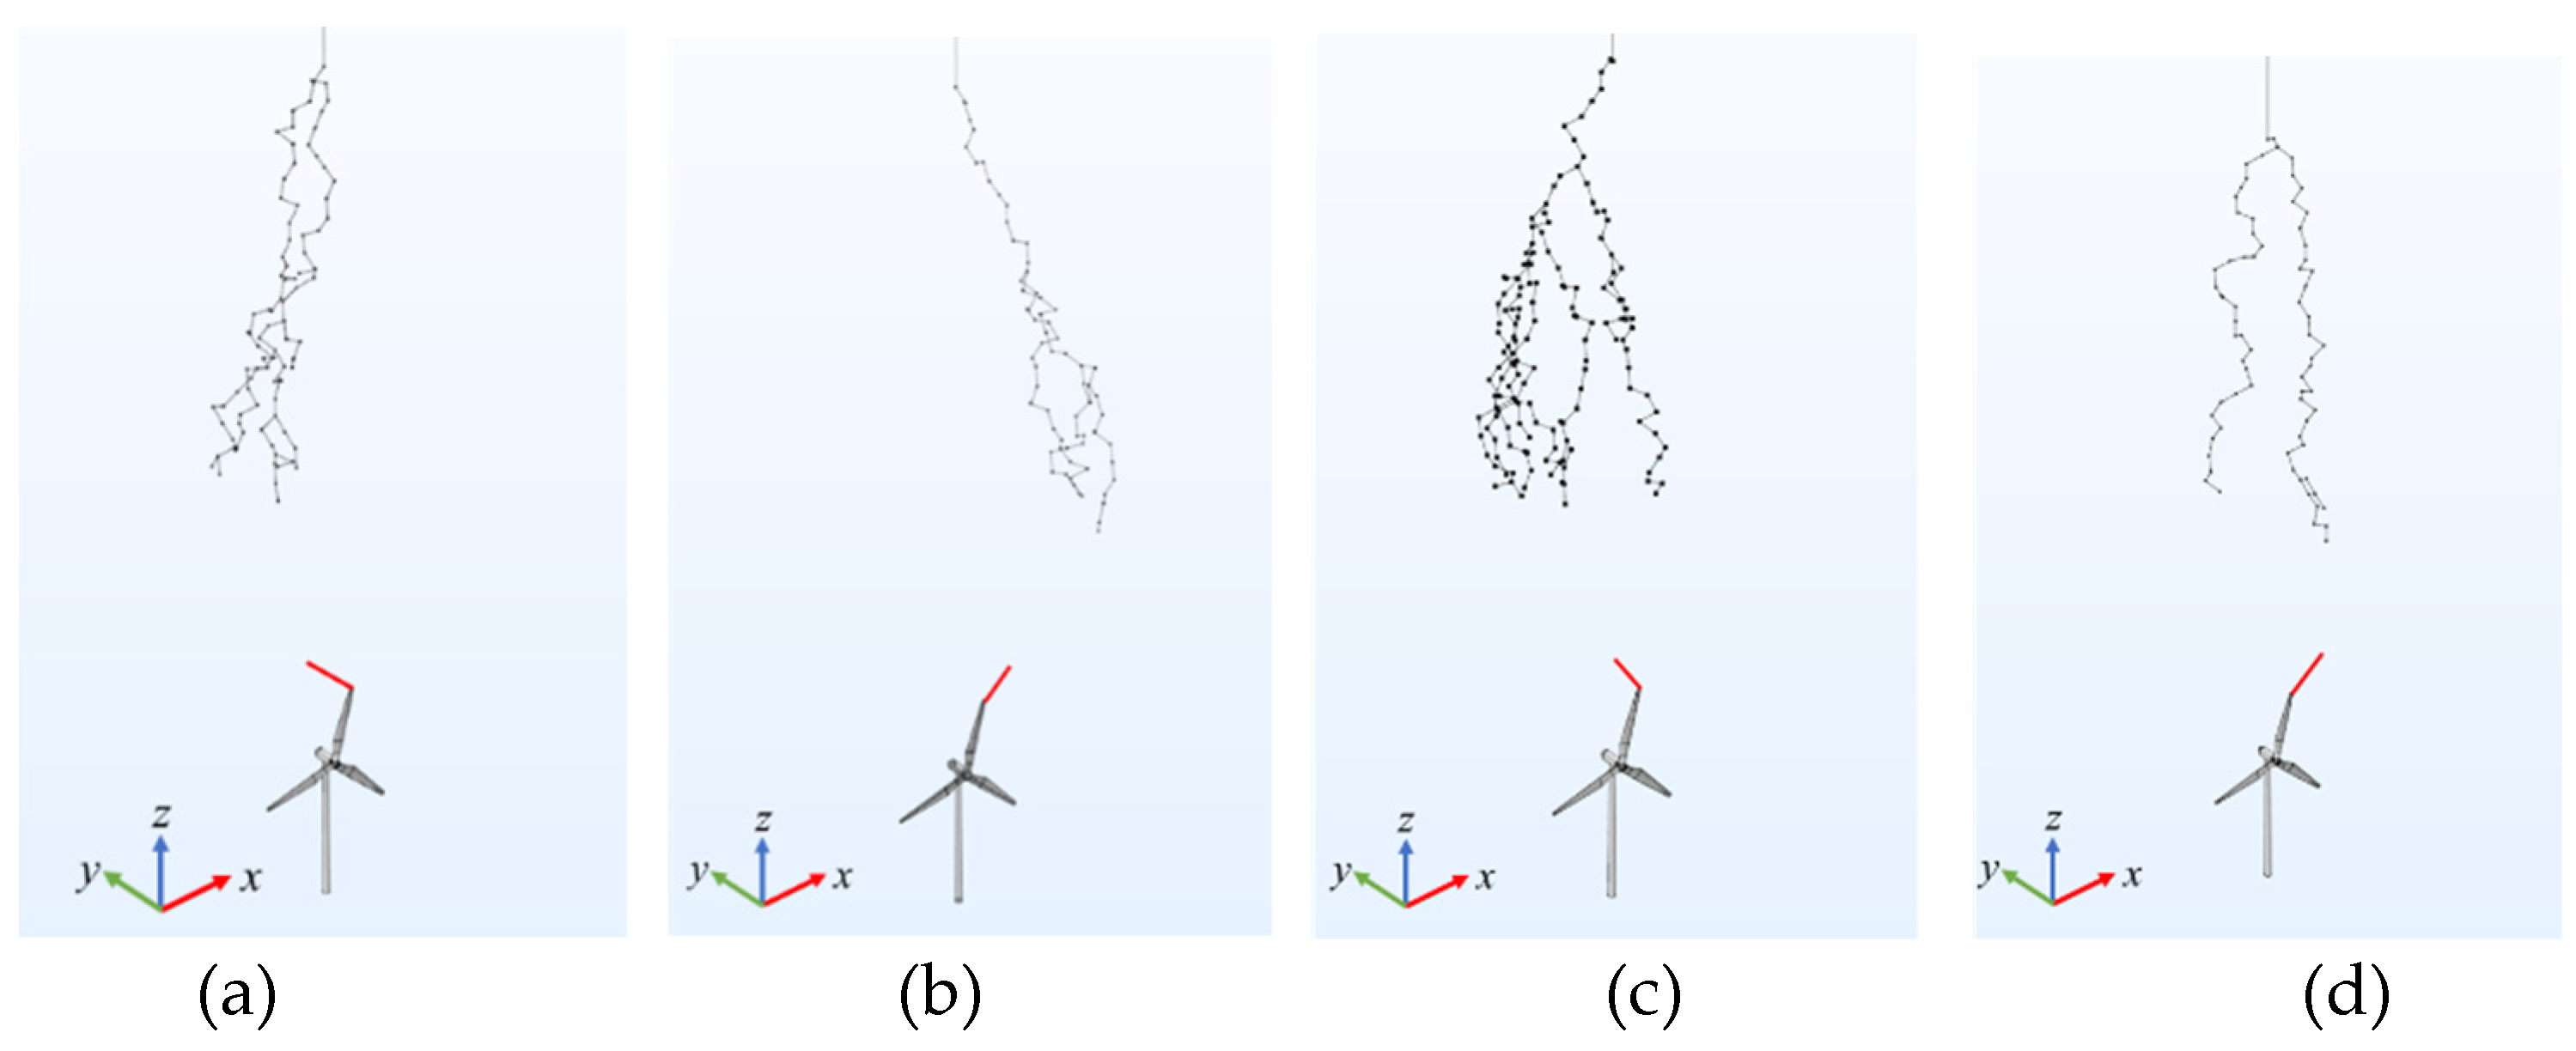
To obtain adequate results of the upward leader’s initiation and further explore the influence characteristics of the stochastic DL and blade rotation, the numerical calculation on the initiation process of the upward leader for the rotating WT was repeated 100 times. Natural lightning has random branching characteristics, so each time the random process of the lightning DL was calculated, a different lightning profile was obtained. However, under the influences of the thundercloud-induced E-field and the random downward leader, the initiation direction of the upward leader from the blade tip has certain statistical characteristics. Typical cases of upward leader initiation were obtained, as shown in Figure 17.
In Figure 17, the upward leader of the blade tip was marked by a red solid line. Since it can be considered that the stable upward leader is formed when the unstable upward leader develops to 2 m, the initial step of the upward leader was set to 2 m and then developed along the direction of the maximum electric field. In the repeated simulation calculation of the leader development, the main body of the downward leader was on the back side of the blade rotation (that is, in the direction of the negative x-axis of the y-z plane) 46 times. At the same time, the initiation direction of the upward leader was mainly on the back side of the blade rotation (42 times).
Moreover, the main body of the downward leader was on the front side of the blade rotation (the positive x-axis direction of the y-z plane) 43 times, and the initiation direction of the upward leader of the blade tip was mainly on the front side of the blade rotation (27 times). Due to the rotation effect, there also existed initial upward leaders with directions on the back side of the blade rotation (16 times).
The remaining 11 times were the cases in which the body of the downward leader was partly branched on the back side of the blade rotation and partly developed on the front side of the blade rotation. The initiation direction of the upward leader may be on the back side of the blade rotation, which was shown in Figure 17c and occurred eight times, as well as on the front side of the blade rotation, which was shown in Figure 17d and occurred three times. In the 100-times-repeated calculations of leader development, there were 66% of cases in which the initiation direction of the upward leader on the blade tip was on the back side of the blade rotation.

5. Conclusions

In this paper, a 3D model of the spatial–temporal distribution of ion flow was established so as to analyze the rotation effect of wind turbine on corona discharge. Aside from that, a 3D stochastic evolution model of the lightning downward leader was established as well, and the initiation process of the upward leader on the blade tip of rotating wind turbine was calculated. The related conclusions are given as follows:
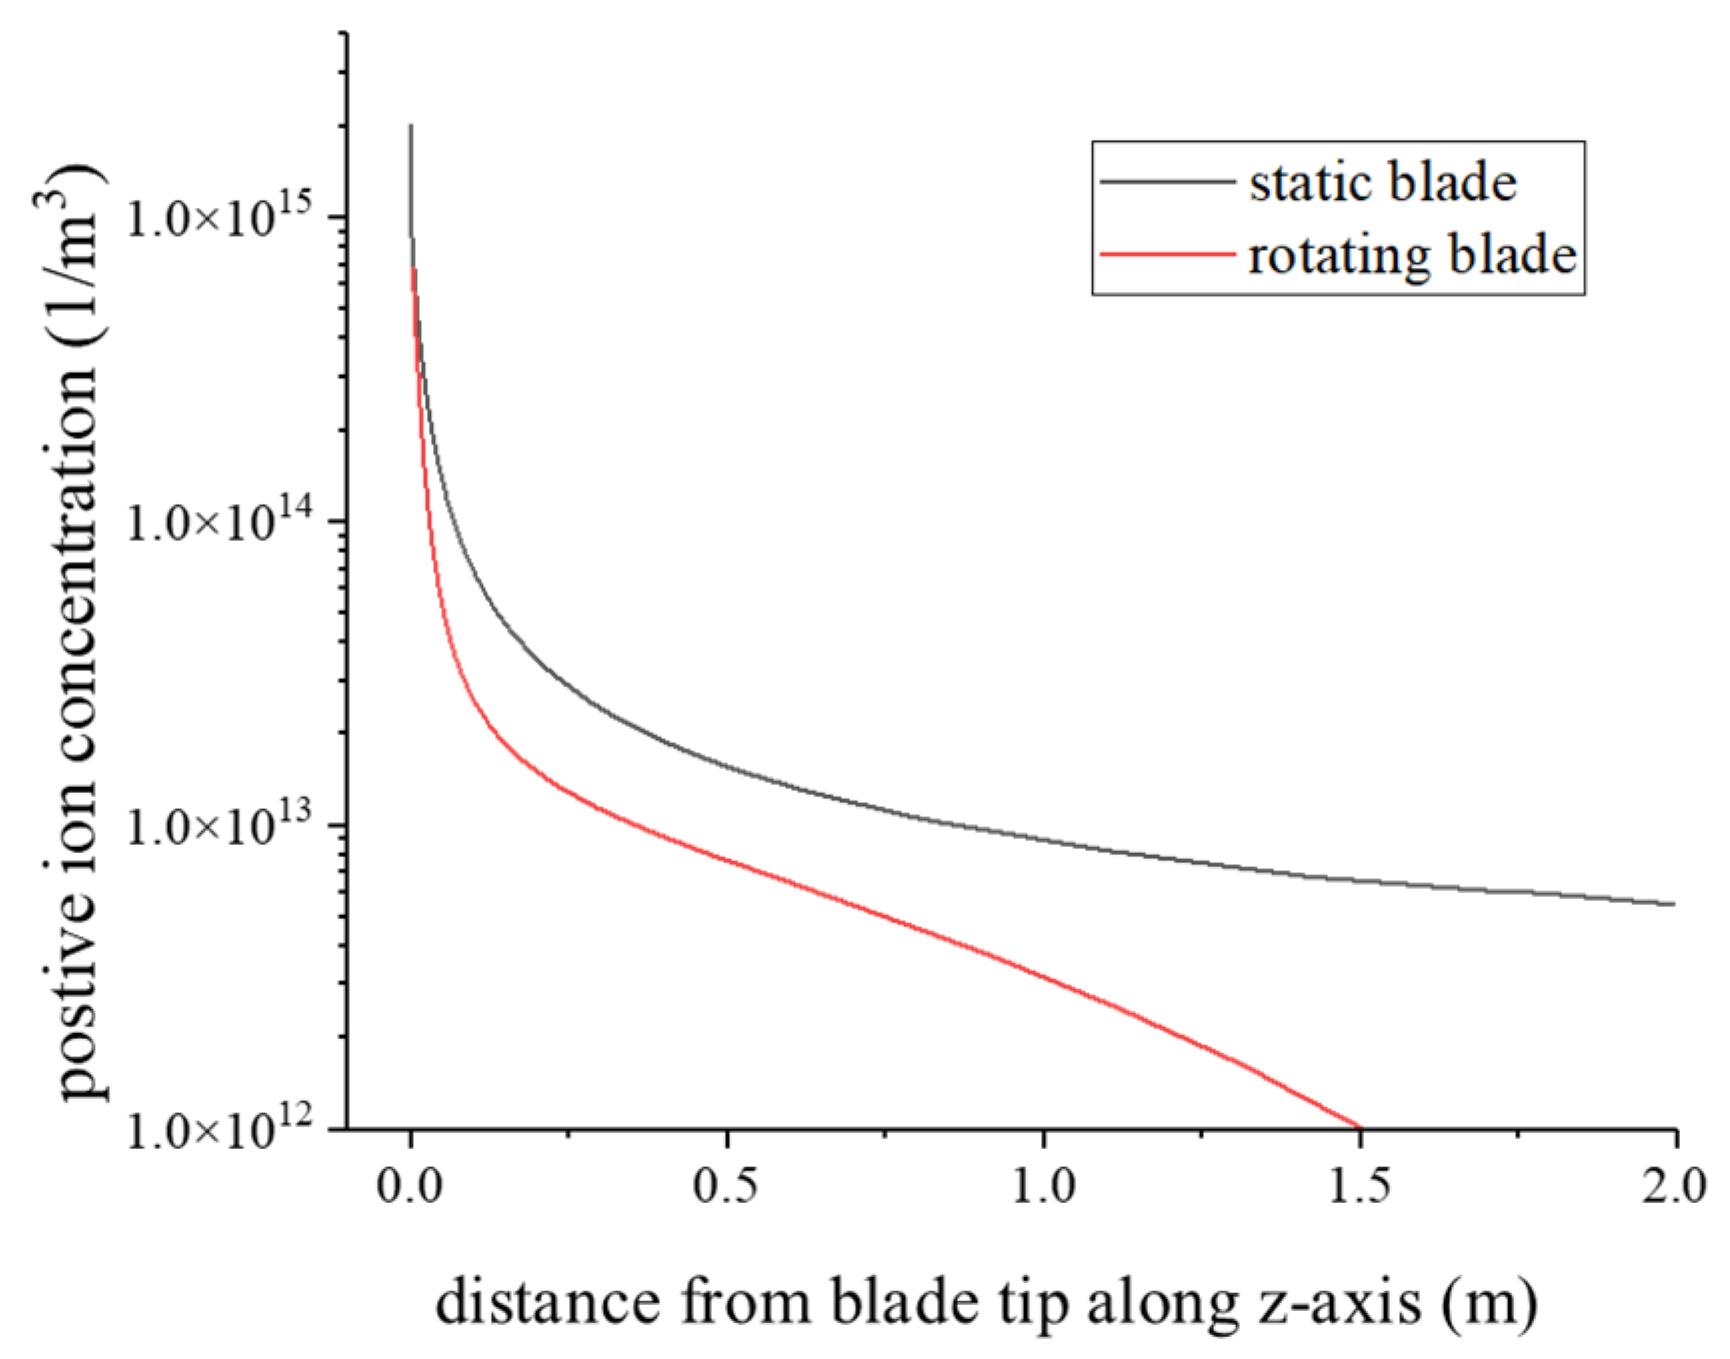
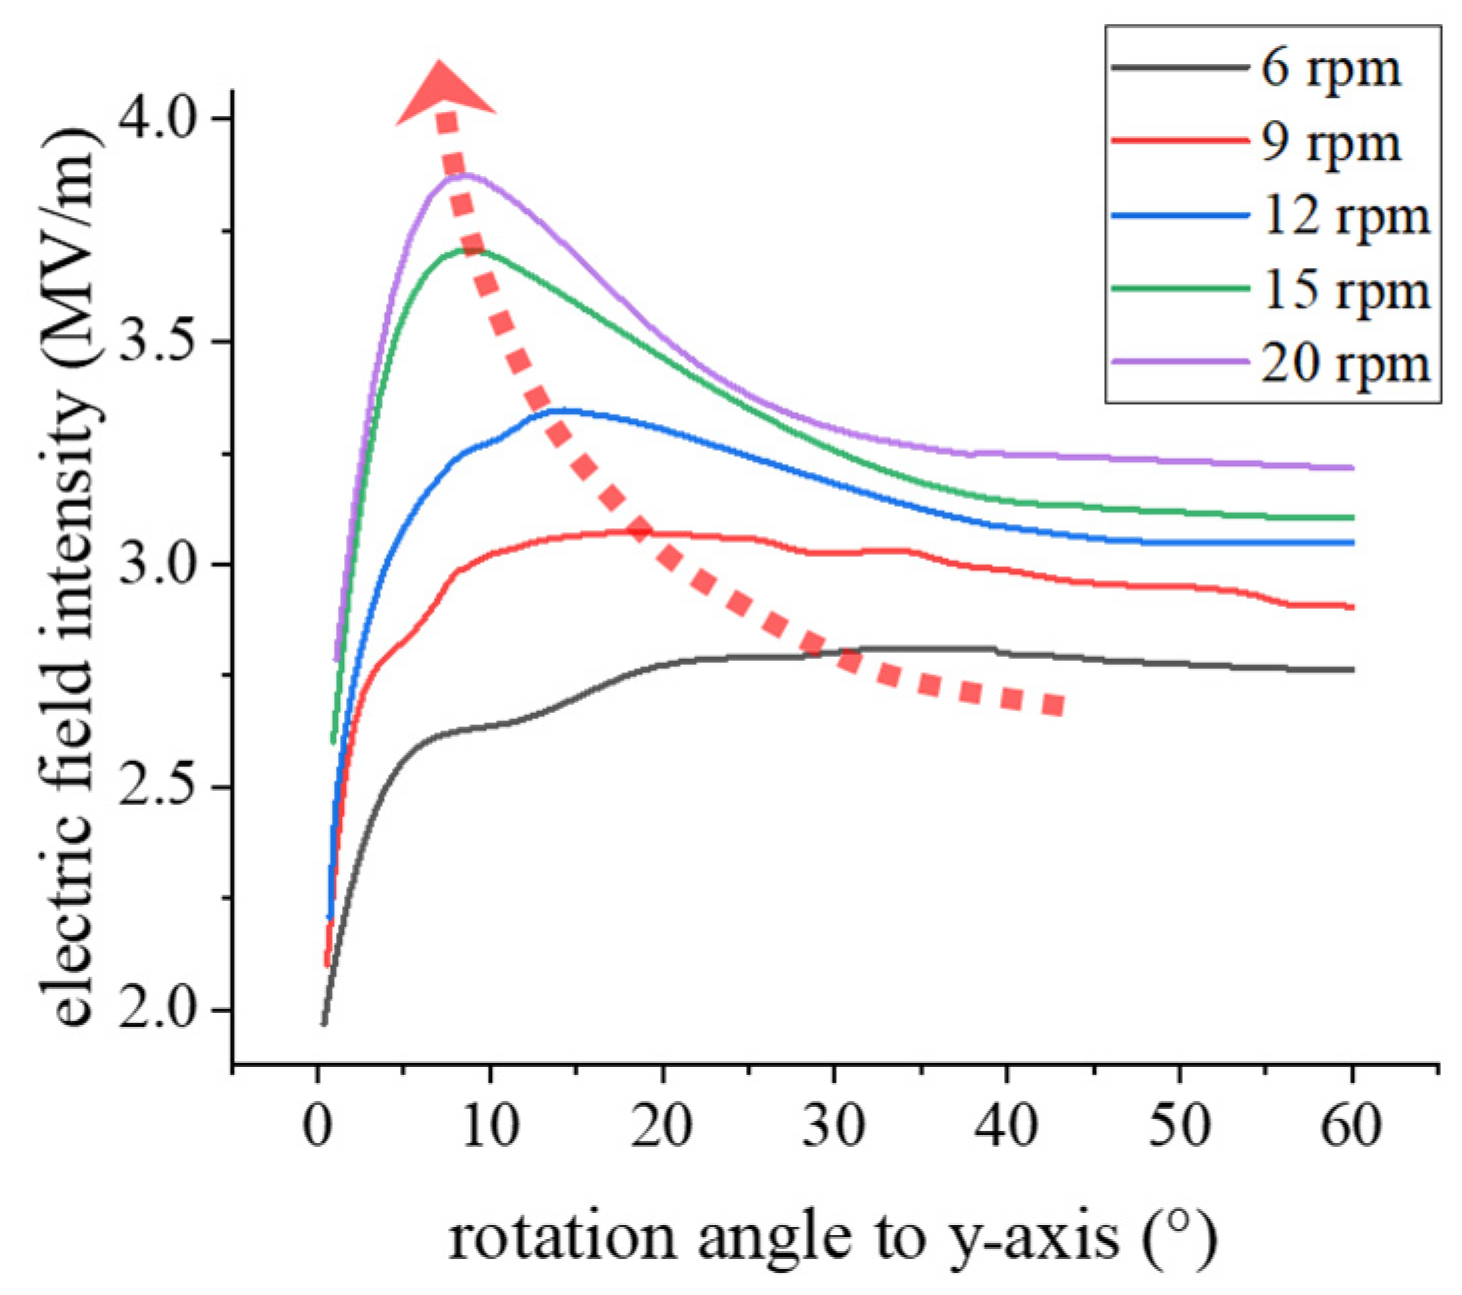
(1) A numerical model of the 3D spatial–temporal distribution of charged particles in the neighboring domain of a rotating wind turbine under a thundercloud-induced E-field was established. By analyzing the influence of wind turbine rotation on the distribution of charged particles, the space charge was found to be distributed in a stripe-like manner as the result of the rotation of wind turbine. Comparing with static wind turbine, the space charge is much less gathered near the blade tip when the blade rotates. Moreover, rotation makes the E-field strength near the blade tip greater, which is positively correlated with the rotating speed, contributing to the corona discharge being easier to initiate. From the perspective of lightning protection, it is recommended that wind turbines operate at reduced speeds or shut down during thunderstorms.
(2) A three-dimensional stochastic evolution model of the lightning downward leader was established by combining the dielectric breakdown model and lightning current shunt method. Combining the dielectric breakdown model with random functions, the random development coordinates of the branch leader were determined. The channel charge of the lightning branch was calculated by distributing the total current injected into the branch point, using the potential difference between the two ends of each branch channel as a weight. The box dimension of the lightning geometry model obtained through the model was calculated to be in the range of 1.1 to 1.4 for natural lightning, which verified the validity of the model.
(3) The initiation process of the upward leader rotating wind turbine under the influence of a thundercloud-induced E-field and the lighting downward leader was simulated. Combining the 3D stochastic development model of the lightning downward leader and the distribution model of ions near a rotating wind turbine, the initiation direction of the upward leader was analyzed. The upward leader initiates along the tangent line of electric field line from the blade tip. Moreover, due to the rotation of the wind turbine, the electric field intensity on the back side of the blade rotation is higher so that the upward leader easily initiates in the direction of the back side of blade rotation, which raises the risk of burning the blade surface by a lightning current. Thus, it is suggested to install conductive stripes near the blade tip. The main findings of the paper provide recommendations for the operation strategy of wind turbines and provide a theoretical basis for the improvement of the lightning protection system of wind turbine blades.

Author Contributions

Conceptualization, Q.L. and W.Y.; methodology, W.Y. and J.Z.; software, W.Y.; validation, W.Y.; formal analysis, W.Y. and Q.L.; writing—original draft preparation, W.Y. and J.Z.; writing—review & editing, W.Y., J.Z. and Q.L.; supervision, Q.L. and W.H.S.; project administration, Q.L. and W.H.S. All authors have read and agreed to the published version of the manuscript.

Funding

This research was supported in part by National Natural Science Foundation of China (grant numbers 51737005, 52127812 and 51929701).

Data Availability Statement

Not applicable.

Conflicts of Interest

The authors declare no conflict of interest. The funders had no role in the design of the study; in the collection, analyses or interpretation of data; in the writing of the manuscript or in the decision to publish the results.

References

  1. Miki, M.; Miki, T.; Wada, A.; Asakawa, A.; Asuka, Y.; Honjo, N. Observation of Lightning Flashes to Wind Turbines. In Proceedings of the 2010 30th International Conference on Lightning Protection (ICLP), Cagliari, Italy, 13–17 September 2010; pp. 1–7. [Google Scholar] [CrossRef]
  2. Ishii, M.; Saito, M.; Natsuno, D.; Sugita, A. Lightning Incidence on Wind Turbines in Winter. In Proceedings of the 2014 International Conference on Lightning Protection (ICLP), Shanghai, China, 11–18 October 2014; pp. 1734–1738. [Google Scholar] [CrossRef]
  3. Montanyà, J.; van der Velde, O.; Williams, E.R. Lightning Discharges Produced by Wind Turbines. J. Geophys. Res. Atmos. 2014, 119, 1455–1462. [Google Scholar] [CrossRef]
  4. Gu, J.; Huang, S.; Fu, Y.; Chen, W.; Cheng, D.; Shi, W.; Fu, Z.; Pei, Z.; Fan, X.; He, T. Morphological Characteristics of Streamer Region for Long Air Gap Positive Discharge. J. Phys. D Appl. Phys. 2020, 54, 025205. [Google Scholar] [CrossRef]
  5. Alonso, M.A.; Irastorza, D.C. Dynamic Wind Turbine Lightning Protection Behaviour under Storm Conditions. In Proceedings of the 29th International Conference on Lightning Protection (ICLP2008), Uppsala, Sweden, 23–26 June 2008; pp. 9a-7-1–9a-7-6. [Google Scholar]
  6. Wang, Y.; Qu, L.; Si, T.; Ni, Y.; Xu, J.; Wen, X. Experimental Study of Rotating Wind Turbine Breakdown Characteristics in Large Scale Air Gaps. Plasma Sci. Technol. 2017, 19, 064016. [Google Scholar] [CrossRef]
  7. Qu, L.; Wang, Y.; Liu, G.; Liao, M.; Cai, H.; Zhang, T.; Deng, Y.; Wen, X. Simulation Study on Positive Corona Discharge of Receptors on Rotating Wind Turbine Blade Tips under Thundercloud Electric Fields. Energies 2019, 12, 4696. [Google Scholar] [CrossRef] [Green Version]
  8. Xiao, F.; Zhang, B.; Mo, J.; He, J. Calculation of 3-D Ion-Flow Field at the Crossing of HVdc Transmission Lines by Method of Characteristics. IEEE Trans. Power Deliv. 2018, 33, 1611–1619. [Google Scholar] [CrossRef]
  9. Xiao, F.; Zhang, B.; Liu, Z. Calculation of Accumulated Charge on Surface of Insulated House Near DC Transmission Lines by Method of Characteristics. IEEE Trans. Magn. 2019, 55, 7201405. [Google Scholar] [CrossRef]
  10. Berendt, A.; Budnarowska, M.; Mizeraczyk, J. DC Negative Corona Discharge Characteristics in Air Flowing Transversely and Longitudinally through a Needle-Plate Electrode Gap. J. Electrost. 2018, 92, 24–30. [Google Scholar] [CrossRef]
  11. Li, X.; Cai, L.; Xu, X.; Wan, Z.; Ma, X.; Liu, Y. Analysis on Corona Discharge Electrical Characteristics of Wind Turbine Blades. Int. J. Appl. Electromagn. Mech. 2019, 60, 91–101. [Google Scholar] [CrossRef]
  12. Warner, T.A. Upward Leader Development from Tall Towers in Response to Downward Stepped Leaders. In Proceedings of the 2010 30th International Conference on Lightning Protection (ICLP), Cagliari, Italy, 13–17 September 2010; pp. 1–4. [Google Scholar] [CrossRef]
  13. Ma, Y.; Zhang, L.; Yan, J.; Guo, Z.; Li, Q.; Fang, Z.; Siew, W.H. Inception Mechanism of Lightning Upward Leader From the Wind Turbine Blade and a Proposed Critical Length Criterion. Proc. CSEE 2016, 36, 5975–5982. [Google Scholar]
  14. Jiang, R.; Lyu, W.; Wu, B.; Qi, Q.; Ma, Y.; Su, Z.; Wu, S.; Xie, Z.; Tan, Y. Simulation of Cloud-to-Ground Lightning Strikes to Structures Based on an Improved Stochastic Lightning Model. J. Atmos. Solar-Terr. Phys. 2020, 203, 105274. [Google Scholar] [CrossRef]
  15. Becerra, M. Glow Corona Generation and Streamer Inception at the Tip of Grounded Objects during Thunderstorms: Revisited. J. Phys. D Appl. Phys. 2013, 46, 135205. [Google Scholar] [CrossRef]
  16. Qie, X.; Soula, S.; Chauzy, S. Influence of Ion Attachment on the Vertical Distribution of the Electric Field and Charge Density below a Thunderstorm. Ann. Geophys. 1994, 12, 1218–1228. [Google Scholar] [CrossRef]
  17. Aleksandrov, N.L.; Bazelyan, E.M.; Drabkin, M.M.; Carpenter, R.B.; Raizer, Y.P. Corona Discharge at the Tip of a Tall Object in the Electric Field of a Thundercloud. Plasma Phys. Rep. 2002, 28, 953–964. [Google Scholar] [CrossRef]
  18. Yu, W.; Li, Q.; Zhao, J.; Li, H.; Siew, W.H. Thundercloud-Induced Spatial Ion Flow in the Neighborhood of Rotating Wind Turbine and Impact Mechanism on Corona Inception. IEEE Trans. Plasma Sci. 2021, 49, 2925–2935. [Google Scholar] [CrossRef]
  19. Peek, F.W. Dielectric Phenomena in High Voltage Engineering; McGraw-Hill Book Company: New York, NY, USA, 1929. [Google Scholar]
  20. Niemeyer, L.; Pietronero, L.; Wiesmann, H.J. Fractal Dimension of Dielectric Breakdown. Phys. Rev. Lett. 1984, 52, 1033–1036. [Google Scholar] [CrossRef]
  21. Wiesmann, H.J.; Zeller, H.R. A Fractal Model of Dielectric Breakdown and Prebreakdown in Solid Dielectrics. J. Appl. Phys. 1986, 60, 1770–1773. [Google Scholar] [CrossRef]
  22. Cooray, V.; Rakov, V.; Theethayi, N. The Lightning Striking Distance—Revisited. J. Electrost. 2007, 65, 296–306. [Google Scholar] [CrossRef]
  23. Rahiminejad, A.; Vahidi, B.; He, J. A Fractal-Based Stepped Downward Leader Model Including Branched Channel Charge Distribution and Branch Fading. Electr. Power Syst. Res. 2019, 176, 105940. [Google Scholar] [CrossRef]
  24. Tsonis, A.A.; Elsner, J.B. Fractal Characterization and Simulation of Lightning. Contrib. Atmos. Phys. 1987, 60, 187–192. [Google Scholar]
  25. Becerra, M.; Cooray, V. A Self-Consistent Upward Leader Propagation Model. J. Phys. D Appl. Phys. 2006, 39, 3708. [Google Scholar] [CrossRef] [Green Version]
  26. Becerra, M.; Cooray, V. Time Dependent Evaluation of the Lightning Upward Connecting Leader Inception. J. Phys. D Appl. Phys. 2006, 39, 4695. [Google Scholar] [CrossRef]
Figure 1. Schematic diagram of calculation domain.
Machines 10 00115 g001
Figure 2. Experiment setup of corona charge measurement on scaled rotating wind turbine.
Machines 10 00115 g002
Figure 3. Measurement result of repetitive corona discharge on blade tip of static wind turbine.
Machines 10 00115 g003
Figure 4. Measurement results of the corona current at the blade tip of rotating wind turbine.
Machines 10 00115 g004
Figure 5. Results comparison of experiment and simulation on corona charge.
Machines 10 00115 g005
Figure 6. Distortionary effect of space charge on the electric field near the blade tip: (a) positive ions density, (b) electric field near static blade tip.
Machines 10 00115 g006
Figure 7. Periodic variation of E-field on blade tip of rotational wind turbine.
Machines 10 00115 g007
Figure 8. Cross section of the calculation model.
Machines 10 00115 g008
Figure 9. The spatial–temporal distribution of positive ions near rotating blade.
Machines 10 00115 g009
Figure 10. The characteristics of E-field near rotating blade: (a) the potential contour without considering space charge, (b) the potential contour with space charge, (c) the E-field with the influence of space charge.
Machines 10 00115 g010
Figure 11. Comparison of positive ion distributions.
Machines 10 00115 g011
Figure 12. E-field strength of blade tip with rotation angle and different speeds.
Machines 10 00115 g012
Figure 13. Leader development of dielectric breakdown model.
Machines 10 00115 g013
Figure 14. The shunt process of lightning current in branches.
Machines 10 00115 g014
Figure 15. Three-dimensional stochastic development simulation results of a typical lightning downward leader.
Machines 10 00115 g015
Figure 16. E-field lines near blade tip and the initiation direction of upward leader which is: (a) on the back side of blade rotation, (b) on the front side of blade rotation, (c) possibly on both sides which need to be determined by E-field strength.
Machines 10 00115 g016
Figure 17. Typical cases of upward leader initiation on blade tip: (a) and (c) upward leader initiates on the back side of blade rotation, (b) and (d) upward leader initiates on the front side of blade rotation.
Machines 10 00115 g017
Publisher’s Note: MDPI stays neutral with regard to jurisdictional claims in published maps and institutional affiliations.

