Article

Early Fault Warning Method of Wind Turbine Main Transmission System Based on SCADA and CMS Data

1
School of Mechanical Engineering, Zhejiang Sci-Tech University, Hangzhou 310018, China
2
Zhejiang Province’s Key Laboratory of Reliability Technology for Mechanical and Electronic Product, Hangzhou 310018, China
3
School of Mechanical Engineering, Hunan University of Science and Technology, Xiangtan 411201, China
*
Author to whom correspondence should be addressed.
Machines 2022, 10(11), 1018; https://doi.org/10.3390/machines10111018
Submission received: 10 October 2022 / Revised: 28 October 2022 / Accepted: 28 October 2022 / Published: 2 November 2022
(This article belongs to the Special Issue Wind Turbine Technologies)

Abstract

:
The main transmission system of wind turbines is a multi-component coupling system, and its operational state is complex and varied. These lead to frequent false alarms and missed alarms in existing monitoring systems. To accurately obtain the operational state of the main transmission system and detect its abnormal operation, an early fault warning method for the main transmission system based on SCADA and CMS data is proposed. Firstly, the SCADA and CMS feature parameters relevant to the operating status of the main transmission system are selected by two different methods separately, and the correlation mechanism between the feature parameters and the operating characteristics of the main transmission system is further analyzed. Secondly, the Long Short-Term Memory (LSTM) network-based prediction model of the main transmission system operating parameters is established, in which SCADA and CMS feature parameters are fused as the input feature vectors. Then, the predicted residuals of the state evaluation parameters are used as the operational state evaluation index. The early fault warning model is established by Analytic Hierarchy Process (AHP) and Kernel Density Estimation (KDE). Finally, a case study is used to verify the correct performance of the proposed method. The results show that this method can realize early warning functions 73 h earlier than the existing SCADA system. The method can provide a theoretical basis for the safe operation and condition-based maintenance of wind turbines.

1. Introduction

As a renewable energy source, wind energy has broad development prospects [1,2,3]. With the rapid development of the wind power industry, how to ensure the safe and reliable operation of wind turbines is a great challenge. Since the wind turbine is a kind of device with a complex structure and mutual coupling of multiple components, various faults will occur in service. According to the statistics data shown in Figure 1 [4], the failure rate of the electrical system is the highest, but its maintenance is simple. In contrast, the maintenance time of the main transmission system is the longest, and the maintenance cost is very high. According to relevant statistical analysis, for onshore wind turbines with a service life of 20 years, the maintenance cost accounts for 10–15% of the total revenue of the wind farm, while for offshore wind farms, the proportion is as high as 20–25% [5]. The main transmission system, including blades, hub, axis, bearings, gearbox, and generator, plays an important role in energy transmission, and its safety and reliability are the keys to ensuring the normal operation of the wind turbine. Therefore, it is of great significance to monitor and evaluate the operational state of the main transmission system, find out the abnormality and deterioration trend in advance, and carry out condition-based maintenance. It can ensure the safe and reliable operation of wind turbines and reduce operation and maintenance costs.
To address the safety and management issues in the operation of wind turbines, most wind turbines in service are equipped with SCADA systems and CMS. SCADA and CMS systems mainly provide real-time monitoring, event alarm, and fault report output. However, it lacks the mining and analysis of historical data. Traditional fault maintenance and routine maintenance are both regular maintenance modes which have serious defects in dealing with changing conditions. They cannot effectively make full use of fault diagnosis and prediction data. The timeliness and effectiveness of maintenance are low, and the degree of intelligence is not enough. Therefore, mining and extracting the feature quantities related to the operational state of the main transmission system from SCADA and CMS data and establishing an intelligent monitoring and evaluation model are the keys to ensuring the safe and reliable operation of wind turbines.
Some researchers have conducted related research on the monitoring and evaluation of wind turbine operating conditions based on SCADA and CMS data. David et al. [6] implemented wind turbine gearbox condition monitoring from the perspective of SCADA data distribution based on the distribution of probability density function after data normalization. Corley et al. [7] established a gearbox thermal network model based on heat conduction theory to successfully monitor gearbox failures. Pandit et al. [8] proposed a nonparametric modeling method based on SCADA data for wind turbine power curve estimation, which better meets the condition monitoring needs of later generation units. Dai et al. [9] processed the wind speed correction and used Gaussian fitting of the corrected wind power curve to obtain a more accurate wind turbine performance index. Dao et al. [10] conducted two-stage cointegration analysis on SCADA data and successfully monitored gearbox faults. Chen et al. [11] used a hierarchical prediction method based on Gaussian process and principal component analysis, and the method has an accuracy rate of 79% for fault monitoring. Zhang Fan et al. [12] analyzed the relationship between SCADA data input/output parameters from a physical point of view, and proposed a calculation formula for the abnormal degree index of the operating state of wind turbines. Fu et al. [13], Zhao et al. [14], and Bangalore et al. [15] used CNN-LSTM, DAE, and NARX-ANN to predict and reconstruct SCADA target parameters, the prediction and reconstruction errors were used as indicators of wind turbine operation status, and the abnormal operation of the wind turbine was successfully monitored. Rezamand et al. [16] proposed a fault detection method based on a mixture of RPCA and wavelet probability distribution functions to achieve early fault monitoring of wind turbine blades. Jin et al. [17] successfully identified anomalies in wind turbine operation by constructing a Mahalanobis space as a reference space. In literature [18,19,20], the state monitoring model of wind turbines was established by LSTM-AE, SVM, and ACNN-Bi-LSTM, respectively, to complete abnormal monitoring of the operating state of wind turbines. Peng et al. [21] used the maximum average difference algorithm combined with CNN to evaluate the state of the wind turbine’s operational state.
Compared to the SCADA system, which comprehensively monitors the operating status of the wind turbines, the CMS is used to monitor the key components. It contains more precise operational status information. ZimrozandA et al. [22] and Pan et al. [23] used the analysis methods of PCA and CEEMDAN-KPCA, respectively, to realize the condition monitoring of the gearbox. Ogata et al. [24] proposed a time-frequency domain feature extraction method based on Fourier local autocorrelation (FLAC), which successfully detected faults that could not be detected by conventional methods. Li et al. [25] used the deep random forest fusion (DRFF) technique to fuse acoustic emission sensor signals with vibration signals, and verified that the method can accurately identify gearbox faults under 11 different operating conditions. Li et al. [26] successfully used the combined method of KPCA and Bi-LSTM for condition monitoring and evaluation of high-speed shaft bearings of wind turbines. In the literature [27], an abnormal monitoring method for the main bearing of the unit based on a small sample of unbalanced vibration data was proposed. Pu [28] proposed a deep enhanced fusion network (DEFN) for wind turbine gearbox fault diagnosis and proved that it has good fault diagnosis accuracy. Gomez [29] used the changing trend of wavelet packet transform energy before and during the occurrence of faults to identify the operating state of the gearboxes. Isham [30] decomposed the vibration signal of the wind turbine and used the limit learning machine for fault classification to successfully diagnose the gearbox fault.
As mentioned above, the existing operational state monitoring of the wind turbine main transmission system has made some progress. However, there are still limitations in the following aspects. (1) The main transmission system is a complex coupled system with multiple components and the operational state is complex and varied. However, most of the existing research methods use a single index to evaluate its operational state. The influence of multiple components coupling on the final monitoring results is ignored, therefore the results are not accurate in evaluating the operational state of the main transmission system. For its condition monitoring and evaluation, we should consider multiple dimensions. (2) In the current research, SCADA or CMS data are mostly used to monitor the operational state of wind turbines, respectively, which will be difficult to make full use of their advantages. The curves of active power, spindle rotational speed of wind turbine, and vibration acceleration of the measuring point on the 2MW wind turbine gearbox on a certain day are shown in Figure 2. The data in Figure 2a were collected using a vibration data acquisition system at the wind farm by the authors, and the data in Figure 2b,c are from the SCADA system. It can be seen that the trend of SCADA and CMS monitoring data is highly consistent. SCADA has more information about the state of the entire wind turbine, while CMS vibration data contain more precise condition information. Most existing methods analyze two types of data separately, ignoring the strong correlations between the data. As a result, the characteristics related to the operational state of the wind turbine main transmission system cannot be fully and effectively obtained, and the final monitoring and evaluation results are inaccurate.
To detect the abnormality and deterioration trend of the main transmission system in advance, improve the operation reliability, and reduce the maintenance cost, in this paper, an early fault warning method of the wind turbine main transmission system based on SCADA and CMS data is proposed. SCADA and CMS data are fully mined to obtain feature information related to the operational state of the main transmission system. The deep learning model is used to fuse the data feature of SCADA and CMS, and the early fault warning model of the operational state of the main transmission system is established. The effectiveness of this method is verified by the test data of wind turbines in wind farms. The main contributions of this paper are as follows:
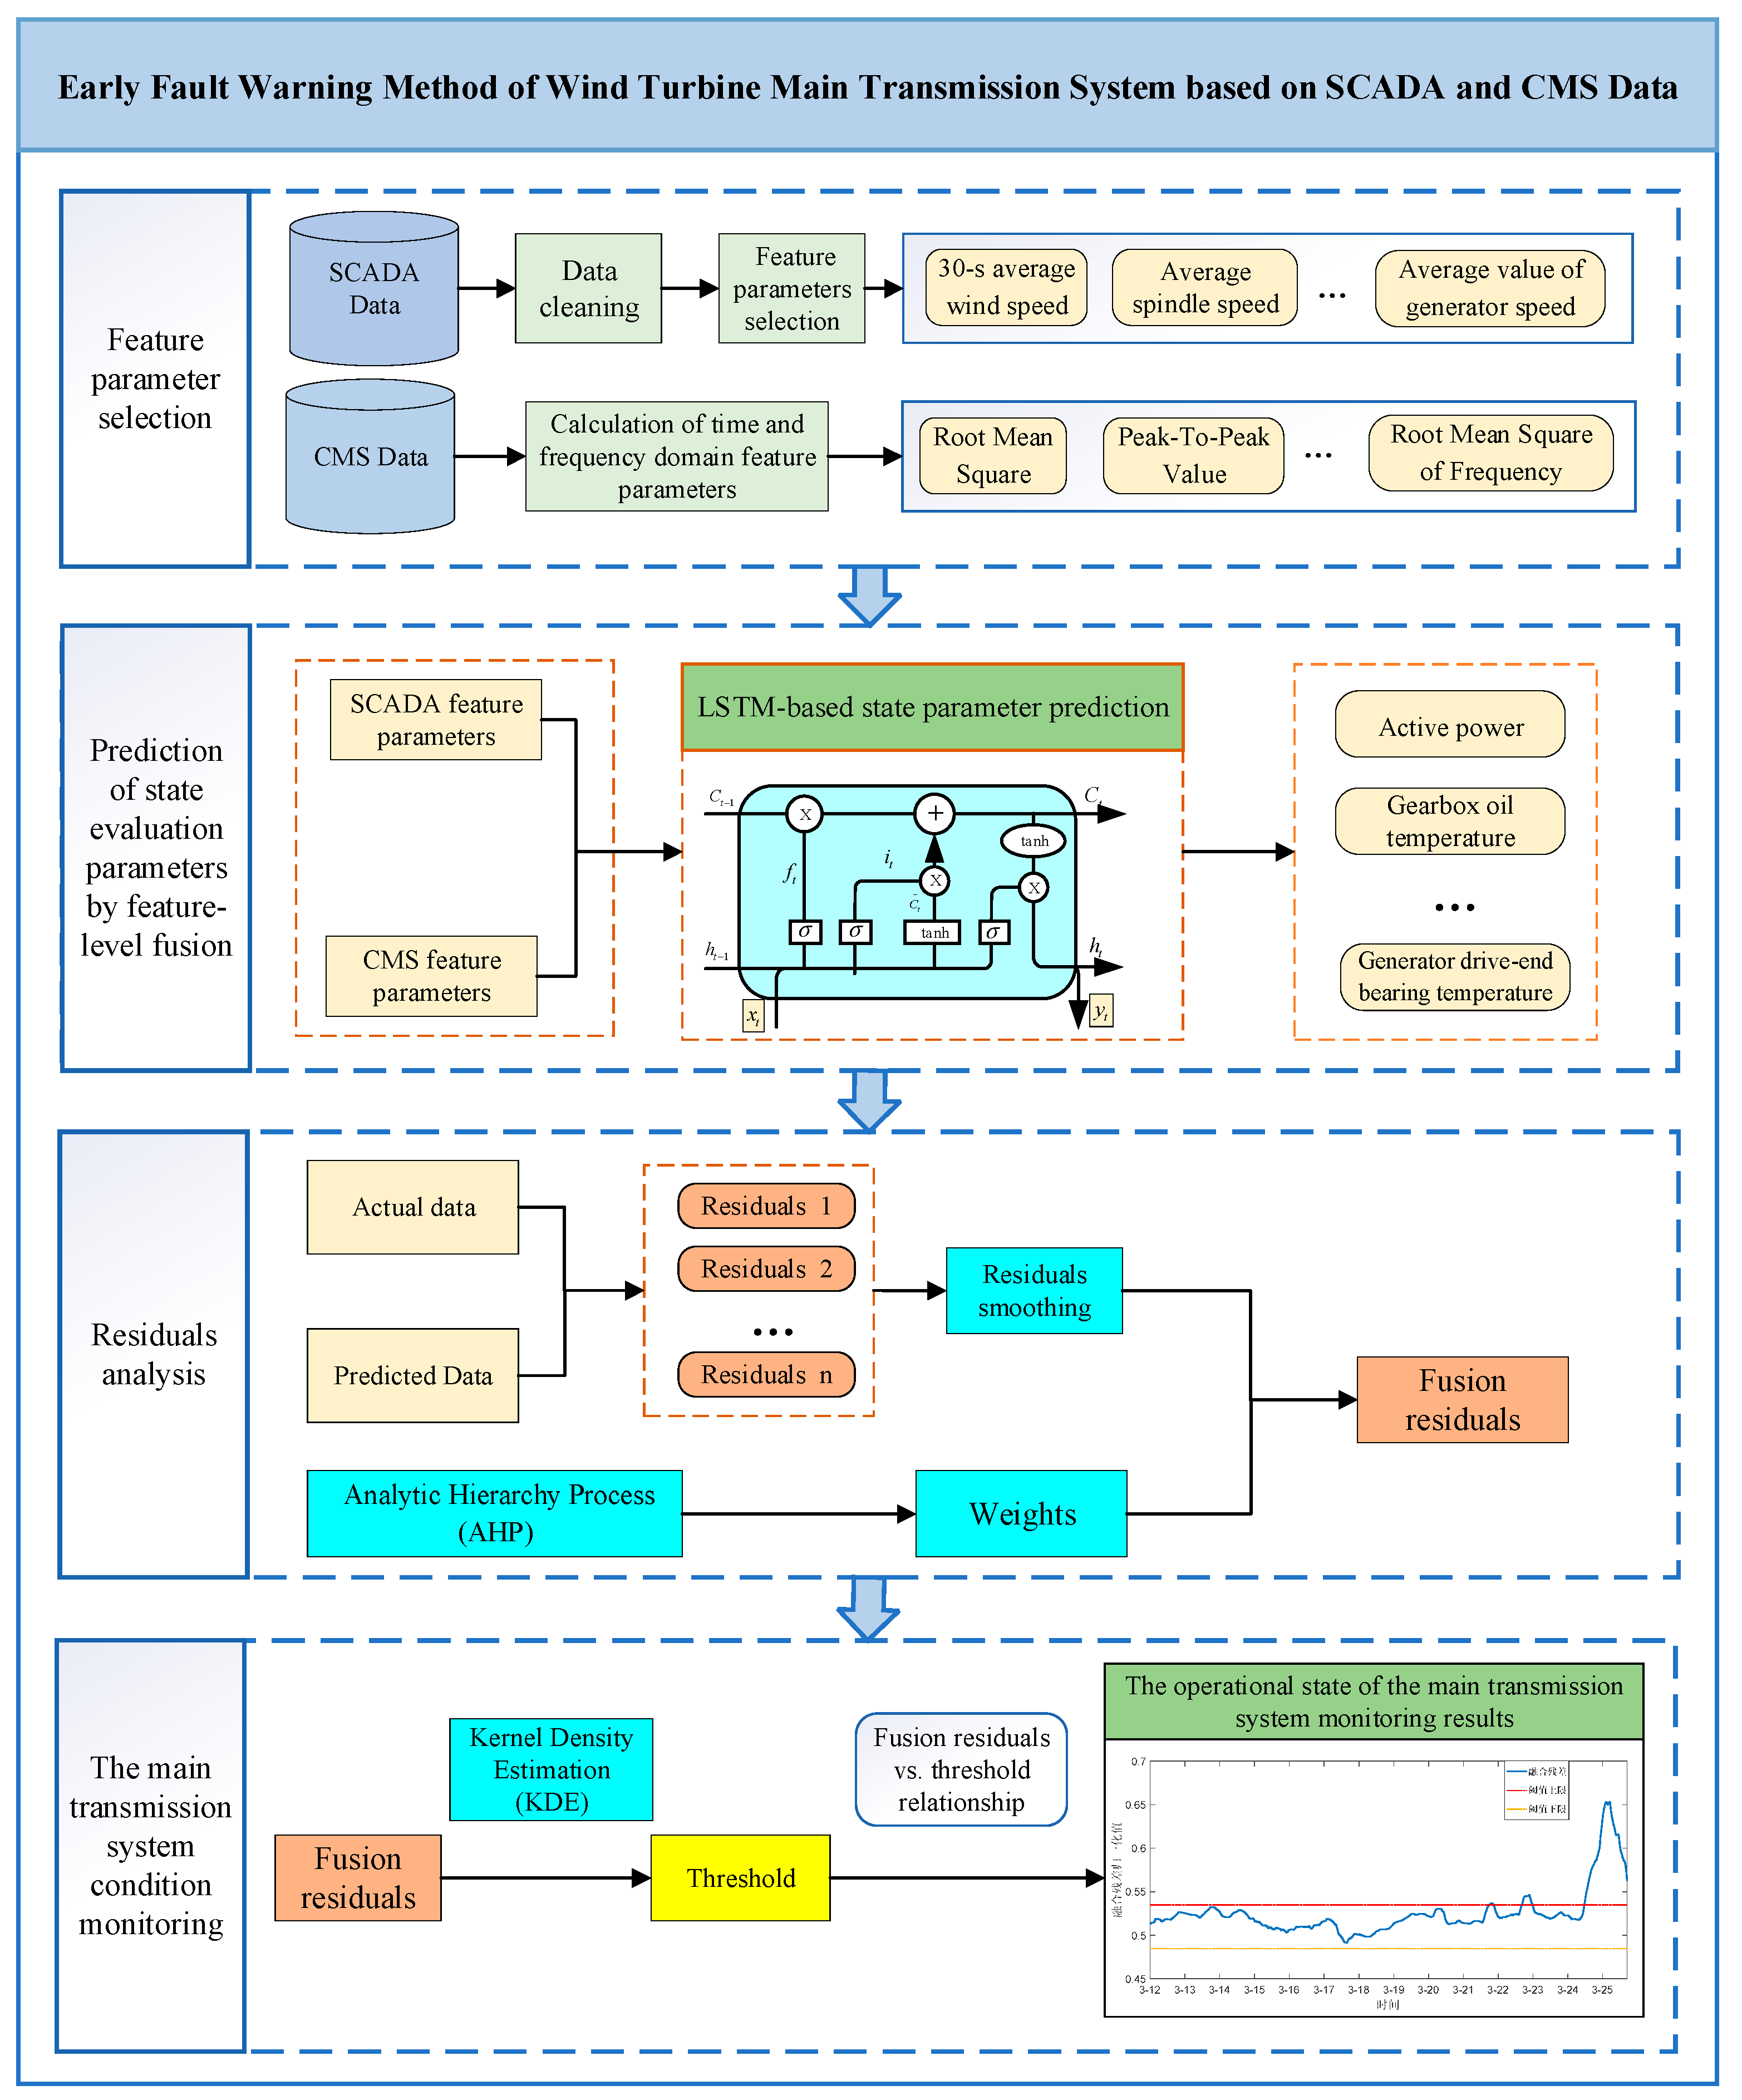
  • By fully exploiting the advantages of SCADA and CMS, an early fault warning method for the wind turbine main transmission system is proposed.
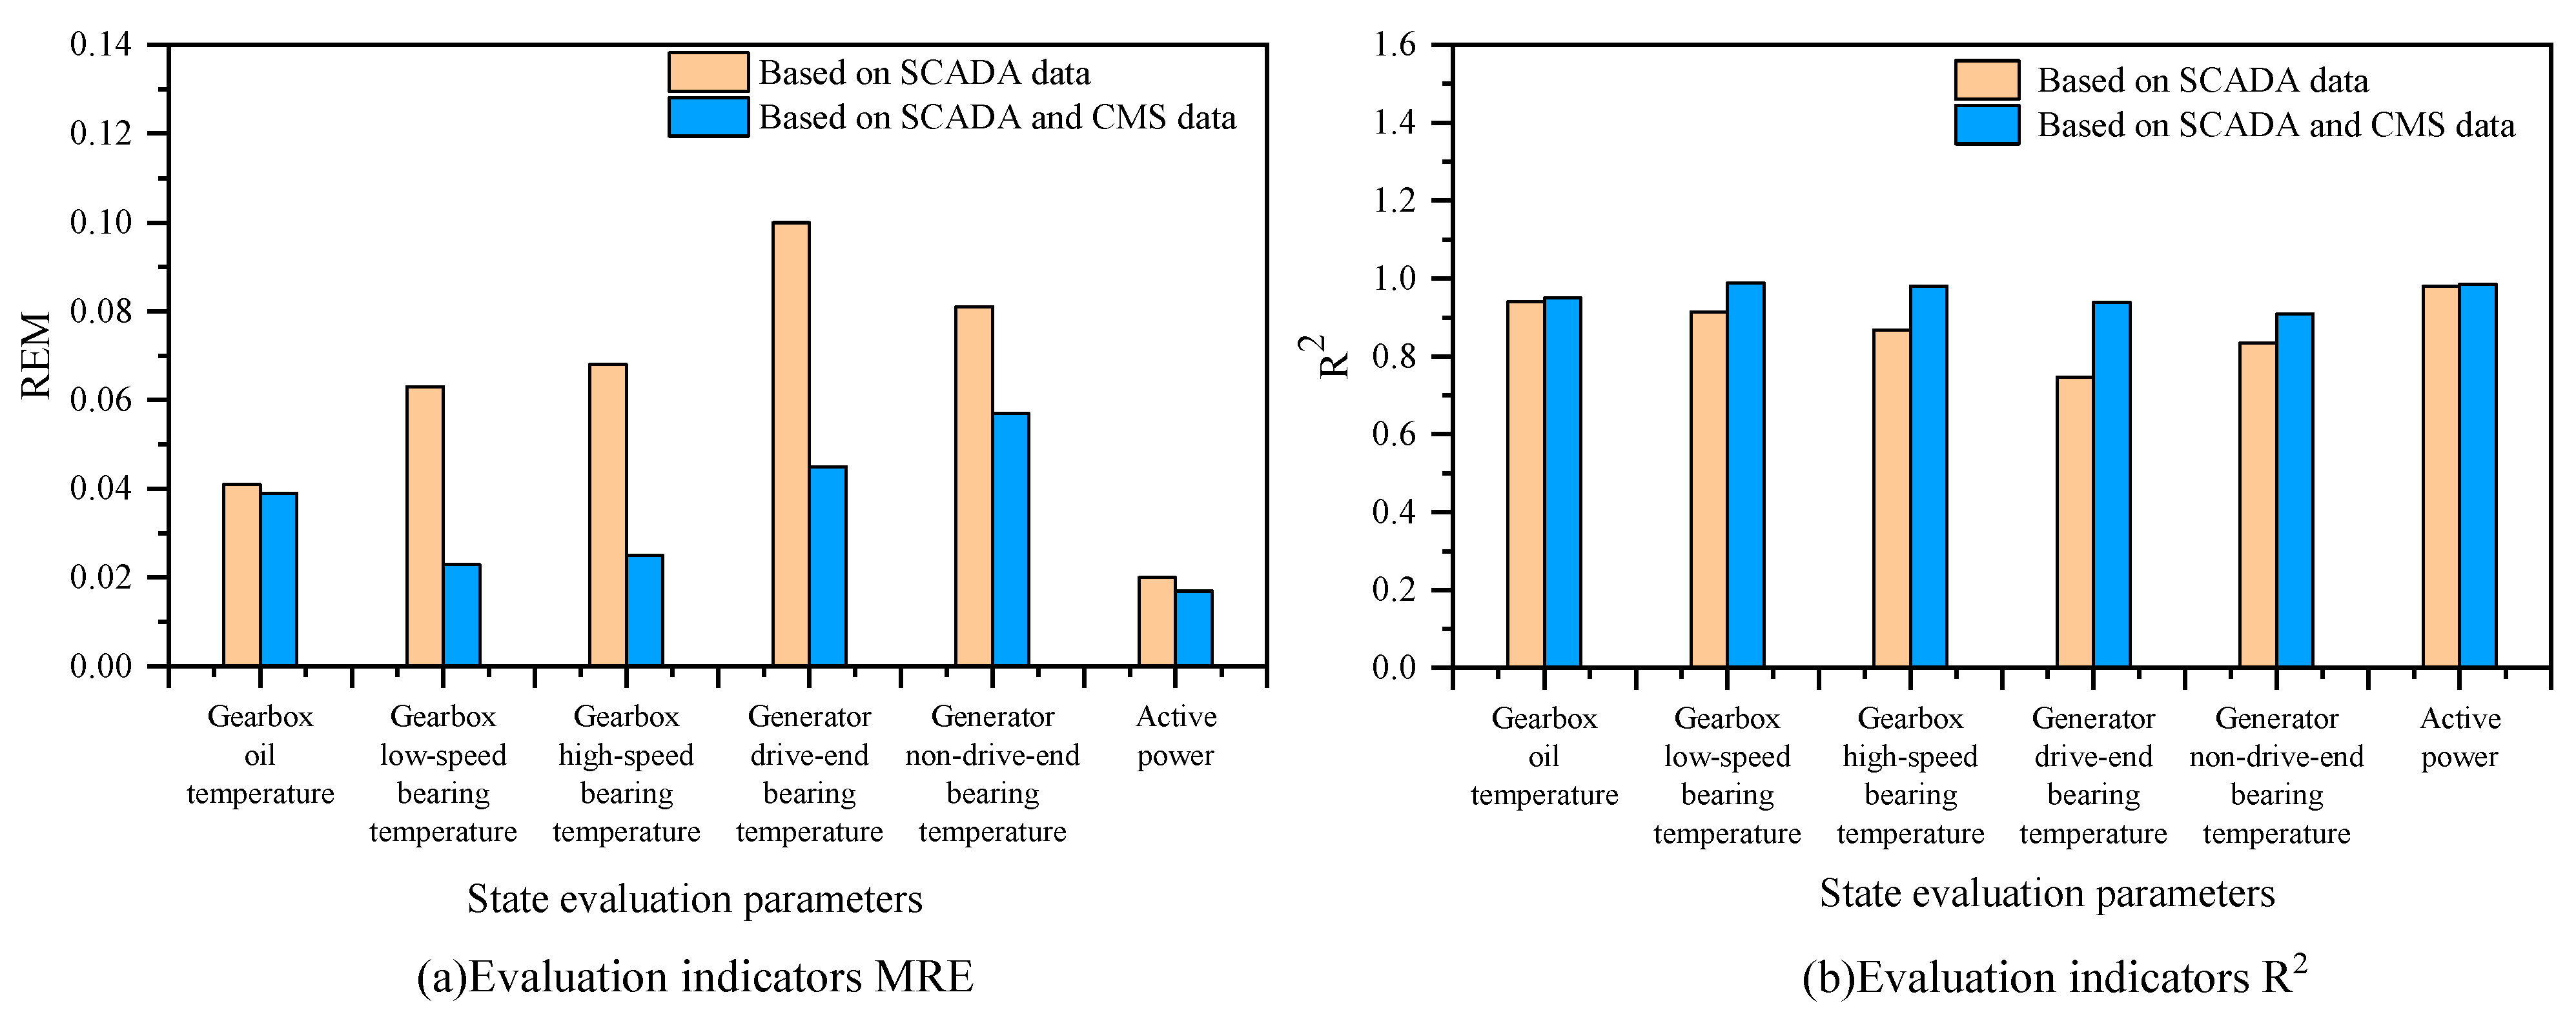
  • Based on SCADA and CMS data, the prediction model of main transmission system condition evaluation parameters with feature-level fusion is established, which has better generalization performance and prediction accuracy.
  • A multi-residual fusion method was used to evaluate the main transmission system condition, which will solve the difficulty of accurately monitoring and characterizing of the operational state by a single indicator.
The remaining parts of the paper are organized as follows. In Section 2, there are differences in data acquisition and storage between SCADA and CMS, so different ways are used to select the characteristic parameters related to the main transmission system. The prediction model of state evaluation parameters for the main transmission system is established by fusing feature parameters of SCADA and CMS in Section 3. In Section 4, the quantization algorithm of the fusion residuals is determined, and the early fault warning model of the main transmission system is established. A case study is used to validate the proposed method in Section 5, and the conclusions are given in Section 6.
The general flowchart of the main transmission system condition monitoring is shown in Figure 3.

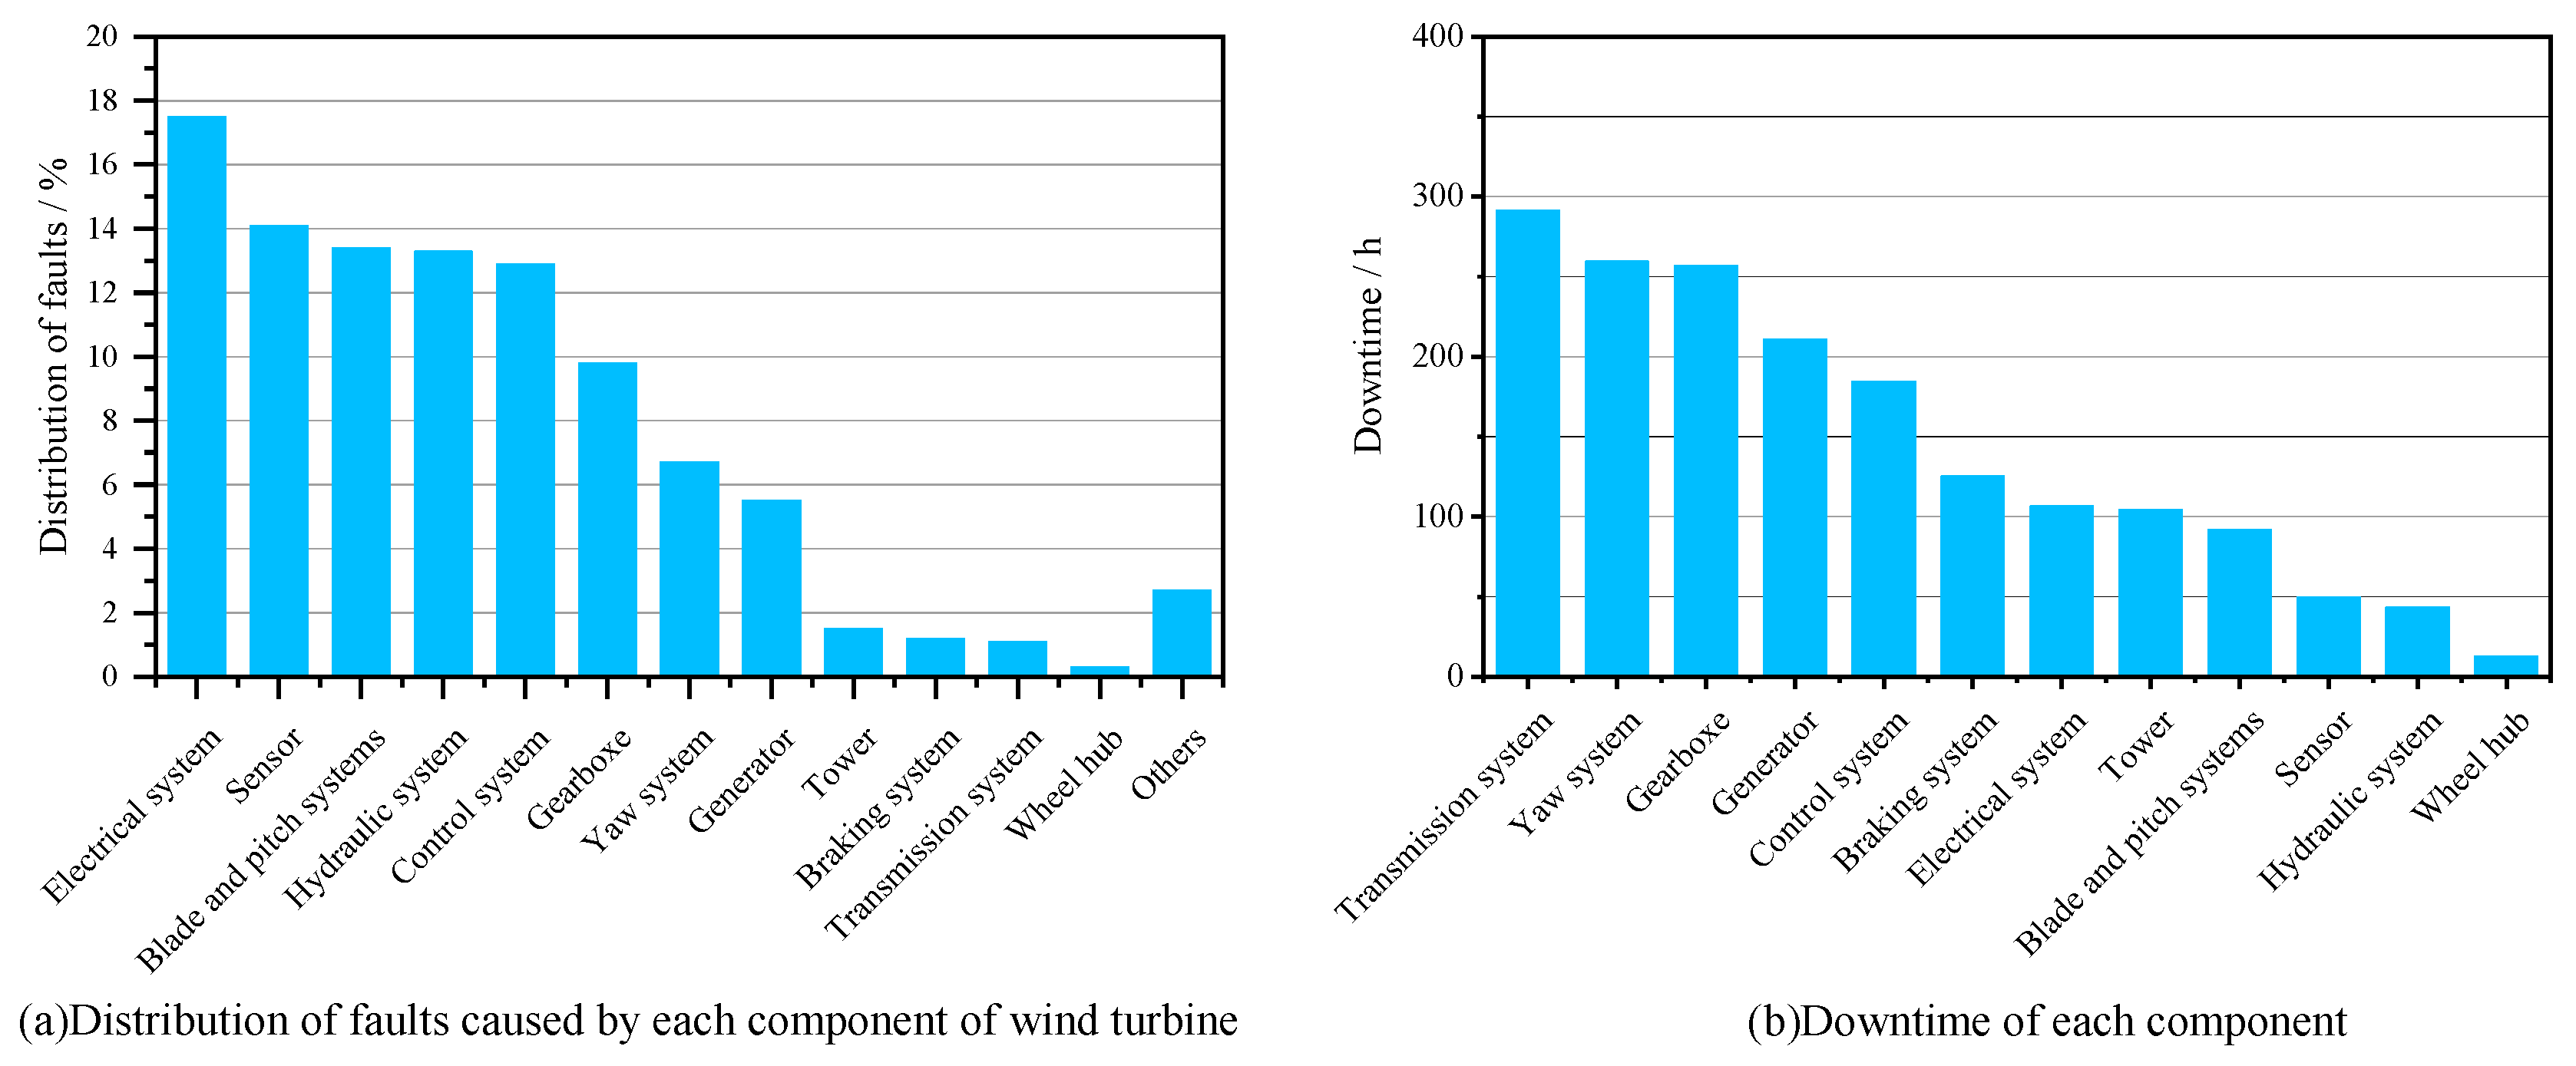
2. Parameters for Early Fault Warning

2.1. State Evaluation Parameters

The main transmission system consists mainly of hubs, spindles, bearings, gearboxes, and generator sets. The SCADA system contains a number of parameters related to the operating status of these components. Any abnormality of one state parameter may mean its failure. In order to find fault earlier and more accurately, it is necessary to select several state evaluation parameters to reflect the operational state from different angles.
During the service of the wind turbine, the loads acting on the blades are very complex (aerodynamic load, gravity load, inertial load, operating load, etc.). Bearing, gearbox, and generator are the main failure parts of the main transmission system because they carry most of the load [31,32].
The heat is produced by the gears during operation, and the heat flux is calculated by [33]:
q c ( t ) = γ f c ( t ) σ c ( t ) V 12 ( t )
where γ is the coefficient of conversion from friction energy to heat energy, generally taken as 0.9~0.95, f c ( t ) is the tooth surface friction coefficient, σ c ( t ) is the normal contact stress of the meshing surface, and V 12 ( t ) is the dynamic relative sliding velocity of the two meshing tooth surfaces, taking into account the system vibration.
For a bearing, its frictional heat flux is calculated as:
q ( t ) = π n 30 × 10 3 A × [ 10 7 f 0 ( v 0 n ) 2 3 d m 3 + f 1 F β d m ]
where n is the rotational speed, f 0 is the coefficient related to the type of bearing and its lubrication method, taking the value of 2, v 0 is the lubricant viscosity, f 1 is the coefficient related to the bearing structure and load, F β is the bearing force of the equivalent load, and d m is the bearing knuckle diameter.
From the above analysis, due to the interaction of various excitations in the abnormal operation process, it will inevitably affect the operation of gears and bearings and load-bearing forms. At the same time, the fault will result in too small clearance, insufficient lubrication, static and dynamic imbalance, etc. These will lead to changes in f c ( t ) , F β and other parameters that will significantly affect the heat flux of gears and bearings. These will further result in rapid changes in temperature over a short period of time.
For permanent magnet synchronous generators, the power generated by a generator can be calculated as [34]:
P = 3 2 p [ Ψ f i s q + ( L s d L s q ) i s d i s q ] ω
where, p is the number of pole pairs, Ψ f is the permanent magnet magnetic field, i s d and i s q are d axis and q axis components of stator currents, respectively, and L s d and L s q are d axis and q axis inductances of the stator, respectively. Obviously, abnormal operation of the generator (like demagnetization of permanent magnets, bearing failure resulting in a decrease in generator speed) will lead to changes in parameters such as Ψ f   i s d   i s q   L s d   L s q . These will affect the power of the generator [35].
Therefore, the abnormal changes of temperature and active power can effectively reflect the early failure of the main transmission system. Accordingly, six parameters are selected as the state evaluation parameters from SCADA data, which are active power ( P ) , gearbox high-speed bearing temperature ( T g ) , gearbox low-speed bearing temperature ( T l ) , gearbox oil temperature ( T g o ) , generator drive-end bearing temperature ( T q ) , and generator non-drive-end bearing temperature ( T f q ) .

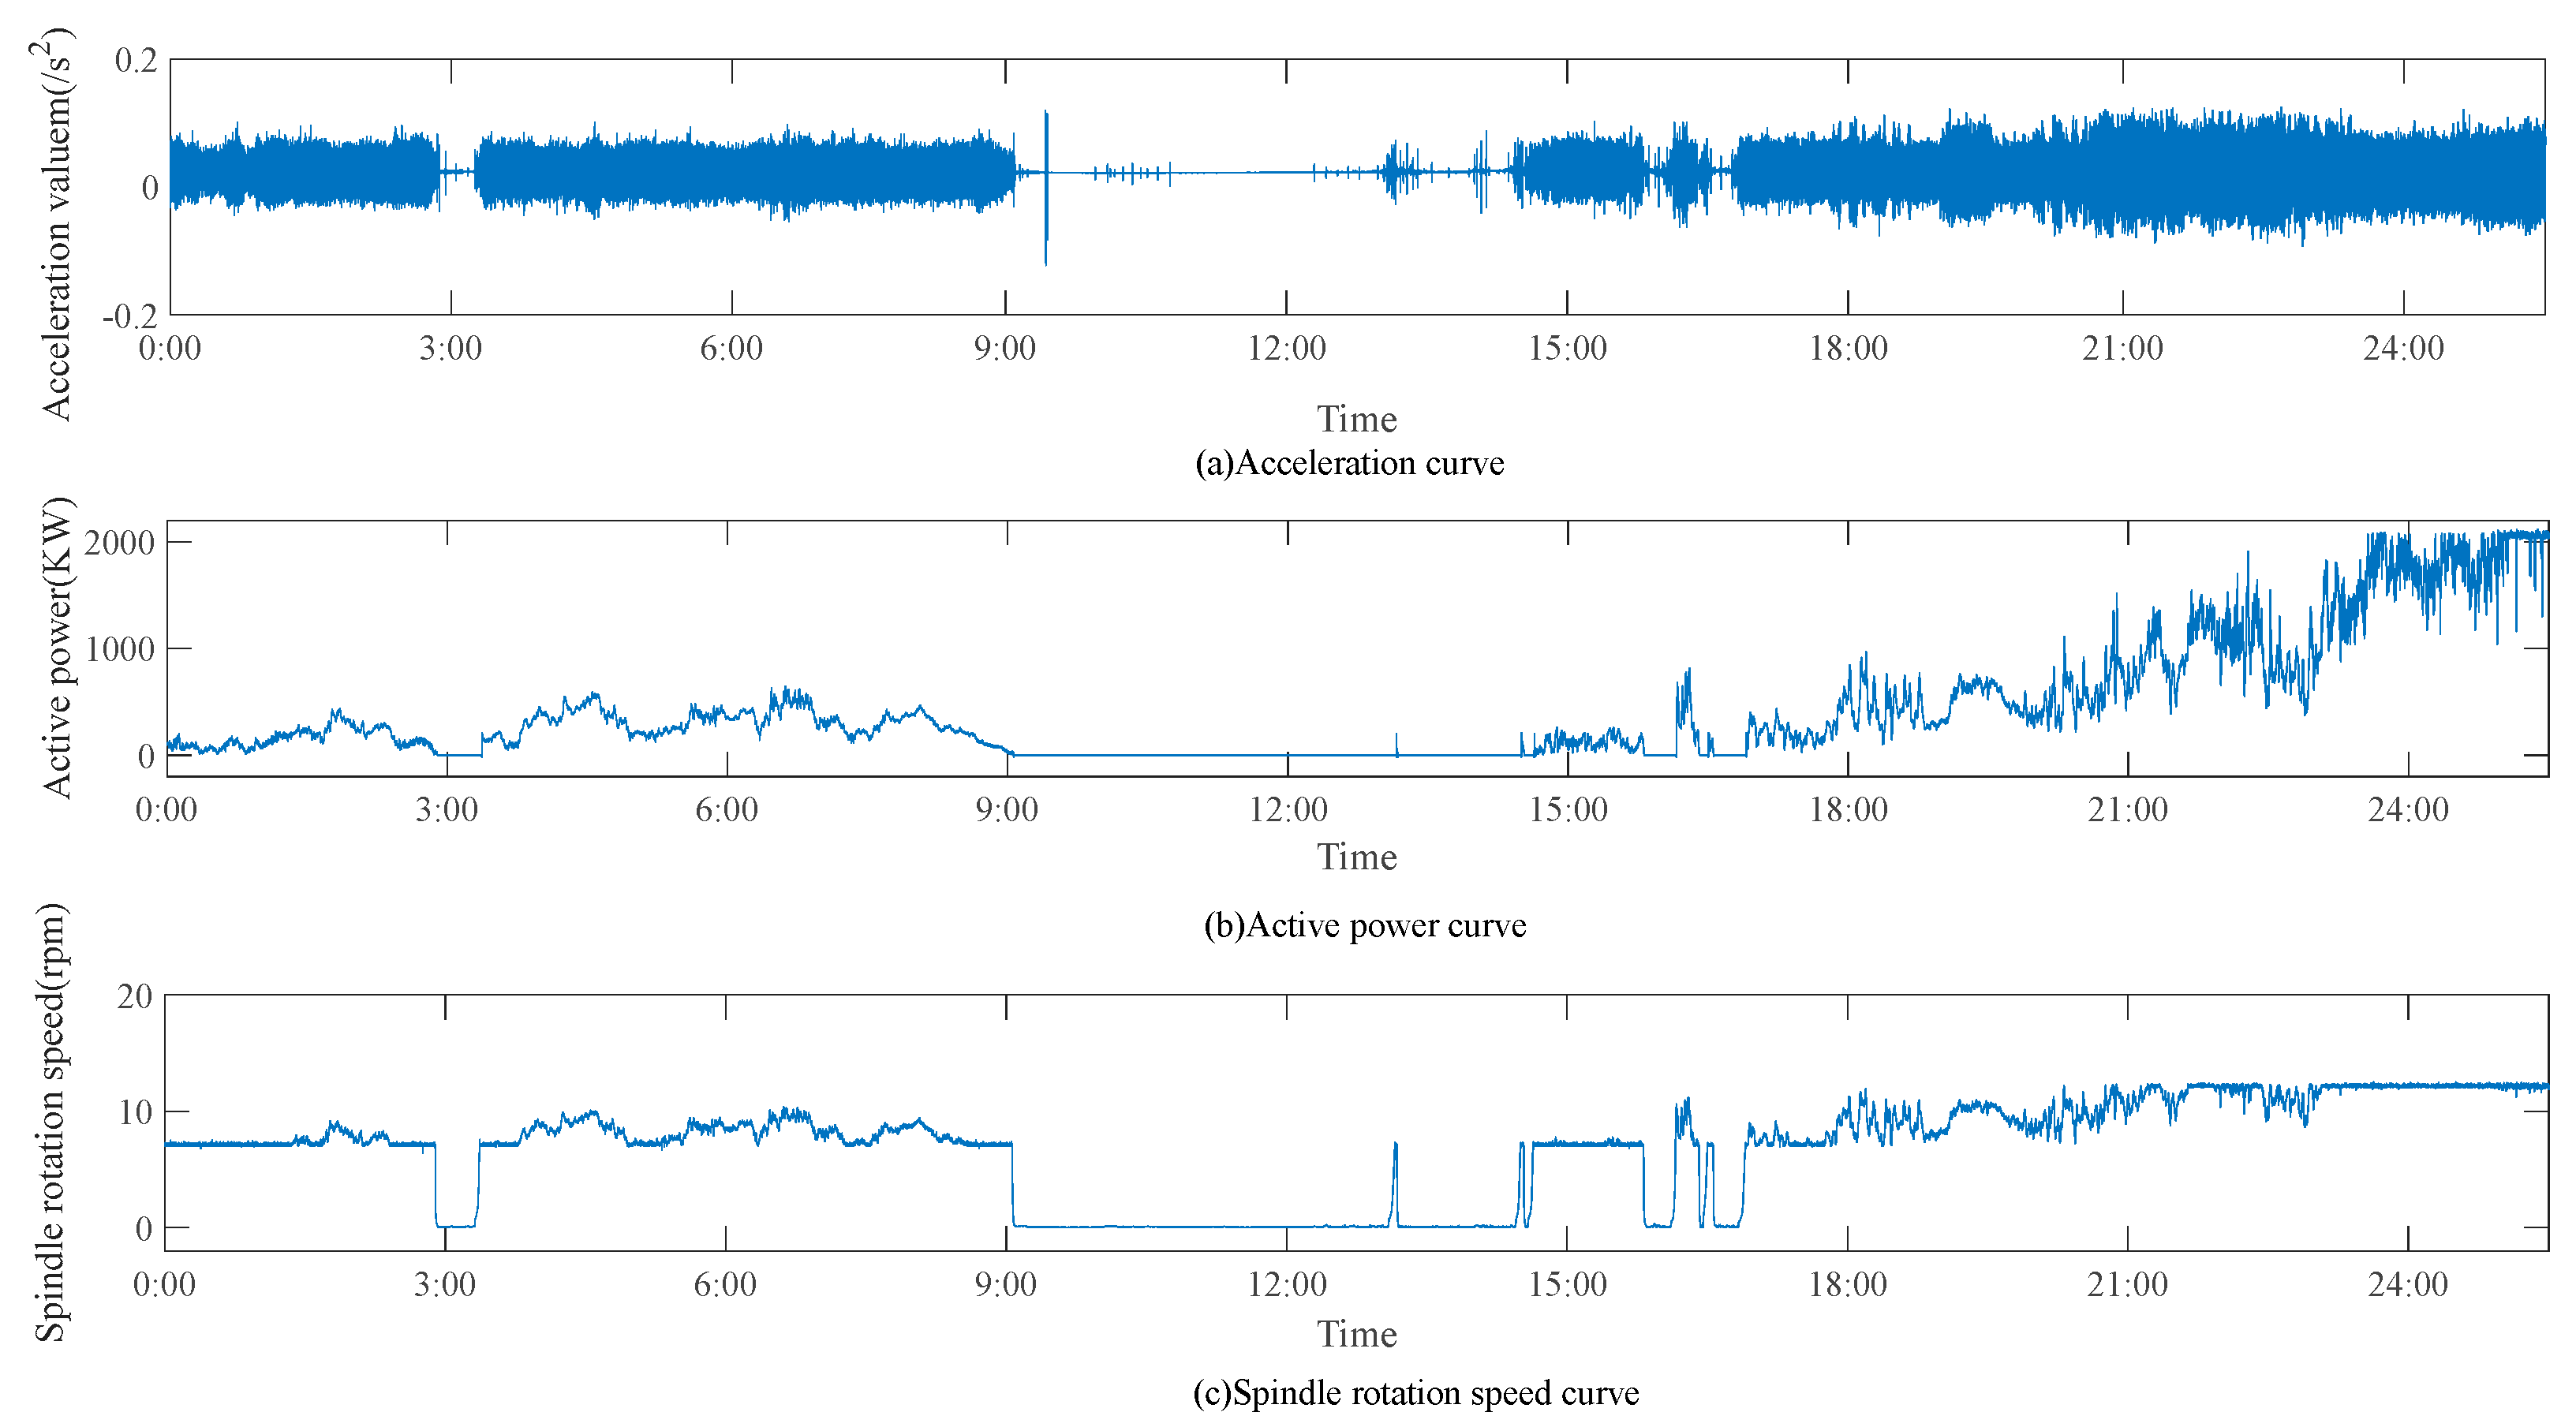
2.2. Feature Parameter Selection

Considering that not all monitoring variables in SCADA and CMS data are related to the failure of the main transmission system, when more feature parameters are selected as the input of the prediction model, it will not only affect the calculation speed, but also the final prediction results will not match the actual situation due to the large redundant information among variables. These will lead to inaccurate monitoring of the operational state. To realize the early fault warning, the feature parameters related to its operational state must be selected as input of the prediction model first. Due to the difference in monitoring data between SCADA and CMS systems, the feature parameters are selected in two different ways.
(1)
Selection of feature parameters from CMS
The CMS system is mainly used to monitor the vibration of the main transmission train. During the operation of the wind turbine, the main shaft and gearbox will generate rich vibration signals. It usually leads to more obvious changes in the time and frequency domain feature parameters of the vibration signal when the main transmission system of the wind turbine operates abnormally. Therefore, the magnitude and distribution of energy in the time domain signal waveform and spectrum can be calculated as CMS feature parameters [36]. We calculated common time domain and frequency domain features. Additionally, in order to select CMS feature parameters with strong correlation to the operational state, the maximum mutual information values (MIC) are used as the criteria for selecting the feature parameters.
The MIC is calculated as:
I ( X ; Y ) = p ( x , y ) log ( p ( x , y ) p ( x ) p ( y ) ) d x d y
MIC ( X , Y ) = max a b n k I ( X ; Y ) log min ( a , b )
where p ( x ) , p ( y ) is the probability density function, and p ( x , y ) is the joint probability density function, I ( X ; Y ) indicates the MIC in all meshing, a , b denotes the number of divisions of the lattice in the x , y direction of the two-dimensional space, n is the sample size, and k usually is set according to empirical values as 0.6. MIC takes values between [0,1], the closer to 1, the higher the correlation, and vice versa, the lower the correlation.
The results of the MIC values between the CMS feature parameters and the state evaluation parameters are shown in Table 1. We selected six-time domain feature parameters and four frequency domain feature parameters with the strongest correlation, as shown in Table 2.
Among these time and frequency domain feature parameters, the root mean square ( x r m s ) value and signal energy ( U f ) reflect vibration intensity and energy magnitude. Its value will be very large when the main transmission system is operating abnormally. The peak-to-peak value ( x p p ) reflects the amplitude of the shock vibration generated by the fault. The pulse factor ( I f ) and margin factor ( C L f ) are more sensitive to impulse faults and have an obvious increasing tread in the early stage of fault. Gravity of frequency ( F C ) and root mean square of frequency ( F R M S ) describe the position change of the main frequency band of the signal power spectrum, and the standard deviation of frequency ( F R M S F ) represents the dispersion degree of spectral energy.
(2)
Selection of feature parameters from SCADA
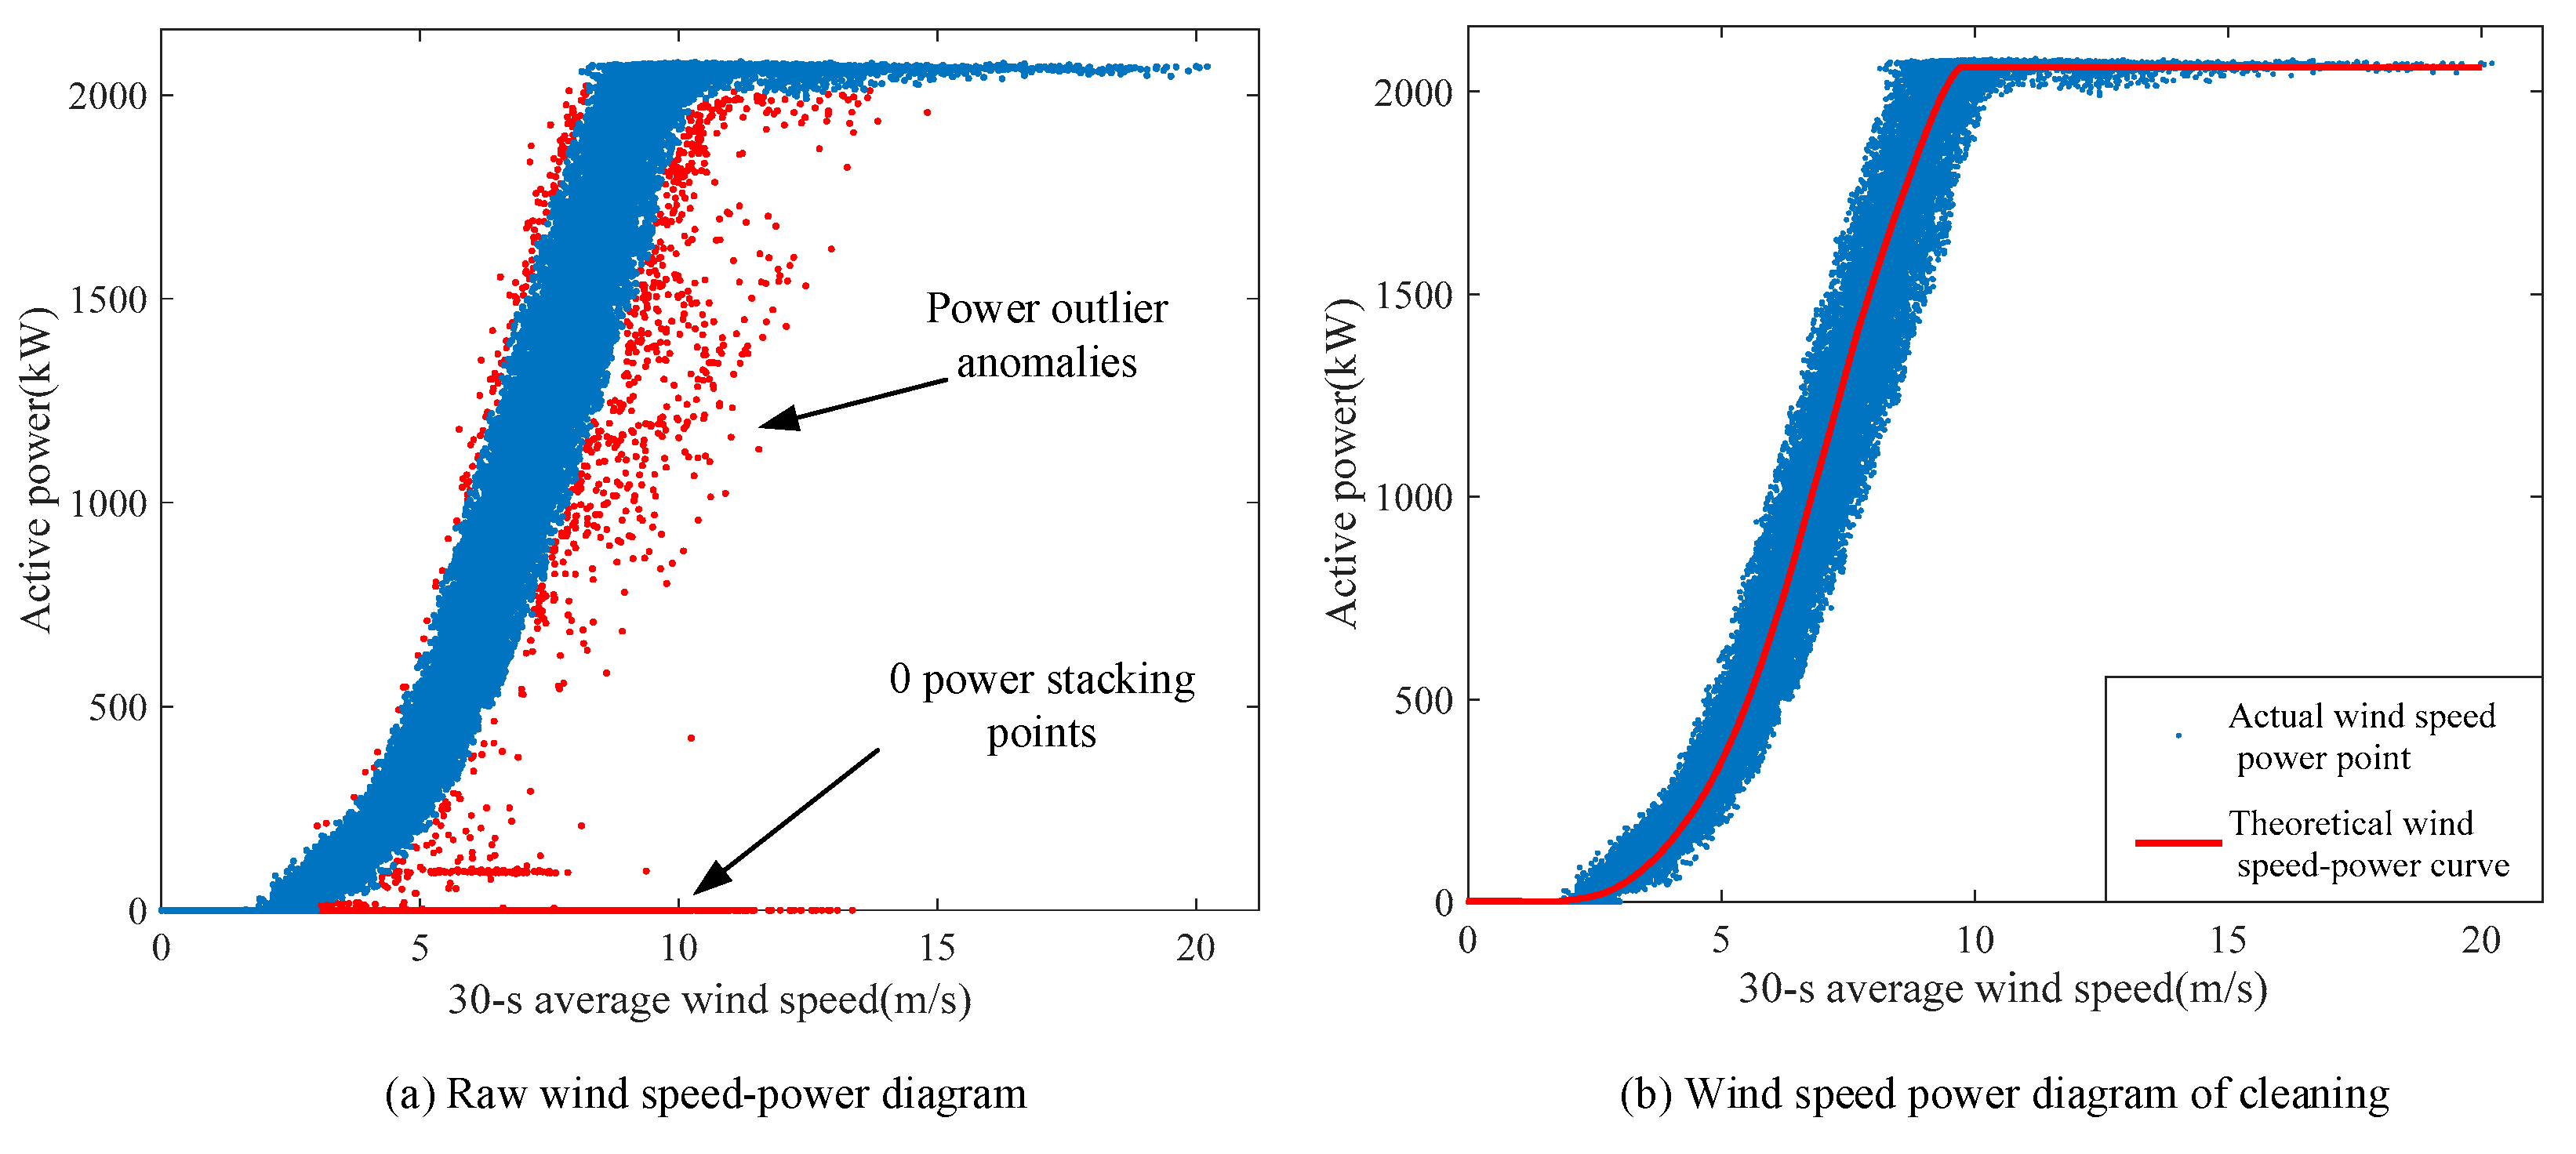
SCADA system includes functions such as remote control of the wind turbines, monitoring data collection, and operational state alarms. The SCADA system collects a large number of dimensional data, but there are problems with missing data, storing outliers, and error values. Therefore, it is necessary to clean the SCADA data, and then select the feature parameters related to the operational state of the wind turbine’s main transmission system.
  • Data cleaning
The untreated wind speed power profile is shown in Figure 4a. It can be seen that there are a large number of power outlier anomalies and zero power stacking points. These anomalies will affect the accuracy of the operational state monitoring results. In this paper, the DBSCAN clustering and direct truncation rejection are used to clean the SCADA data, and the cleaned wind speed–power curve is shown in Figure 4b. The cleaning result matches the theoretical wind speed–power curve of the wind turbine.
  • Selection of SCADA feature parameters
To solve the problem of the high dimensionality of SCADA monitoring data and redundancy among variables, the correlation analysis method was also used to select the feature parameters in the SCADA data that have a high correlation with the operational state of the wind turbine’s main transmission system. We will establish a prediction model for the main transmission system state evaluation parameters in Section 3. To obtain more accurate prediction results, the selected SCADA feature parameters were analyzed by correlating each state evaluation parameter with other parameters. According to the non-linear characteristics of SCADA data, the Maximal Information Coefficient (MIC) with low computational complexity and good robustness is used to measure the correlation between parameters.
The results of the MIC values between the SCADA feature parameters and the state evaluation parameters of the main transmission system are shown in Table 3.
In Table 3, the 10 parameters of the strongest correlation were selected separately as SCADA feature parameters. Furthermore, the six prediction models for the main transmission system state evaluation parameters were developed in Section 3. For each state evaluation parameter prediction model, the combination of the selected 10 SCADA parameters and 10 CMS feature parameters was used as the input vector of the model. The six prediction models input vectors were expressed as:
X P = [ v z , v f , v w , T q , T f q , T f u , T f v , T f w , T , P a , x r m s , x p p , S f , I f , C L f , U f , F C , F , F r m s , F r m s f ] X T g = [ v z , v f , v w , T i n , T h , T g o , T q , T f q , T , P a , x r m s , x p p , S f , I f , C L f , U f , F C , F , F r m s , F r m s f ] X T l = [ v z , v f , v w , T i n , T h , T g o , T q , T f q , T , P a , x r m s , x p p , S f , I f , C L f , U f , F C , F , F r m s , F r m s f ] X T g o = [ v z , v f , v w , T i n , T h , T f u , T f v , T f w , T , P a , x r m s , x p p , S f , I f , C L f , U f , F C , F , F r m s , F r m s f ] X T q = [ v z , v f , P , T g , T h , T f u , T f v , T f w , T , P a , x r m s , x p p , S f , I f , C L f , U f , F C , F , F r m s , F r m s f ] X T f q = [ v z , v w , P , T g o , T h , T f u , T f v , T f w , T , T i n , x r m s , x p p , S f , I f , C L f , U f , F C , F , F r m s , F r m s f ]
where the names corresponding to each symbol in the input vector are shown in Table 4.

3. Prediction of State Evaluation Parameters

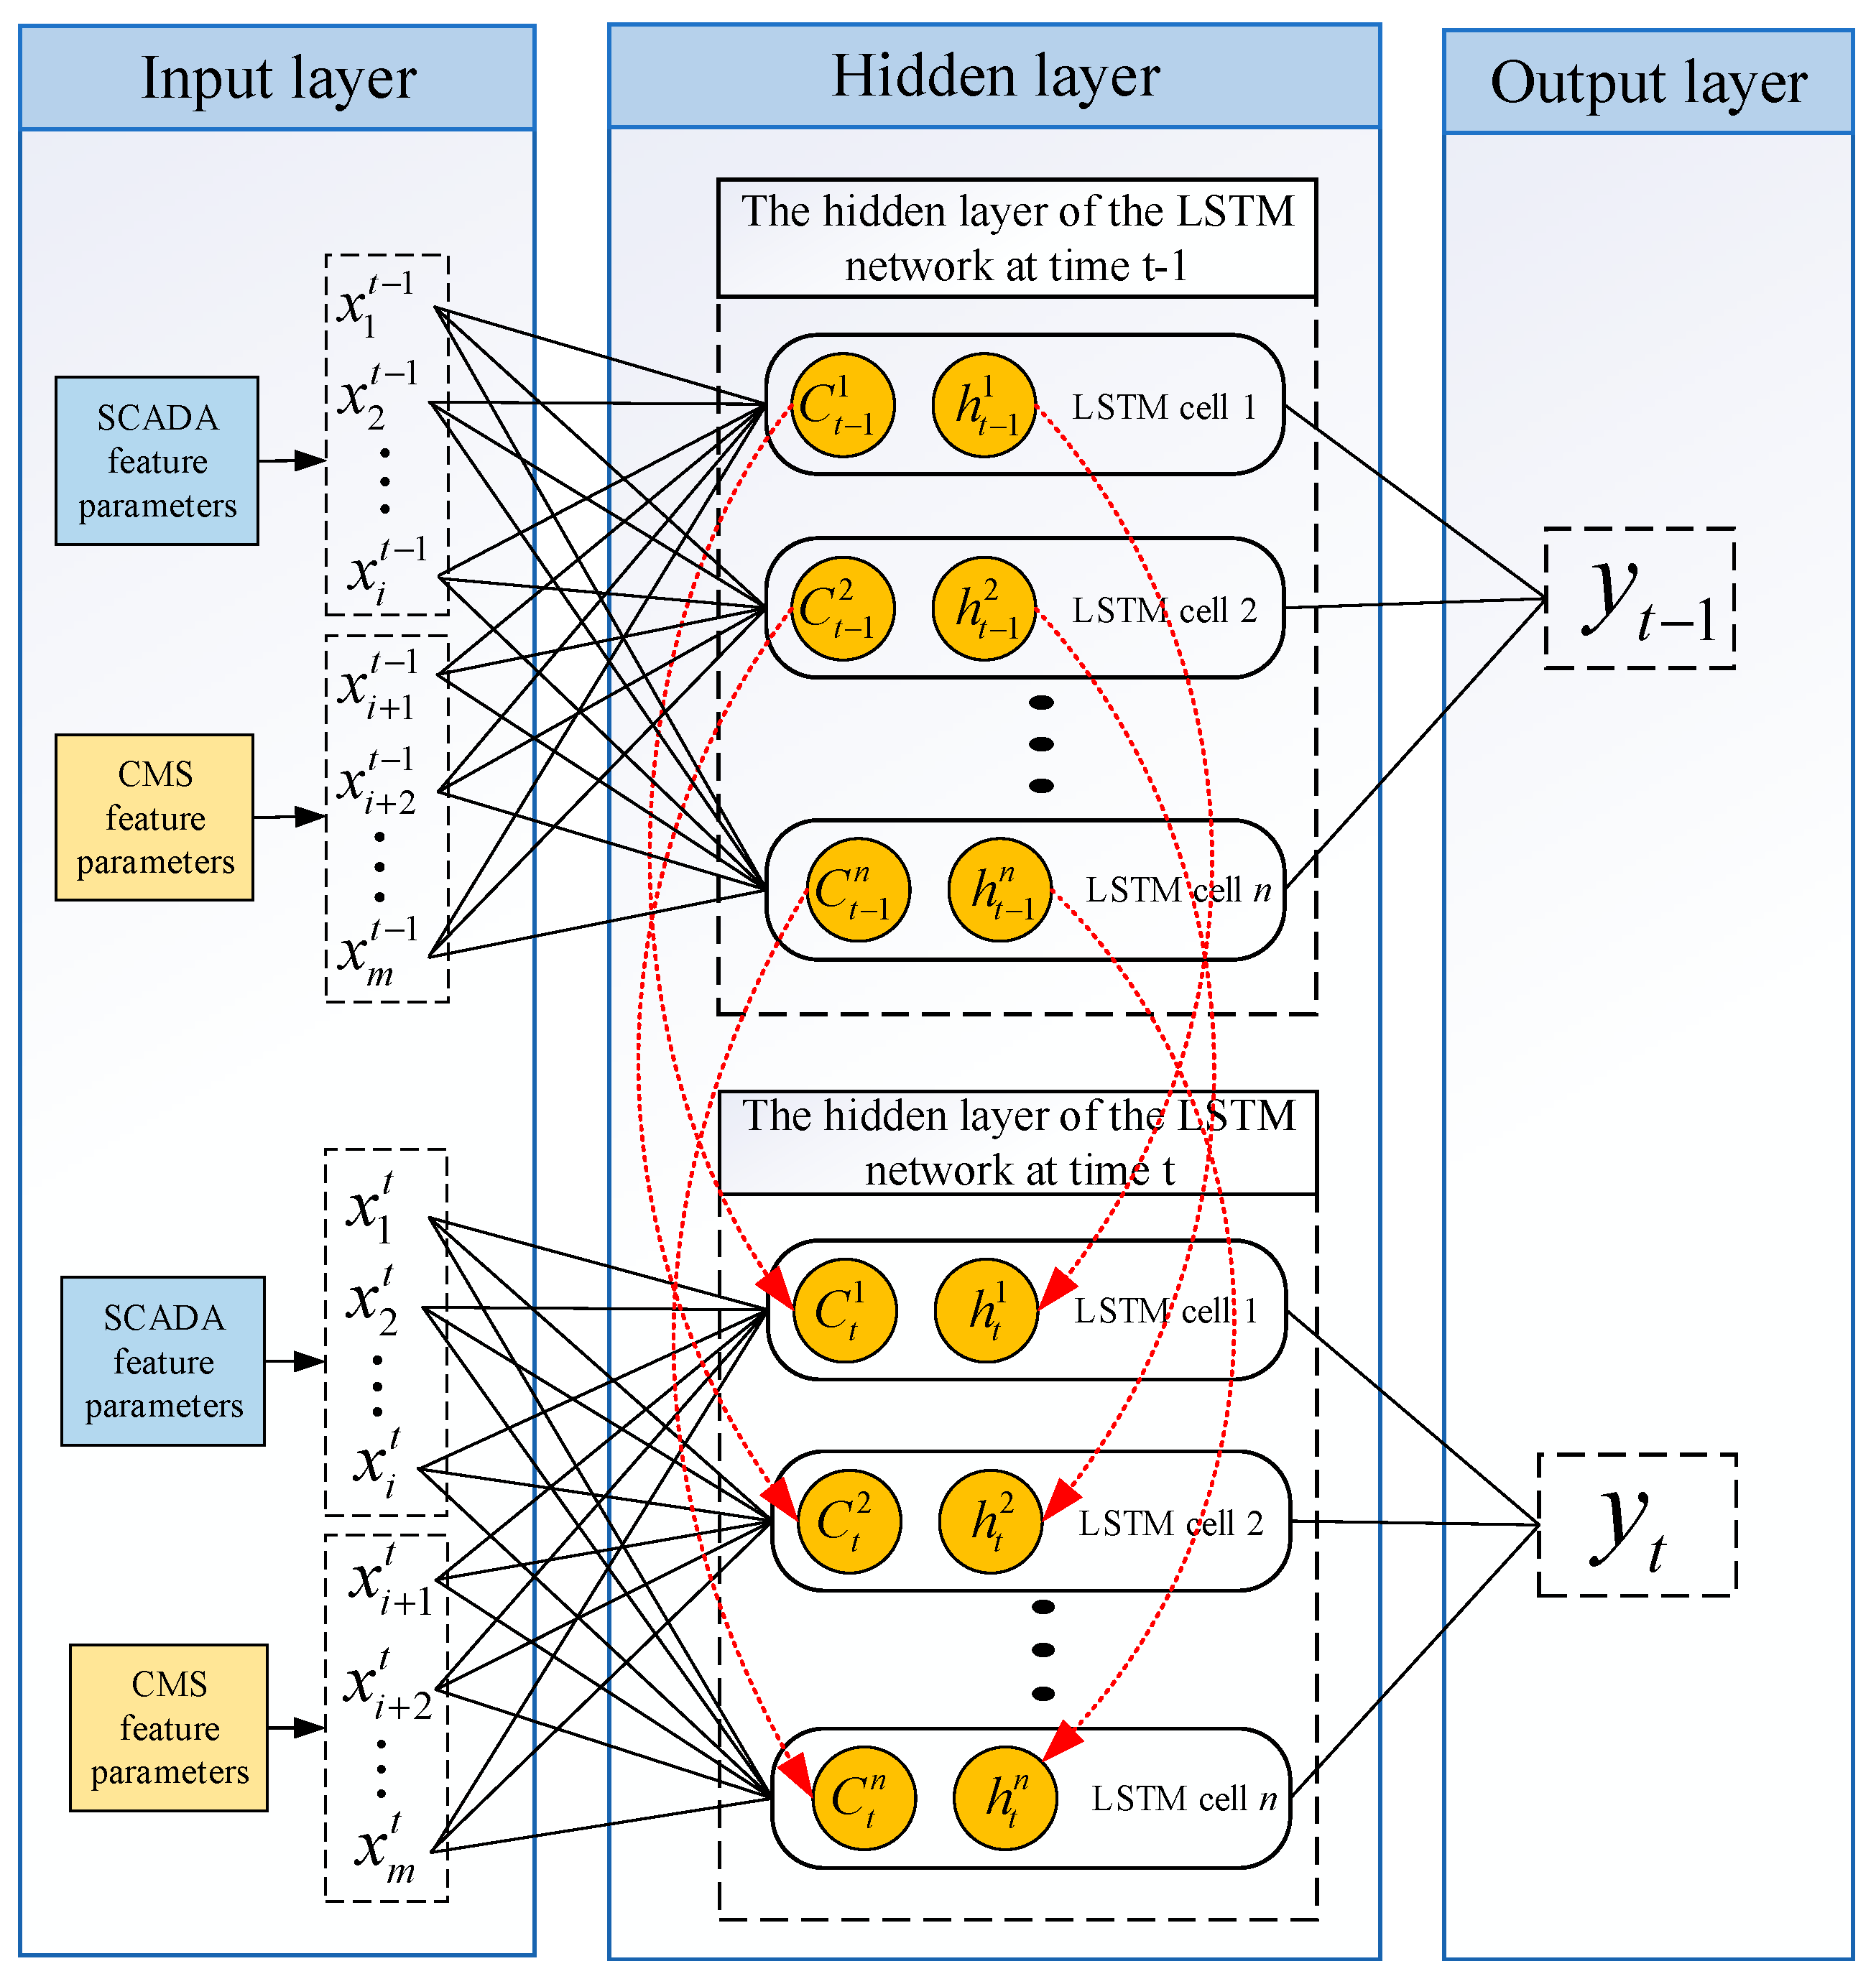
3.1. LSTM-Based Fusion of SCADA and CMS Feature Parameters

SCADA data can provide comprehensive operational state information, while CMS vibration data contain the more accurate state information. In order to improve the accuracy of fault monitoring and detect abnormalities earlier, it is necessary to integrate the characteristic information contained in the data source.
Neural network, which is a model with multiple nonlinear mapping levels, can abstract the input variables layer by layer and extract their features. Therefore, the information of different feature parameters can be fused and a deeper underlying mode can be explored by neural network models [37]. LSTM is a kind of temporal recurrent neural network which is composed of a series of memory cells. It can choose to memorize the time series information and mine the relationship features before and after the time series data. It has some advantages in processing the temporal data. LSTM networks have better prediction results compared to other methods [38]. Therefore, the Long Short Term Memory network (LSTM) was selected to fuse SCADA and CMS feature information.
LSTM network is a variant of the recurrent neural network, and its core concepts are cell state and channel structure. Its three channels are forget, input, and output channels, which can retain and delete the data information in the sequence [39]. C t and C t 1 denote cell state information at moments t and t 1 , and h t , h t 1 are the hidden layer state information.
Among them, the forget channel is used to determine whether information will be removed from the memory cell based on h t 1 and C t 1 . The output equation of the forget channels is:
f t = σ ( W f x [ h t 1 , x t ] + W f c C t 1 + b f )
The input channel is used to perform updates to the cell state. h t 1 and x t are passed to the activation function σ to update the information. Meanwhile, h t 1 and x t are passed to the function tanh to get the candidate vectors. Then, the function S value is used to determine whether information will be removed in the candidate vectors. The output equation of input channels is:
i t = σ ( W i [ h t 1 , x t ] + b i )
C t = tanh ( W C [ h t 1 , x t ] + b c )
C t = C t × f t + C t × i t
The output channel is used to determine the next hidden state. The output equation of out channels is:
o t = σ ( W o [ h t 1 , x t ] + b o )
h t = o t × tanh ( C t )
where W f x , W i , W C , W o are the weights of the connection input information and the hidden layer input information, W f c is the weight of connecting the previous cell state, b f , b i , b C , b o are the biases corresponding to forget channels, input channels, candidate vector, and output channels.
The LSTM network is used to fuse SCADA and CMS feature parameters information. The time series information of each parameter and the coupling relationship between parameters are mined. The prediction model of the main transmission system state evaluation parameters is established as shown in Figure 5. First, the LSTM network input layer is the first layer, and the selected SCADA and CMS feature parameters are used as model inputs. The time step is used to construct SCADA and CMS input time series data. Then, the LSTM network hidden layer was used to fuse and learn from the input SCADA and CMS data information. Time series features will be passed between parameters by LSTM cells, meanwhile, the time series information and coupling relationship of each parameter will be mined. Finally, the last layer of the prediction model is the output layer, which is mainly connected to the hidden layer through a fully connected layer. The fully connected layer is used to fuse the features learned by the multilayer LSTM to obtain the final prediction results.

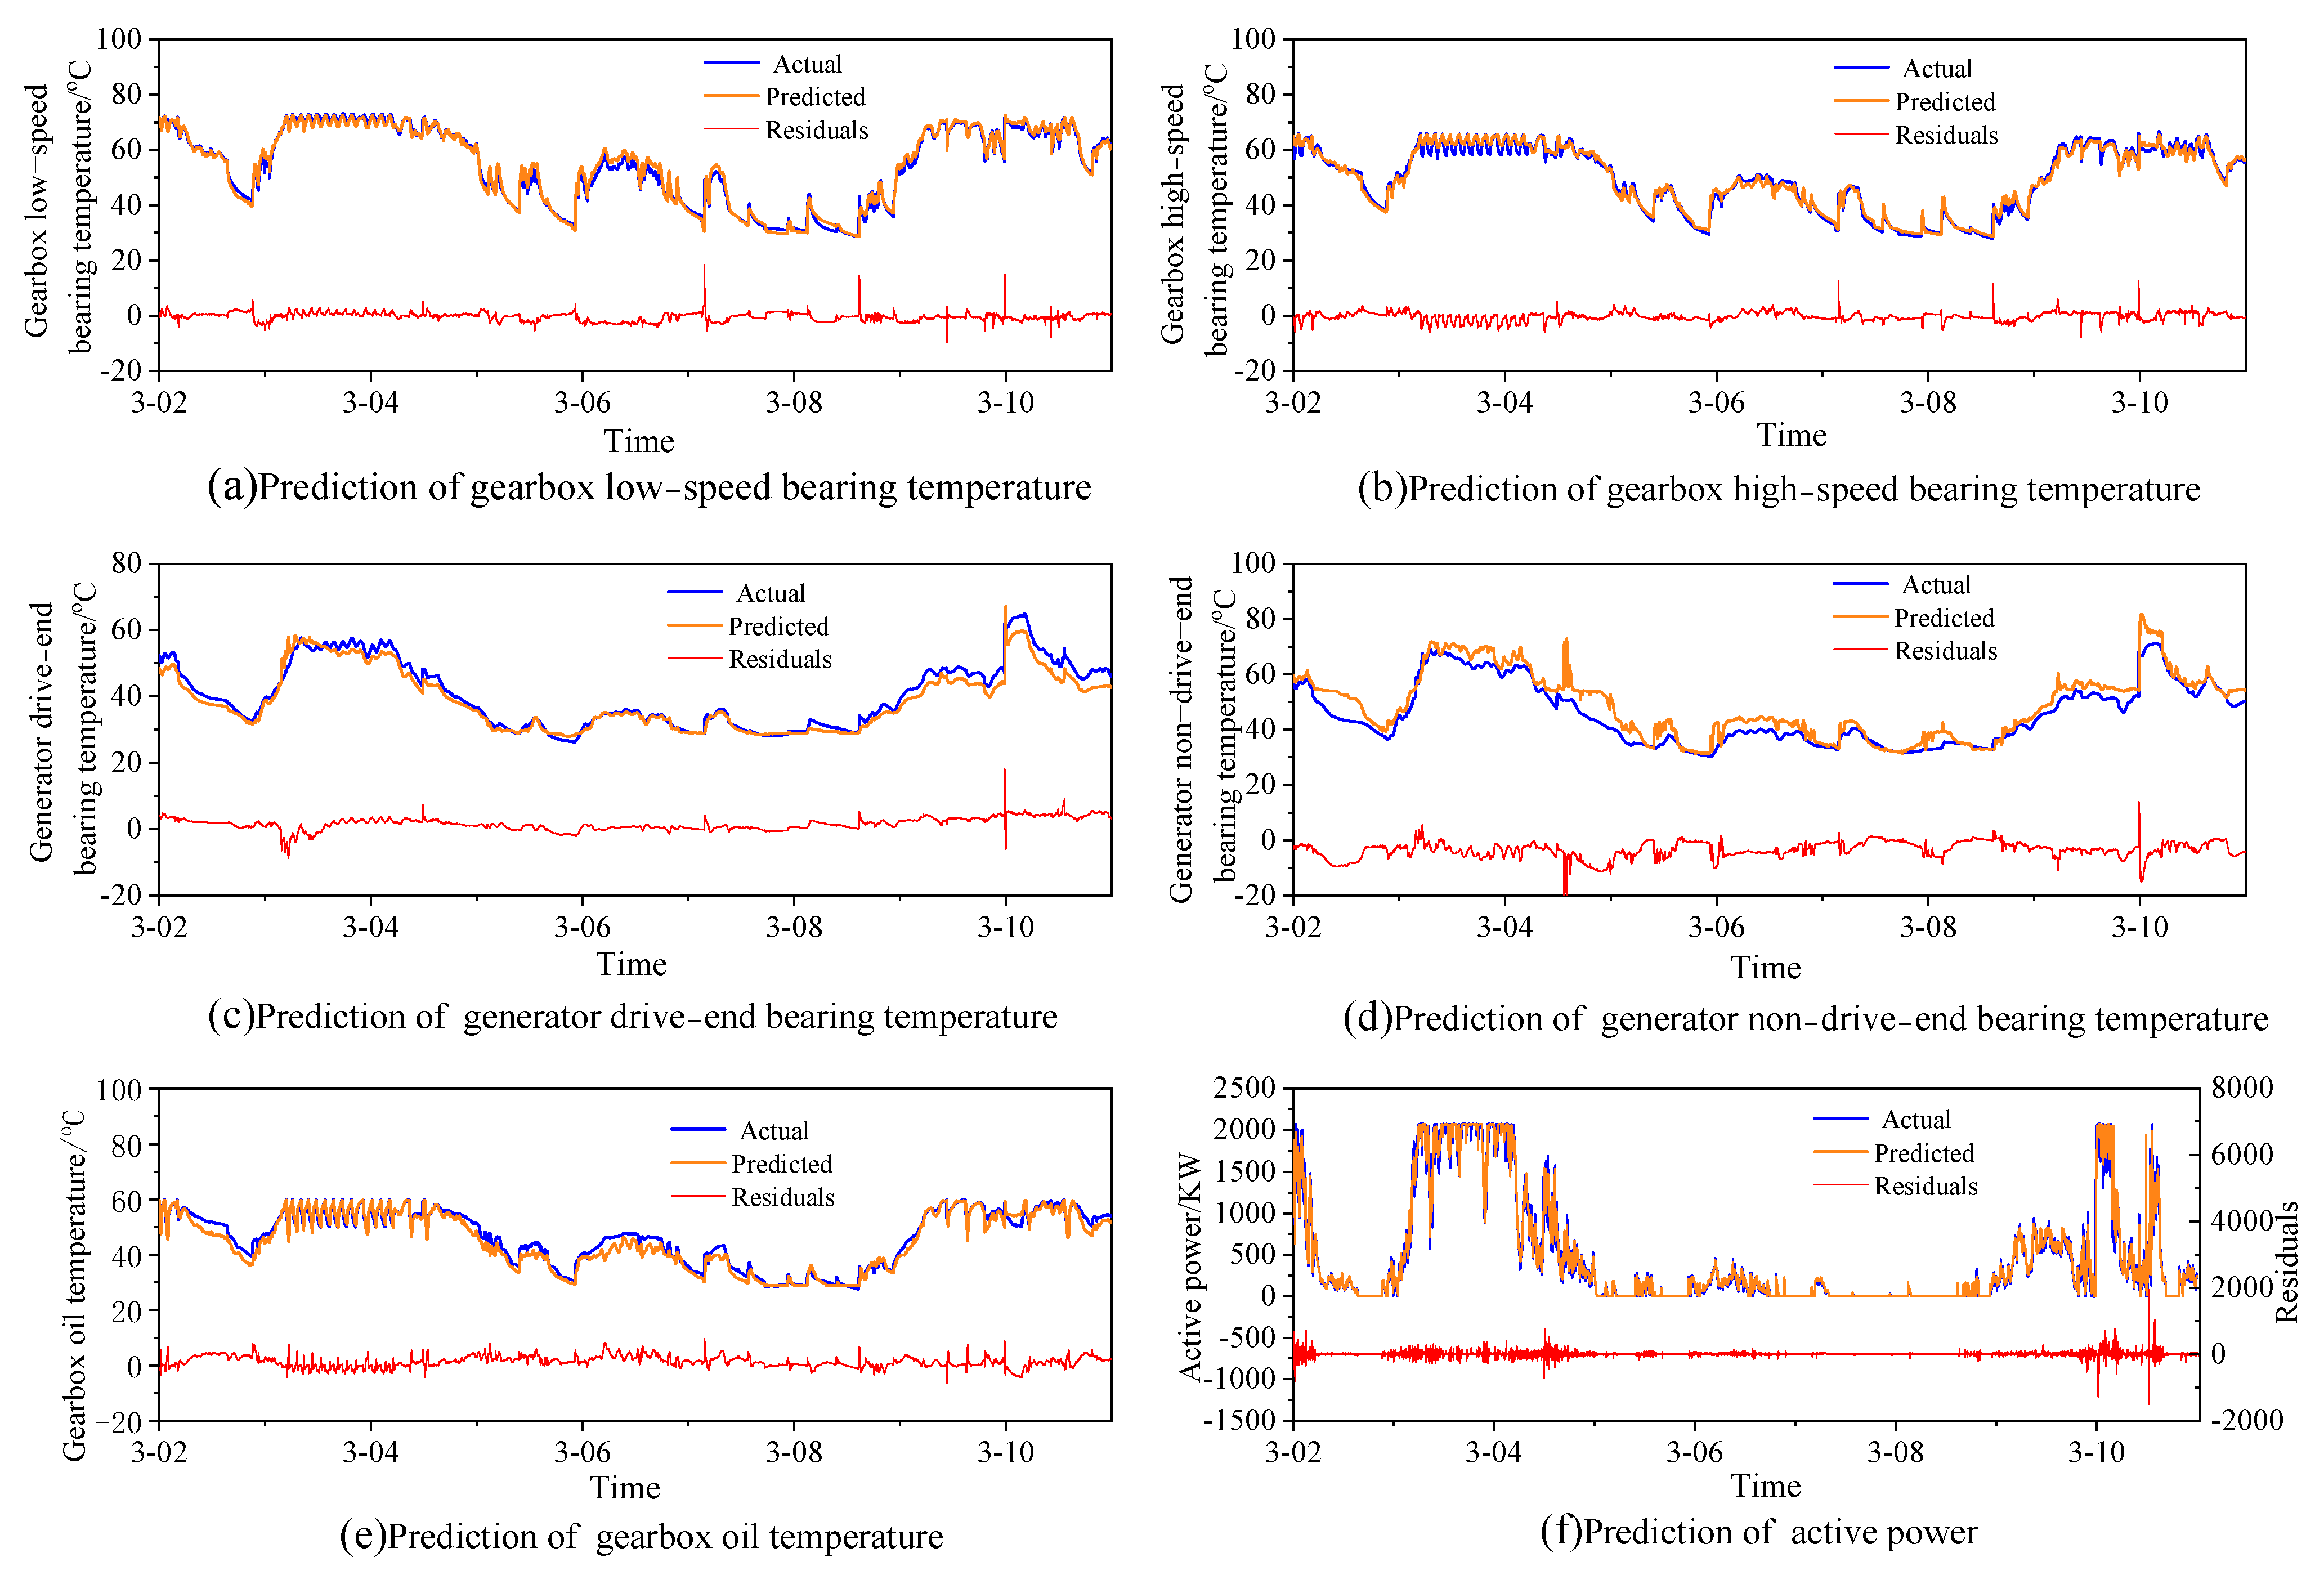
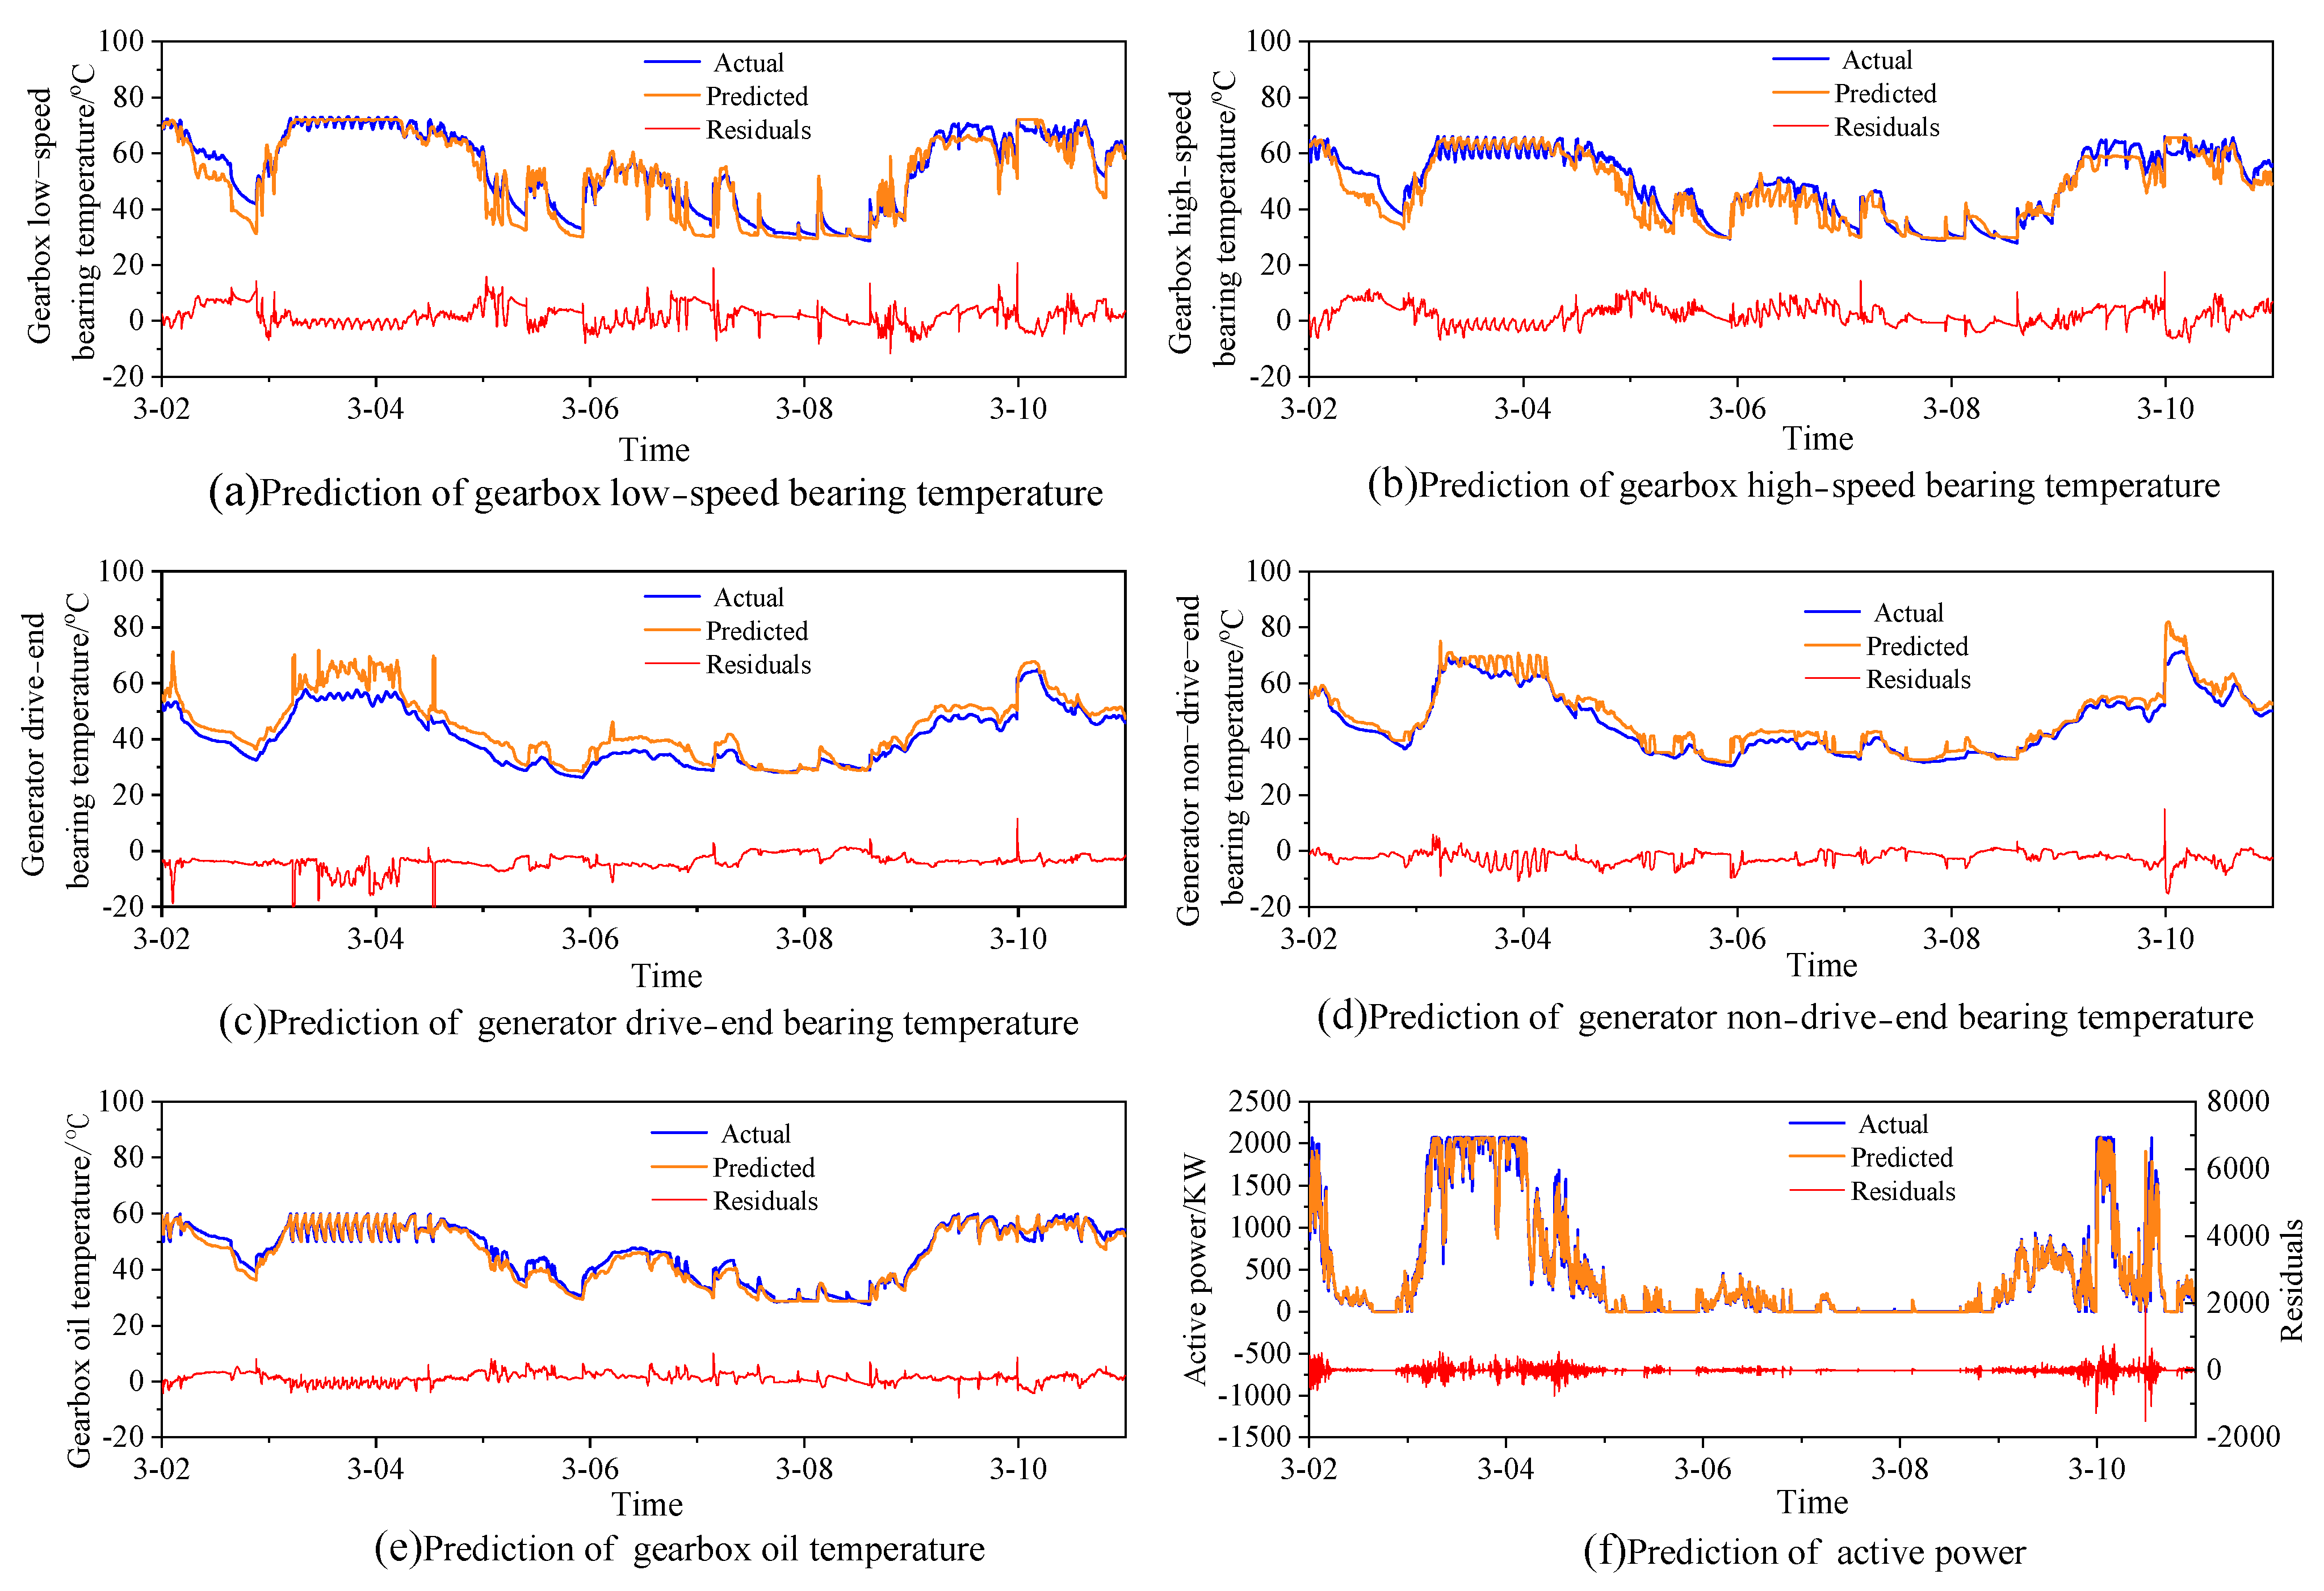
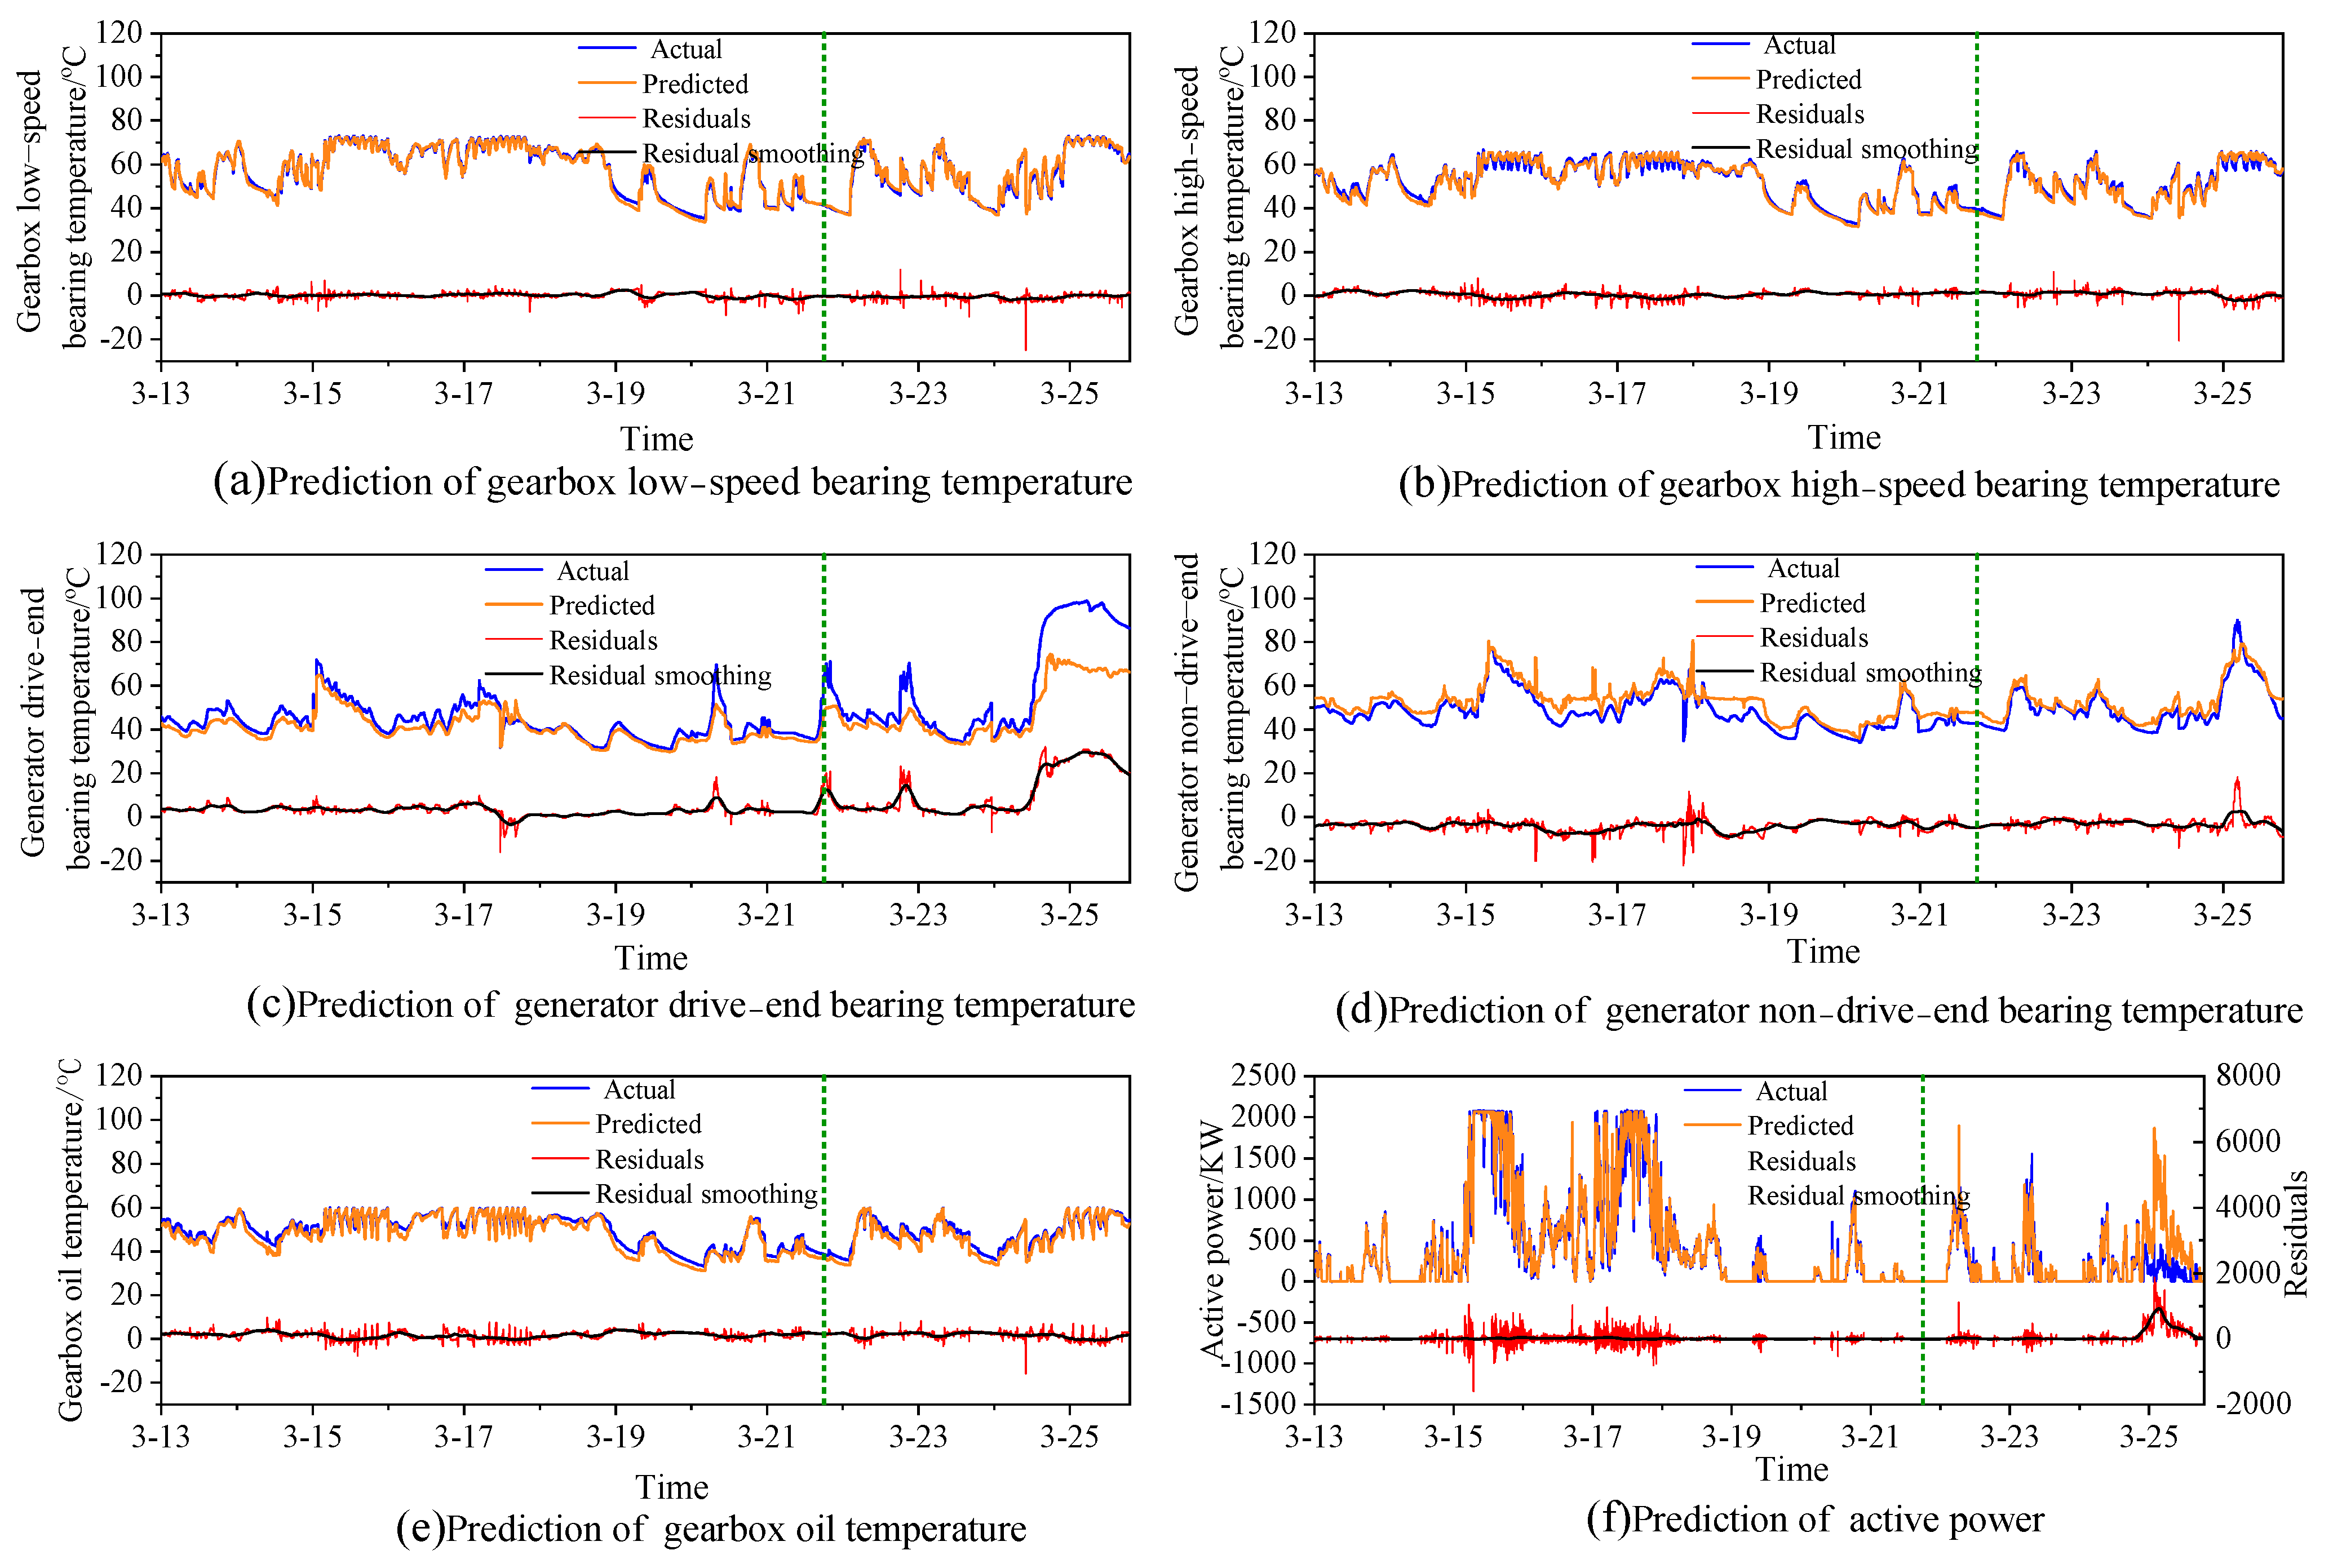
3.2. Prediction of State Evaluation Parameters on Feature-Level Fusion

According to the selected SCADA and CMS feature quantities and predicted quantities in Section 2, the prediction model of the main transmission system state evaluation parameters is established. We tuned the LSTM model hyperparameters based on the empirical. Its specific hyperparameters are shown in Table 5.
The prediction model for SCADA and CMS data fusion was trained and tested by using wind turbine data from November 2021 to March 2022. A total of 75,216 data sets were used, with 66,859 training data samples and 8357 test data samples. The prediction results and prediction residuals are shown in Figure 6. As can be seen from Figure 6, the fusion of SCADA and CMS data has a good prediction effect for the selected six state evaluation parameters of the main transmission system. The prediction residuals are basically smooth regardless of the operational state of the wind turbine. These will be able to meet the needs of monitoring and early warning of the main transmission system. In order to demonstrate the superiority of the fusion, the results of the prediction using SCADA data alone are used for comparison. The prediction results using only SCADA data are shown in Figure 7. Its prediction residuals have large fluctuations compared to the prediction results of SCADA and CMS fusion. It would be detrimental to monitor the operational state of the main transmission system.
In order to quantify the difference, the mean relative error (MRE) and the coefficient of determination (R2) are used as evaluation indicators to evaluate our prediction model. Its calculation formula is as follows:
M R E = 1 N i = 1 N ( y i y ^ i y i )
R 2 = 1 i = 1 N ( y i y ^ i ) 2 i = 1 N ( y i y ¯ i ) 2
where y i is the actual measured value, y ^ i is the predicted value, and the average value is y ¯ i , N is the sample size.
The accuracy of the two models is compared through the evaluation indicators, as shown in Figure 8. The MRE represents the error between the prediction values and actual values, and the smaller the MRE, the more the prediction values correspond to the actual values. R2 characterizes the goodness of fit of the prediction model, while the closer its value is to 1, the better the goodness of fit for the prediction results. As can be seen from Figure 8, the MRE values of the predictions using SCADA and CMS data fusion are smaller than using SCADA data alone, meanwhile, the R2-values are higher for the former than for the latter. This also indicates that the prediction accuracy is higher by using data fusion, and this will also help to improve the accuracy of main transmission system anomaly monitoring.

4. Early Fault Warning Method

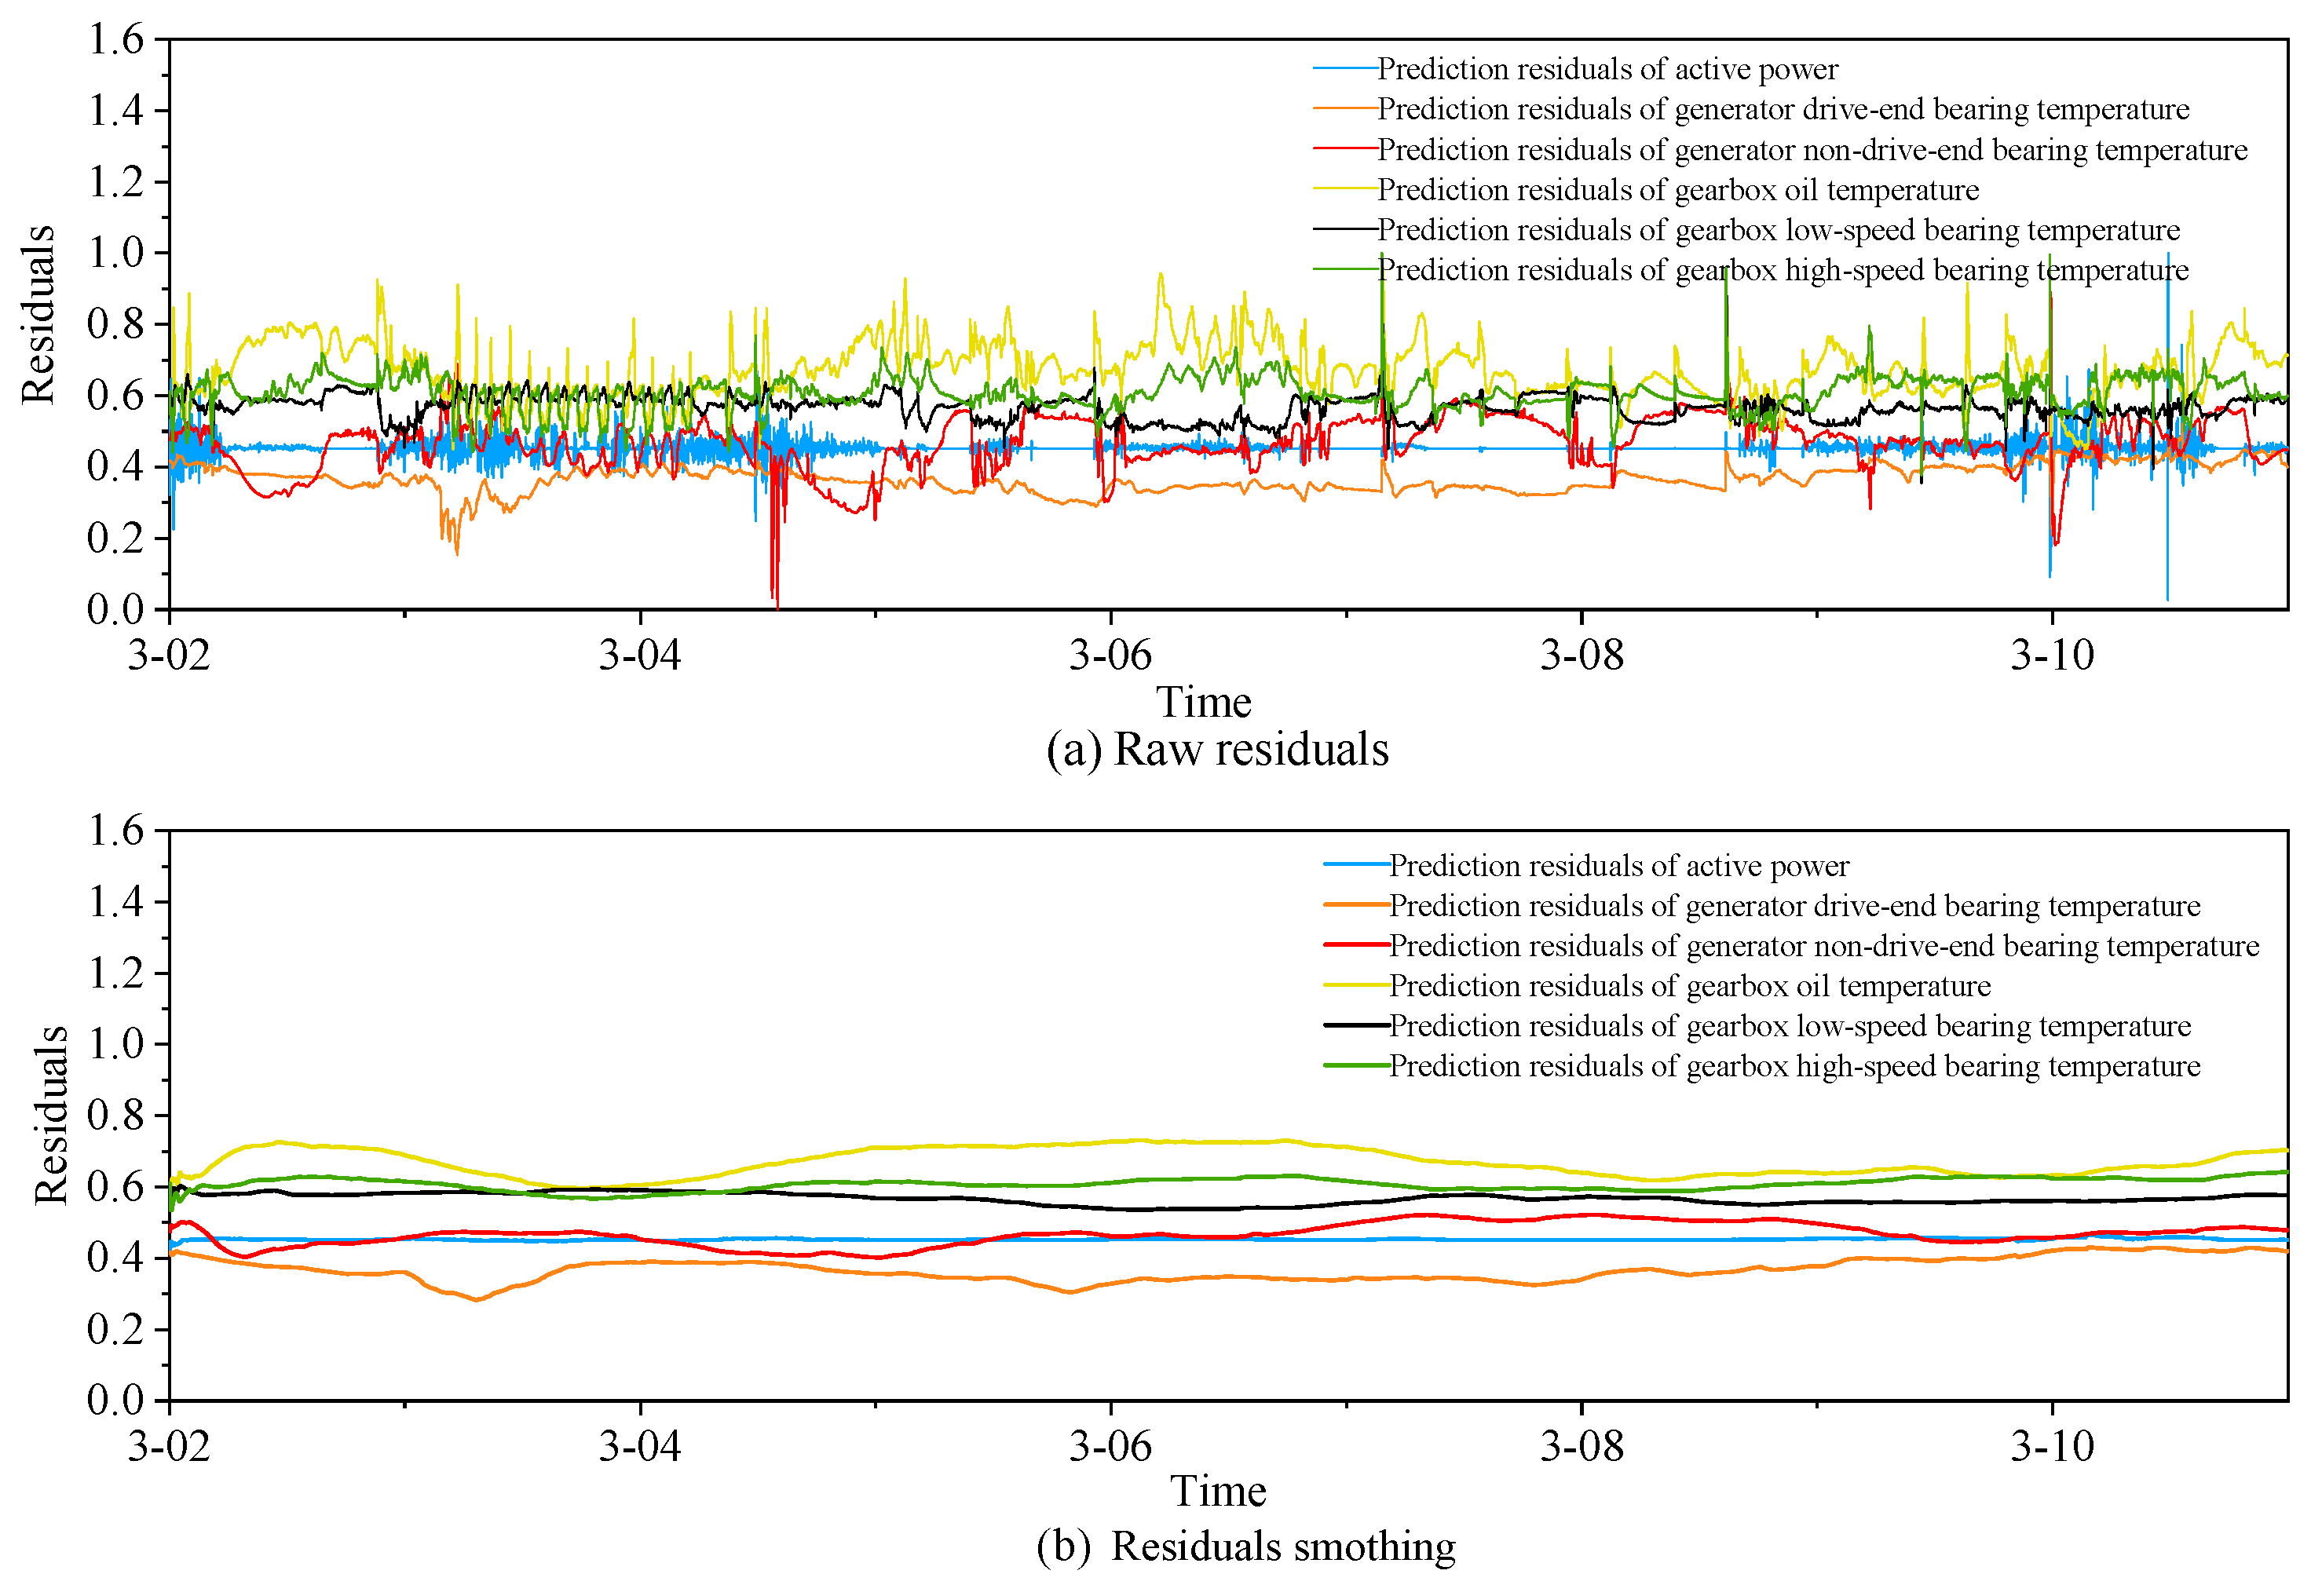
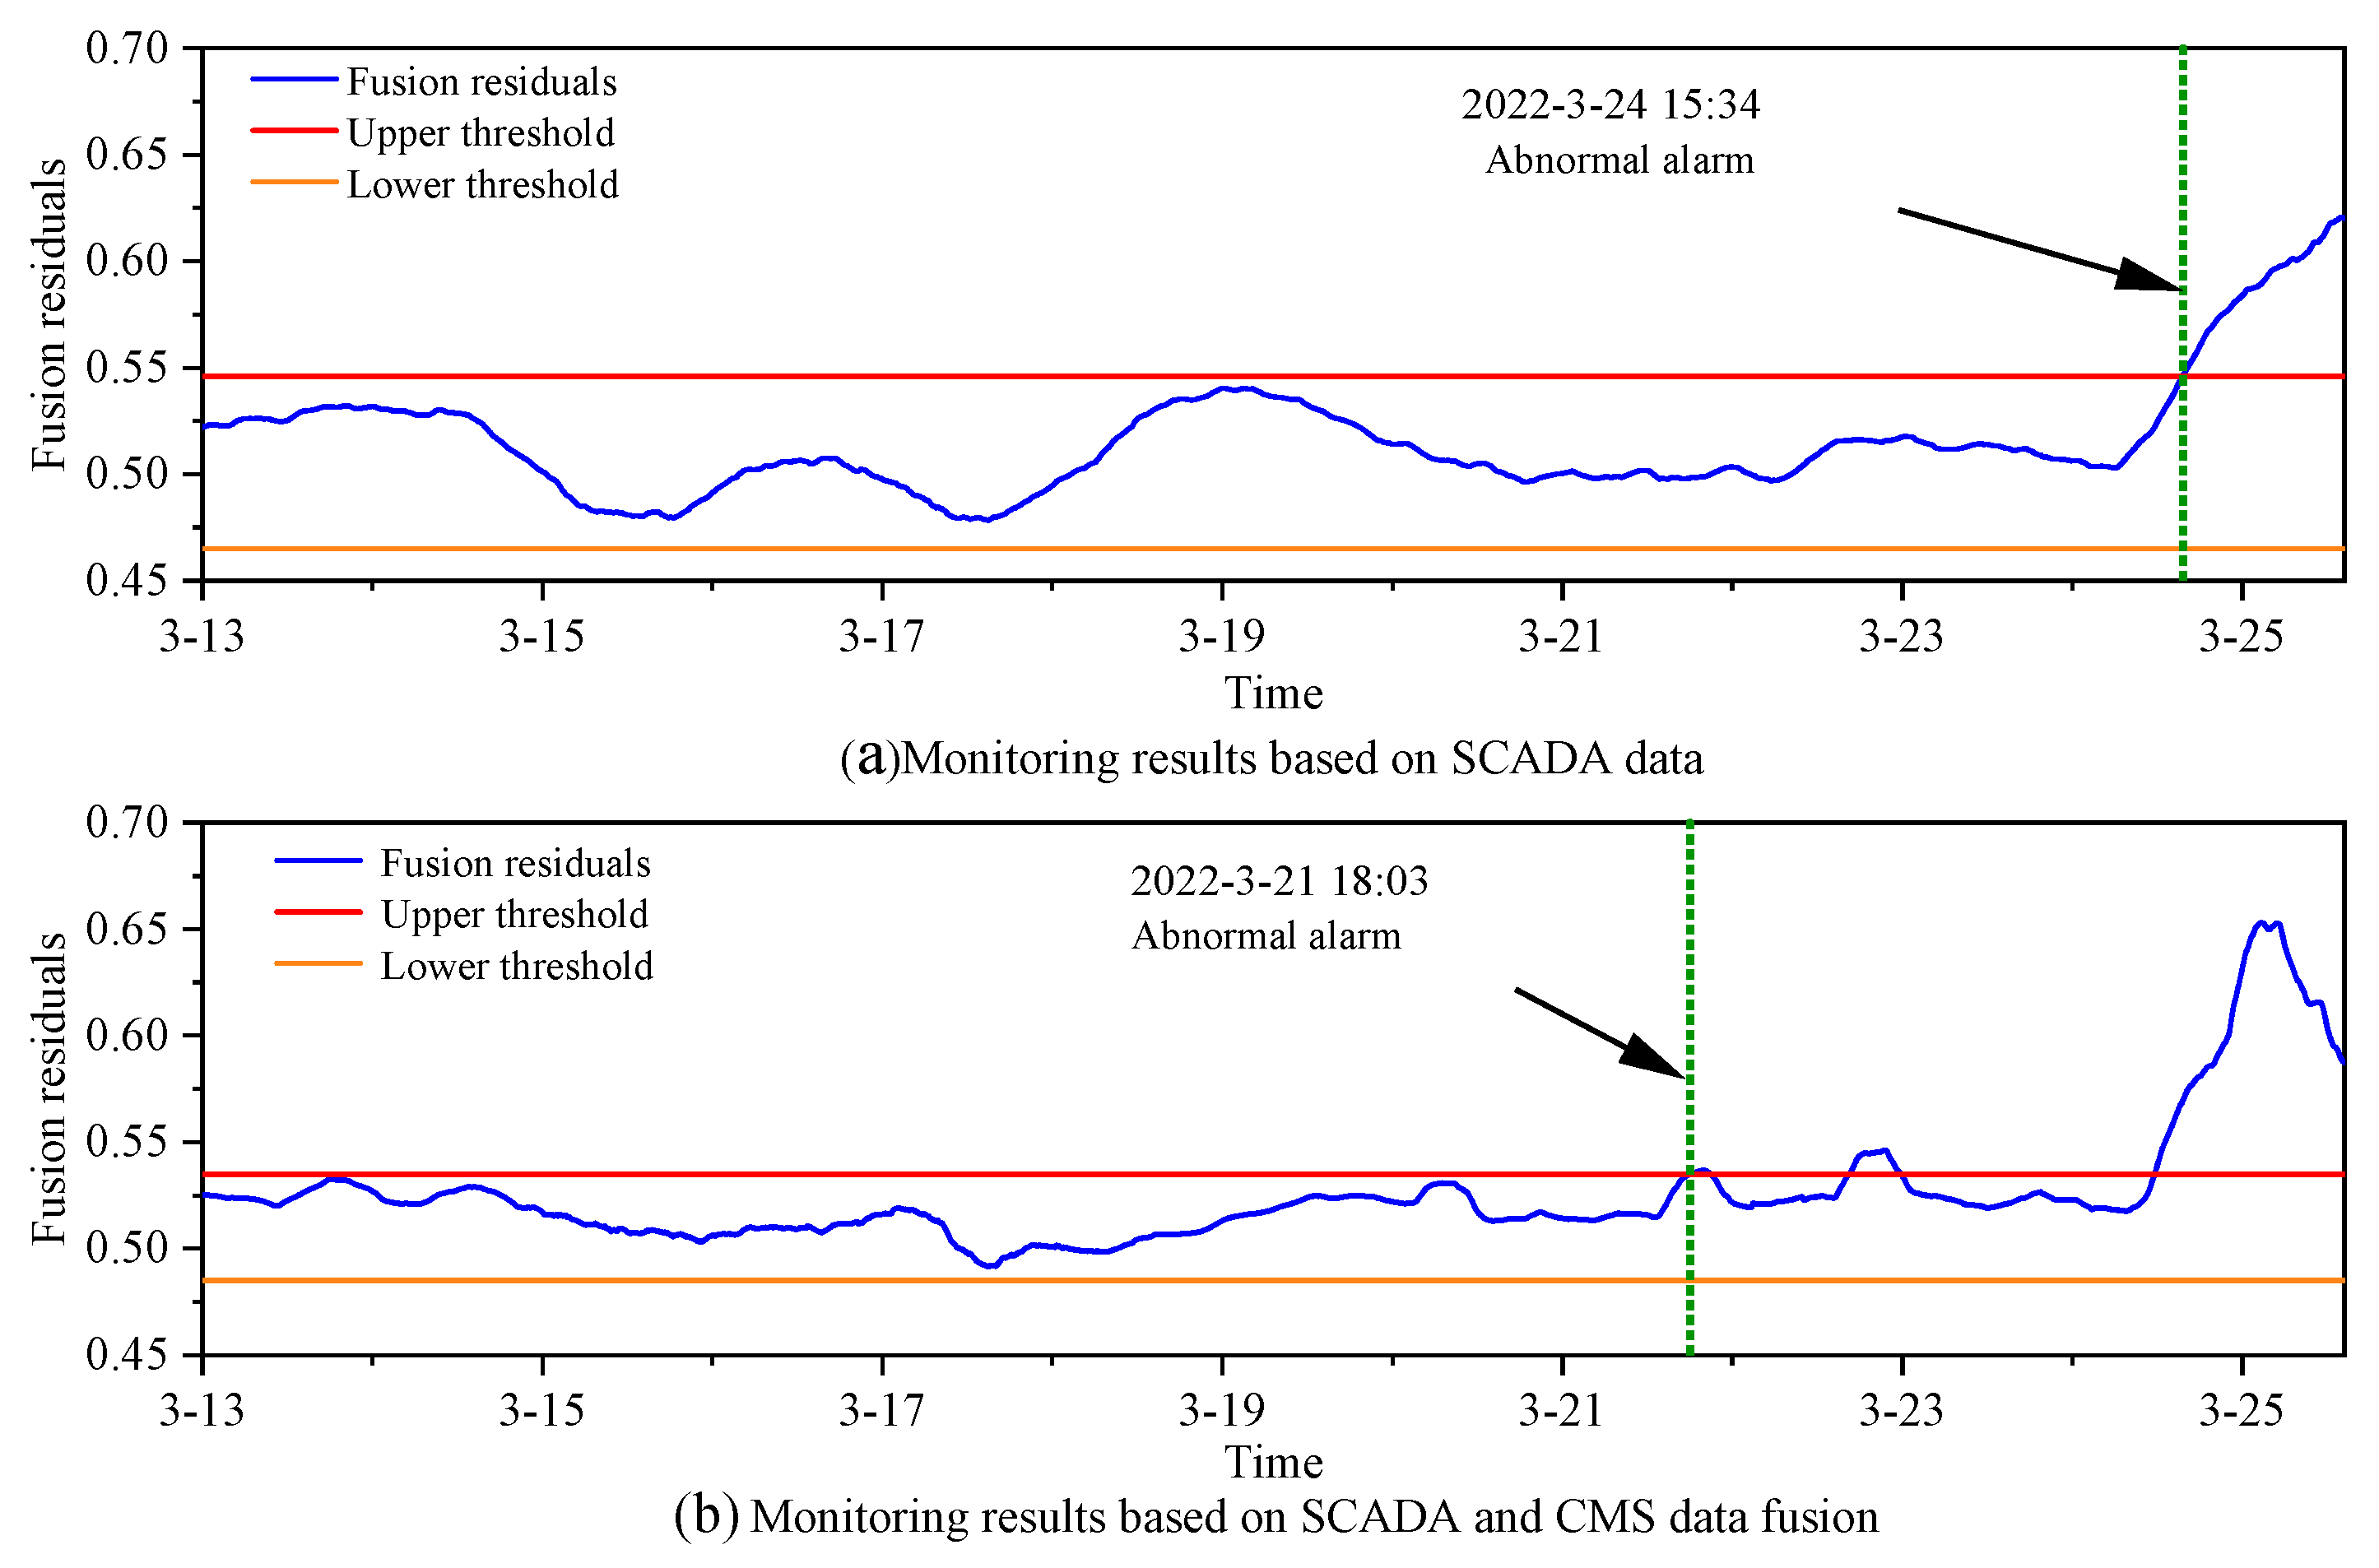
4.1. Multiple Residual Fusion Analysis

The main transmission system of the wind turbine is a multi-part coupling and complex structure system. When a single residual variation is used as an evaluation index, it cannot accurately evaluate the operational state of the main transmission system. Meanwhile, considering the complexity and variability of SCADA and CMS data, the prediction residuals will fluctuate, as shown in Figure 9a. These six residual indicators show large fluctuations in the normal operation of the main transmission system, but on the whole, the trends are not obvious. If the prediction residuals are directly selected as the standard of operational state evaluation, it may lead to the false alarm. Therefore, an early fault warning method with multi-residual fusion analysis by the Analytic Hierarchy Process (AHP) was proposed.
Firstly, we addressed the problem of fluctuations in forecast residual indicators. The sliding window smoothing method was used to smooth the prediction residuals. The results of smoothing the prediction residuals of the six condition evaluation parameters are shown in Figure 9b. It can be seen that, compared with the raw residuals plot, the trend of residuals is stable after smoothing, and the fluctuation of residuals is reduced. These can effectively avoid false alarm problems caused by residual fluctuations. Then, according to the influence degree of the six state evaluation parameters on the operational state of the main transmission system, the corresponding weights for each parameter are obtained by using AHP. In order to prevent the influence of artificial subjective scoring in AHP, the correlation coefficient (MIC) between each evaluation parameter and the main transmission system is used as the scoring basis of the 1–9 scale. The corresponding weights for each parameter are shown in Table 6.
Combining the weights of each parameter, the fusion residuals representing the operational state of the main transmission system are introduced. Its fusion residual X is defined as:
X = i = 1 n R i ω i
where R i is the smoothed value of the residuals for the i th predicted parameter, and ω i is the weight corresponding to the i th predicted parameter. The fusion residuals contain information about the operational state of main transmission system from the six selected evaluation parameters.

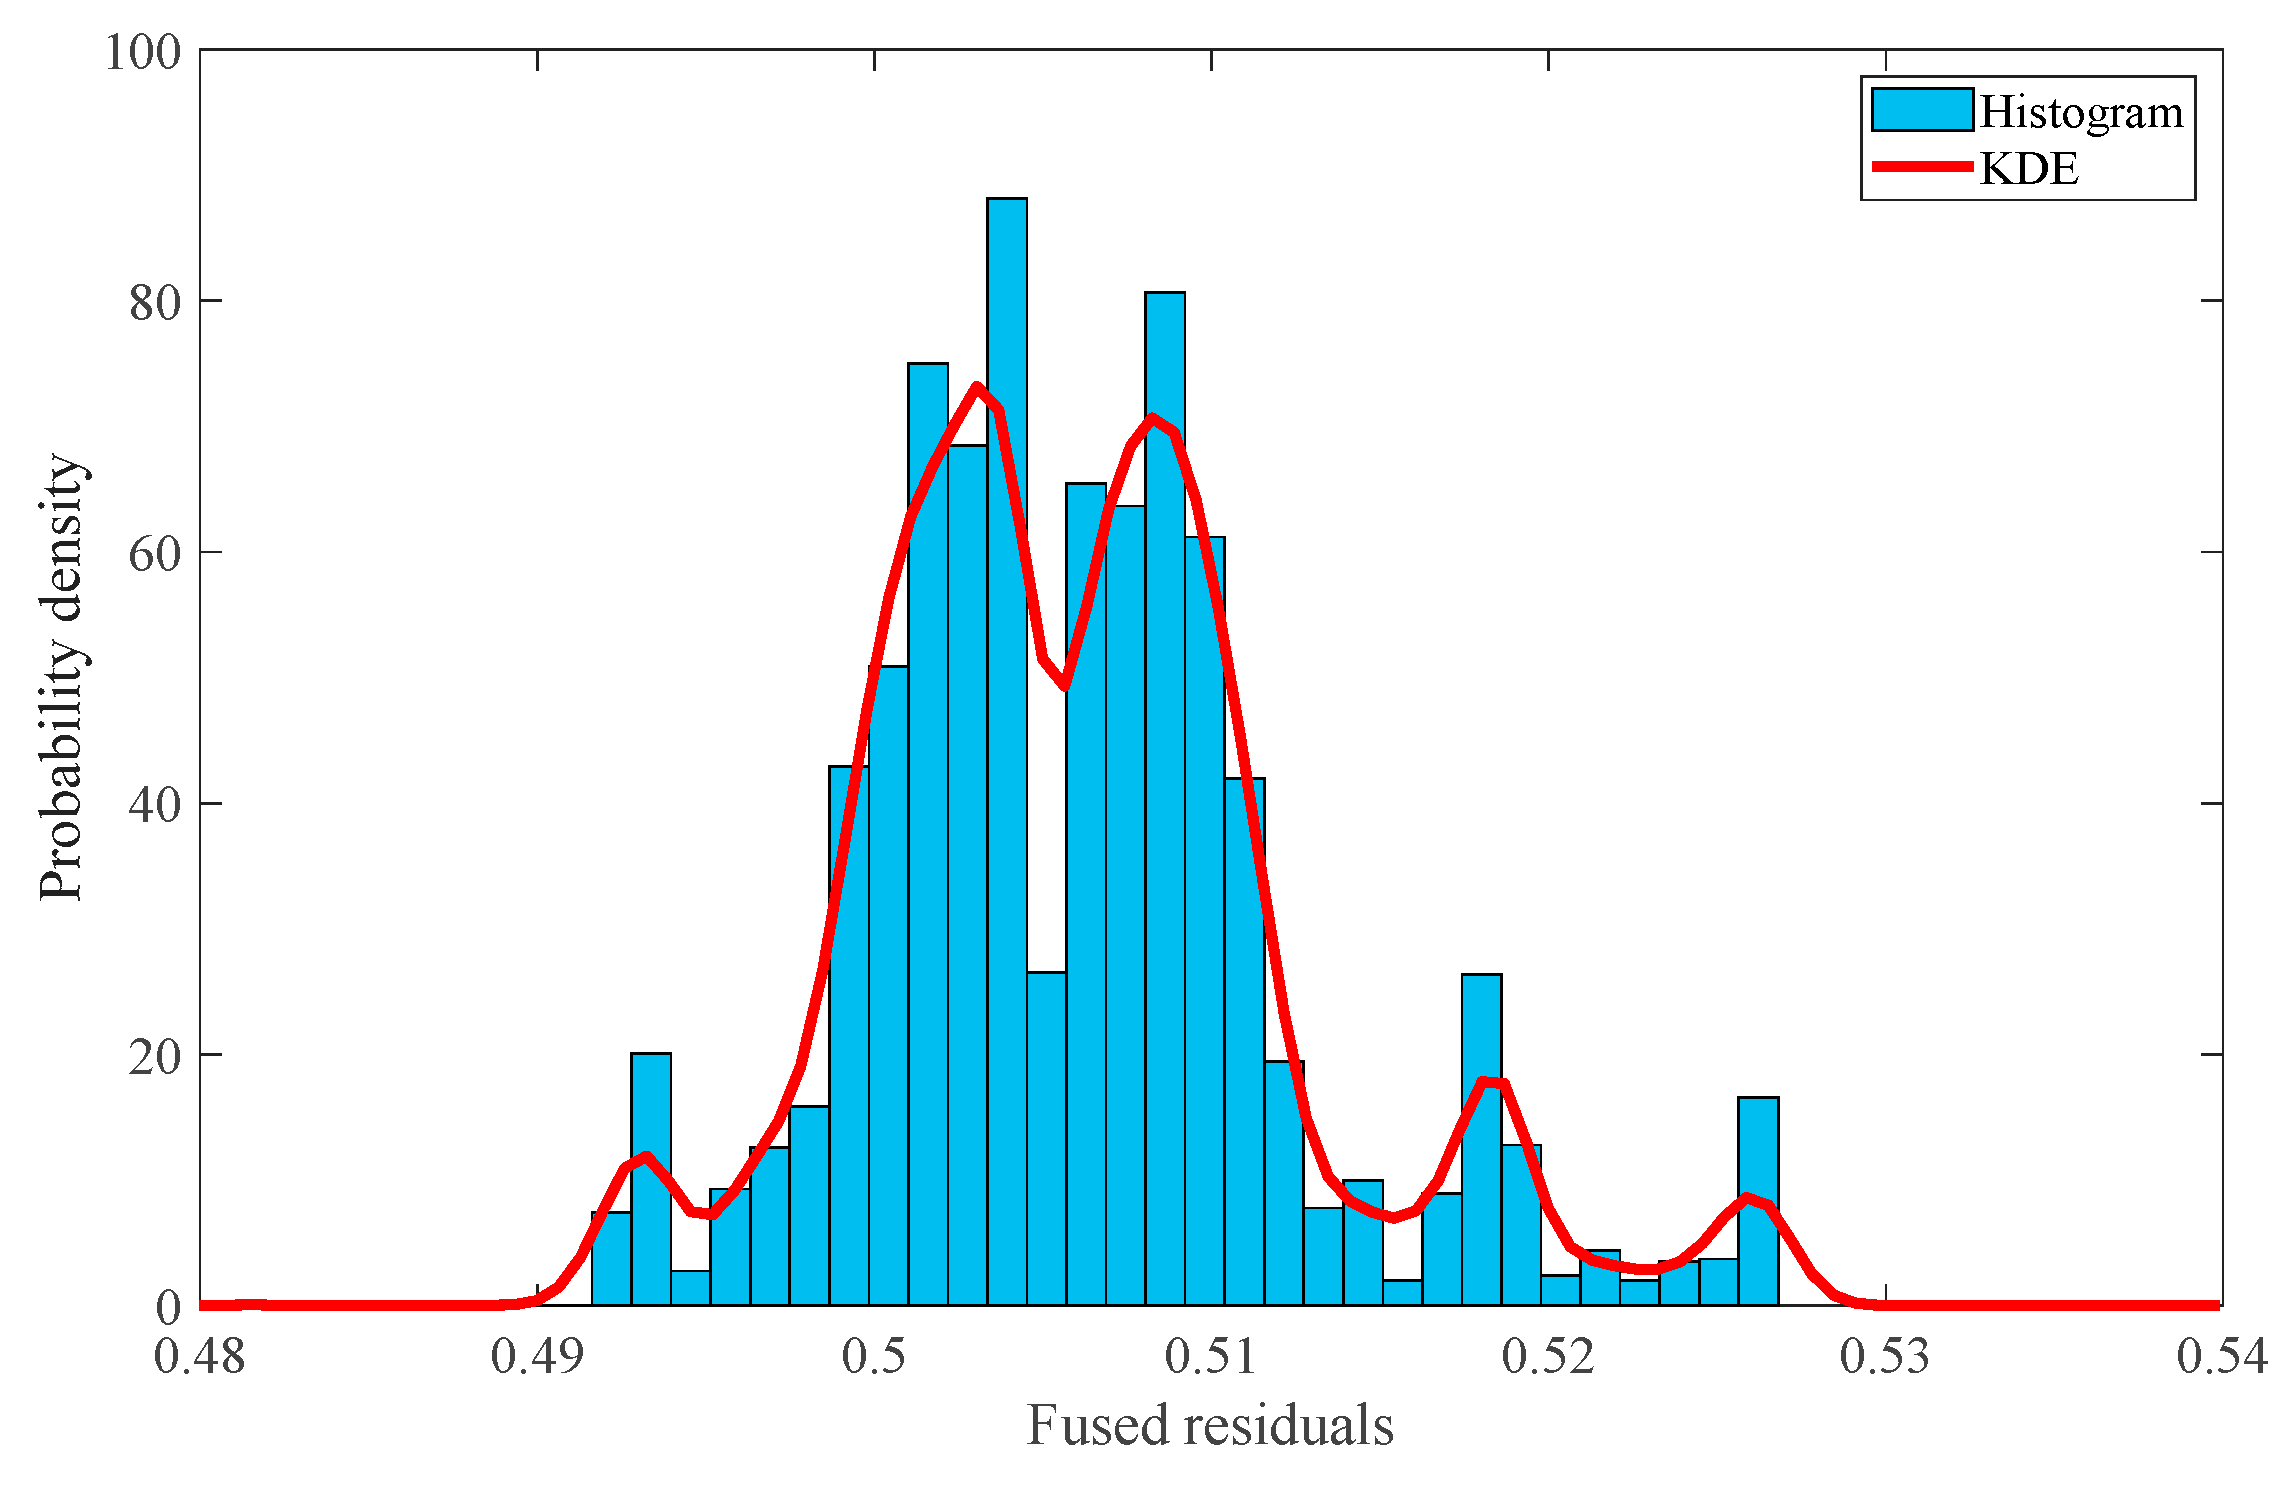
4.2. Monitoring Thresholds

According to the fusion residual index X , it is necessary to determine the appropriate alarm threshold to monitor the operation of the main transmission system. The kernel density estimation (KDE) method is used to set the threshold limits. A kernel density function K ( x ) needs to be determined. For the fusion residuals X = { x 1 , x 2 , , x n , } , the probability density function f ^ ( x ) based on the sample data xi is defined as:
f ^ ( x ) = 1 n h i = 1 n K ( x x i h )
where h denotes the bandwidth in the kernel density estimation.
According to the theory of interval estimation in statistics, the confidence level δ is determined if it satisfies P { x X lim } = δ , and the interval [ , X lim ] is called the confidence interval of the fused residual X with a confidence level of δ . When the given δ is a larger value, it is a small probability event that the fusion residual indicator X falls outside the interval. It is almost impossible for the normal operating of the wind turbine to have abnormal operating conditions outside the interval [12]. The upper limit of the interval X lim can be solved by the integral formula of the probability density function f ^ ( x ) . Its calculation formula is as follows:
X lim f ^ ( x ) d ( x ) = δ
The Gaussian function is chosen as the kernel density function. The confidence interval of 99.7% confidence level is used as the control limit for the normal operation of the main transmission system. Real-time predicted fusion residuals versus threshold limits are used to determine the operational state of the main transmission system. When the threshold limit is exceeded, it means that the main transmission system is operating abnormally, and then the fault will be warned. Figure 10 shows the probability distribution of the fusion residuals under normal operation. The upper and lower threshold limits are calculated from the confidence level of the set interval as [0.485,0.535].

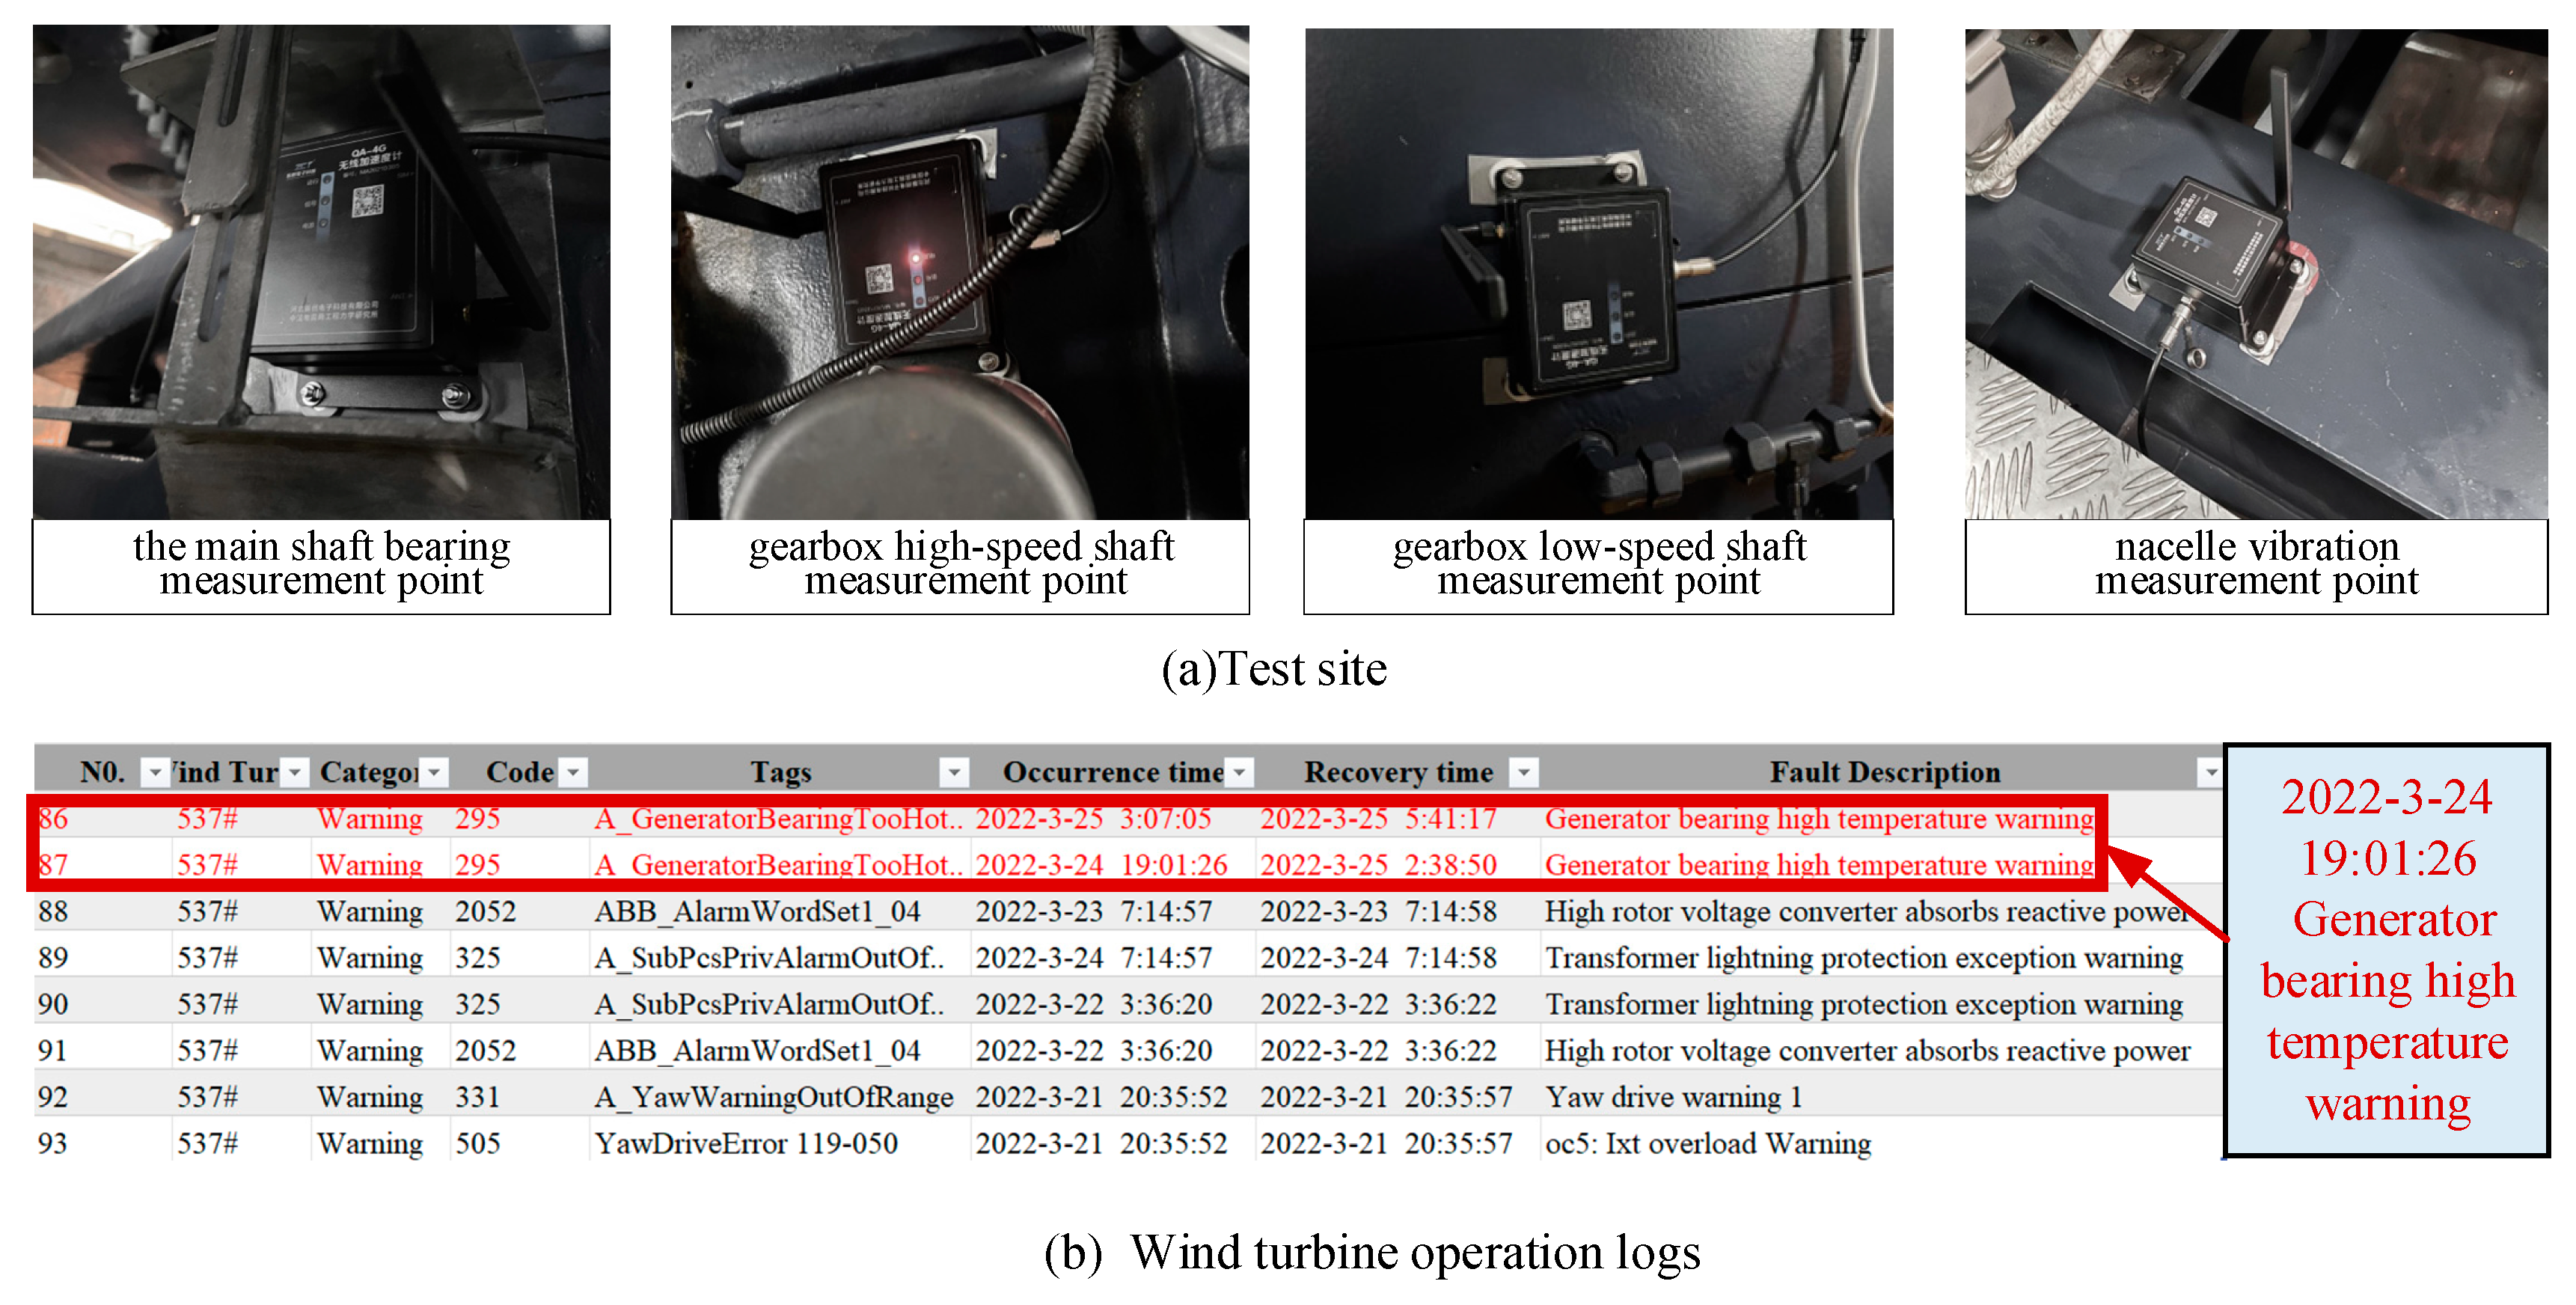
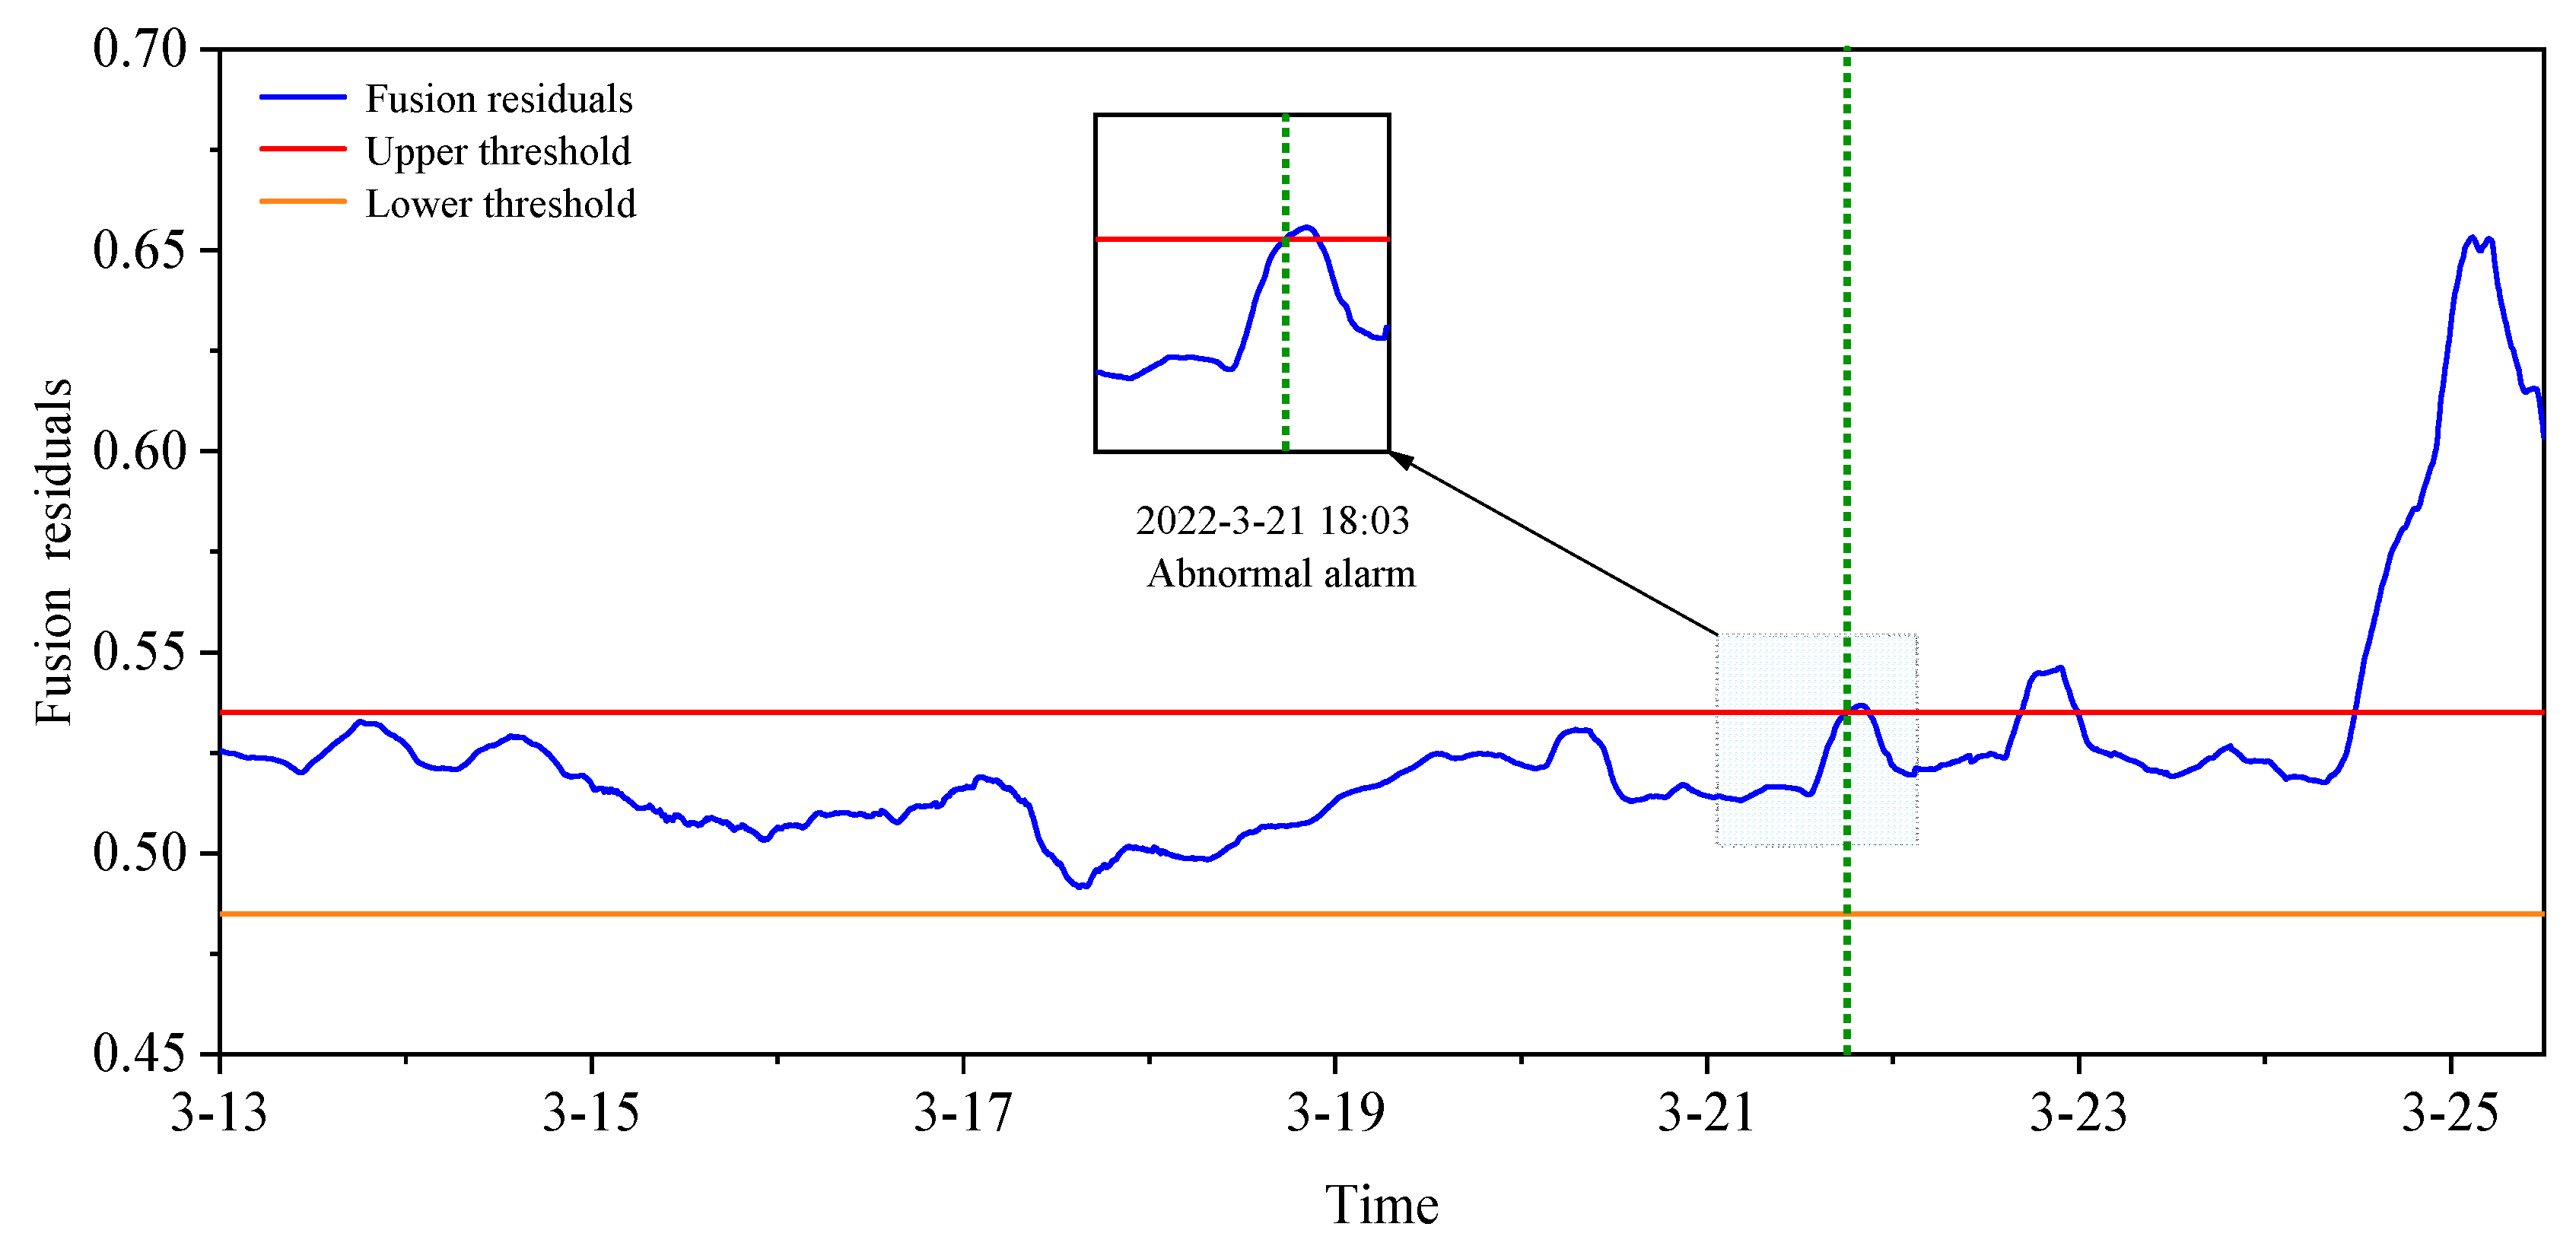
5. Case Verification Analysis

The monitoring method proposed in this paper was verified by using SCADA and CMS data of 2WM wind turbines in one wind farm. Among them, SCADA data were obtained directly from the SCADA monitoring system of the wind turbine, which has a sampling period of 1 min. CMS vibration data were obtained from experiments conducted at the wind turbine. The QA-4G wireless acceleration sensor was used in vibration data collection experiments. This experiment mainly monitored the vibration information of four positions, as shown in Figure 11a: the main shaft bearing, the gearbox low-speed shaft, the gearbox high-speed shaft, and the nacelle vibration. Meanwhile, in order to reduce data loss during wireless transmission, the sampling frequency of CMS vibration data was set to 500 HZ because of the need for long-term monitoring and the lower engagement frequency.
The data in March 2022 were used as the validation set data, totaling 21,700 sets of data. During this period, the wind turbine had a high-temperature alarm on the Drive-end bearing of the generator set at 19:01 on 24 March 2022 (Figure 11b). Then, the wind farm staff shut down the wind turbines for maintenance. We applied the proposed method to the abnormal monitoring of the wind turbine, and the monitoring results are shown in Figure 12.
It can be seen from Figure 12 that the fusion residual exceeded the set threshold at the green dotted line position for the first time. The wind turbine main transmission system’s operational state was monitored for abnormal operation, and the specific time was 21 March 2022, 18:03. The fusion residuals returned to within the threshold over time. However, at 16:40 on 22 March, it exceeded the threshold for the second time, and the fusion residuals returned to the threshold range again shortly afterward. It was not until after 11:31 on 24 March that the residuals substantially exceeded the set threshold. During the monitoring process, there was a phenomenon of residual fallback. The wind speed fluctuated above and below the cut-in wind speed range during these two time periods, which was found when analyzing SCADA data. These made the wind turbine return to the shutdown state soon after startup, which led to the residual fallback phenomenon. It is found that at 19:01 on 24 March 2022, the SCADA system issued a high-temperature warning for the generator drive-end bearing temperature by reviewing the operating log of the wind turbine (Figure 11b). This proves that the method proposed in this paper can be realized as the fault warning.
Figure 13 shows the prediction results of each condition evaluation parameter during this period. The prediction residuals of each condition evaluation parameter fluctuate less when there is no fault in the main transmission system. This also proves that the predictive model using SCADA and CMS data fusion has good generalization capability. When the main transmission system operates abnormally, only the prediction residuals of the generator’s drive-end bearing temperature (Figure 13c) and active power (Figure 13f) show large fluctuations, while the prediction parameters of other evaluation parameters change smoothly. This is also evidence that it is not enough to accurately grasp the operational state of the main transmission system by using a single index, and using multiple metrics fusion will lead to more accurate monitoring results.
Furthermore, to verify the superiority of the proposed method, the monitoring results using only SCADA data were used for comparison, as shown in Figure 14. As seen in Figure 14a, the operation abnormal of the main transmission system using SCADA data alone is monitored at 15:34 on 24 March 2022. However, an operational abnormal warning of the main transmission system was issued at 18:03 on 21 March by adopting the SCADA and CMS data fusion method. In fact, at 19:01 on 24 March, the SCADA system prompted a high-temperature warning for the drive-end bearing of the generator set. Compared with the existing SCADA system, these two monitoring methods can monitor the abnormal operation of the main transmission system in advance. However, the monitoring method based on the fusion of SCADA and CMS data can detect the abnormalities of the main transmission system earlier. This method can realize early warning function 73 h earlier than the existing SCADA system, and the abnormality can be found 69 h in advance compared with the fault monitoring method only with SCADA.

6. Conclusions

To accurately obtain the operational state of the main transmission system and detect its operation abnormal as soon as possible, an early fault warning method of the wind turbine main transmission system based on SCADA and CMS was proposed. The method is applied to an actual wind turbine to verify its feasibility, and the experimental results showed that:
(1) The state evaluation parameters have good prediction results under normal and fault conditions of the main transmission system. The prediction model established by the fusion of SCADA and CMS data has good generalization performance. Meanwhile, its prediction accuracy is higher than the prediction results using SCADA data alone. These will lead to a higher degree of confidence in the final main transmission system operating condition monitoring results.
(2) The main transmission system is a complex coupled system with multiple components. When the operation is abnormal, not all the prediction residuals of the state evaluation parameters fluctuate greatly. Using a single indicator is not enough to accurately characterize the operational state of the main transmission system. We should consider multiple dimensions and use the fusion of multiple indicators to get a more accurate picture of its operational state.
(3) This method can take full advantage of SCADA and CMS data by fusing their characteristic information. The actual monitoring of wind farm turbines revealed that it can monitor the main transmission system operation abnormality earlier compared with the existing SCADA system.
To sum up, the proposed method in this study can effectively and accurately monitor the operational state of the main transmission system. It can provide effective support for the safe and efficient operation of wind turbines and prevent deterioration of turbine failures. However, at present, the method is only applied to 2WM wind turbines in wind farms, and there are few fault samples. Therefore, in future work, this method will be applied to more fault modes of the wind turbine. Meanwhile, we will carry out the division of wind turbine groups and establish a digital and remote intelligent monitoring system for wind turbine clusters.

Author Contributions

Conceptualization, H.C., J.C. and J.D.; methodology, H.C. and J.D.; validation, J.C.; formal analysis, X.W.; investigation, J.C. and X.W.; resources, J.D.; data curation, H.T.; writing—original draft preparation, J.C. and H.T.; writing—review and editing, H.C. and J.D.; project administration, H.C.; funding acquisition, H.C. All authors have read and agreed to the published version of the manuscript.

Funding

This research was funded by the National Natural Science Foundation of the People’s Republic of China (grant number 51975535 and 52075164), the Key R & D Projects of Zhejiang Province (grant number 2021C01133).

Institutional Review Board Statement

Not applicable.

Informed Consent Statement

Not applicable.

Data Availability Statement

The datasets used and/or analyzed during the current study are available from the corresponding author upon reasonable request.

Conflicts of Interest

The authors declare no conflict of interest.

References

  1. Chu, S.; Majumdar, A. Opportunities and challenges for a sustainable energy future. Nature 2012, 488, 294–303. [Google Scholar] [CrossRef] [PubMed]
  2. Wang, T.; Han, Q.; Chu, F.; Feng, Z. Vibration based condition monitoring and fault diagnosis of wind turbine planetary gearbox: A review. Mech. Syst. Signal Process. 2019, 126, 662–685. [Google Scholar] [CrossRef]
  3. Sun, H.; Qiu, C.; Lu, L.; Gao, X.; Chen, J.; Yang, H. Wind turbine power modelling and optimization using artificial neural network with wind field experimental data. Appl. Energy 2020, 280, 115880. [Google Scholar] [CrossRef]
  4. Pérez, J.M.P.; Márquez, F.P.G.; Tobias, A.; Papaelias, M. Wind turbine reliability analysis. Renew. Sustain. Energy Rev. 2013, 23, 463–472. [Google Scholar] [CrossRef]
  5. Li, Y.; Zhu, C.C.; Tao, Y.C.; Song, C.S.; Tan, J.J. Research States and Development Tendency of Wind Turbine Reliability. Chin. J. Constr. Mach. 2017, 28, 1125–1133. [Google Scholar]
  6. Ferguson, D.; McDonald, A.; Carroll, J.; Lee, H. Standardisation of wind turbine SCADA data for gearbox fault detection. J. Eng. 2019, 2019, 5147–5151. [Google Scholar] [CrossRef]
  7. Corley, B.; Carroll, J.; McDonald, A. Fault detection of wind turbine gearbox using thermal network modelling and SCADA data. J. Phys. Conf. Ser. 2020, 1618, 022042. [Google Scholar] [CrossRef]
  8. Pandit, R.K.; Infield, D. SCADA based nonparametric models for condition monitoring of a wind turbine. J. Eng. 2019, 2019, 4723–4727. [Google Scholar] [CrossRef]
  9. Dai, J.; Zeng, H.; Zhang, F.; Chen, H.; Li, M. Study on Obtaining Real Power Curve of Wind Turbines Using SCADA Data. Front. Energy Res. 2022, 10, 3927598. [Google Scholar] [CrossRef]
  10. Dao, P.B.; Staszewski, W.J.; Barszcz, T.; Uhl, T. Condition monitoring and fault detection in wind turbines based on cointegration analysis of SCADA data. Renew. Energy 2018, 116, 107–122. [Google Scholar] [CrossRef]
  11. Chen, N.; Yu, R.; Chen, Y.; Xie, H. Hierarchical method for wind turbine prognosis using SCADA data. IET Renew. Power Gener. 2017, 11, 403–410. [Google Scholar] [CrossRef]
  12. Zhang, F.; Liu, D.S.; Dai, J.C.; Wang, C.; Shen, X.B. An Operating Condition Recognition Method of Wind Turbine Based on SCADA Parameter Relations. J. Mech. Eng. 2019, 55, 1–9. [Google Scholar] [CrossRef]
  13. Fu, J.; Chu, J.; Guo, P.; Chen, Z. Condition monitoring of wind turbine gearbox bearing based on deep learning model. IEEE Access 2019, 7, 57078–57087. [Google Scholar] [CrossRef]
  14. Zhao, H.; Liu, H.; Hu, W.; Yan, X. Anomaly detection and fault analysis of wind turbine components based on deep learning network. Renew. Energy 2018, 127, 825–834. [Google Scholar] [CrossRef]
  15. Bangalore, P.; Letzgus, S.; Karlsson, D.; Patriksson, M. An artificial neural network-based condition monitoring method for wind turbines, with application to the monitoring of the gearbox. Wind. Energy 2017, 20, 1421–1438. [Google Scholar] [CrossRef]
  16. Rezamand, M.; Kordestani, M.; Carriveau, R.; Ting, D.S.-K.; Saif, M. A new hybrid fault detection method for wind turbine blades using recursive PCA and wavelet-based PDF. IEEE Sens. J. 2019, 20, 2023–2033. [Google Scholar] [CrossRef]
  17. Jin, X.; Xu, Z.; Qiao, W. Condition Monitoring of Wind Turbine Generators Using SCADA Data Analysis. IEEE Trans. Sustain. Energy 2021, 12, 202–210. [Google Scholar] [CrossRef]
  18. Chen, H.; Liu, H.; Chu, X.; Liu, Q.; Xue, D. Anomaly detection and critical SCADA parameters identification for wind turbines based on LSTM-AE neural network. Renew. Energy 2021, 172, 829–840. [Google Scholar] [CrossRef]
  19. Leahy, K.; Hu, R.L.; Konstantakopoulos, I.C.; Spanos, C.J.; Agogino, A.M.; O’Sullivan, D.T.J. Diagnosing and PredictingWind Turbine Faults from SCADA Data Using Support Vector Machines. Int. J. Progn. Health Manag. 2018, 9, 6. [Google Scholar] [CrossRef]
  20. Hu, A.; Lian, J.; Xiang, L. Early Fault Identification of Wind Turbine Based on ACNN and BI-LSTM. Acta Energ. Sol. Sin. 2021, 42, 143–149. [Google Scholar]
  21. Peng, J.; Kimmig, A.; Niu, Z.; Wang, J.; Liu, X.; Wang, D.; Ovtcharova, J. Wind turbine failure prediction and health assessment based on adaptive maximum mean discrepancy. Int. J. Electr. Power Energy Syst. 2022, 134, 107391. [Google Scholar] [CrossRef]
  22. Zimrozand, R.; Bartkowiak, A. Investigation on spectral structure of gearbox vibration signals by principal component analysis for condition monitoring purposes. J. Phys. Conf. Ser. 2011, 305, 012075. [Google Scholar] [CrossRef]
  23. Pan, Y.; Hong, R.; Chen, J.; Singh, J.; Jia, X. Performance degradation assessment of a wind turbine gearbox based on multi-sensor data fusion. Mech. Mach. Theory 2019, 137, 509–526. [Google Scholar] [CrossRef]
  24. Ogataand, J.; Murakawa, M. Vibration-based anomaly detection using FLAC features for wind turbine condition monitoring. In Proceedings of the 8th European Workshop on Structural Health Monitoring, Bilbao, Spain, 5–8 July 2016; pp. 5–8. [Google Scholar]
  25. Li, C.; Sanchez, R.-V.; Zurita, G.; Cerrada, M.; Cabrera, D.; Vásquez, R.E. Gearbox fault diagnosis based on deep random forest fusion of acoustic and vibratory signals. Mech. Syst. Signal Process. 2016, 76, 283–293. [Google Scholar] [CrossRef]
  26. Li, Z.E.; Zhang, X.Y.; Hu, W.; Xie, L.R. State Assessment and Prediction of Wind Turbine High Speed Shaft Bearing Based on Health Index. Acta Energ. Sol. Sin. 2021, 42, 290–297. [Google Scholar]
  27. Huang, N.T.; Yang, X.H.; Cai, G.W.; Song, X.; Chen, Q.Z.; Zhao, W.G. A Deep Adversarial Diagnosis Method for Wind Turbine Main Bearing Fault with Imbalanced Small Sample Scenarios. Proc. CSEE 2020, 40, 563–574. [Google Scholar]
  28. Pu, Z.; Li, C.; Zhang, S.; Bai, Y. Fault diagnosis for wind turbine gearboxes by using deep enhanced fusion network. IEEE Trans. Instrum. Meas. 2020, 70, 1–11. [Google Scholar] [CrossRef]
  29. Gómez, M.; Marklund, P.; Strombergsson, D.; Castejón, C.; García-Prada, J.C. Analysis of vibration signals of drivetrain failures in wind turbines for condition monitoring. Exp. Tech. 2021, 45, 1–12. [Google Scholar] [CrossRef]
  30. Isham, M.F.; Leong, M.S.; Lim, M.H.; Bin Ahmad, Z.A. Intelligent wind turbine gearbox diagnosis using VMDEA and ELM. Wind. Energy 2019, 22, 813–833. [Google Scholar] [CrossRef]
  31. Rashid, H.; Khalaji, E.; Rasheed, J.; Batunlu, C. Fault Prediction of Wind Turbine Gearbox Based on SCADA Data and Machine Learning. In Proceedings of the 2020 10th International Conference on Advanced Computer Information Technologies (ACIT), Deggendorf, Germany, 13–15 May 2020; pp. 391–395. [Google Scholar]
  32. Zhao, H.S.; Liu, Y.S.; Zhang, X.T.; Guo, W. Research on early Fault Prediction of Wind Turbine Gearbox. Adv. Mater. Res. 2013, 608, 522–528. [Google Scholar] [CrossRef]
  33. Qiao, S.; Zhou, J.X.; Zhang, X.F.; Wang, C.L.; Shen, Y. Dynamic Temperature Response and Experimental Study of Two-Stage Gear Transmission System In Wind Turbine. Acta Energ. Sol. Sin. 2022, 43, 116–124. [Google Scholar]
  34. Dai, J.; Hu, Y.; Liu, D.; Wei, J. Modelling and analysis of direct-driven permanent magnet synchronous generator wind turbine based on wind-rotor neural network model. Proc. Inst. Mech. Eng. Part A J. Power Energy 2012, 226, 62–72. [Google Scholar] [CrossRef]
  35. Dai, J.; Yang, W.; Cao, J.; Liu, D.; Long, X. Ageing assessment of a wind turbine over time by interpreting wind farm SCADA data. Renew. Energy 2018, 116, 199–208. [Google Scholar] [CrossRef] [Green Version]
  36. Lei, Y.G.; He, Z.J.; Zi, Y.Y. Fault Diagnosis Based on Novel Hybrid Intelligent Model. J. Mech. Eng. 2008, 44, 112–117. [Google Scholar] [CrossRef]
  37. LeCun, Y.; Bengio, Y.; Hinton, G. Deep learning. Nature 2015, 521, 436–444. [Google Scholar] [CrossRef]
  38. Delgado, I.; Fahim, M. Wind turbine data analysis and LSTM-based prediction in SCADA system. Energies 2020, 14, 125. [Google Scholar] [CrossRef]
  39. Zhu, Y.; Zhu, C.; Tan, J.; Wang, Y.; Tao, J. Operational state assessment of wind turbine gearbox based on long short-term memory networks and fuzzy synthesis. Renew. Energy 2022, 181, 1167–1176. [Google Scholar] [CrossRef]
Figure 1. Wind turbine component failure distribution and maintenance downtime of each component.
Machines 10 01018 g001
Figure 2. Curves of the active power, spindle rotational speed, and vibration acceleration.
Machines 10 01018 g002
Figure 3. Flowchart of the early fault warning.
Machines 10 01018 g003
Figure 4. Wind speed–power curve.
Machines 10 01018 g004
Figure 5. Prediction diagram of main transmission system state evaluation parameters.
Machines 10 01018 g005
Figure 6. Prediction results based on SCADA and CMS data fusion.
Machines 10 01018 g006
Figure 7. Prediction results based on SCADA data.
Machines 10 01018 g007
Figure 8. Evaluation of model prediction accuracy.
Machines 10 01018 g008
Figure 9. Trend of residual variation.
Machines 10 01018 g009
Figure 10. Fusion of residual probability density distribution histograms with KDE plots.
Machines 10 01018 g010
Figure 11. Field test and wind turbine operation logs. (a) Text site; (b) Wind turbine operation logs.
Machines 10 01018 g011
Figure 12. Graph of monitoring results.
Machines 10 01018 g012
Figure 13. Prediction results of each condition evaluation parameter.
Machines 10 01018 g013
Figure 14. Comparison of monitoring results.
Machines 10 01018 g014
Table 1. CMS parameters and MIC values of main transmission system state evaluation parameters.
State Evaluation
Parameters
Active PowerGearbox High-Speed Bearing TemperatureGearbox Low-Speed Bearing TemperatureGearbox Oil TemperatureGenerator Drive-End Bearing TemperatureGenerator Non-Drive-End Bearing Temperature
SCADA Feature
Parameters
Root Mean Square0.8310.6570.6800.5480.6860.536
Peak-To-Peak Value0.8420.7060.7500.6430.7480.634
Form Factor0.8670.7160.7610.6880.7320.689
Pulse Factor0.6460.6400.6330.6280.6280.627
Margin Factor0.5950.5860.5820.5660.5720.562
Cliffness Factor0.4710.3570.3610.3090.3650.352
Kurtosis Factor0.4800.2890.3470.2210.3290.284
Signal Energy0.830 0.6570.6800.5480.6860.536
Skewness0.281 0.3100.2900.2600.3300.270
Gravity of Frequency0.762 0.5180.5480.6450.5820.585
Average amplitude0.910 0.7360.8070.6110.7610.640
Standard Deviation of Frequency0.800 0.6310.6680.5200.6610.574
Root Mean Square of Frequency0.720 0.6730.6390.5360.6570.562
Table 2. Time and frequency domain feature parameters and formula.
Feature NameFormulaFeature NameFormula
Root Mean Square x r m s = 1 N n = 1 N x 2 ( n ) Signal Energy U f = n = 1 N x ( n ) 2
Peak-To-Peak Value x p p = x max x min Gravity of Frequency F C = k = 1 K f k s ( k ) k = 1 K s ( k )
Form Factor S f = x r m s 1 N n = 1 N x ( n ) Average amplitude F = k = 1 K s ( k ) / K
Pulse Factor I f = x max 1 N n = 1 N x ( n ) Standard Deviation of Frequency F R M S F = k = 1 K ( f k F C ) 2 s ( k ) K 1
Margin Factor C L f = x max 1 N n = 1 N x ( n ) 2 Root Mean Square of Frequency F R M S = k = 1 K f k 2 s ( k ) k = 1 K s ( k )
Note: x ( n ) is the feature sequence vector, N is the feature sequence vector length, x max , x min are the maximum and minimum values of the feature sequence vector, s ( k ) is the spectrum of signal x ( n ) , and f k is the frequency value of K spectral lines.
Table 3. SCADA parameters and MIC values of main transmission system state evaluation parameters.
State Evaluation
Parameters
Active PowerGearbox High-Speed Bearing TemperatureGearbox Low-Speed Bearing TemperatureGearbox Oil TemperatureGenerator Drive-End Bearing TemperatureGenerator Non-Drive-End Bearing Temperature
SCADA Feature
Parameters
Average spindle rotation speed0.9590.810.7630.6080.5480.579
30-s average wind speed0.9280.7160.760.610.5870.65
Average value of torque feedback0.8820.7270.7720.6040.5390.569
Average value of V-phase winding temperature of generators0.7880.7490.7620.6530.6420.638
Average value of W-phase winding temperature of generators0.7810.7420.760.6510.6430.632
Average value of U-phase winding temperature of generators0.7580.7160.7320.6230.6440.621
Average value of generator speed0.9390.8420.7680.620.5590.602
Average value of generator slip-ring temperature0.610.7970.7880.7680.9180.866
Average ambient temperature outside the cabin0.4350.5490.5520.5840.4520.489
Average value of gearbox inlet temperature0.6060.840.840.880.6320.731
Average gearbox oil pressure0.8740.5910.6010.6880.430.47
Table 4. Selected SCADA feature parameters.
SymbolsParameter NameUnitSymbolsParameter NameUnit
v z Average spindle rotation speed r p m T l Gearbox low-speed bearing temperature ° C
v f Average value of generator speed r p m T i n Average value of gearbox inlet temperature ° C
v w 30-s average wind speed m / s T h Average value of generator slip-ring temperature ° C
P Active power K W T f u Average value of U-phase winding temperature of generators ° C
T q Generator drive-end bearing temperature ° C T f w Average value of V-phase winding temperature of generators ° C
T f q Generator non-drive-end bearing temperature ° C T f w Average value of W-phase winding temperature of generators ° C
T g o Gearbox oil temperature ° C T Average value of torque feedback N m
T g Gearbox high-speed bearing temperature ° C P a Average gearbox oil pressure b a r
Table 5. LSTM network parameters setting.
HyperparametersValues
Hidden layers3
Time step20
Iteration cycle500
Batch size64
Loss functionMSE
OptimizerAdam
Learning rate0.005
Dropout setting value0.25
Table 6. Weight of each parameter.
State evaluation ParametersWeights
Active power0.290
Generator drive-end bearing temperature0.149
Generator non-drive-end bearing temperature0.134
Gearbox oil temperature0.077
Gearbox low-speed bearing temperature0.177
Gearbox high-speed bearing temperature0.173
Publisher’s Note: MDPI stays neutral with regard to jurisdictional claims in published maps and institutional affiliations.

