Article

Experimental Study on the Influence of a Two-Dimensional Cosine Hill on Wind Turbine Wake

1
Guangling College, Yangzhou University, Yangzhou 225000, China
2
Key Laboratory of Wind Energy and Solar Energy Technology, Inner Mongolia University of Technology, Hohhot 010051, China
3
College of Electrical, Energy and Power Engineering, Yangzhou University, Yangzhou 225127, China
*
Author to whom correspondence should be addressed.
Machines 2022, 10(9), 753; https://doi.org/10.3390/machines10090753
Submission received: 13 August 2022 / Revised: 26 August 2022 / Accepted: 28 August 2022 / Published: 1 September 2022
(This article belongs to the Special Issue Wind Turbine Technologies)

Abstract

:
The accurate prediction of wind energy distribution on the terrain has been of great significance for wind farm selection. Therefore, this paper evaluated the influence of a two-dimensional hill with a relatively large slope (i.e., 0.83) on wind turbine wake. Firstly, the wakes on flat terrain and wind characteristics around a single hill were investigated by using a hot-wire anemometer. Subsequently, wake distributions combined with the hill were measured when the turbine was located 2D in front and on the hilltop. The results of the hill showed that a flow separation was formed within 6D of the leeward side (where D is the rotor diameter). The turbulence intensity increased initially and then decreased as height increased, leading to a high turbulence region 2.28 times the hill height, according to the experiment of a wind turbine combined with the hill. In conclusion, wake recovery was promoted on the windward side and 4D behind the hilltop. As the longitudinal coordinate increased, the intensity of the turbulence changed to a single peak, and the peak value was more than twice as high as on flat terrain. Based on this, it may be possible to optimize the design of wind turbines for better performance.

1. Introduction

In the last few years, the wind power industry has experienced rapid growth, the location selection of wind farms is moderately diversified, and more and more wind farms are located in mountains, hills, and other complex terrains. According to the relevant literature [1,2,3], by creating a wake, the wind turbines upstream reduce the generation power and increase the fatigue load of their downstream counterparts. Due to the fact that the performance of a turbine wake is extremely dependent on the velocity of inflow, the intensity of turbulence, and the conditions of the upstream turbine, the wind turbine wake could interact with the topography in complex terrains, forming wake development laws different from flat terrains [4,5]. Consequently, the wake effect should be a critical factor that needs to be considered in evaluating wind farm power generation and micro-site selection, and detailed research about this is of great practical importance.
Wind turbine wake characteristics in complex terrains have been studied extensively over the past few years by numerous scholars through various methods. In the field measurement, the wake distribution of wind turbines under complex terrain is the focus of scholars. Lidar measurements of a single 2 MW turbine located on a double-ridge position were conducted by Menke et al. [6]. It was determined that the wake displacements resulted from fluctuations in the flow field caused by the changes in atmospheric stability and topographic features. A measurement examined the performance of wind farms with complicated terrain and another on a ridge with a single turbine; Hansen et al. [7] analyzed the comparison results in detail. This research showed that the wake tracks presented different development trends day and night. Subramanian et al. [8] used UAVs (Unmanned Aerial Vehicles) to measure the wake of a single wind turbine in the Mont Crosin wind farm and Altenbruch II wind farm, respectively. Compared with these two different forms of terrain, in the near-wake region, the wake structure of hilly terrain was about 35% shorter than on flat terrain, while in the far-wake region, the distribution was roughly no different.
By reason of high costs and extended period of field measurement, it cannot be widely applied. Hence, some scholars choose to conduct wind tunnel experiments to determine wind turbines’ wake characteristics. Ibrahim et al. [9] studied a two-dimensional hill’s wake velocity profile with a hill slope of 0.328 and its change in wake width around the hill. It was found that the wake width gradually decreased from the foot of the windward hill to the top. In contrast, when it reached the leeward side, the width mildly increased. Tian et al. [10] conducted the wake structure of a model wind turbine by testing the flow field of a two-dimensional hill with a slope of 0.25. Studies have shown that when the wind flows toward the hilltop, it causes a speed-up effect. Hence, the turbine installed on the uphill position and the hilltop could produce more power and less fatigue load than the case without the hill. Moreover, in this test scheme, when the wind turbine was placed downhill, in contrast to on flat terrain, the power output was even higher, and the fatigue load was correspondingly more elevated, which needs to be considered in future designs. Hyvarinen and Segalini [11] explored the variation rule of wind turbine wake in a series of two-dimensional sinusoidal hills (hill slope = 0.156) through wind tunnel experiments. It was confirmed that compared with flat terrain, the velocity recovered faster at hub height on complex terrain. As part of their study, Hyvarinen and Segalini [12] also examined wind turbine wake structures for two aligned turbines and a single turbine on identical terrain. Based on the investigation findings, it has been found that if wind turbines were aligned, the turbine wakes had an apparent deviation in the height direction. Furthermore, a model hill and a wind turbine were arranged by Howard et al. [13] after the test wind turbine, respectively. By measuring the time-averaged and pulsating electrical power of the downstream turbine, the influences of the aerodynamic characteristics combined with a hill (slope = 0.67) and a turbine upstream of the downstream turbine were discussed, and the correlation function of the instantaneous output voltage sequence was analyzed. The results showed that the 25% and 30% reductions in downstream time-averaged and pulsed power resulted from the upstream turbine, respectively. In comparison, the upstream hill reduced the time-averaged power of the downstream turbine by 13% but increased the pulsation output power by 7%.
The study of wake characteristics under complex terrain also has widely used numerical simulation methods [14,15,16,17,18]. In these studies, the hill slope was less than 0.57. Furthermore, the Reynolds-averaged Navier–Stokes equations (RANS) method was adopted by Astolfi et al. [19] to simulate wind turbine clusters in southern Italy. The simulation indicated that the terrain effect would considerably distort the wake of wind turbines, resulting in the severe asymmetry of wake velocity distribution. Compared with flat terrain, complex terrain allows a wind turbine to recover from wake faster. In a small coastal wind farm with complex terrain, Makridis and Chick observed the wake effect by comparing the results with those measured in the natural field with an effective slope ≈ 0.27. They pointed out that the numerical simulation slightly overestimated the velocity deficit in the wake (about 10% to 13%). However, the maximum error could reach 30% in a farther wind direction [20]. A simulation by Zhou et al. [21] examined the turbine wake performance under different positions relative to the two continuous model hills with slopes equal to 0.32 and 0.2, respectively. Upon further investigation, it came to light that the turbine had the highest power output when installed at the second hilltop. If the wind turbine was located downstream of a hill, it was highly recommended that the stall zone be avoided as much as possible. Besides, the turbine located at the side position had higher power than the turbine sited at the front and rear of the hill. As described in Dar et al. [22], the large eddy simulation method was applied to simulate the wake structures in flat and complex terrains with slopes of 0.57 and 0.77, and they observed that the self-similarity preservation range of wind turbine wakes in complex terrains was greatly shortened. It was reported by Xu et al. [23] that a lattice Boltzmann method was carried out to explore the impact of hilly terrain with three slopes (i.e., slopes = 0.26, 0.58 and 1.0) on the wind turbine wakes. They found that the smaller the slope, the closer the downward-moving track of the wake would be to the leeward of the hill.
As described in the literature above, research on wind turbine’s wake characteristics under complicated topography has experienced numerous investigations with experimental and numerical analyses. However, the average slope (the ratio between the height of a hill and the horizontal distance) of the terrain involved in most existing studies was relatively small. Even though natural wind turbines were sited in those steeper hilly terrains, very few test studies have been published on their wake characteristics. Flow separation seems to occur with a more significant slope in the leeward of hills, and the greater the slope, the more intense the flow separation. Nevertheless, there is still much work to be done in understanding how the wind turbine wake changes as a result of such steep hilly terrains interacting with them. Therefore, the purpose of this study was to describe the wind turbine wake structure combined with a two-dimensional hill model with a larger slope. These results could be used as a reference, validating the wind parameters so as to make power generation and load calculation more accurate. Wind turbine wake experiments on flat and hilly terrain were performed to analyze the influence of hills on the wake characteristics to guide power generation prediction and micro-site selection under complex terrain. The paper is organized as follows. In Section 2, the experimental setup is described, including the wind turbine model, hill model, and test setup. As discussed in Section 3, the velocity and turbulence intensity distributions at different locations are examined. The conclusion, accompanied by the experimental investigations, is given in the last section.

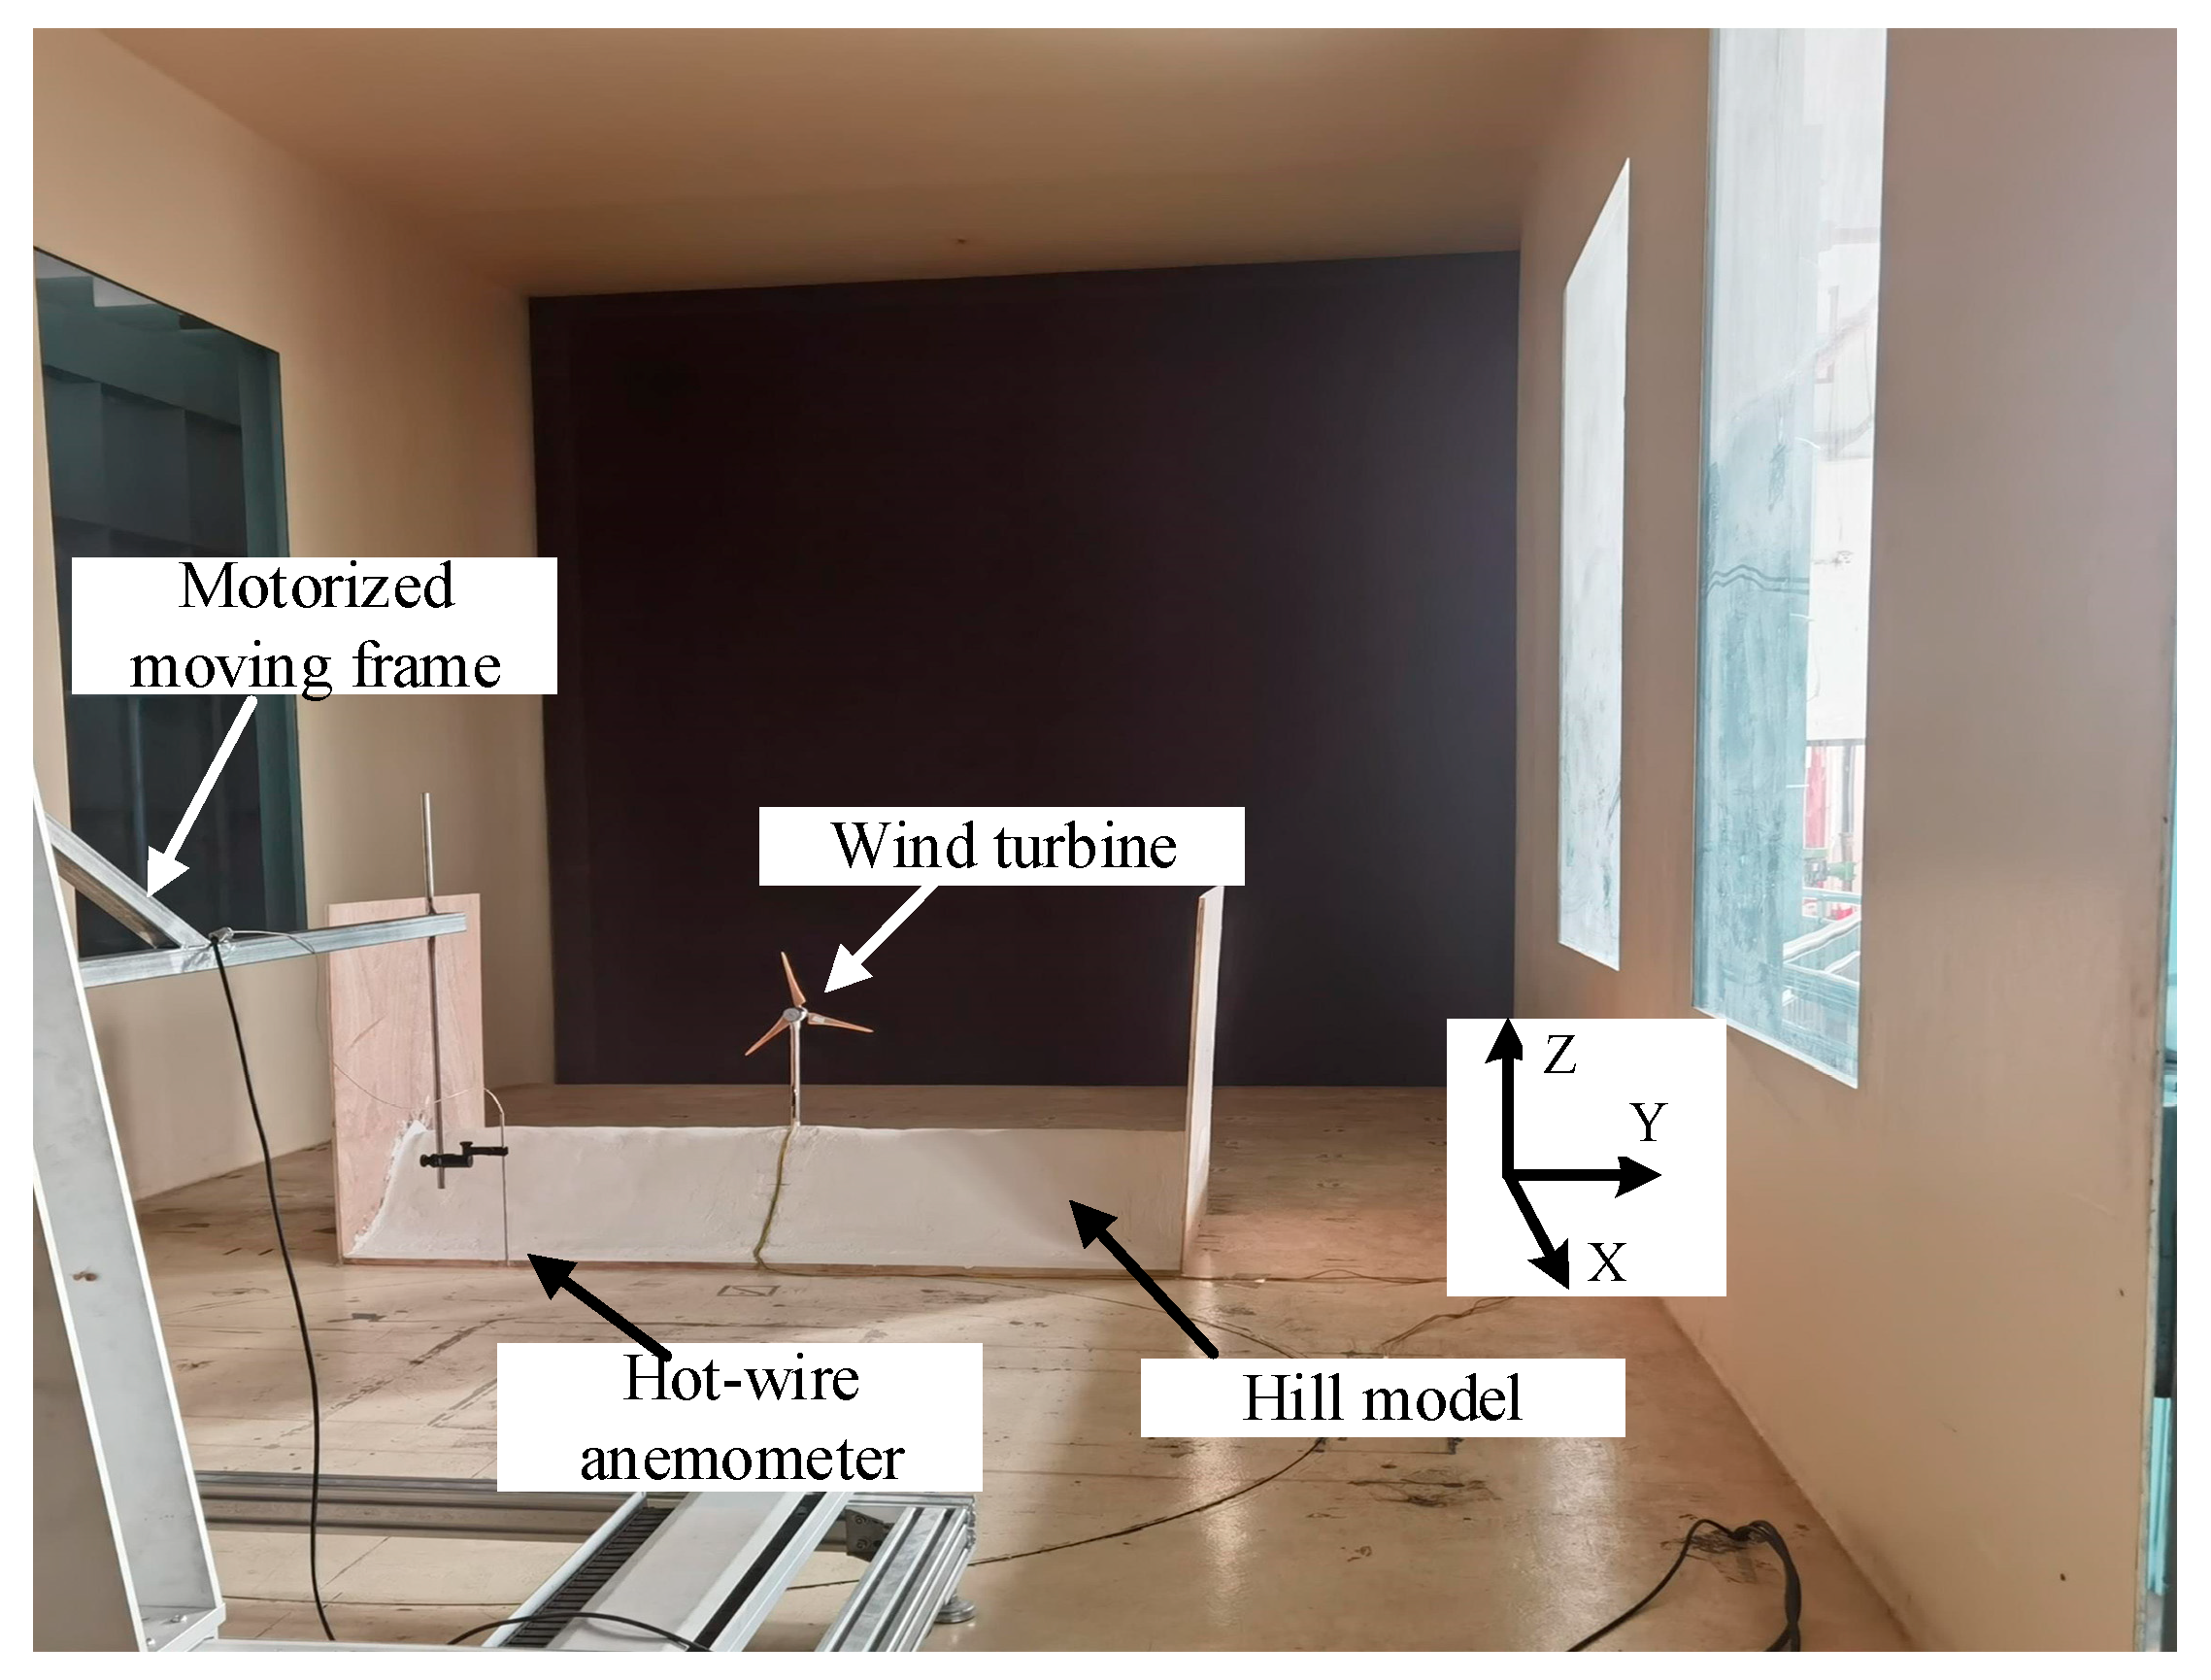
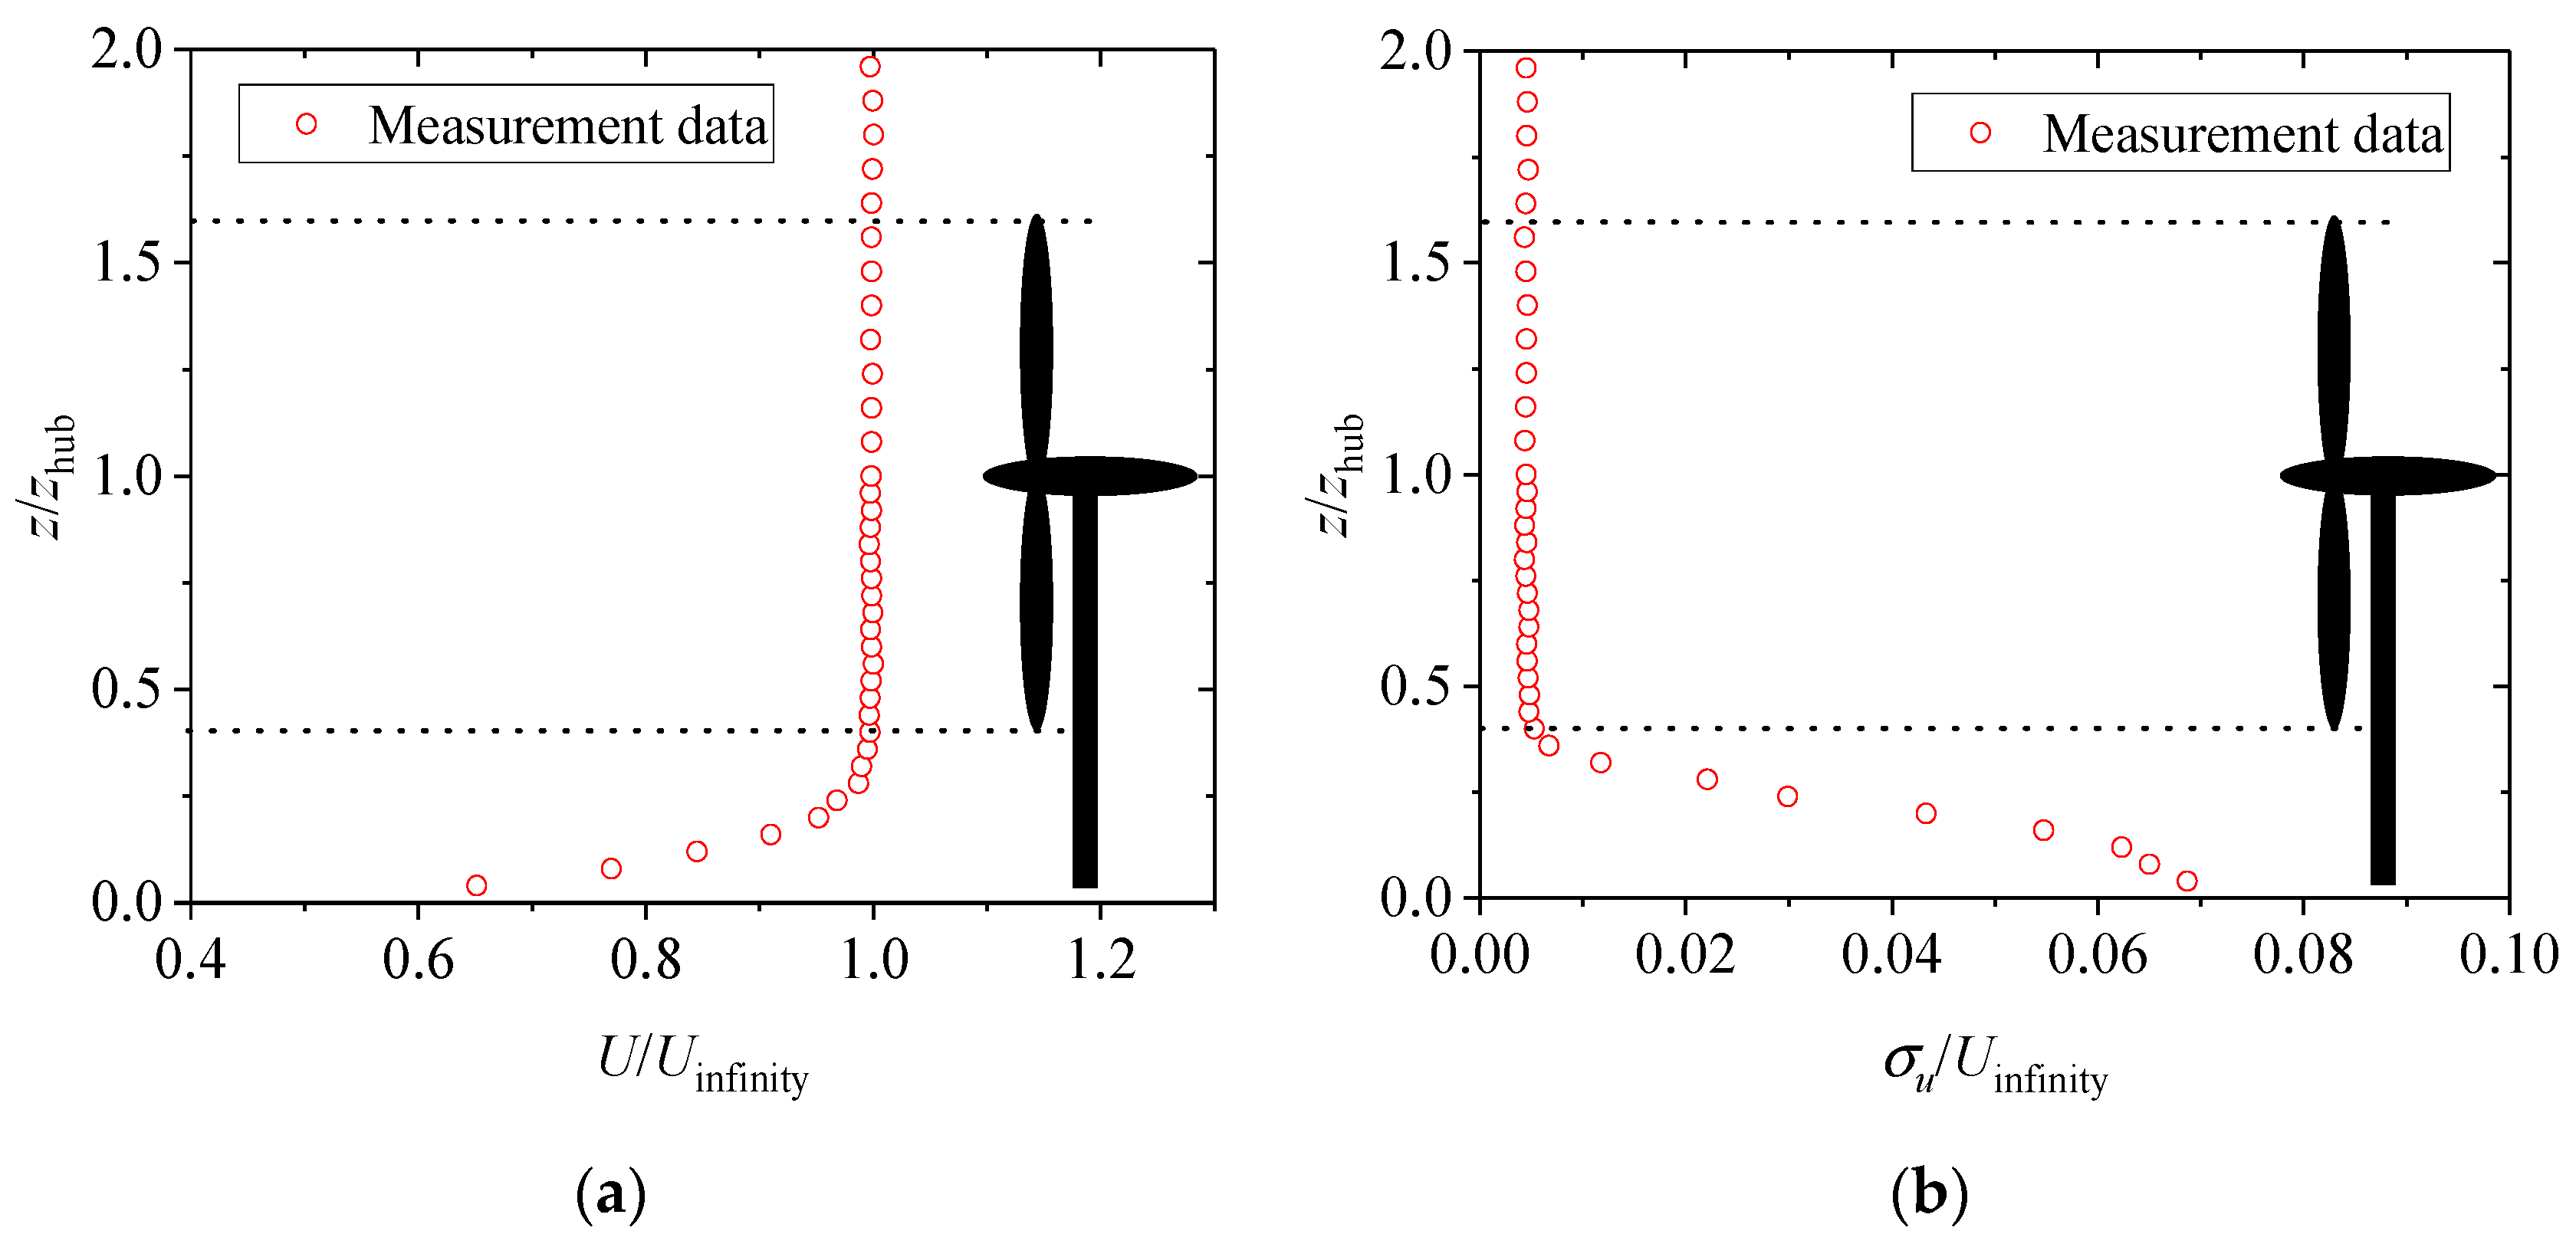
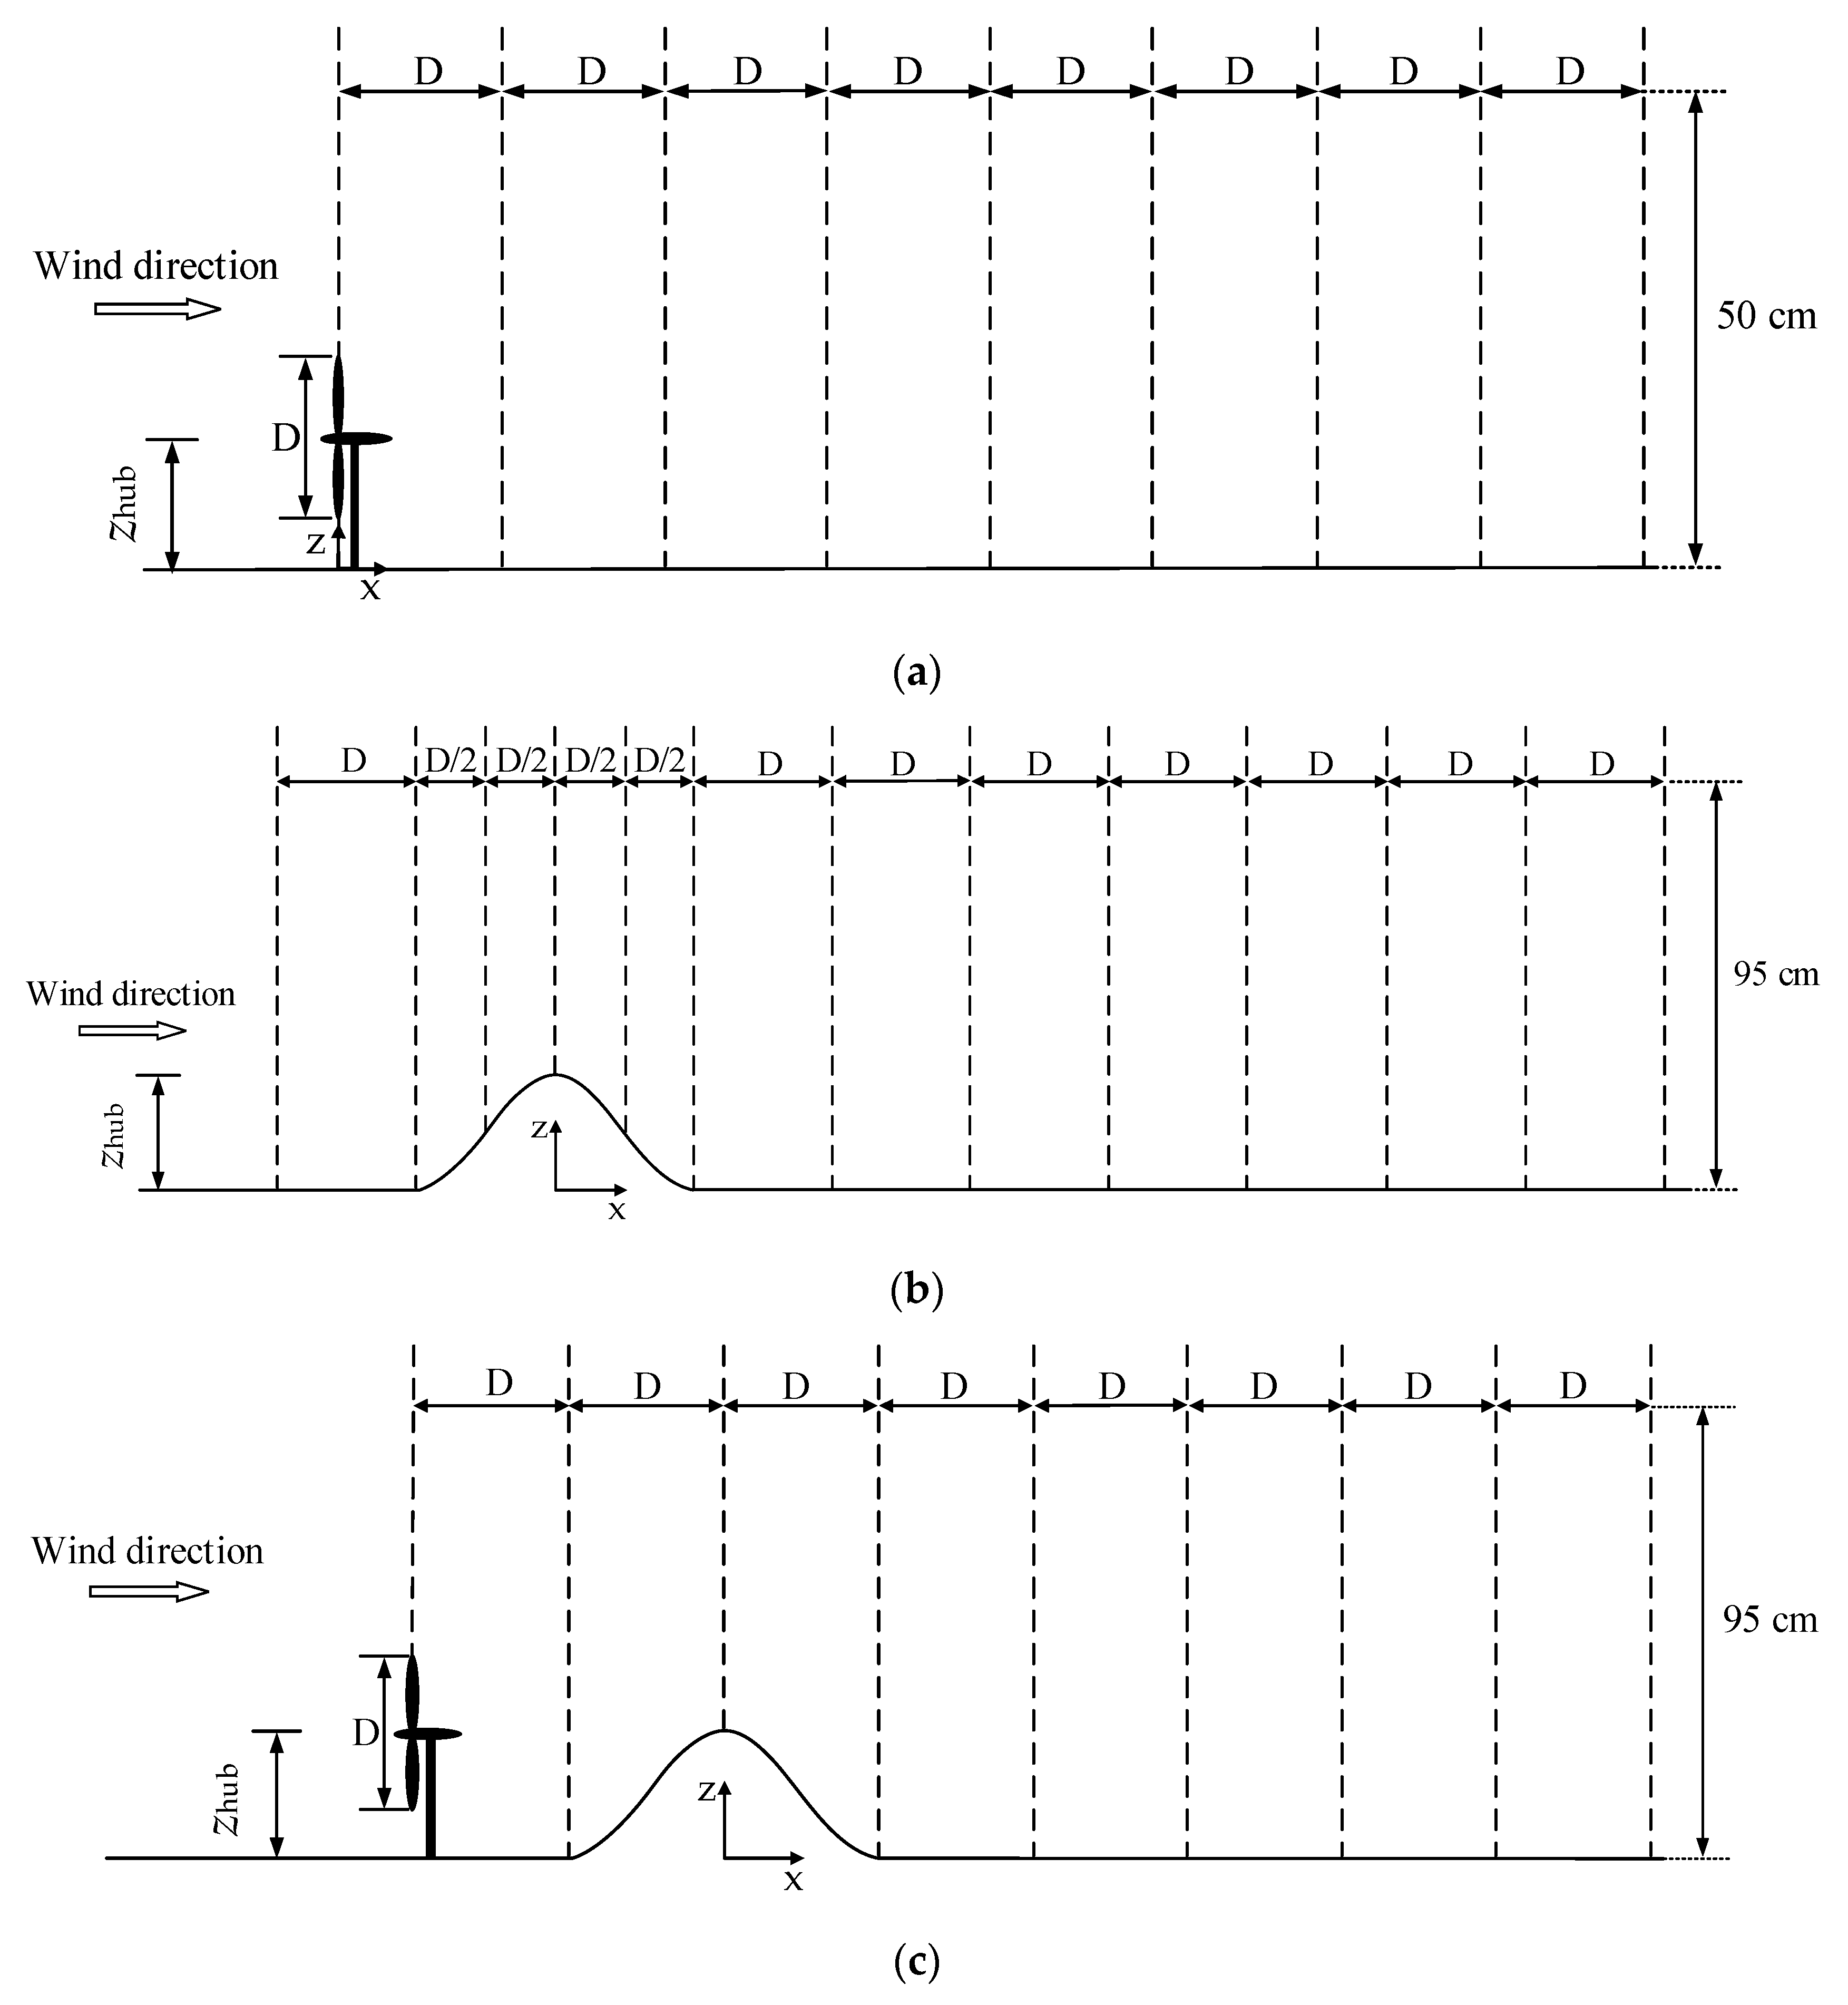
2. Experimental Setup

This wind tunnel experiment was conducted at Yangzhou University, and the closed loop wind tunnel has two test sections. In the larger section with cross-sectional parameters of 3 m × 3 m, a length of 3 m, measurements were performed. The axial fan was driven by an alternating current motor that had a function of 185 kW, and the maximum velocity in this test section was 25 m/s. Detailed information about this wind tunnel can be found in Refs. [24,25].
During the tests, a horizontal axis wind turbine was used. The test model was composed of the rotor, miniature direct current (DC) motor, tower, fixed base, and DC motor bracket. The rotor was designed by three-dimensional modeling and printing, the red wax resin materials were used to satisfy the hardness, toughness, and surface smoothness requirements, and the blades were made up of a series of DTU-LN221 airfoils (Technical University of Denmark, Kongens Lyngby, Denmark). The airfoil was designed with low noise, low sensitivity to roughness, and high lift; the diameter of the blade was D = 0.3 m, as seen in Figure 1. To improve the aerodynamic characteristics of the rotary rotor, a three-dimensional inverse problem aerodynamic optimization design was carried out. Hence, the impact of the low tangential velocity close to the blade root, caused by the small relative radius and the tip loss effect near the blade tip, with a low Reynolds number, was mitigated [26].
It can be seen on the right side of Figure 1 that the parameters of this small-scale turbine blade include chord length and twist angle. According to this, the twist angle and chord length of the turbine blade smoothly decrease along the spanwise direction, and the maximum twist angle was 20.59° at 24.1% of the relative radius. By using a bracket, the miniature DC motor was mounted on the tower. The tower was made from steel rods measuring 16 mm in diameter, and the distance from the rotor was about 4.0 cm. Furthermore, a steel plate was bonded at the bottom of the steel rod as the base of the test model, and a 31ZYT57-R permanent-magnet DC motor was used in the present study (De Sheng Motor Co., Ltd., Dongguan, Guangdong, China). In order to drive the motor efficiently, an additional DC constant-voltage power supply was used, and the rotational speed was measured using a Hall sensor. The turbine model had a hub height of zhub = 0.25 m, and more detailed design parameters are exhibited in Figure 1.
As a matter of fact, the Reynolds number of a large wind turbine in actual operation is different from that of the wind tunnel experiment. It was calculated that the Reynolds number was about 104 orders of magnitude in this study, much lower than the 106 to 107 values of a large-scale wind turbine. Referring to similar wind tunnel tests [27,28], the reduction in the diameter of the turbine could result in a corresponding decrease in the Reynolds number and degradation of power output performance. However, according to the conclusion from Ref. [29], the wake turbulence behavior, including the turbulent flow structures and unsteady vortices, was almost independent of the Reynolds number. In addition, as recommended by the conclusion of Chamorro et al. [30], when the hub height velocity and rotor diameter were taken as the characteristic length, the main flow statistics of the wake were independent, with the Reynolds number reaching above 9.3 × 10⁴. In contrast, the Reynolds number calculated from this test was 1.6 × 10⁵. In this way, it is important to note that the results of these lower Reynolds numbers were also meaningful and it can thus be ensured that numerical results are accurate by providing verification.
Figure 2 shows the test model used in this experiment. The hill, which spanned 1.5 m, was made of special wood panels in the interior and filled with high-density foam to reduce weight. In addition, two end-plates were added on the transverse ends of the model, respectively, to ensure nominally two-dimensional flow on the model tests.
The contour line of the model adopted a cosine curve, as shown in Equation (1):
z = h cos 2 ( π x 2 L )
where z and x are the vertical and longitudinal directions. Since h = 25 cm represents the hill model height and L = 30 cm represents the length of the half hill, the slope was calculated by h/L ≈ 0.83.
According to Mason and King [31], flow separation over hilly terrain requires a critical slope of approximately 0.3. Thus, the test model in this study can represent typical steep hilly terrains with flow separation. For the hill model and the test turbine, the blockage ratios were 4.167% and 0.785%, respectively. The total value was considerably lower than the 10% suggested by Ryi et al. [32] and Meng et al. [33], so the blockage effect was not considered in this measurement.
As shown in Figure 3, the hot-wire anemometer made by Dantec corporation and a 55P11 probe were used for the flow field experiment (Dantec Dynamics A/S, Copenhagen, Denmark). The two-point calibrator 9054H0101 first acquired the relational expression of the instantaneous velocity and then collected the velocities through the multi-channel acquisition system CTA-54N81 (Dantec Dynamics A/S, Copenhagen, Denmark). In order to fully describe the wake interference variation and reduce the possible flow interference, the hot-wire probe was set vertically. Furthermore, to more conveniently measure the velocity changes at multiple points, a three-dimensional motorized moving frame was employed to accurately determine the exact location of the measuring points with a minimum moving distance of 1.0 mm.
In addition, experiments in this paper were carried out under uniform inflow conditions, and the average inflow velocity was maintained at 8.0 m/s at hub height (i.e., Uinfinity = 8.0 m/s). This is because, as Uehara et al. [34] reported, when hill height was taken as the characteristic length, the turbulence structure behind hills with a Reynolds number greater than 2.9 × 10⁴ was similar. Figure 4a,b displays the non-dimensional mean inflow velocity U/Uinfinity and the turbulence intensities Iu along the vertical direction for this measurement, respectively. The Iu was calculated as σu/Uinfinity, where σu is the root mean square of the instantaneous velocity. These two figures illustrate that the distributions seemed to be nearly constant in the test direction of the rotor inflow velocity. For the stochastic uncertainty in the experiment, refer to the relevant research [35]. Multiple repeated samples could overcome the stochastic uncertainties in the test to minimize the uncertainty. In this respect, the sampling frequency was set at 5 kHz, and the number of samplings was 50,000. The limitation of this study was that the atmospheric distribution on the natural ground would change due to the influence of temperature. In this test, the temperature was the same, and all measurements were made in a single hill model. Therefore, more studies would be needed to evaluate a mountainous model.
The measurements were performed to determine the wake distributions of a single wind turbine, the flow field characteristics around a two-dimensional cosine hill, and the wake characteristics of the complex terrain with a wind turbine with two times the rotor diameter in front of the hill and with a wind turbine on the hilltop, respectively. These four layouts of the measurements are shown in Figure 5. In the case of the flat terrain wind turbine, the test range covered the wake distribution area, where flow fields were measured at the positions of x/D = 1, 2, 3, 4, 5, 6, 7 and 8, respectively. The measuring points in all the test sections were arranged on the vertical center line of the wind turbine. The height range was z = 1–50 cm in flat terrain, and the interval between the measuring points was 1 cm (the same below). The wind turbine should operate under similar conditions to make the comparisons more meaningful. Hence, the blade tip speed ratio λ = 6 was selected. The λ can be calculated using Equation (2), which was considered the velocity at the hub height and the rotational speed.
λ = n π D 60 U infinity
where n is the rotational speed, and Uinfinity is the average inflow velocity at hub height.
For the case of flow field characteristics around a two-dimensional cosine hill, the velocity distributions were measured in the positions of x/D = −2, −1, 0.5, 0, 0.5, 1, 2, 3, 4, 5, 6, 7 and 8, respectively. The arrangement of the measuring points of a broader range for z = 1–95 cm was adopted (the same below). For two cases of the wind turbine coupling a hill, the wake distributions were measured as follows: in the downstream locations of x/D = 1, 2, 3, 4, 5, 6, 7 and 8, respectively.

3. Results and Discussion

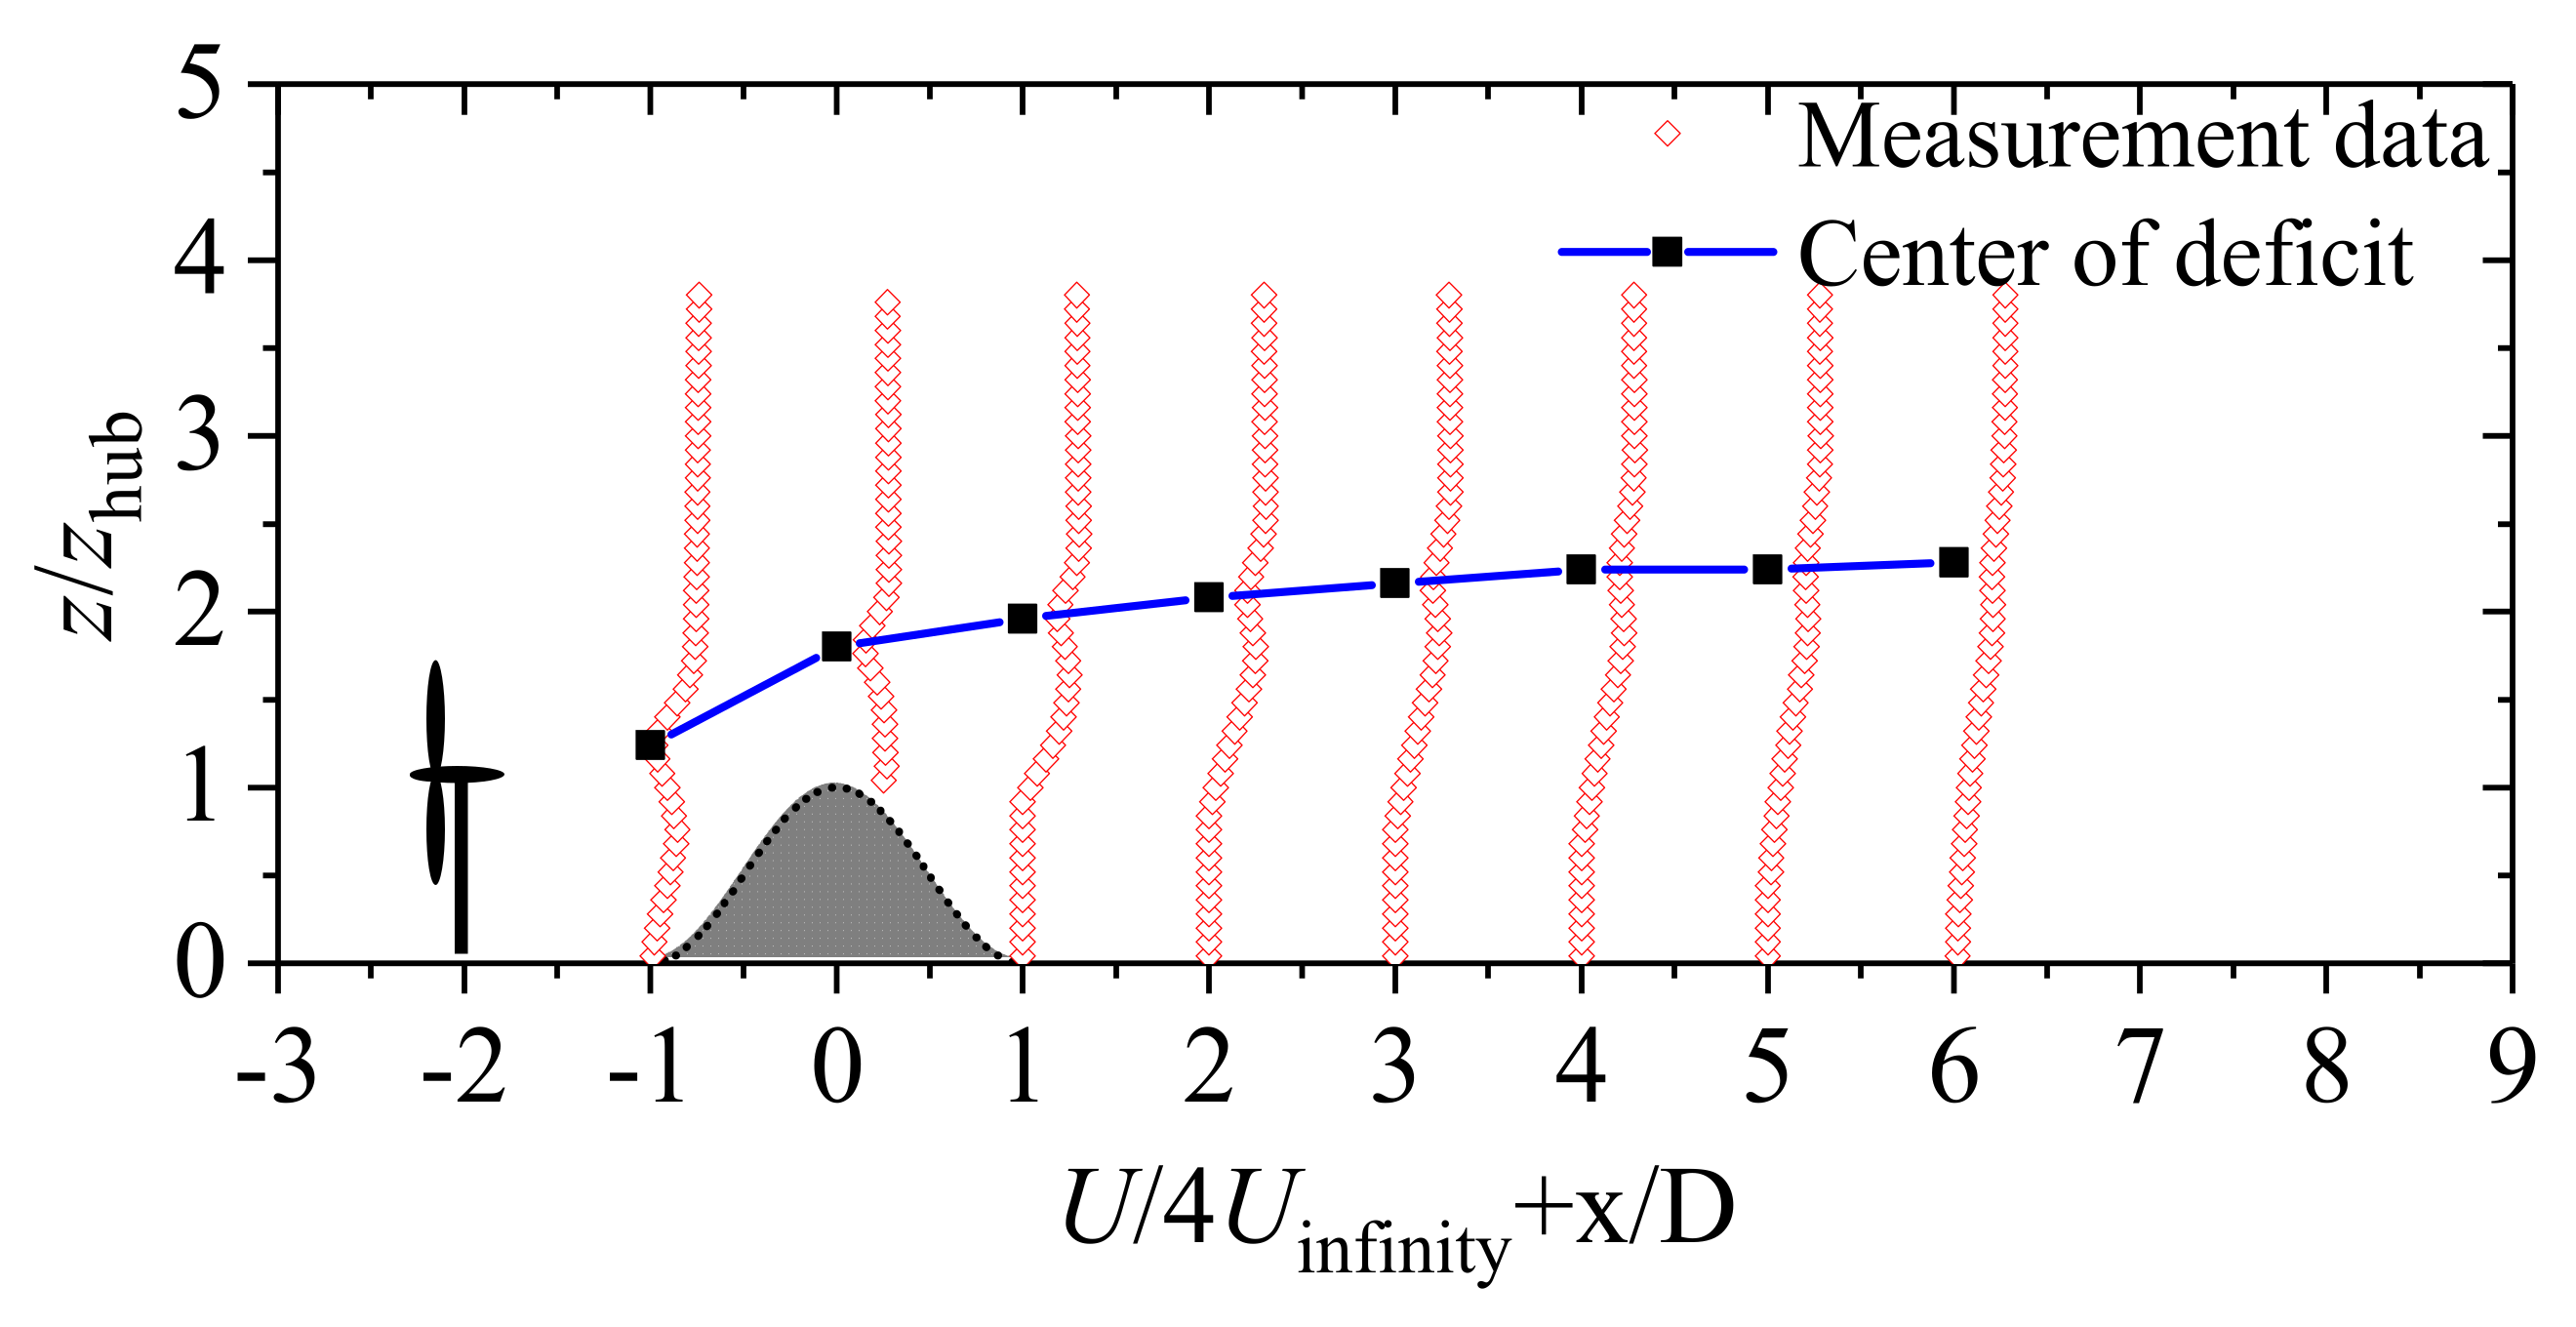
3.1. Wake Characteristics on Flat Terrain

According to Dou et al. [36], in a wind tunnel experiment of the model wind turbine, there existed two types of driving modes, the generator mode (passive mode) and the motor mode (active mode). During the generator mode, the inflow drove the turbine rotor to generate power, and then the current in the load circuit could be altered to change the rotational speed of the wind turbine, which was similar to an actual wind turbine. However, due to the load limit on the rotor, this method requires a higher incoming velocity or a larger rotor diameter to overcome the motor’s starting torque. The rotor could only operate within a limited range of rotational speed in the wind tunnel tests, while in the motor mode, the rotor was driven by an additional power supply, and the rotational speed was larger than the adjustment range. Considering that the turbine model in this experiment operated in a motor mode, it was necessary to verify the impact on the wake characteristics of this driving model first.
As shown in Figure 6, the lateral distributions of the wake characteristics at hub height were compared between two driven modes at x/D = 2, 5 when λ = 6. y/D represents the non-dimensional lateral coordinate, and U/Uinfinity represents the non-dimensional mean velocity. Two dashed lines correspond to the wind turbine blade tip positions in the figure. According to the results of the comparison, it can be seen that there was a substantial similarity between them, which supported the conclusions of Dou et al. [36]. The existing comparative experiments also showed that the rotational speed of the motor mode is more stable than that of the generator mode. In accordance with these results, the motor mode could also be used to reflect the natural wake characteristics of a wind turbine under the same tip speed ratio. As a result of this, this study has been conducted in the motor mode.
This section starts to present the results for measuring the wake on flat terrain (i.e., case 1). As shown in Figure 7a,b, the characteristics were distributed vertically in the wake of the turbine. A low-speed wake area was formed after the inflow passed the rotary rotor, and the mean velocity U decayed instantly in the wake. It was in the center position that the biggest loss of velocity was observed; especially in the position of x/D ≤ 5, the wake deficit reaches more than 50%. As the measuring point moves towards the spanwise direction of the wind turbine blade and the downstream direction, momentum exchange occurs due to the expansion of the wake and the continuous infiltration of the external environment fluid, leading to velocity recovery. With the longitudinal position increased further, about 37% inflow velocity in the hub height was deficient at x/D = 8. Due to the existence of the tower, there was an asymmetric distribution of velocity in the wake field relative to the rotor’s center line. The velocity changed markedly in the region behind the rotor (i.e., between two dotted lines), while the wake velocity at the outer region of the rotor slightly decreased with the increase in x/D, and the wake width increased gently. For the other lateral positions, according to the results from Li et al. [35], under different inflow conditions, such asymmetrical velocity deficit distribution could appear in the range of 1.5 ≤ y/D ≤ 1.5. Because of the inflow turbulence intensity and wind shear, the wake would be asymmetrical in both the vertical and lateral directions. With the increase in lateral coordinates, the deficit area gradually decreases, especially when y/D > 0.5. When in the natural wind field, such asymmetric distribution occurs in a broader range. According to the results of the outfield experiment [37], when x/D = 2, in the range of −1.0 ≤ y/D ≤ 1.0, the velocity deficit region was similar, but the asymmetric distribution was still significant. With the continuous increase in y/D, the wake velocity generally recovered when y/D = 2.25.
Figure 7b shows that wind turbine rotation caused severe disturbances in the flow field. An increase and asymmetric vertical distribution were found. When x/D = 1, it was evident that the blocking effect of the tower contributed a great deal to the turbulence intensity of the flow field, which reached a maximum of 0.12 at the bottom of the flow field. Nevertheless, the turbulence intensity behind the tower was strikingly reduced with fluid exchange with lower turbulence intensity outside when x/D > 2, and the blockage effect of the tower was significantly eliminated. Meanwhile, the maximum turbulence intensity emerged at x/D = 3, and the turbulence intensity distribution showed a double peak shape downstream of this position. Moreover, the high turbulence level region mainly arose in the middle of the blade. This phenomenon was because the tip vortex and hub vortex continuously lose the coherence of the vortex structure during shedding, coupling with the intense momentum exchange, so a considerable amount of turbulent kinetic energy was created between the external flow field and the inner field.

3.2. Wind Characteristics around a Cosine Hill

An analysis in case 2 of the wake measurements around a single cosine hill is presented in the current section. Figure 8 illustrates how the average velocity distribution changes as the x/D increases, and comparisons on flat terrain are also provided as a reference. To make the comparison more intuitive, in the horizontal axis, the mean velocity of the wind is represented by the sum of the two non-dimensional components U/4Uinfinity and x/D (i.e., U/4Uinfinity + x/D). Hence, one scale division represents the normalized distance on the horizontal axis.
Since the hot-wire anemometer cannot accurately acquire the negative wind speed. As a consequence, the first measuring point with an average velocity less than 0.4 m/s (i.e., U/Uinfinity < 0.05) from top to bottom in each vertical position was taken as the dividing point of positive and negative wind velocity in the data processing of this paper. Therefore, the position lower than this point was considered the negative wind speed region. In the above figure, the wind velocity in the negative velocity region was set to zero, and this region was omitted in subsequent turbulence intensity analyses. On both the windward and leeward sides of the hill, it was evident that the hill had a speed-up effect in the upper part of the flow fields. The maximum dimensionless wind velocity measured in the experiment was at the height of z/zhub = 1.88 in the position x/D = 2, and its value could reach about 1.27. Meanwhile, the increase in slope made the wind velocity of the lower flow field on the leeward side decrease sharply, and a flow separation was formed within 6D on the leeward side. With an increased horizontal distance, eventually, the lower flow field on the leeward side recovered to positive velocity.
Figure 9 illustrates the distribution of turbulence intensity at different points in x/D vertically on the tested hill. In a similar manner, the horizontal axis represents the sum of 2σu/Uinfinity and the longitudinal coordinate x/D. On the bottom of the windward side, it can be seen that the turbulence intensity was slightly higher than at the top and quickly recovered to the inflow level with the increase in height, while the turbulence intensity on the leeward side increased significantly. The turbulence intensity depicted a single peak shape on the leeward side. With a height increase in the identical downstream position, the value increased first, then decreased. Moreover, the peak value of each measuring position all appeared above the hilltop’s height, meaning wind turbines installed on the leeward side of the hill were subjected to more severe pulsating loads. The maximum value was measured at the height z/zhub = 1.52 at x/D = 3, and its actual value was about 0.29.
It can be concluded that for the hill with larger slopes, the turbulence at the height close to the hill and the region behind the hill still remain at a high level in the test range. Compared with the published literature of Kamada et al. [38], the flow field characteristics around a two-dimensional hill model had slopes of 0.5 and 1.0. In agreement with the test results, regions of high turbulence intensity were formed behind both peaks of the two slopes. When the slope was 0.5 and 1.0, respectively, the high turbulence region (i.e., σu/Uinfinity > 0.2) behind the hill appeared within the range of 1.8 and 2.2 times the hill height, which seemed to become higher with the increase in the slope, while in this experiment, the corresponding value reached 2.28 times the hill height. Although the slope of this test was within the range of both, the high-turbulence region was slightly larger. The possible reason for this was that in Kamada’s experiment, the vertical distribution of the inflow turbulence intensity was about 5–10%, slightly larger than in this test. Therefore, in this experiment, the momentum exchange between the external low-turbulence flow field and the wake flow field was more intense, and the range became wider. The results also indicated that slope was not the only factor affecting the turbulence intensity behind the hill. It is worth noting that the turbulence intensity of 20% is close to the limit of 18% specified by the International Electrotechnical Commission (IEC) in the IEC61400-2 standard for the design and installation of wind turbines. The actual wind turbine location needs to avoid these areas. Obviously, it is ideal for the wind turbine layout since the inlet velocity can be recovered, and the turbulence intensity can be reduced to a lower level at a higher location on the leeward side of the hill. However, in practical engineering applications, it is unrealistic to blindly improve the hub height of wind turbines because the structural stability of wind turbines deteriorates as hub height increases. Hence, a wind turbine located in complex terrain will be discussed in more detail in the following section.

3.3. Velocity Profiles Combined with a Cosine Hill and a Wind Turbine

The velocity deficit under hilly terrain can be calculated by Equation (3) for a better analysis of wake recovery.
U def = U NW U W
where the average velocity deficit at a measuring point is represented by Udef. UW and UNW represent the normalized mean velocities in a certain position in the wake with and without a wind turbine, respectively. Both the velocities in cases 3 and 4 were compared in the subsequent analyses.
The wake center was defined as the position downstream of the turbine where the maximum deficit was measured in the same longitudinal coordinate. Following are the equations for describing the average velocity deficit at the wake center Uc,def and the wake center height zc:
U c , def = max [ U def ( z ) ]
z c = arg max [ U def ( z ) ]
where Udef(z) is the average wake deficit at height z.
Figure 10 describes the vertical distribution of velocity deficit with a wind turbine installed 2D upstream of the hill. Due to the hill blockage and the separation on the leeward side, the wake obviously changes in the near wake and transition area. Figure 11 illustrates more detailed information about case 3 on the average wind speed at different locations downstream. The average velocity at the same locations with no wind turbine was also exhibited. In this figure, UW and UNW are indicated by red and black dots, respectively, and the dotted line in Figure 11 represents the wake center height determined according to Equation (5). It can clearly be seen that with the development of the terrain on the windward side, the wake center’s height increases consistently. When x/D= −1 and 0, the zc is 1.24 and 1.80, respectively. Although the height decreased behind the hilltop, the height of the wake center still increased. With the increase in longitudinal coordinates, the wake center height grew slowly in the range of experimental measurements. In comparing the wake profiles with and without a wind turbine, it has been shown that both the deficits were mainly centered near the wake center and had an asymmetric distribution, and the velocity deficits above the wake center were smaller than below.
For the case with a wind turbine, when x/D = 3, 4, 5 and 6, the zc was 2.16, 2.24, 2.24 and 2.28, respectively. Furthermore, as expected, the separation of flow was observed for the hill when the flow passed through it. The vortices in the wake began to break and fall off. The vortices eventually disappeared when x/D = 6, and the wake velocities in the near-wall region were gradually returned to a positive value. It should be noted that the separation range from the hilltop was about six times the horizontal distance of the rotor diameter, and the variation seemed unchanged with or without a wind turbine arranged in the wake field. Furthermore, the reverse flow region was between hills with slopes of 0.5 and 1.0, as described in Ref. [38] (about 5.5 and 9.5 times hill height, respectively). This means that the hill slope influenced the separation flow on the lee side. These areas should be avoided as much as possible in the site selection of wind turbines.
Furthermore, there was an investigation of the wake velocity distribution when the wind turbine was located on a hilltop (i.e., case 4). As seen in Figure 12, similar to the above case, the distribution is also apparent for the average wind velocity of the wake field at the lower leeward side decreased, which formed a shear flow form, and a separation zone within the range of =6D was found. Although the height of the terrain behind the wake decreased, the wake center continued to maintain a certain height with the increase in longitudinal coordinates.
A more detailed comparison can be seen in Figure 13, keeping a consistent color scheme with case 3, which exhibits the vertical distribution of average wind velocity at various locations downstream. The central heights of the wake with dotted lines are also lined out for comparison. The figure shows that when the position of x/D was 1 to 8, the heights of the wake center fluctuated between 2.04 and 2.16. Compared with the case in Figure 11, the wake center height zc decreased slightly, and the velocity deficit with a wind turbine was larger than that of the turbine located 2D in front. The possible reason may be that when the test turbine is located in the front, the speed-up effects caused by the hill could mix with the free inflow in the outer region of the wake more easily, leading the wake to expand more widely and recover faster.
It should be noted that only the streamwise velocity components were measured in this study. However, in the near-wake of the turbine, the flow will be three-dimensional due to the intense development of tip vortices, central vortices, and tower vortices. The vertical and lateral velocity distributions behind the rotor fluctuated wildly. According to a similar investigation of the flow field around a single two-dimensional hill [38], when the inflow velocity was close to this study, the windward side of the hill would have a vertical velocity of about 0.4 m/s. Thus, it can be reasonably inferred that the vertical velocities with opposite and nearly symmetric directions appearing in the vertical distribution behind the rotor might be shifted, which could be different from the flat terrain [39]. Meanwhile, this situation should be more apparent when installing a wind turbine located 2D in front, because in the near-wake region, the rotor’s aerodynamics would significantly impact the wake structure, and the evolution of the vortex structure in the wake is bound to be affected by the obstruction of the hill near the wake. Hence, for the wind turbines installed in the natural terrain, this situation could cause the meandering phenomenon and increase the turbulence intensity, which would directly lead to the increase in the load of the wind turbine downstream and a decrease in the output power.
Figure 14 compares the mean velocity deficit of the wake center. The measurement results are presented in the cases of two hilly terrains and the flat terrain, respectively. The horizontal and vertical axes represent the non-dimensional relative distance to the plane of the rotor and the non-dimensional wake center deficit, respectively. For the case of the wind turbine located 2D upstream of the hilltop, the position x/D = 2 is the hilltop. A rapid decrease in the average velocity deficit of the wake center on hilly terrain was about four times greater than on flat terrain, with locations x/D = 1 to 2, which indicates that on the windward side, the steep hill played an essential role in promoting wake recovery. When x/D = 2 to 6 (i.e., the corresponding position less than 4D on the leeward side), the wake recovery was markedly slowed. The decrease in the non-dimensional average deficit in the wake center was only about 67% on the flat terrain. Based on this, the wake recovery was restricted within the 4D range of the leeward side. Besides, when x/D = 6 to 8, the decreasing amplitude of the average velocity deficit was slightly larger than that on flat terrain, which was about 1.07 times.
For the case with a wind turbine located on the hilltop, the wake recovery was also limited when the position of x/D =1 to 4. The decrease in the wake deficit at the center position was only about 85% of that of the flat terrain. The adverse pressure gradient on the lee side may have enhanced the wake effect by preventing turbulent flow mixing between the low-speed inner wake and the outer flow. Hence, the recovery of the wake flow was reduced. While the wake recovery was promoted at the position of x/D = 4 to 8, the decrease in mean velocity deficit at the center position was 1.25 times that on flat terrain.

3.4. Turbulence Intensity in the Wind Turbine Wake over the Cosine Hill

Figure 15 describes the vertical distribution of turbulence intensity at different locations downstream when the wind turbine is located 2D in front of the hill. As a comparison, the change rule of turbulence intensity at the corresponding position with no wind turbine in the hilly terrain is also presented in the figure. It can be observed that on the windward side of the hill, the existence of the wind turbine had a great influence mainly on the wake area and the area above, and the turbulence intensity distribution resembled that on flat terrain, while on the leeward side of the hill, the turbulence intensity resulted from the interaction between wind turbine wake and hill-induced turbulence. As shown in Figure 15c–f, the wind turbine installation’s impact on turbulence intensity in the flow field mainly occurred above the wake center and at the peak of turbulence intensity below the wake center. In the position of x/D ≤ 4 on the leeward side, turbulence intensity distribution presented a double peak shape in the vertical direction. Compared with the flat terrain, the asymmetry of the peak shape was greater. When x/D = 2, the upper and lower peak values were 11.62% and 27.14%, while the peak values on the flat terrain were 10.03% and 9.78%, respectively. With the increase in the longitudinal coordinates, the turbulence induced by the wind turbine strongly affected the wake flow field in a more extensive range. The turbulence intensity above the wake center increased markedly, and the double peak shape gradually disappeared and became a single peak shape that appeared between the wake center and the hub. Compared with the case with no wind turbine installed, the value decreased slightly, and the difference seemed to become more prominent with the increase in x/D. From Figure 15f–h, for the peak of turbulence intensity at the position x/D = 4, 5 and 6, the difference values were 3.47%, 4.00% and 4.37%, respectively. It is worth noting that the peak turbulence intensity results occurred within the range of the typical spacing of adjacent wind turbines in an actual wind farm layout. Moreover, at the further position of x/D = 6, the peak turbulence intensity was still above 20%. Hence, the influence of additional turbulence intensity in complex terrain should be considered when siting the wind turbine or calculating the load downstream.
The vertical distribution of turbulence intensity at different positions when the wind turbine is located at the hilltop is shown in Figure 16, and the results at the corresponding position without a model wind turbine are also presented.
Similar to the test case where the wind turbine was located 2D in front, the turbulence intensity distribution was also the result of the coupling of the wake and the hill-induced turbulent flow when the wind turbine was on the hilltop. Compared with the case without wind turbines, the turbulence generated by the interference of hills and wind turbine wake mainly affects the flow field near the center of the wake. It interacts with the wake to form a double peak shape within the position of x/D ≤ 3. In addition, the peak value below the wake center was significantly greater than that above the wake center. When x/D = 1, 2 and 3, the corresponding peak values were 24.50%, 25.04% and 25.02%, respectively, and the peaks appeared at 1.32, 1.44 and 1.56 times the hub height. With the longitudinal coordinate x/D increased further, affected by the hill, the turbulence above the wake center also tended to be enhanced. In the position of x/D ≥ 4, the turbulence intensity changed to a single-peak distribution in the vertical direction. It should be noted that, in this case, the peak value of turbulence intensity was more than twice that of flat terrain. Although the turbulence intensity in the wake was higher than that in the flat terrain, the wake recovery in this region was slower than in the flat terrain. This phenomenon indicated that the wake of the wind turbine in the hilly terrain does not entirely follow the development law that the higher the turbulence intensity, the faster the recovery speed will be.

4. Conclusions

By conducting wind tunnel experiments, this paper investigated the wake characteristics of a wind turbine on flat terrain, the flow field characteristics close to a model hill, and the wake characteristics of a wind turbine located at two specific positions on hilly terrain with a slope of 0.83. In summary, the major findings are as follows:
(1)
On flat terrain, the lowest wind velocity in the same vertical position of the wake emerged in the center of the rotor, and the wind shear was formed along the vertical direction. At the position of x/D = 8, the average velocity deficit at hub height was about 63% of the inflow. Without considering the tower’s blocking effect, the turbulence intensity mainly presented a double shape in a vertical direction. The peak value tended to increase first and decrease with each successive increase in longitudinal distance. The maximum peak values of turbulence intensity occurred downstream of the turbine at the x = 3D position.
(2)
Based on the single test hill with a slope of 0.83, the speed-up effect existed on the upper part of the windward and leeward sides. In contrast, the wind velocity on the lower part of the windward and leeward sides decreased, and a flow separation zone was formed within the range of 6D on the leeward side. The turbulence intensity on the leeward side increased significantly and showed a single-peak shape, with the vertical height growing first and then decreasing.
(3)
The wake flow field was measured when the turbine was sited on the hilltop and 2D in front. The wake recovery of the wind turbine was promoted on the windward side and 4D behind the hilltop in two test cases, while it was limited within the range of 4D on the leeward side in comparison with the flat terrain. When the wind turbine was located 2D in front of the hilltop as well as on the top, values were achieved at 67% and 85% of that of the flat terrain, respectively. Furthermore, the turbulence intensity changed into a single peak shape in the x = 4D position downstream in the vertical direction. The generated peak value of turbulence intensity with a slightly higher position than the test hill with no wind turbine was smaller. However, the turbulence intensity peak was more than twice that of the flat terrain, suggesting that the wind turbine’s site selection and load calculation need to be paid attention to.
It should be noted that the test object in the present research was a two-dimensional cosine shape with a uniform incoming flow. Considering the existence of three-dimensional hilly terrain and atmospheric boundary layer wind in the natural environment, it is evident that such flow characteristics differences may have a certain degree of impact on wind turbines’ aerodynamic performance. Therefore, in future work, wind tunnel studies will be carried out to reveal the aerodynamic characteristics and wake interference of the atmospheric boundary layer flow into the wind turbine over typical dimensional hills.

Author Contributions

Conceptualization, J.Y. and H.Y.; methodology, K.F. and H.Y.; formal analysis, K.F. and J.Y.; funding acquisition, H.Y. and J.Y.; writing—original draft preparation, J.Y.; writing—review and editing, H.Y. and X.W. All authors have read and agreed to the published version of the manuscript.

Funding

This research was funded by the Open Fund of the Key Laboratory of Wind Energy and Solar Energy Technology, Ministry of Education of China, under grant number 2021ZD01, and the Natural Science Foundation of Jiangsu Higher Education Institutions of China under grant number 22KJD480003.

Institutional Review Board Statement

Not applicable.

Informed Consent Statement

Not applicable.

Data Availability Statement

Not applicable.

Conflicts of Interest

The authors declare no conflict of interest.

References

  1. Adaramola, M.S.; Krogstad, P.-A. Experimental investigation of wake effects on wind turbine performance. Renew. Energy 2011, 36, 2078–2086. [Google Scholar] [CrossRef]
  2. El-Asha, S.; Zhan, L.; Iungo, G.V. Quantification of power losses due to wind turbine wake interactions through SCADA, meteorological and wind LiDAR data. Wind Energy 2017, 20, 1823–1839. [Google Scholar] [CrossRef]
  3. Tian, W.; Ozbay, A.; Hu, H. An experimental investigation on the aeromechanics and wake interferences of wind turbines sited over complex terrain. J. Wind Eng. Ind. Aerodyn. 2018, 172, 379–394. [Google Scholar] [CrossRef]
  4. Zhao, F.; Gao, Y.H.; Wang, T.Y.; Yang, J.S.; Gao, X.X. Experimental Study on Wake Evolution of a 1.5 MW wind turbine in a complex terrain wind farm based on LiDAR measurements. Sustainability 2020, 12, 2467. [Google Scholar] [CrossRef]
  5. Meng, H.; Lien, F.-S.; Glinka, G.; Li, L.; Zhang, J.H. Study on wake-induced fatigue on wind turbine blade based on elastic actuator line model and two-dimensional finite element model. Wind Eng. 2019, 43, 64–82. [Google Scholar] [CrossRef]
  6. Menke, R.; Vasiljević, N.; Hansen, K.S.; Hahmann, A.N.; Mann, J. Does the wind turbine wake follow the topography? A multi-lidar study in complex terrain. Wind Energy Sci. 2018, 67, 681–691. [Google Scholar] [CrossRef]
  7. Hansen, K.S.; Larsen, G.C.; Menke, R.; Vasiljevic, N.; Angelou, N.; Ju, F.; Zhu, W.J.; Vignaroli, A.; Liu, W.W.; Xu, C.; et al. Wind turbine wake measurement in complex terrain. J. Phys. Conf. Ser. 2016, 75, 032013. [Google Scholar] [CrossRef]
  8. Subramanian, B.; Chokani, N.; Abhari, R.S. Aerodynamics of wind turbine wakes in flat and complex terrains. Renew. Energy 2016, 85, 454–463. [Google Scholar] [CrossRef]
  9. Ibrahim, O.M.A.M.; Yoshida, S.; Hamasaki, M.; Takada, A. Wind turbine wake modeling in accelerating wind field: A preliminary study on a two-dimensional hill. Fluids 2019, 4, 153. [Google Scholar] [CrossRef]
  10. Tian, W.; Ozbay, A.; Yuan, W.; Sarakar, P.; Hu, H. An experimental study on the performances of wind turbines over complex terrains. In Proceedings of the 51st AIAA Aerospace Sciences Meeting including the New Horizons Forum and Aerospace Exposition, Grapevine, TX, USA, 7–10 January 2013. [Google Scholar]
  11. Hyvärinen, A.; Segalini, A. Qualitative analysis of wind-turbine wakes over hilly terrain. J. Phys. Conf. Ser. 2017, 85, 012023. [Google Scholar] [CrossRef] [Green Version]
  12. Hyvärinen, A.; Segalini, A. Effects from complex terrain on wind-turbine performance. J. Energy Resour.-ASME 2017, 139, 36–48. [Google Scholar] [CrossRef]
  13. Howard, K.B.; Hu, J.S.; Chamorro, L.P.; Guala, M. Characterizing the response of a wind turbine model under complex inflow conditions. Wind Energy 2015, 18, 729–743. [Google Scholar] [CrossRef]
  14. Liu, X.; Yan, S.; Guo, Y.T.; Shi, S.P.; Chen, X.M.; Mu, Y.F. CFD simulation and Lidar experimental study on wind turbines in complex terrain. Acta Energ. Sol. Sin. 2020, 41, 1–7. [Google Scholar]
  15. Berg, J.; Troldborg, N.; Sørensen, N.N.; Patton, E.G.; Sullivan, P.P. Large-eddy simulation of turbine wake in complex terrain. J. Phys. Conf. Ser. 2017, 854, 012003. [Google Scholar] [CrossRef]
  16. Shamsoddin, S.; Fernando, P.-A. Wind turbine wakes over hills. J. Fluid Mech. 2018, 855, 671–702. [Google Scholar] [CrossRef]
  17. Politis, E.S.; Prospathopoulos, J.; Cabezon, D.; Hansen, K.S.; Chaviaropoulos, P.K.; Barthelmie, R.J. Modeling wake effects in large wind farms in complex terrain: The problem, the methods and the issues. Wind Energy 2012, 15, 161–182. [Google Scholar] [CrossRef]
  18. Yang, X.L.; Maggie, P.; Fotis, S. Large-eddy simulation of a utility-scale wind farm in complex terrain. Appl. Energy 2018, 229, 767–777. [Google Scholar] [CrossRef]
  19. Astolfi, D.; Castellani, F.; Terzi, L. A study of wind turbine wakes in complex terrain through RANS simulation and SCADA data. J. Sol. Energy Eng. 2018, 140, 031001. [Google Scholar] [CrossRef]
  20. Makridis, A.; Chick, J. Validation of a CFD model of wind turbine wakes with terrain effects. J. Wind Eng. Ind. Aerodyn. 2013, 123, 12–29. [Google Scholar] [CrossRef]
  21. Zhou, T.Y.; Tan, J.F.; Cai, J.G.; Shi, R.P.; Xia, Y.S. Numerical Investigation on Power Outputs of a Wind Turbine Sited over Continuous Hilly Terrain. Trans. Nanjing Univ. Aeronaut. Astronaut. 2020, 37, 120–128. [Google Scholar]
  22. Dar, A.S.; Berg, J.; Troldborg, N.; Patton, E.G. On the self-similarity of wind turbine wakes in a complex terrain using large eddy simulation. Wind Energy Sci. 2019, 4, 633–644. [Google Scholar] [CrossRef]
  23. Xu, C.; Hang, H.; Shi, C.; Duan, H.; Li, G.; Li, L. Numerical Simulation of Wind Turbine Wakes in Typical Complex Terrains Based on LBM-LES Method. Proc. CSEE 2020, 40, 4236–4242. [Google Scholar]
  24. Yang, J.W.; Yang, H.; Zhu, W.J.; Li, N.L.; Yuan, Y.P. Experimental study on aerodynamic characteristics of a Gurney flap on a wind turbine airfoil under high turbulent flow condition. Appl. Sci. 2020, 10, 7258. [Google Scholar] [CrossRef]
  25. Zhou, H.C.; Jiang, Z.; Wang, G.L.; Zhang, S.P. Aerodynamic Characteristics of Isolated Loaded Tires with Different Tread Patterns: Experiment and Simulation. Chin. J. Mech. Eng. 2021, 34, 6. [Google Scholar] [CrossRef]
  26. Sessarego, M.; Ramos-Garcia, N.; Yang, H.; Shen, W.Z. Aerodynamic wind-turbine rotor design using surrogate modeling and three-dimensional viscous–inviscid interaction technique. Renew. Energy 2016, 93, 620–635. [Google Scholar] [CrossRef]
  27. Kulak, M.; Lipian, M.; Zawadzki, K. Investigation of performance of small wind turbine blades with winglets. Int. J. Numer. Methods Heat Fluid Flow 2021, 31, 629–640. [Google Scholar] [CrossRef]
  28. Dou, B.Z.; Guala, M.; Zeng, P.; Lei, L.P. Experimental investigation of the power performance of a minimal wind turbine array in an atmospheric boundary layer wind tunnel. Energy Convers. Manag. 2019, 196, 906–919. [Google Scholar] [CrossRef]
  29. Medici, D.; Alfredsson, P.H. Measurements on a Wind Turbine Wake: 3D Effects and Bluff Body Vortex Shedding. Wind Energy 2006, 9, 219–236. [Google Scholar] [CrossRef]
  30. Chamorro, L.R.; Arndt, R.E.A.; Sotiropoulos, F. Reynolds number dependence of turbulence statistics in the wake of wind turbines. Wind Energy 2012, 15, 733–742. [Google Scholar] [CrossRef]
  31. Mason, P.J.; King, J.C. Measurements and predictions of flow and turbulence over an isolated hill of moderate slope. Q. J. Roy. Meteor. Soc. 1985, 111, 617–640. [Google Scholar] [CrossRef]
  32. Ryi, J.; Rhee, W.; Hwang, U.C.; Choi, J.S. Blockage effect correction for a scaled wind turbine rotor by using wind tunnel test data. Renew. Energy 2015, 79, 227–235. [Google Scholar] [CrossRef]
  33. Meng, H.R.; Ma, Z.; Dou, B.Z.; Zeng, P.; Lei, L.P. Investigation on the performance of a novel forward folding rotor used in a downwind horizontal axis turbine. Energy 2020, 190, 116384. [Google Scholar] [CrossRef]
  34. Uehara, K.; Murakami, S.; Oikawa, S.; Wakamatsu, S. Wind tunnel experiments on how thermal stratification affects flow in and above urban street canyons. Atmos. Environ. 2000, 34, 1553–1562. [Google Scholar] [CrossRef]
  35. Li, Q.; Murata, J.; Endo, M.; Maeda, T.; Kamada, Y. Experimental and numerical investigation of the effect of turbulent inflow on a Horizontal Axis Wind Turbine (part II: Wake characteristics). Energy 2016, 113, 1304–1315. [Google Scholar] [CrossRef]
  36. Dou, B.Z.; Yang, Z.P.; Guala, M.; Qu, T.M.; Lei, L.P.; Zeng, P. Comparison of Different Driving Modes for the Wind Turbine Wake in Wind Tunnels. Energies 2020, 13, 1915. [Google Scholar] [CrossRef]
  37. Li, Q.; Maeda, T.; Kamada, Y.; Mori, N. Investigation of wake characteristics of a Horizontal Axis Wind Turbine in vertical axis direction with field experiments. Energy 2017, 141, 262–272. [Google Scholar] [CrossRef]
  38. Kamada, Y.; Li, Q.; Maeda, T.; Yamada, K. Wind tunnel experimental investigation of flow field around two-dimensional single hill models. Renew. Energy 2019, 136, 1107–1118. [Google Scholar] [CrossRef]
  39. Zhang, W.; Markfort, C.D.; Porté-Agel, F. Near-wake flow structure downwind of a wind turbine in a turbulent boundary layer. Exp. Fluids 2012, 52, 1219–1235. [Google Scholar] [CrossRef] [Green Version]
Figure 1. Arrangement of the test turbine and the parameters.
Machines 10 00753 g001
Figure 2. The hill model.
Machines 10 00753 g002
Figure 3. Photograph of the test setup.
Machines 10 00753 g003
Figure 4. The measured profiles of the normalized inflow velocity and turbulence intensity. (a) Mean velocity; (b) turbulence intensity.
Machines 10 00753 g004
Figure 5. Schematic diagram of four experimental layouts. (a) Flat terrain with a single wind turbine (case 1); (b) only the hilly terrain (case 2); (c) hilly terrain with a wind turbine in front (case 3); (d) hilly terrain with a wind turbine on the hilltop (case 4).
Machines 10 00753 g005aMachines 10 00753 g005b
Figure 6. An analysis of different driving modes for the wake of a wind turbine (x/D = 2, 5). (a) Mean velocity; (b) turbulence intensity.
Machines 10 00753 g006
Figure 7. Wake distributions with various locations in the hub center vertical plane (flat terrain). (a) Mean velocity; (b) turbulence intensity.
Machines 10 00753 g007
Figure 8. The mean velocity at various locations around a single two-dimensional cosine hill.
Machines 10 00753 g008
Figure 9. Turbulence intensity at various locations around a single two-dimensional cosine hill.
Machines 10 00753 g009
Figure 10. Wind turbine wake distributions when sited 2D in front of the test hill (case 3).
Machines 10 00753 g010
Figure 11. A detailed comparison of the wake with the wind turbine located 2D in front (case 3, x/D = −1 to 6).
Machines 10 00753 g011
Figure 12. Wind turbine wake velocity distributions when sited on a hilltop (case 4).
Machines 10 00753 g012
Figure 13. A detailed comparison of the wake with the wind turbine located on the hilltop (case 4, x/D = 1 to 8).
Machines 10 00753 g013
Figure 14. Comparison of mean velocity deficit on the wake center.
Machines 10 00753 g014
Figure 15. Vertical distribution of the turbulence intensity with and without a wind turbine located 2D in front of the hill (case 3, x/D = −1 to 6).
Machines 10 00753 g015aMachines 10 00753 g015b
Figure 16. Vertical turbulence intensity distribution with and without a wind turbine located on the hilltop (case 4, x/D = 1 to 8).
Machines 10 00753 g016aMachines 10 00753 g016b
Publisher’s Note: MDPI stays neutral with regard to jurisdictional claims in published maps and institutional affiliations.

