Article

Discriminant Analysis of the Vibrational Behavior of a Gas Micro-Turbine as a Function of Fuel †

Department of Industrial Engineering, University of Naples “Federico II”, Via Claudio 21, 80125 Napoli, Italy
*
Author to whom correspondence should be addressed.
This paper is an extended version of “Spirto, M.; Savino, S.; Quaremba, G.; Cosenza, C.; Nicolella, A.; Niola, V. Discriminant analysis of the vibrational dynamics of a gas microturbine with different fuels. In Proceedings of the 5th Jc-IFToMM International Symposium, the 28th Jc-IFToMM Symposium on Theory of Mechanism and Machines, Kyoto, Japan, 16 July 2022”.
Machines 2022, 10(10), 925; https://doi.org/10.3390/machines10100925
Submission received: 27 September 2022 / Revised: 5 October 2022 / Accepted: 8 October 2022 / Published: 12 October 2022
(This article belongs to the Special Issue Advances of Machine Design in Italy 2022)

Abstract

:
Several studies were conducted previously on fuel and biofuel performance of micro-turbines. The present paper combines experimental and statistical approaches to study the vibrational behavior of a gas micro-turbine supplied with different pure fuels and admixed with rapeseed oils. Experimental tests carried out at different operating conditions have allowed us to build a classification model through using discriminant analysis. The classification model can distinguish the vibrational behavior occurring when the turbine is fueled with kerosene, or pure and admixed diesel with rapeseed oil. Moreover, the methodology has even allowed us to highlight differences in vibrational behavior caused by small amounts of rapeseed oil admixed in the fuel. The model reliability, in terms of Cohen’s kappa, results in optimal data classification.

1. Introduction

In recent years, significant effort has been made to lessen the environmental impact of operating gas turbines [1,2,3].
Micro gas turbines have the potential source to be an alternative power unit (APU) in range-extended electric vehicles (REEVs) [4].
Due to their improved thermal efficiency and reduced fuel consumption, diesel engines make up a significant portion of the passenger car industry in Europe. However, due to increasingly strict exhaust emission laws, particularly for NOx and PM, a more complex and expensive gas exhaust treatment system is required for most diesel vehicles, which also results in increased fuel usage. By 2030, several EU regulations and incentives would call for up to 45% bio-components in fossil fuel. It has been demonstrated that biofuels in the form of pure plant oils cannot be used for automotive applications in diesel engines efficiently because of technical issues brought on by their considerably higher viscosity, corrosive character, and increased exhaust smoke emissions [5].
Biofuels are, broadly speaking, any fuel source made from organic material, such as firewood, charcoal, animal fats and oils, dung, and vegetable oils. To mimic the performance and physical properties of fossil fuels, biofuels must be modified. The development of new power and propulsion technologies will necessitate a better control of the harmful chemicals generated by combustion sources. As energy demand increases, concerns about global warming could result in restrictions on greenhouse gas emissions from fossil fuel facilities. This has prompted substantial study into carbon capture and storage, as well as a growth in renewable energy sources. Many investigations of fuel preparation and emission characterizations of systems powered entirely or partially by pure vegetable oils are available [6,7,8,9,10,11,12,13].
A crucial aspect is the relation between spray quality and combustion performance in micro gas turbines burned with biofuels and biomasses [14,15].
Pure vegetable oils might cause unwanted vibrations by damaging the injection system or combustion device. The ideal answer would be to have a tool that could foresee and/or track the vibrational state of the combustion device in real time. By using appropriate quantifiers generated from microphone and accelerometer inputs, investigations based on acoustic and vibrational measurements seem to offer an intriguing diagnostic and predictive answer [16,17,18,19,20]. Other authors have proposed a neural-network-based tool that allows them to ensure protection and the safety measures against the instability phenomena in a gas turbine based on the modeling of its dynamic behavior [21].
In this context, Allouis et al. [22] have evaluated the impact of biofuel properties on emissions and performances of a micro gas turbine using combustion vibrations detection. Other methodologies described in [23,24,25] are employed for detecting anomalies in mechanical systems such as gas micro-turbines.
The present paper aims to study the vibrational behavior of a low-emission gas micro-turbine for power generation, fueled with different liquid fuels, including commercial diesel oil and its blend with pure rapeseed oil. Kerosene is the design fuel for this turbine. The authors of this current paper have presented a preliminary work on this topic [26].
In the first part, the study describes the experimental phase in which vibrational signals have been acquired through accelerometers properly mounted on the injector. Afterward, signal processing has been performed through discriminant analysis. A classification model has been developed to distinguish the vibrational behavior associated to the turbine fueled with kerosene, pure diesel, and admixed diesel with rapeseed oil.

2. Materials

The study system (the same as of [22]) is a Capstone 30 model 18-blade gas micro-turbine (Figure 1) with a maximum power output of 30 kW. Since its output power is less than 100 kW, it can be included in the micro-turbine category.
The maximum fuel flow rate is 10 kg/h, and the exhaust gas temperature is approximately 590 °C, while at the system discharge it is 276 °C (as nominal temperature). The test bench of the system is reported in Figure 2.
Two different blends of diesel with rapeseed oil (respectively at 1 and 3% by volume) and kerosene (the turbine’s designed fuel) are used as turbine fuels. The choice of such low percentages of rapeseed oil in the two additive fuels is necessary to characterize the machine’s behavior from a vibrational point of view and to grasp the minimal variations resulting from the use of fuels with a very similar composition.
As for the choice of rotation speeds, speeds lower than the maximum one (90,000 rpm) were chosen to study the machine’s behavior under conditions that gradually deviate from the maximum. Tests were conducted for turbine rotation speeds of 75,000, 80,000, and 85,000 rpm. A piezoelectric uniaxial accelerometer (PCB 352C22) and a data acquisition system (LMS SCADAS Mobile SM01) were used to sense and acquire the turbine vibrations. The accelerometer was mounted on a rigid bracket in-built with the injector. The need to use the bracket is due to the high temperature reached by the turbine: in the injector, the temperature can reach a high value to damage the accelerometer.
The accelerometer signals were acquired for a duration of 10 s with a sampling frequency of 102,400 Hz. As a preliminary step, the accelerometer was calibrated using a Bruel & Kjaer Calibration Exciter Type 4294. Below is the procedure followed to carry out the experimental tests at 85,000 rpm (the procedure is similar for the other two speeds):
  • Calibration of the accelerometer;
  • Implementation of the accelerometer to the brackets and anchoring them to the injector;
  • Preparation of fuel mixtures with additives using a graduated cylinder;
  • Starting the turbine with the design fuel (kerosene) and the required power of 10 kW;
  • Waiting for the turbine operating conditions by checking that the exhaust gas temperature is 590 °C as declared by the name plate;
  • Adjustment of turbine power (approx. 19 kW) to reach the preset speed of 85,000 rpm;
  • Accelerometer acquisition for kerosene supply;
  • Adjustment of power output to 10 kW;
  • Gradual switchover from kerosene fueling to pure diesel;
  • Adjustment of turbine power (approx. 19 kW) to reach the preset speed of 85,000 rpm;
  • Accelerometer acquisition for pure diesel fuel supply;
  • Adjustment of power output to 10 kW;
  • Gradual switchover from pure diesel fuel to 1% rapeseed oil diesel;
  • Adjustment of turbine power (approx. 19 kW) to reach the preset speed of 85,000 rpm;
  • Accelerometer acquisition for feeding 3% rapeseed oil diesel;
  • Adjustment of power output to 10 kW;
  • Gradual switchover from 1% rapeseed oil to 3% rapeseed oil admixed fuel;
  • Adjustment of turbine power (approx. 18.5 kW) to reach the preset speed of 85,000 rpm;
  • Accelerometer acquisition for 3% rapeseed oil diesel;
  • Adjustment of power output to 10 kW;
  • Gradual switchover from 3% rapeseed oil diesel supply to pure kerosene;
  • Turbine shutdown with design fuel (kerosene).
Table 1 shows a summary of the acquisition data.

3. Methods

The acquired vibrational signals were analyzed by means of discriminant analysis of statistical indices directly calculated on the raw signals.
The method used for the creation of the classificatory model obtained through discriminant analysis is stepwise, i.e., the variables are not inserted into the model at the same time but in steps, i.e., only those variables with the greater discriminating weight are inserted. At each step, the variable with the lowest Wilks lambda value and, in turn, the highest F coefficient value is entered, i.e., the variable that contributes to better differentiate the groups. More details on this type of analysis can be found in the bibliographical references [26,27].
The chosen statistical indices for the analysis are asymmetry, kurtosis, shape factor, quadratic oscillation index, root mean square value, crest factor, non-normalized Shannon entropy, logarithmic entropy, synchrony index, Pearson’s correlation index, Kendall’s correlation index, and Spearman’s correlation index [27,28,29,30]. The statistical indices used to create the three discriminating models (Section 4) will be briefly described. In the description, n is the length of the signal and x i is the i-th component of the signal. The quadratic oscillation index ( O 2 ) that provides indications of the oscillating phenomenon is described by Equation (1):
O 2 = 1 n 1 i = 1 n 1 x i x i + 1 2
The non-normalized Shannon entropy ( S E ) that provides a measure of the degree of order or disorder of a signal is described by Equation (2):
S E = i = 1 n x i 2 log x i 2  
The asymmetry ( γ ), which is described in Equation (3), gives an indication of the distance between the mean value and the mode of the signal:
γ = m 3 σ 3
where m 3 is the third-order central moment of the signal, while σ is the standard deviation.
The root mean square ( R M S ) value, which is described in Equation (4), gives an indication of the loads acting on the system and the system speed:
R M S = 1 n i = 1 n x i 2
Finally, to assess the degree of accuracy and reliability of the classification, Cohen’s kappa ( κ ) was calculated [31,32]. It is a statistical coefficient representing the degree of accuracy and reliability in a statistical classification defined from a confusion matrix, as reported in Equation (5):
κ = P 0 P e 1 P e
P 0 is the sum of the probabilities along the main diagonal of the confusion matrix, as given in Equation (6):
P 0 = i = 1 n P i , i
where P i , i is the probability of the generic element along the main diagonal of the confusion matrix. The P e formula is given in Equation (7):
P e = i = 1 n P i , T O T · P T O T , i
where P i , T O T is the total probability along the i-th row, and P T O T , i is the total probability along the i-th column of the confusion matrix.

4. Results and Discussion

The first operation carried out on the sampled signals was the calculation of the statistical indices indicated in paragraph 3. From the single sampled signal at a given speed of the micro-turbine powered with a given fuel, 125 values of the generic statistical index were obtained, i.e., one value was calculated every 100 revolutions of the turbine: this means that a total of 500 values of the generic index were obtained for each speed considered. An example-blocks diagram of the algorithm adopted to calculate the generic index I for the four signals (for each speed) was reported in Figure 3.
Subsequently, each of the calculated indices was used as a potential variable for the creation of the classification model for each speed. The software used to create the classification model returned only three variables (indices) out of all those inserted in the model. Table 2 summarizes the variables entered into the model, i.e., those variables that were able to explain 100% of the cumulative variance for each speed analyzed.
Starting from these variables, it is possible to write three discriminant functions, called F i , for each analyzed speed:
F 1 = a 1 X 1
F 2 = b 1 X 1 + b 2 X 2
F 3 = c 1 X 1 + c 2 X 2 + c 3 X 3
where X i are the variables (indices) chosen by the model and shown in Table 2, while a i , b i , and c i are the standardized coefficients associated with each function returned by the software.
The three discriminant functions (Table 3) are different for each turbine speed. The coefficients a, b, and c are different for each case study.
Table 4 displays the variance percentages contributed by the individual functions and the cumulative variance. For all three turbine speeds, it is possible to exceed 95% of the cumulative variance with only two functions. The third added function contributes a value of less than 5% to the cumulative variance, which is necessary to attain 100% of the total cumulative variance.

4.1. Variables Included in the Classification Model

In the following, the obtained indices for the fulfillment of the classification model at each speed (Table 2) are reported. All the following diagrams are shown as a function of the number of periods where the single period corresponds to 100 turbine revolutions.
Figure 4 shows the trends of the three indices (variables) inserted in the discriminant model for the speed of 75,000 rpm.
In Figure 4a, which shows the trend of the quadratic oscillation index, the clear distinction between the four fuels can be seen immediately. Indeed, while kerosene and pure diesel are in the upper part of the diagram, the two admixed diesels clearly present lower values, with the diesel with 1% rapeseed oil averagely higher than the diesel with 3% rapeseed oil: this phenomenon can be seen in the greater tendency of diesel with 1% rapeseed oil towards the behavior of pure diesel. Since high values of this index emphasize that the system dynamic energy is better utilized, it can be said that using pure rather than admixed fuels makes the system better in usage use of dynamic energy. This can be explained by the fact that admixed diesel has an explosive power lower than the pure, reducing its energy output. This makes it possible to see that, by using biofuels, CO2 emissions and other pollutants can certainly be reduced at the expense of efficiency.
The distinction between pure and admixed fuels can also be seen in Figure 4b, in which the trend of non-normalized Shannon entropy is shown, by observing that admixed fuels exhibit higher values than pure fuels. This trend highlights how admixed fuels show little stationary and periodic vibrational cycles in contrast to pure fuels: this phenomenon is due to the reduction in explosive power caused by the presence of the oil and the resulting non-homogeneity of the mixture.
The asymmetry index is the last one adopted for modeling the 75,000 rpm case, shown in Figure 4c. By simply plotting the trend, it is not possible to show a difference between the four fuels used because of the overlapping of the curves and their highly chaotic course. The only possible observation is the main trend to negative values for all four fuels.
Figure 5 shows the trends of the three indices (variables) inserted in the discriminant model for the speed of 80,000 rpm.
In Figure 5a, in which the trend of non-normalized Shannon entropy is shown, a clear distinction between pure and additive fuels can be seen, as in the case for 75,000 rpm. Pure diesel and kerosene present the lowest values for this index; diesel with 1% rapeseed oil gives higher values than the latter and diesel with 3% rapeseed oil gives the highest values among the four curves. This indicates how the vibrational dynamics of additive fuels are more irregular and unsteady than those of pure fuels and how the most irregular dynamics are in the case of diesel with 3% rapeseed oil, as expected, the latter being characterized by the higher percentage of rapeseed oil.
In Figure 5b, the asymmetry trend is reported, which tends to form two distinct clusters: the diesel group, including both pure and additive fuels, and the kerosene. The kerosene assumes negative values, which is not the case for diesel, where values are generally higher. This makes it possible to say that from a dynamic point of view, the use of diesel, pure or with rapeseed oil admixed, because it is characterized by a positive asymmetry, results in stronger vibrations than the use of kerosene, which, on the other hand, results in a much lower vibration. This was desirable since kerosene is the design fuel of the turbine.
Finally, Figure 5c shows the trend of the last of the three indices for the 80,000 rpm case, the RMS. The trend of the four curves allows a good distinction between pure and admixed fuels (note the separation of the red and the green curve from the other two). Furthermore, this graph emphasizes how the energy involved is greater in the case of pure fuels and, therefore, the explosive power decreases as the percentage of rapeseed oil admixed to diesel increases.
Figure 6 shows the trends of the three indices (variables) entered into the discriminant model for the speed of 85,000 rpm.
In Figure 6a, the RMS trend is shown. In this graph, the kerosene values are generally higher than those of the other fuels: as previously stated, this phenomenon was desired because kerosene is the turbine’s design fuel, and the turbine works at a speed of only 5000 rpm lower than the maximum speed (90,000 rpm). Kerosene is the fuel with the best possible working conditions in terms of energy compared to all the others; on the other hand, the admixed diesel with the highest percentage of rapeseed oil has the worst working conditions in terms of energy.
In Figure 6b, a good distinction between pure diesel and admixed diesel can be seen, emphasizing how the turbine rotates smoothly and periodically using a pure fuel, as expected, compared to additive ones.
In the last diagram, i.e., the one in Figure 6c, the curves relating to admixed diesels are much more chaotic and assume a much wider range of values; those relating to pure fuels are much more stable and assume a much narrower range of values.

4.2. Cluster Analysis

As follows, the diagrams of the discriminant functions (Table 3) have been displayed for each speed. All functions are normalized in the range 0 , 1 .
Figure 7 shows the clusters of the discriminant function for the speed of 75,000 rpm.
Functions 1 and 2 (Figure 7a) explain most of the total variance, showing a clear distinction between pure diesel and kerosene, which occupy the right-hand side of the diagram, while on the other side there are the two additive diesel fuels, thus creating two families: pure and admixed fuels. It is possible to observe different behavior depending on whether a pure or non-pure fuel is used. Function 1 is associated with the quadratic oscillation index: the higher this index takes on values, the more the system is characterized by a better use of dynamic power. Indeed, it can be seen from the diagram that dynamic power is better used when using pure rather than admixed fuels: kerosene and diesel assume a very high value of function 1 and, therefore, of the quadratic oscillation index compared to the admixed fuels. This is in full agreement with what was previously stated for the index diagram in Figure 4a, namely that using biofuels reduces emissions of pollutants at the expense of system efficiency. Function 2, which is obtained by adding to the term associated with the quadratic oscillation index a term relating to non-normalized Shannon entropy, the values are spread with respect to the centroids (yellow in the diagrams): as previously stated for this index, it highlights the presence of vibrational cycles that are not stationary and not periodic. It follows that the discriminant analysis at a speed of 75,000 rpm does not allow any clear distinction, since pure diesel describes power conditions like those of kerosene (function 1), while the admixed fuels assume high entropy values, which could compromise the integrity of the system.
Functions 2 and 3 (Figure 7b) do not allow a good distinction between the different types of fuels. Indeed, they explain only 13.1% of the total variance (Table 4) so that the different fuels make a single cluster, preventing any differentiation between the fuels.
Functions 1 and 3 (Figure 7c) allow a distinction between admixed fuels like in Figure 7a but less sharply: this is due to the lower discriminating power of function 3 compared to function 2 (9.3% of function 2 against 3.8% of function 3). Indeed, the overlap between the kerosene and pure diesel clusters is greater than the case in Figure 7a. Once again, the non-admixed fuels occupy the right-hand of the diagram, i.e., the dynamic power of the turbine is fully exploited (function 1 being composed of only the quadratic oscillation index), while the admixed fuels occupy the left-hand of the diagram, emphasizing an opposite behavior to the other two fuels. Finally, the cluster is much more dispersed with respect to the y-axis, particularly for the case of admixed diesel with 1% rapeseed oil.
Figure 8 shows the clusters of the discriminant function for the speed of 80,000 rpm.
The highest discriminating power is associated with functions 1 and 2 (Figure 8a), where it is possible to notice a pattern that clearly distinguishes the four fuels: particularly, the kerosene has values of function 1 different from the remaining fuels. Observing the non-normalized Shannon entropy (function 1), the points are really close to their own centroids: the system vibrates more contained than the 75,000 rpm case. In function 2, the entropy term is more prevalent than the asymmetry: from the diagram in Figure 5b, the kerosene values are clearly lower than the other three fuels, an event that is not repeated in the plot of the clusters (Figure 8a). Finally, it shows the tendency of admixed diesel with 1% rapeseed oil to pure diesel to be greater than diesel with 3% rapeseed oil: this is due to the different percentages of rapeseed oil added to diesel. In general, it can be seen in the diagram that the four clusters are distinct, separated from each other and closer to their own centroids: this allows us to say that it is the best classification obtained.
Since functions 2 and 3 (Figure 8b) have the least discriminating power, they do not allow a good distinction between the different types of fuels as in the case of Figure 8a. Although pure diesel and admixed diesel with 1% rapeseed oil are well-distinguished and separated from the others, kerosene and admixed diesel with 3% rapeseed oil tend to overlap and form a single cluster.
Functions 1 and 3 (Figure 8c) allow a good distinction between the various fuels, although the cumulative variance percentage of 77.9% is lower than in functions 1 and 2 (96.7%). Even though they are slightly less sharply defined than in Figure 8a (this is due to the lower discriminating power of function 3 compared to function 2), the four clusters are still separated so that the diesel and the kerosene family stand out. Therefore, the considerations made previously on function 1 for Figure 8a are the same for the same function but in Figure 8c, i.e., the clusters are concentrated to their centroids and the system vibrates smoother than in the case of 75,000 rpm. Function 3 does not allow a good distinction between the fuels: the four clusters have an elongated shape along y-axis and a same range of values, except for admixed diesel with 1% rapeseed oil.
Figure 9 shows the clusters of the discriminant function for the speed of 85,000 rpm.
In the diagram of Figure 9a, knowing that function 1 is associated with the RMS, function 1 indicates how much energy is involved in terms of signal power where function 1, relatively to the kerosene, assumes greater values than the other fuels, as expected since kerosene is the design fuel, and the turbine is at a speed of 85,000 rpm (closer to the maximum speed). Function 2 allows a clear distinction between pure and admixed diesel: the first is clearly distinguished from the latter with a well-defined cluster, while the admixed diesel with 1% and 3% rapeseed oil overlap and there is not a big difference between the two. Kerosene has the highest power because it has the highest RMS. Since kerosene is the most expensive fuel among the proposed ones, a good alternative is using the pure diesel, which is far cheaper than the kerosene but less powerful (lower RMS). The pure and admixed diesel fuels have about the same function 1 range values: it means that it is possible to use admixed diesel keeping a similar RMS. Increasing the amount of rapeseed oil, the power output of the turbine and the pollutants decrease (this is also confirmed by the diagram in Figure 6a).
Functions 2 and 3 (Figure 9b) do not allow a good distinction between the various clusters: the four fuels tend to overlap and mix. As said for the previous speed rates, this event is due to the low percentage of cumulative variance provided by functions 2 and 3 (26.8%).
As in the case with functions 1 and 2, in the case of functions 1 and 3 (Figure 9c) it is possible to distinguish, on the left hand, the diesel family and, on the right hand, the kerosene, regarding function 1; furthermore, there is no distinction between pure diesel and admixed fuels. As regards function 3, it can be observed that the assumed values by pure fuels is much more concentrated around their centroid, unlike admixed fuels, which present much wider and dispersed values.

4.3. Classification Summary

Finally, the confusion matrices and the Cohen’s kappa for each of the analyzed speeds are reported to highlight the goodness of the classification performed. In all confusion matrices, there are target classes along the first row and output classes along the first columns.
In the 75,000 rpm case (Table 5), it can be seen that 90.4% of the samples are correctly classified, which is an optimal result. In the kerosene case, 100% of the samples are correctly classified, while the lowest percentage is in the case of admixed diesel with 3% rapeseed oil where 19.2% of the samples are included in the case of admixed diesel with 1% rapeseed oil. Finally in the pure diesel case, 84% of the samples are correctly classified, while the remaining are confused with kerosene. It is interesting to note that it is never confused with admixed diesel, except for one sample confused with admixed diesel with 3% rapeseed oil: this underlines the clear separation between the two families of fuels shown in the clusters of Figure 7a.
In the case at 80,000 rpm (Table 6), 100% of the samples is correctly classified: this is the best possible case of classification since no value of the chosen variables will be associated with a different predicted class. This result was desirable from the simple observation of the clusters in Figure 8a, which are all distinct and separate from the others, and this confirmed that this is the best possible classification.
In the case at 85,000 rpm (Table 7), 93.4% of samples are correctly classified. Both kerosene and pure diesel fuel contribute to this high percentage as both report a 100% correct classification. The lowest percentage of correct classification is for admixed diesel with 1% rapeseed oil: 80% is for the 1% rapeseed oil while the remaining 20% is assigned to 3% rapeseed oil. Moreover, for the admixed diesel with 3% rapeseed oil, 93.6% of samples are correctly classified, while the remaining are confused with admixed diesel with 1% rapeseed oil. This was also evident from the diagram in Figure 9a in which the clusters of the two admixed diesels tend to overlap and form a single cluster. It is possible to say that the case analyzed at 85,000 rpm constitutes a good distinction between pure fuels (the latter being correctly classified as 100%) and admixed fuels.
To confirm the optimal results obtained with the proposed classification method, Table 8 shows the Cohen’s kappa values for each turbine speed. The values of this index are always greater than 0.8: this implies an optimal classification, especially for the case at 80,000 rpm.

5. Conclusions

From the simple observation of the selected indices of the discriminant model, the following results could be deduced:
  • For the 75,000 rpm case, a strong distinction emerges between pure and admixed fuels: for the pure fuels, the quadratic oscillation index assumes the greatest values suggesting that the explosive power of the fuel is fully exploited while there is a decrease in the explosive power and pollutants for the admixed fuels. Non-normalized Shannon entropy show a no-stationary and no-periodic vibrational cycle, in particular for the admixed fuels;
  • For the 80,000 rpm case, just as for the previous case, it is possible to well-distinguish pure and admixed fuels (by non-normalized Shannon entropy and RMS), but at the same time, thanks to the asymmetry, an excellent distinction emerges between the turbine design fuel (kerosene) and the others (diesel family);
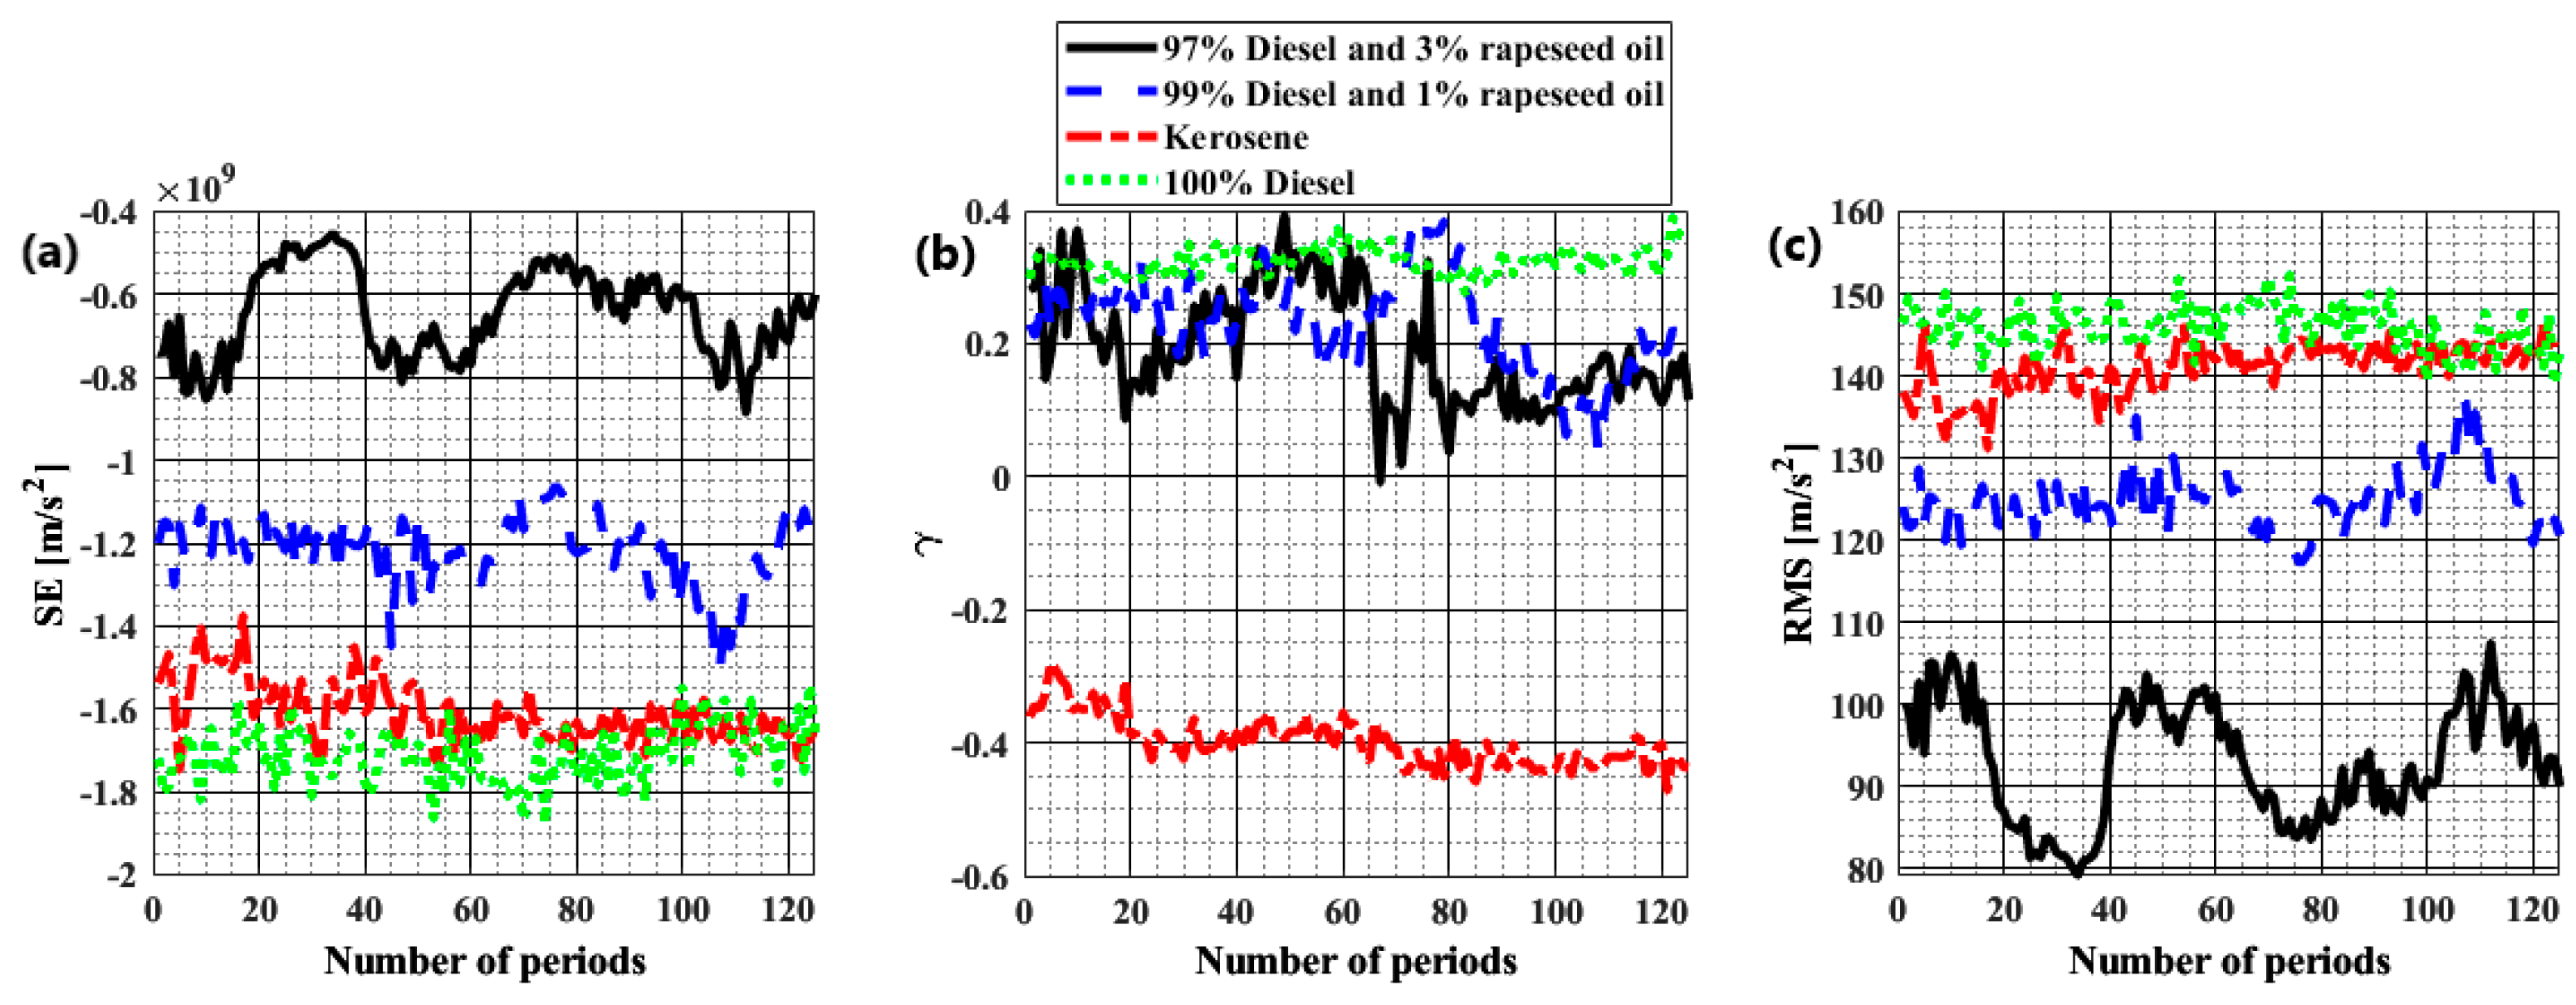
  • For the 85,000 rpm case, the distinction is evident of how dynamic energy is best exploited using kerosene (by RMS), and how vibrations tend to be more regular with pure fuels (by asymmetry).
For all three analyzed speeds, the diagrams of discriminant functions 2 and 3 do not allow a good differentiation of the fuels as expected given the low percentage of cumulative variance (Table 4).
As regards the diagrams of functions 1 and 3, they certainly allow better differentiation than the case of functions 2 and 3 because of the higher percentage of cumulative variance, but they still do not allow optimal differentiation for each speed.
The best differentiation is provided by the diagrams obtained from functions 1 and 2, which provide the highest percentage of cumulative variance. Indeed:
  • The 75,000 rpm case showed the distinction between the pure and admixed family: they are in two different zones of the diagram in Figure 7a. The admixed diesel with 1% rapeseed oil has a greater tendency toward pure diesel than the diesel with 3% rapeseed oil;
  • The 80,000 rpm case provided the best possible differentiation among all the fuels because of the formation of four distinct, separate and non-overlapping clusters. In this diagram, it is possible to distinguish between the diesel and the kerosene family;
  • As for the previous speed, the case at 85,000 rpm led to the distinction between the diesel and the kerosene family but not an optimal distinction between the two admixed fuels because of overlapping clusters.
The results show that the best possible classification occurs in the case at 80,000 rpm where the clusters are well-defined and spaced out. This classification model can be used for quality check of the purchased fuel, especially diesel. It could happen that the purchased fuel has been admixed with crude oils, which can negatively affect its quality because of different molecular structures. Another application can be the quantity check of rapeseed oil admixed with diesel. Comparing the vibrational behavior of the turbine powered by the supplied fuel with the vibrational response of the same with the desired fuel, it is possible to say whether the fuel purchased from the supplier meets the required standards or not.
Finally, it is possible to make some final observations on the individual velocities with respect to the diagrams obtained by plotting functions 1 and 2:
  • In the case at 75,000 rpm, the clusters with respect to function 2 were always very dispersed around their centroids, underlining how the turbine presents vibrational cycles that are not very stationary and not very periodic, while the clusters with respect to function 1 show that the dynamic power of the system is better exploited with pure fuels. The best performance is with the pure fuels, but the lower emissions and costs are with the admixed fuels.
  • In the case at 80,000 rpm, the clusters with respect to function 1 are always grouped around their own centroids, highlighting more stationary and periodic vibrations than the other cases. This is the best working condition for the turbine.
  • In the case of 85,000 rpm, referring to function 1, the kerosene has the highest values and better exploits dynamic energy, while the diesel family presents a similar range of values. Regarding function 2, there is a clear distinction between admixed and pure diesels: the pure diesel presents higher explosive power. Thus, kerosene has the best possible performance but is the most expensive. The three diesels are cheaper but make the turbine less efficient. Lastly, there is not a great difference between using an admixed diesel with 1 or 3% rapeseed oil.
From the confusion matrices and the calculation of Cohen’s kappa, it was possible to establish the worth of the classification method studied and to see that, for all three velocities studied, optimal results were obtained.
The operating conditions of a gas micro-turbine powered with different types of fuel was discussed in this work. As discussed in the current literature, vibrational analysis has already been addressed to study the behavior of gas turbines through different approaches. The innovation of this work is the application of discriminant analysis to accelerometric signals, highlighting how it can provide indications regarding the differences in the system vibrations when powered with pure fuels or biofuels.

Author Contributions

Conceptualization, C.C., M.S. and A.N.; methodology, V.N., S.S. and G.Q.; software, C.C., M.S. and A.N.; validation, V.N., S.S. and G.Q.; investigation, C.C., M.S. and A.N.; data curation, C.C., M.S. and A.N.; writing—original draft preparation, C.C., M.S. and A.N.; writing—review and editing, V.N., S.S. and G.Q.; visualization, C.C., M.S. and A.N.; supervision, V.N., S.S., G.Q. All authors have read and agreed to the published version of the manuscript.

Funding

This paper received no external funding.

Data Availability Statement

Not available.

Conflicts of Interest

The authors declare no conflict of interest.

References

  1. Rochelle, D.; Najafi, H. A review of the effect of biodiesel on gas turbine emissions and performance. Renew. Sustain. Energy Rev. 2019, 105, 129–137. [Google Scholar] [CrossRef]
  2. Bazooyar, B.; Darabkhani, H.G. Design, manufacture and test of a micro-turbine renewable energy combustor. Energy Convers. Manag. 2020, 213, 112782. [Google Scholar] [CrossRef]
  3. Ameli, S.M.; Agnew, B.; Potts, I. Integrated distributed energy evaluation software (IDEAS) Simulation of a micro-turbine based CHP system. Appl. Therm. Eng. 2007, 27, 2161–2165. [Google Scholar] [CrossRef]
  4. Karvountzis-Kontakiotis, A.; Andwari, A.M.; Pesyridis, A.; Russo, S.; Tuccillo, R.; Esfahanian, V. Application of Micro Gas Turbine in Range-Extended Electric Vehicles. Energy 2018, 147, 351–361. [Google Scholar] [CrossRef]
  5. Menkiel, B.; Donkerbroek, A.; Uitz, R.; Cracknell, R.; Ganippa, L. Combustion and soot processes of diesel and rapeseed methyl ester in an optical diesel engine. Fuel 2014, 118, 406–415. [Google Scholar] [CrossRef]
  6. Daho, T.; Vaitilingom, G.; Sanogo, O.; Ouiminga, S.K.; Zongo, A.S.; Pirioud, B.; Koulidiati, J. Combustion of vegetable oils under optimized conditions of atomization and granulometry in a modified fuel oil burner. Fuel 2014, 118, 329–334. [Google Scholar] [CrossRef]
  7. Bayındır, H.; Zerrakki Isık, M.; Argunhan, Z.; Lütfü Yücel, H.; Aydın, H. Combustion, performance and emissions of a diesel power generator fueled with biodiesel-kerosene and biodiesel-kerosene-diesel blends. Energy 2017, 123, 241–251. [Google Scholar] [CrossRef]
  8. Nascimento, M.A.; Lora, E.S.; Corrêa, P.S.; Andrade, R.V.; Rendon, M.A.; Venturini, O.J.; Ramirez, G.A. Biodiesel fuel in diesel micro-turbine engines: Modelling and experimental evaluation. Energy 2008, 33, 233–240. [Google Scholar] [CrossRef]
  9. Rakopoulos, D.C.; Rakopoulos, C.D.; Giakoumis, E.G. Impact of properties of vegetable oil, bio-diesel, ethanol and n-butanol on the combustion and emissions of turbocharged HDDI diesel engine operating under steady and transient conditions. Fuel 2015, 156, 1–19. [Google Scholar] [CrossRef]
  10. Chiaramonti, D.; Rizzo, A.M.; Spadi, A.; Prussi, M.; Riccio, G.; Martelli, F. Exhaust emissions from liquid fuel micro gas turbine fed with diesel oil, biodiesel and vegetable oil. Appl. Energy 2013, 101, 349–356. [Google Scholar] [CrossRef]
  11. Boomadevi, P.; Paulson, V.; Samlal, S.; Varatharajan, M.; Sekar, M.; Alsehli, M.; Tola, S. Impact of microalgae biofuel on microgas turbine aviation engine: A combustion and emission study. Fuel 2021, 302, 121–155. [Google Scholar] [CrossRef]
  12. Chiong, M.C.; Chong, C.T.; Ng, J.H.; Lam, S.S.; Tran, M.V.; Chong, W.W.F.; Valera-Medina, A. Liquid biofuels production and emissions performance in gas turbines: A review. Energy Convers. Manag. 2018, 173, 640–658. [Google Scholar] [CrossRef] [Green Version]
  13. Enagi, I.I.; Al-Attab, K.A.; Zainal, Z.A. Liquid biofuels utilization for gas turbines: A review. Renew. Sustain. Energy Rev. 2018, 90, 43–55. [Google Scholar] [CrossRef]
  14. Sallevelt, J.L.H.P.; Gudde, J.E.P.; Pozarlik, A.K.; Brem, G. The impact of spray quality on the combustion of a viscous biofuel in a micro gas turbine. Appl. Energy 2014, 132, 575–585. [Google Scholar] [CrossRef]
  15. Lv, X.; Liu, X.; Gu, C.; Weng, Y. Determination of safe operation zone for an intermediate temperature solid oxide fuel cell and gas turbine hybrid system. Energy 2016, 99, 91–102. [Google Scholar] [CrossRef] [Green Version]
  16. Reggio, F.; Ferrari, M.L.; Silvestri, P.; Massardo, A.F. Vibrational analysis for surge precursor definition in gas turbines. Meccanica 2019, 54, 1257–1278. [Google Scholar] [CrossRef] [Green Version]
  17. Kaczmarczyk, T.Z.; Żywica, G.; Ihnatowicz, E. Measurements and vibration analysis of a five-stage axial-flow microturbine operating in an ORC cycle. Diagnostyka 2017, 18, 51–58. [Google Scholar]
  18. Waumans, T.; Waumans, T.; Vleugels, P.; Peirs, J.; Al-Bender, F.; Reynaerts, D. Rotordynamic behaviour of a micro-turbine rotor on air bearings: Modelling techniques and experimental verification. In Proceedings of the International Conference on Noise and Vibration Engineering, Heverlee, Belgium, 18–20 September 2006. [Google Scholar]
  19. Talebi, S.S.; Tousi, A.M. The effects of compressor blade roughness on the steady state performance of micro-turbines. Appl. Therm. Eng. 2017, 115, 517–527. [Google Scholar] [CrossRef]
  20. Cafaro, S.; Traverso, A.; Ferrari, M.L.; Massardo, A.F. Performance Monitoring of Gas Turbine Components: A Real Case Study Using a Micro Gas Turbine Test Rig. In Proceedings of the ASME Turbo Expo, Genova, Italy, 8–12 June 2009. [Google Scholar]
  21. Rahmounea, M.B.; Hafaifaa, A.; Kouzoua, A.; Chenc, X.; Chaibetd, A. Gas turbine monitoring using neural network dynamic nonlinear autoregressive with external exogenous input modelling. Math. Comput. Simul. 2021, 179, 23–47. [Google Scholar] [CrossRef]
  22. Allouis, C.; Amoresano, A.; Capasso, R.; Langella, G.; Niola, V.; Quaremba, G. The impact of biofuel properties on emissions and performances of a micro gas turbine using combustion vibrations detection. Fuel Process. Technol. 2018, 179, 10–16. [Google Scholar] [CrossRef]
  23. Amoresano, A.; Avagliano, V.; Niola, V.; Quaremba, G. The assessment of the in-cylinder pressure by means of the morpho-dynamical vibration analysis—Methodology and application. Int. Rev. Mech. Eng. 2013, 7, 999–1006. [Google Scholar]
  24. Niola, V.; Quaremba, G.; Forcelli, A. The detection of gear noise computed by integrating the Fourier and Wavelet methods. WSEAS Trans. Signal Process. 2008, 4, 60–67. [Google Scholar]
  25. Niola, V.; Quaremba, G. The Gear Whine Noise: The influence of manufacturing process on vibro-acoustic emission of gear-box. In Proceedings of the 10th WSEAS International Conference, Recent Researches in Communications, Automation, Signal Processing, Nanotechnology, Astronomy and Nuclear Physics, Athens, Greece, 20 February 2011. [Google Scholar]
  26. Spirto, M.; Savino, S.; Quaremba, G.; Cosenza, C.; Nicolella, A.; Niola, V. Discriminant analysis of the vibrational dynamics of a gas microturbine with different fuels. In Proceedings of the 5th Jc-IFToMM International Symposium, the 28th Jc-IFToMM Symposium on Theory of Mechanism and Machines, Kyoto, Japan, 16 July 2022. [Google Scholar]
  27. Niola, V.; Quaremba, G. Sistemi Vibrazionali Complessi Teoria, Applicazioni e Metodologie Innovative di Analisi, 1st ed.; Nane Edizioni: Italy, 2015. [Google Scholar]
  28. Niola, V.; Spirto, M.; Savino, S.; Cosenza, C. Vibrational analysis to detect cavitation phenomena in a directional spool valve. Int. J. Mech. Control 2021, 22, 11–16. [Google Scholar]
  29. Cosenza, C.; Nicolella, A.; Genovese, A.; Niola, V.; Savino, S.; Spirto, M. A Vision Based Approach to Study Lubrication Conditions in Gearwheels. In Proceedings of the 4th International Conference of the IFToMM Italy, Naples, Italy, 7 September 2022. [Google Scholar]
  30. Niola, V.; Savino, S.; Quaremba, G.; Cosenza, C.; Spirto, M.; Nicolella, A. Study on the Dispersion of Lubricant Film from a Cylindrical Gearwheels with Helical Teeth by Vibrational Analysis. WSEAS Trans. Appl. Theor. Mech. 2021, 16, 274–282. [Google Scholar] [CrossRef]
  31. Warrens, M.J. Five Ways to Look at Cohen’s Kappa. J. Psychol. Psychother. 2015, 5, 1–4. [Google Scholar] [CrossRef] [Green Version]
  32. Sun, S. Meta-analysis of Cohen’s kappa. Health Serv. Outcomes Res. Methodol. 2011, 11, 145–163. [Google Scholar] [CrossRef]
Figure 1. Turbine side view.
Machines 10 00925 g001
Figure 2. System test bench.
Machines 10 00925 g002
Figure 3. Algorithms implemented for calculating indices.
Machines 10 00925 g003
Figure 4. Indices for 75,000 rpm: (a) quadratic oscillation index, (b) non-normalized Shannon entropy, and (c) asymmetry.
Machines 10 00925 g004
Figure 5. Indices for 80,000 rpm: (a) non-normalized Shannon entropy, (b) asymmetry, and (c) root mean square value.
Machines 10 00925 g005
Figure 6. Indices for 85,000 rpm: (a) root mean square value, (b) quadratic oscillation index, and (c) asymmetry.
Machines 10 00925 g006
Figure 7. Clusters for 75,000 rpm: (a) functions 1 and 2, (b) functions 2 and 3, and (c) functions 1 and 3.
Machines 10 00925 g007
Figure 8. Clusters for 80,000 rpm: (a) functions 1 and 2, (b) functions 2 and 3, and (c) functions 1 and 3.
Machines 10 00925 g008
Figure 9. Clusters for 85,000 rpm: (a) functions 1 and 2, (b) functions 2 and 3, and (c) functions 1 and 3.
Machines 10 00925 g009
Table 1. Tests summary.
Test NumberFuelRPM
197% Diesel and 3% rapeseed oil75,000
299% Diesel and 1% rapeseed oil75,000
3Kerosene75,000
4100% Diesel75,000
597% Diesel and 3% rapeseed oil80,000
699% Diesel and 1% rapeseed oil80,000
7Kerosene80,000
8100% Diesel80,000
997% Diesel and 3% rapeseed oil85,000
1099% Diesel and 1% rapeseed oil85,000
11Kerosene85,000
12100% Diesel85,000
Table 2. Variables chosen for the model.
Step75,000 rpm80,000 rpm85,000 rpm
1Quadratic Oscillation
Index ( O 2 )
Non-Normalized
Shannon Entropy ( S E )
Root Mean Square
Value ( R M S )
2Non-Normalized
Shannon Entropy ( S E )
Asymmetry ( γ )Quadratic Oscillation
Index ( O 2 )
3Asymmetry ( γ )Root Mean Square
Value ( R M S )
Asymmetry ( γ )
Table 3. Discriminant function.
Function75,000 rpm80,000 rpm85,000 rpm
1 F 1 = a 1 O 2 F 1 = a 1 S E F 1 = a 1 R M S
2 F 2 = b 1 O 2 + b 2 S E F 2 = b 1 S E + b 2 γ F 2 = b 1 R M S + b 2 O 2
3 F 3 = c 1 O 2 + c 2 S E + c 3 γ F 3 = c 1 S E + c 2 γ + c 3 R M S F 3 = c 1 R M S + c 2 O 2 + c 3 γ
Table 4. Variance percentage.
RPM75,00075,00080,00080,00085,00085,000
Function% Function Variance% Cumulative Variance% Function Variance% Cumulative Variance% Function Variance% Cumulative Variance
186.986.974.674.673.273.2
29.396.222.196.722.095.2
33.81003.31004.8100
Table 5. Confusion matrix for 75,000 rpm.
Fuel97% Diesel and 3% Rapeseed Oil99% Diesel and 1% Rapeseed OilKerosene100% DieselTotal %
97% Diesel and 3% rapeseed oil101240080.8%
99% Diesel and 1% rapeseed oil41210096.8%
Kerosene001250100%
100% Diesel011910584%
Total %83.4%95.3%86.8%100%90.4%
Table 6. Confusion matrix for 80,000 rpm.
Fuel97% Diesel and 3% Rapeseed Oil99% Diesel and 1% Rapeseed OilKerosene100% DieselTotal %
97% Diesel and 3% rapeseed oil125000100%
99% Diesel and 1% rapeseed oil012500100%
Kerosene001250100%
100% Diesel000125100%
Total %100%100%100%100%100%
Table 7. Confusion matrix for 85,000 rpm.
Fuel97% Diesel and 3% Rapeseed Oil99% Diesel and 1% Rapeseed OilKerosene100% DieselTotal %
97% Diesel and 3% rapeseed oil100250080%
99% Diesel and 1% rapeseed oil81170093.6%
Kerosene001250100%
100% Diesel000125100%
Total %92.6%82.4%100%100%93.4%
Table 8. Cohen’s kappa.
RPMLower ExtremeMean ValueUpper Extreme
75,0000.83760.87200.9064
80,000111
85,0000.88300.91200.9410
Publisher’s Note: MDPI stays neutral with regard to jurisdictional claims in published maps and institutional affiliations.

