Essay

Effect of Residual Stresses on Wheel Fatigue Life and Experimental Validation

1
College of Marine Equipment and Mechanical Engineering, Jimei University, Xiamen 361000, China
2
Xiamen Sunrise Group Co., Ltd., Xiamen 361000, China
*
Author to whom correspondence should be addressed.
Machines 2022, 10(10), 924; https://doi.org/10.3390/machines10100924
Submission received: 1 September 2022 / Revised: 1 October 2022 / Accepted: 4 October 2022 / Published: 11 October 2022
(This article belongs to the Section Vehicle Engineering)

Abstract

:
Steel wheels, consisting of rims and spokes, are important load-bearing parts of vehicles, and the fatigue fractures’ life estimation accuracy directly determines the stability and safety when applied in the transportation industry. The most common form of failure is fatigue fracture. The strong elastic–plastic deformation during the rim roll-forming process generates a residual stress field in its surface layer, which changes the actual stress distribution in the rim when it is loaded and thus affects the fatigue life of the steel wheel. In this paper, ABAQUS software was used to establish a rim-rolling simulation model to obtain the residual stress field distribution after forming and compare it with the actual residual stress on the formed surface of the rim to verify the reliability of the model. On the basis of this model establishment, the service hazard areas and maximum stresses of steel wheels with or without superimposed residual stress fields were calculated separately, and their fatigue lives were predicted separately using the local stress-strain method. The simulation results show that the maximum stress of the rim before and after the superimposed residual stress occurs in the area of the bottom of the groove, which is consistent with the actual failure location. However, the maximum stress after superposition increased from 120.7 MPa to 332.9 MPa, and the corresponding calculated life decreased from 158,340,000 to 459,500 cycles, which is closer to the actual test results. The results of the study can provide a theoretical basis for the lightweight design and process improvement of automotive steel wheels.

1. Introduction

Accurate estimation of fatigue life of wheels, generally composed of spokes and rims, has great potential to improve the performance of safety of the vehicle. The design and production process experiences three durability tests, including radial fatigue test, dynamic bending fatigue test, and impact test [1]. The dynamic bending fatigue test is applied to simulate the loading of the wheels during vehicle turning [2,3], and its force state is the most complex and difficult to analyze [4,5,6]. In the actual product development process, it is difficult to make a more accurate estimate of the fatigue life of a product. The test life often differs significantly from the initial design expectations, and the design can only be continuously improved through repeated testing. This design method based on the sole experiments requires a large amount of time and cost; therefore, a systematic and efficient design method is hard to form; as a result, the development of the industry is seriously limited.
In order to seek an efficient analysis method that can accurately predict the actual stress distribution and fatigue life of wheels, shorten the design cycle, and ensure the safety of traffic, a large amount of studies were conducted. Karandikar H. M. et al. used finite element simulation, equivalent force magnitude, and S-N curves and local stress-strain methods to predict the fatigue life of wheels in cornering, respectively [7,8,9,10]. Zheng Z. G. et al. [11] proposed a computational method to simulate the dynamic bending fatigue tests of wheels and estimate their multi-axial fatigue life, illustrating that steel wheels are in a biaxial tensile and compressive stress state in dynamic bending fatigue tests. Duan Y. et al. [12] proposed a new method for multi-scale biaxial fatigue simulation, which can significantly reduce the dispersion of biaxial virtual test life prediction results. Wan X. et al. [13] considered the biaxial loading conditions for the effect of tire and wheel camber, and their simulation model was closer to the actual service conditions. The above experimental studies were all based on fatigue life predictions based on nominal load stresses during wheel service without considering the effects of their manufacturing process.
The manufacturing process of a component is accompanied by a complex stress evolution that generates certain residual stresses and affects its fatigue life [14,15]. Based on the above view, some scholars have conducted studies related to the effect of residual stress on wheel fatigue life. Das B. et al. [16] considered the effect of the steel wheel disc forming thickness variation and pre-strain on fatigue life prediction of steel wheel turning. This method can be used to predict the turning fatigue life of different wheel designs and patterns. Dong S. et al. [17] proposed a wheel fatigue life prediction method introducing residual stresses in steel wheel disc stamping, and the results were more accurate and effective. Zheng Z. et al. showed that the design style and complexity of the wheel had a large influence on its dynamic cornering fatigue failure location [18,19,20]. Rim failure, accounting for a large proportion of the cases, and residual stresses exist in rim-roll forming. Analysis of the residual stress distribution on the forming surface of steel wheel rims and its effect on fatigue life is of great interest to the work of improving wheel life and the light weight of wheels. In this paper, ABAQUS software was used to simulate the residual and working stresses in wheel rims. The effect of residual stresses on the prediction of wheel fatigue life was analyzed. Finally, the predicted life was compared with the experimental one in order to verify the feasibility of the method.

2. Steel Rim-Roll-Forming Simulation

2.1. Rim-Roll-Forming Model Construction

The rim-rolling system usually consists of an upper roll, a lower roll, and a guide wheel. The upper roll rotates around the axis in the initial position, and the lower roll rotates around the axis while feeding upward to squeeze the rim to obtain the desired outer profile. Taking the roll forming process of 22.5 × 9 steel rim as an example, we established the finite element model as shown in Figure 1. The upper roll, lower roll, and guide wheel are made of analytic rigid body, and the rim blank is made of eight-node linear hexahedral element C3D8R, and the sweep progression algorithm divides the mesh with a total of 29,784 cells. In order to avoid tearing due to excessive deformation during the rolling process, this rim needs to be roll formed three times to obtain the desired profile. During the simulation, the stress and strain data from the previous roll forming are sequentially transferred to the next roll-forming process.
Zhang Yunkai et al. [21] used an electronic universal testing machine to perform room temperature tensile tests on 380cl steel plates to obtain data on the mechanical properties of the material. The rim blank is made of 380CL wheel special steel with initial thickness of 4 mm, whose Young’s modulus is 189 GPa, Poisson’s ratio is 0.3, and yield strength is 288 MPa, and the real stress–plastic strain relationship of the material is shown in Figure 2. The contact between the rolling tool and the rim is face-to-face, and the contact constraint is applied by using the penalty function contact method with a feed rate of 5 mm/s. The rolling process is simulated by using an explicit dynamics algorithm.

2.2. Residual Stress Field Analysis of Rim-Roll Forming

The first roll is mainly to perform the bottom part of the groove, and the bottom part of the groove is deformed by the first contact with the upper roll. The simulation results of the profile and residual stress after rolling are shown in Figure 3. In the rolling process, the continuous reduction of the diameter of the bottom of the groove leads to the metal material flow to the middle, and the material flow in the contact area between the outer surface of the bottom and the upper roller is limited by the roller, resulting in the surface residual tensile stress of a large value outside the bottom of the groove; the maximum value is 222.7 MPa. Similarly, the inner surface of the outer edge is in contact with the lower roll, and the flow of other materials is restricted, resulting in a relatively large residual surface tensile stress on the inner surface of the outer edge.
The second roll is mainly to shape the groove bottom part and the rim part to obtain a more accurate groove bottom profile size while preforming the rim part, and the residual stress after rolling is shown in Figure 4. The residual stress increases slightly after the rounding of the groove bottom is further reduced, and the diameter of the middle of the rim is further enlarged, but the axial residual stress is distributed in a more uniform way in this area, and the amplitude of the circumferential residual stress on the inner surface continues to increase due to the flaring, with a maximum value of 266.6 MPa.
As the shape of the rim is already relatively close to the workpiece in the first two roll forms, the third roll is mainly for forming the outer edge and the rib in the middle of the rim to achieve precise forming, and the residual stress distribution after rolling is shown in Figure 5. The arc radius of the wheel rim is small, and the material here undergoes serious plastic deformation during the forming process, so the residual tensile stresses of high magnitude appear on the outer surface of this area. It can be seen that the residual tensile stresses are on the outer surface of the groove bottom, there are large residual tensile stresses on the outer surface and inner surface of the outer edge, and the maximum value is 274.9 MPa. It will have a certain negative effect on the fatigue life of the steel wheel. The rim-roll-forming simulation simulates the actual rim-forming process. When the lower roll drives the rim blanks to rotate upward, the rim will inevitably have a large impact in the local area, and its regional residual stress will show a certain asymmetry in the value.

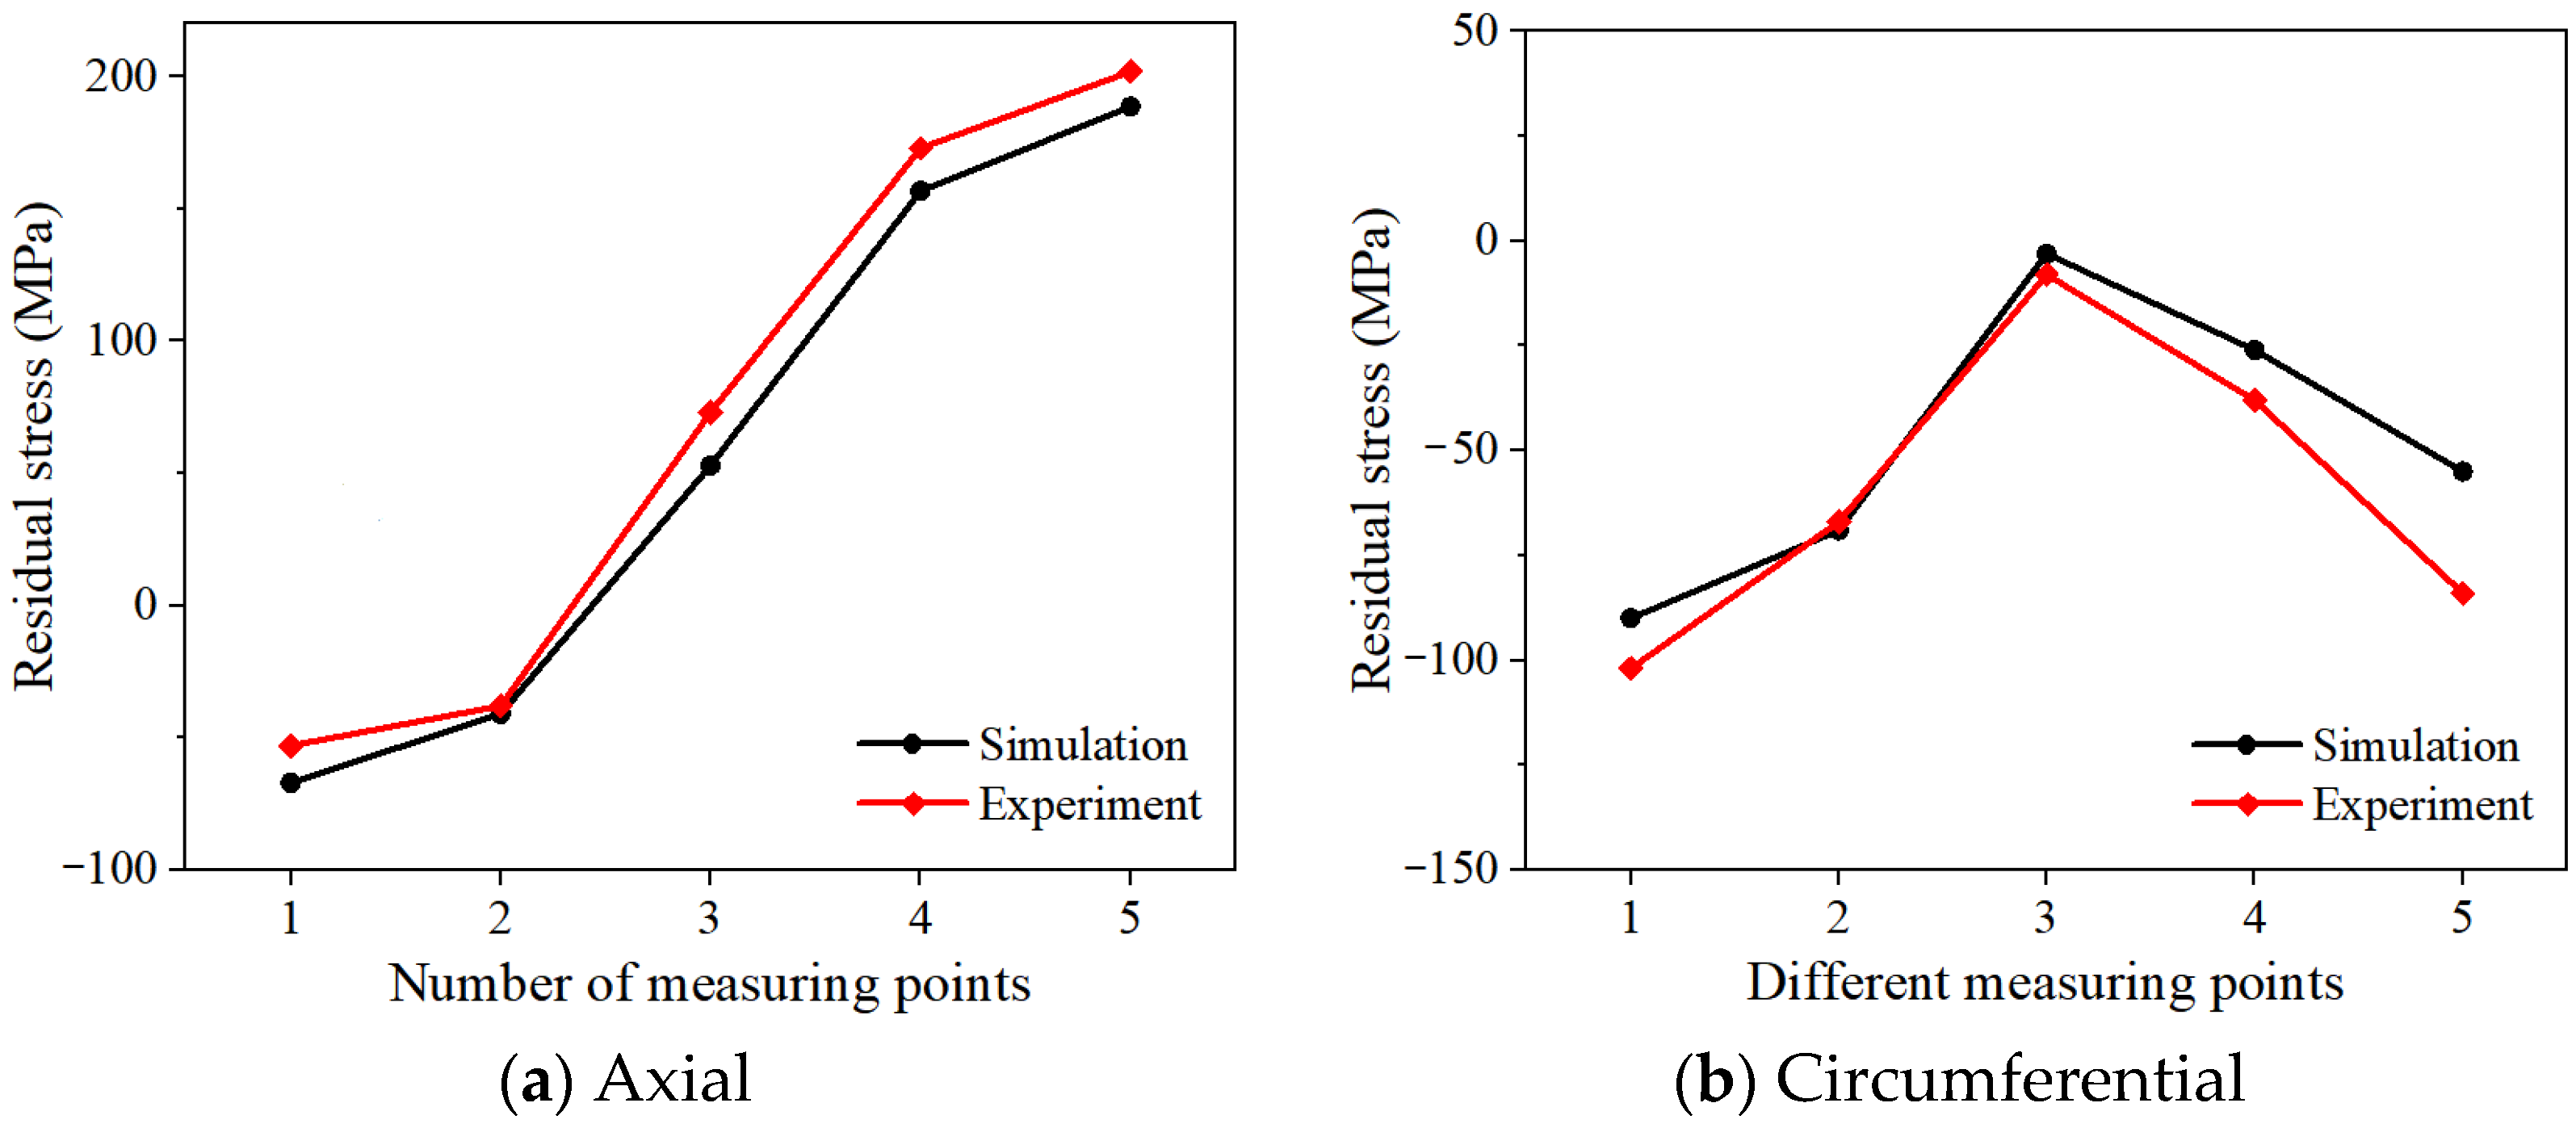
2.3. Residual Stress Measurement of Rim-Rolling Forming

In order to verify the accuracy of the roll-forming simulation results, the residual stresses in the rim were measured using X-ray diffraction. The basic principle of X-ray diffraction is that when internal stresses exist in a polycrystalline material, the grain surface spacing d of the material inevitably changes, and diffraction occurs when certain conditions are satisfied between the known X-ray wavelength λ and the diffraction angle α, thus achieving an indirect measurement of the residual stresses. This relationship for the occurrence of diffraction is known as the Bragg equation [22,23]:
2 d sin α = n λ
The HDS-I X-ray diffractometers used in this paper are shown in Figure 6. The penetration depth of X-rays to the general metal plate is small (about 10 μm), so the residual stress component in the direction of the surface normal is not considered. The rim deformation is plastic deformation with large size and complex shape, and the area to be measured is cut off from the rim with a wire cutter with sufficient margin. The stress change near the measurement point after cutting is negligible.
As the deformation of the measured point is large, the measurement error range is very large. Therefore, the area of large bending deformation is ignored, and the points in the relatively flat area of the surface are selected. We marked 5 measurement points along the outer surface of the rim, as shown in Figure 7, and a local coordinate system for each measurement point was established, where the x-axis is along the circumferential direction, and the y-axis is along the axial direction, and the residual stress distribution in both directions is obtained by taking the average of three measurements, as shown in Table 1.
When selecting the residual stress simulation value, the local high area is avoided, while the residual stress simulation value in other areas is more uniform The comparison of the results of the simulated and measured residual stresses is shown in Figure 8. It can be seen that the residual stress of the rim along the measured path gradually increases from −100 MPa to 200 MPa, and there is a significant rising trend between measurement points 3 and 5, which indicates that the material deformation trend in this region has changed significantly, and it matches well with the test-measured participation stress distribution. Except for the deviation of 29.7% for the circumferential residual stress at point 5 of the third roll in Figure 8 (b), the deviation is smaller (less than 20%) for most of the measured points, which verifies the accuracy of the proposed elastic–plastic simulation model in describing the residual stress distribution of the rim after roll forming. The accuracy of the simulation model is verified.

3. Stress Field Analysis of Rim in Turning Condition

3.1. Construction of Steel Wheel Turning Mode Model

The dynamic bending fatigue test is used to simulate the wheel life test under the turning and loading conditions of the vehicle. As shown in Figure 9, according to “GB36581-2018” wheel dynamic bending fatigue performance test 90° loading method (bottom clamping method), the lower outer side of the wheel rim is fixed with a flange clamped on the test machine, and the wheel is installed on the mounting surface with a length of L = 0.6 m and sufficient rigidity of the load shaft.
According to the above test conditions in ABAQUS to establish the dynamic bending fatigue test finite element model of the wheel, as shown in Figure 10, the model consists of spokes, rim, connecting plate, bolts, and load shaft, and we calculated the loading bending moment M, N-m according to Equation (2).
M = ( μ R + d ) F v S
where μ is the friction coefficient between the tire and the road; R is the static load radius of the maximum tire mated to this wheel, m; d is the internal offset of the wheel, m; Fv is the rated load of the wheel, N; S is the reinforcement factor. According to the above formula, the loading moment M at a value of 21350 N-m is calculated, and the loading concentration force at the arm end of the force arm is F0 = 35583.3 N.
The modal analysis shows that the first-order intrinsic frequency of the wheel is 203 Hz, which is much higher than its operating frequency of 30 Hz, so the dynamic rotational loading process can be reduced to a quasi-static problem solution. A rotational load F0 is applied at the end of the load axis at point O, which varies uniformly along the direction in the Oxy plane. as shown in Figure 11, F0 can be decomposed into two components Fx and Fy along the x- and y-axes; θ is the angle between F0 and the x axis.
F x = F 0 = cos θ
F y = F 0 = sin θ

3.2. Analysis of Stress Field under Turning Condition

3.2.1. Nominal Stress Field of Rim Wheel

When θ was increased from 0° to 360° in steps of 22.5°, the change in load experienced during one week of wheel rotation was approximated. The nominal stress distribution of the rim under a load of θ = 0° is shown in Figure 12. The area at the bottom of the rim groove is the danger zone, and the working stress near it is significantly greater than the other areas. The point A with the maximum stress in this zone was selected as the object of interest to study its nominal stress history as θ increases from 0° to 360° in a complete cycle.
The nominal stress history curve at point A obtained from the simulation is shown in Figure 13. It can be seen that the maximum principal amplitude at this point under 16 different directional loads is 120.7 MPa. During the cycle change, the nominal stress of the rim is always much less than its yield stress, but the rim still experiences fatigue failure several times during the bending fatigue test, so there are still some important factors that have not been effectively considered in the simulation model, such as the surface residual stresses introduced during the roll-forming process described above.

3.2.2. Rim Wheel Actual Service Stress Field

In order to study the effect of roll-forming residual stress on the actual service stress of the wheel, the residual stresses and strains of the rim after three rolls were transferred to the dynamic bending fatigue test finite element model using ABAQUS. At this time, the initial stress of the rim is not zero, and the calculated service stress of the rim is the superposition of the residual stress and the nominal stress.
The stress distribution after superposition is shown in Figure 14. It can be seen that the maximum stress region is also shifted to some extent (adjusted with the actual results) due to the different initial stresses, causing a significant change in the nominal after superposition. The maximum stress point A’ was selected as the object of attention in the stress maximum region to record its nominal stress history curve, with θ increasing from 0° to 360° in the complete cycle as shown in Figure 15. It can be seen that after superimposing the residual stresses from the previous process, the actual stress history curve of the rim changes significantly, and its maximum magnitude increases to 332.9 MPa. These changes will certainly affect the fatigue life of the wheel. The simulation results were further validated the corresponding fatigue life test.

4. Validation of the New Prediction Method

4.1. Local Stress–Strain Fatigue Life Prediction Method

The local stress-strain method is used for analyzing the fatigue life based on the strain–life relationship, which considers the local plastic deformation at the stress concentration site as a prerequisite for fatigue crack sprouting and expansion and combines the stress–strain relationship curve and fatigue cumulative damage theory for fatigue life calculation. It is applicable to estimate fatigue life over the entire range of fatigue curves, including the low circumference fatigue state (LCF) and the high circumference fatigue state (HCF). The expression of the cyclic stress–strain relationship curve of the material is:
Δ ε 2 = Δ σ 2 E + ( Δ σ 2 k ) 1 n
where Δε is the local strain amplitude, Δσ is the local stress amplitude, E is the modulus of elasticity, k′ is the cyclic strength factor, and n′ is the cyclic strain hardening index. The stress–life approach proposed by Basquin [24] describes the fatigue behavior in the high circumferential fatigue state. The relationship between stress amplitude and fatigue life is as follows:
Δ σ 2 = Δ ε e E 2 = σ f ( 2 N ) b
where Δεe/2 is the elastic strain amplitude, σ′f is the fatigue strength factor, b is the fatigue strength index, and 2N is the fatigue life. The Coffin–Manson model for the low circumferential fatigue state can express the plastic strain amplitude and fatigue life as [24]:
Δ ε p 2 = ε f ( 2 N ) c
where Δεp/2 is the plastic strain amplitude, ε′f is the fatigue ductility coefficient, and c is the fatigue ductility index. By combining Equations (6) and (7), the total strain amplitude can be related to the fatigue life and is called the Coffin–Manson–Basquin equation [25,26]:
Δ ε 2 = Δ ε e 2 + Δ ε p 2 = σ f E ( 2 N ) b + ε f ( 2 N ) c
Smith et al. [27,28] discovered experimentally that the average stress has a non-negligible effect on the elastic strain amplitude and plastic strain amplitude. Based on this fact, the idea of using the product of the maximum stress σmax and the total strain amplitude as the damage parameter is proposed. An improved Smith–Watson–Topper correction formula was obtained:
σ max Δ ε 2 = σ f E ( 2 N ) 2 b + σ f ε f ( 2 N ) b + c
The relevant parameters were obtained from the low-cycle fatigue experiments of the material at room temperature by means of axial strain control on an electro-hydraulic servo fatigue tester. The equation is as follows:
σ max Δ ε 2 = 1.904761905 × ( 2 N ) 0.144 + 137.94 × ( 2 N ) 0.6011

4.2. Fatigue Life Prediction Results and Experimental Verification

The Von Mises stress distribution and the total strain amplitude obtained from the wheel finite element simulation were used for the fatigue life calculation, and the results are shown in Table 2. Based on the fact that the maximum stress on the rim occurs in the area of the bottom of the groove as the factor of residual stress is ignored, the estimated life of the rim is 158,340,000 cycles. When the residual stress is superimposed, the maximum stress on the rim occurs in the area of the bottom of the groove, with a predicted life of 459,500 cycles. It demonstrated that residual stresses largely affect the actual stress distribution and fatigue life prediction results of the rim.
According to the GB36581-2018, a dynamic bending fatigue test was performed on this model of wheel, as shown in Figure 16. In the fatigue test machine, the wheel is rotated under a constant bending moment, and the control system will automatically stop the test machine when the wheel has a fatigue crack, resulting in a decrease in stiffness and thus a decrease in resonance frequency. The results of three tests show that the average dynamic bending fatigue life of the wheel is about 384,000 cycles. The fatigue life deviation of the rim after superimposing the roll-forming residual stress reduced from 41,134.4% to 19.7%. The failure location occurs in the groove area at the bottom of the groove, as shown in Figure 17.
The results show that the life prediction results considering the residual stresses in roll forming of superimposed rims are closer to the actual experimental data, and the fatigue failure region matches with the experimental results. The residual stress after roll molding is mainly manifested as axial tensile stress, and the fatigue crack of the experimental results is presented as axial tensile. It indicates that the residual stresses largely change the initial conditions of the wheel service and have a large impact on its fatigue service life.

5. Conclusions

The distribution of residual stress field after roll forming of the wheel rim and its influence on the actual working stress and fatigue life of wheel rim were analyzed. A fatigue life prediction method for steel wheels with superimposed roll-forming residual stress and nominal stress is proposed, and the method was verified by dynamic bending fatigue tests on wheels, and the following conclusions are drawn:
  • The residual stresses in the wheel rim after roll forming can cause a significant change in the service stress state of the wheel, resulting in a significant increase in local stress, from 124 MPa to 332.9 MPa. It significantly reduces the service life of steel rims. Considering the residual stress of rim rolling has an important effect on the structure design, analysis, and life prediction.
  • The modified local stress–strain equation was applied to predict the fatigue life of a rim with superimposed roll-forming residual and nominal stresses versus a rim without considering residual stresses. The calculated fatigue life was reduced from 158,340,000 to 459,500 cycles, which shows that the residual stress generated by manufacturing is not negligible for the product.
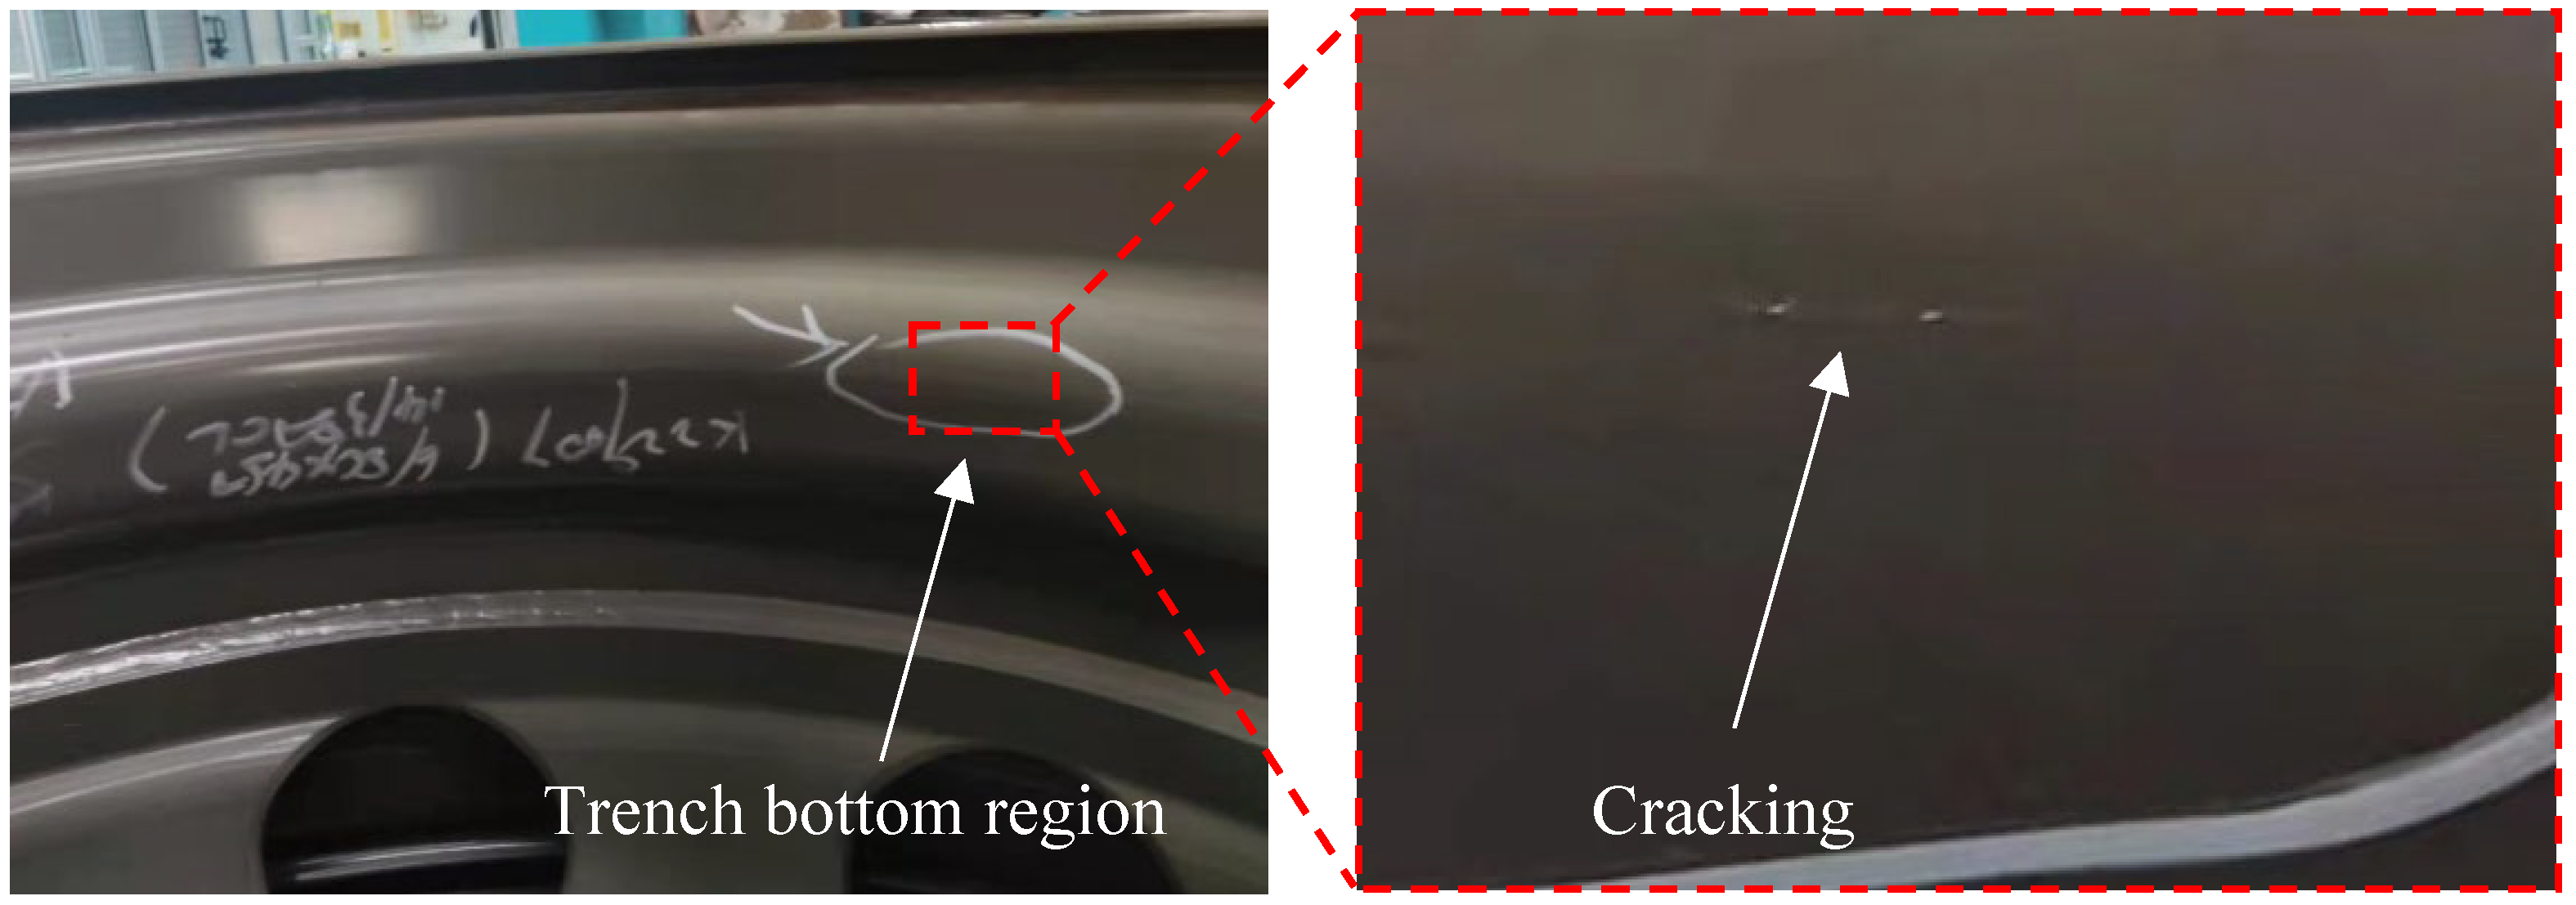
  • The wheel dynamic turning fatigue test showed fatigue cracks at the bottom of the rim groove, which was consistent with the simulation results. The average fatigue life was 384,000 cycles, and the fatigue life deviation of the rim after superimposing the roll-forming residual stress reduced from 41,134.4% to 19.7%. It shows that the life prediction method of this paper is accurate and effective.
Factors such as the assembly state of the product also affect the actual service stress of the wheel to some extent, and the stress distribution of the wheel should be controlled in future research to obtain better expected performance accurately.

Author Contributions

Conceptualization, Z.X., Q.J., Z.Z. (Zhiwen Zhao) and Z.Z. (Zhenye Zhao); methodology, Q.J. and Z.Z. (Zhiwen Zhao); software, Q.J. and Z.Z. (Zhiwen Zhao); validation, J.S., X.C. and W.J.; formal analysis, Q.J., Z.Z. (Zhiwen Zhao) and Z.X.; investigation, Q.J. and Z.Z. (Zhiwen Zhao); resources, Q.J.; writing-original draft preparation, Q.J. and Z.Z. (Zhiwen Zhao); writing-review and editing, B.S. and Z.Z. (Zhiwen Zhao); visualization, B.S. and Z.X.; project administration, Q.J. and Z.Z. (Zhiwen Zhao); funding acquisition, Z.X. and Q.J. All authors have read and agreed to the published version of the manuscript.

Funding

This research was funded by the Science and Technology Guiding Project of Fujian Province, China (Grant No. 2022H0020), the Natural Science Foundation of Fujian, China (Grant No. 2020J01693), the Natural Science Foundation of Fujian, China (Grant No. 2021J05168), the Major Science and Technology Project of Fujian, China (Grant No. 2021HZ0109), and the Fujian Marine Economic Development Fund Project (FJHJF-L-2021-9).

Data Availability Statement

Not applicable.

Conflicts of Interest

The authors declare no conflict of interest.

References

  1. Zhang, Z.P.; Ren, N.Z.; Zhang, X.F. Interpretation of GB 36581-2018 “Safety performance requirements and test methods for automotive wheels”. China Automot. 2019, 5, 47–51. [Google Scholar]
  2. Wang, X.; Zhang, X. Simulation of dynamic cornering fatigue test of a steel passenger car wheel. Int. J. Fatigue 2010, 32, 434–442. [Google Scholar] [CrossRef]
  3. Yue, F.L.; Ren, S.J.; Xu, Y.; Chen, W.J.; Zhang, S.H.; Zou, L.C.; Shao, Y.K. Finite element simulation of fatigue performance of auto rims made of hydroformed S500MC high-strength steel. Mech. Eng. Mater. 2021, 45, 7. [Google Scholar]
  4. Wan, X.; Liu, X.; Shan, Y.; Jiang, E.; Yuan, H. Numerical and experimental investigation on the effect of tire on the 13° impact test of automotive wheel. Adv. Eng. Softw. 2019, 133, 20–27. [Google Scholar] [CrossRef]
  5. Topa, M.M.; Ercan, S.; Kuralay, N.S. Fatigue life prediction of a heavy vehicle steel wheel under radial loads by using finite element analysis. Eng. Fail. Anal. 2012, 20, 67–79. [Google Scholar] [CrossRef]
  6. Wang, Y.Q.; Liu, X.H.; Chen, J.S.; Han, Y.F.; Meng, H.R.; Xiao, N. Lightweight design and multi-objective optimization of steel assembled wheels. J. Harbin Inst. Technol. 2020, 52, 170–178. [Google Scholar]
  7. Karandikar, H.M.; Fuchs, W. Fatigue life prediction for wheels by simulation of the rotating bending test. SAE Trans. 1990, 180–190. [Google Scholar]
  8. Wang, L.M.; Chen, Y.F.; Wang, C.Z. Simulation and test on aluminum alloy wheel rotary fatigue life. J. Nanjing U. Sci. Technol. 2009, 33, 571–575. [Google Scholar]
  9. Wang, L.; Chen, Y.; Wang, C.; Wang, Q. Fatigue Life Analysis of Aluminum Wheels by Simulation of Rotary Fatigue Test. Stroj. Vestn.-J. Mech. Eng. 2011, 57, 31–39. [Google Scholar] [CrossRef] [Green Version]
  10. Kocabicak, U.; Firat, M. Numerical analysis of wheel cornering fatigue tests. Eng. Fail. Anal. 2001, 8, 339–354. [Google Scholar] [CrossRef]
  11. Zheng, Z.G.; Sun, T.; Xu, X.Y.; Pan, S.Q.; Yuan, S. Numerical simulation of steel wheel dynamic cornering fatigue test. Eng. Fail. Anal. 2014, 39, 124–134. [Google Scholar] [CrossRef]
  12. Duan, Y.-C.; Zhang, F.-F.; Yao, D.; Hu, J.-H.; Dong, R.; Zhao, X.; Guan, Y.-P. Multiscale fatigue-prediction method to assess life of A356-T6 alloy wheel under biaxial loads. Eng. Fail. Anal. 2021, 130, 105752. [Google Scholar] [CrossRef]
  13. Wan, X.; Shan, Y.; Liu, X.; Wang, H.; Wang, J. Simulation of biaxial wheel test and fatigue life estimation considering the influence of tire and wheel camber. Adv. Eng. Softw. 2016, 92, 57–64. [Google Scholar] [CrossRef]
  14. Xiao, G.; Chen, B.; Li, S.; Zhuo, X. Fatigue life analysis of aero-engine blades for abrasive belt grinding considering residual stress. Eng. Fail. Anal. 2021, 131, 105846. [Google Scholar] [CrossRef]
  15. Meng, J.; Zhu, P.; Liu, Z.; Ji, Q. Integration of multi-step stamping effects in the bending fatigue analysis of a steel wheel. Fatigue Fract. Eng. Mater. Struct. 2013, 36, 795–808. [Google Scholar] [CrossRef]
  16. Das, B.; Paul, S.K.; Singh, A.; Arora, K.S.; Shome, M. The effect of thickness variation and pre-strain on the cornering fatigue life prediction of a DP600 steel wheel disc. Int. J. Fatigue 2020, 139, 105799. [Google Scholar] [CrossRef]
  17. Shang, D.; Liu, X.; Shan, Y.; Jiang, E. Research on the stamping residual stress of steel wheel disc and its effect on the fatigue life of wheel. Int. J. Fatigue 2016, 93, 173–183. [Google Scholar] [CrossRef]
  18. Zheng, Z.; Yuan, S.; Sun, T.; Pan, S. Fractographic study of fatigue cracks in a steel car wheel. Eng. Fail. Anal. 2014, 47, 199–207. [Google Scholar] [CrossRef]
  19. Wang, M.Q.; Sun, X.; Shen, L. A finite element-based fatigue analysis method for truck wheels. Mod. Manuf. Eng. 2017, 11, 88–92. [Google Scholar]
  20. Mazzoni, A.; Solazzi, L. Experimental field test on a multipiece steel wheel and influence of the material properties on its fa-tigue life evaluation. Eng. Fail. Anal. 2022, 135, 106106. [Google Scholar] [CrossRef]
  21. Zhang, Y. Analysis and Research on the Forming Process of Steel Wheel Rim Rolling and Spoke Strong Spinning; Huaqiao University: Quanzhou, China, 2014. [Google Scholar]
  22. Martins, J.A.; Cardoso, L.P.; Fraymann, J.A.; Button, S.T. Analyses of residual stresses on stamped valves by X-ray diffraction and finite elements method. J. Mater. Process. Technol. 2006, 179, 30–35. [Google Scholar] [CrossRef] [Green Version]
  23. Pope, C.G. X-ray diffraction and the Bragg equation. J. Chem. Educ. 1997, 74, 129. [Google Scholar] [CrossRef]
  24. Suresh, S. Fatigue of Materials, 2nd ed.; Cambridge University Press: Cambridge, MA, USA, 1998. [Google Scholar]
  25. Dowling, N.E.; Kampe, S.L.; Kral, M.V. Mechanical Behavior of Materials, 5th ed.; Pearson Education: Hoboken, NJ, USA, 2018. [Google Scholar]
  26. Niesłony, A.; el Dsoki, C.; Kaufmann, H.; Krug, P. New method for evaluation of the Manson–Coffin–Basquin and Ramberg–Osgood equa-tions with respect to compatibility. Int. J. Fatigue 2008, 30, 1967–1977. [Google Scholar] [CrossRef]
  27. Kn, K.N.S.; Watson, P.; Th, T.H.T. Stress-strain function for the fatigue of metals. J. Mater 1970, 5, 767–778. [Google Scholar]
  28. Curiel, F.F.; Ambriz, R.R.; García, M.A.; Ramríez, M.C.; García, S. Smith Watson and Topper Model in the Determination of the Fatigue Life of an Automotive Steel. In International Conference on New Trends in Fatigue and Fracture, Proceedings of the 17th International Conference on New Trends in Fatigue and Fracture, Cancun, Mexico, 25–27 October 2017; Springer International Publishing: New York, NY, USA, 2018. [Google Scholar]
Figure 1. Roll-forming model.
Machines 10 00924 g001
Figure 2. 380CL real stress–plastic strain relationship.
Machines 10 00924 g002
Figure 3. Residual stress distribution after the first rolling.
Machines 10 00924 g003
Figure 4. Residual stress distribution after the second rolling.
Machines 10 00924 g004
Figure 5. Residual stress distribution after the third rolling.
Machines 10 00924 g005
Figure 6. X-ray diffractometers.
Machines 10 00924 g006
Figure 7. Residual stress detection.
Machines 10 00924 g007
Figure 8. Comparison of experimental and simulated data.
Machines 10 00924 g008
Figure 9. Schematic diagram of dynamic bending fatigue test.
Machines 10 00924 g009
Figure 10. Finite element model of steel wheel.
Machines 10 00924 g010
Figure 11. Load decomposition diagram.
Machines 10 00924 g011
Figure 12. Stress results at hazard points.
Machines 10 00924 g012
Figure 13. Nominal stress history at point A at the bottom of the rim groove.
Machines 10 00924 g013
Figure 14. Stress distribution after superposition.
Machines 10 00924 g014
Figure 15. Stress history at hazard points before and after stress superposition.
Machines 10 00924 g015
Figure 16. Dynamic bending fatigue test.
Machines 10 00924 g016
Figure 17. Rim fatigue failure location.
Machines 10 00924 g017
Table 1. Residual stress testing results.
Measure PointsPoint 1Point 2Point 3Point 4Point 5
y-axis (MPa)−53 ± 18.7−38 ± 5.2731 ± 3.4173 ± 15.4202 ± 20.6
x-axis (MPa)−102 ± 21.5−67 ± 16.4−8 ± 23.1−38 ± 12.2−82 ± 8.1
Table 2. Fatigue life calculation results.
Failure LocationFatigue Life (Cycles)Deviation (%)
Residual stress-free life simulationBottom area of the trench158,340,00041,134.4
With residual stress–life simulationBottom area of the trench459,50019.7
Fatigue testBottom area of the trench384,000-
Publisher’s Note: MDPI stays neutral with regard to jurisdictional claims in published maps and institutional affiliations.

