Article

Thermal Behavior and Phase Transition of Uric Acid and Its Dihydrate Form, the Common Biominerals Uricite and Tinnunculite

by
Alina R. Izatulina
1,*,
Vladislav V. Gurzhiy
1,
Maria G. Krzhizhanovskaya
1,
Nikita V. Chukanov
2 and
Taras L. Panikorovskii
3
1
Crystallography Department, Institute of Earth Sciences, St. Petersburg State University, University emb. 7/9, 199034 St. Petersburg, Russia
2
Institute of Problems of Chemical Physics, Russian Academy of Sciences, Chernogolovka, 142432 Moscow, Russia
3
Laboratory of Nature-Inspired Technologies and Environmental Safety of the Arctic, Kola Science Centre, Russian Academy of Sciences, Fersmana str. 14, 184209 Apatity, Russia
*
Author to whom correspondence should be addressed.
Minerals 2019, 9(6), 373; https://doi.org/10.3390/min9060373
Submission received: 24 May 2019 / Revised: 19 June 2019 / Accepted: 21 June 2019 / Published: 22 June 2019

Abstract

:
Single crystals and powder samples of uric acid and uric acid dihydrate, known as uricite and tinnunculite biominerals, were extracted from renal stones and studied using single-crystal and powder X-ray diffraction (SC and PXRD) at various temperatures, as well as IR spectroscopy. The results of high-temperature PXRD experiments revealed that the structure of uricite is stable up to 380 °C, and then it loses crystallinity. The crystal structure of tinnunculite is relatively stable up to 40 °C, whereas above this temperature, rapid release of H2O molecules occurs followed by the direct transition to uricite phase without intermediate hydration states. SCXRD studies and IR spectroscopy data confirmed the similarity of uricite and tinnunculite crystal structures. SCXRD at low temperatures allowed us to determine the dynamics of the unit cells induced by temperature variations. The thermal behavior of uricite and tinnunculite is essentially anisotropic; the structures not only expand, but also contract with temperature increase. The maximal expansion occurs along the unit cell parameter of 7 Å (b in uricite and a in tinnunculite) as a result of the shifts of chains of H-bonded uric acid molecules and relaxation of the π-stacking forces, the weakest intermolecular interactions in these structures. The strongest contraction in the structure of uricite occurs perpendicular to the (101) plane, which is due to the orthogonalization of the monoclinic angle. The structure of tinnunculite also contracts along the [010] direction, which is mostly due to the stretching mechanism of the uric acid chains. These phase transitions that occur within the range of physiological temperatures emphasize the particular importance of the structural studies within the urate system, due to their importance in terms of human health. The removal of supersaturation in uric acid in urine at the initial stages of stone formation can occur due to the formation of metastable uric acid dihydrate in accordance with the Ostwald rule, which would serve as a nucleus for the subsequent growth of the stone at further formation stages; afterward, it irreversibly dehydrates into anhydrous uric acid.

1. Introduction

The lithosphere contains about 99.99% of all carbon on Earth [1], about three-quarters of which is inorganic (carbonate minerals). The rest is organic carbon, for example kerogen [2]. Only a small portion falls into probably the most unique and remarkable group of organic minerals, which nowadays includes more than 60 species. All of them are quite rare and their amounts are negligible compared to other forms of carbon in the Earth’s crust. The majority of organic mineral species are salts of organic acids, among which oxalates are the most widely represented [3,4]. A number of organic minerals are also found in pathogenic biomineral formations within the human body, such as urinary system stones and aggregates in bone marrow and myocardium. These include, for example, hydrated calcium oxalates whewellite, weddellite, and caoxite [5], and uric acid (uricite) and uric acid dihydrate (tinnunculite) [6]. Pathogenic formations of uric acid occur in the case of purine exchange and uric acid metabolism violations [7].
Uricite, an anhydrous form of uric acid, C5H4N4O3, was first described by Klaproth in 1807 [8] in samples of Peruvian guanos, and later was identified in a bird-guano deposit in Western Australia [9]. Tinnunculite, uric acid dihydrate, C5H4N4O3·2H2O, was originally found by Chesnokov at the top of a burning dump of a coal mine in the town of Kopeisk (Southern Ural, Russia), but it was not approved as a mineral species because of the technogenic origin of the deposit [10]. Recently, Pekov et al. found tinnunculite samples of natural origin within the guano microdeposits on cliffs of alkaline rocks in the Khibiny and Lovozero alkaline complexes [11].
Uricite and tinnunculite were found in altered bird excrement. Uricite is more common in nature and often occurs in association with whewellite, weddellite, and brushite, which are also known as pathogenic biominerals [9,12,13]. Uric acid is regularly found in association with uric acid dihydrate in uroliths, as well as with calcium oxalate monohydrate (whewellite) and calcium oxalate dihydrate (weddellite). Such observations make it possible to assume some crystal genetic parallels between the formation of the natural and pathogenic phases.
First attempts to determine crystallographic data for uric acid (UA) and uric acid dihydrate (UAD) were made by Ringertz [14]. Afterward, the structures of UA [15] and UAD were determined with higher accuracy and precision [16]. Later, the similarity of uric acid and uric acid dihydrate structures was discussed, which led to the possibility of their epitaxial interaction [16,17]. Differences in the crystal structure associated with the presence of additional water molecules lead to a change in properties. For example, Liu et al. described the differences in the mechanical properties of anhydrous and hydrated uric acid [18]. The kinetics of UAD dehydration to UA was recently studied using microscopy, DSC, and TGA techniques [19].
Herein, we report on the thermal behavior of the UA and UAD crystal structures and phase transition mechanisms that were determined using in situ powder and single crystal XRD techniques.

2. Materials and Methods
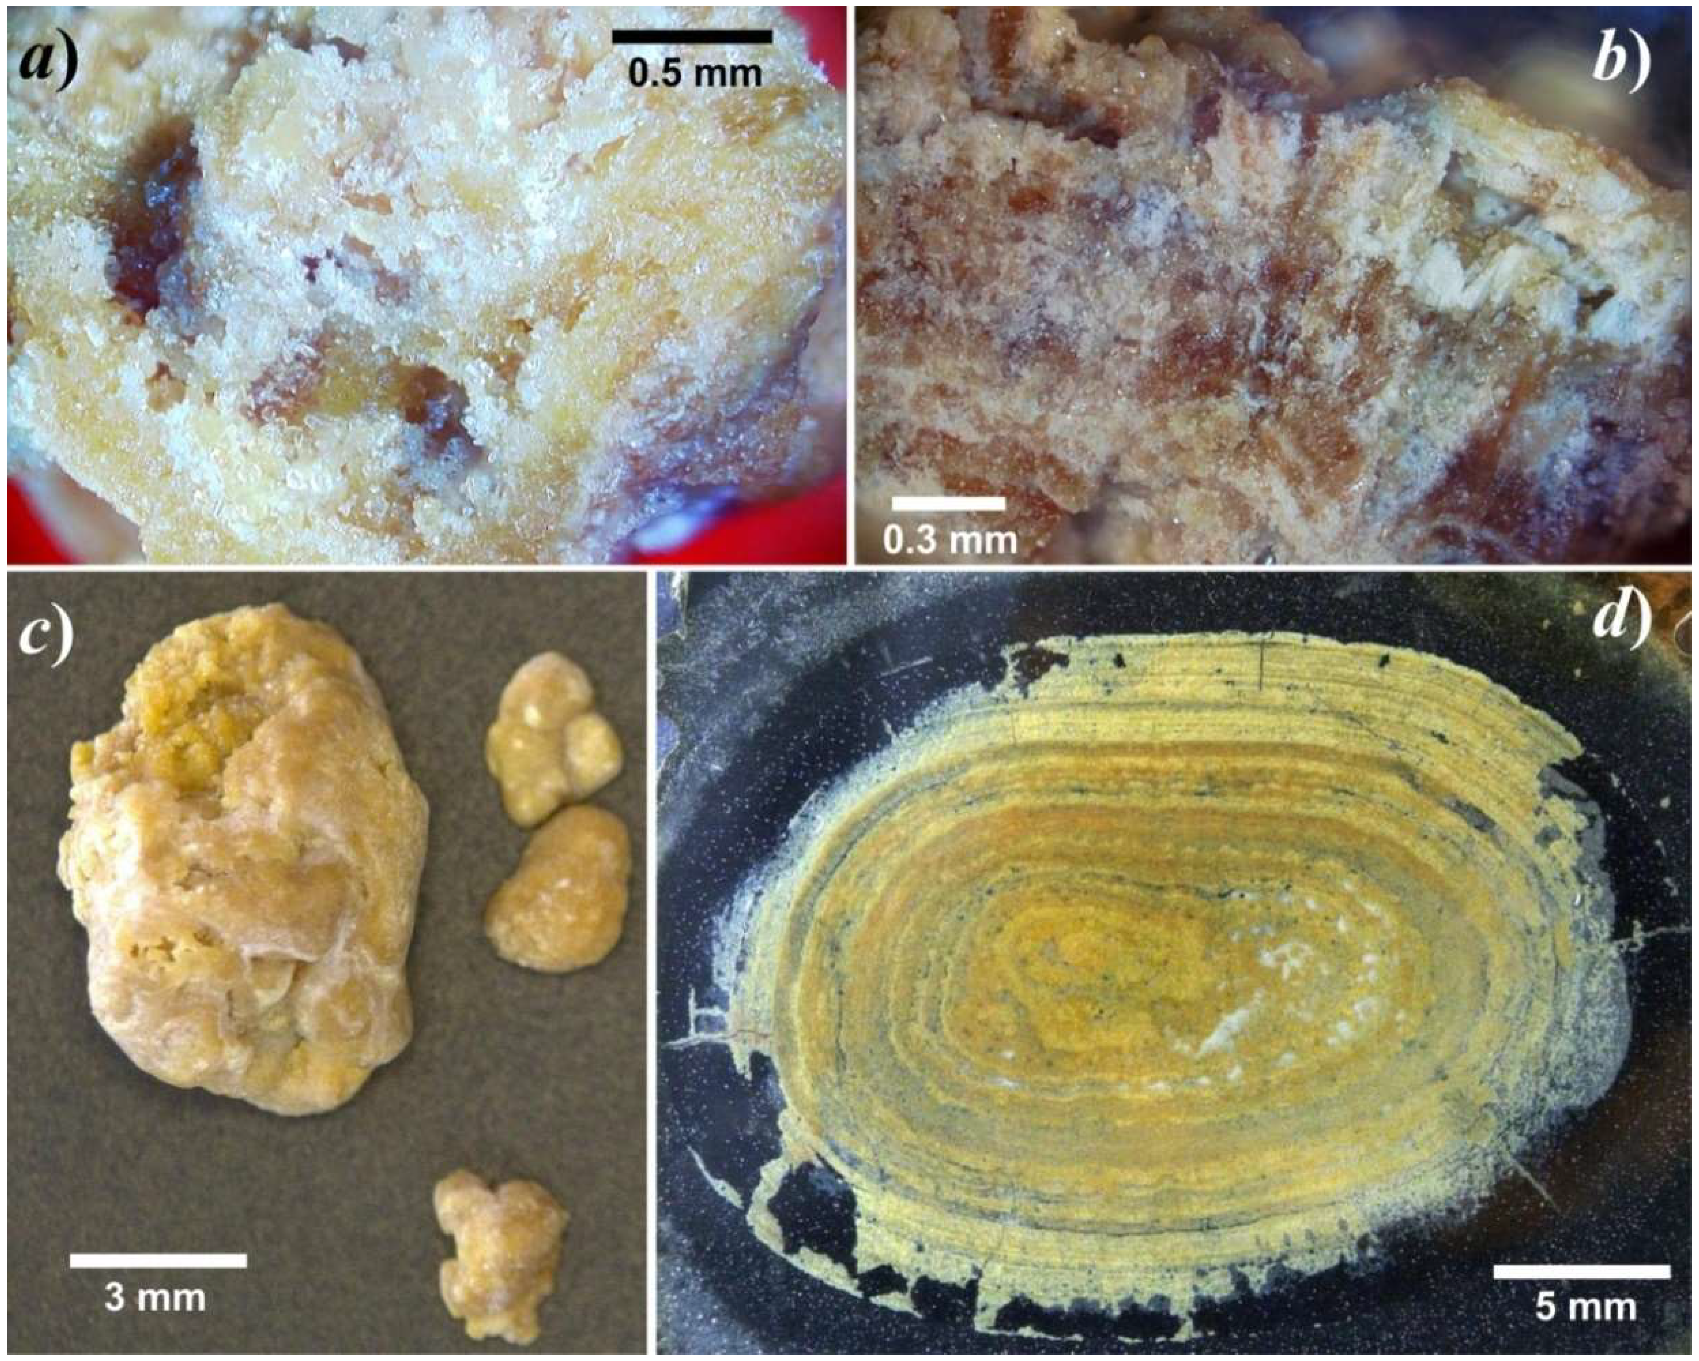
2.1. Occurrence

Single crystals and powder samples of UA and UAD (Figure 1) were extracted from the renal stones of our collection, which includes about 2000 samples removed from residents of St. Petersburg (Russian Federation) of both sexes and aged from 3 to 81 years. About 15% of renal stones within the collection consist of uric acid and its derivatives: 320 stones contain anhydrous uric acid, 50 stones contain uric acid dihydrate, and 10 stones contain calcium, ammonium, and sodium urates. However, we have never found uric acid monohydrate in the stones. Notably, Schubert et al. described a urolith with uric acid monohydrate [20], but most likely, this finding should be considered very rare, if not a single occurrence.

2.2. Single-Crystal X-Ray Diffraction Study

Single crystals of UA and UAD were selected under an optical microscope, encased in oil-based cryoprotectant, and mounted on glass fibers. Diffraction data were collected using a Rigaku Oxford Diffraction XtaLab SuperNova diffractometer (Rigaku Oxford Diffraction, Oxford, UK) equipped with a hybrid photon counting HyPix-3000 detector operated with monochromated microfocused CuKα radiation (λ(CuKα) = 1.54184 Å) at 50 kV and 0.8 mA. Diffraction data were collected at different temperatures without changing the crystal orientation in the range of −173 to +60 °C (Table 1) with frame widths of 0.5° in ω and φ, and exposures of 1–6 s per frame. Data were integrated and corrected for background, Lorentz, and polarization effects. An empirical absorption correction based on spherical harmonics implemented in the SCALE3 ABSPACK algorithm was applied in the CrysAlisPro program [21]. The unit-cell parameters were refined using the least-squares techniques. The structures were solved by a dual-space algorithm and refined using the SHELX programs [22,23] incorporated in the OLEX2 program package [24]. The final models included coordinates and anisotropic displacement parameters for all non-H atoms. The nitrogen-bound H atoms were placed in calculated positions and were included in the refinement in the “riding” model approximation, with Uiso(H) set to 1.2Ueq(N) and N–H fixed at 0.86 Å. The H atoms of H2O molecules were localized from difference Fourier maps and were included in the refinement with Uiso(H) set to 1.5Ueq(O) and O–H restrained to 0.95 Å. Supplementary crystallographic data were deposited in the Inorganic Cambridge Crystallographic Data Centre (CCDC) and can be obtained by quoting the depository numbers CCDC 1916030–1916042. (see Supplementary Materials).

2.3. High-Temperature Powder X-Ray Diffraction Study

Pieces of UA and UAD containing renal stones were ground with an agate mortar for in situ examination using a Rigaku Ultima IV powder X-ray diffractometer (PXRD, CoKα radiation; 40 kV/30 mA; Bragg-Brentano geometry; PSD D-Tex Ultra detector, Rigaku, Tokyo, Japan). A Rigaku SHT-1500 chamber was employed for experiments with UA in air within 25–440 °C; a Pt strip (20 × 12 × 2 mm3) was used as the heating element and sample holder. A Rigaku R-300 chamber using a Cu sample holder (20 × 12 × 2 mm3) was used to collect the data for UAD in air within 30–100 °C. The temperature steps varied from 5 to 20 °C depending on the temperature range. The heating rate was 2 °C/min. The collection time at each temperature step was about 30 min. The irreversibility of the observed phase transformations was verified by collecting PXRD data on cooling. Phases were identified using the ICDD PDF-2 Database (release 2016; Newtown Square, PA, USA). The unit cell parameters were refined by the Pawley method using TOPAS 4.2 software [25]. The background was modelled using a 12th order Chebyshev polynomial. The peak profiles were described using the fundamental parameters approach. The zero shift parameter was refined at every step, and it was usually increased by 0.01–0.02° 2θ because of the sample holder expansion on heating.
The main coefficients of the thermal-expansion tensor were determined using a second-order approximation of temperature dependencies for the unit cell parameters by means of the TEV program [26]. The same software was also used to determine the orientation of the principal axes of the thermal expansion tensor and for visualization purposes.

2.4. Infrared Spectroscopy

In order to obtain IR absorption spectra of UA, UAD, and a product of partial UAD dehydration, powdered samples were mixed with anhydrous KBr, pelletized, and analyzed using an ALPHA FTIR spectrometer (Bruker Optics; Billerica, MA, USA) at a resolution of 4 cm−1. We collected 16 scans. The IR spectrum of an analogous pellet of pure KBr was used as a reference.

3. Results and Discussion

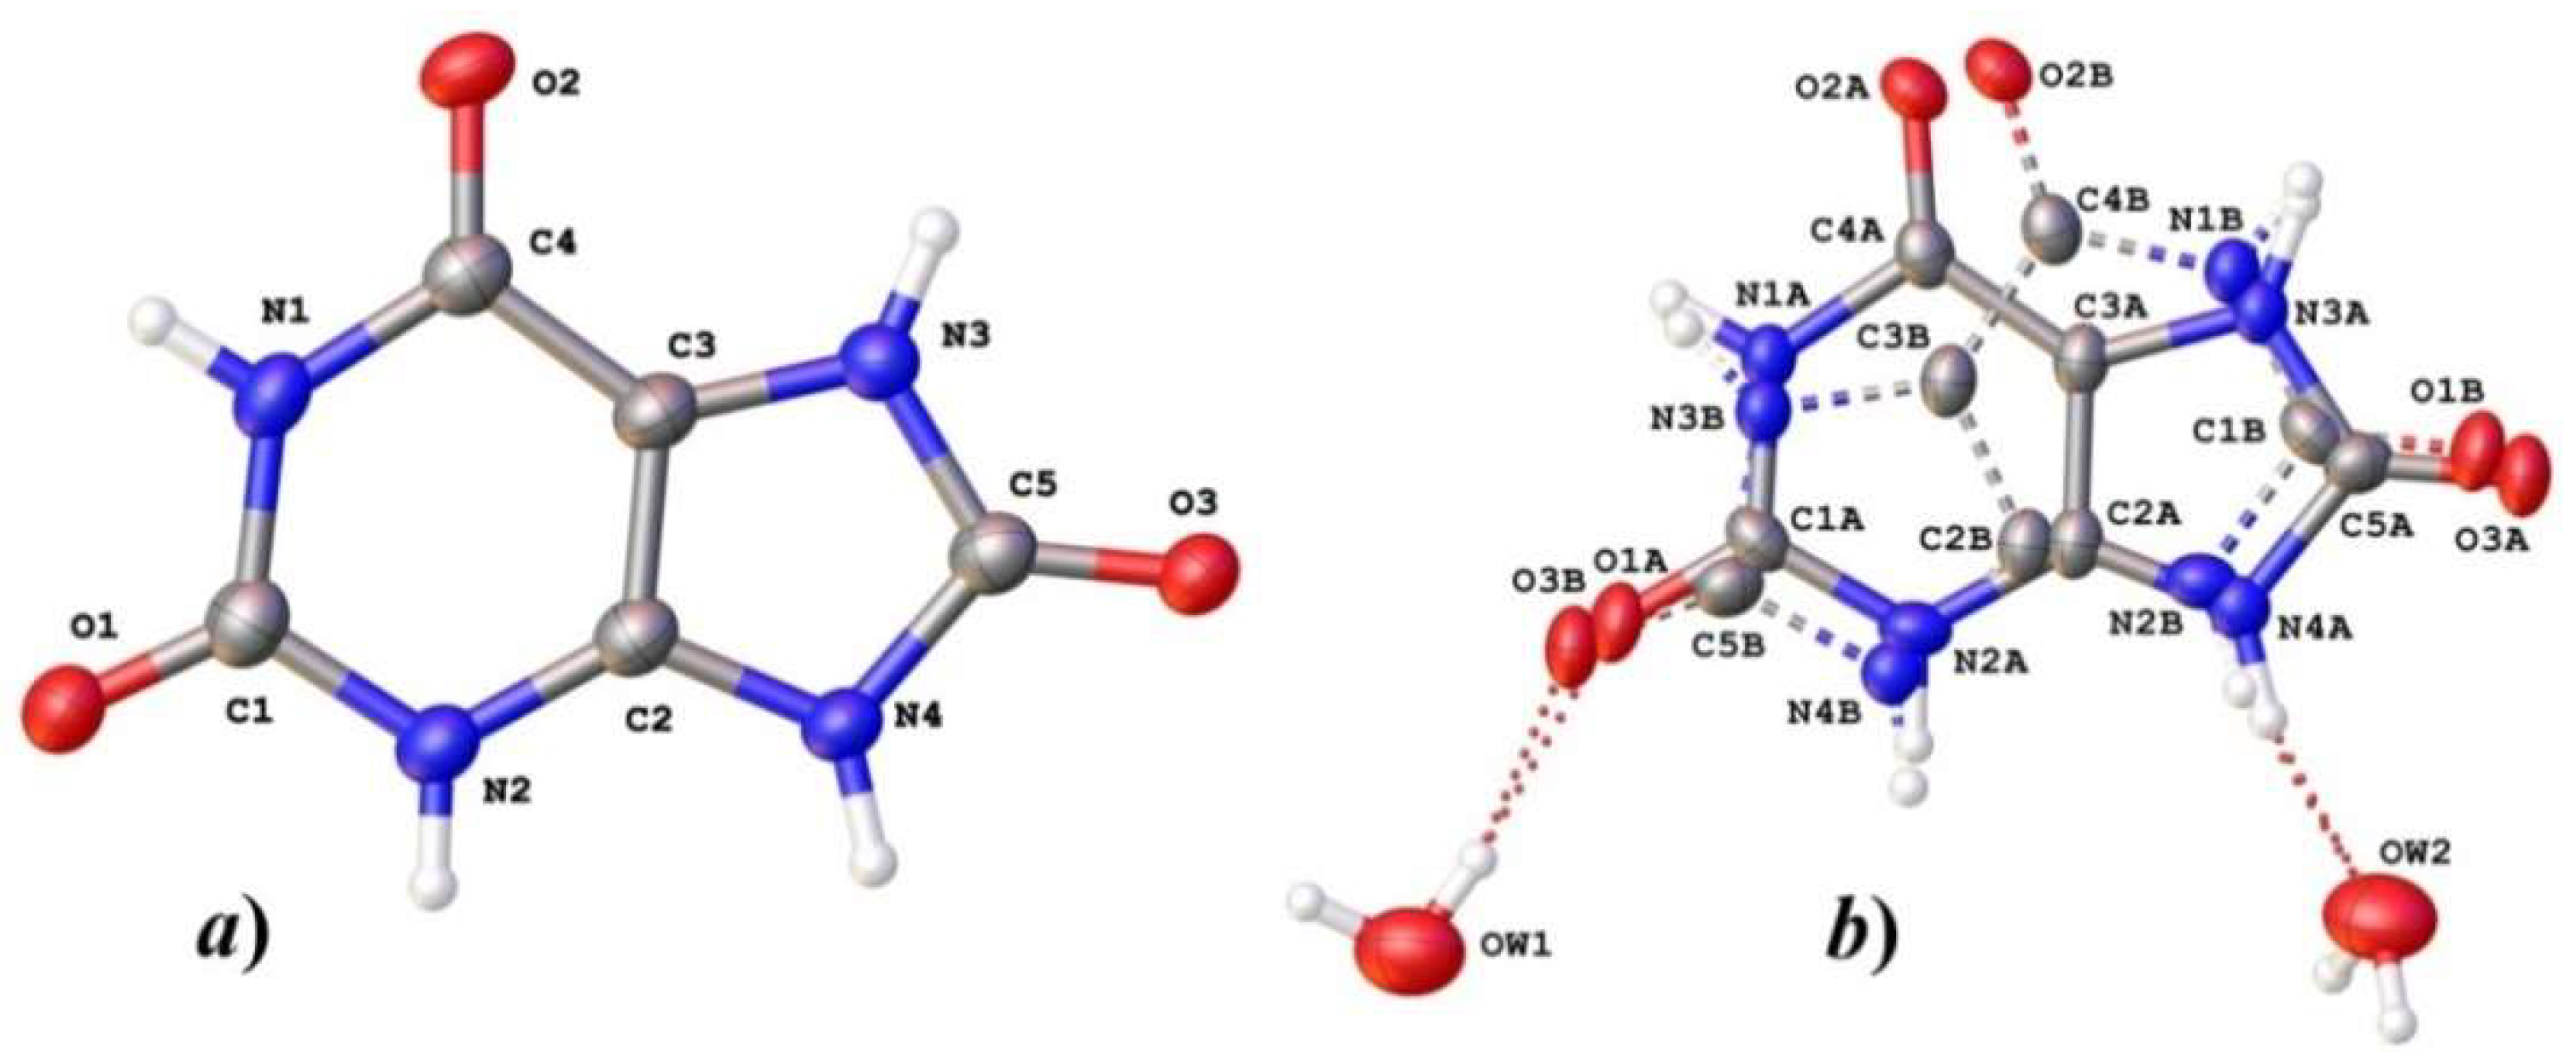
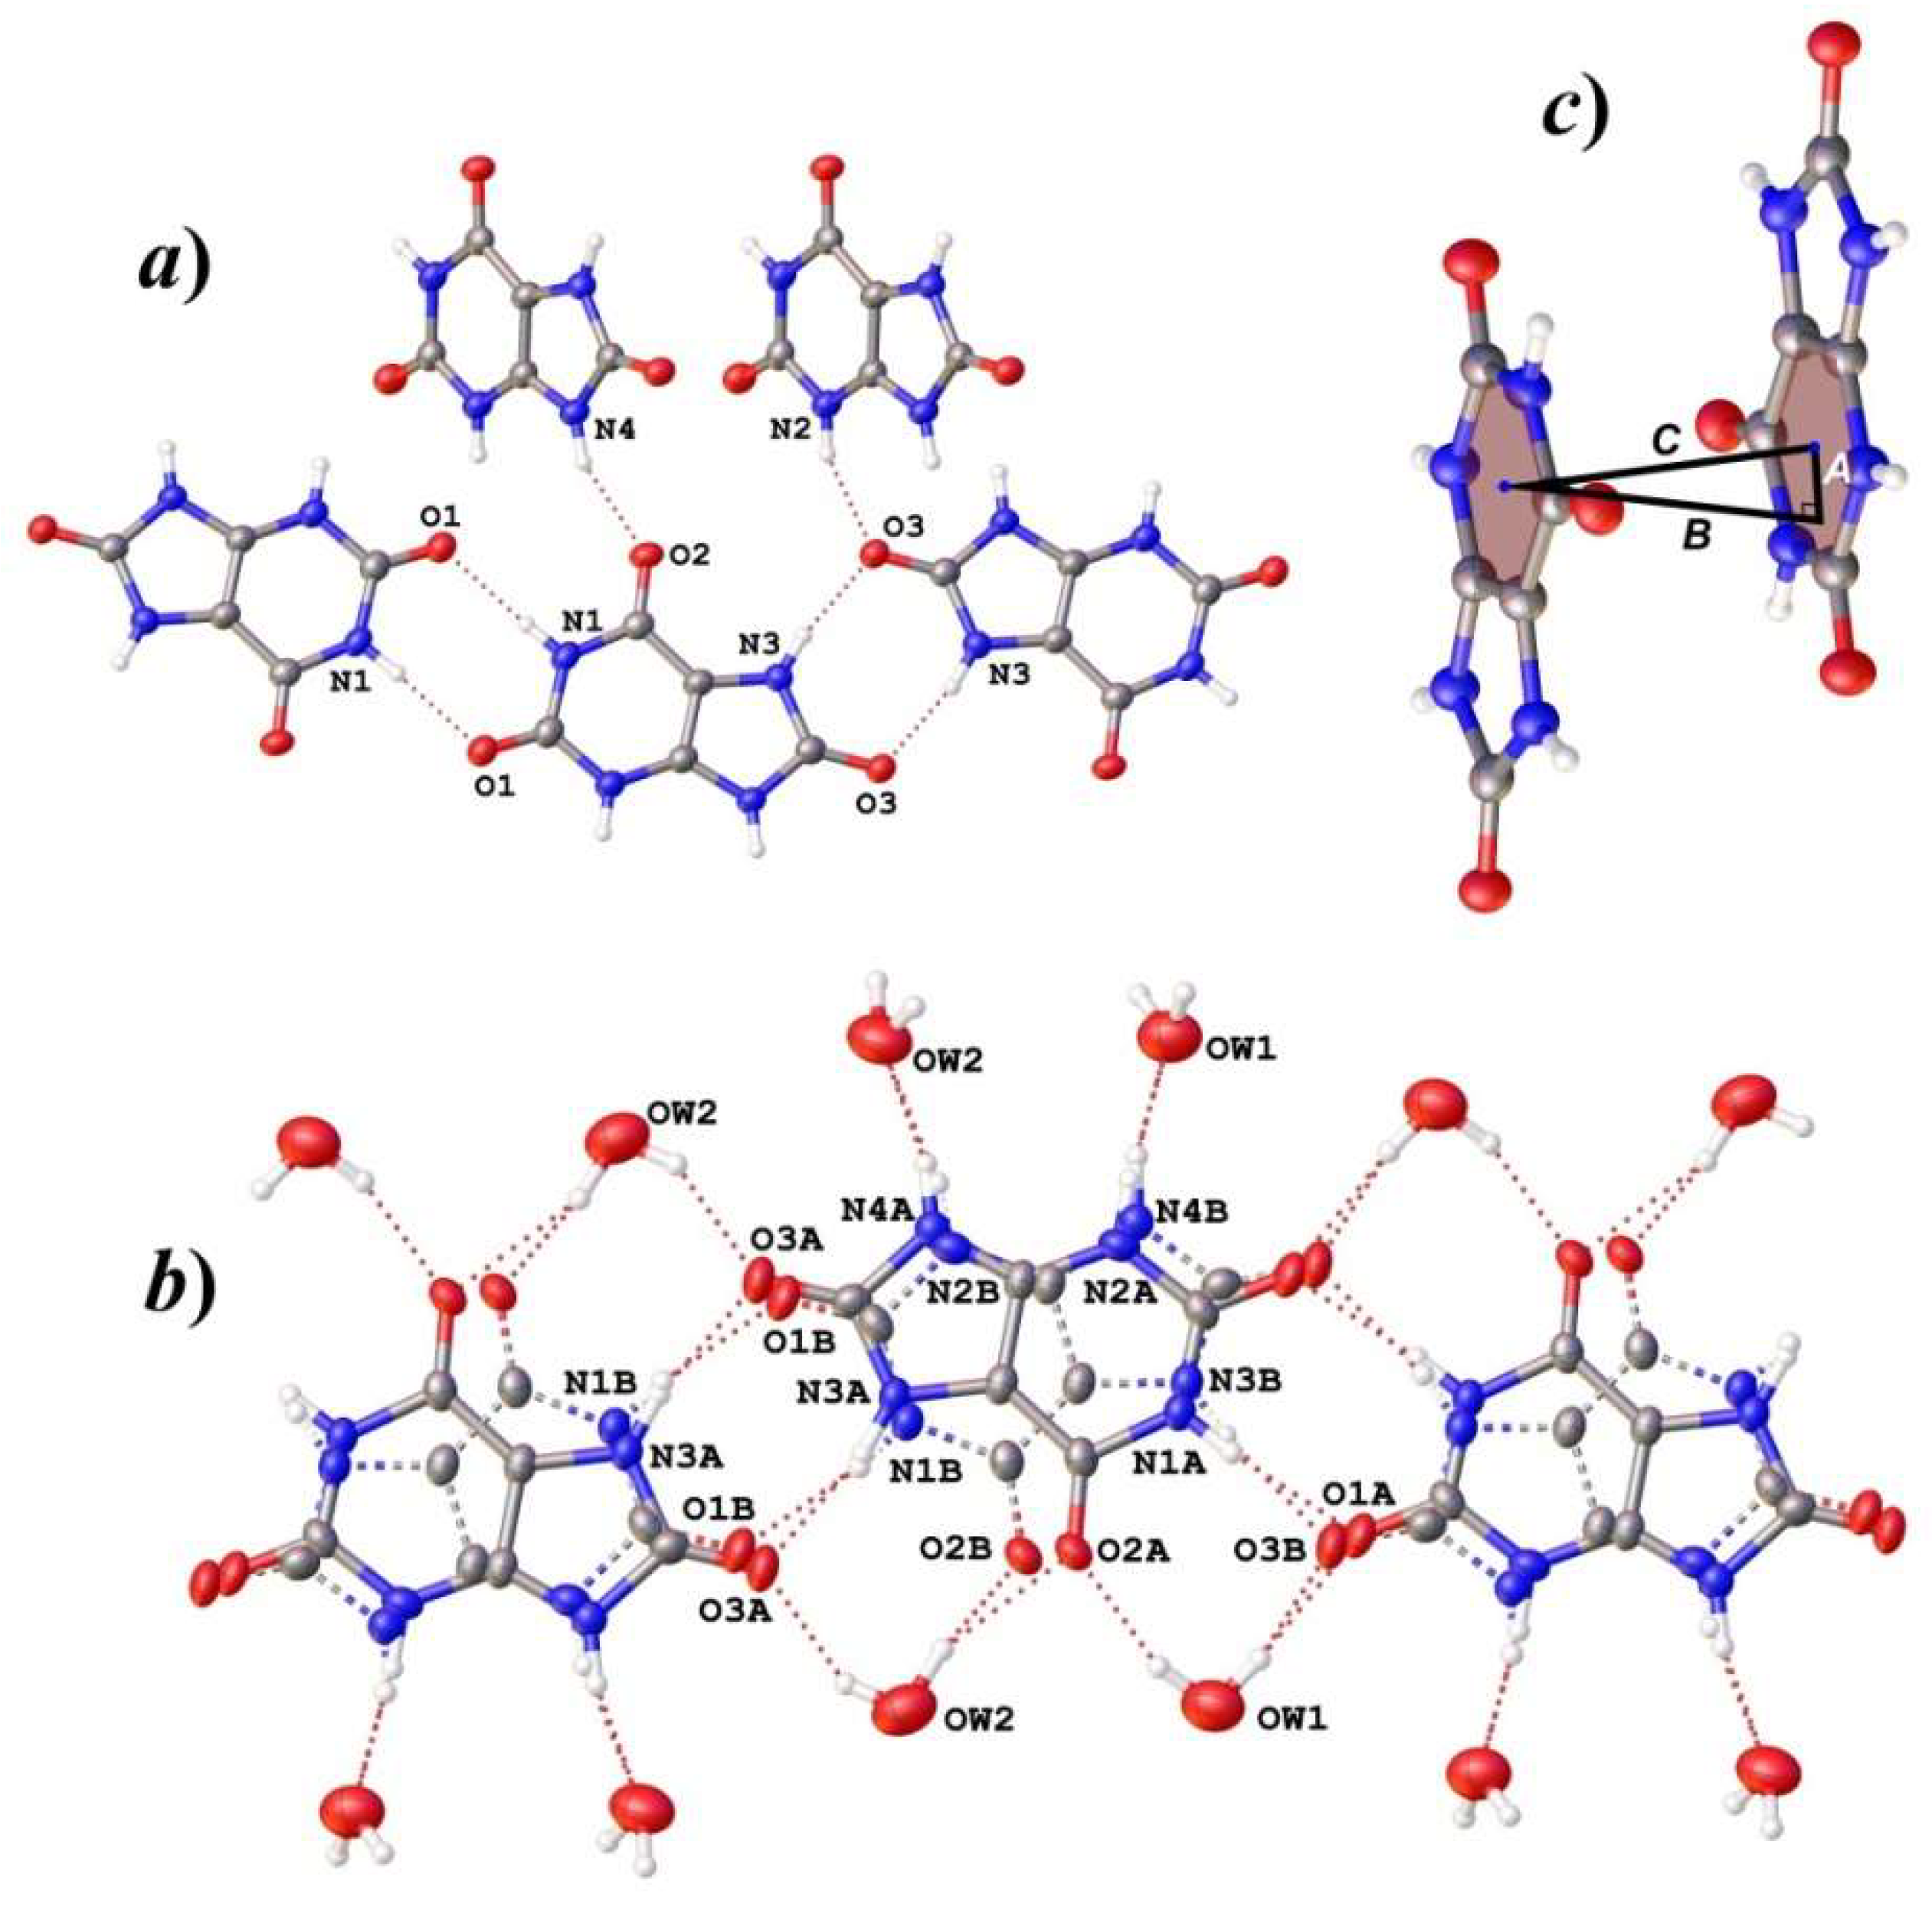
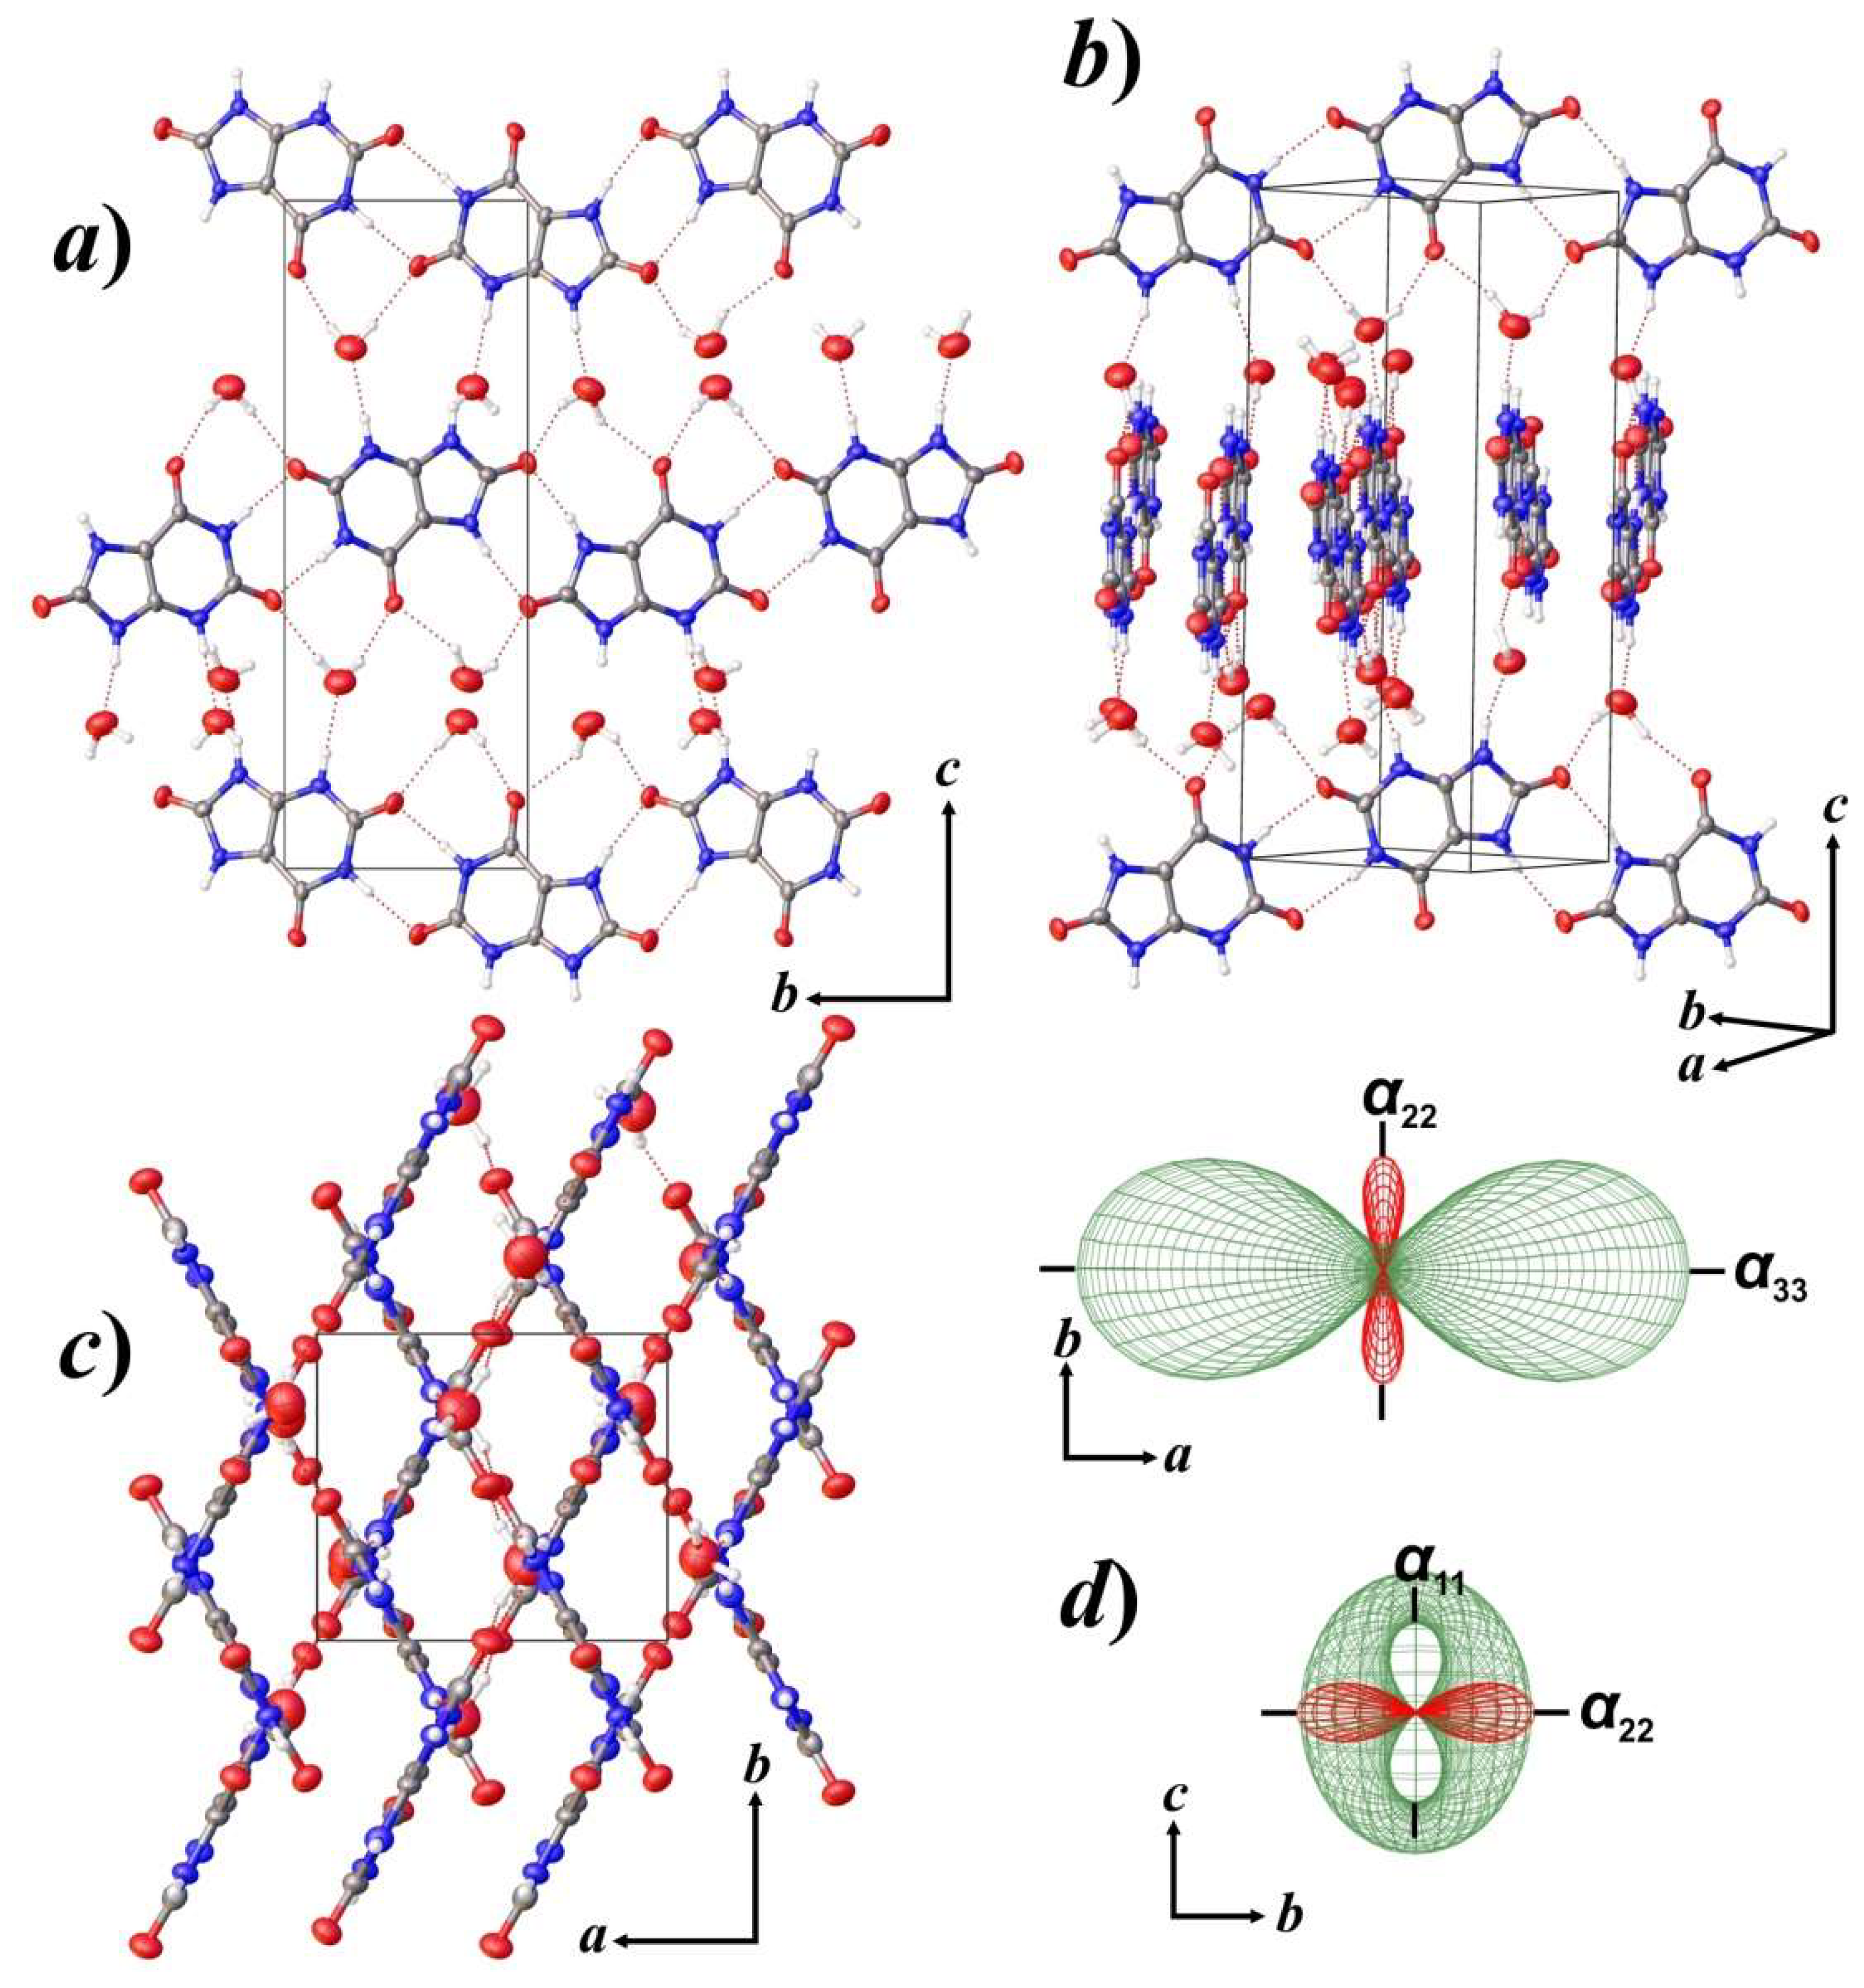
3.1. Structure Descriptions

Uric acid is a flat heterocyclic aromatic compound that consists of six-membered pyrimidine and five-membered imidazole rings combined through a common C=C bond, thus forming a purine molecule, with each of non-shared C atoms making conjugate bonds with O atoms, and with all four N atoms being protonated (Figure 2a).
Uric acid molecules are arranged in flat chains parallel the (210) plane and connected via H-bonding system N1···O1 and N3···O3 (Figure 3a). These chains are linked with the neighboring ones via parallel-displaced π-stacking forces (Figure 3b, Table 2) between the pyrimidine cycles to form layers parallel to the (001) plane. Layers are connected together via another H-bonding system N2···O3 and N4···O2. There are two such layers in the unit cell of UA, in which the UA molecules and respective chains are arranged parallel to (210) and ( 2 1 ¯ 0 ) planes (Figure 4) with the twist angle between the planes of chains equal to ~60°.
The crystal structure of UAD (Figure 5) is quite similar to that of UA, which can also be observed from the similarity of a and b unit cell parameters in both structures (Table 1). Uric acid molecules are linked in the similar chains that are arranged parallel to (210) and ( 2 1 ¯ 0 ) planes, and the chains are combined into the layers via π-stacking forces. Unlike the UA structure where the neighboring layers are directly linked via an H-bonding system, layers in the structure of UAD are separated by an additional interlayer of H2O molecules (Figure 3c). Such intrusion leads to the linkage of neighboring uric acid layers only through the H-bonding with H2O molecules and results in an increase of c unit cell parameter by ~4.4 compared to UA (Table 1). Figure 4b shows that uric acid molecules in the structure of UA are inclined to the c axis at ~15°. The presence of H2O molecules in the structure of UAD leads to the alteration of the slope to almost parallel to the c-axis (Figure 5b).
Notably, the uric acid moiety in the structure of UAD is disordered over two superimposed orientations obtained by rotation around a statistical two-fold axis passing in the plane of the molecule and along the [001] direction (Figure 2b). In the case of the reported UAD structure, the ratio of moieties having different orientations is 0.59(1):0.41(1), with a total site occupancy factor (s.o.f.) of 1.0. Such disorder appears typical for the UAD crystals but may vary significantly. The other two UAD crystals that were selected from the same renal stone had nearly the same ratios (~0.6:0.4), whereas in a previous work, a 0.83:0.17 ratio was reported [17]. However, no such disorder has been reported for UA structures. Most likely, the occurrence of interlayer H2O molecules loosens the structure, which results in the relaxation of the π-stacking system. As a result, a rather significant increase in the plane-to-plane shift and centroid-to-centroid distances is observed (Table 2). In turn, this allows uric acid molecules’ presence in two different orientations, especially in the rigid arrangement of H2O sites.

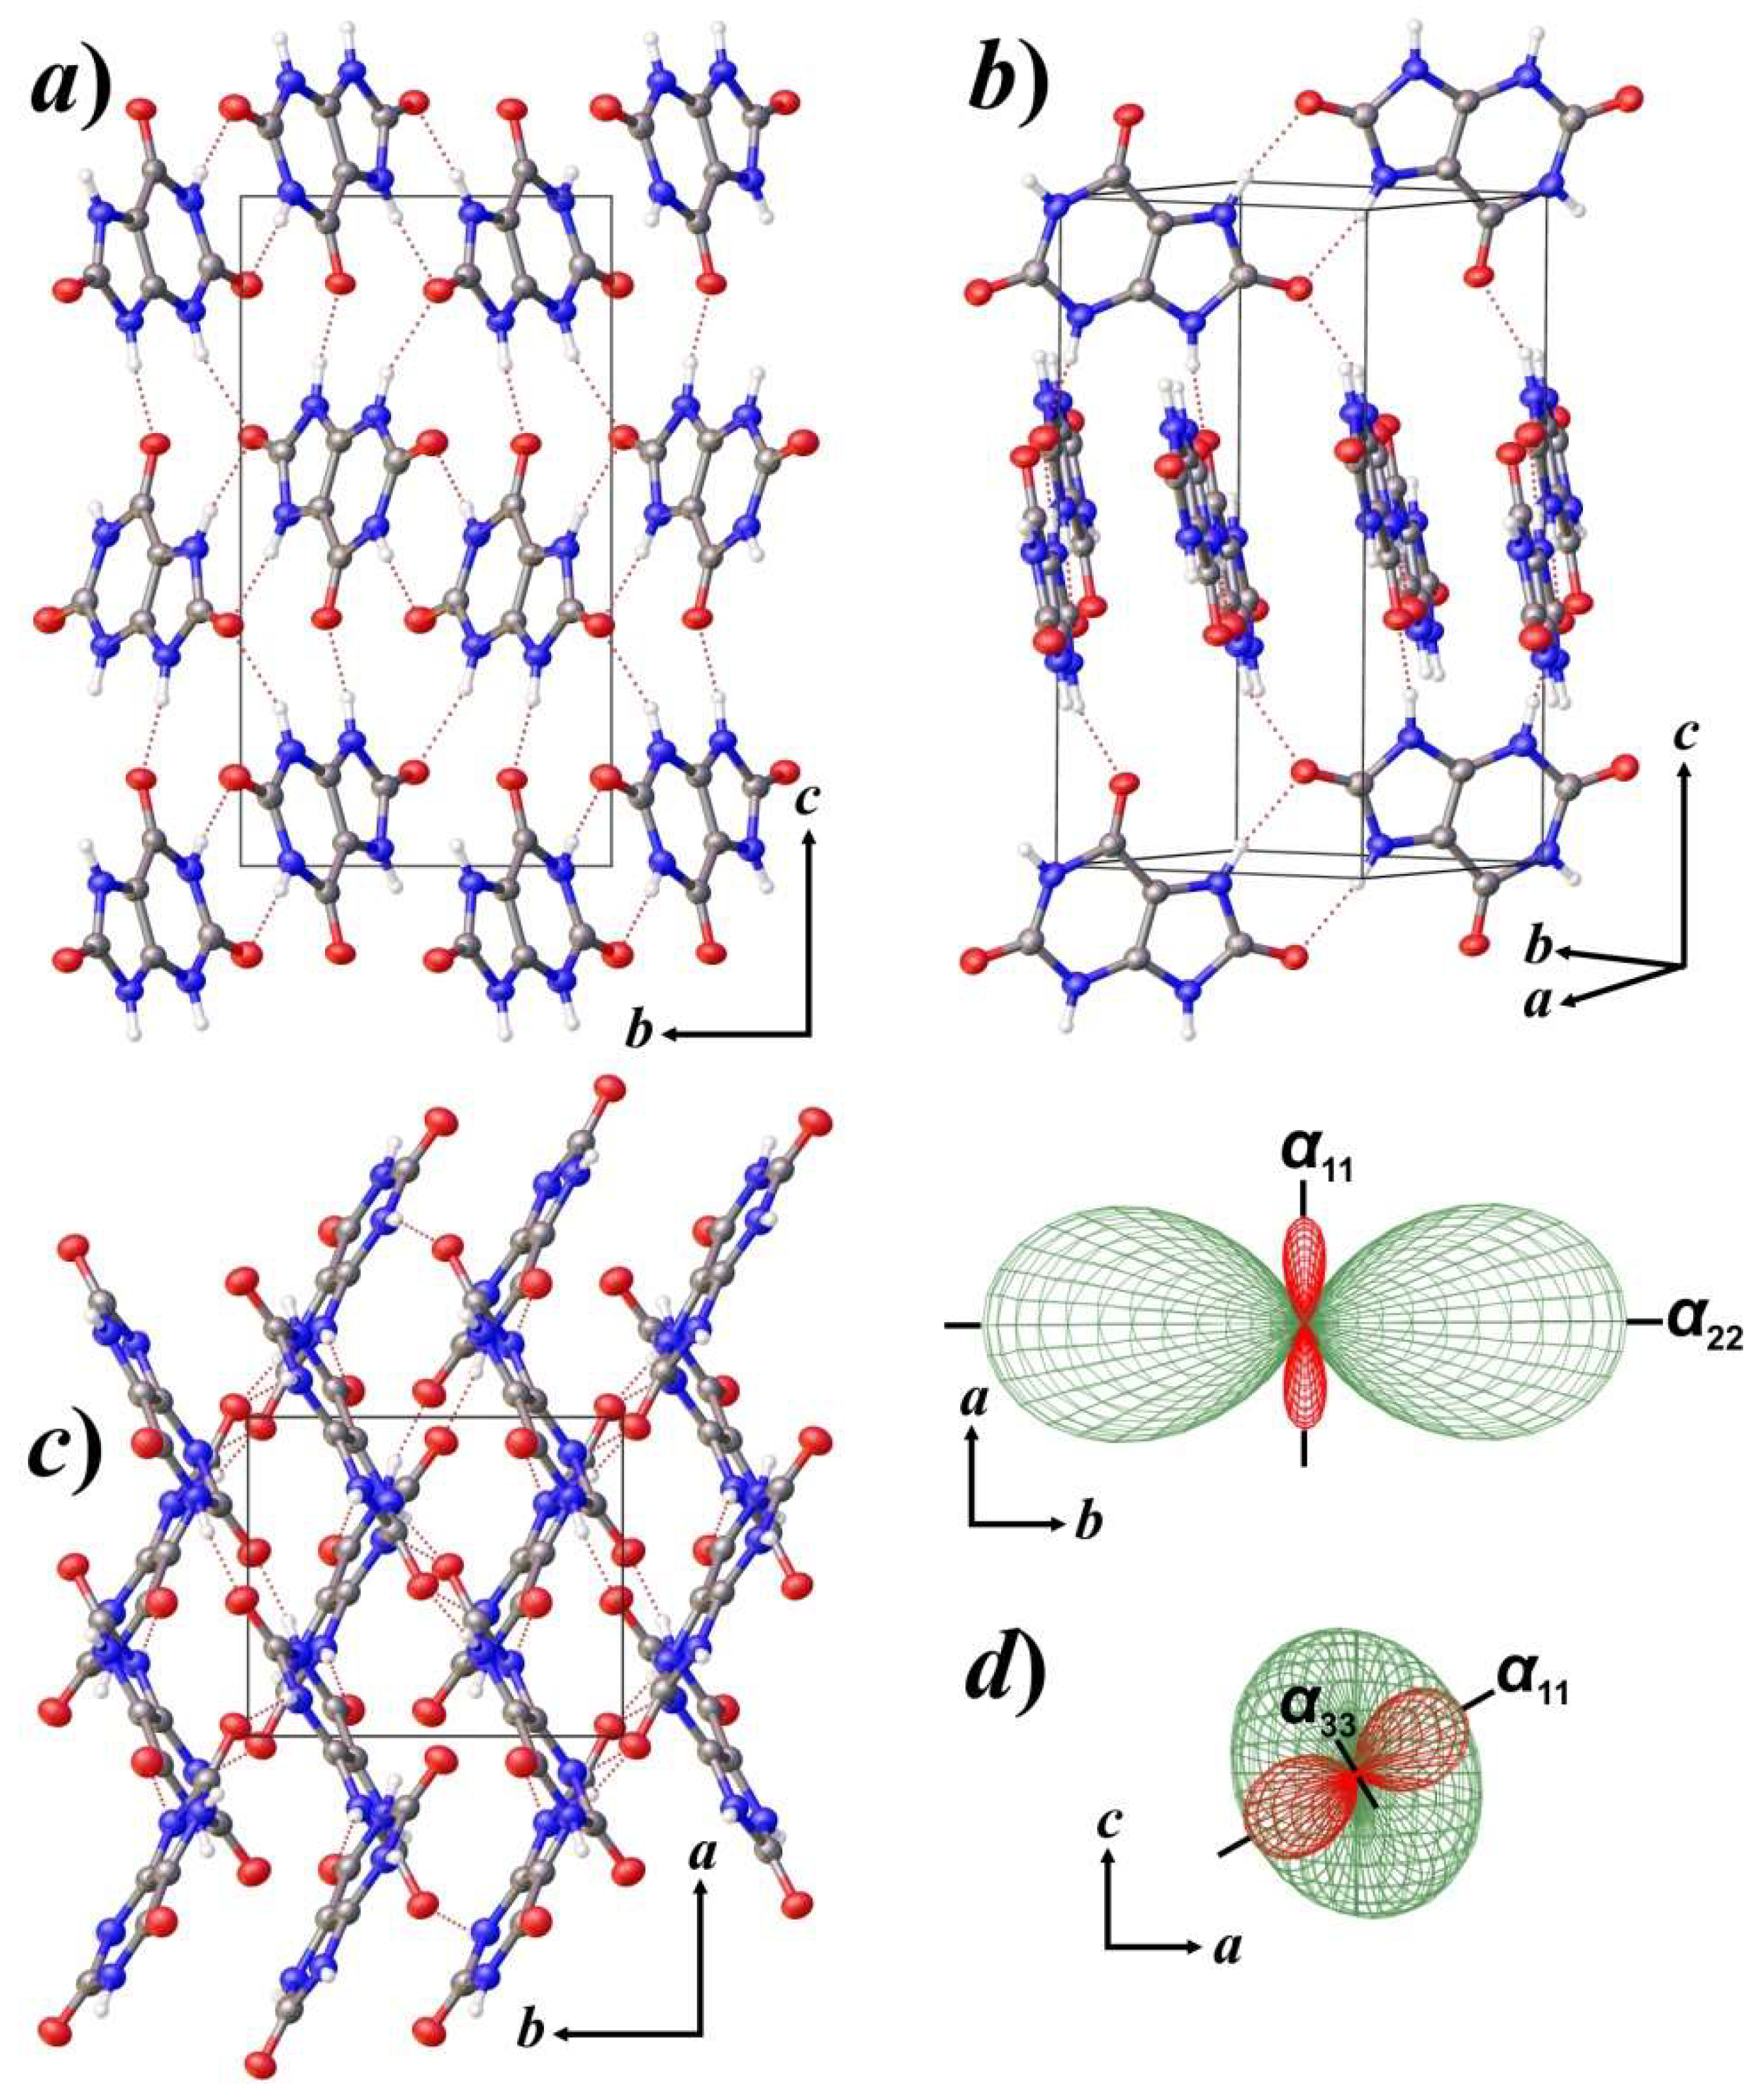
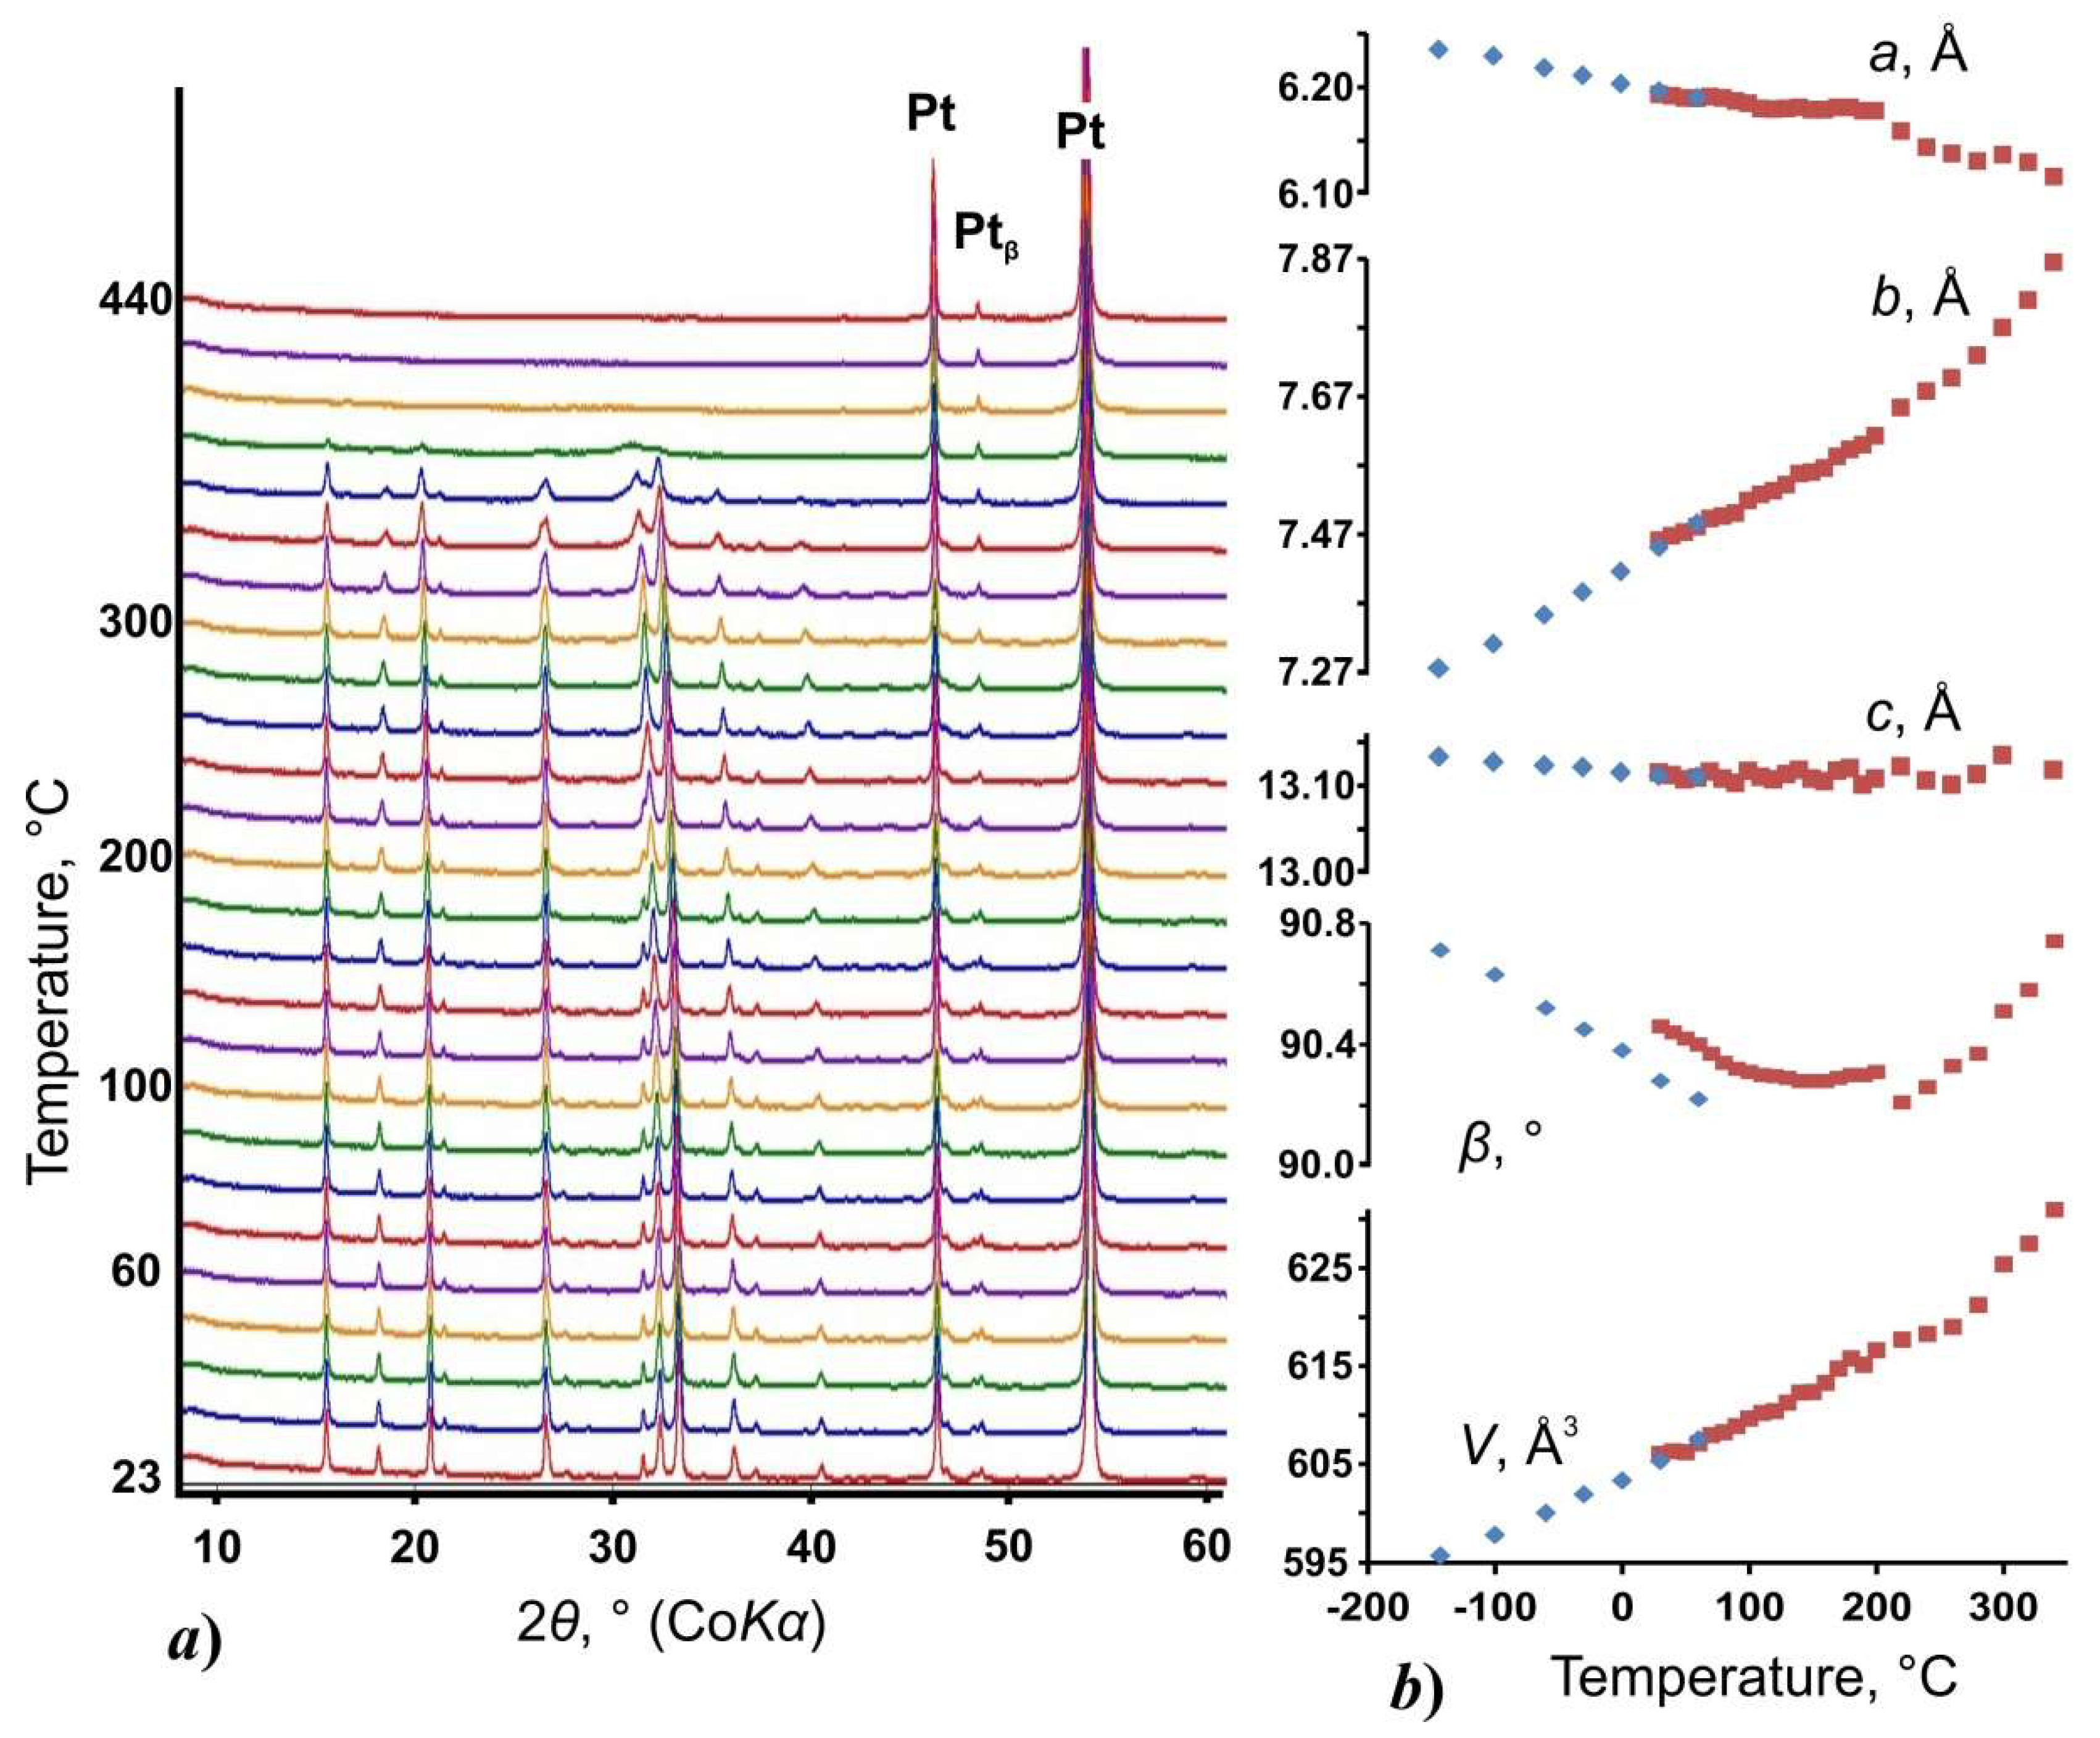
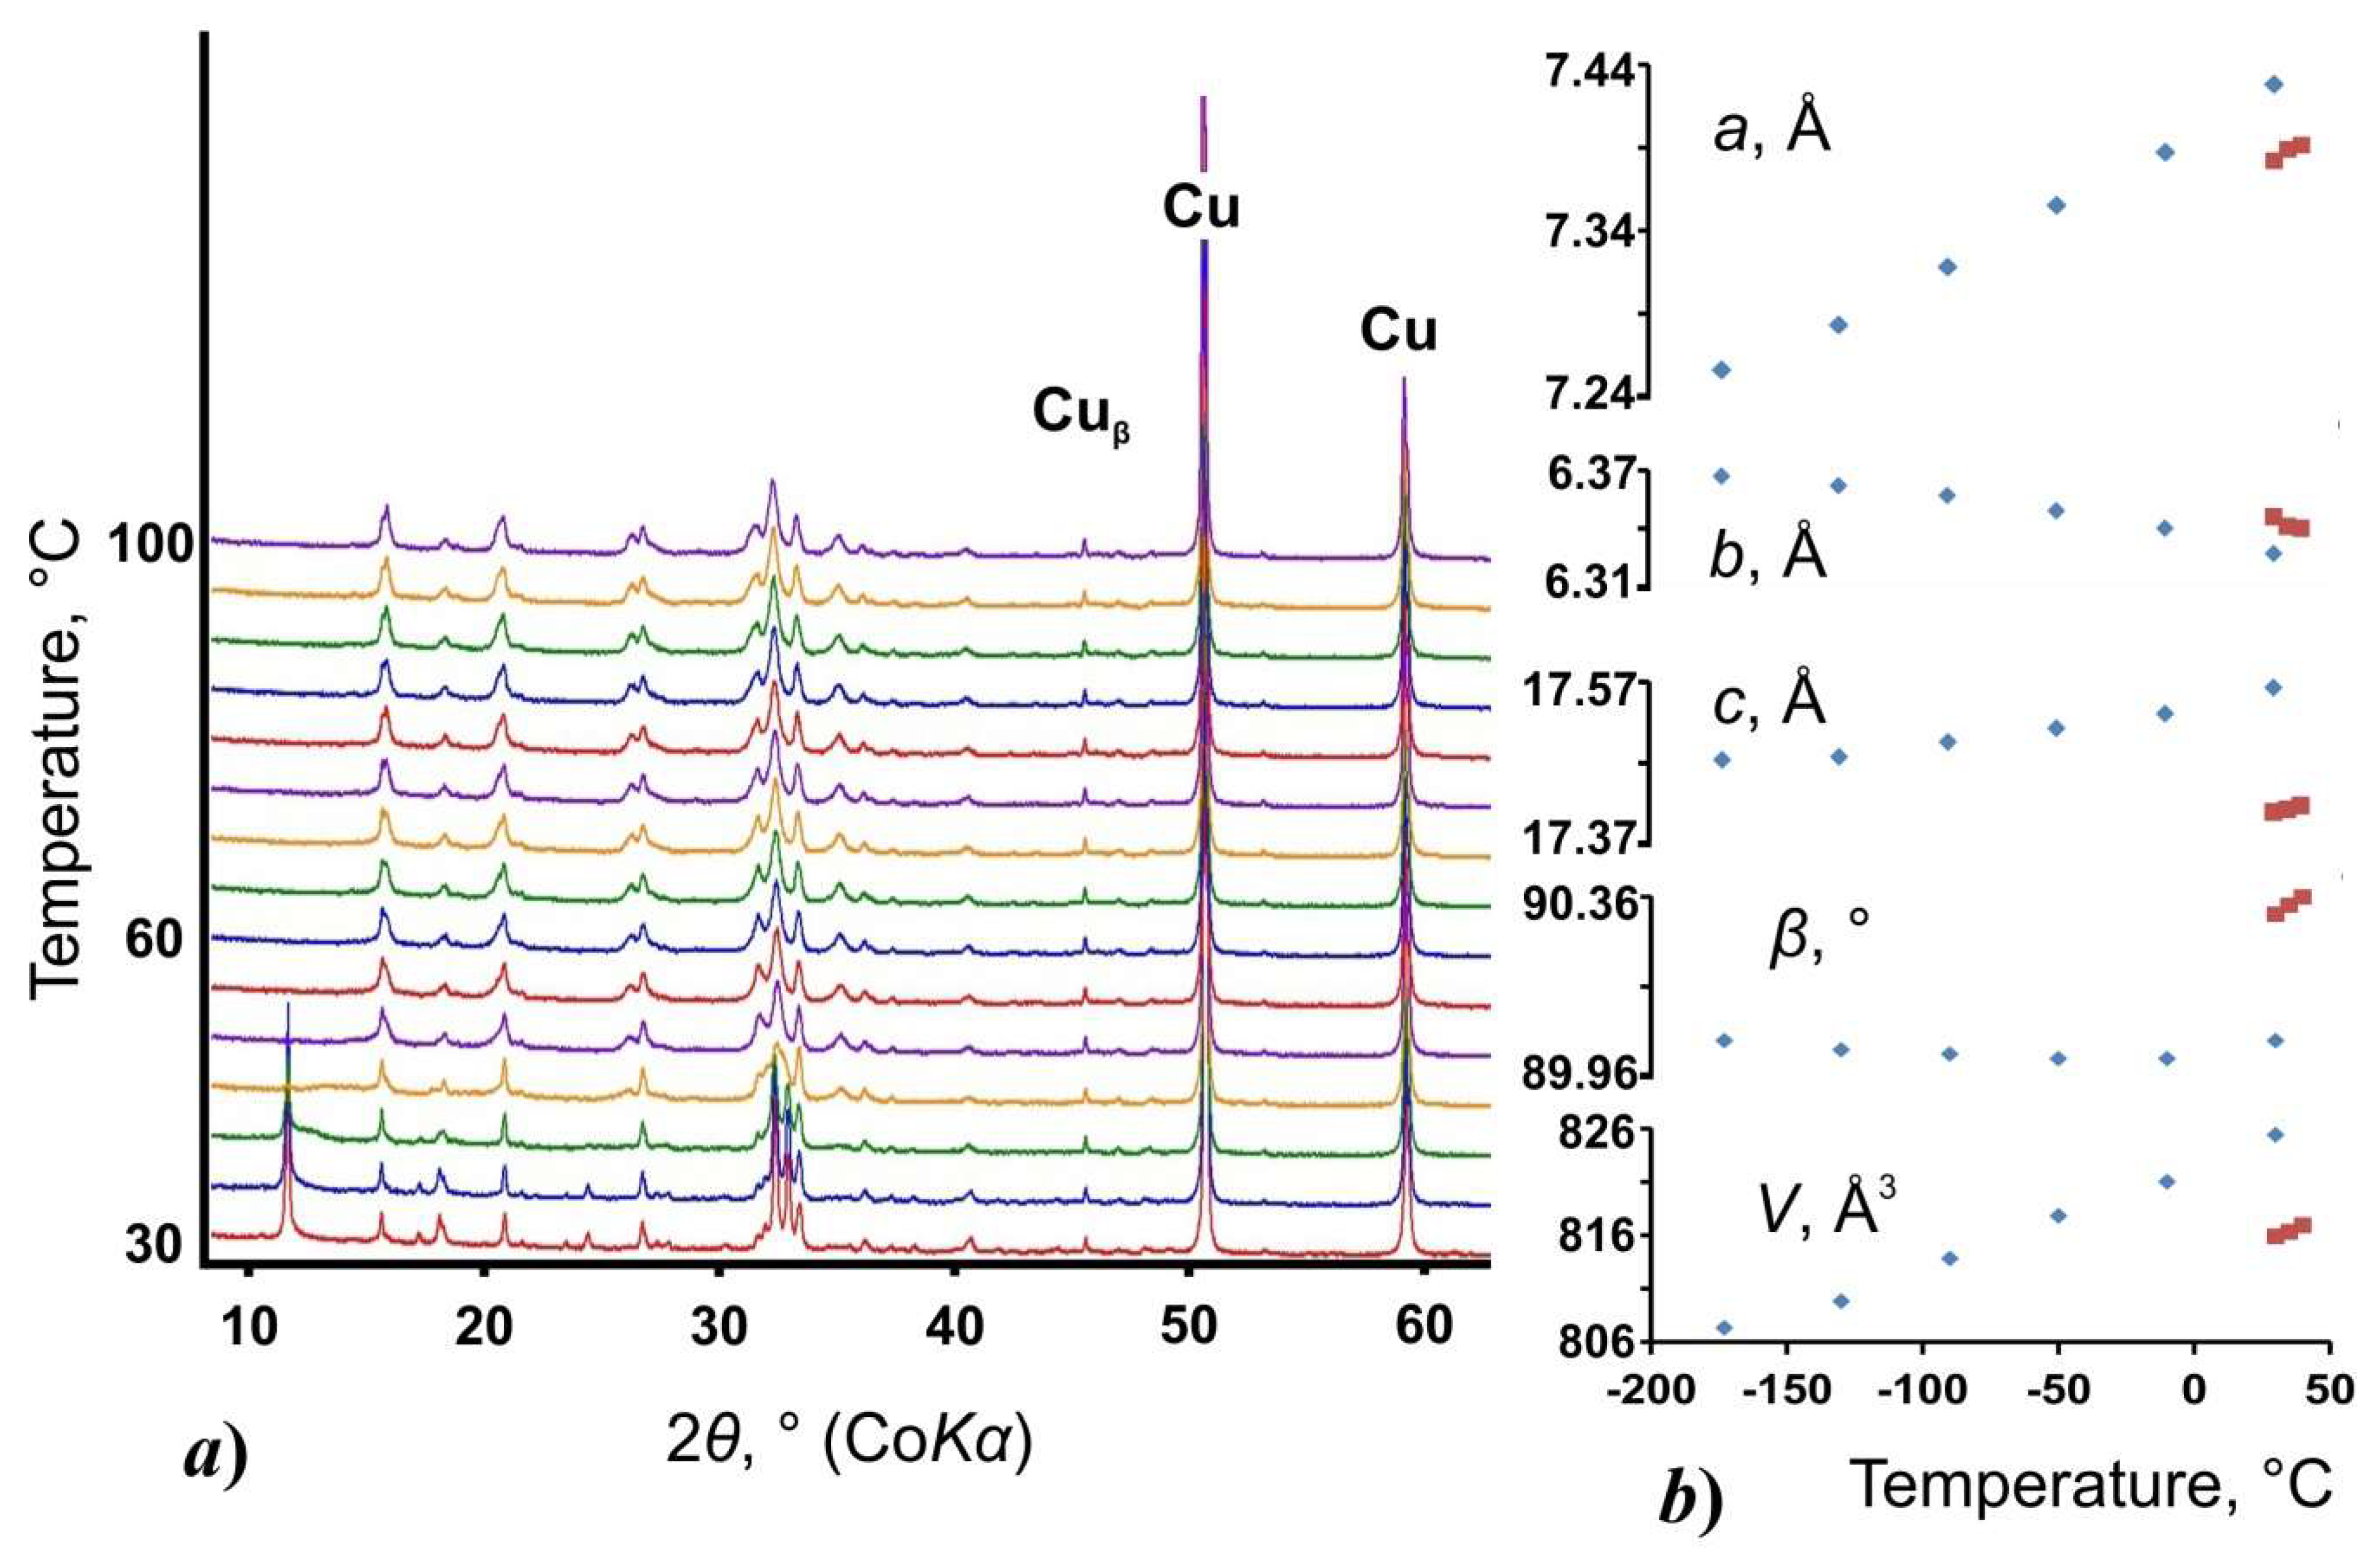
3.2. Thermal Behavior and Phase Transition

The analysis of the powder diffraction patterns obtained at room temperature revealed single UA phase in the respective powder sample (Figure 6a), whereas an admixture of UA (about 15%) was found within the UAD sample as indicated by the presence of distinct diffraction maxima at around 32, 36, and 40° 2θ (Figure 7a).
Figure 6b shows the behavior of the unit-cell parameters of UA as a function of temperature. As seen from the graphs, an essential change in the temperature dependence character starts after 210 °C. The powder pattern of UA (Figure 6a) remains almost unchanged up to 220 °C, where two diffraction maxima at 2θ = 32–33° merge into one peak. Unfortunately, we were unable to collect the SC data at the specified temperature range to understand what is happening with the structure, but according to the similarity of the patterns, it is likely that an overall structural motif remains the same up to 380 °C, where the crystallinity of the phase is lost. The only diffraction peaks left within the pattern after 400 °C are attributed to the Pt sample holder. Equations describing the temperature dependence of the unit-cell parameters of UA within the range of −143 to 60 °C are: a = 6.204 − 2.416 × 10⁻⁴ × T to 1.192 × 10⁻⁷ × T2; b = 7.417 + 1.113 × 10⁻³ × T + 8.478 × 10⁻⁷ × T2; c = 13.116 − 1.147 × 10⁻⁴ × T + 3.250 × 10⁻⁸ × T2; β = 90.374 − 2.605 × 10⁻³ × T − 1.520 × 10⁻⁶ × T2; and V = 603.5 + 61.9 × 10⁻³ × T + 5.0 × 10⁻⁵ × T2.
The PXRD patterns of the UAD sample as a function of temperature are shown in Figure 7. The most significant visible changes occur at 45 °C, where the sample fully dehydrates and transforms to the UA phase, as seen from the extinction of peaks at 2θ = 11.5 and 25° and alteration of the triplet geometry in the 2θ range of 31 to 35°. Equations describing the temperature dependence of the unit-cell parameters of UAD within the range of −173 to 30 °C are: a = 7.398 + 9.642 × 10⁻⁴ × T + 7.732× 10⁻⁷ × T2; b = 6.337 – 2.838 × 10⁻⁴ × T + 6.337 × 10⁻⁷ × T2; c = 17.541 + 6.645 × 10⁻⁴ × T + 1.588 × 10⁻⁶ × T2; β = 89.981 − 4.283 × 10⁻⁴ × T − 6.729 × 10⁻⁷ × T2; and V = 822.25 + 10.25 × 10⁻³ × T + 8.0 × 10⁻⁵ × T2.
The thermal behavior of the UA and UAD structures was analyzed according to the single crystal XRD data, since only three points were obtained in PXRD experiments for UAD, and the characteristics of the dependencies obtained during single crystal and powder XRD experiments for UA looked almost identical if measured by the slope of the generated curves.
The thermal behavior of UA and UAD is essentially anisotropic (Table 3). According to the theory of thermal behavior [27,28,29], the maximal thermal expansion should be along the direction of the weakest bonding. Aromatic rings are the most rigid units of the structures. Their planes are located preferably parallel to the [001] direction (Figure 4a–c and Figure 5a–c). Thus, the lowest expansion is observed along [001] in both structures (Figure 4d and Figure 5d). Considering the chained structural motif of UA (Figure 4) and UAD (Figure 5), one could expect the highest expansion in the direction of π-stacking interactions between the neighboring chains. However, the multidirectional arrangement of π-stacking as well as cross linkage of chains from different layers via H-bonds and the oblique symmetry of the lattice modify the thermal behavior. The maximal expansion of UA is observed along the b-axis, whereas the strongest contraction occurs perpendicular to the (101) plane due to the orthogonalization of the monoclinic angle (Figure 4d) [5,30]. Straightening of the β angle leads to the expansion of the structure in the opposite direction, and causes shifts in the uric acid chains in the direction perpendicular to their extension, which in turn results in the π-stacking geometry alteration (Table 2). The thermal behavior of UA is also governed by the increase in the acute twisted angle (Figure 4c) between the chains from the neighbor layers from 58° to 64°. The latter motion also highlights the expansion of the structure, since the respective decrease in the obtuse twisted angle leads to the stretching of the structure along the [010] direction.
The appearance of H2O molecules between the layers of uric acid molecules in the structure of UAD slightly affects the figure of the thermal expansion coefficients’ orientation (Figure 5d), but not the mechanism of the expansion. Being almost orthogonal, the unit cell of UAD has the maximal expansion along the a-axis and contraction along the b-axis due to the same decrease in the obtuse angle and respective increase in the acute twisted angle (from 63° to 66°; Figure 5c), the same as in the structure of UA.

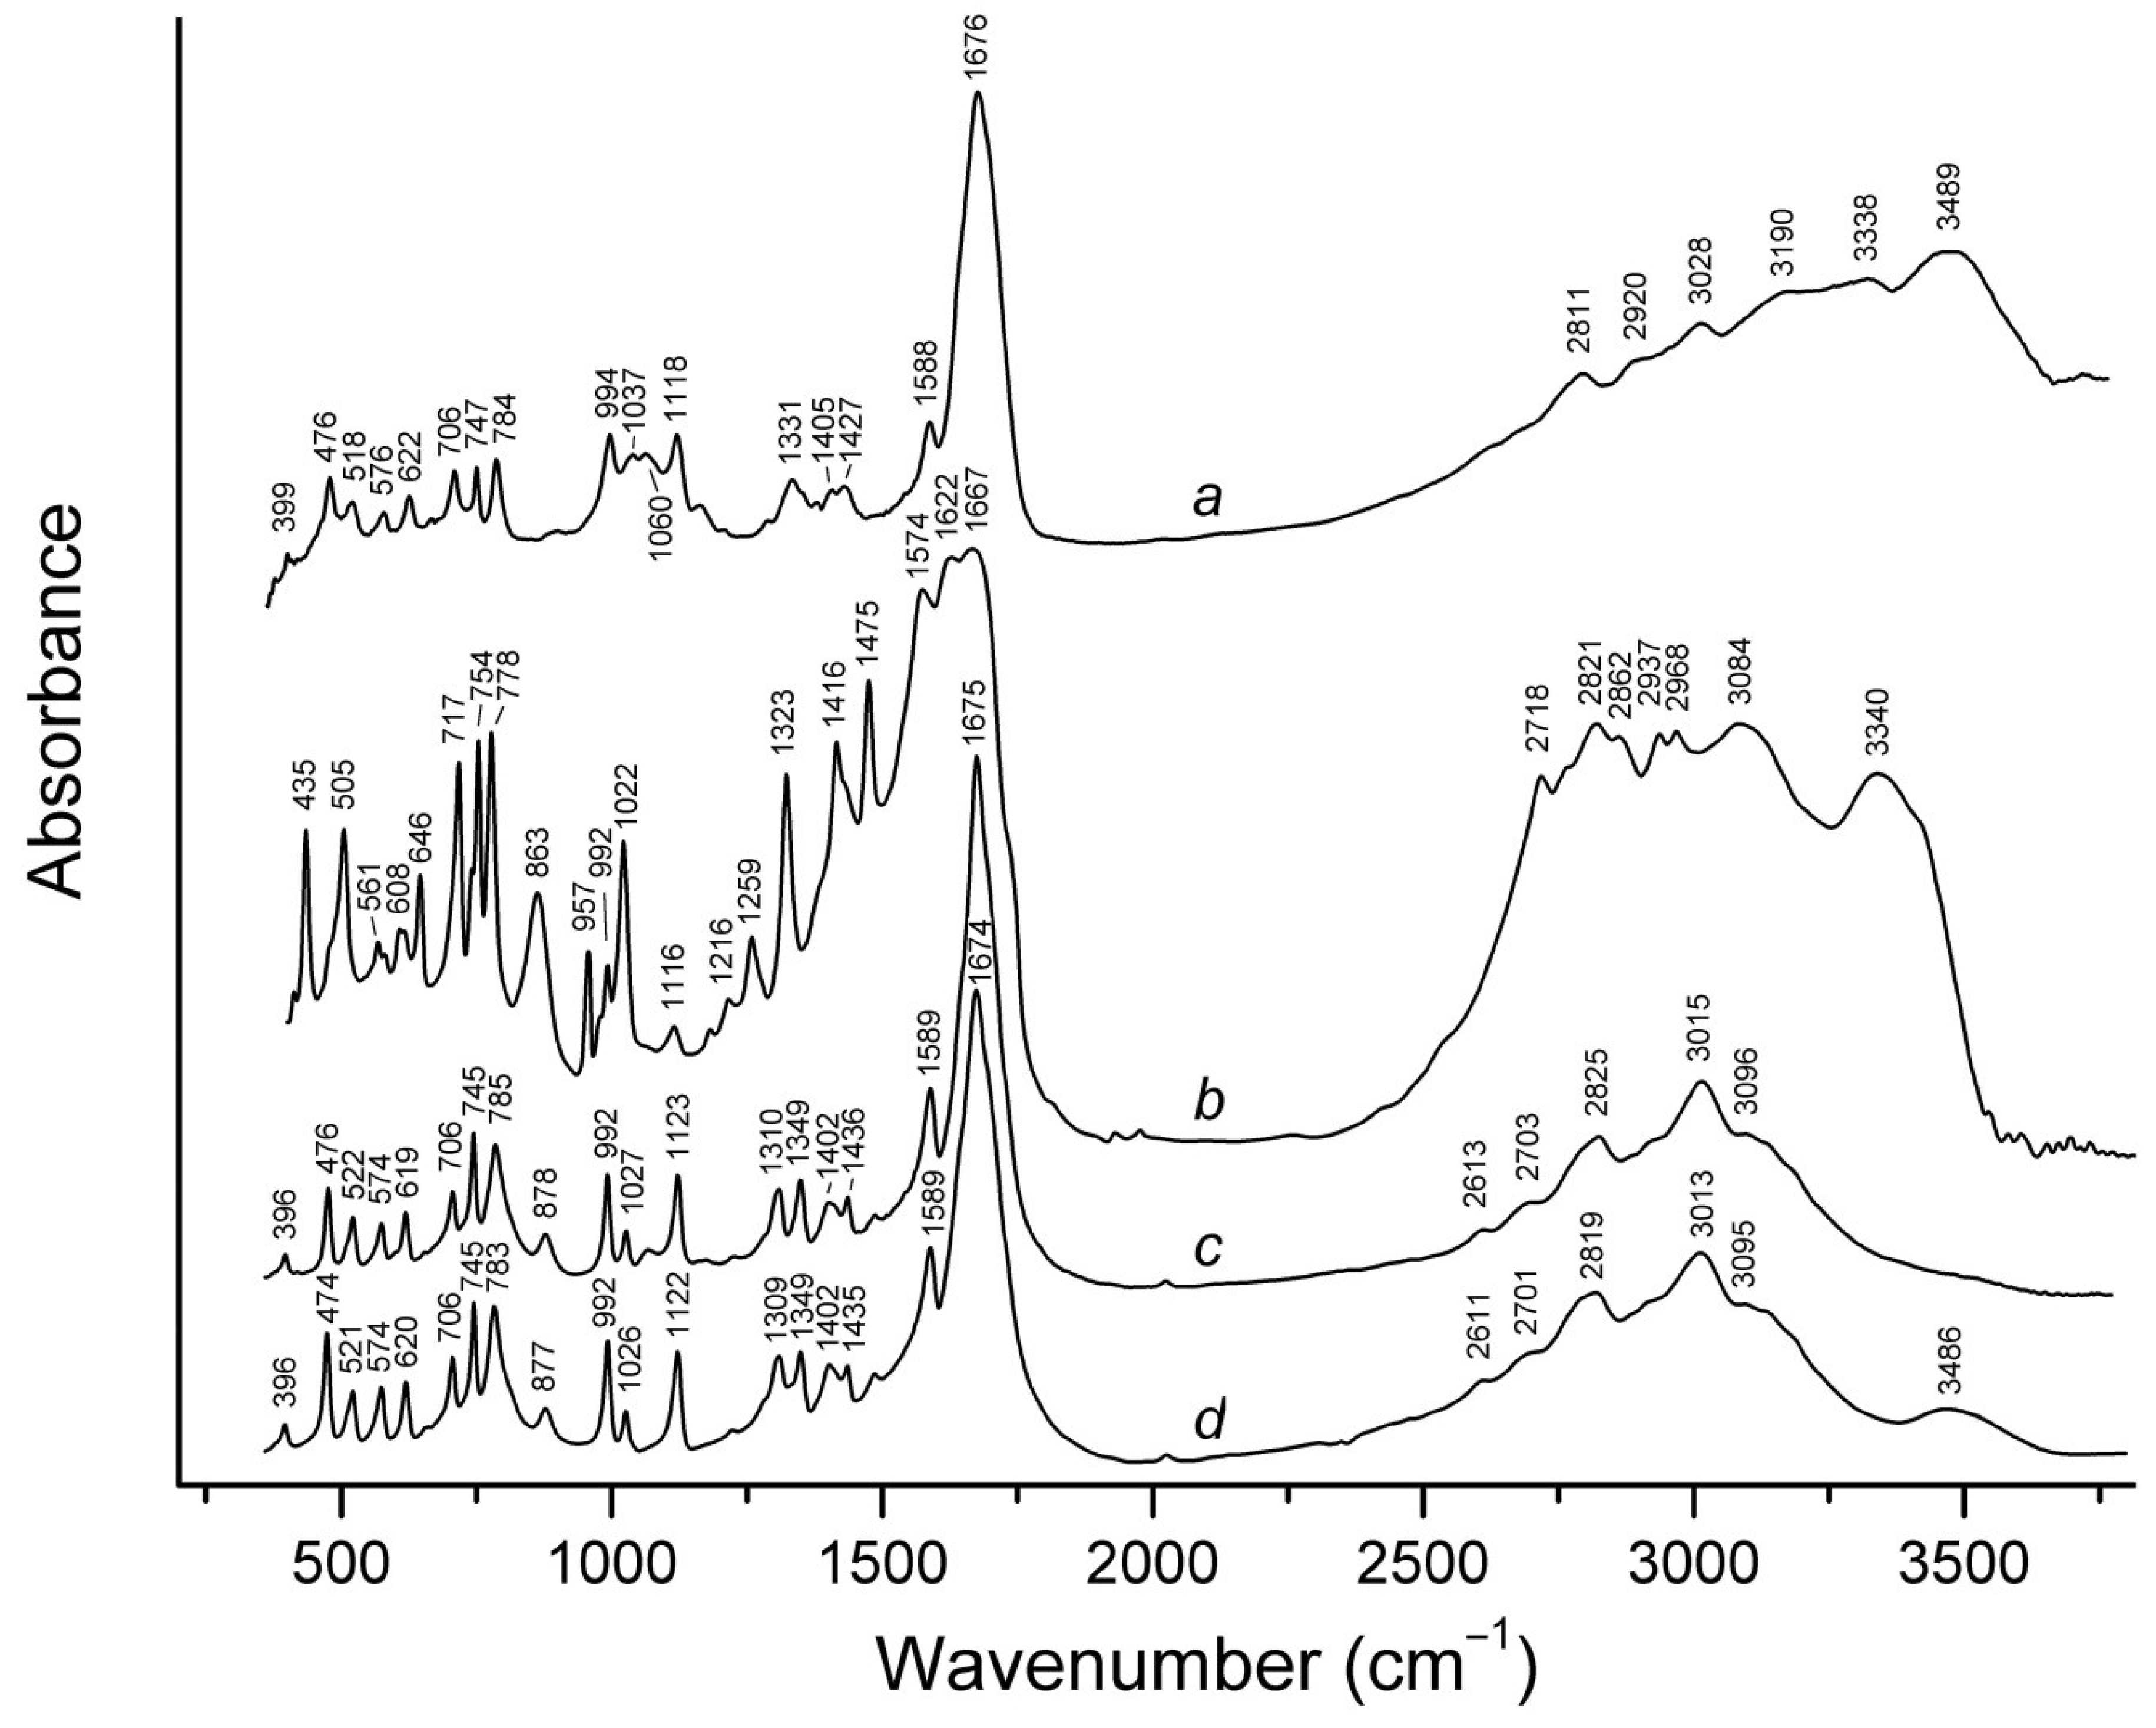
3.3. IR Spectroscopy

The similarity of the UA and UAD IR spectra confirms their structural similarity, whereas their monohydrate phases [20] are significantly different (Figure 8). In particular, the IR spectrum of uric acid monohydrate shows strong absorption in 2700–3000 cm−1, which corresponds to strong hydrogen bonds. The IR spectrum of the incomplete UAD dehydration product (Figure 8d) has a band at 3486 cm−1, which is close to the band of weakly bound water in UAD (at 3489 cm−1). Strong characteristic bands of uric acid monohydrate (at 1475, 1323, and 1022 cm−1, Figure 8b) are not observed in the IR spectrum of partly dehydrated tinnunculite, which confirms direct transformation of UAD to UA without formation of an intermediate partly dehydrated phase.

4. Conclusions

Total removal of H2O molecules from the structure of UAD results in the reduction of the interlayer space, and the recovery of the direct H-bonding systems between the layers of uric acid molecules. Re-penetration of H2O molecules into the structure of UA seems impossible because it will result in the breaking of rather strong H bonds accompanied by the formation of significantly weaker H bonds with water molecules and the retraction of layers. As a result, the reverse phase transition from UA to UAD cannot be realized. Single crystals of UAD start to lose crystallinity at 30 °C, which is seen from the significant degradation of the refinement parameters. These phase transitions that occur in the range of physiological temperatures emphasize the particular importance of structural studies within the urate system, due to their importance in terms of human health. However, dehydration of UAD in a dry atmosphere may occur at even lower temperatures, and the dehydration speed also depends on the size of the crystals. Thus, almost complete dehydration of UAD powder sample in a dry room temperature conditions occurs during one year.
Recent studies [6] showed that the removal of supersaturation in uric acid in the urine in the initial stages of stone formation may occur due to the formation of metastable uric acid dihydrate, which serves as a nucleus for the subsequent growth of the stone during further formation stages; afterward, it irreversibly dehydrates into anhydrous uric acid. According to studies of urate stones from our collection, in which we often observe alternation of UA and UAD zones, the formation of metastable uric acid dihydrate can occur repeatedly due to variations in the urine composition (for example, pH and supersaturation in uric acid). According to the Ostwald rule on the metastable crystalline hydrates, in the process of crystallization from the solution, the hydrates that have a higher solubility crystallize first [31]. The tinnunkulite formation within the guano deposits can also be associated with the crystallization of metastable UAD from supersaturated solutions, and due to the low environmental temperature, it does not (or very slowly) dehydrate. These crystal chemical results confirm the similar mechanisms of urate and oxalate stone formation, as well as their similar crystallization structures observed in thin sections and cuts [5,32].

Supplementary Materials

The following are available online at https://www.mdpi.com/2075-163X/9/6/373/s1. Crystallographic Data Files.

Author Contributions

Conceptualization, A.R.I. and V.V.G.; Methodology, A.R.I., M.G.K., V.V.G., N.V.C., and T.L.P.; Investigation, A.R.I., M.G.K., V.V.G., N.V.C., and T.L.P.; Writing-Original Draft Preparation, A.R.I. and V.V.G.; Writing-Review & Editing, A.R.I., M.G.K., V.V.G., N.V.C., and T.L.P.; Visualization, A.R.I., V.V.G., and N.V.C.

Funding

This research was funded by the Russian Science Foundation (grant 18-77-00026 to A.R.I.).

Acknowledgments

The XRD was performed at the X-ray Diffraction Centre of the St. Petersburg State University. We are grateful to reviewers for their useful comments.

Conflicts of Interest

The authors declare no conflict of interest.

References

  1. Kempe, S. Carbon in the rock cycle. In Scope 13, the Global Carbon Cycle; Bolin, B., Degens, E.T., Kempe, S., Ketner, P., Eds.; John Wiley and Sons: Chichester, UK, 1979; pp. 343–377. [Google Scholar]
  2. Hunt, J.M. Petroleum Geochemistry and Geology, 2nd ed.; Freeman: New York, NY, USA, 1995; 743p. [Google Scholar]
  3. Graustein, W.C.; Cromack, K.J.R.; Sollins, E. Calcium oxalate: Occurrence in soils and effect on nutrient and geochemical cycles. Science 1977, 23, 1252–1254. [Google Scholar] [CrossRef] [PubMed]
  4. Echigo, T.; Kimata, M. Crystal chemistry and genesis of organic minerals: A review of oxalate and polycyclic aromatic hydrocarbon minerals. Can. Mineral. 2010, 48, 1329–1358. [Google Scholar] [CrossRef]
  5. Izatulina, A.R.; Gurzhiy, V.V.; Krzhizhanovskaya, M.G.; Kuz’mina, M.A.; Leoni, M.; Frank-Kamenetskaya, O.V. Hydrated Calcium Oxalates: Crystal Structures, Thermal Stability and Phase Evolution. Cryst. Growth Des. 2018, 18, 5465–5478. [Google Scholar] [CrossRef]
  6. Grases, F.; Villacampa, A.I.; Costa-Bauza, A.; Sohnel, O. Uric acid calculi: Types, etiology and mechanisms of formation. Clin. Chim. Acta 2000, 302, 89–104. [Google Scholar] [CrossRef]
  7. Seregin, A.V.; Mulabaev, N.S.; Tolordava, E.R. Urolithiasis: Current Aspects of Etiology and Pathogenesis. Med. Bus. 2012, 4, 4–10. (In Russian) [Google Scholar]
  8. Klaproth, M.H. Beiträge zur Chemischen Kenntnis der Mineralkörper; Decker und Compagnie: Posen, Germany; Heinrich August Rottmann: Berlin/Leipzig, Germany, 1795; pp. 299–313. [Google Scholar]
  9. Bridge, P.J. Guanine and uricite, two new organic minerals from Peru and Western Australia. Min. Mag. 1974, 39, 889–890. [Google Scholar] [CrossRef]
  10. Chesnokov, B.V.; Kovalev, E.G.; Gorelov, P.N.; Kotlyarov, V.A.; Bushmakin, A.F.; Zhdanov, V.F.; Tinnunculite, C. 10H12N8O8, a new mineral, in Mineraly i mineral’noe syr’e gorno-promyshlennykh raionov Urala. In Minerals and Mineral Resources of Mining Districts of the Urals; UB of RAS: Sverdlovsk, Russia, 1989; pp. 20–24. [Google Scholar]
  11. Pekov, I.V.; Chukanov, N.V.; Yapaskurt, V.O.; Belakovskiy, D.I.; Lykova, I.S.; Zubkova, N.V.; Shcherbakova, E.P.; Britvin, S.N.; Chervonnyi, A.D.; Tinnunculite, C. 5H4N4O3·2H2O: Occurrences on the Kola Peninsula and Redefinition and Validation as a Mineral Species. Geol. Ore Depos. 2017, 59, 609–618. [Google Scholar] [CrossRef]
  12. Artioli, G.; Galli, E.; Ferrari, M. Uric acid dihydrate—A new mineral? Riv. Mineral. Ital. 1993, 4, 261–264. [Google Scholar]
  13. Kolitsch, U.; Raade, G. Uric acid dihydrate: Occurrences in Austria and Norway. Nor. Bergverksmus. Skr. 2011, 46, 25–29. [Google Scholar]
  14. Ringertz, H. Optical and crystallographic data of uric acid and its dihydrate. Acta Crystallogr. 1965, 19, 286. [Google Scholar] [CrossRef]
  15. Ringertz, H. The molecular and crystal structure of uric acid. Acta Crystallogr. 1966, 20, 397–403. [Google Scholar] [CrossRef]
  16. Artioli, G.; Masciocchi, N.; Galli, E. The elusive crystal structure of uric acid dihydrate: Implication for epitaxial growth during biomineralization. Acta Crystallogr. 1997, B53, 498–503. [Google Scholar] [CrossRef]
  17. Parkin, S.; Hope, H. Uric Acid Dihydrate Revisited. Acta Crystallogr. 1998, B54, 339–344. [Google Scholar] [CrossRef]
  18. Liu, F.; Hooks, D.E.; Nan, L.; Mara, N.A.; Swift, J.A. Mechanical Properties of Anhydrous and Hydrated Uric Acid Crystals. Chem. Mater. 2018, 30, 3798–3805. [Google Scholar] [CrossRef]
  19. Zellelow, A.Z.; Kim, K.-H.; Sours, R.E.; Swift, J.A. Solid-State Dehydration of Uric Acid Dihydrate. Cryst. Growth Des. 2010, 10, 418–425. [Google Scholar] [CrossRef]
  20. Schubert, G.; Gunter, R.; Jancke, H.; Kraus, W.; Patzelt, C. Uric acid monohydrate—A new urinary calculus phase. Urol. Res. 2005, 33, 231–238. [Google Scholar] [CrossRef]
  21. CrysAlisPro Software System, version 1.171.38.46; Rigaku Oxford Diffraction: Oxford, UK, 2015.
  22. Sheldrick, G.M. SHELXT—Integrated space-group and crystal structure determination. Acta Crystallogr. 2015, A71, 3–8. [Google Scholar] [CrossRef]
  23. Sheldrick, G.M. Crystal structure refinement with SHELXL. Acta Crystallogr. 2015, C71, 3–8. [Google Scholar]
  24. Dolomanov, O.V.; Bourhis, L.J.; Gildea, R.J.; Howard, J.A.K.; Puschmann, H. OLEX2: A complete structure solution, refinement and analysis program. J. Appl. Crystallogr. 2009, 42, 339–341. [Google Scholar] [CrossRef]
  25. Topas, version 4.2; General Profile and Structure Analysis Software for Powder Diffraction Data; Bruker AXS: Karlsruhe, Germany, 2009.
  26. Langreiter, T.; Kahlenberg, V. TEV—A Program for the Determination of the Thermal Expansion Tensor from Diffraction Data. Crystals 2015, 5, 143–153. [Google Scholar] [CrossRef]
  27. Filatov, S.K. Visokotemperaturnaia Kristallohimia. In High-Temperature Crystal Chemistry; Nedra: Leningrad, Russia, 1990. (In Russian) [Google Scholar]
  28. Hazen, R.M.; Downs, R.T. (Eds.) Reviews in Mineralogy and Geochemistry: High-Temperature and High-Pressure Crystal Chemistry; Mineralogical Society of America: Washington, DC, USA, 2001; Volume 41, pp. 1–596. [Google Scholar]
  29. Filatov, S.K. General concept of increasing crystal symmetry with an increase in temperature. Crystallogr. Rep. 2011, 56, 953–961. [Google Scholar] [CrossRef]
  30. Filatov, S.K. Negative linear thermal expansion of oblique-angle (monoclinic and triclinic) crystals as a common case. Phys. Stat. Sol. (B) 2008, 245, 2490–2496. [Google Scholar] [CrossRef]
  31. Ostwald, W. Studien über die Bildung und Umwandlung fester Körper. Z. Phys. Chem. 1897, 22, 289–330. [Google Scholar] [CrossRef]
  32. Golovanova, O.A.; Punin, Y.O.; Izatulina, A.R.; Yelnikov, V.Y.; Plotkina, Y.V. Structural-tex-tural features and ontogenetic regularities of renal stone formation. Vestn. St. Peterbg. Univ. Seriya Geol. I Geogr. 2009, 1, 26–34. (In Russian) [Google Scholar]
Figure 1. Fragments of urate renal stones: (a) monophase renal stone with uricite single crystals; (b) fragment of the urate renal stone with yellowish uricite zones and white tinnunculite zones; (c) typical urate renal stones excreted at one time; and (d) thin section of large urate renal stone, showing zonal distribution of uricite (light yellow) and organic substance.
Minerals 09 00373 g001
Figure 2. Crystallographically non-equivalent moieties, and the atom-labeling scheme in the structures of (a) UA and (b) UAD. Legend: C, N, O, and H atoms are shown as grey, blue, red, and white spheres, respectively. Thermal ellipsoids are drawn at the 50% probability level. Dashed lines in (b) show the disordered counterpart (occupancy = 0.59:0.41), obtained by rotation around statistical two-fold axis. Red dotted line = H bonds.
Minerals 09 00373 g002
Figure 3. An arrangement of uric acid molecules in chains in the structures of (a) UA and (b) UAD; (c) parallel-displaced π-stacking between the pyrimidine cycles. See Table 2 for details. Legend the same as in Figure 2.
Minerals 09 00373 g003
Figure 4. Crystal structure of UA, projections along (a) [100], (b) [ 2 1 ¯ 0 ], and (c) [ 2 1 ¯ 0 ] directions; and (d) the arrangement of the figure of thermal expansion/contraction coefficients (TEC) in the structure of UA. Legend the same as in Figure 2; TEC figures: expansion = green, contraction = red.
Minerals 09 00373 g004
Figure 5. Crystal structure of UAD, projections along the (a) [100], (b) [ 2 1 ¯ 0 ], and (c) [001] directions; and (d) the arrangement of figure of thermal expansion/contraction coefficients in the structure of UAD. Legend is the same as in Figure 2; figures of TEC: expansion = green, contraction = red.
Minerals 09 00373 g005
Figure 6. (a) Powder X-ray diffraction patterns and (b) the unit cell parameters of UA as a function of temperature (23–440 °C) under heating in air: blue diamonds = SCXRD data, red squares = PXRD data; ESDs of the unit cell parameters are within the limits of the symbols.
Minerals 09 00373 g006
Figure 7. (a) Powder X-ray diffraction patterns and (b) the unit cell parameters of UAD as a function of temperature (30–100 °C) under heating in air: blue diamonds = SCXRD data, red squares = PXRD data; ESDs of the unit cell parameters are within the limits of the symbols.
Minerals 09 00373 g007
Figure 8. IR spectra of a: UAD, b: uric acid monohydrate [20], c: UA, and d: a product of incomplete UAD (holotype tinnunculite) dehydration in dry air at room temperature.
Minerals 09 00373 g008
Table 1. Crystallographic data and refinement parameters for UA and UAD.
SampleT (°C)a
(Å)
b
(Å)
c
(Å)
Β
(°)
V
3)
R1CCDC
UA
(s.g. P21/n)
−1436.2352(5)7.2756(6)13.1328(11)90.710(8)595.72(8)0.0551916030
−1006.2288(4)7.3113(5)13.1274(8)90.632(6)597.79(7)0.0561916031
−606.2182(4)7.3530(5)13.1232(8)90.519(6)600.00(7)0.0531916032
−306.2110(4)7.3857(5)13.1213(8)90.447(6)601.89(7)0.0481916033
06.2025(4)7.4163(5)13.1147(8)90.378(6)603.26(7)0.0461916034
306.1963(3)7.4512(4)13.1114(7)90.282(5)605.34(5)0.0421916035
606.1898(3)7.4857(4)13.1103(5)90.217(4)607.46(5)0.0371916036
UAD
(s.g. P21/c)
−1737.2559(4)6.3669(4)17.4739(13)90.036(6)807.25(9)0.0481916037
−1307.2830(3)6.3616(3)17.4781(9)90.020(4)809.79(7)0.0471916038
−907.3175(3)6.3565(3)17.4962(8)90.010(4)813.82(6)0.0471916039
−507.3553(4)6.3485(3)17.5125(9)90.005(5)817.75(7)0.0501916040
−107.3872(4)6.3397(3)17.5312(9)90.004(5)821.03(7)0.0481916041
307.4283(8)6.3266(5)17.5627(16)90.044(10)825.37(13)0.0941916042
Table 2. Alteration of selected interatomic distances as a function of temperature in the structures of UA and UAD: plane-to-plane shift (A), plane-to-plane normal (B), and centroid-to-centroid distance (C) are the parameters of π-stacking (Figure 3c), and N···O are the donor-acceptor distances in the H-bonding systems (values are given only for counterpart with higher occupancy).
SampleT (°C)ABCN1···O1N2···O3N3···O3N4···O2
UA−1431.252(4)3.241(3)3.474(2)2.816(3)2.800(3)2.780(3)2.721(3)
−1001.245(5)3.246(3)3.476(3)2.817(3)2.803(4)2.782(3)2.723(3)
−601.231(4)3.254(3)3.479(2)2.819(3)2.806(3)2.783(3)2.725(3)
−301.228(4)3.261(3)3.484(2)2.821(3)2.809(3)2.786(3)2.727(3)
01.224(4)3.265(3)3.487(2)2.824(3)2.810(3)2.790(3)2.729(3)
301.221(4)3.274(2)3.494(2)2.827(3)2.815(3)2.789(3)2.728(2)
601.218(3)3.280(2)3.499(2)2.829(2)2.818(2)2.793(2)2.730(2)
T (°C)abcN1A···O1AN2A···OW1N3A···O3AN4A···OW2
UAD−1731.619(11)3.242(7)3.624(6)2.832(12)2.832(7)2.836(14)2.566(8)
−1301.629(12)3.240(8)3.627(6)2.808(16)2.816(8)2.858(18)2.555(7)
−901.586(12)3.268(7)3.633(6)2.780(15)2.848(6)2.887(17)2.549(6)
−501.611(11)3.273(7)3.648(6)2.837(12)2.844(6)2.879(13)2.559(7)
−101.591(13)3.311(8)3.674(7)2.864(13)2.846(8)2.876(15)2.563(8)
301.48(4)3.24(3)3.57(2)2.71(4)2.84(2)2.94(4)2.51(2)
Table 3. The main coefficients of the thermal expansion/contraction αii (i = 1–3) × 106 °C1 and orientation of the main axes in the structures of UA and UAD.
SampleT (°C)α11α22α33<α11a<α22b<α33c
UA−100−45.7129.02.029.60028.98
−50−48.3139.72.829.17028.67
0−51.0150.13.628.76028.39
50−53.6160.34.428.36028.12
UAD−10019.8−24.7110.888.41088.40
−5028.8−34.7120.788.04088.04
037.7−44.8130.587.66087.68
3043.1−50.9136.287.43087.47
Note: α, coefficient of thermal expansion (α11, α22, α33 are eigenvalues (main values)); <αiia is the angle between αii and crystallographic direction [100], calculated with clockwise rotation.

