1. Introduction
Lithium is widely used in batteries, ceramics, glass, lubricants, refrigeration and the nuclear and optoelectronics industries. With the development of computers, digital cameras, mobile phones and other electronic devices, the battery industry has become the largest consumer of lithium. The lithium market has grown dramatically in recent years. The total global consumption of lithium almost doubled in 2016 compared to 2008, due mainly to the development of the lithium-ion battery market [
1]. It is expected that the lithium demand to be increased at an average annual growth rate of 10% over the next decade [
2], and the supply of lithium should increase accordingly.
Around 150 different minerals contain lithium and approximately 30 of these have a significant quantity of lithium. However, only five of these minerals have economic value. They include spodumene (LiAlSi
2O
6) from the pyroxene sub-group, lepidolite (KLiAl
1,5Li
1,5(Si
3Al
10)(F)
2) and zinnwaldite (KLiFeAl(AlSi
3)O
10(OH,F)
2) from the mica family, petalite (LiAlSi
4O
10, tectosilicate) and a lithium phosphate-amblygonite ((Li,Na)AlPO
4(F,OH)). Spodumene contains approximately 8% Li
2O which is the most abundant lithium-containing mineral. Due to the similarity of the physical-chemical properties of lithium minerals (including spodumene) and their associated gangue minerals (e.g., quartz, feldspar, mica), it is often challenging to separate lithium minerals [
3]. The typical beneficiation methods consist of flotation, hand sorting, heavy media separation, thermal treatment and magnetic separation.
Flotation is the most widely used beneficiation method for lithium minerals, including spodumene. While sodium oleate is often used as a collector in spodumene flotation, recent studies have suggested new collector mixtures for this purpose [
4,
5]. The characteristic surface crystal chemistry of spodumene has been determined to be the main contributing factor in spodumene selective flotation with an oleate collector when other aluminosilicates, such as muscovite, quartz and feldspar, are present [
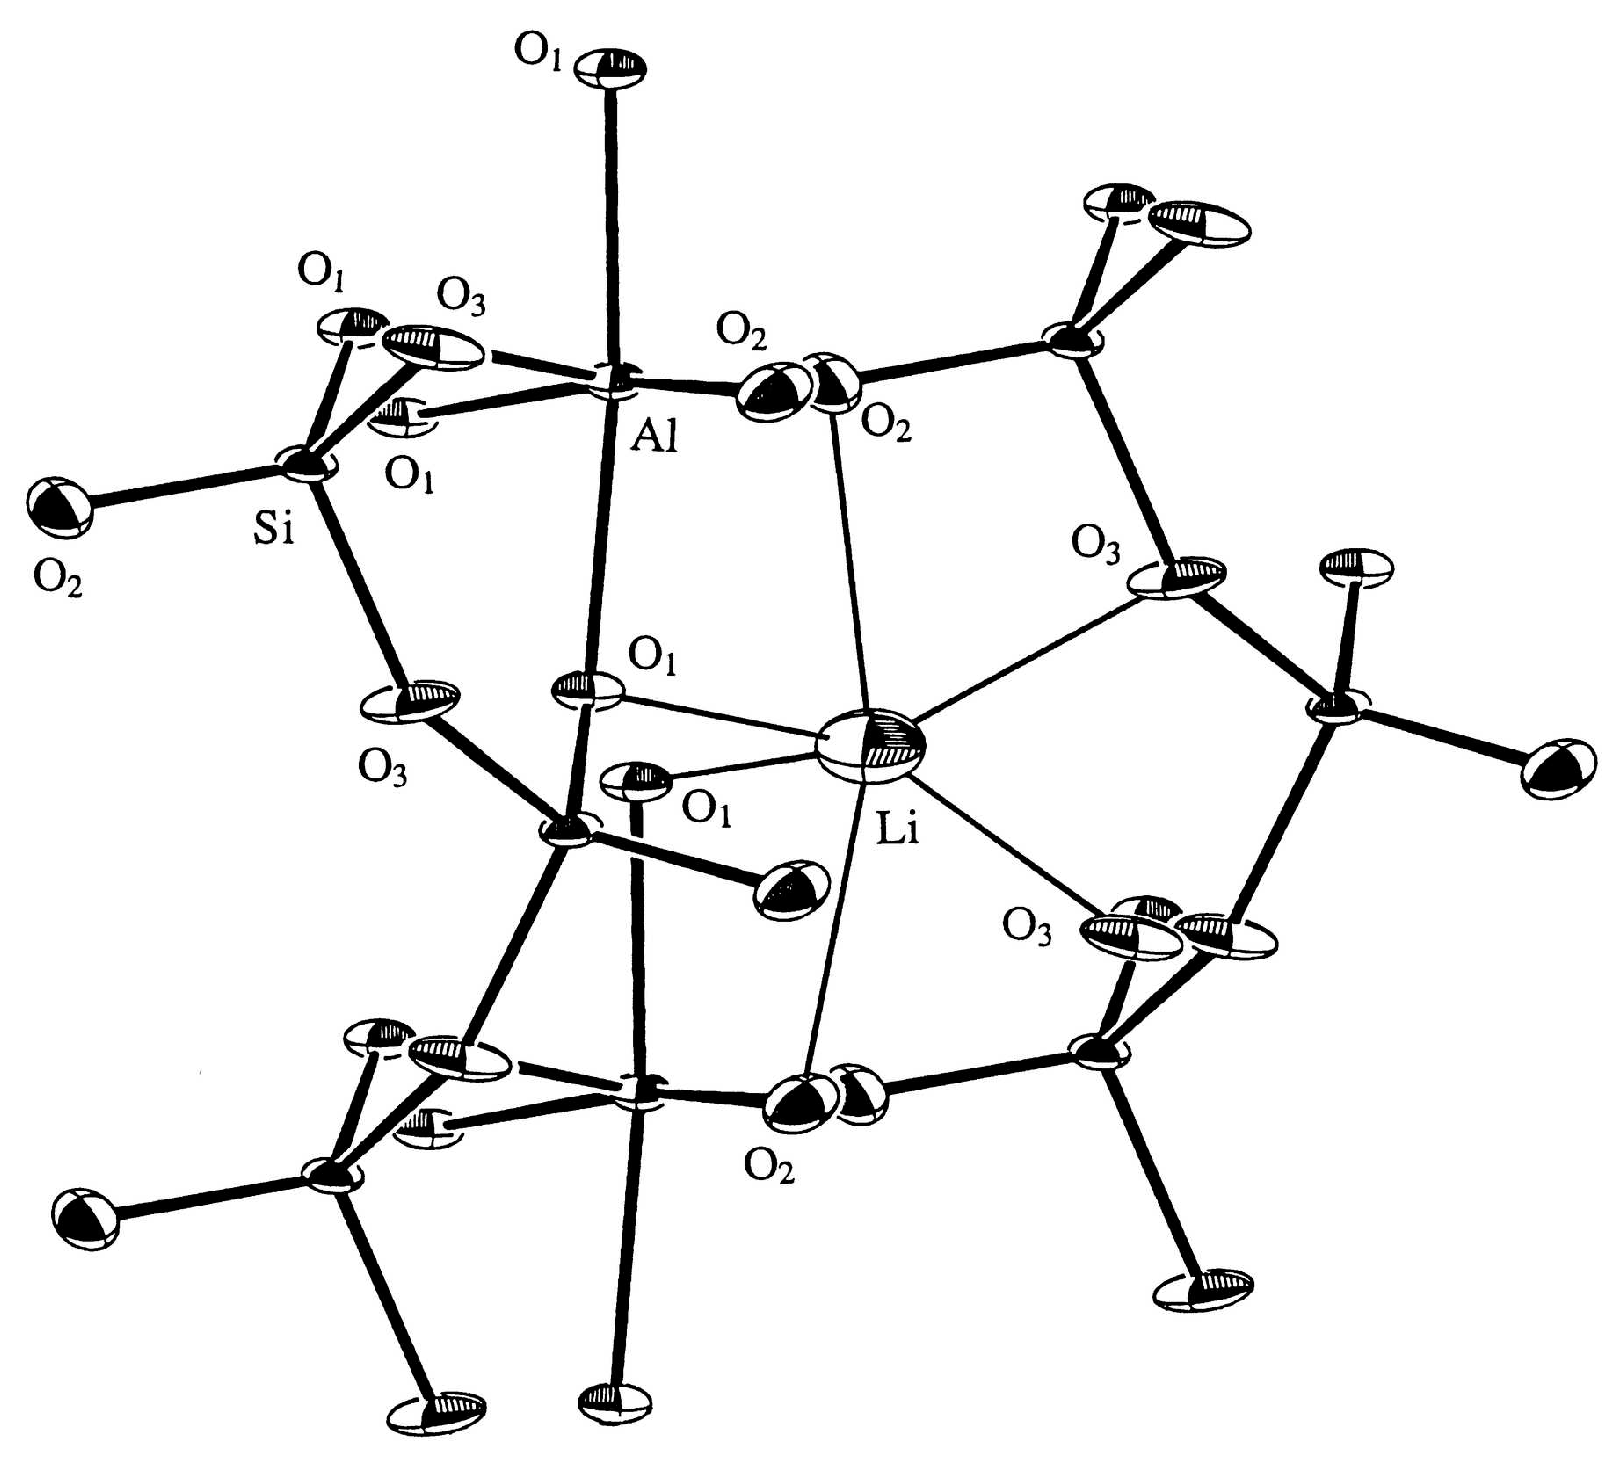
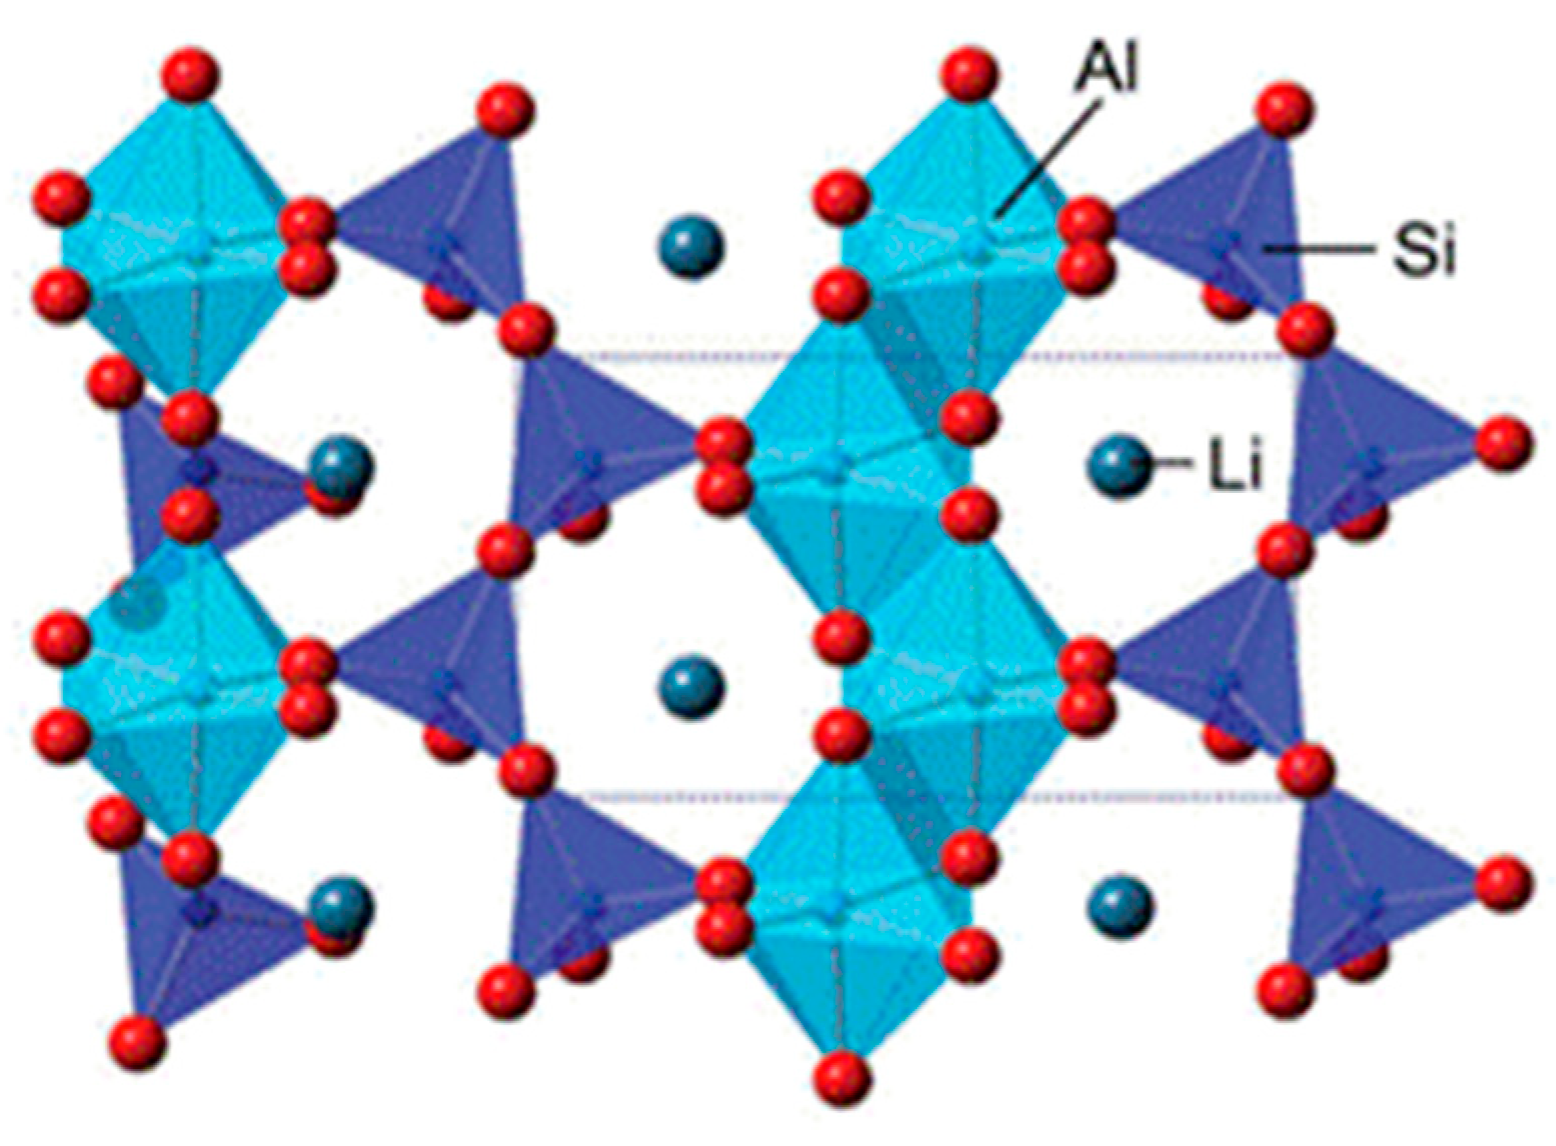
6]. Investigations of the crystallography of spodumene have become more important. As shown in
Figure 1, each of the individual tetrahedrons in a single-chain of silicates faces the same direction. These chains of silicate tetrahedrons are bound together laterally through ionic bonding with Li and Al in octahedral coordinates, leading to a unit cell formula of Li
4Al
4Si(O
3)
8. The Al
3+ sites on the spodumene surface have specific interactions with different chemical reagents, as is discussed further in this paper.
Moon and Fuerstenau [
6] studied the surface chemistry of spodumene when oleate is present in order to understand the crystallographic difference between spodumene and other aluminosilicates. They found that the surface Al site is the most favorable site for the selective chemisorption of oleate. In fact, Al sites in other aluminosilicates are deeply buried inside the crystal unit, making them unavailable for oleate adsorption. They also calculated the broken ionic bond strength per unit area for the {110}, {010}, {001} and {100} cleavage planes as 2.521 × 10
14, 3.155 × 10
14, 4.165 × 10
14 and 4.570 × 10
14 valence/cm
2, respectively. This indicates that cleavage occurs along the weakest {110} plane. Zhu et al. [
8] also reported that, while the four spodumene surfaces ({110}, {010}, {001} and {100}) are naturally hydrophilic, the preferential adsorption of sodium oleate on the {100} and {110} surfaces makes them hydrophobic.
The spodumene surface generally has a negative zeta potential in solutions of pH > 3 [
9]. This indicates that the separation of spodumene could be possible using cationic collectors. Amine collectors are the main cationic collectors used in spodumene flotation, and are normally applied in reverse flotation to float the gangue minerals (e.g., quartz, mica or feldspar). The performance of sodium oleate and lauryl amine as collectors in spodumene flotation has been investigated [
10] and it was found that lauryl amine achieves a higher recovery of spodumene than sodium oleate (i.e., 90% vs. 50%, respectively). Although the clean surface of spodumene is negatively charged at pH > 3, there are normally several cationic ions suspended in the solution, such as Li
+ and Al
3+, which can attach to the clean surface and easily form a bond with the anionic collectors. This is probably the reason for the wide utilization of anionic collectors in spodumene flotation. As stated above, oleic acid is the most frequently used anionic collector in spodumene flotation. Oleic acid performs best under slightly alkaline conditions (pH = 8–9). As oleic acid forms RCOO
− ions at a strong alkaline pH, and ROOH at acidic and neutral pH levels, both exist under a slightly alkaline pH and tend to form an ion-molecule complex. The RCOO
− group will react with the positive Al ions on the spodumene surface generated through chemical bonding. Meanwhile, the presence of molecular oleic acid will increase the negative value of the charge of RCOO
−, which strengthens the chemical bonding and increases its hydrophobicity [
11].
It is acknowledged that many studies have been carried out to improve spodumene flotation. However, most of the published papers focus on using different reagents, and the flotation mechanism is not yet fully understood. In this study, the flotation behavior of spodumene (obtained from a pegmatite ore) with different particle sizes was studied to determine the optimum flotation particle size range. This provides a theoretical basis for the selective grinding of spodumene. In addition, the optimum flotation conditions of spodumene is determined in order to improve the efficiency of flotation. Finally, the mechanism of spodumene flotation is discussed in conjunction with its surface charge behavior and its crystallography. The results of this study could have a significant effect on future productions of spodumene, and therefore could be of economic importance.
2. Materials and Experimental Methods
Spodumene was prepared from Länttä pegmatite ore deposit in Finland. The main minerals in the ore were identified as spodumene, quartz, muscovite, albite and potassium feldspar. The lumpy spodumene-rich pegmatite ore particles were manually selected from the batch rocks. The ore was crushed to less than 2 mm. Due to the density difference between spodumene and the gangue minerals, heavy media separation was performed to separate the spodumene. The gangue minerals present in the ore have densities of about 2.70 g/cm
3 while the density of spodumene is about 3.20 g/cm
3 [
12]. The dense media used in this study was a mixture of bromoform and tetra-bromoform with a density of 2.95 g/cm
3. The heavy fraction was dried at 50 °C and then ground to less than 700 μm. Another stage of heavy media separation was conducted to remove fine gangue particles and impurities. Finally, the desired size fractions were obtained after grinding and sieving.
XRD measurements were conducted to analyze the composition of the prepared spodumene samples and extract structural information. The measurements were performed on a Bruker D8 ADVANCE diffractometer with CuKα radiation (wavelength = 17.8897 nm). The XRD data were processed using DIFFFRAC.EVA provided by Bruker.
Scanning electron microscopy (SEM) was used to scan surface of the samples. Various signals generated by the interactions between the electrons and atoms contain information on the sample topography and composition. The machine used was a Hitachi S-4800 (Tokyo, Japan), which features a resolution down to 1 nm at 15 kV with acceleration tension between 0.1 and 30 kV.
Zeta potential measurements were performed using a Zetameter IV (CAD Instruments, France). Generally, particles have different movements in the presence of an electric field. Thus, the surface charge can be calculated according to this movement when combined with knowledge of the electric field magnitude, mobility velocity and direction. Using an agate mortar, 1 g of spodumene was ground to below 5 µm and stored in a glass bottle. The amount of sample used for each test was 50 mg with 200 mL of NaNO3 electrolyte solution. Each sample was stirred for 3 min to obtain a stable dispersion. The pH regulators were dilute solutions of HCl or NaOH. After the desired pH was obtained, the collector was added to the solution when needed. Finally, the suspension was injected into the apparatus using a syringe to test the electrophoretic mobility of the particles. Each test was repeated at least three times.
Flotation tests were performed using a Hallimond tube. One g of spodumene sample was suspended in 300 mL of deionized water and the reagents were then added and rotated with a magnetic stirrer for 30 s. Nitrogen gas was introduced at the volume rate of 60 mL/min. Sodium oleate (NaOl) was used as a collector (250 mg/L, as reported by Liu et al. [
9]). The optimum collector dosage was also reconfirmed in the initial tests since the spodumene recovery increased as the NaOl dosage increased up to 250 mg/L, and was unchanged after that. Flotation tests were carried out for 10 min with agitation at 500 rpm.
3. Results and Discussion
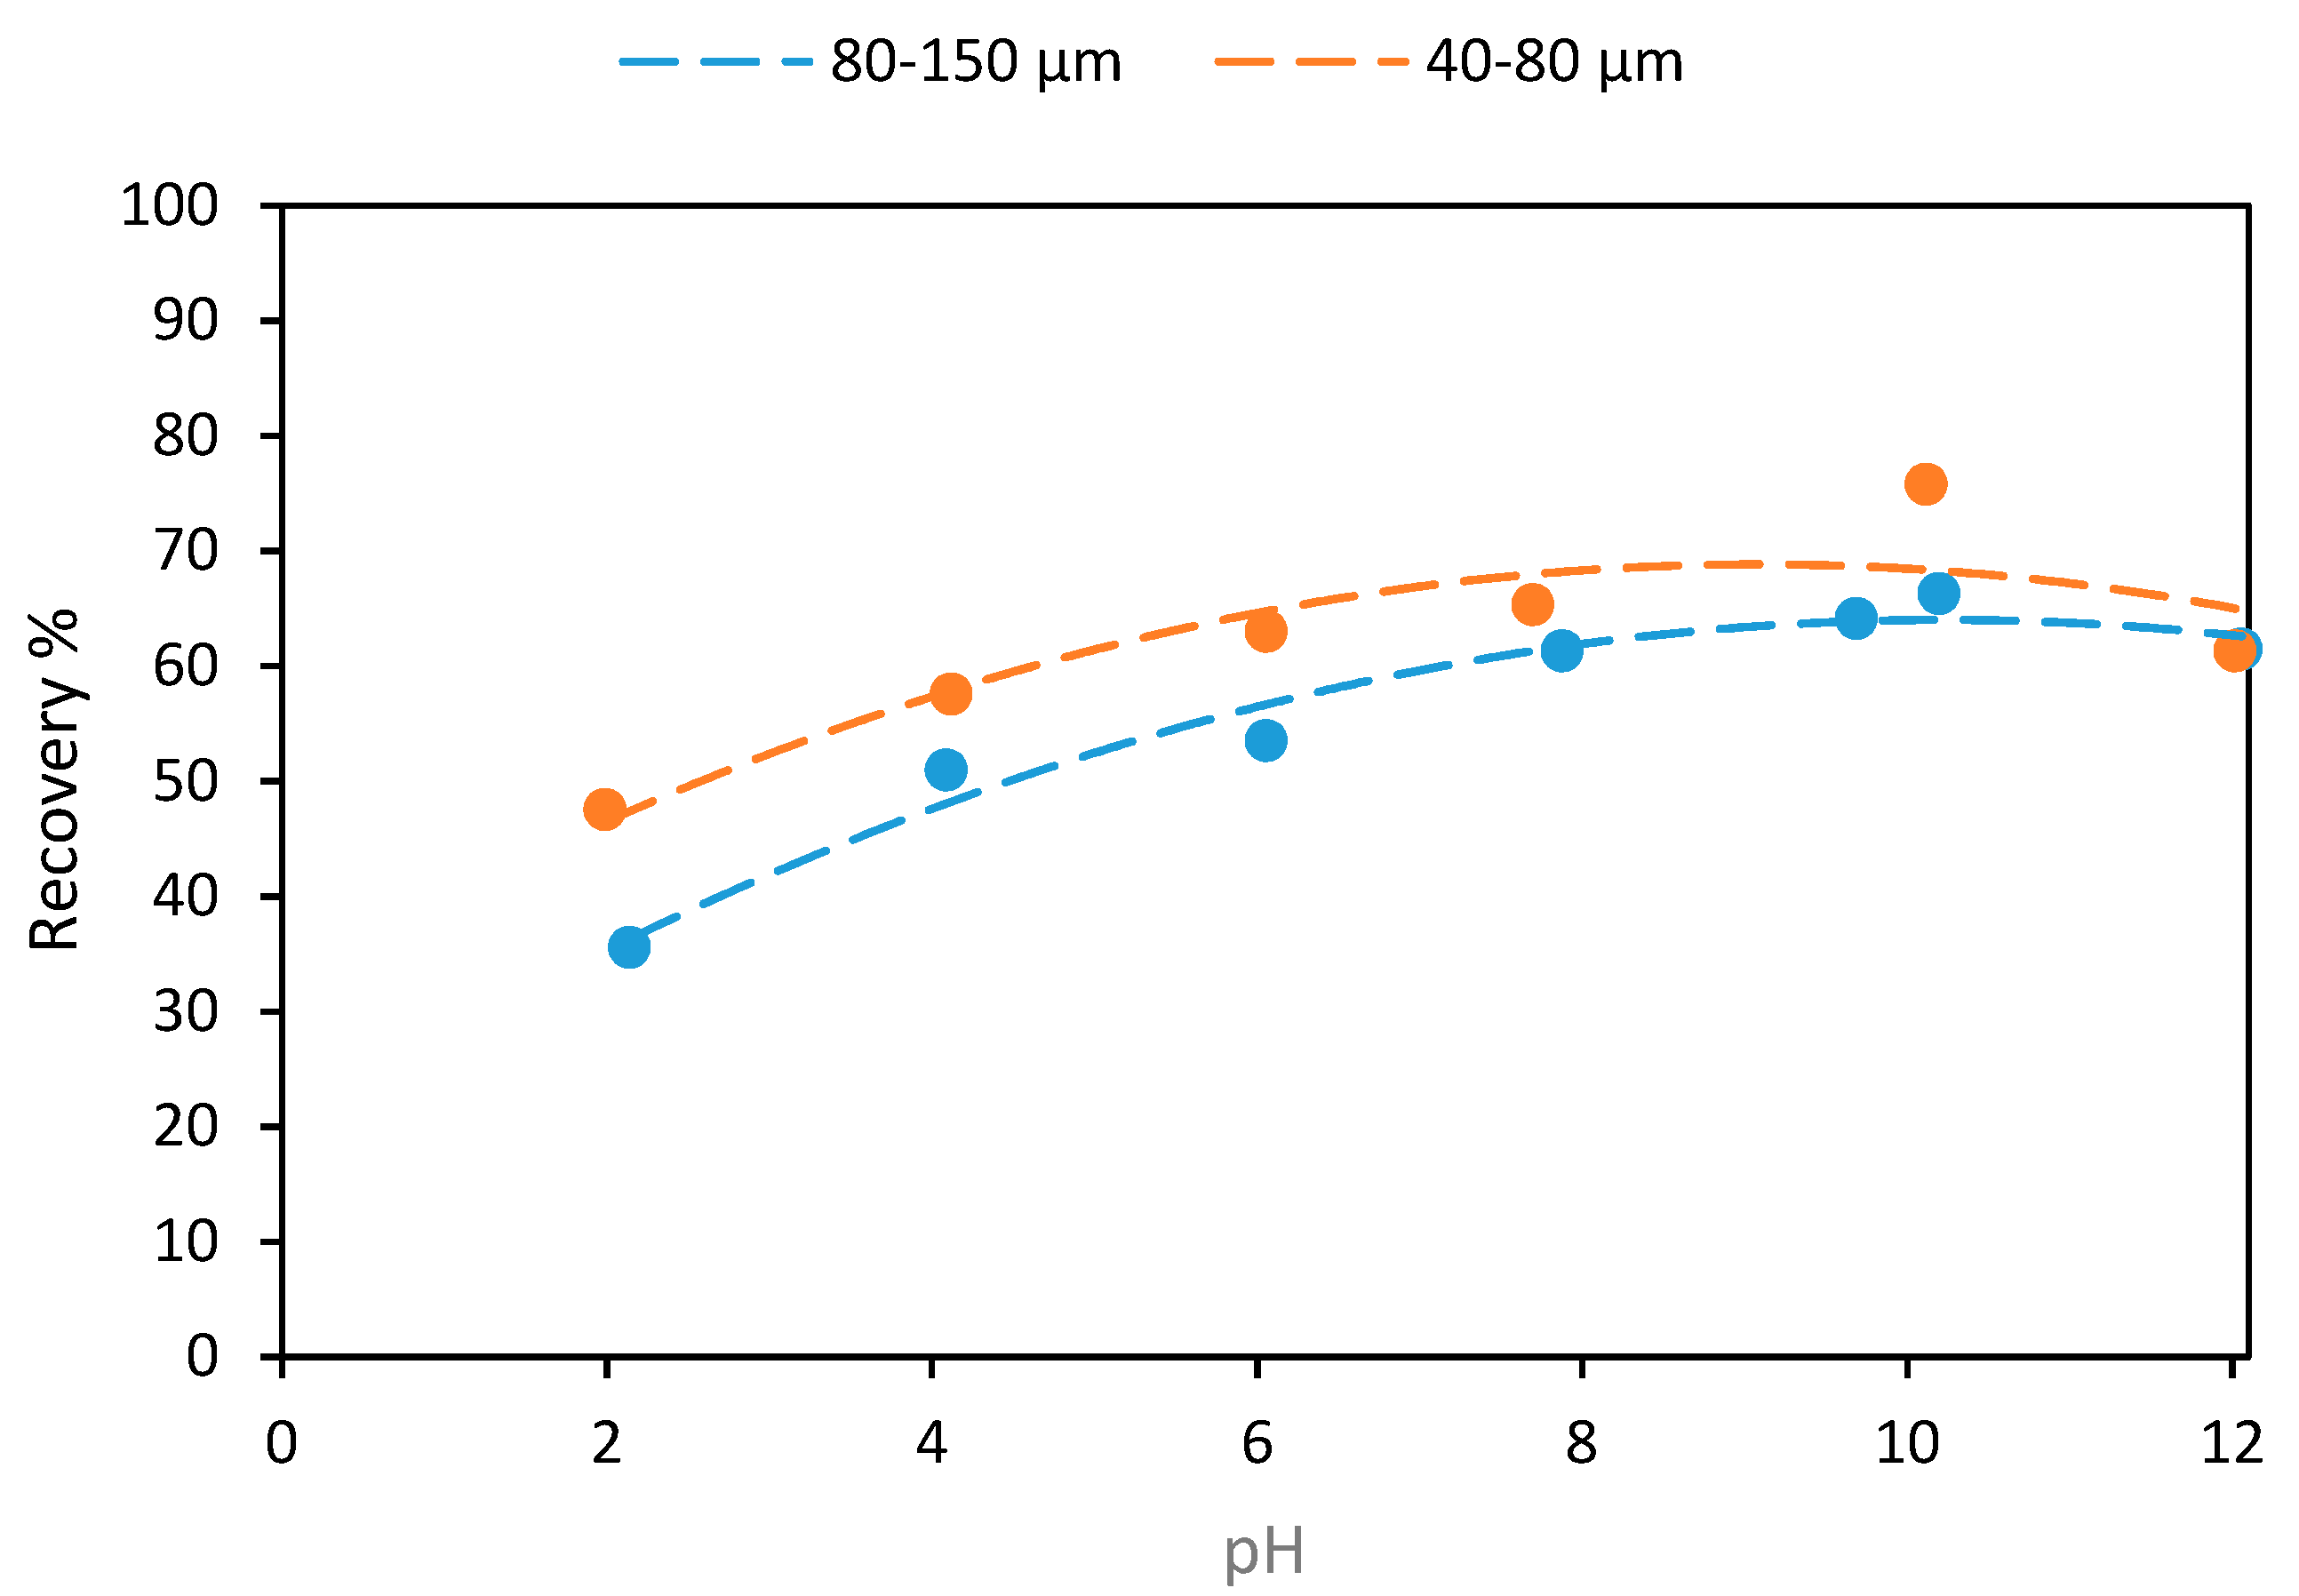
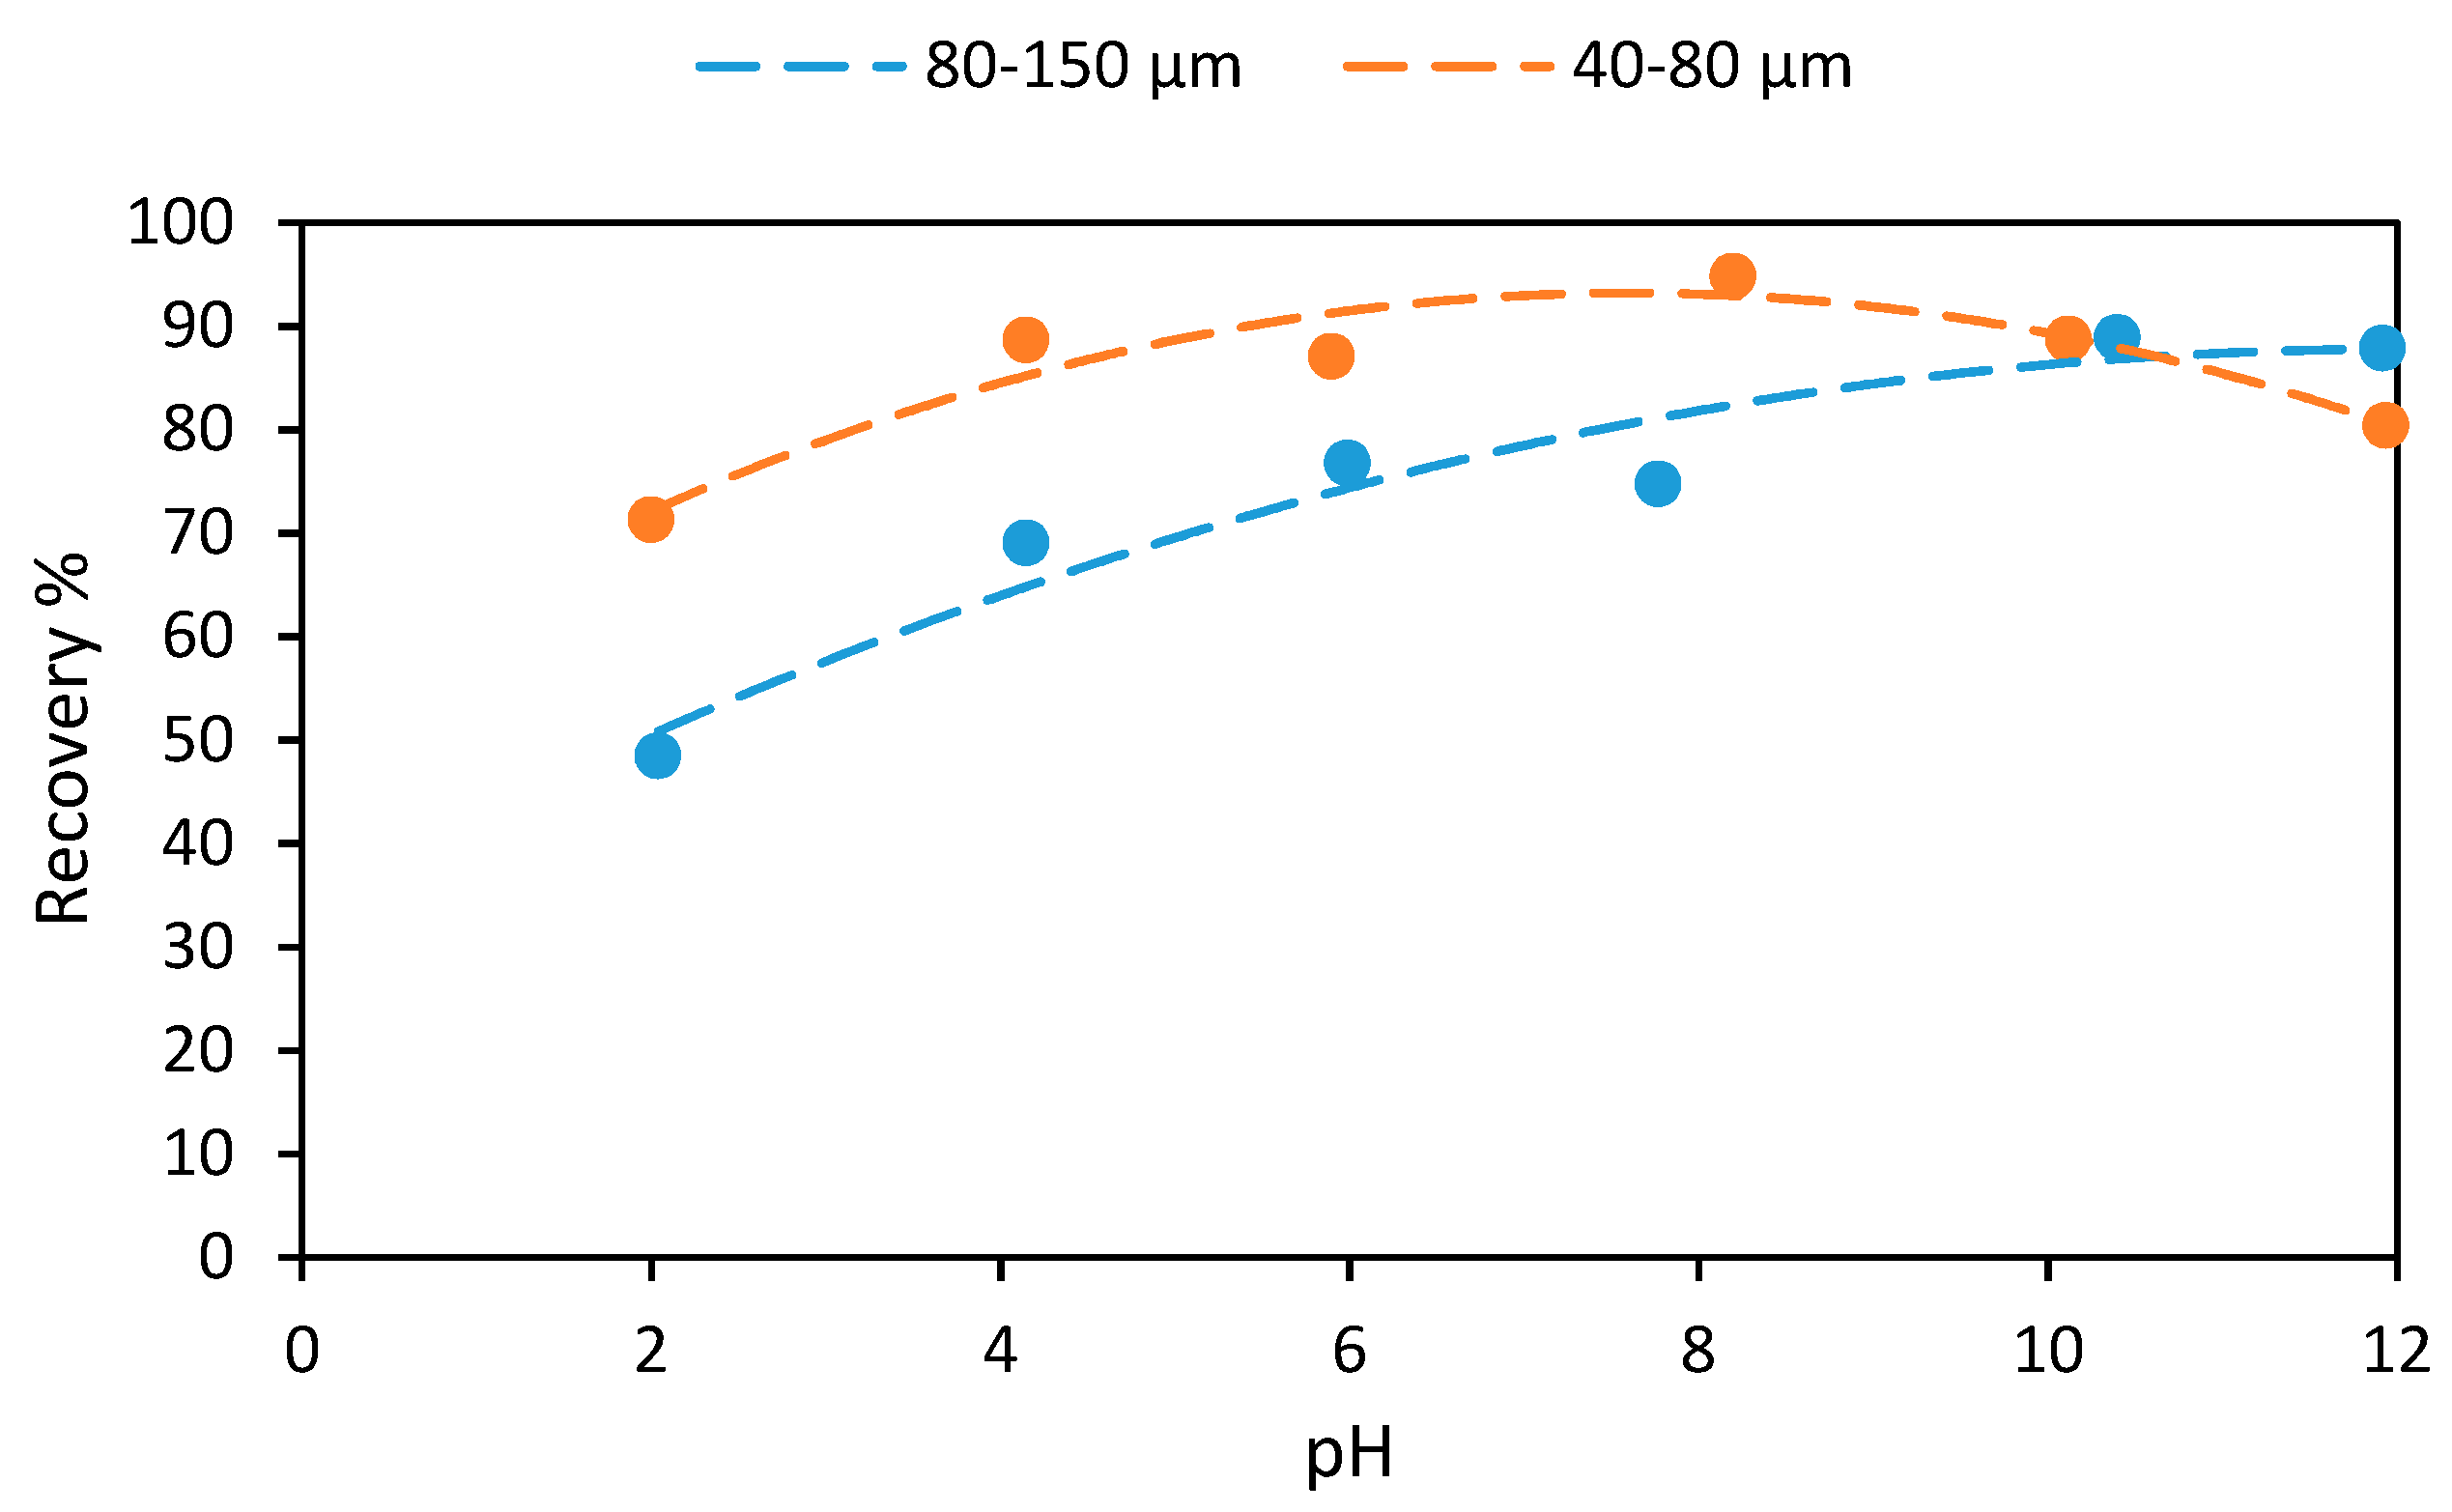
In the initial tests, the spodumene flotation recovery increased as the pH was raised from 2 to 10, and then stayed more or less unchanged up to pH 12 (
Figure 2).
Figure 2 also shows that the flotation recovery is a bit higher for almost all pH ranges for the finer fraction (i.e., the 40–80 µm compared to the 80–150 µm fraction), as is further discussed later in this paper.
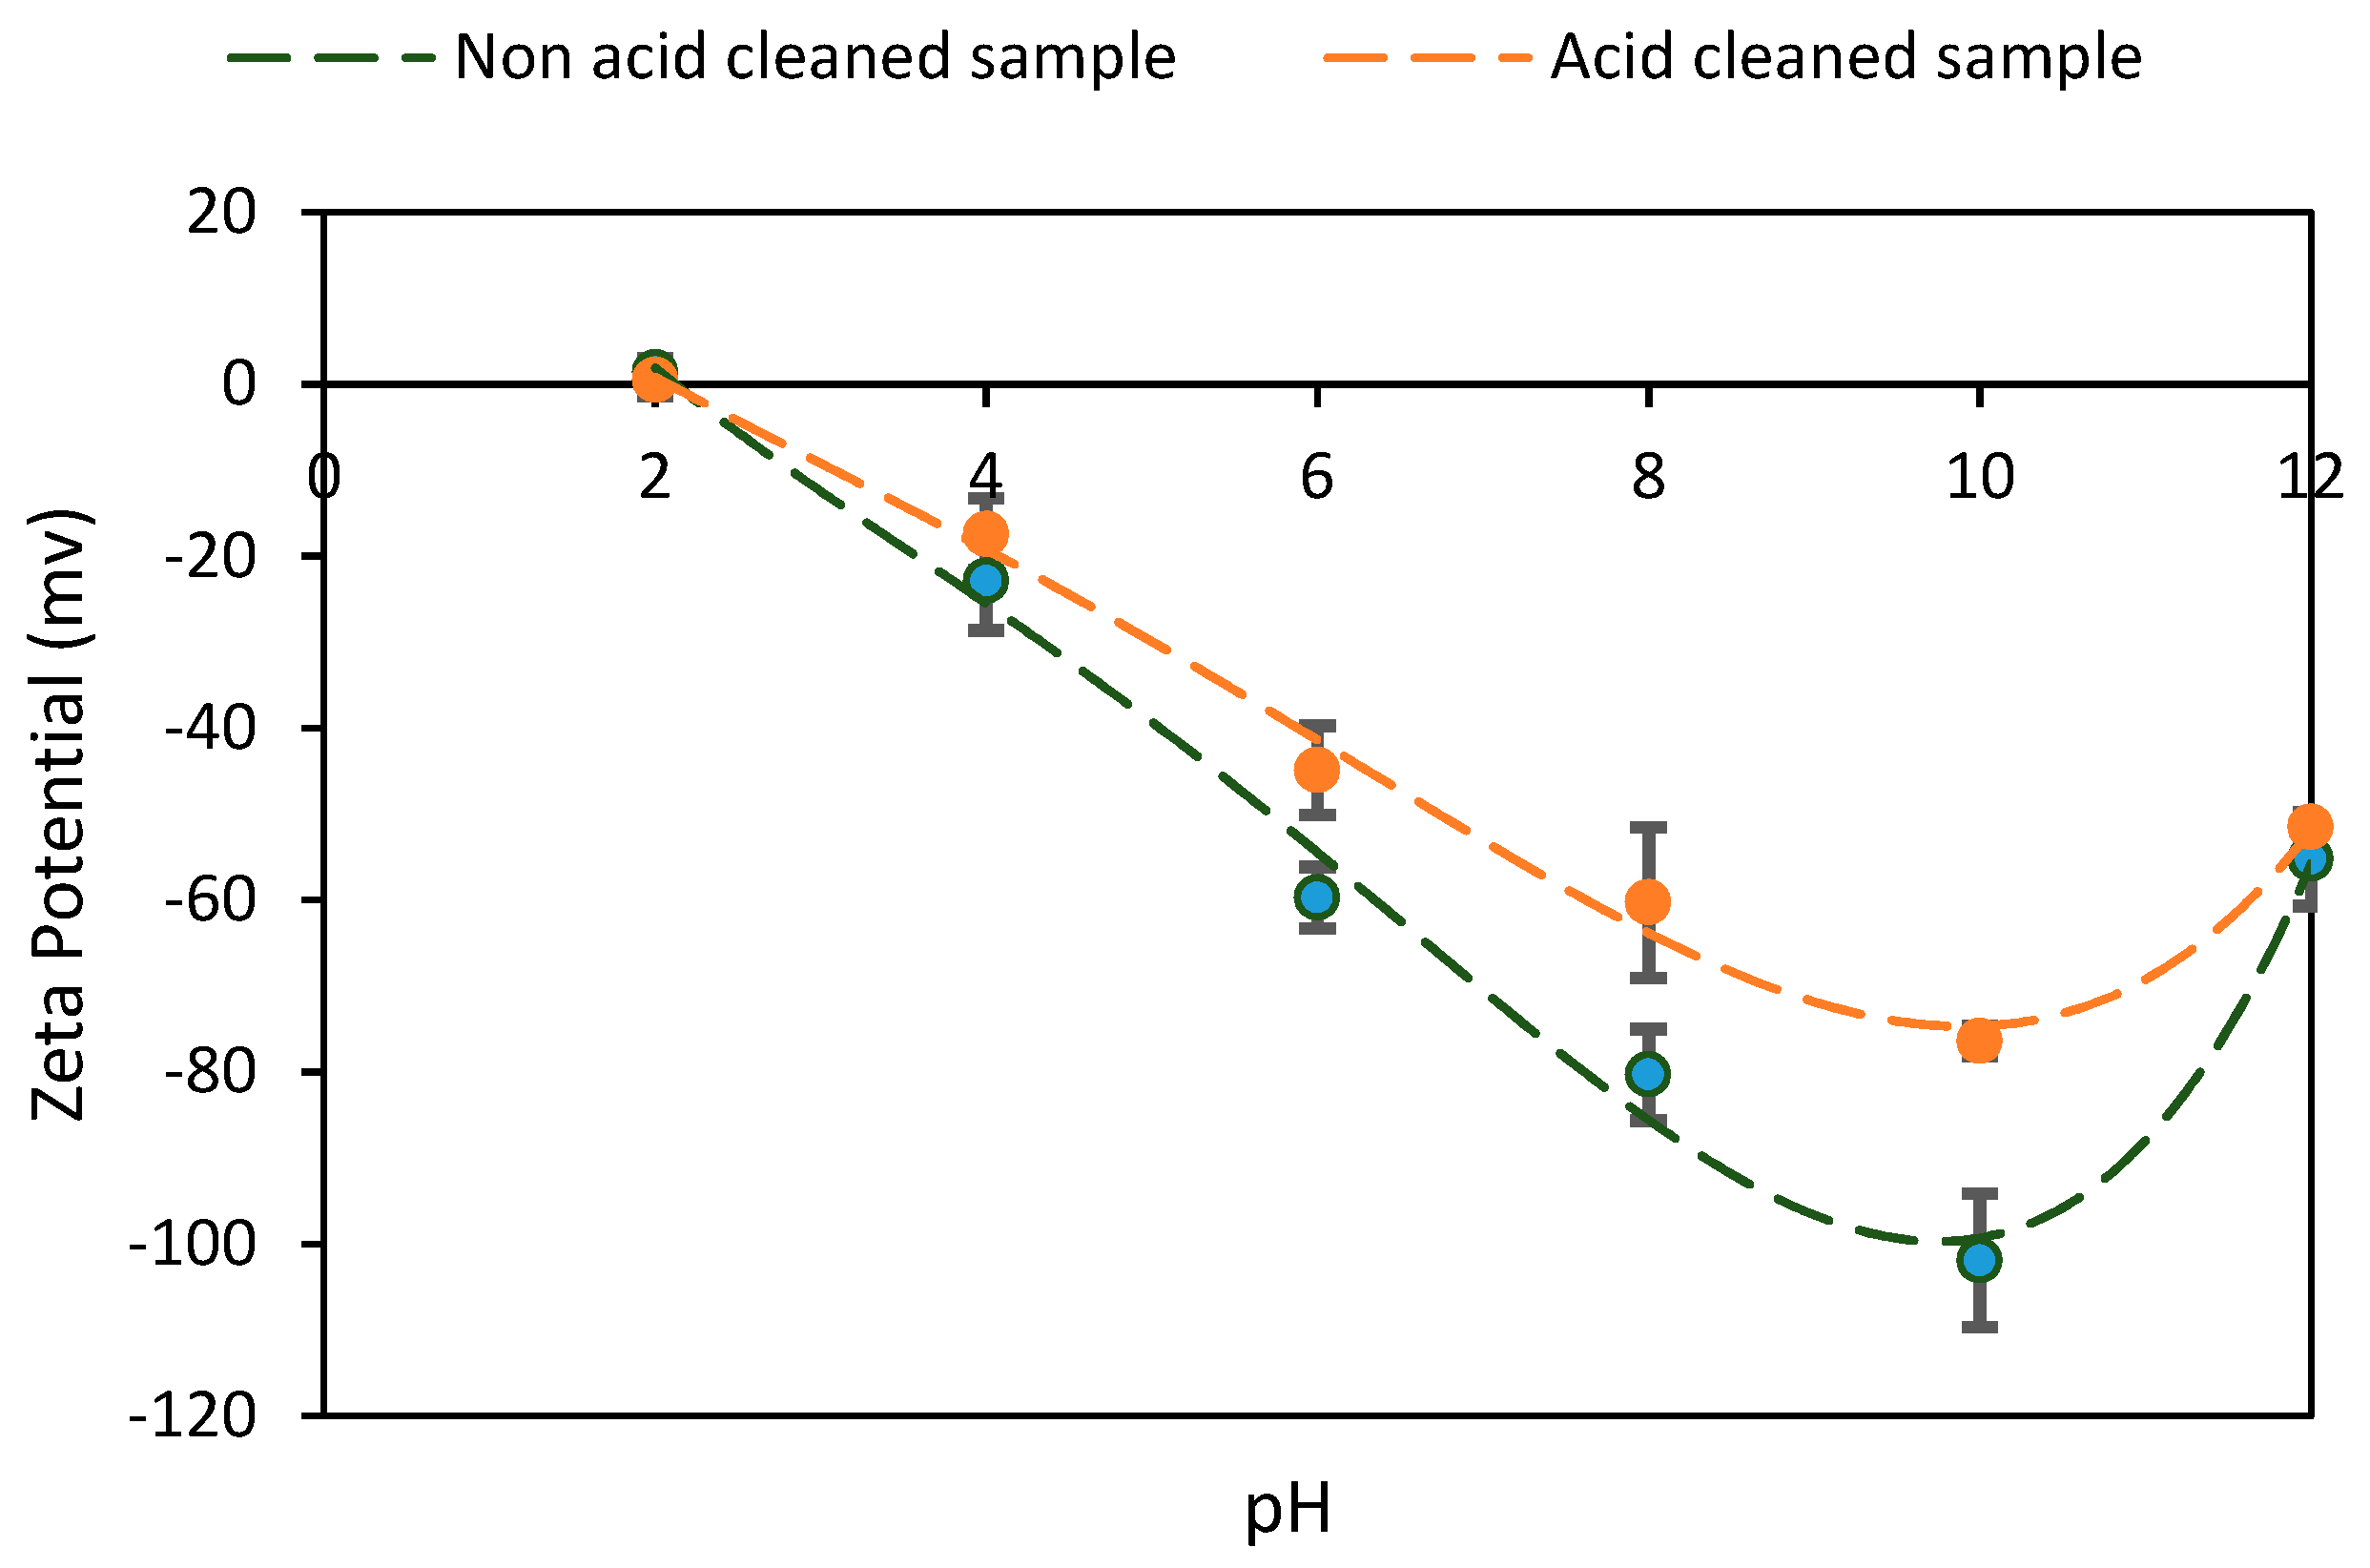
As shown in
Figure 3, the isoelectric point (i.e.p.) of spodumene is at approximately pH 2, which is in agreement with the previously reported data (e.g., Xu et al. [
10]). The zeta potential becomes more negative as the pH increases up to pH 10, at which point it becomes less negative (
Figure 2). This is similar to the flotation recovery results seen at different pH levels. In fact, the maximum flotation recovery was obtained at pH 10, when spodumene is highly negatively charged. At this pH, the spodumene surface is capable of the maximum number of interactions with the positively charged sites. It should be noted that the zeta potential of the cleaned spodumene surface is different from that of the non-cleaned surface (
Figure 3). Therefore, contaminants can affect the surface charge of spodumene and, consequently, its interactions with other reagents. It is therefore necessary to clean the spodumene surface before flotation. The zeta potential data for the acid-cleaned sample are similar to those reported in the literature (e.g., Xu et al. [
13]).
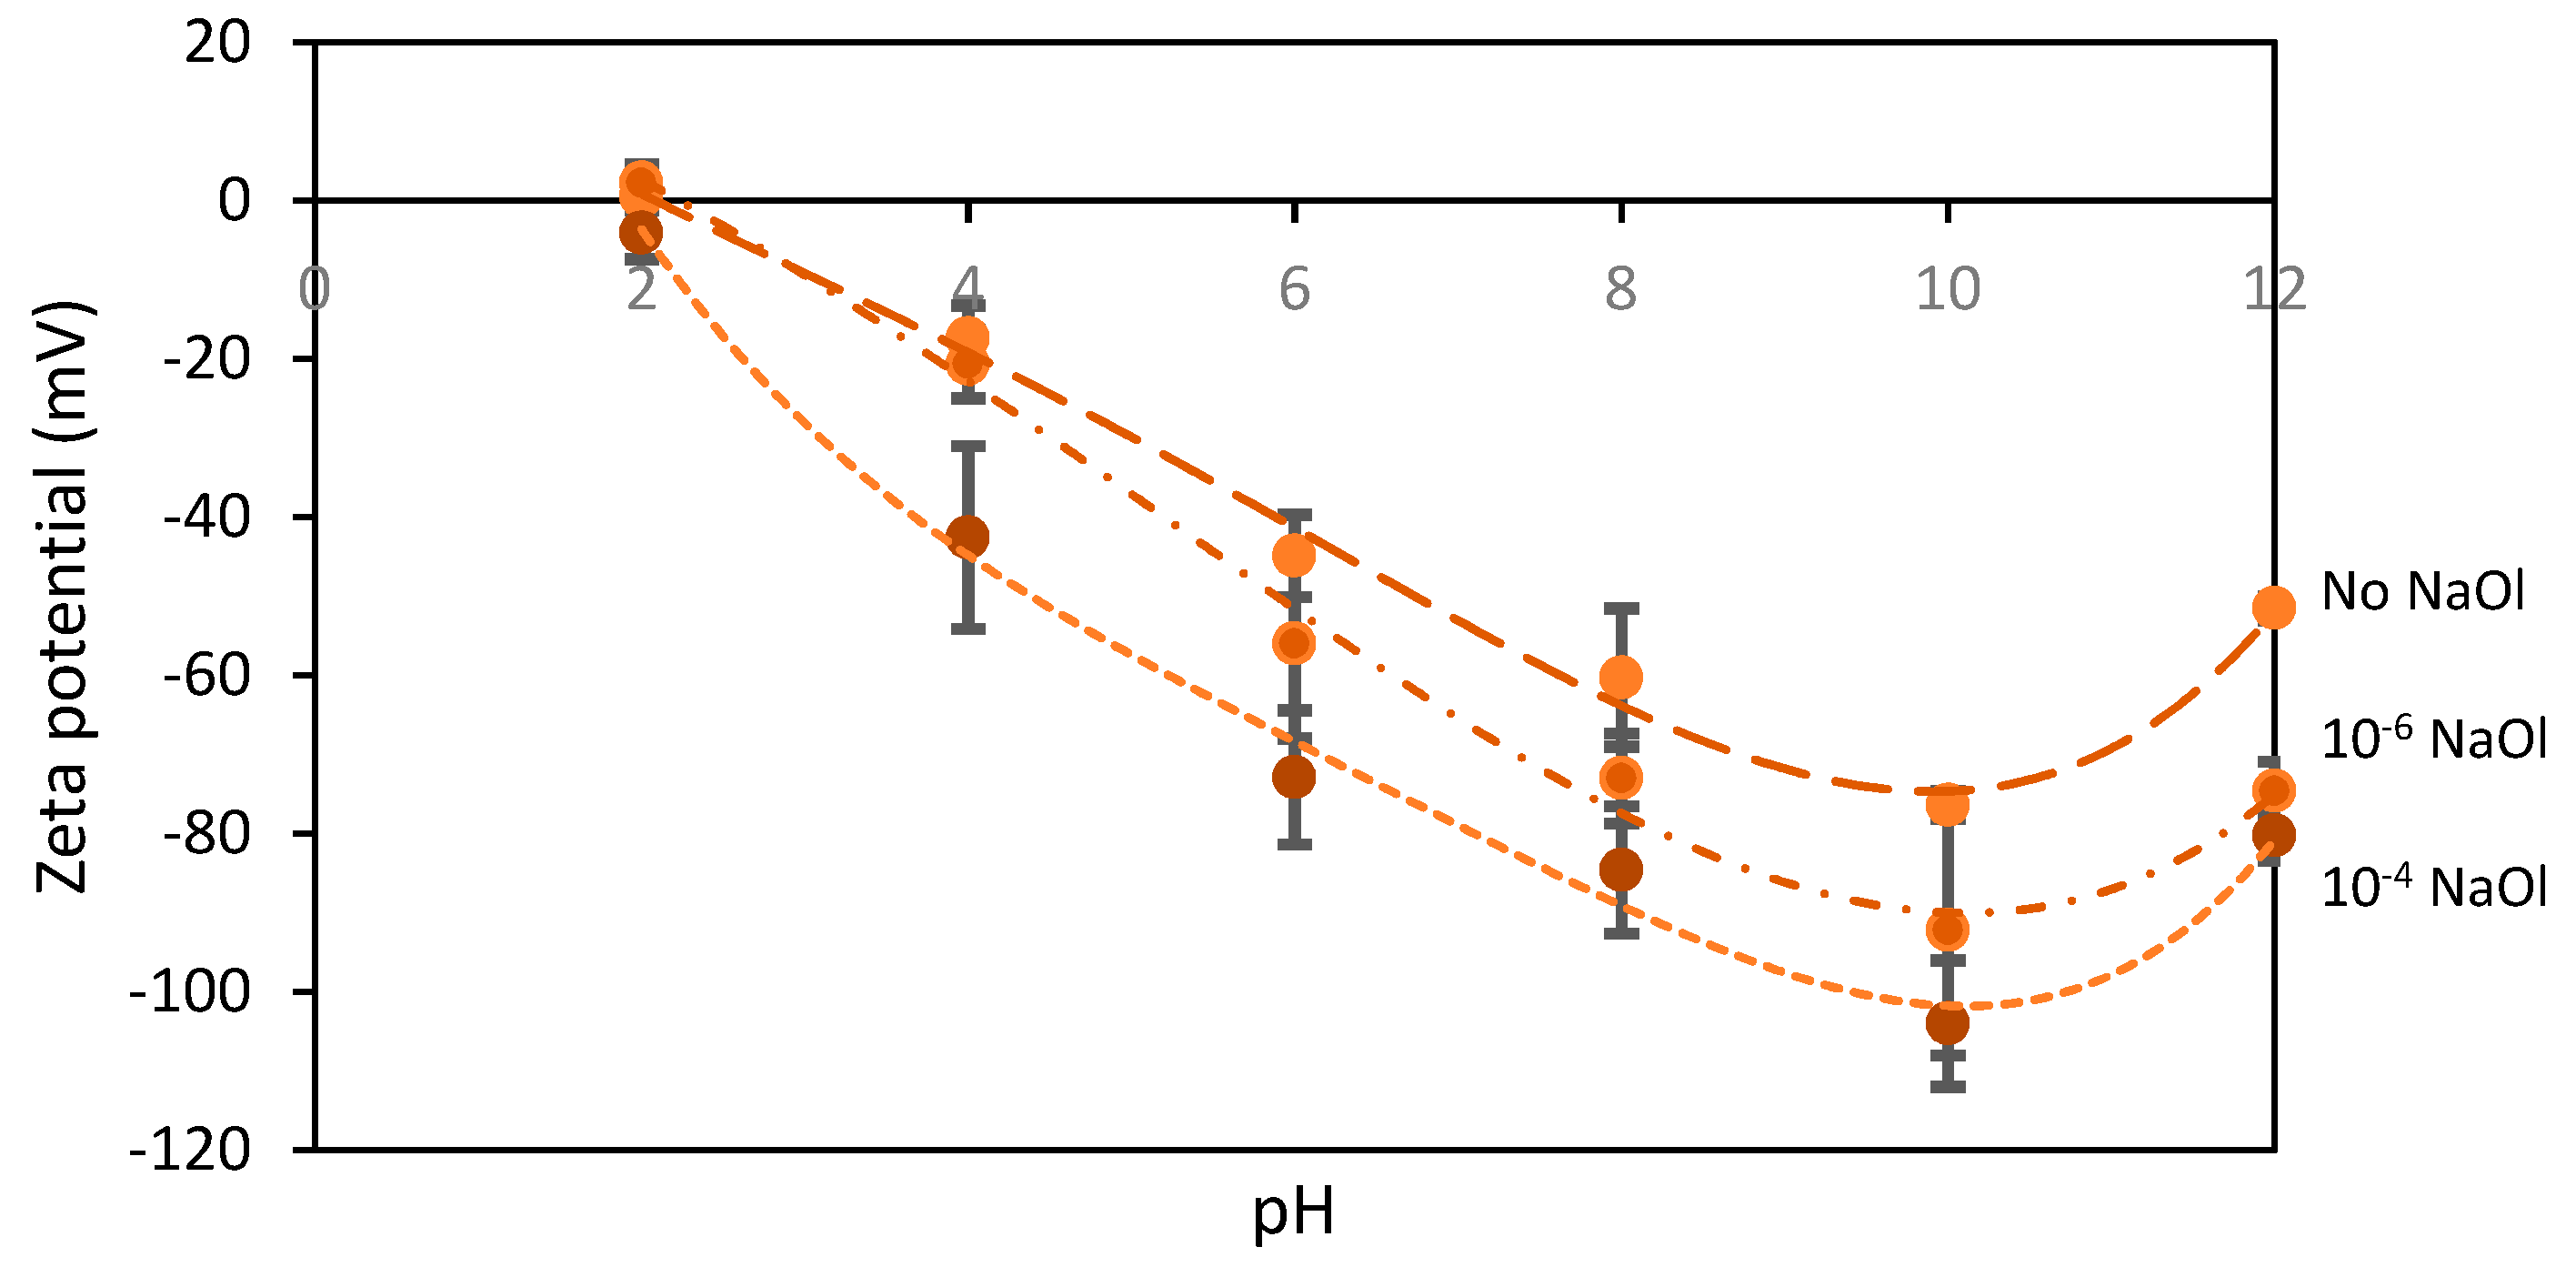
When the collector (i.e., NaOl) is added, the zeta potential of spodumene becomes more negative over a wide pH range (
Figure 4), demonstrating that collector adsorption indeed occurs. The zeta potential of the spodumene particles becomes even more negative when the dosage of NaOl increases (
Figure 4). The ion-molecule complexes react with the exposed Al sites on the spodumene surface, reducing the positive charge on the spodumene surface and therefore decreasing the zeta potential.
Based on the initial results, the highest recovery for spodumene flotation is still less than 70% (
Figure 2). The flotation recovery may be improved by adding an activator. Common activators for spodumene flotation are metallic ions (e.g., Fe
3+ or Ca
2+) [
14].
Figure 5 shows that by activating spodumene using calcium ions, the recovery of spodumene is increased significantly to 90%. In addition, while the optimum recovery was initially obtained at approximately pH 10 (
Figure 2), by activating spodumene using calcium ions the recovery peak shifts towards a neutral pH. This makes the process easier to control in industrial practice. In addition, the pH range for the maximum flotation spodumene recovery after activation (i.e., pH of approximately 8) matches well with the values reported by other researchers [
10,
11].
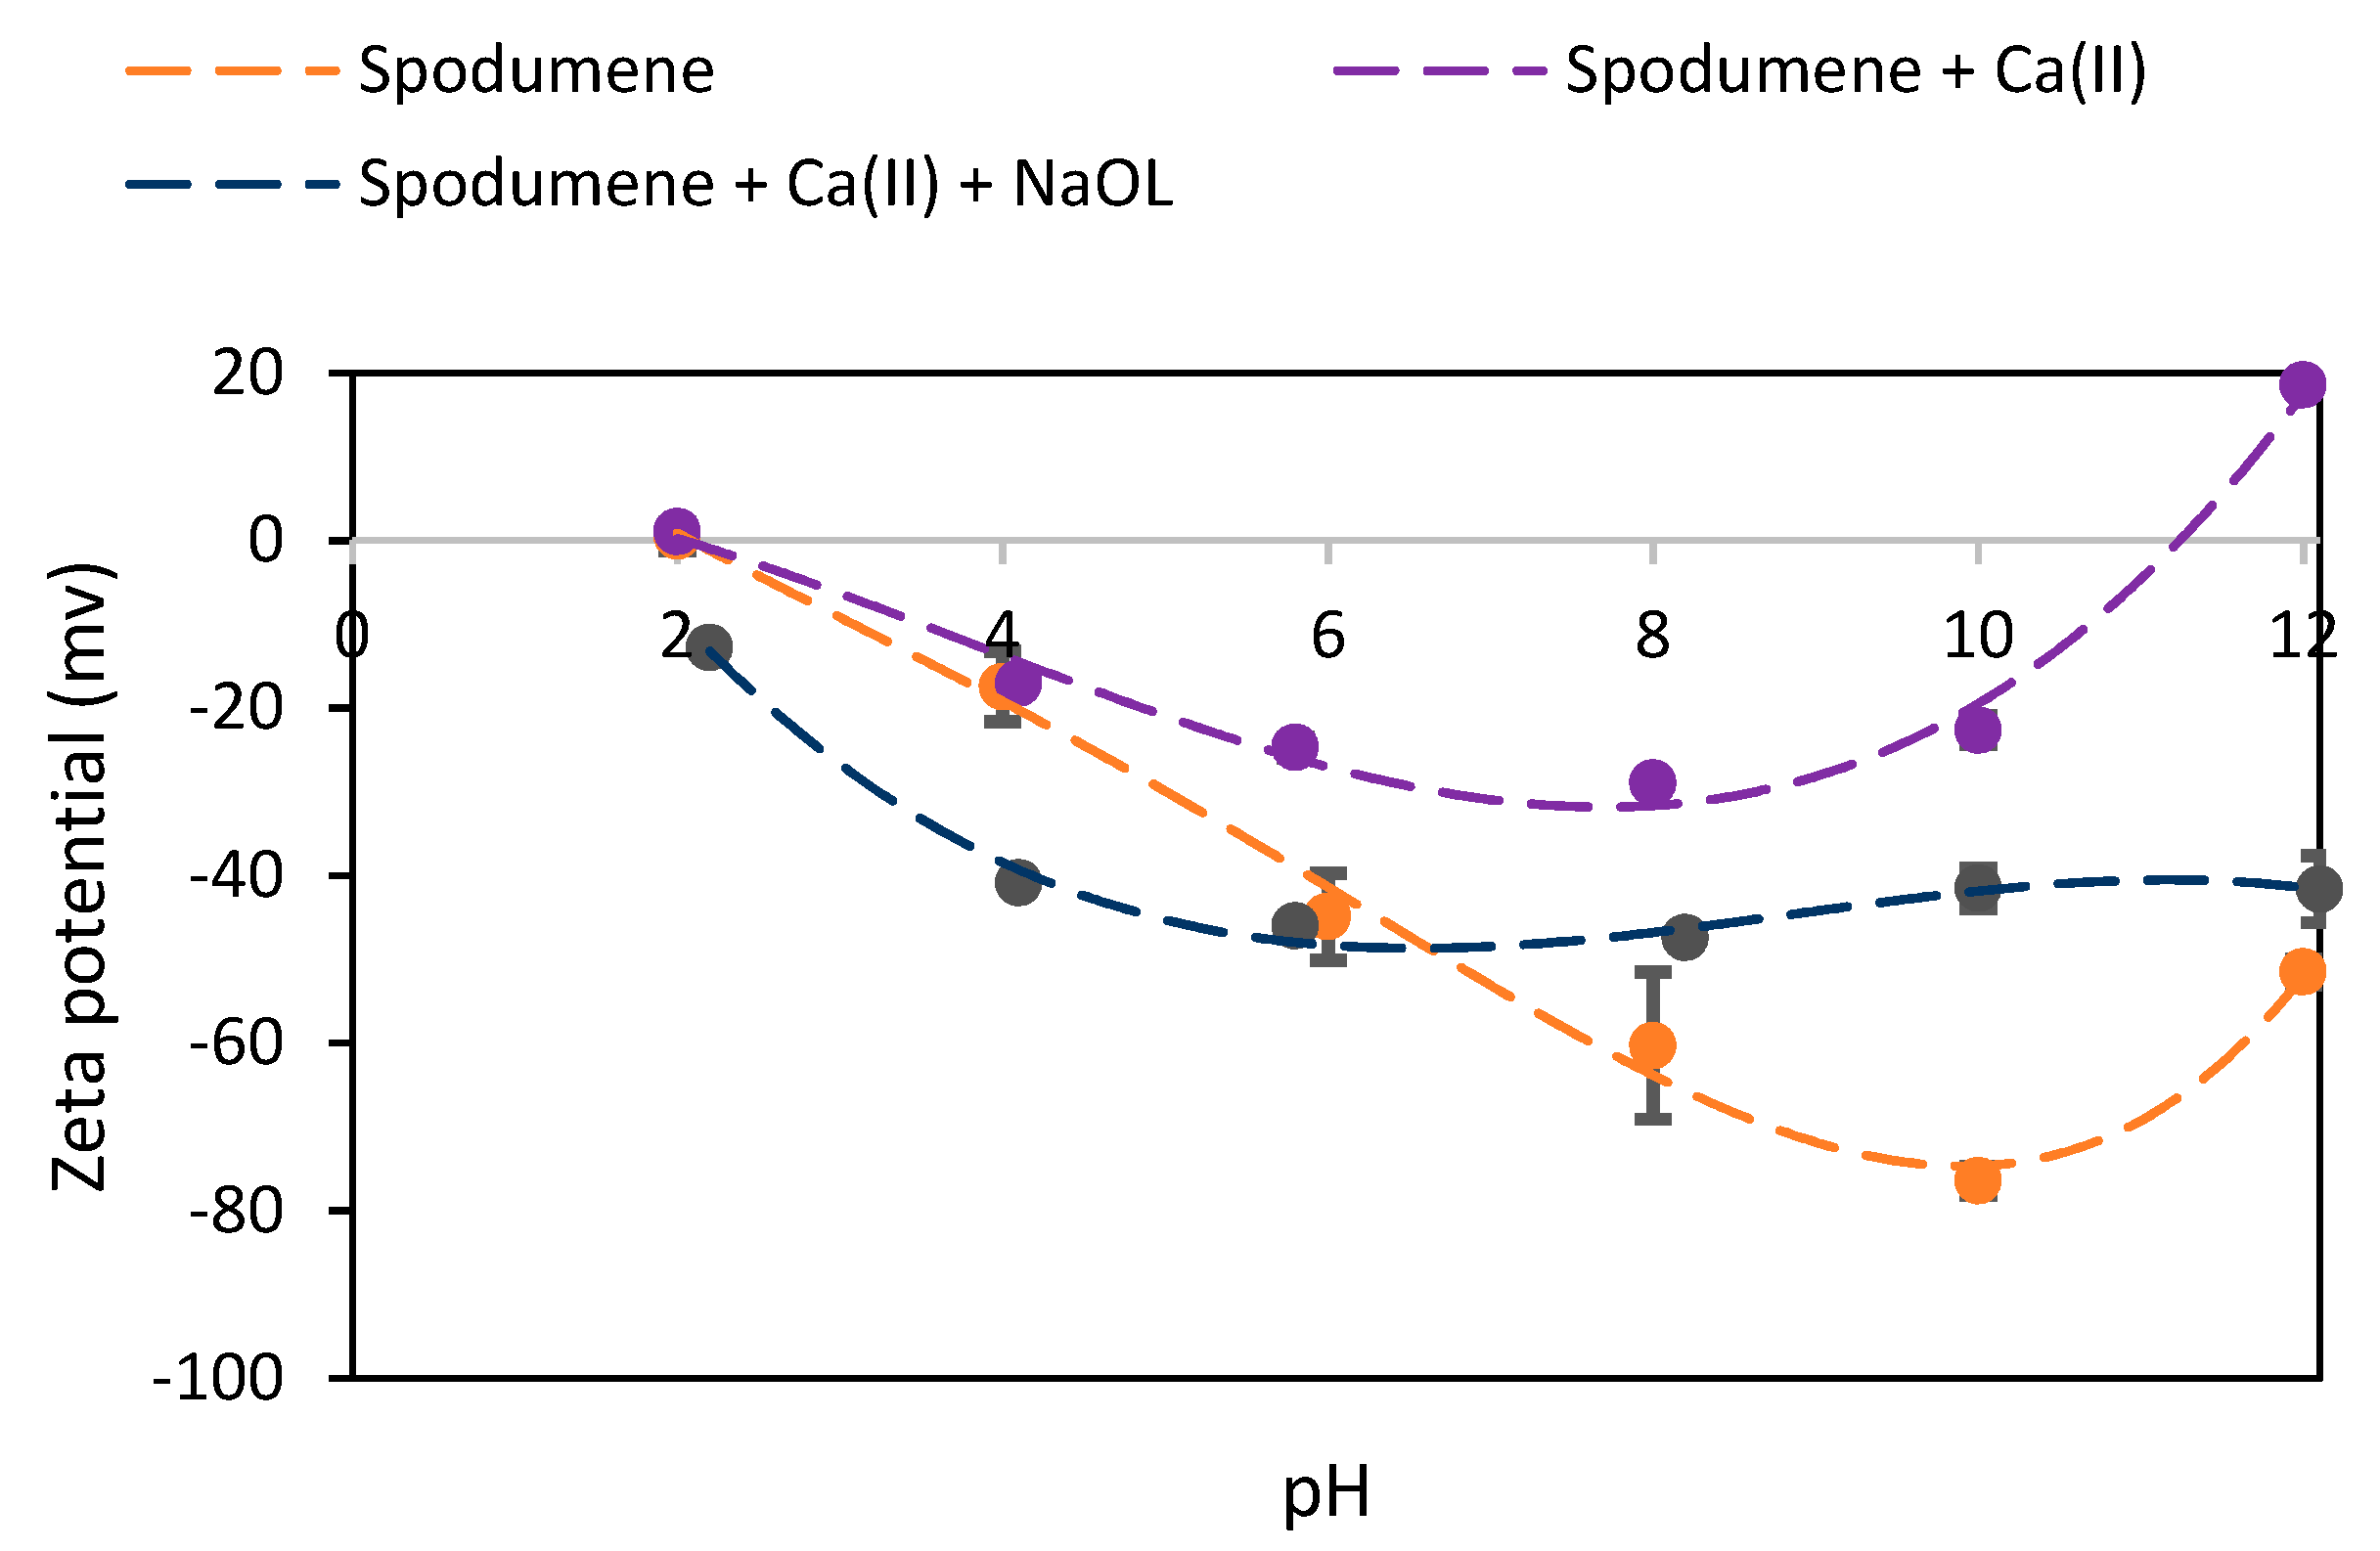
The i.e.p. of spodumene is at approximately pH 2, as discussed, and its surface is negatively charged at pH > 2. After the addition of calcium ions, the zeta potential of the spodumene particles becomes less negative (
Figure 6), indicating the adsorption of Ca
2+ on the negative sites of the spodumene surface due to electrostatic attraction. As stated, when the collector (i.e., NaOl) is added, the zeta potential of spodumene becomes more negative over a wide pH range. The ion-molecule complexes react with the exposed Al sites, reducing the positive charge on the spodumene surface, and therefore shifting the zeta potential to less negative values. Adding Ca
2+ activator followed by NaOl decreases the quantity of negative charge on the surface and results in a reduction in the electrostatic repulsion between the collector and Al sites and an increase in the interaction efficiency, which can improve the flotation of spodumene. Ca
2+ adsorbs on the negative SiO
− site of the silica tetrahedrons, and thus increases the density of available adsorption sites. Moreover, Ca
2+ can adsorb on the other planes of spodumene, allowing for denser adsorption layer formation.
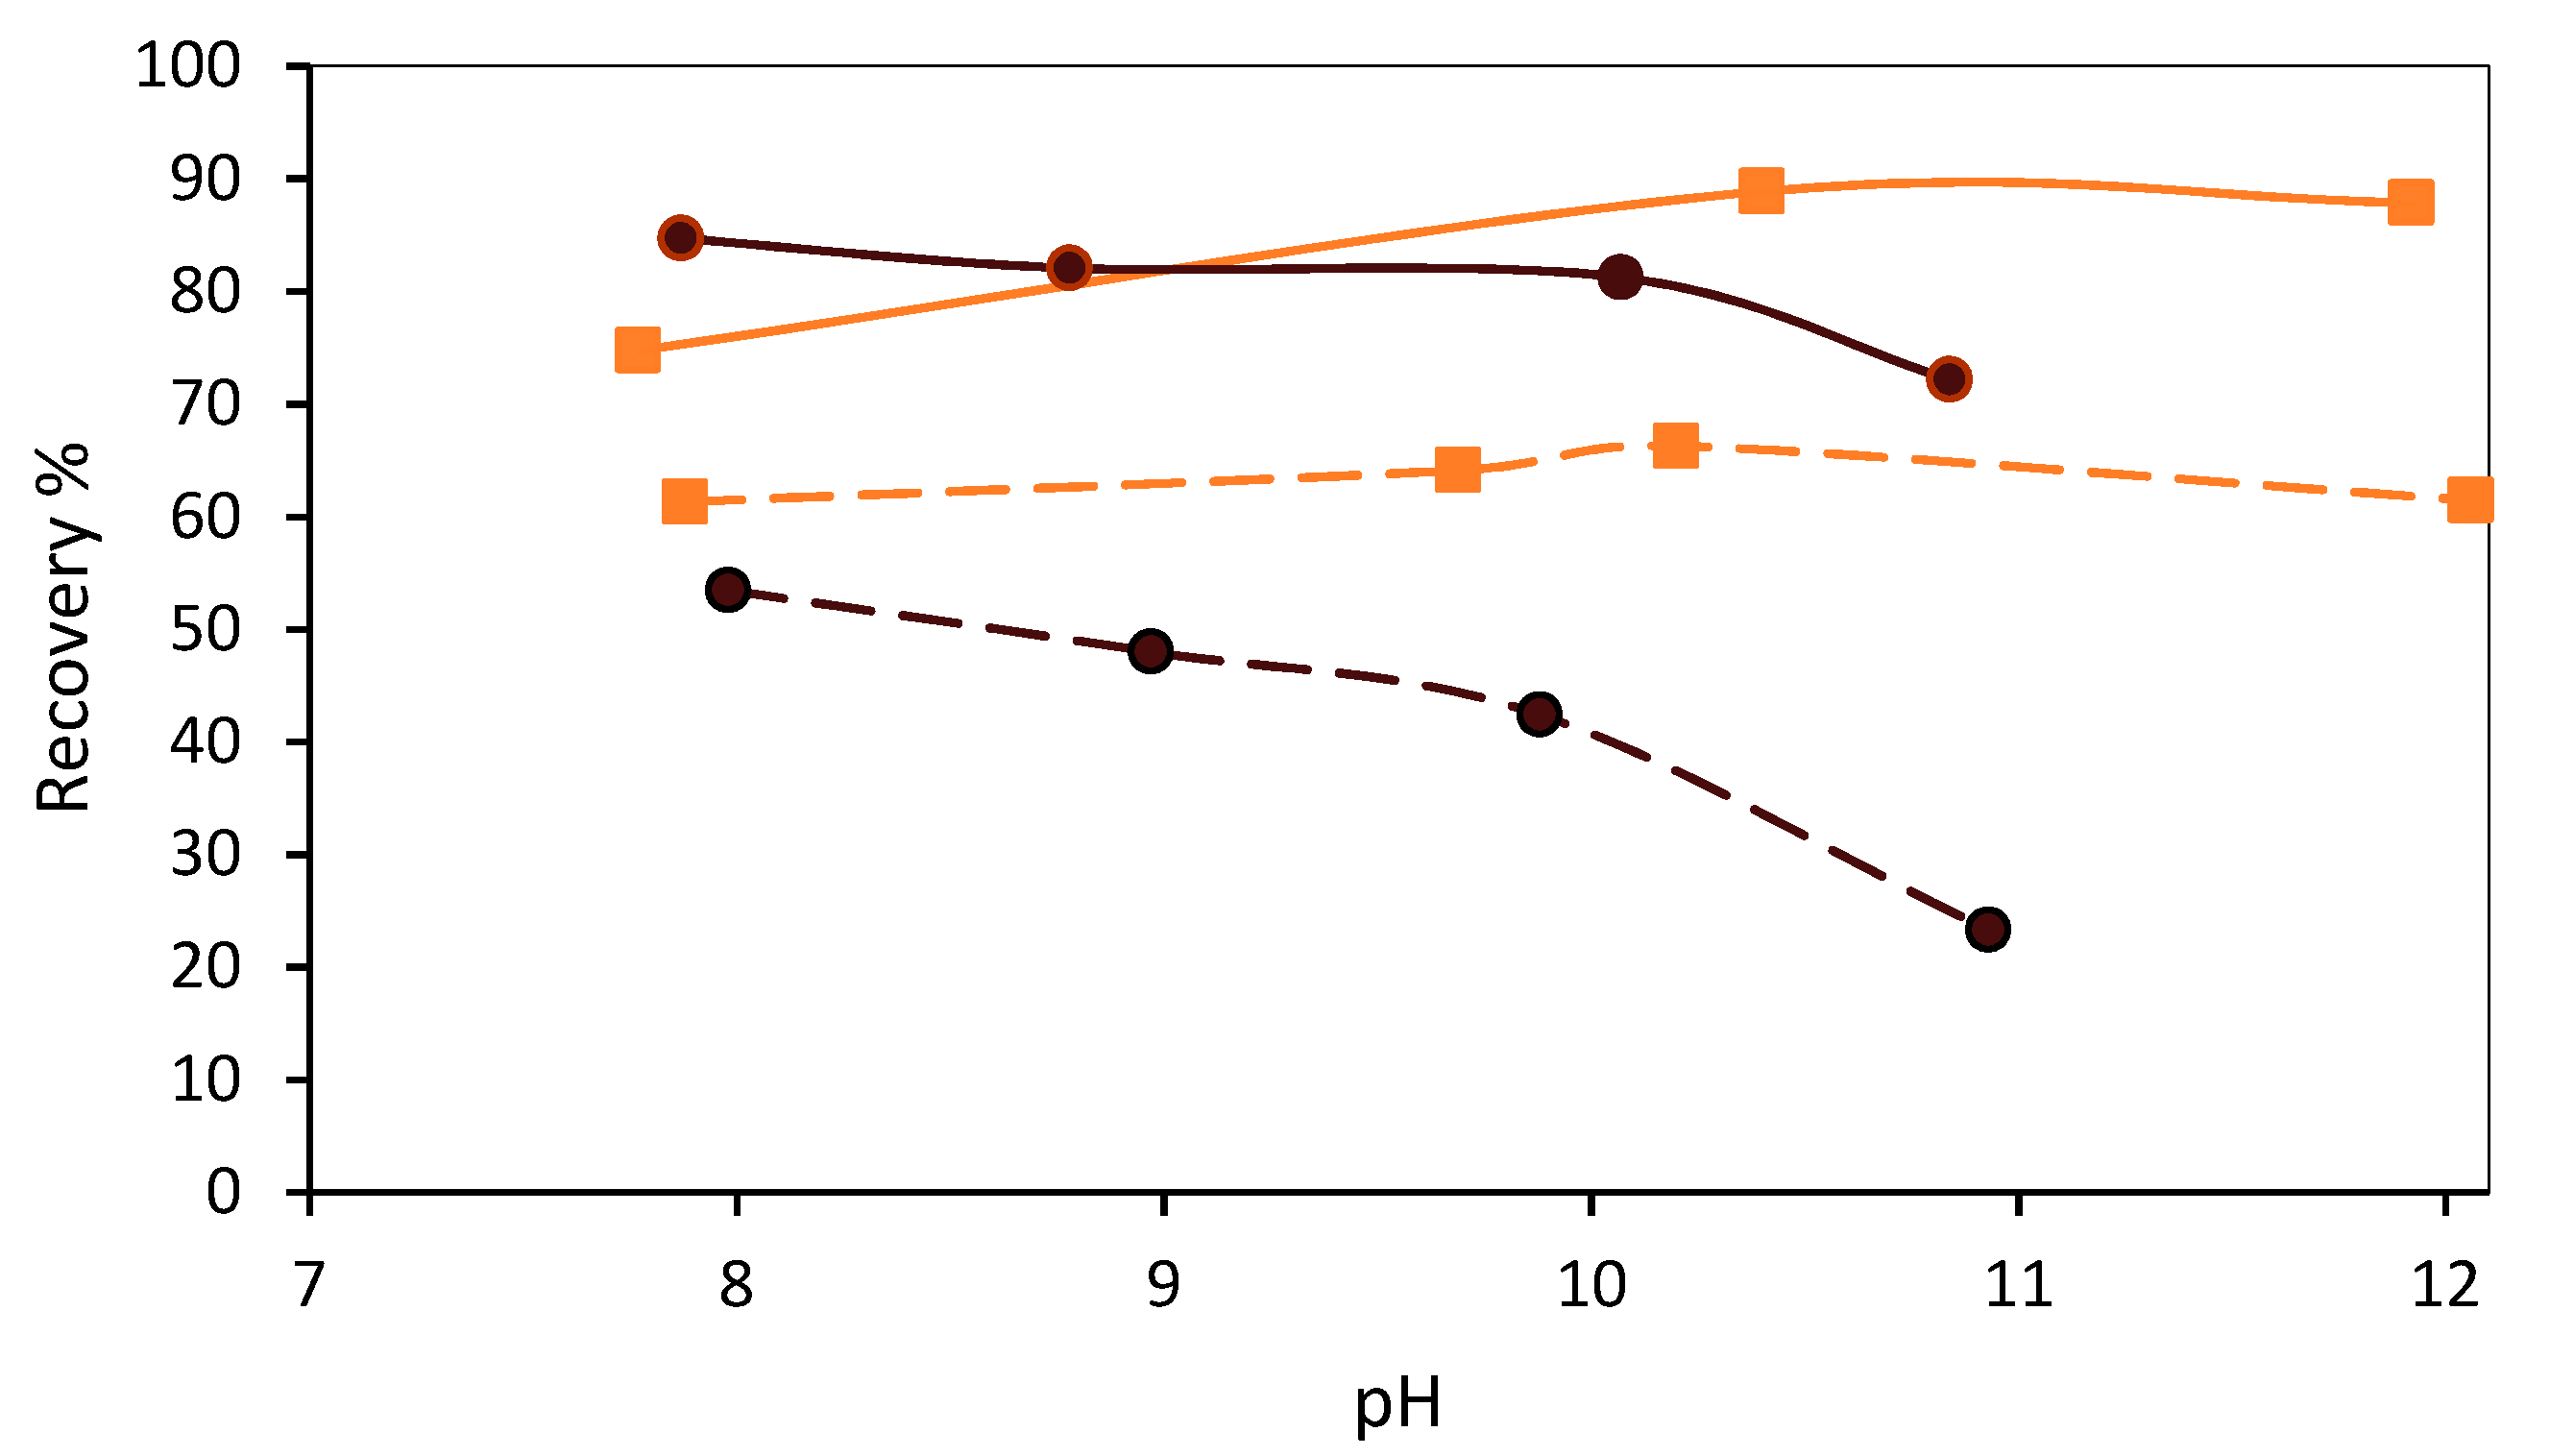
It is evident that the pulp pH plays a very important role in spodumene flotation. The main regulators used in spodumene flotation are generally NaOH and Na
2CO
3. A comparison between the effects of these two pH regulators is shown in
Figure 7. It can be seen that NaOH results in much higher spodumene recovery (than Na
2CO
3) when used to control the pH
, with or without activation. This suggests that NaOH is a more suitable pH regulator in spodumene flotation.
Figure 7 also shows that when Na
2CO
3 is used as a pH regulator, the flotation recovery of the activated spodumene decreases as the pH increases from 8 to 11. Meanwhile, the recovery of non-activated spodumene also drops when the pH increases. This is not the case when NaOH is used, indicating that an increased dosage of Na
2CO
3 has a negative effect on spodumene recovery (dropping from 50% to 20%). On the other hand, activated spodumene has a much higher recovery than the non-activated sample when either NaOH or Na
2CO
3 is used. This suggests that CaCl
2 has an activating effect on spodumene in flotation, even if a depressant (i.e., Na
2CO
3 in the current case) is present.
Many metallic ions are the effective components of flotation reagents (activators or depressants). The hydration equilibrium of inorganic ions is the basis for studying flotation. Metal ions in the hydrolysis reaction occurring in solution generate a variety of complexes. The concentration of each component can be obtained according to the solution equilibria:
The solubility of Ca(OH)2 is 3.55 mmol/L and the initial concentration of CaCl2 was 1.08 mmol/L. Therefore, there is no precipitation of Ca(OH)2 over the entire pH range. Chemical analysis of the flotation solution revealed that when CaCl2 is added to the slurry, it is mainly in the form of Ca2+ at pH < 12.5. The concentration of Ca(OH)+ increases with the pH and at pH > 12.5, Ca(OH)2(aqueous) gradually dominates. Therefore, over the pH range of the flotation when the maximum spodumene recovery was obtained, the calcium was predominantly in the form of Ca2+ ions.
A typical structure of spodumene is shown in
Figure 8. Spodumene is composed of a series of single-chain silica tetrahedrons along the y-axis which are bonded together by sharing an oxygen between two neighboring tetrahedrons [
6].
In flotation, the adsorption of the collector is mainly determined by the generation of new surfaces during grinding. For spodumene, the liberated surfaces mainly consist of broken Si–O and Al–O bonds. The lengths of these three bonds vary; the Li–O bond is the longest followed by Al–O and Si–O [
15]. However, the strength of the Li–O bond is not high enough to form a bond, as shown in
Figure 8. The Al–O bonds are longer than the Si–O bonds, so it is easier to break these bonds and expose more Al ions, which causes the adsorption of NaOl. This interaction occurs over a long distance compared to covalent bonding.
The total broken bond strengths per unit cell area were calculated as 9.372 × 10
18, 6.352 × 10
18, 4.734 × 10
18 and 7.524 × 10
18 valence/m
2 for the {100}, {010}, {110} and {001} planes, respectively. The {110} plane is the weakest crystalline plane, indicating that cleavage occurs along the {110} plane during the comminution process. Each crystalline plane has a distinct type and number of Al–O bonds, which leads to variance in the total bond strength. In terms of density of Al sites in the unit cell area, the crystalline planes are ranked in the order of {001} > {110} > {100} > {010}. The Al sites on the surfaces provide a high affinity for oleate molecules through complexation and the broken Al–O bonds are responsible for adsorbing the oleic acid ions [
16]. The {110} plane is still more favorable to chemisorption with oleate than the {001} plane because it has two broken Al–O bonds which provide two unsatisfied coordinates, whereas only one exists in the {001} plane. Therefore, the chemical properties of the surface, such as the surface potential and hydrophobicity, are dominated by the {110} crystalline planes. Recently, Zhu et al. [
8] also reported that the adsorption of sodium oleate on the spodumene mineral occurs at the {100} and {110} surfaces.
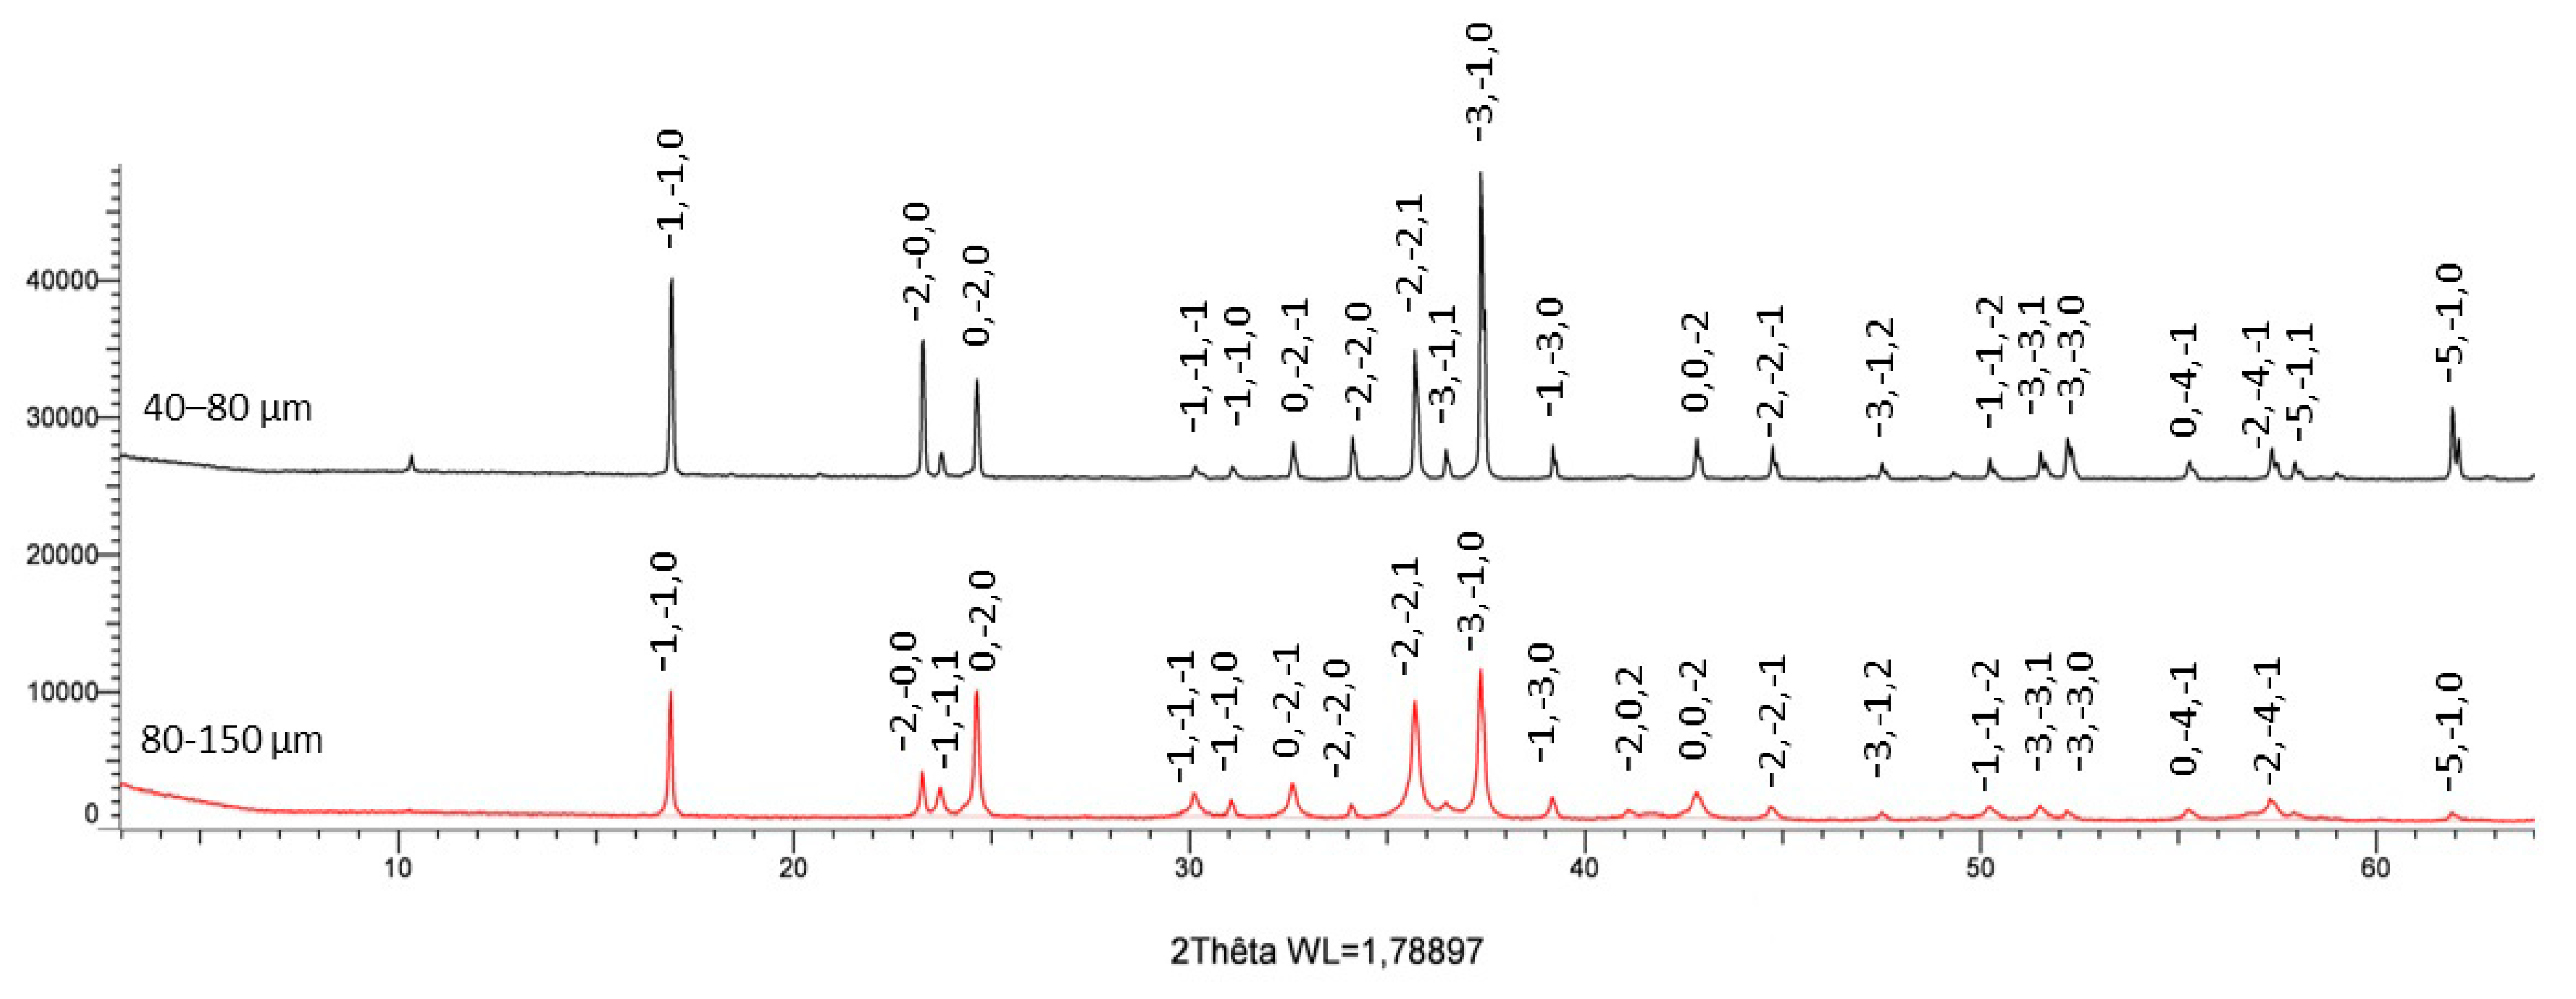
The XRD patterns of the spodumene samples are shown in
Figure 9. The relative intensities of the four crystalline planes ({100}, {010}, {110} and {001}) are listed in
Table 1. It should be noted that the relative intensities only represent the relative amounts of phases in one sample. Therefore, a conversion should be developed in order to compare the same phase between different samples. The ratio of the amount of desired crystalline planes ({110}) to the amount of the three undesired crystalline planes ({100}, {010} and {001}) defines the relative quantity of desired planes in each fraction. Higher values of this ratio indicate the presence of more {110} planes, more exposed Al sites and more collectors adsorbed on the surface (in the current case, this ratio is higher for the 40–80 µm fraction than the 80–150 µm fraction). This indicates that the 40–80 µm fraction is preferable for collector adsorption.
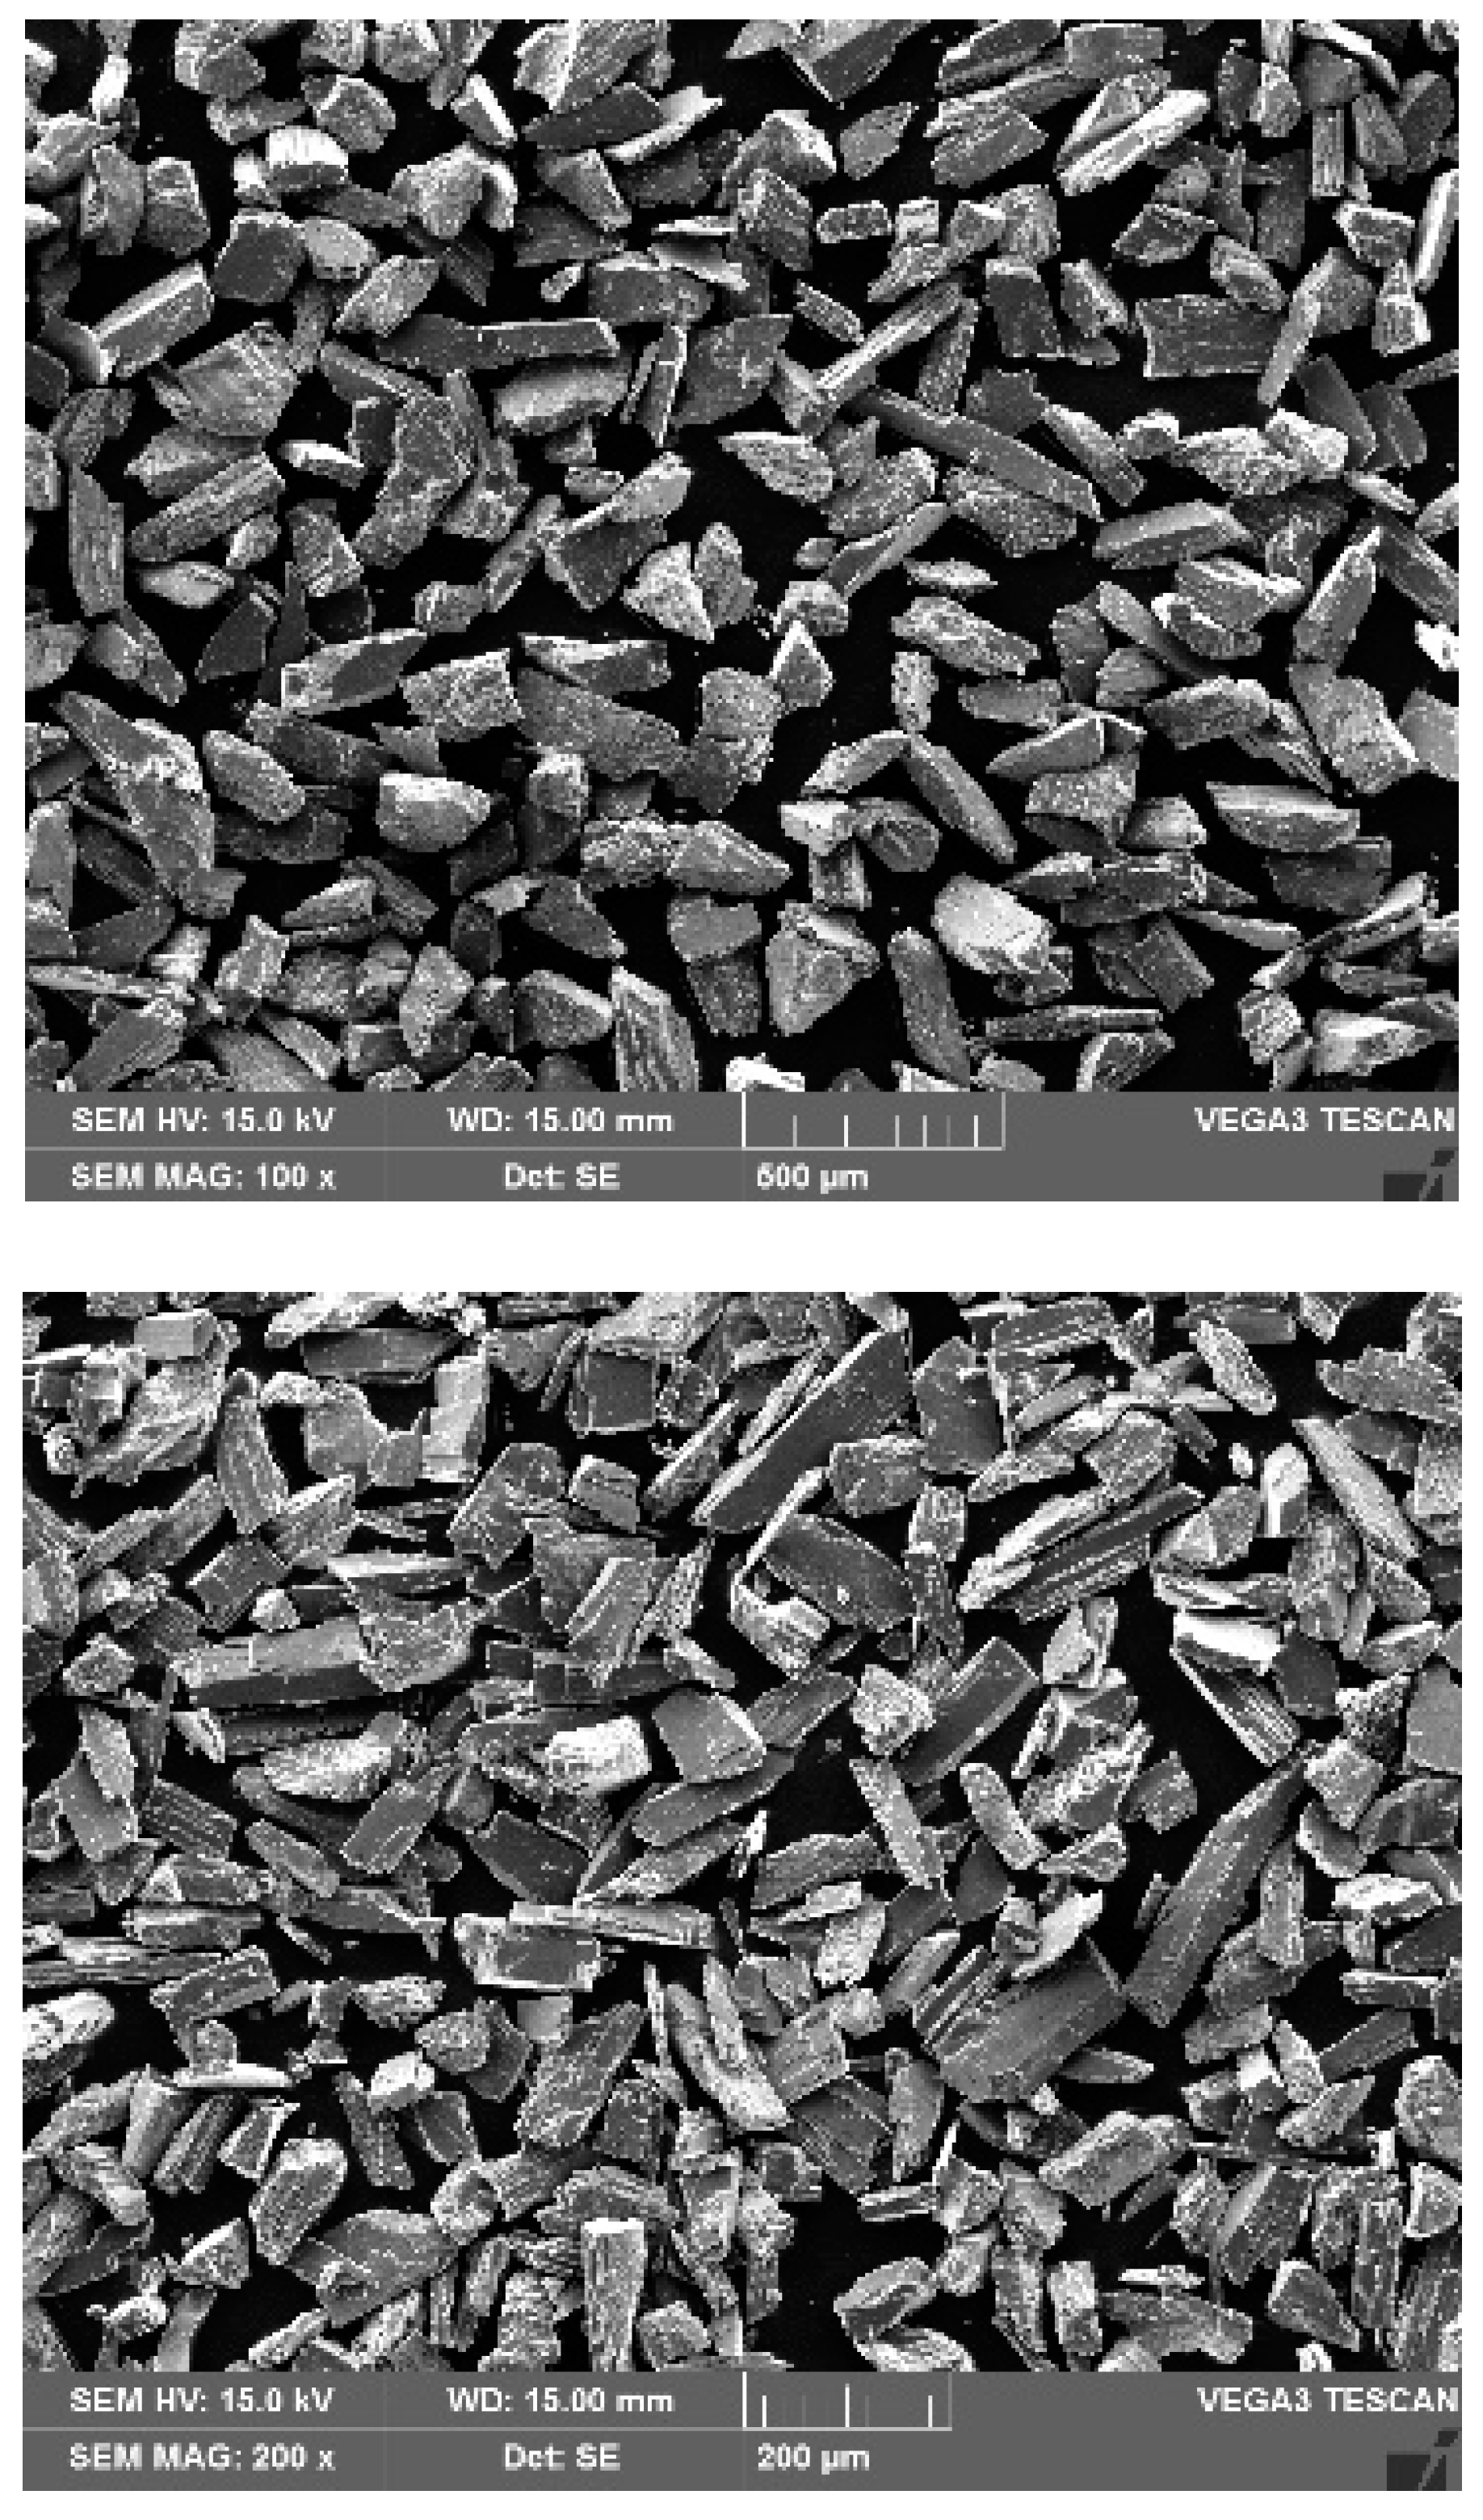
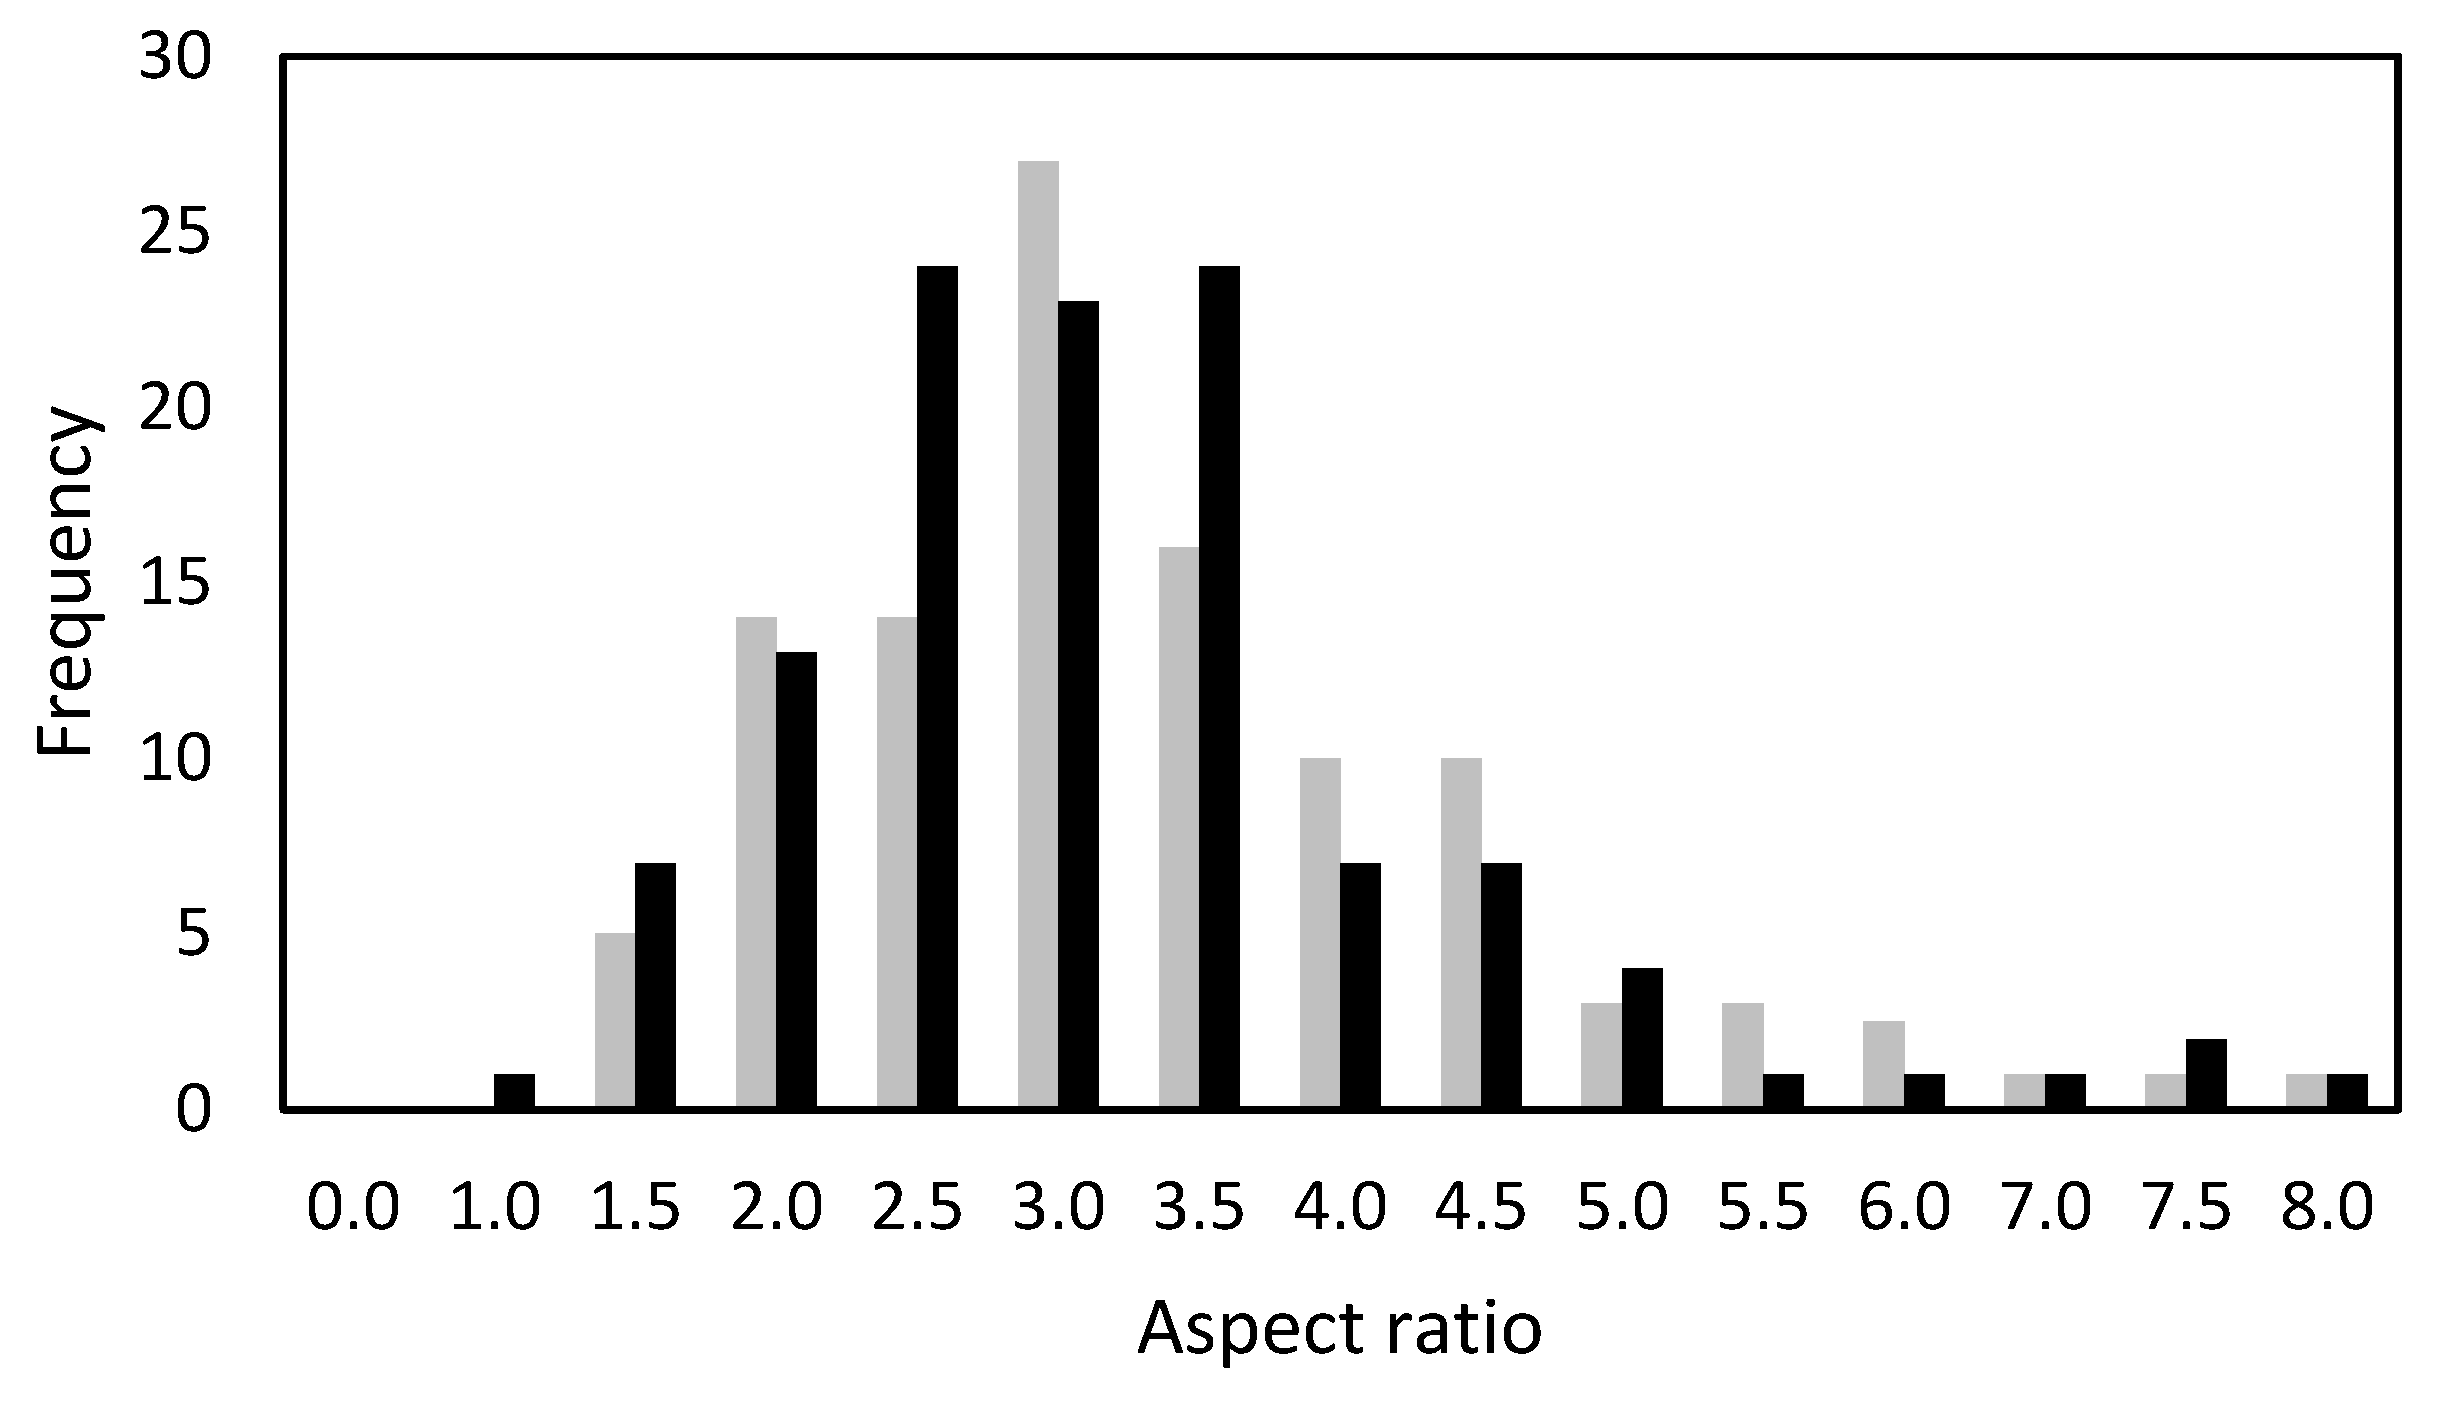
Figure 10 shows that {110} is the main cleavage plane of spodumene. A total of one hundred {110} planes were randomly selected in the images and their aspect ratios were calculated using ImageJ software. The histograms of the aspect ratios presented in
Figure 11 show that the {110} planes from the 40–80 µm fraction exhibit a smaller aspect ratio than those in the coarse fraction. This is in agreement with the results reported by Xu et al. [
10], who proposed a grinding method for spodumene that results in various particle sizes. Spodumene is a very anisotropic mineral. Due to the high tendency of spodumene to generate a cleavage plane, the monoclinic structure consists of the {110} planes as the side plane and the {001} planes as the basal plane [
6]. When the particles are slightly crushed, the {110} planes are the most likely to break, so the quantity as well as the relative surface area of the {110} planes increase more quickly than those of the {001} planes. The quantity of {001} planes starts to increase as the particle size decreases (
Table 1). The higher {001} planes adsorb less NaOl, which could be responsible for the decreased floatability of the coarser fraction (
Figure 2). It should be noted that the very fine fraction (less than 40 µm) was not considered in this work due to the complexity which may arise due to entrainment.
4. Conclusions
The optimum pH for spodumene flotation was found to be approximately 10, and the optimum dosage of sodium oleate was found to be 250 mg/L. After the addition of CaCl2, spodumene flotation recovery increased considerably to 90%. The effects of pH regulators were also investigated and it was found that spodumene had poor floatability when Na2CO3 was used as a pH regulator compared to NaOH.
The i.e.p. of spodumene shifted to a lower pH when NaOl was added, which confirmed the adsorption of oleate to the mineral surface. Activating spodumene with calcium ions makes the mineral surface charge less negative due to the adsorption of Ca2+ on the surface.
To understand the flotation mechanism of spodumene, its crystallographic properties were analyzed. The adsorption of NaOl was attributed to the chemisorption of oleate to the exposed Al and Si sites, which were generated after breaking the Al–O and Si–O bonds on the mineral surface. Through the calculation of the strength of the broken bonds on the spodumene surface, it was found that the {110} planes are the most favorable for the adsorption of oleate. The {110} plane is the weakest plane and spodumene has the highest tendency to cleave along the {110} plane. The XRD patterns of spodumene revealed that the 40–80 µm fraction has more {001} planes than the 80–150 µm fraction, which may explain why the former has better floatability.
The results obtained in this work suggest that the comminution process (e.g., crushing and grinding) can affect the floatability of spodumene by changing its crystallography. Therefore, further investigations into more suitable grinding methods which could increase the floatability of spodumene are required.


