A New Plagioclase-Liquid Hygrometer Specific to Trachytic Systems


1
Dipartimento di Scienze della Terra, Università di Pisa, Via Santa Maria 53, 56126 Pisa, Italy
2
Dipartimento di Scienze della Terra, Sapienza–Università di Roma, P.le Aldo Moro 5, 00185 Rome, Italy
*
Author to whom correspondence should be addressed.
Minerals 2019, 9(6), 375; https://doi.org/10.3390/min9060375
Submission received: 13 May 2019
/
Revised: 10 June 2019
/
Accepted: 20 June 2019
/
Published: 22 June 2019
(This article belongs to the Special Issue Magma Plumbing Systems)
Abstract
:We present a new empirical plagioclase-liquid hygrometer for estimating the amount of H2O dissolved in trachytic magmas. The hygrometer is based on the exchange reaction of anorthite between plagioclase and liquid, and is calibrated using crystallization experiments where the concentration of H2O in quenched glasses has been accurately determined based on Fourier Transform Infrared Spectroscopy (FTIR) analysis. The multiple linear regression of plagioclase-liquid cation fractions and components from experimental data obtained at 150–202 MPa, 850–1020 °C, 1.17–7.57 wt. % H2O and ΔNNO + 2.5 buffer, yields to a highly accurate model with uncertainty of only ±0.29 wt. % H2O. The model reliability has been demonstrated using an independent test data set consisting of crystallization experiments from the literature and thermodynamically derived compositions. The fairly good convergence between our model calibration and the test data set excludes systematic H2O overestimates or underestimates caused by miscalibration and data overfitting. The plagioclase-liquid hygrometer from this study has been applied to trachyandesitic (latitic) and trachytic products erupted over the last 1000 years at the La Fossa cone of Vulcano Island (Aeolian Islands, Southern Italy). Results from calculations indicate that the concentration of H2O in the latitic and trachytic melts is comprised between ~2.5 and ~3.5 wt. %. These values are in good agreement with data from melt inclusions and, overall, testify to low-pressure, open-system differentiation of trachytic magmas under strong degassing conditions.
1. Introduction
Volatiles in magmas exert a great influence on the physicochemical properties of silicate melts and, ultimately, on the eruptive style of active volcanoes [1,2,3]. Among the volatile species dissolved in silicate magmas, H2O is the most abundant and effective parameter in modifying phase equilibria and rheological properties [4,5,6]. For this reason, modelling of H2O solubility and speciation has been the main focus of experimental and theoretical works [7,8,9,10,11]. In turn, determining the concentration of H2O dissolved in differentiated magmas is extremely important for volcanic hazard assessment, especially for the efficiency of volcanic eruptions controlled by H2O exsolution in shallow magma reservoirs [12,13,14].
Among the typical magmatic minerals, plagioclase is the most common constituent of low-pressure phase assemblages and one of the most sensitive (in terms of stability and chemical composition) to H2O changes in the crystallizing system [15]. Therefore, a variety of empirical and semi-empirical hygrometers has been calibrated through the application of feldspar-liquid exchange reactions, mostly referring to the partitioning of albite (NaAlSi3O8) and anorthite (CaAl2Si2O8) components [15,16,17,18,19,20,21]. Although the calibration error of these models is generally low (±1.1, ±0.32, ±0.35 and ±0.53 wt. % H2O for [16], [17], [18] and [19], respectively), there are several important limitations that may reduce their predictive power (cf. [19]), such as: (1) the use of H2O contents from a wide spectrum of glass compositions that, most of the time, are measured with inaccurate (or indirect) analytical methods, (2) the paucity of experimental data referring to H2O concentrations intermediate between anhydrous and fluid-present conditions and (3) the application of previous hygrometric models to compositions under-represented in their calibration data sets.
In this study, we propose a new empirical plagioclase-liquid hygrometer specific to trachytic magmas, calibrated using a refined data set consisting of phase equilibria experiments, performed both at H2O-saturated and H2O-undersaturated conditions, where the concentration of H2O dissolved in the melt has been accurately measured by Fourier Transform Infrared Spectroscopy (FTIR) analysis. The use of a restricted and well-characterized calibration data set allows to significantly reduce the uncertainty of the model and error propagation effects caused by inaccurate H2O estimates. It is worth stressing that most of the experimental works used for the calibration of previous models do not provide direct H2O measurements and, consequently, the concentration of H2O is estimated by alternative and less precise methods (cf. [15,16,17,18,19] and [22]), such as: (i) the difference from an electron microprobe analysis of quenched glasses (i.e., H2O = 100 – glass wt. % total, as reported in [23,24]), (ii) the application of solubility models to pure-H2O fluid saturated experiments, and (iii) the assumption that H2O concentration equals the amount of volatile added to the experimental charge. Therefore, for the purpose of this study, new crystallization experiments were conducted under H2O-undersaturated conditions at 150 MPa, 1000–1020 °C, 1.17–3.73 wt. % H2O and ΔNNO + 2.5 buffer, using as starting composition a trachytic lava erupted at Vulcano Island (Aeolian Islands, Southern Italy). This experimental data set has been integrated with further experiments on a trachyandesitic melt composition from Masotta and Keppler [25], performed under H2O-saturated conditions at 170–202 MPa, 850–950 °C and H2O ranging from 5.12 to 7.57 wt. %. For all these experiments, the concentration of H2O in the melt was either directly measured by FTIR analysis or estimated by a FTIR-based calibration of the difference from electron microprobe analysis of quenched glasses (cf. [25]). Through multiple regression analysis of plagioclase and melt components, we have derived a new hygrometer specific to trachytic magmas that is more accurate than previous models. The hygrometer has been tested with both experimental and thermodynamically derived melt compositions, providing the best predictions for H2O concentrations at temperatures ranging from 850 to 1050 °C. The hygrometer has been also employed to trachyandesitic (latitic) and trachytic products erupted at the La Fossa cone of Vulcano Island. The obtained H2O estimates are consistent with the crystallization conditions inferred for the shallow plumbing system of the La Fossa volcano, by means of gas geochemistry [26,27], thermobarometry [28,29] and H2O measurements from melt inclusion studies [30,31].
2. Materials and Methods
The starting material used for the crystallization experiments is a trachytic lava from the Palizzi eruptive unit at Vulcano Island (cf. [32]). The crushed rock sample was ground in an agate mortar to obtain a fine powder. The powder was double-melted for 1 h in a Fe-presaturated Pt-crucible at 1 atm, 1600 °C and NNO buffer at the HPHT Laboratory of the Department of Earth Sciences, Sapienza–University of Rome (Rome, Italy). The quenched glass was crushed in the mortar and sieved to the grain size of 20 μm. Eight Au90Pd10 capsules were loaded with about 10 mg of the nominally anhydrous glassy powder plus variable amounts of deionized H2O added by a microsyringe and yielding final H2O contents in the range of 1.17–3.73 wt. % (Table 1). The crystallization experiments were carried out at 150 MPa and 1000–1020 °C using a rapid-quench cold-seal vessel made of TZM (titanium-zirconium-molybdenum) alloy and pressurized with argon. The intrinsic oxygen fugacity of TZM autoclaves is close to the ΔNNO + 2.5 buffer. The run duration was set on 48 h, in order to ensure the achievement of thermochemical equilibrium within the experimental capsule (cf. [22]). For quenching, the sample is rapidly dropped into a water-cooled zone and quenched in about 2 s. At the end of the experiment, one half of the capsule was mounted in an epoxy disk and polished for textural and chemical analyses, whereas the second half was embedded in crystal bond resin and polished on both sides for FTIR analysis. This experimental data set has been integrated with additional experiments from Masotta and Keppler [25], conducted on trachytic compositions using a similar TZM apparatus. These experiments were performed at 170–202 MPa, 850–950 °C, 5.12–7.57 wt. % H2O and at Re-ReO2 or Hematite–Magnetite oxygen buffers (Table 1).
Chemical analyses of experimental glasses and plagioclase crystals (Table 2 and Table 3) were performed with a Cameca SX-50 electronic probe microanalyzer (EPMA) equipped with five spectrometers and installed at the CNR-Istituto di Geologia Ambientale e Geoingegneria (Rome, Italy). For glasses, a slightly defocused electron beam with a size of 5 μm was used with a counting time of 5 s on background and 15 s on peak. For plagioclases, the beam size was 1 μm with a counting time of 20 and 10 s on peaks and background, respectively. The following standards have been adopted for the various chemical elements: Jadeite (Si and Na), corundum (Al), forsterite (Mg), andradite (Fe), rutile (Ti), orthoclase (K), barite (Ba), apatite (P), and spessartine (Mn). Sodium and potassium were analyzed first to prevent alkali migration effects. The precision of the microprobe was measured through the analysis of well-characterized synthetic oxides and minerals. Data quality was ensured by analyzing these test materials as unknowns. Based on counting statistics, analytical uncertainties relative to their reported concentrations indicate that precision was better than 5% for all cations.
FTIR analyses (Table 1) were carried out at the Dipartimento di Scienze della Terra, University of Roma Tre (Rome, Italy). The analytical conditions and methods used for the estimate of the H2O content in the glass are similar to those described in Di Matteo et al. [33]. Absorption spectra were collected in the mid-infrared (MIR) using an FTIR spectrometer with a Nicolet NicPlan microscope equipped with a nitrogen-cooled MCT detector and a KBr beamsplitter. Spectral resolution was 2 cm−1. For each spectrum, 50–100 scans were collected. The spot size applied in analyses was typically 50 μm × 50 μm. The analyzed area was checked optically before FTIR measurements to avoid any possible crystal. Doubly polished glass plates of about 15–80 μm thickness were prepared from the experimental products for IR spectroscopy. The thickness of each section was measured with a digital micrometer (Mitutoyo; precision ±2 μm). The concentration of dissolved H2O in the investigated glass was calculated using the Beer–Lambert law [7]. The total H2O content (Table 1) was computed using the molar absorptivity of 62 L mol−1 for the infrared band at 3550 cm−1 [34]. The glass density (Table 1) was calculated using the equation of Lange and Carmichael [35].
3. Results
3.1. Crystallization Experiments
The experimental products are characterized by the ubiquitous presence of clinopyroxene and feldspar (plagioclase + sanidine) (Table 1). The crystal content decreases from 27 to 11 vol. % as the amount of H2O in the glass phase increases from ~1.17 to ~3.73 wt. % (Table 1). Both crystals and glasses are compositionally homogeneous, suggesting the attainment of thermochemical equilibrium over the relatively long experimental time duration of 48 h (cf. [22]). This is also corroborated by the equilibrium model of Namur et al. [36] that, based on the glass analysis and experimental temperature, successfully estimates the concentration of An in plagioclase within the relative low uncertainty of ±0.07 mol. %. As a further test, we have also employed the Ab-An exchange of Putirka [16] between plagioclase and the quenched glass (pl-liqKdAb-An), requiring constant values over two temperature intervals: pl–liqKdAb–An = 0.10 ± 0.05 and 0.27 ± 0.11 at T < 1050 °C and T ≥ 1050 °C, respectively. The Ab-An exchange partition coefficients (0.01–0.14) from this study closely match with the equilibrium interval derived at T < 1050 °C (Table S1).
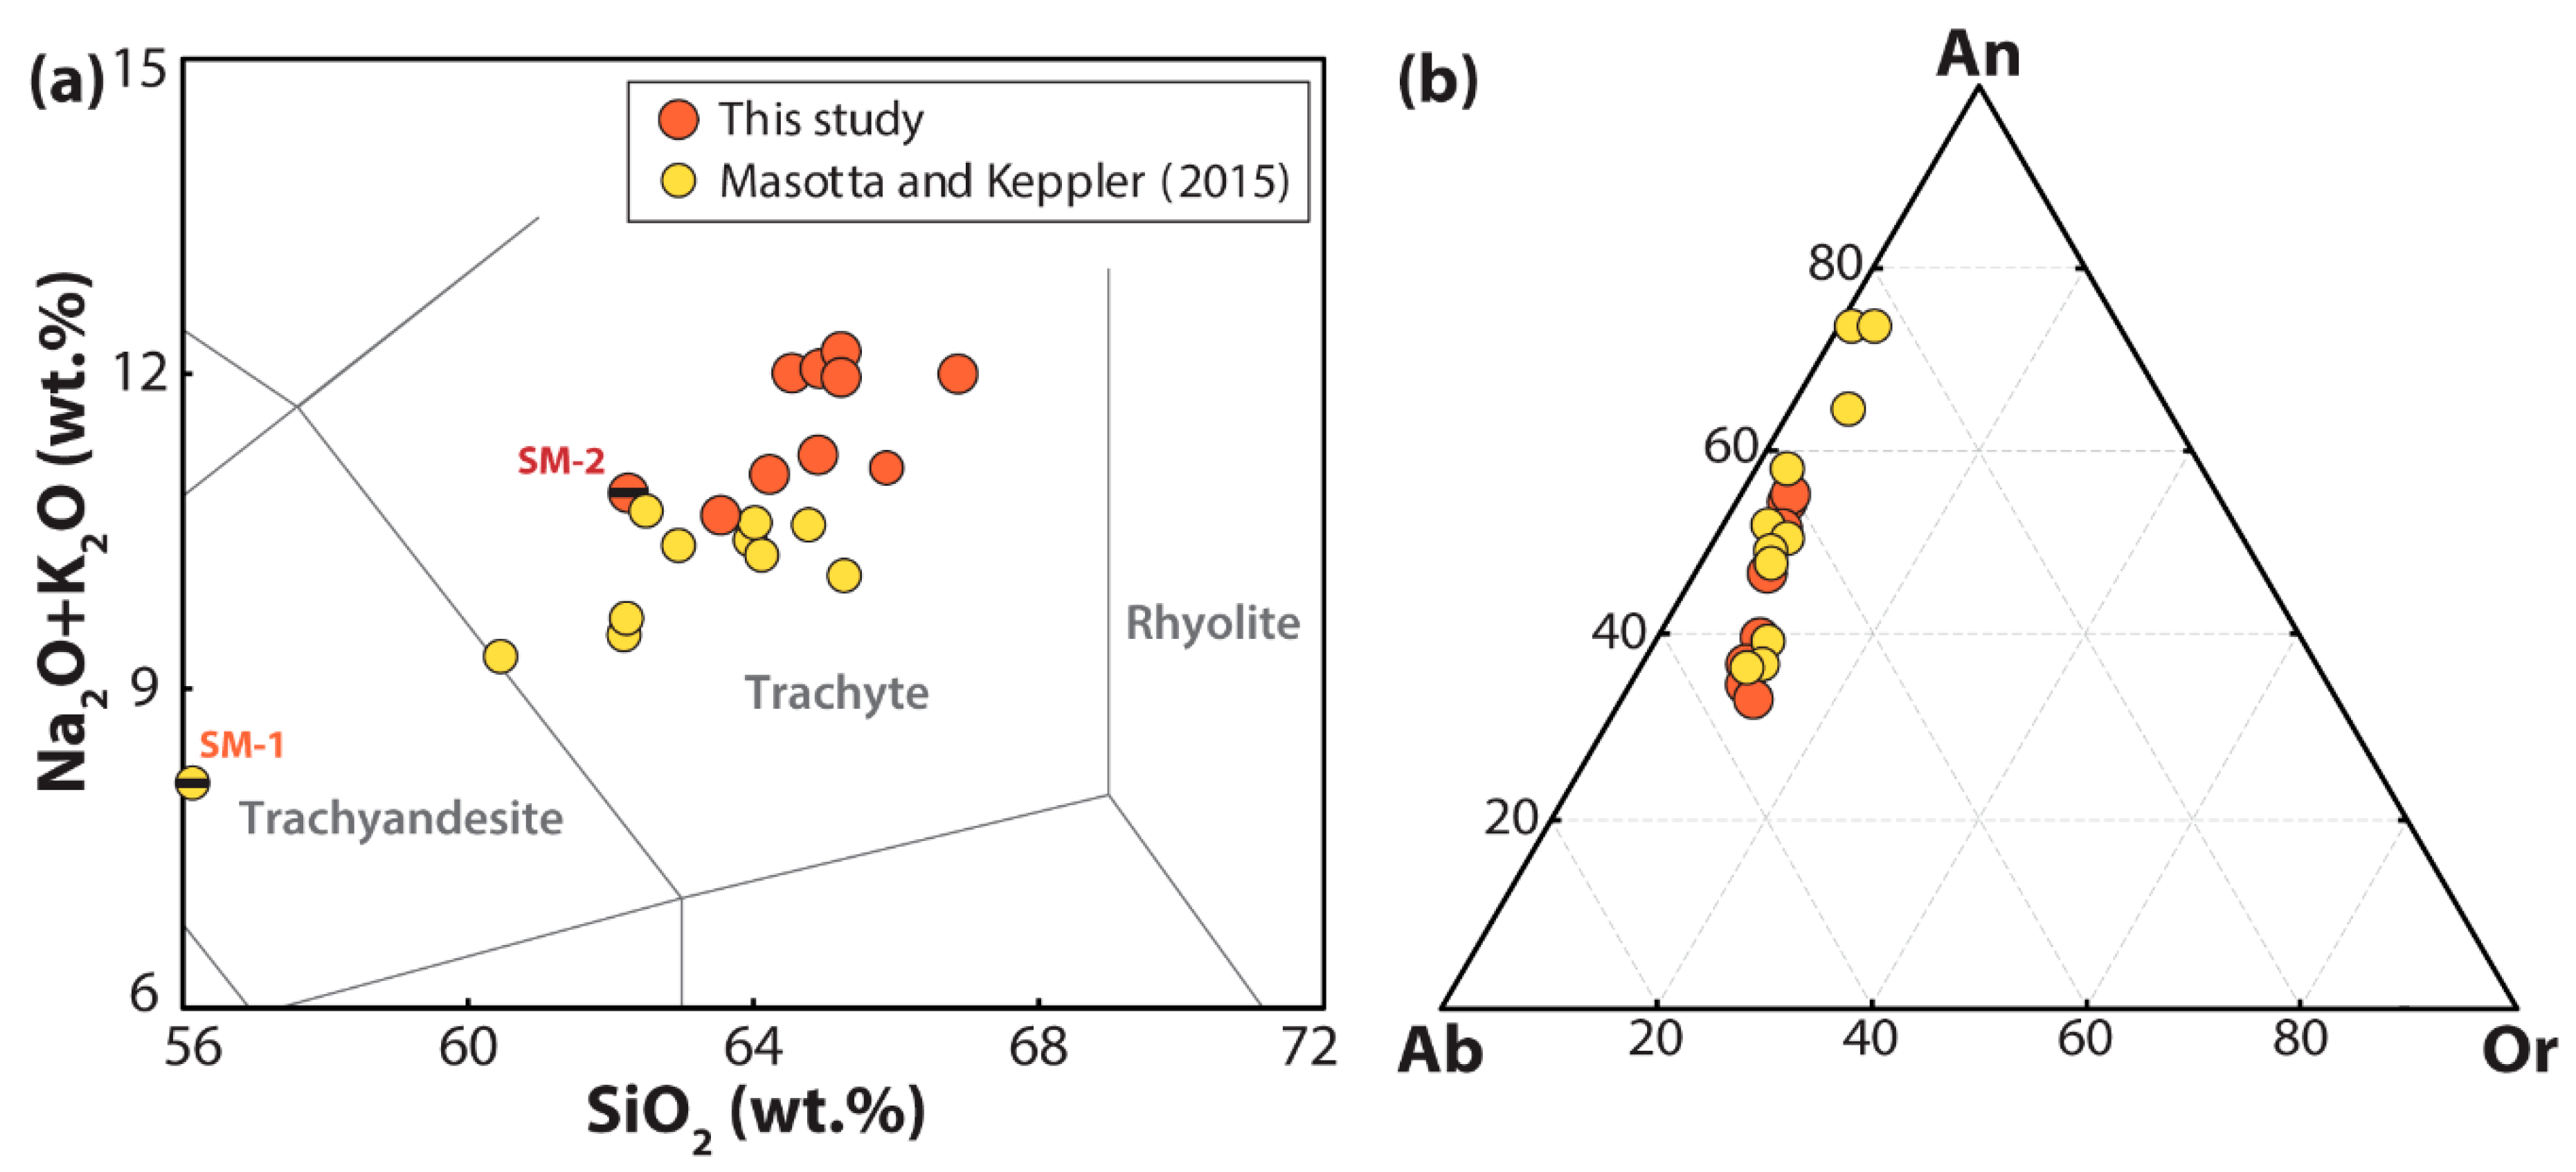
According to the TAS (total alkali vs. silica) classification scheme of Le Bas et al. [37], all the residual glass analyses plot in the field of trachyte (Figure 1a) and become more differentiated and alkali-rich with decreasing T and H2O (i.e., with increasing the degree of crystallization; Table 2). The quenched melts from Masotta and Keppler [25] compare well with those from this study in terms of trachytic association because of the constant co-saturation of plagioclase + pyroxene, but are also characterized by less differentiated compositions approaching towards the trachyandesite-trachyte boundary (Figure 1a; Table S1).
The chemistry of plagioclase sensibly changes as a function of the experimental conditions. In particular, the An component increases from 35 to 55 mol. % (Figure 1b) with increasing H2O and, subordinately, with increasing T, due to the narrow range of 1000–1020 °C (Table 3). In comparison, experiments from Masotta and Keppler [25] display a broader variation of the plagioclase composition, with the An content ranging from 37 to 73 mol. % (Figure 1b; Table S1). Such enrichment in the anorthite component is remarkably high relative to the low temperatures (850–950 °C) adopted for the experiments. Such a compositional effect is due to the much higher H2O content (~5.12–7.57 wt. %) used in the experiments by Masotta and Keppler [25], compared to that (~1.17–3.73 wt. %) used in this study. With respect to the overall compositional data set, the plagioclase crystals obtained at higher T are in equilibrium with lower H2O contents, thus providing a broad and functional spectrum for the concentration of An in plagioclase during the crystallization and evolution of trachytic systems.
3.2. Plagioclase-Liquid Hygrometer
For the calibration of the hygrometer, the glass and plagioclase analyses were treated in terms of cation fractions (Xiliq or XiPl where liq and pl refers to the liquid and plagioclase, respectively, and i is the cation of interest) and components (An and Ab, as the expression of mol. % of anorthite and albite, respectively). Provided that all the experimental plagioclase crystals are in equilibrium with the coexisting glasses, the amount of H2O at which plagioclase saturates the melt has been determined through the equilibrium constant (Keq) for the following reaction [15]:
CaOliq + Al2O3liq + 2SiO2liq = CaAl2Si2O8pl
During magma evolution, the content of An in plagioclase is positively correlated with either T or H2O and, consequently, discriminating the role played by these two parameters is not possible (e.g., [16]). Starting from a hypothetical near-liquidus melt region, the thermal path followed by primitive basaltic magmas prior to complete solidification is always much greater than that referring to more differentiated trachytic compositions. Therefore, the role played by H2O during magmatic evolution becomes increasingly more relevant with respect to temperature, accounting for the enhanced solubility of H2O in more differentiated melts [38]. Rationally, Keq for Equation (1) is prevalently a proxy for the amount of H2O dissolved in trachytic magmas, as the effect of temperature is subordinated to the melt-H2O content [20,39]. Looking at the experimental conditions listed in Table 1, T and H2O change from 850 to 1020 °C and 1.17 to 7.57 wt. %, respectively, during the crystallization of the trachytic melt. These different intervals yield to the recognition that T increases by only ~17%, whereas H2O increases substantially by 83%. A more marked effect of H2O on the concentration of An in plagioclase has been documented by the experimental investigation of Sisson and Grove [40] on the role of H2O in calc-alkaline differentiation and subduction zone magmatism. Furthermore, phase equilibria experiments conducted by Ushioda et al. [41] on arc basaltic magmas have illustrated that, under the strong influence of hydrous crystallization conditions, the effects of P and T are almost negligible for the Ca–Na exchange between plagioclase and liquid. In addition to Keq, we observe that H2O dissolved in the trachytic melt is negatively correlated with the concentration of Ab in plagioclase and positively correlated with the Na/K cation ratio of the liquid (Table S1). On this basis, we have derived a new hygrometer specific to trachytic compositions following the same calibration approach proposed by Putirka [16] and consisting of multiple regression analysis of plagioclase-liquid cation fractions and components:
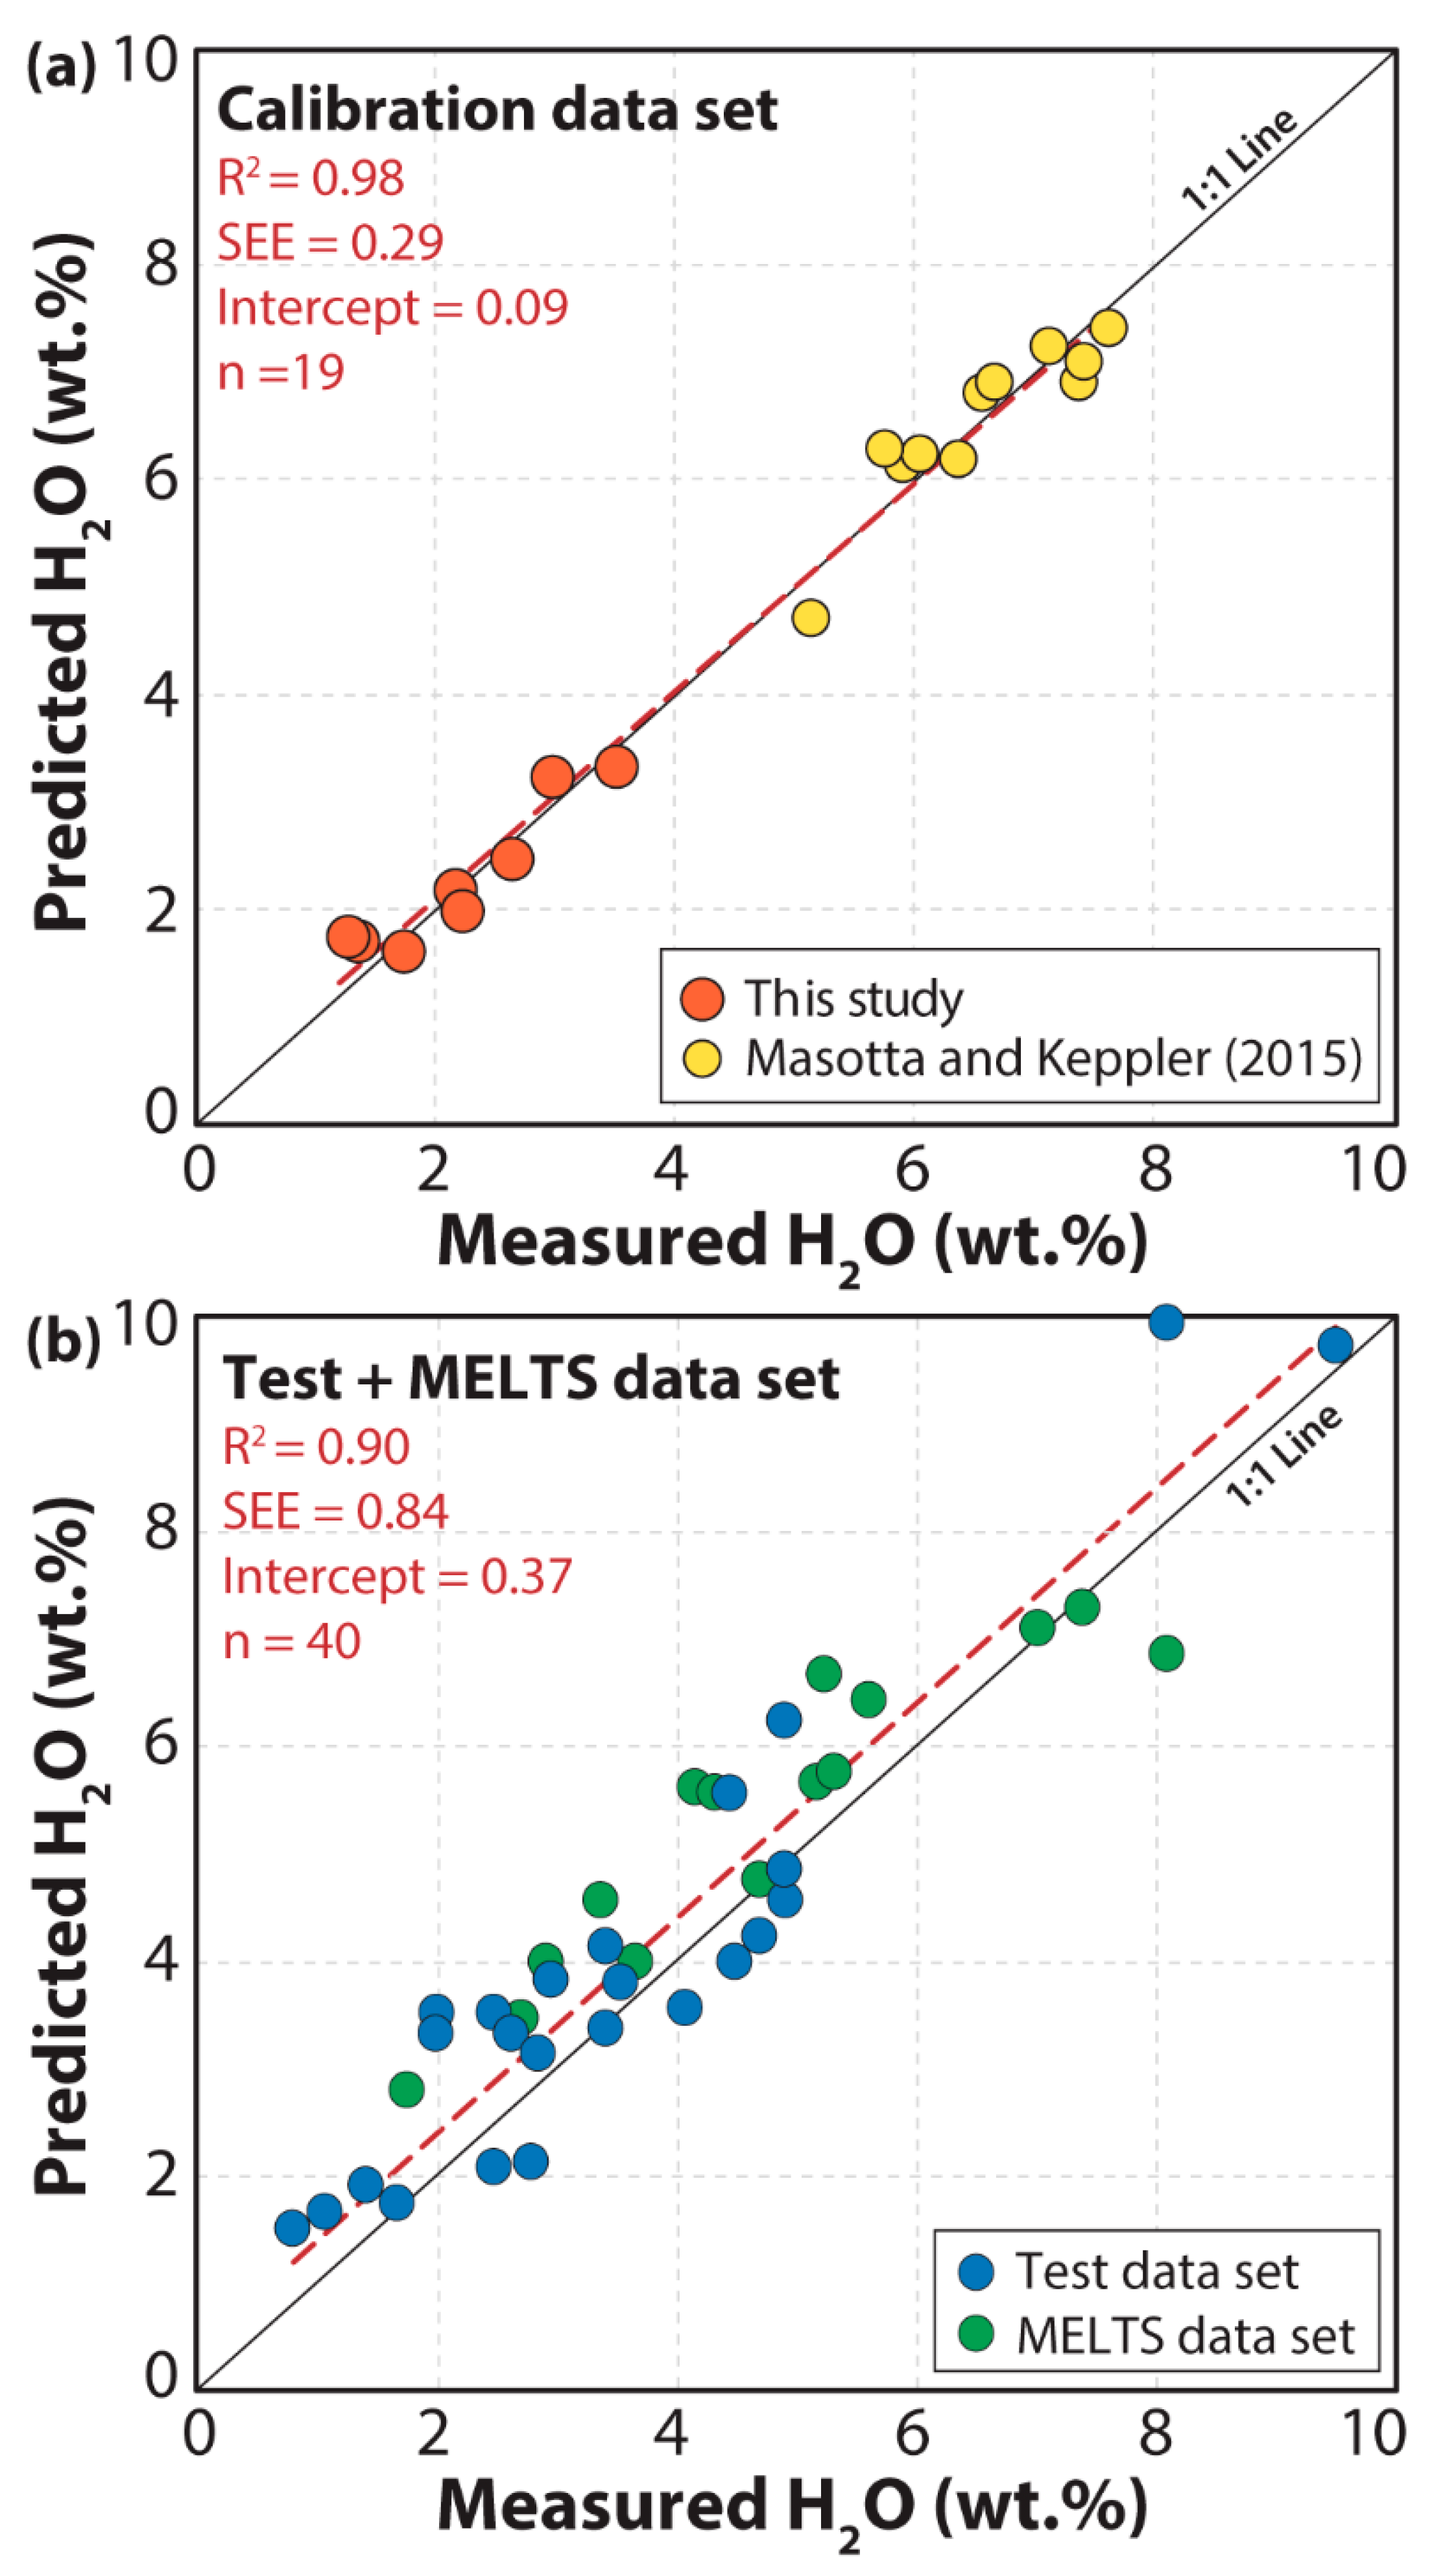
The main difference between Equation (2) and the model of Putirka [16] consists of the number of regression parameters that has been reduced to five. We observe, indeed, that the use of additional predictors does not offer any statistical improvements for the regression fit, but rather leads to data overfitting. For example, the effect of P on the bulk plagioclase-liquid system is always negligible at conditions lower than 300 MPa [16,17]. Coherently, the regression statistics of the simplified Equation (2) are very good, with a correlation coefficient (R) of 0.98 and a standard error of estimate (SEE) of ±0.29 wt. % H2O, evidencing the high predictive power of the model (Figure 2a).
The precision of the hygrometer was tested using plagioclase-liquid pairs from crystallization experiments on trachyandesitic, trachytic and trachyphonolitic melts available in literature [22,42,43]. In order to give more strength to the test, we included additional plagioclase-liquid pairs recovered through MELTS [44] numerical simulations, as reported in Mollo et al. [19]. The MELTS data set refers to trachytic compositions equilibrated at 100–300 MPa, 804–1007 °C, 1.77–7.39 wt. % H2O and ΔNNO − 0.8 to ΔNNO + 0.5 buffer, and is unbiased by the analytical uncertainty that characterizes most of the experimental products. At this purpose, it is worth stressing that there is a fairly good agreement between phase relationships and compositions predicted by MELTS and those observed in natural and experimental trachytic products (e.g., [39,45]). Moreover, the MELTS algorithm for Gibbs free energy minimization is based on an independent and very different set of mineral thermochemical data [44]. In ultimate analysis, the combination of the test data set with the MELTS data set gives the opportunity to verify the convergence between thermodynamic principles and the experimental compositions employed for calibrating the plagioclase-liquid hygrometer from this study. Figure 2b shows that H2O contents of both test and MELTS data sets are highly consistent with those estimated from Equation (2), also confirming the attainment of bulk equilibrium conditions within the experimental charges. The regression analysis of the data recovers appreciable statistics of R2 = 0.90 and SEE = ±0.84 wt. % H2O. According to the very different principles beyond MELTS thermodynamic data, we can also exclude systematic H2O overestimates or underestimates caused by miscalibration of the plagioclase-liquid hygrometer.
3.3. Comparison with Previous Plagioclase-Liquid Hygrometers
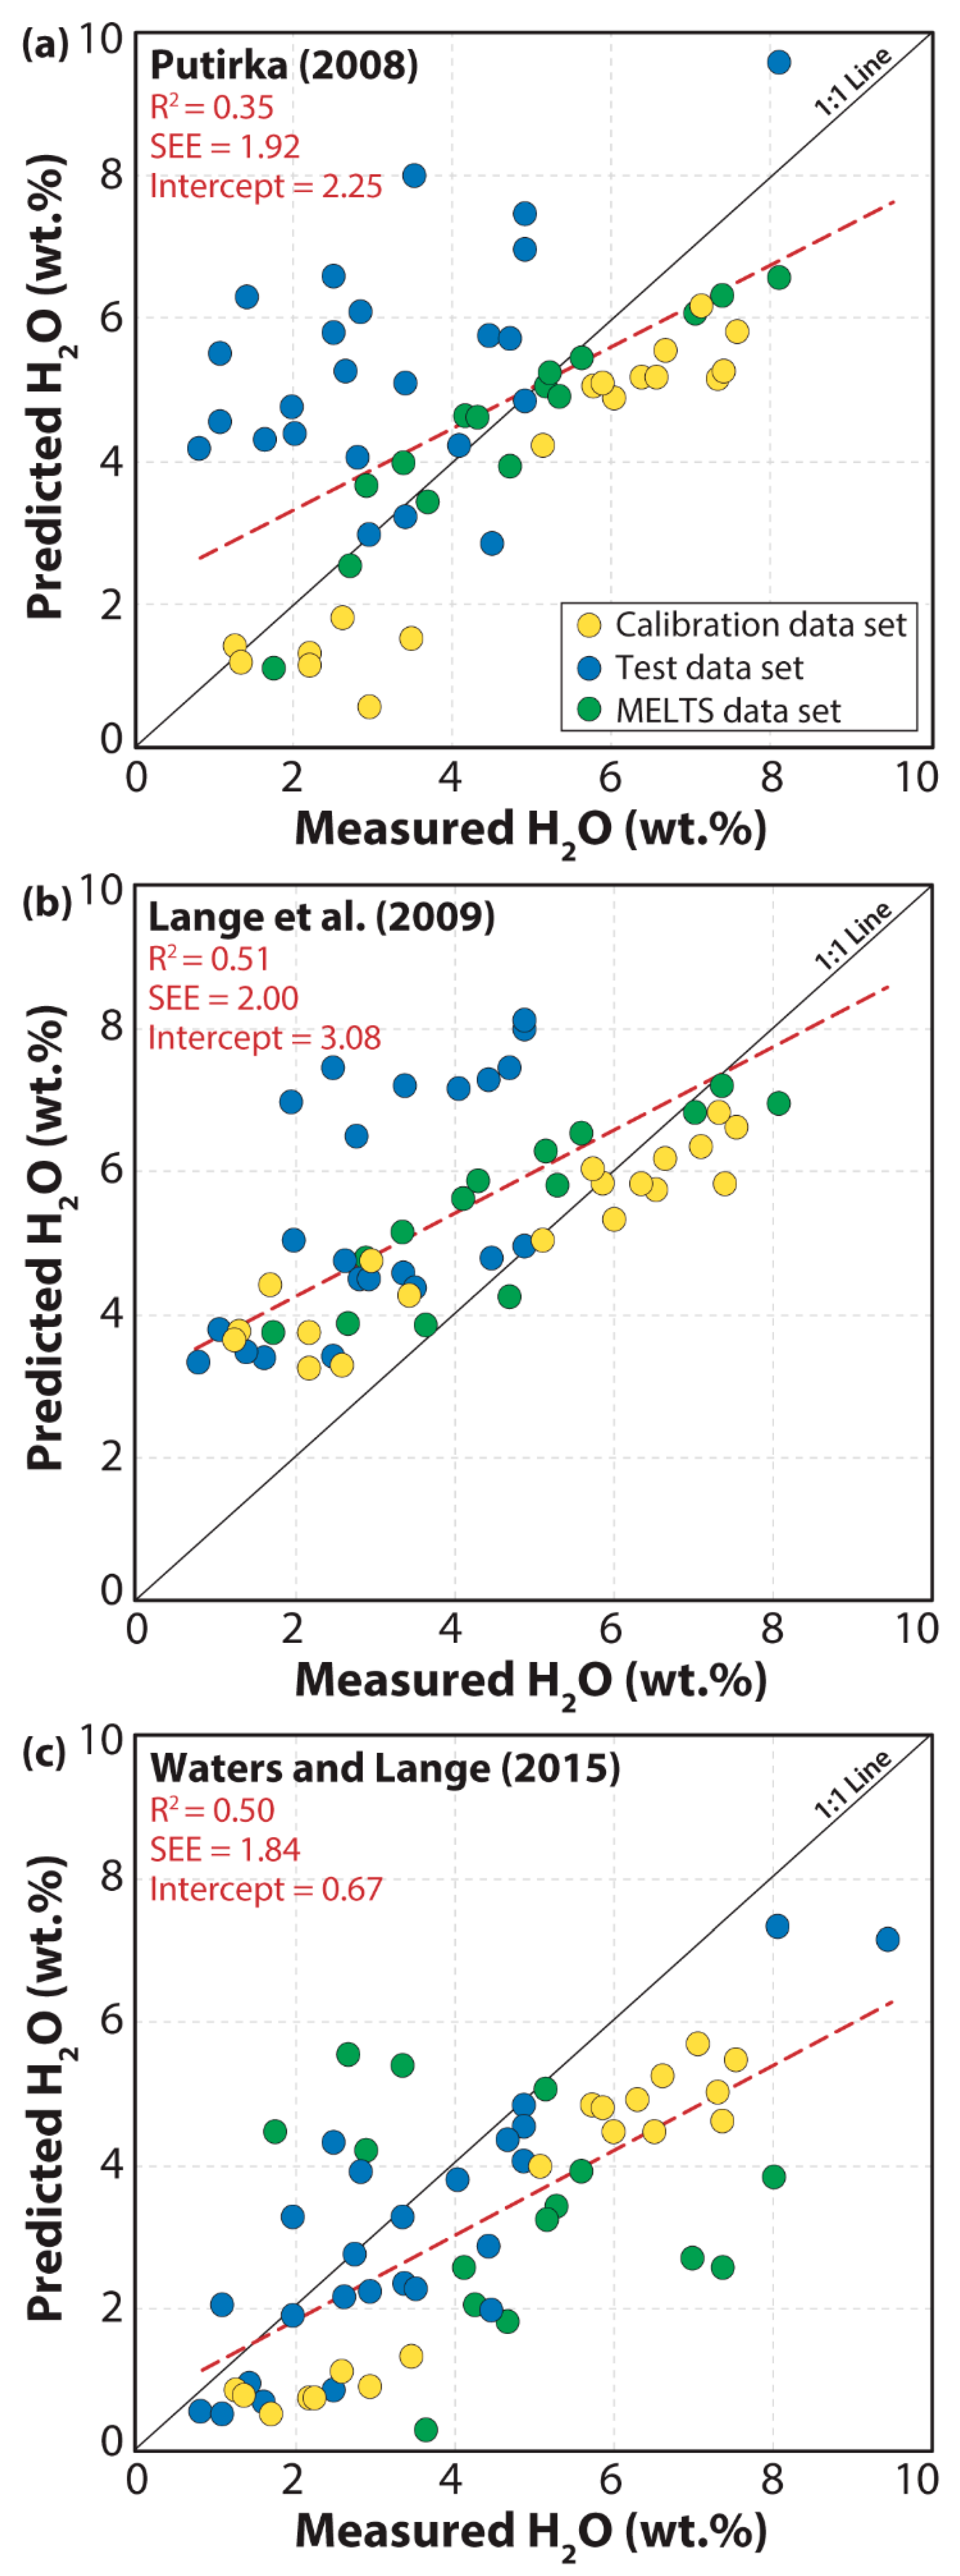
The plagioclase-liquid hygrometers of Putirka [16], Lange et al. [17] and Waters and Lange [18] are, at present, the most reliable semi-empirical models for determining the H2O concentration in magmas with compositions ranging from basalt to rhyolite. These models are derived by global regression analysis of a broad calibration data set, including plagioclase-bearing experiments conducted under variable P-T-H2O conditions. In principle, global hygrometers show the advantage to be applicable, with a certain caution, to very different natural crystallizing systems. On the other hand, it is not an easy task to quantify the calibration error caused by the use of experimental data lacking accurate H2O measurements and/or well represented alkaline compositions. In this context, we have quantified the error propagation effects caused by the application of previous hygrometers from the literature with the calibration test and MELTS data sets from this study (Figure 3, Table S1). The models of Putirka [16] and Lange et al. [17] predict with a fairly good accuracy the H2O content of both MELTS and calibration data sets, although they tend to overestimate the H2O content of the test data set comprising the experiments on trachyandesitic, trachytic and trachyphonolitic melts from the literature. Overall, the errors of H2O estimate are 1.92 and 2.00 wt. %, respectively for models [16] and [17] (Figure 3a,b), thus resulting higher than their original calibration errors of ±1.10 and ±0.32 wt. %, respectively. In contrast, the model of Waters and Lange [18] underestimates systematically the H2O content, particularly for H2O concentrations up to 8 wt. %. The error of the H2O estimate of the model [18] is 1.84 wt. %, being invariably higher than the original calibration error of ±0.35 wt. %.
4. Application of the Plagioclase-Liquid Hygrometer
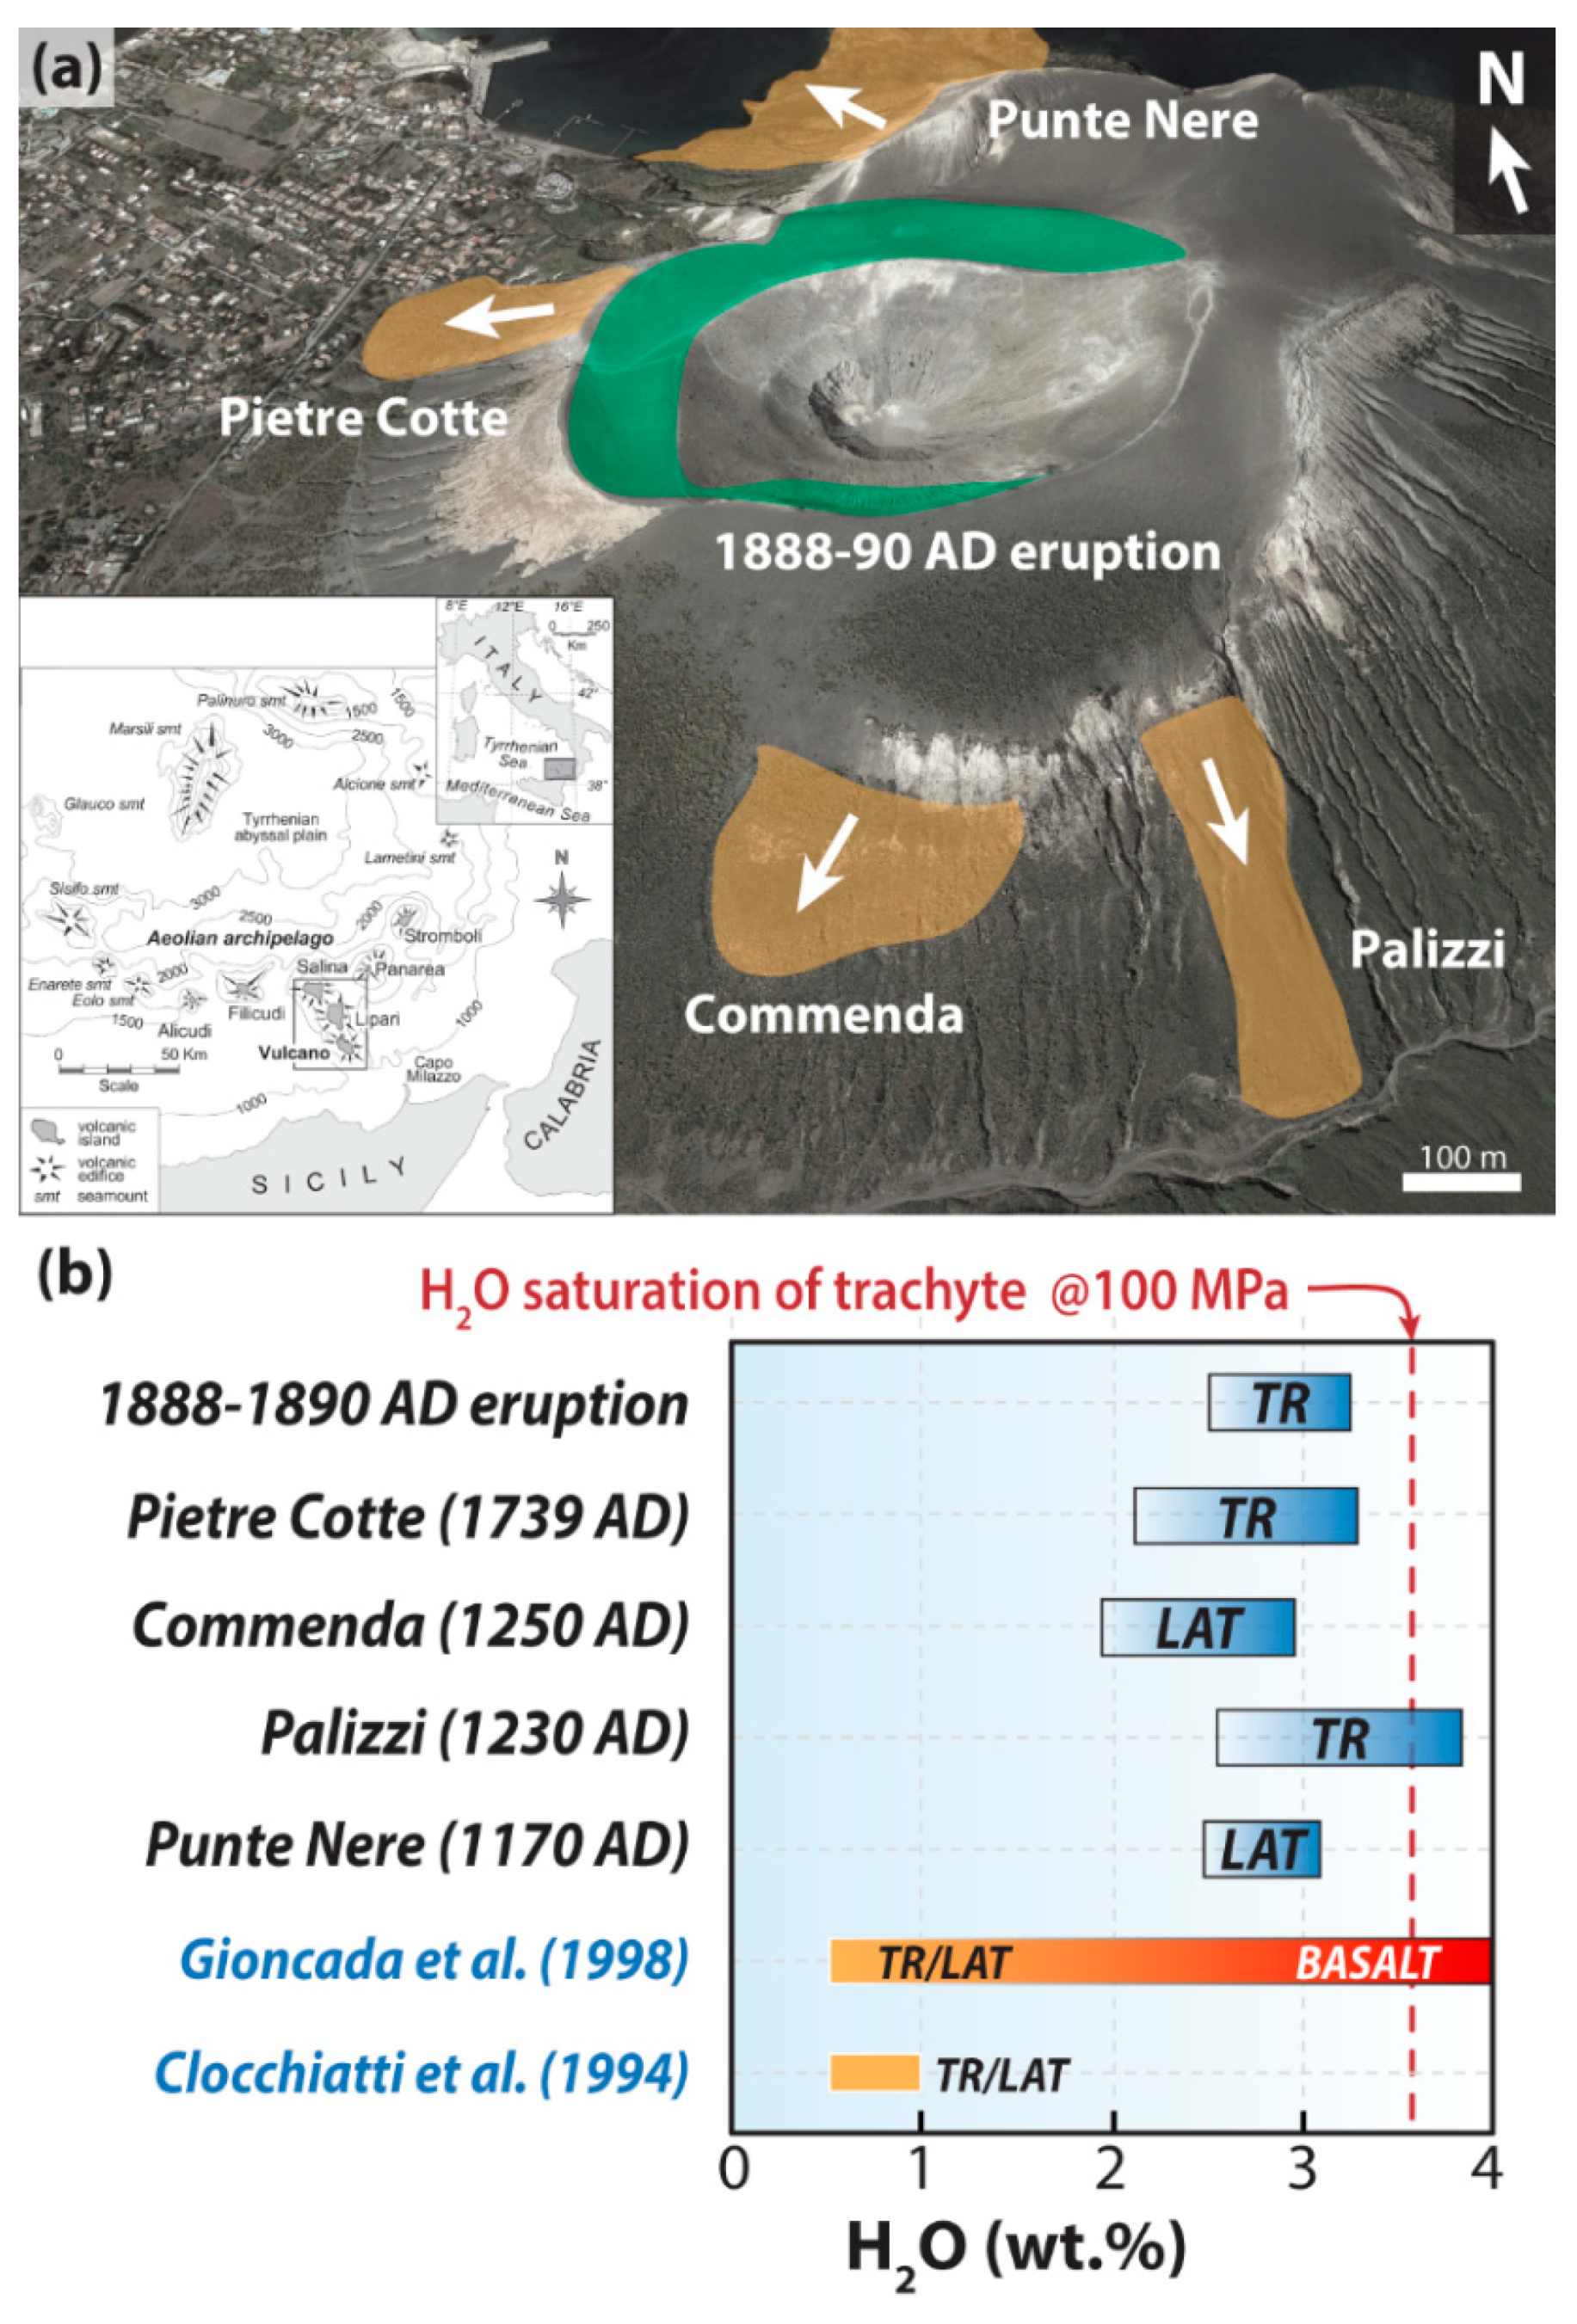
The plagioclase-liquid hygrometer from this study has been applied to natural latitic and trachytic products erupted over the last 1000 years at the La Fossa cone of Vulcano Island, which represents the exposed summit of a volcanic edifice sited in the southernmost sector of the Aeolian archipelago (southern Tyrrhenian sea). The La Fossa cone (~5.5 ka–1890 AD) built up during the last of the six main stages that characterized the volcanic activity of Vulcano Island and stands in the middle of the La Fossa caldera, representing the dominant morphostructural feature in the northern sector of the island [46]. The most recent 1:10,000 scale geological map of Vulcano Island by De Astis et al. [47] is based on the stratigraphic principles of unconformity-bounded units. In this context, the different eruptive cycles that characterized the La Fossa cone in the past 1000 years can be all ascribed to the lithesome of Gran Cratere di La Fossa. Di Traglia et al. [32] grouped these eruptive cycles into two Eruptive Clusters (EC), namely the Palizzi-Commenda-EC and the Gran Cratere-EC. The lowermost Palizzi-Commenda-EC includes the lava flows of Punte Nere (1170 ± 20 AD), Palizzi (1230 ± 20 AD) and Commenda (1250 ± 100 AD). Conversely, the uppermost Gran Cratere-EC comprises the lava flow of Pietre Cotte (1739 AD) and products of the 1888–90 eruption (Figure 4a). The presence of products with different degrees of evolution within each single eruptive episode and the widespread occurrence of heterogeneous magmatic enclaves testify to the development of a compositionally and thermally zoned magma storage system [48]. Polybaric and polythermal crystallization phenomena have been also envisaged for the plumbing system of Vulcano island [29,47,49], in concert with assimilation and fractional crystallization (AFC) processes [31,32,50,51]. It is apparent from Equation (2) that the new plagioclase-liquid hygrometer is T-dependent, as for the case of previous feldspar-based hygrometers from the literature (cf. [15,16,17,18,19]). Therefore, before using this model to predict the H2O concentration of latitic and trachytic magmas erupted at La Fossa, the crystallization temperature of plagioclase has been determined using an independent approach. Given the cotectic crystallization of plagioclase and clinopyroxene experimentally observed for trachytic products [22], we can reliably obtain the mineral saturation temperature using the clinopyroxene-liquid thermometer of Masotta et al. [22] specific to alkaline differentiated magmas. It should be noted that this clinopyroxene-liquid thermometer is slightly sensitive to the H2O content in the melt, so that a variation of 1 wt. % H2O (within a range 0–4 wt. %) translates into a temperature change of less than 10 °C. This change, however, is very small (being lower than the standard deviation for the clinopyroxene populations examined; Table S2) and corresponds to an error of H2O estimate of less than 0.25 wt. %. The clinopyroxene-liquid thermometer was thus applied to clinopyroxene phenocryst, glass and bulk rock analyses from the literature [28,29,49], after a careful selection of mineral-liquid pairs that satisfy the criteria of chemical equilibrium. Indeed, to minimize the error of temperature estimates, only compositional data yielding ∆DiHd values of less than 0.1 were selected. The ∆DiHd model is based on the difference (∆) between diopside + hedenbergite components predicted for clinopyroxene via regression analyses of clinopyroxene-melt pairs in equilibrium conditions, with those measured in the analyzed crystals [52]. ∆DiHd equals zero only at thermodynamic equilibrium, but values lower than 0.1 may, with caution, attest near-equilibrium crystallization (cf. [53]). Hence, by assuming a melt-H2O content of 2 wt. %, we inferred average crystallization temperature of 1025 ± 13 °C and 1008 ± 12 °C for the latitic and trachytic magmas, respectively. These values are in general agreement with previous estimates based on both thermobarometry and melt inclusion analyses [28,29,30,31]. For the H2O estimates, we used literature data from Nicotra et al. [49] after testing that the average temperatures of 1025 and 1008 °C effectively minimize the difference (ΔAn < 0.1 mol.%) between An in plagioclase predicted by the equilibrium model of Namur et al. [36] and the natural compositions of phenocrysts. Results from calculations are plotted in Figure 4b showing that the overall concentration of H2O in latitic and trachytic magmas is comprised between ~2.5 and ~3.5 wt. % (Table S3). These estimates are slightly higher than those from melt inclusion data for latitic and trachytic products, ranging from 0.8 to 1.9 wt. % H2O [30,31]. It should be noted, however, that the entrapment of the melt inclusions may represent an early stage of crystallization and that the overall increase of the H2O content in the melt is consistent with the ongoing differentiation of magmas at shallow depths, owing to an increase of H2O solubility during the evolution of magma from latite to trachyte to rhyolite [38]. This discrepancy is reconciled by considering the melt inclusion study of Gioncada et al. [31] that illustrates the decrease in pre-eruptive H2O content is caused by an open-system differentiation of alkaline differentiated magmas, in concert with abundant volatile exsolution. Rationally, with respect to basaltic magmas stored at high depths (P > 600 MPa; [29,49]), the crystallization of latitic and trachytic magmas takes place at shallower crustal levels (P < 100 MPa) under H2O saturated and/or oversaturated conditions [48]. This is also confirmed by the negative correlation between sulfur content in melt inclusions and the degree of evolution between basalt to trachyte [31], in response to preferential sulfur partitioning into the vapor phase during magma degassing at low-P conditions [54]. The comparison between isotope data of Paonita et al. [26] and Mandarano et al. [27] provides also that 4He/3He signatures of gases in the fumarole system of the La Fossa cone record volatile flushing phenomena from deep-seated basaltic magmas towards shallower latitic reservoirs. The analysis of melt inclusions and secondary fluid H2O–CO2 inclusions in quartzitic xenoliths from the 1888–1890 AD products [30] confirms that latitic reservoirs may evolve towards rhyolites by clinopyroxene + plagioclase fractional crystallization at very low P and T conditions of 0.3–0.6 MPa and 1000–1030 °C, respectively.
5. Conclusions
A new empirical plagioclase-liquid hygrometer specific to trachytic magmas has been calibrated using plagioclase-saturated experiments, where the H2O concentration in the quenched glasses has been determined based on FTIR measurements. The model considers the exchange reaction of the anorthite component between plagioclase and liquid, as well as the albite component in plagioclase and the alkali fraction in the melt, yielding to a calibration uncertainty of only ±0.29 wt. % H2O. The reliability of the hygrometer is demonstrated through the examination of a large test data set consisting of both experimental and thermodynamically derived plagioclase-liquid pairs. The hygrometer has been applied to natural products, including latitic and trachytic magmas erupted over the last 1000 years at the La Fossa cone of Vulcano Island. Estimations of the H2O content in these magmas indicate that alkaline magmas undergo open-system differentiation under strong degassing conditions, thus corroborating previous observations from melt inclusion studies.
Supplementary Materials
The following are available online at https://www.mdpi.com/2075-163X/9/6/375/s1, Table S1: Major element composition of glasses and plagioclases of calibration and test experimental datasets (see text for details), Table S2: Major element composition of natural clinopyroxenes (data from [28,29]) and clinopyroxene-liquid thermometric calculations (according to [22]); Table S3: Major element composition of natural plagioclases (data from [49]) and application of the new plagioclase-liquid hygrometer.
Author Contributions
Conceptualization, M.M. and S.M.; Experimental work and microprobe analyses, M.M.; FTIR analyses, S.M.; Data analyses, manuscript writing, review and editing, M.M. and S.M.
Funding
This study was funded by Progetti di Ricerca di Ateneo (PRA) by the University of Pisa [PRA_2018_19].
Acknowledgments
The authors thank four anonymous reviewers for their valuable comments and to C.M. Petrone for her editorial guidance. M.M. is grateful to R. Trigila for the scientific support and laboratory skills acquired during his MSc. M. Serracino is acknowledged for help during electron microprobe analyses.
Conflicts of Interest
The authors declare no conflict of interest.
References
- Carroll, M.R.; Holloway, J.R. Volatiles in Magmas. Rev. Mineral. Geochem. 1994, 30, 509. [Google Scholar]
- Zhang, Y.; Xu, Z.; Zhu, M.; Wang, H. Silicate melt properties and volcanic eruptions. Rev. Geophys. 2007, 45. [Google Scholar] [CrossRef] [Green Version]
- Cashman, K.V. Volatile controls on magma ascent and eruption. In The State of the Planet: Frontiers and Challenges in Geophysics; Sparks, R.S.J., Hawkesworth, C.J., Eds.; Geophysical Monograph Series; American Geophysical Union: Washington, DC, USA, 2004; Volume 150, pp. 109–124. [Google Scholar]
- Hess, K.; Dingwell, D.B. Viscosities of hydrous leucogranitic melts: A non-Arrhenian model. Am. Mineral. 1996, 81, 1297–1300. [Google Scholar]
- Moore, G.; Carmichael, I.S.E. The hydrous phase equilibria (to 3 kbar) of an andesite and basaltic andesite from western Mexico: Constraints on water content and conditions of phenocryst growth. Contrib. Mineral. Petrol. 1998, 130, 304–319. [Google Scholar] [CrossRef]
- Ochs, F.A.; Lange, R.A. The Density of Hydrous Magmatic Liquids. Science 1999, 283, 1314–1317. [Google Scholar] [CrossRef]
- Stolper, E.M. The speciation of water in silicate melts. Geochim. Cosmochim. Acta 1982, 46, 2609–2620. [Google Scholar] [CrossRef]
- Nowak, M.; Behrens, H. The speciation of water in haplogranitic glasses and melts determined by in situ near infrared spectroscopy. Geochim. Cosmochim. Acta 1995, 59, 3445–3450. [Google Scholar] [CrossRef]
- Shen, A.; Keppler, H. Infrared spectroscopy of hydrous silicate melts to 1000 °C and 10 kbar: Direct observation of H2O speciation in a diamond-anvil cell. Am. Mineral. 1995, 80, 1335–1338. [Google Scholar] [CrossRef]
- Ottonello, G.; Richet, P.; Papale, P. Bulk solubility and speciation of H2O in silicate melts. Chem. Geol. 2018, 479, 176–187. [Google Scholar] [CrossRef]
- Shishkina, T.A.; Botcharnikov, R.E.; Holtz, F.; Almeev, R.R.; Jazwa, A.M.; Jakubiak, A.A. Compositional and pressure effects on the solubility of H2O and CO2 in mafic melts. Chem. Geol. 2014, 388, 112–129. [Google Scholar] [CrossRef]
- Tait, S.; Jaupart, C.; Vergniolle, S. Pressure, gas content and eruption periodicity of a shallow crystallising magma chamber. Earth Planet. Sci. Lett. 1989, 92, 107–123. [Google Scholar] [CrossRef]
- Huppert, H.E.; Woods, A.W. The role of volatiles in magma chamber dynamics. Nature 2002, 420, 493–495. [Google Scholar] [CrossRef] [PubMed]
- Sisson, T.W.; Grove, T.L. Temperature and H2O contents of low-MgO high-alumina basalts. Contrib. Mineral. Petrol. 1993, 113, 167–184. [Google Scholar] [CrossRef]
- Putirka, K.D. Igneous thermometers and barometers based on plagioclase + liquid equilibria: Tests of some existing models and new calibrations. Am. Mineral. 2005, 90, 336–346. [Google Scholar] [CrossRef]
- Putirka, K.D. Thermometers and barometers for volcanic systems. Rev. Mineral. Geochem. 2008, 69, 61–120. [Google Scholar] [CrossRef]
- Lange, R.A.; Frey, H.M.; Hector, J. A thermodynamic model for the plagioclase-liquid hygrometer/thermometer. Am. Mineral. 2009, 94, 494–506. [Google Scholar] [CrossRef]
- Waters, L.E.; Lange, R.A. An updated calibration of the plagioclase-liquid hygrometer-thermometer applicable to basalts through rhyolites. Am. Mineral. 2015, 100, 2172–2184. [Google Scholar] [CrossRef]
- Mollo, M.; Masotta, M.; Forni, F.; Bachmann, O.; De Astis, G.; Moore, G.; Scarlato, P. A K-feldspar–liquid hygrometer specific to alkaline differentiated magmas. Chem. Geol. 2015, 392, 1–8. [Google Scholar] [CrossRef]
- Kudo, A.M.; Weill, D.F. An igneous plagioclase thermometer. Contrib. Mineral. Petrol. 1970, 25, 52–65. [Google Scholar] [CrossRef]
- Mathez, E.A. A refinement of the Kudo-Weill plagioclase thermometer and its application to basaltic rocks. Contrib. Mineral. Petrol. 1973, 41, 61–72. [Google Scholar] [CrossRef]
- Masotta, M.; Mollo, S.; Freda, C.; Gaeta, M.; Moore, G. Clinopyroxene–liquid thermometers and barometers specific to alkaline differentiated magmas. Contrib. Mineral. Petrol. 2013, 166, 1545–1561. [Google Scholar] [CrossRef]
- Devine, J.D.; Gardner, J.E.; Brack, H.P.; Layne, G.D.; Rutherford, M.J. Comparison of microanalytical methods for estimating H2O contents of silicic volcanic glasses. Am. Mineral. 1995, 80, 319–328. [Google Scholar] [CrossRef]
- Hughes, E.C.; Buse, B.; Kearns, S.L.; Blundy, J.D.; Kilgour, G.; Mader, H.M. Low analytical totals in EPMA of hydrous silicate glass due to sub-surface charging: Obtaining accurate volatiles by difference. Chem. Geol. 2019, 505, 48–56. [Google Scholar] [CrossRef] [Green Version]
- Masotta, M.; Keppler, H. Anhydrite solubility in differentiated arc magmas. Geochim. Cosmochim. Acta 2015, 158, 79–102. [Google Scholar] [CrossRef]
- Paonita, A.; Federico, C.; Bonfanti, P.; Capasso, G.; Inguaggiato, S.; Italiano, F.; Madonia, P.; Pecoraino, G.; Sortino, F. The episodic and abrupt geochemical changes at La Fossa fumaroles (Vulcano Island, Italy) and related constraints on the dynamics, structure, and compositions of the magmatic system. Geochim. Cosmochim. Acta 2013, 120, 158–178. [Google Scholar] [CrossRef]
- Mandarano, M.; Paonita, A.; Martelli, M.; Viccaro, M.; Nicotra, E.; Millar, I.L. Revealing magma degassing below closed-conduit active volcanoes: Geochemical features of volcanic rocks versus fumarolic fluids at Vulcano (Aeolian Islands, Italy). Lithos 2016, 248–251, 272–287. [Google Scholar] [CrossRef]
- Fulignati, P.; Gioncada, A.; Costa, S.; Di Genova, D.; Di Traglia, F.; Pistolesi, M. Magmatic sulfide immiscibility at an active magmatic-hydrothermal system: The case of La Fossa (Vulcano, Italy). J. Volcanol. Geotherm. Res. 2018, 358, 45–57. [Google Scholar] [CrossRef]
- Bullock, L.A.; Gertisser, R.; O’Driscoll, B.O.; Harland, S. Magmatic evolution and textural development of the 1739 CE Pietre Cotte lava flow, Vulcano, Italy. J. Volcanol. Geotherm. Res. 2019, 372, 1–23. [Google Scholar] [CrossRef] [Green Version]
- Clocchiatti, R.; Del Moro, A.; Gioncada, A.; Joron, J.L.; Mosbah, M.; Pinarelli, L.; Sbrana, A. Assessment of a shallow magmatic system: The 1888–1890 eruption, Vulcano Island, Italy. Bull. Volcanol. 1994, 56, 466–486. [Google Scholar] [CrossRef]
- Gioncada, A.; Clocchiatti, R.; Sbrana, A.; Bottazzi, P.; Massare, D.; Ottolini, L. A study of melt inclusions at Vulcano (Aeolian Islands, Italy): Insights on the primitive magmas and on the volcanic feeding system. Bull. Volcanol. 1998, 60, 286–306. [Google Scholar] [CrossRef]
- Di Traglia, F.; Pistolesi, M.; Rosi, M.; Bonadonna, C.; Fusillo, R.; Roverato, M. Growth and erosion: The volcanic geology and morphological evolution of La Fossa (island of Vulcano, southern Italy) in the last 1000 years. Geomorphology 2013, 194, 94–107. [Google Scholar] [CrossRef]
- Di Matteo, V.; Carroll, M.R.; Behrens, H.; Vetere, F.; Brooker, R.A. Water solubility in trachytic melts. Chem. Geol. 2004, 213, 187–196. [Google Scholar] [CrossRef]
- Mandeville, C.W.; Webster, J.D.; Rutherford, M.J.; Taylor, B.E.; Timbal, A.; Faure, K. Determination of molar absorptivities for infrared absorption bands of H2O in andesitic glasses. Am. Mineral. 2002, 87, 813–821. [Google Scholar] [CrossRef]
- Lange, R.A.; Carmichael, I.S.E. Densities of Na2O-K2O-CaO-MgO-FeO-Fe2O3-Al2O3-TiO2-SiO2 liquids: New measurements and derived partial molar properties. Geochim. Cosmochim. Acta 1987, 51, 2931–2946. [Google Scholar] [CrossRef]
- Namur, O.; Charlier, B.; Toplis, M.J.; Vander Auwera, J. Prediction of plagioclase-melt equilibria in anhydrous silicate melts at 1-atm. Contrib. Mineral. Petrol. 2012, 163, 133–150. [Google Scholar] [CrossRef]
- Le Bas, M.J.; Le Maitre, R.W.; Streckeisen, A.; Zanettin, B. IUGS Subcommission on the Systematics of Igneous Rocks. A chemical classification of volcanic rocks based on the total alkali-silica diagram. J. Petrol. 1986, 27, 745–750. [Google Scholar] [CrossRef]
- Papale, P.; Moretti, R.; Barbato, D. The compositional dependence of the saturation surface of H2O + CO2 fluids in silicate melts. Chem. Geol. 2006, 229, 78–95. [Google Scholar] [CrossRef]
- Fowler, S.J.; Spera, F.; Bohrson, W.; Belkin, H.E.; De Vivo, B. Phase equilibria constraints on the chemical and physical evolution of the Campanian Ignimbrite. J. Petrol. 2007, 48, 459–493. [Google Scholar] [CrossRef]
- Sisson, T.W.; Grove, T.L. Experimental investigations of the role of H2O in calcalkaline differentiation and subduction zone magmatism. Contrib. Mineral. Petrol. 1993, 113, 143–166. [Google Scholar] [CrossRef]
- Ushioda, M.; Takahashi, E.; Hamada, M.; Suzuki, T. Water content in arc basaltic magma in the Northeast Japan and Izu arcs: An estimate from Ca/Na partitioning between plagioclase and melt. Earth Planets Space 2014, 66. [Google Scholar] [CrossRef]
- Andújar, J.; Costa, A.; Marti, J. Magma storage conditions of the last eruption of Teide volcano (Canary Islands, Spain). Bull. Volcanol. 2010, 72, 381–395. [Google Scholar] [CrossRef]
- Romano, P.; Andújar, J.; Scaillet, B.; Romengo, N.; di Carlo, I.; Rotolo, S.G. Phase equilibria of Pantelleria trachytes (Italy): Constraints on pre-eruptive conditions and on the metaluminous to peralkaline transition in silicic magmas. J. Petrol. 2018, 59, 559–588. [Google Scholar] [CrossRef]
- Ghiorso, M.S.; Sack, R.O. Chemical mass transfer in magmatic processes. IV. A revised and internally consistent thermodynamic model for the interpolation and extrapolation of liquid-solid equilibria in magmatic systems at elevated temperatures and pressures. Contrib. Mineral. Petrol. 1995, 119, 197–212. [Google Scholar] [CrossRef]
- Masotta, M.; Gaeta, M.; Gozzi, F.; Marra, F.; Palladino, D.M.; Sottili, G. H2O- and temperature-zoning in magma chambers: The example of the Tufo Giallo della Via Tiberina eruptions (Sabatini Volcanic District, central Italy). Lithos 2010, 118, 119–130. [Google Scholar] [CrossRef]
- De Astis, G.; Dellino, P.; La Volpe, L.; Lucchi, F.; Tranne, C.A. Geological Map of the Island of Vulcano (Aeolian Islands), Scale 1:10,000; La Volpe, L., De Astis, G., Eds.; Litographia Artistica Cartographica: Florence, Italy, 2006. [Google Scholar]
- De Astis, G.; Lucchi, F.; Dellino, P.; La Volpe, L.; Tranne, C.A.; Frezzotti, M.L.; Peccerillo, A. Geology, volcanic history and petrology of Vulcano (central Aeolian archipelago). In The Aeolian Islands Volcanoes; Lucchi, F., Peccerillo, A., Keller, J., Tranne, C.A., Rossi, P.L., Eds.; Geological Society of London Publications: London, UK, 2013; Volume 37, pp. 281–349. [Google Scholar]
- Vetere, F.; Petrelli, M.; Morgavi, D.; Perugini, D. Dynamics and time evolution of a shallow plumbing system: The 1739 and 1888–1890 eruptions, Vulcano Island, Italy. J. Volcanol. Geotherm. Res. 2015, 306, 374–382. [Google Scholar] [CrossRef]
- Nicotra, E.; Giuffrida, M.; Viccaro, M.; Donato, P.; D’Oriano, C.; Paonita, A.; De Rosa, R. Timescales of pre-eruptive magmatic processes at Vulcano (Aeolian Islands, Italy) during the last 1000 years. Lithos 2018, 316–317, 347–365. [Google Scholar] [CrossRef]
- De Fino, M.; La Volpe, L.; Piccarreta, G. Role of magma mixing during the recent activity of La Fossa di Vulcano (Aeolian Islands, Italy). J. Volcanol. Geotherm. Res. 1991, 48, 385–398. [Google Scholar] [CrossRef]
- Piochi, M.; De Astis, G.; Petrelli, M.; Ventura, G.; Sulpizio, R.; Zanetti, A. Constraining the recent plumbing system of Vulcano (Aeolian Arc, Italy) by textural, petrological, and fractal analysis: The 1739 A.D. Pietre Cotte lava flow. Geochem. Geophys. Geosyst. 2009, 10, Q01009. [Google Scholar] [CrossRef]
- Mollo, S.; Putirka, K.; Misiti, V.; Soligo, M.; Scarlato, P. A new test for equilibrium based on clinopyroxene–melt pairs: Clues on the solidification temperatures of Etnean alkaline melts at post-eruptive conditions. Chem. Geol. 2013, 352, 92–100. [Google Scholar] [CrossRef]
- Mollo, S.; Masotta, M. Optimizing pre-eruptive temperature estimates in thermally and chemically zoned magma chambers. Chem. Geol. 2014, 368, 97–103. [Google Scholar] [CrossRef]
- Wallace, P.; Carmichael, I.S.E. Sulfur in basaltic magmas. Geochim. Cosmochim. Acta 1992, 56, 1863–1874. [Google Scholar] [CrossRef]
Figure 1.
Total alkali vs silica classification diagram according to Le Bas et al. [37] reporting the composition of experimental glasses of this work and Masotta and Keppler [25]; the composition of the starting materials (SM-1 and SM-2) is reported for comparison (a). Ab-An-Or ternary diagrams reporting the composition of experimental feldspars (b).

Figure 2.
Calibration of the new plagioclase-liquid hygrometer using experimental data from this study and Masotta and Keppler [25] (a). Test of the model using mineral-liquid compositions from Mollo et al. [19] (b). The red dashed line is obtained by least square regression analysis of the data sets.

Figure 3.
Test of literature plagioclase-liquid hygrometers of (a) Putirka [16], (b)Lange et al. [17] and (c) Waters and Lange [18], using the experimental data used to calibrate the new hygrometer. The red dashed line is obtained by least square regression analysis of the data sets.

Figure 4.
(a) Map of the La Fossa cone reporting the distribution of lava flows (orange) and pyroclastic products (green) emplaced during the main eruptive cycles in the last 1000 years; the inset panel reports a sketch map of the Aeolian archipelago (modified after De Astis et al. [47]). (b) Range of H2O content determined for latitic (LAT) and trachytic (TR) magmas erupted during the major eruptions that occurred in the last 1000 years of activity at La Fossa; H2O estimates from melt inclusions are reported for comparison (see text for details).


Table 1.
List of experiments.
| Experiment | P (MPa) | T (°C) | t (h) | H2O a | Phase assemblage b | A3550 (μm-1) | Density (g/L) | Thickness (μm) |
|---|---|---|---|---|---|---|---|---|
| Phase equilibria experiments—this study | ||||||||
| CA-9 | 150 | 1000 | 48 | 1.17 | Gl(73), Pl(11), Sa(11), Cpx(5) | 0.010 | 2484 | 51 |
| CA-4 | 150 | 1000 | 48 | 1.71 | Gl(76), Pl(9), Sa(10), Cpx(5) | 0.015 | 2481 | 35 |
| CA-7 | 150 | 1000 | 48 | 2.14 | Gl(78), Pl(9), Sa(10), Cpx(4) | 0.022 | 2472 | 28 |
| CA-8 | 150 | 1000 | 48 | 2.80 | Gl(81), Pl(8), Sa(7), Cpx(4) | 0.009 | 2439 | 60 |
| CA-17 | 150 | 1000 | 48 | 3.55 | Gl(86), Pl(6), Sa(6), Cpx(2) | 0.029 | 2406 | 17 |
| CA-21 | 150 | 1000 | 48 | 3.73 | Gl(89), Pl(5), Sa(4), Cpx(2) | 0.031 | 2385 | 15 |
| CA-19 | 150 | 1020 | 48 | 2.88 | Gl(83), Pl(7), Sa(7), Cpx(3) | 0.024 | 2436 | 80 |
| CA-22 | 150 | 1020 | 48 | 3.20 | Gl(84), Pl(7), Sa(6), Cpx(3) | 0.027 | 2438 | 42 |
| Phase equilibria experiments—Masotta and Keppler (2015) | ||||||||
| AND-15 | 200 | 850 | 168 | 7.32 | Gl, Pl, Cpx, Ox, Anhy | - | - | - |
| AND-13 | 202 | 900 | 168 | 5.75 | Gl, Pl, Cpx, Ox, Anhy | - | - | - |
| AND-16 | 202 | 900 | 168 | 6.36 | Gl, Pl, Cpx, Opx, Ox, Anhy | - | - | - |
| AND-18 | 195 | 950 | 168 | 7.40 | Gl, Pl, Cpx, Ox, Anhy | - | - | - |
| AND-7 | 200 | 850 | 168 | 7.57 | Gl, Pl, Cpx, Ox, Anhy | - | - | - |
| AND-10 | 200 | 850 | 168 | 7.10 | Gl, Pl, Cpx, Ox, Anhy | - | - | - |
| AND-8 | 202 | 900 | 168 | 6.65 | Gl, Pl, Cpx, Ox, Anhy | - | - | - |
| AND-12 | 202 | 900 | 168 | 5.89 | Gl, Pl, Cpx, Opx, Amph, Ox, Anhy | - | - | - |
| AND-9 | 170 | 950 | 168 | 6.03 | Gl, Pl, Cpx, Ox, Anhy | - | - | - |
| AND-11 | 170 | 950 | 168 | 6.56 | Gl, Pl, Cpx, Ox, Anhy | - | -- | - |
| AND-19 | 202 | 950 | 168 | 5.12 | Gl, Pl, Cpx, Opx, Ox, Anhy | - | - | - |
a By FTIR analysis; b Phase abundances in parentheses are calculated on electron backscattered images. Phase abbreviations: Glass (Gl), Plagioclase (Pl), Sanidine (Sa), Clinopyroxene (Cpx), Oxide (Ox), Anhydrite (Anhy), Orthopyroxene (Opx), and Amphibole (Amph).
Table 2.
Major element composition of experimental glasses.
| Sample | SiO2 | TiO2 | Al2O3 | FeOtot | MnO | MgO | CaO | Na2O | K2O | Total |
|---|---|---|---|---|---|---|---|---|---|---|
| Starting material | ||||||||||
| VGPL-3 | 62.63 | 0.60 | 17.82 | 4.56 | 0.15 | 0.77 | 2.21 | 4.41 | 6.64 | 99.79 |
| (15) a | 1.01 | 0.12 | 0.65 | 0.23 | 0.03 | 0.27 | 0.12 | 0.23 | 0.21 | - |
| Crystallization experiments | ||||||||||
| CA-9 | 64.45 | 0.28 | 18.01 | 1.73 | 0.04 | 0.52 | 1.91 | 4.41 | 7.42 | 98.77 |
| (10) | 0.72 | 0.02 | 0.70 | 0.13 | 0.01 | 0.09 | 0.20 | 0.25 | 0.24 | - |
| CA-4 | 64.34 | 0.29 | 17.99 | 1.71 | 0.02 | 0.47 | 1.74 | 4.49 | 7.54 | 98.59 |
| (10) | 0.36 | 0.07 | 0.34 | 0.17 | 0.01 | 0.06 | 0.04 | 0.11 | 0.29 | - |
| CA-7 | 65.40 | 0.28 | 16.95 | 1.70 | 0.01 | 0.60 | 1.07 | 4.41 | 7.32 | 97.74 |
| (10) | 0.58 | 0.03 | 0.51 | 0.22 | 0.01 | 0.05 | 0.04 | 0.15 | 0.24 | - |
| CA-8 | 63.16 | 0.37 | 17.25 | 2.35 | 0.11 | 0.81 | 1.98 | 4.69 | 7.05 | 97.77 |
| (10) | 0.61 | 0.04 | 0.42 | 0.14 | 0.01 | 0.05 | 0.24 | 0.17 | 0.23 | - |
| CA-17 | 62.79 | 0.31 | 17.32 | 2.10 | 0.14 | 0.72 | 1.65 | 4.39 | 7.27 | 96.69 |
| (10) | 0.57 | 0.03 | 0.61 | 0.09 | 0.01 | 0.10 | 0.17 | 0.20 | 0.22 | - |
| CA-21 | 62.60 | 0.32 | 17.37 | 2.13 | 0.05 | 0.88 | 2.20 | 4.35 | 6.48 | 96.38 |
| (10) | 0.82 | 0.02 | 0.39 | 0.13 | 0.01 | 0.04 | 0.15 | 0.13 | 0.20 | - |
| CA-19 | 62.22 | 0.43 | 16.99 | 2.64 | 0.15 | 1.06 | 2.62 | 4.29 | 6.39 | 96.79 |
| (10) | 0.97 | 0.04 | 0.47 | 0.19 | 0.03 | 0.06 | 0.27 | 0.18 | 0.31 | - |
| CA-22 | 61.82 | 0.33 | 17.42 | 2.87 | 0.12 | 1.21 | 3.12 | 4.26 | 6.09 | 97.24 |
| (10) | 0.65 | 0.03 | 0.45 | 0.20 | 0.02 | 0.15 | 0.12 | 0.17 | 0.17 | - |
a Standard deviation is calculated according to the number of analyses in parenthesis.
Table 3.
Major element composition of experimental plagioclases.
| Sample | SiO2 | TiO2 | Al2O3 | FeOtot | MnO | MgO | CaO | Na2O | K2O | Total | An | Ab | Or |
|---|---|---|---|---|---|---|---|---|---|---|---|---|---|
| CA-9 | 58.96 | 0.05 | 25.24 | 0.67 | 0.01 | 0.05 | 6.80 | 6.11 | 1.98 | 99.86 | 0.34 | 0.55 | 0.12 |
| (10) a | 0.93 | 0.03 | 1.20 | 0.26 | 0.02 | 0.05 | 0.77 | 0.15 | 0.55 | - | - | - | - |
| CA-4 | 58.28 | 0.03 | 26.50 | 0.59 | 0.03 | 0.03 | 7.56 | 6.00 | 1.58 | 100.60 | 0.37 | 0.53 | 0.09 |
| (10) | 0.59 | 0.01 | 0.62 | 0.04 | 0.01 | 0.01 | 0.44 | 0.25 | 0.15 | - | - | - | - |
| CA-7 | 57.47 | 0.08 | 26.28 | 0.97 | 0.02 | 0.10 | 7.98 | 5.53 | 1.61 | 100.04 | 0.40 | 0.50 | 0.10 |
| (10) | 0.52 | 0.04 | 0.83 | 0.43 | 0.03 | 0.08 | 0.34 | 0.68 | 0.56 | - | - | - | - |
| CA-8 | 58.65 | 0.05 | 26.02 | 0.51 | 0.01 | 0.02 | 7.07 | 6.05 | 1.76 | 100.13 | 0.35 | 0.54 | 0.10 |
| (10) | 0.73 | 0.00 | 0.12 | 0.08 | 0.00 | 0.00 | 0.13 | 0.07 | 0.06 | - | - | - | - |
| CA-17 | 54.29 | 0.03 | 29.03 | 0.70 | 0.03 | 0.06 | 10.91 | 4.50 | 0.81 | 100.37 | 0.55 | 0.41 | 0.05 |
| (10) | 0.93 | 0.02 | 0.91 | 0.14 | 0.03 | 0.02 | 0.91 | 0.44 | 0.09 | - | - | - | - |
| CA-21 | 54.24 | 0.04 | 28.84 | 0.88 | 0.02 | 0.07 | 10.86 | 4.40 | 0.78 | 100.13 | 0.55 | 0.40 | 0.05 |
| (10) | 0.39 | 0.04 | 0.52 | 0.27 | 0.01 | 0.01 | 0.41 | 0.09 | 0.18 | - | - | - | - |
| CA-19 | 56.37 | 0.05 | 27.61 | 0.57 | 0.02 | 0.04 | 9.56 | 5.17 | 1.13 | 100.51 | 0.47 | 0.46 | 0.07 |
| (10) | 1.19 | 0.02 | 0.65 | 0.13 | 0.03 | 0.01 | 0.79 | 0.32 | 0.29 | - | - | - | - |
| CA-22 | 54.89 | 0.04 | 27.94 | 0.81 | 0.00 | 0.09 | 10.25 | 4.66 | 0.98 | 99.67 | 0.52 | 0.42 | 0.06 |
| (10) | 1.12 | 0.02 | 0.80 | 0.21 | 0.01 | 0.09 | 0.51 | 0.28 | 0.26 | - | - | - | - |
a standard deviation is calculated for the number of analyses in parenthesis.
© 2019 by the authors. Licensee MDPI, Basel, Switzerland. This article is an open access article distributed under the terms and conditions of the Creative Commons Attribution (CC BY) license (http://creativecommons.org/licenses/by/4.0/).
Share and Cite
MDPI and ACS Style
Masotta, M.; Mollo, S. A New Plagioclase-Liquid Hygrometer Specific to Trachytic Systems. Minerals 2019, 9, 375. https://doi.org/10.3390/min9060375
AMA Style
Masotta M, Mollo S. A New Plagioclase-Liquid Hygrometer Specific to Trachytic Systems. Minerals. 2019; 9(6):375. https://doi.org/10.3390/min9060375
Chicago/Turabian StyleMasotta, Matteo, and Silvio Mollo. 2019. "A New Plagioclase-Liquid Hygrometer Specific to Trachytic Systems" Minerals 9, no. 6: 375. https://doi.org/10.3390/min9060375
Note that from the first issue of 2016, this journal uses article numbers instead of page numbers. See further details here.