Comparison of the Mineralogy of Iron Ore Sinters Using a Range of Techniques

 , , ,
, , , 
Abstract
:1. Introduction
2. Analysis Techniques
2.1. Overview
- University of Newcastle (UON). Sinter mineralogy was analysed by PC and TIMA, and bulk chemical composition and FeO concentration were analysed by XRF and wet chemistry, respectively.
- BlueScope Steel Ltd. (BSL) Port Kembla. Sinter mineralogy was analysed by PC.
- CSIRO Mineral Resources (Clayton, Waterford and QCAT). Sinter mineralogy was analysed by PC, the Mineral4/Recognition4 optical image analysis system, QEMSCAN and QXRD.
- University of Wollongong (UOW). Sinter mineralogy was analysed by image analysis.
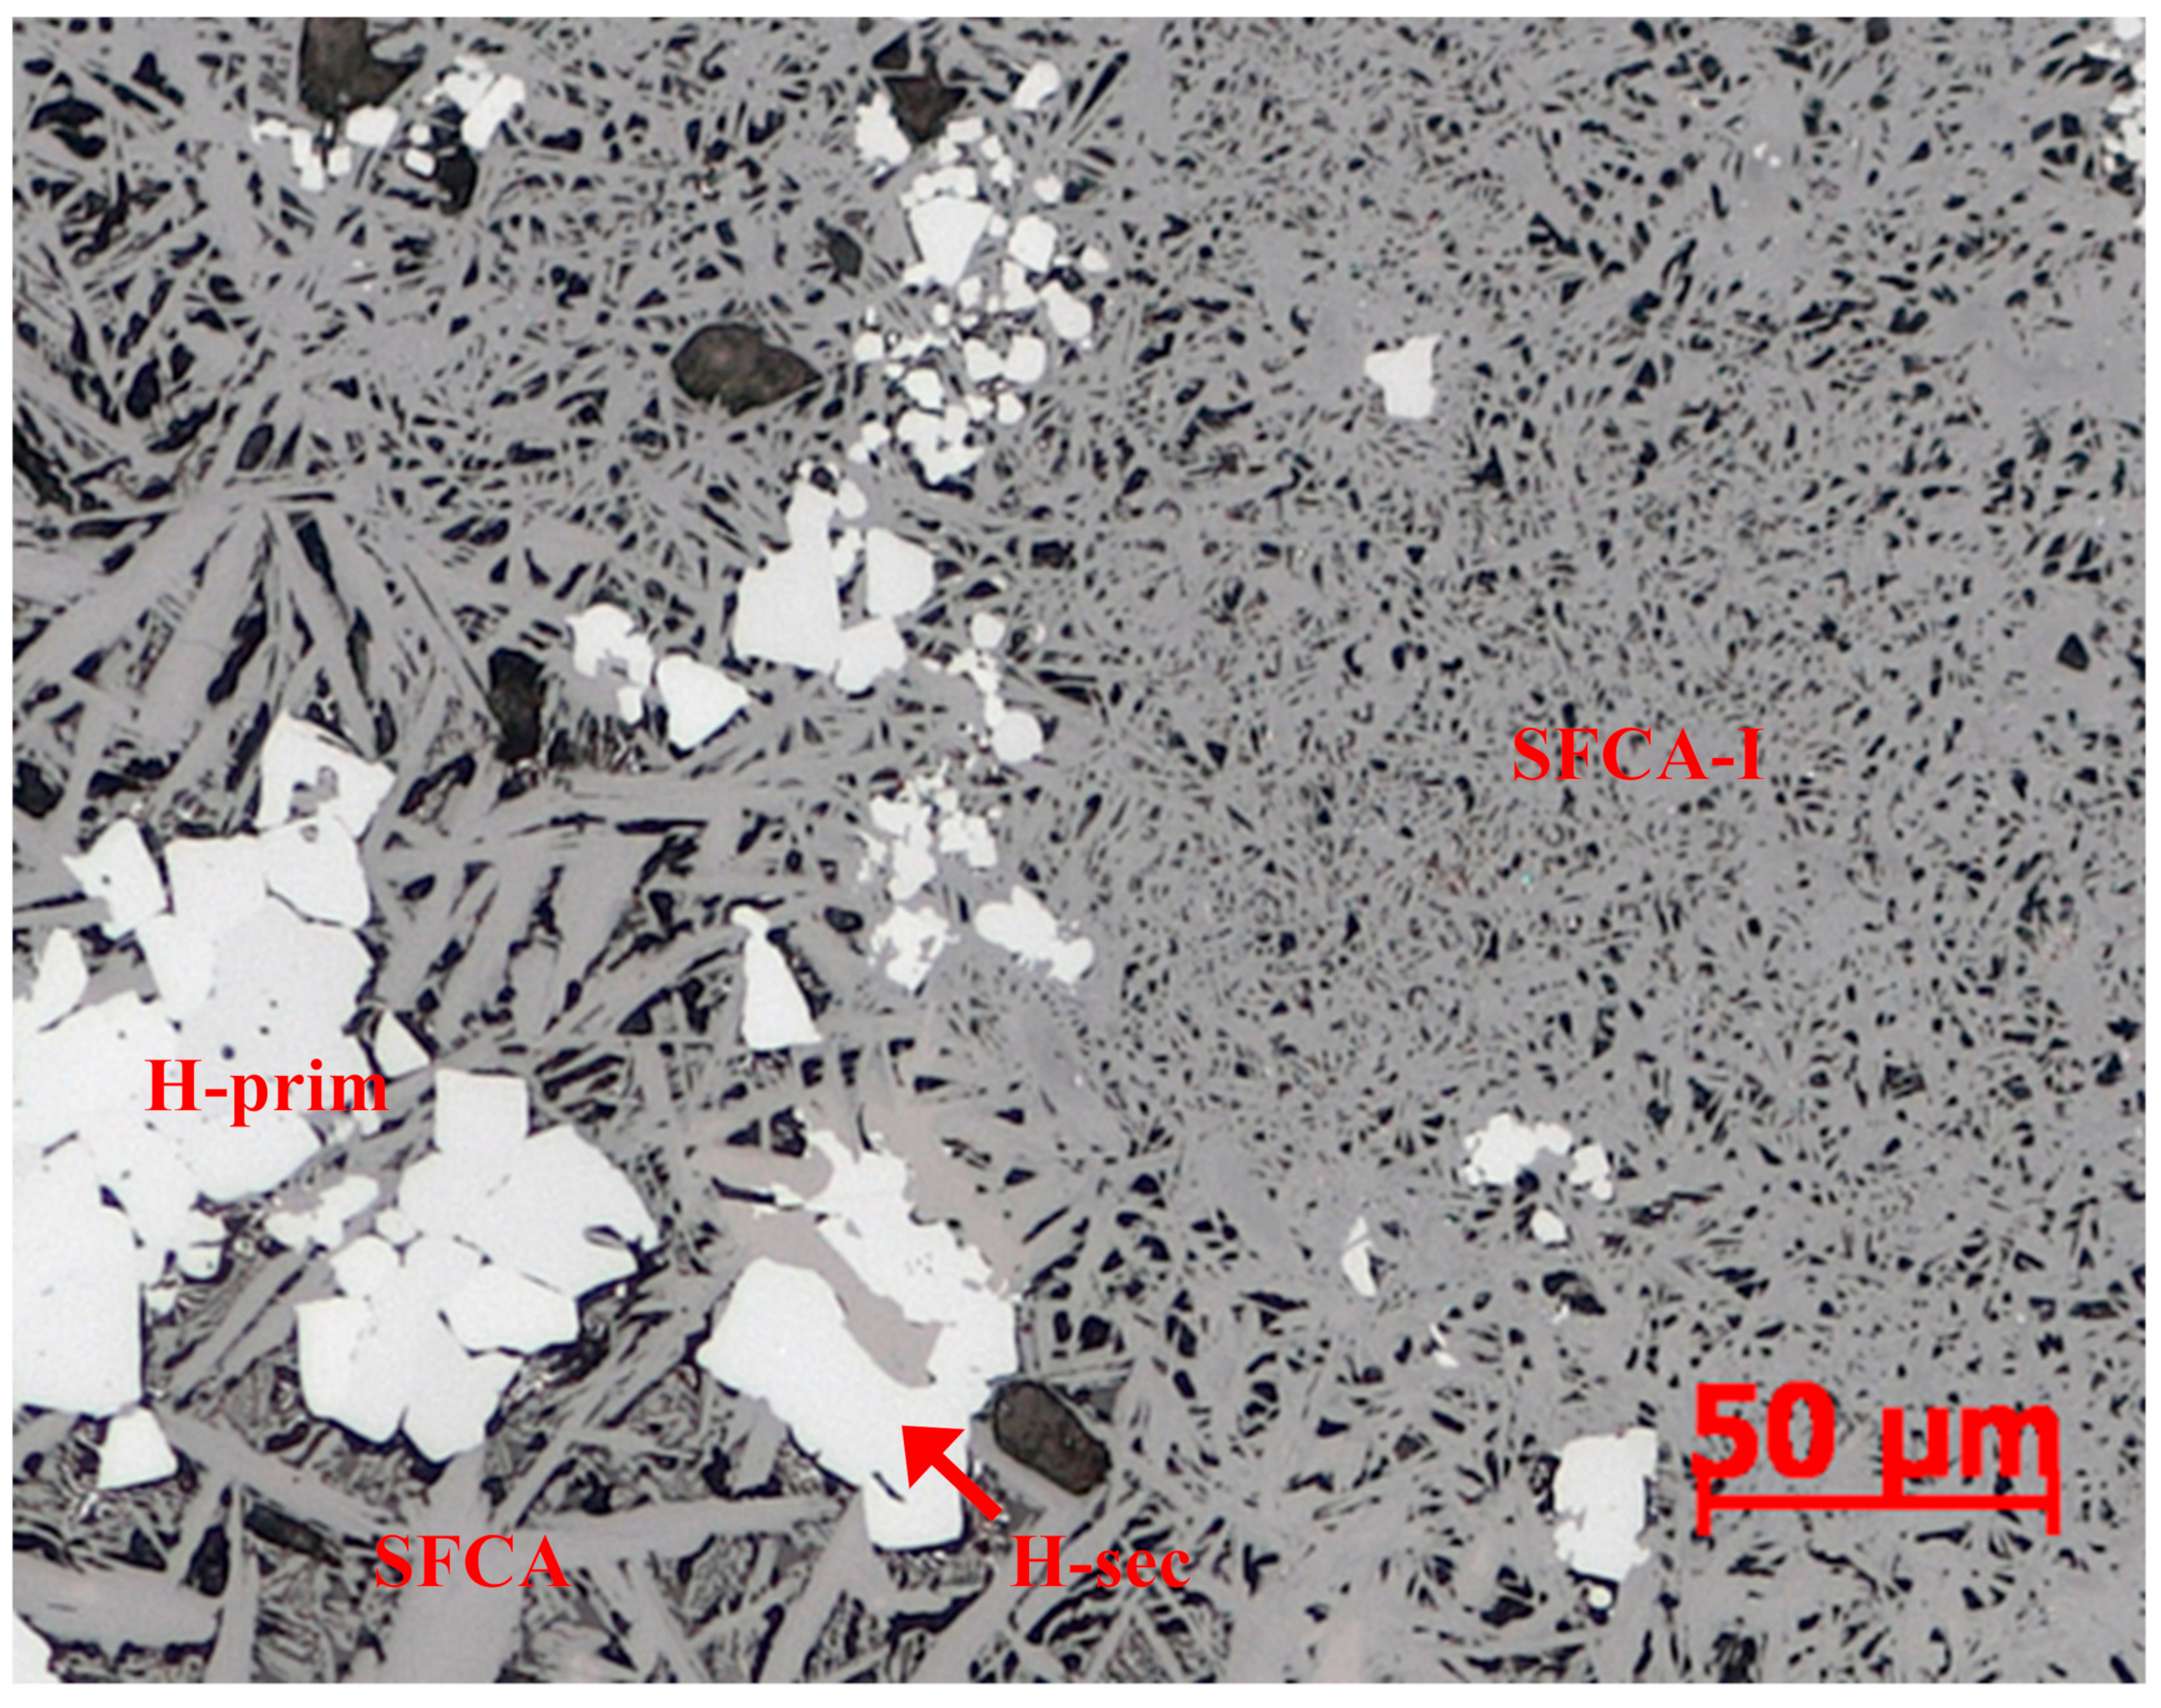
2.2. Reflected Light Microscopy–PC
- primary hematite
- secondary hematite
- magnetite
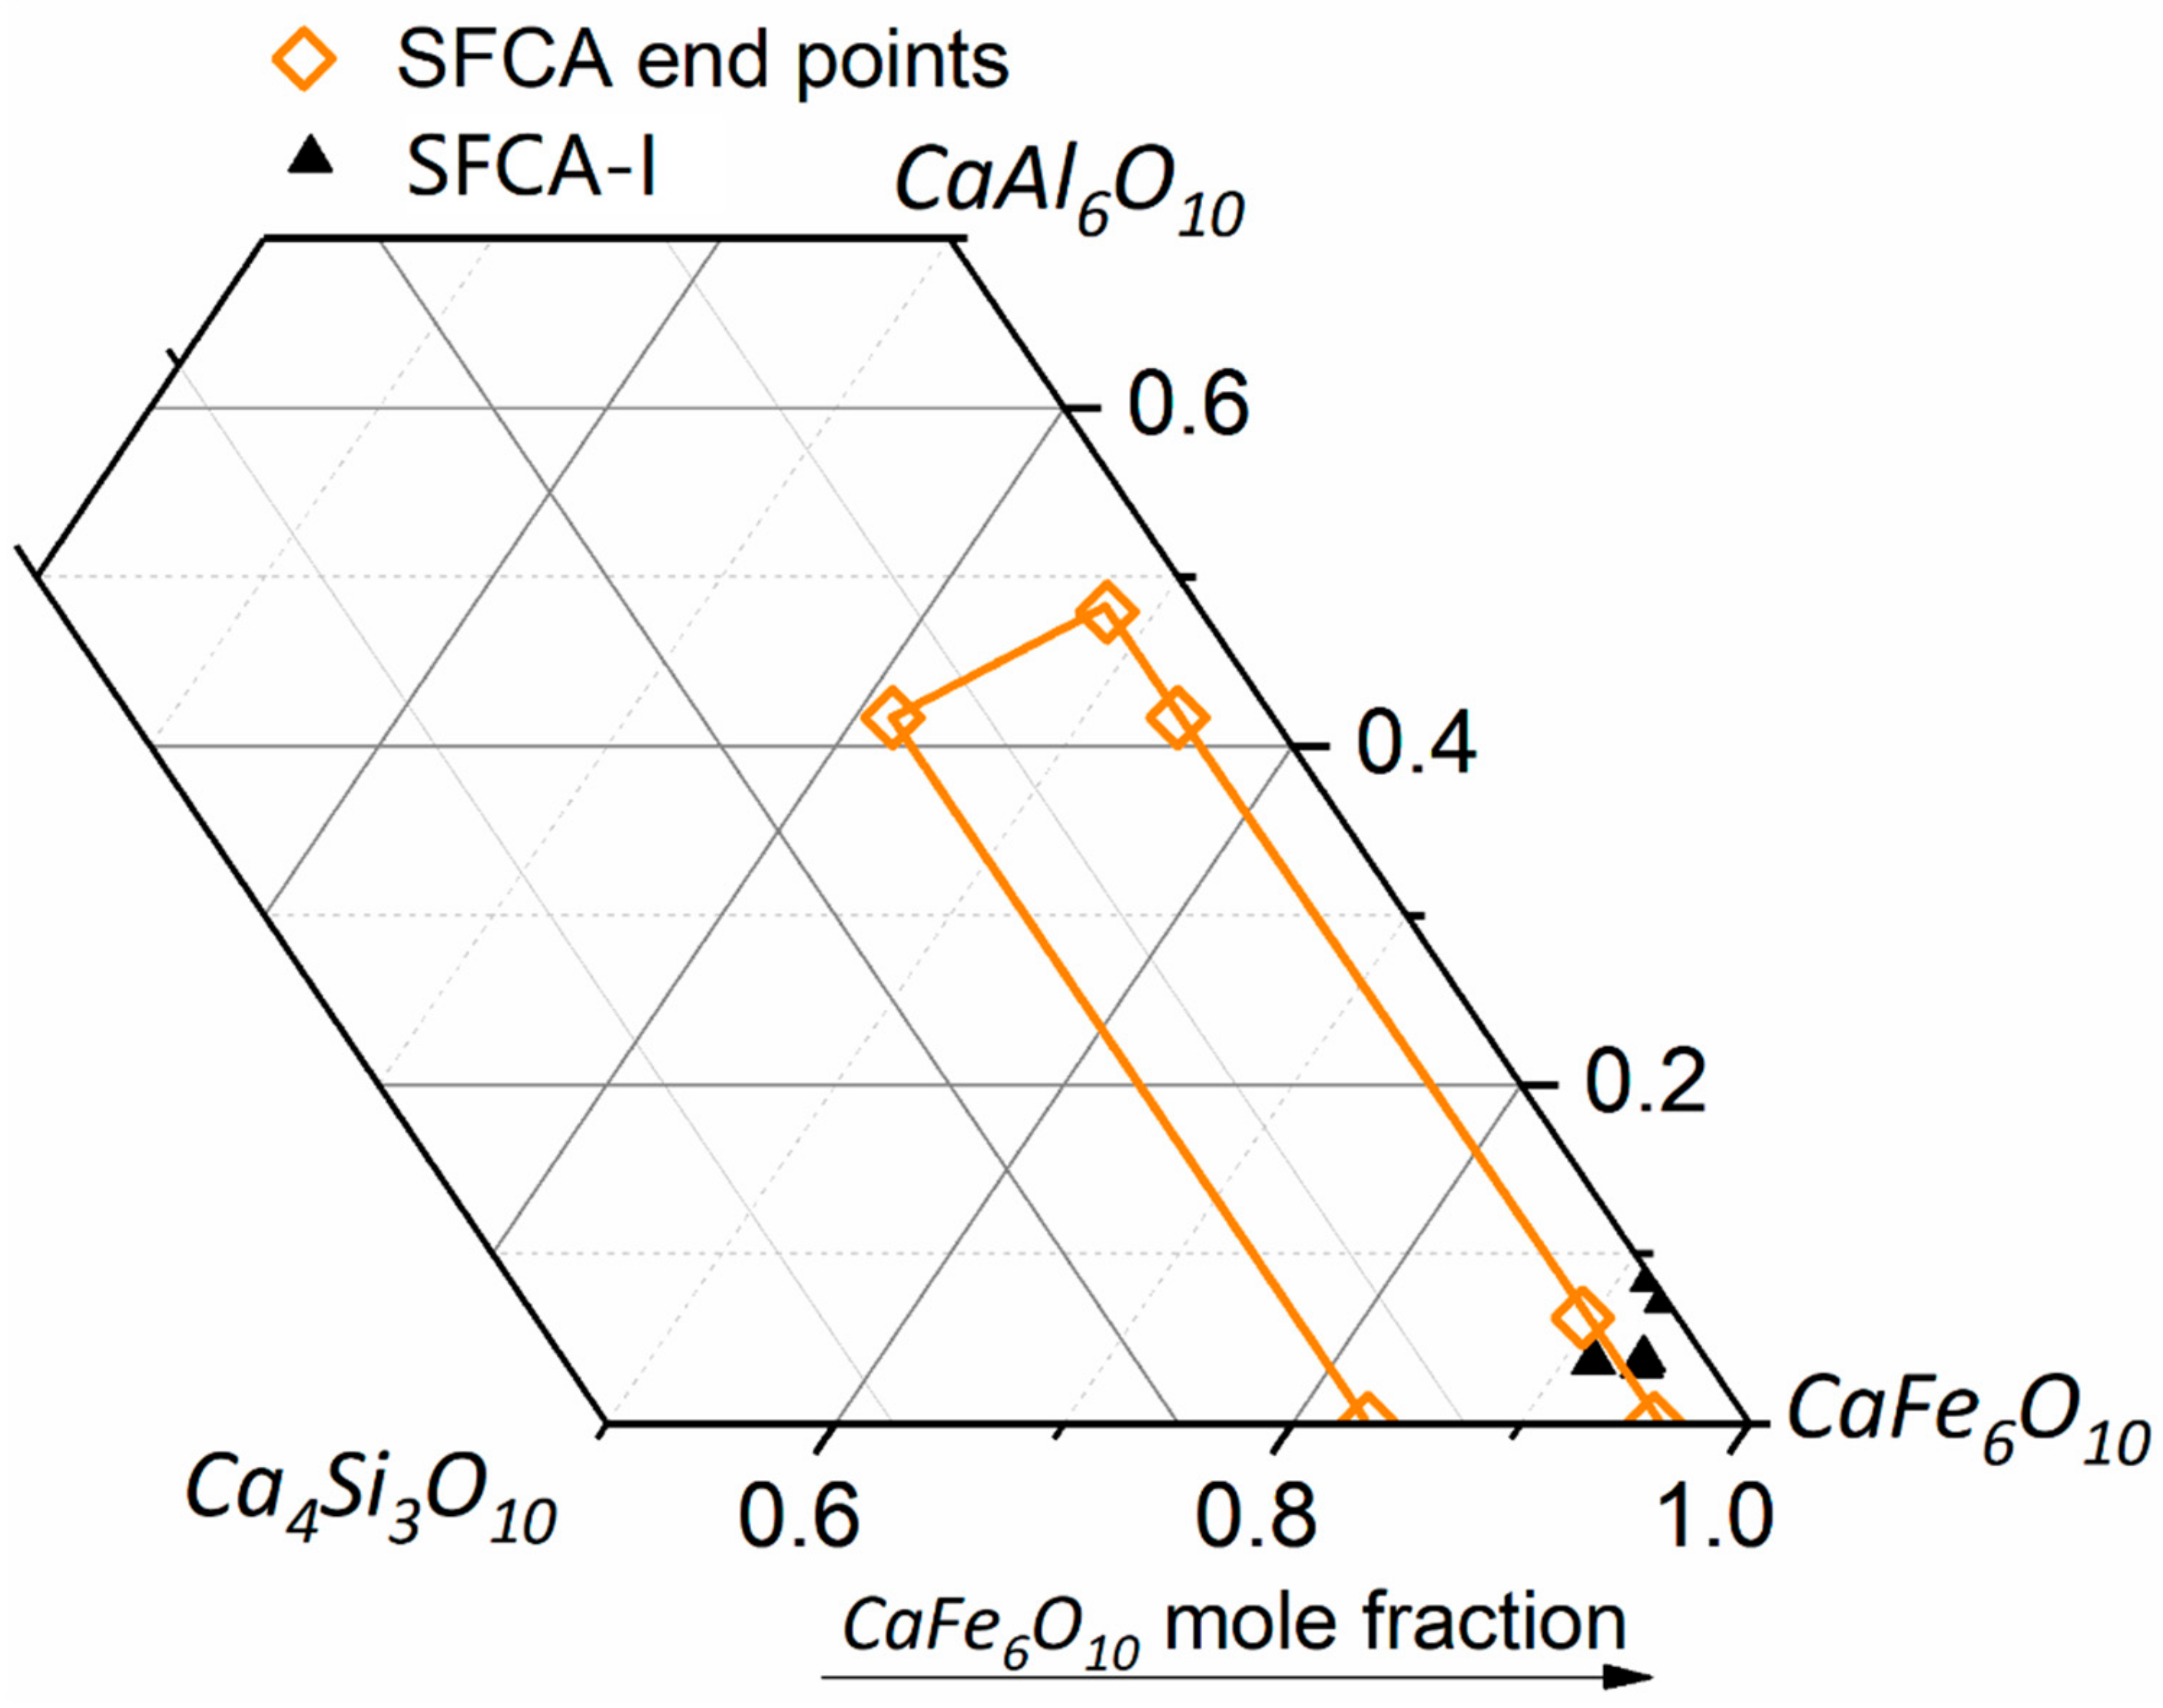
- platy SFCA-I
- prismatic SFCA, including morphological subtypes blocky and dendritic
- dicalcium silicate (C2S)
- glass
2.3. Automated Image Analysis (AIA)
2.4. Quantitative X-ray Diffraction
2.5. Scanning Electron Microscopy (SEM)
2.5.1. QEMSCAN
2.5.2. TIMA
3. Sinter Mineralogy Results
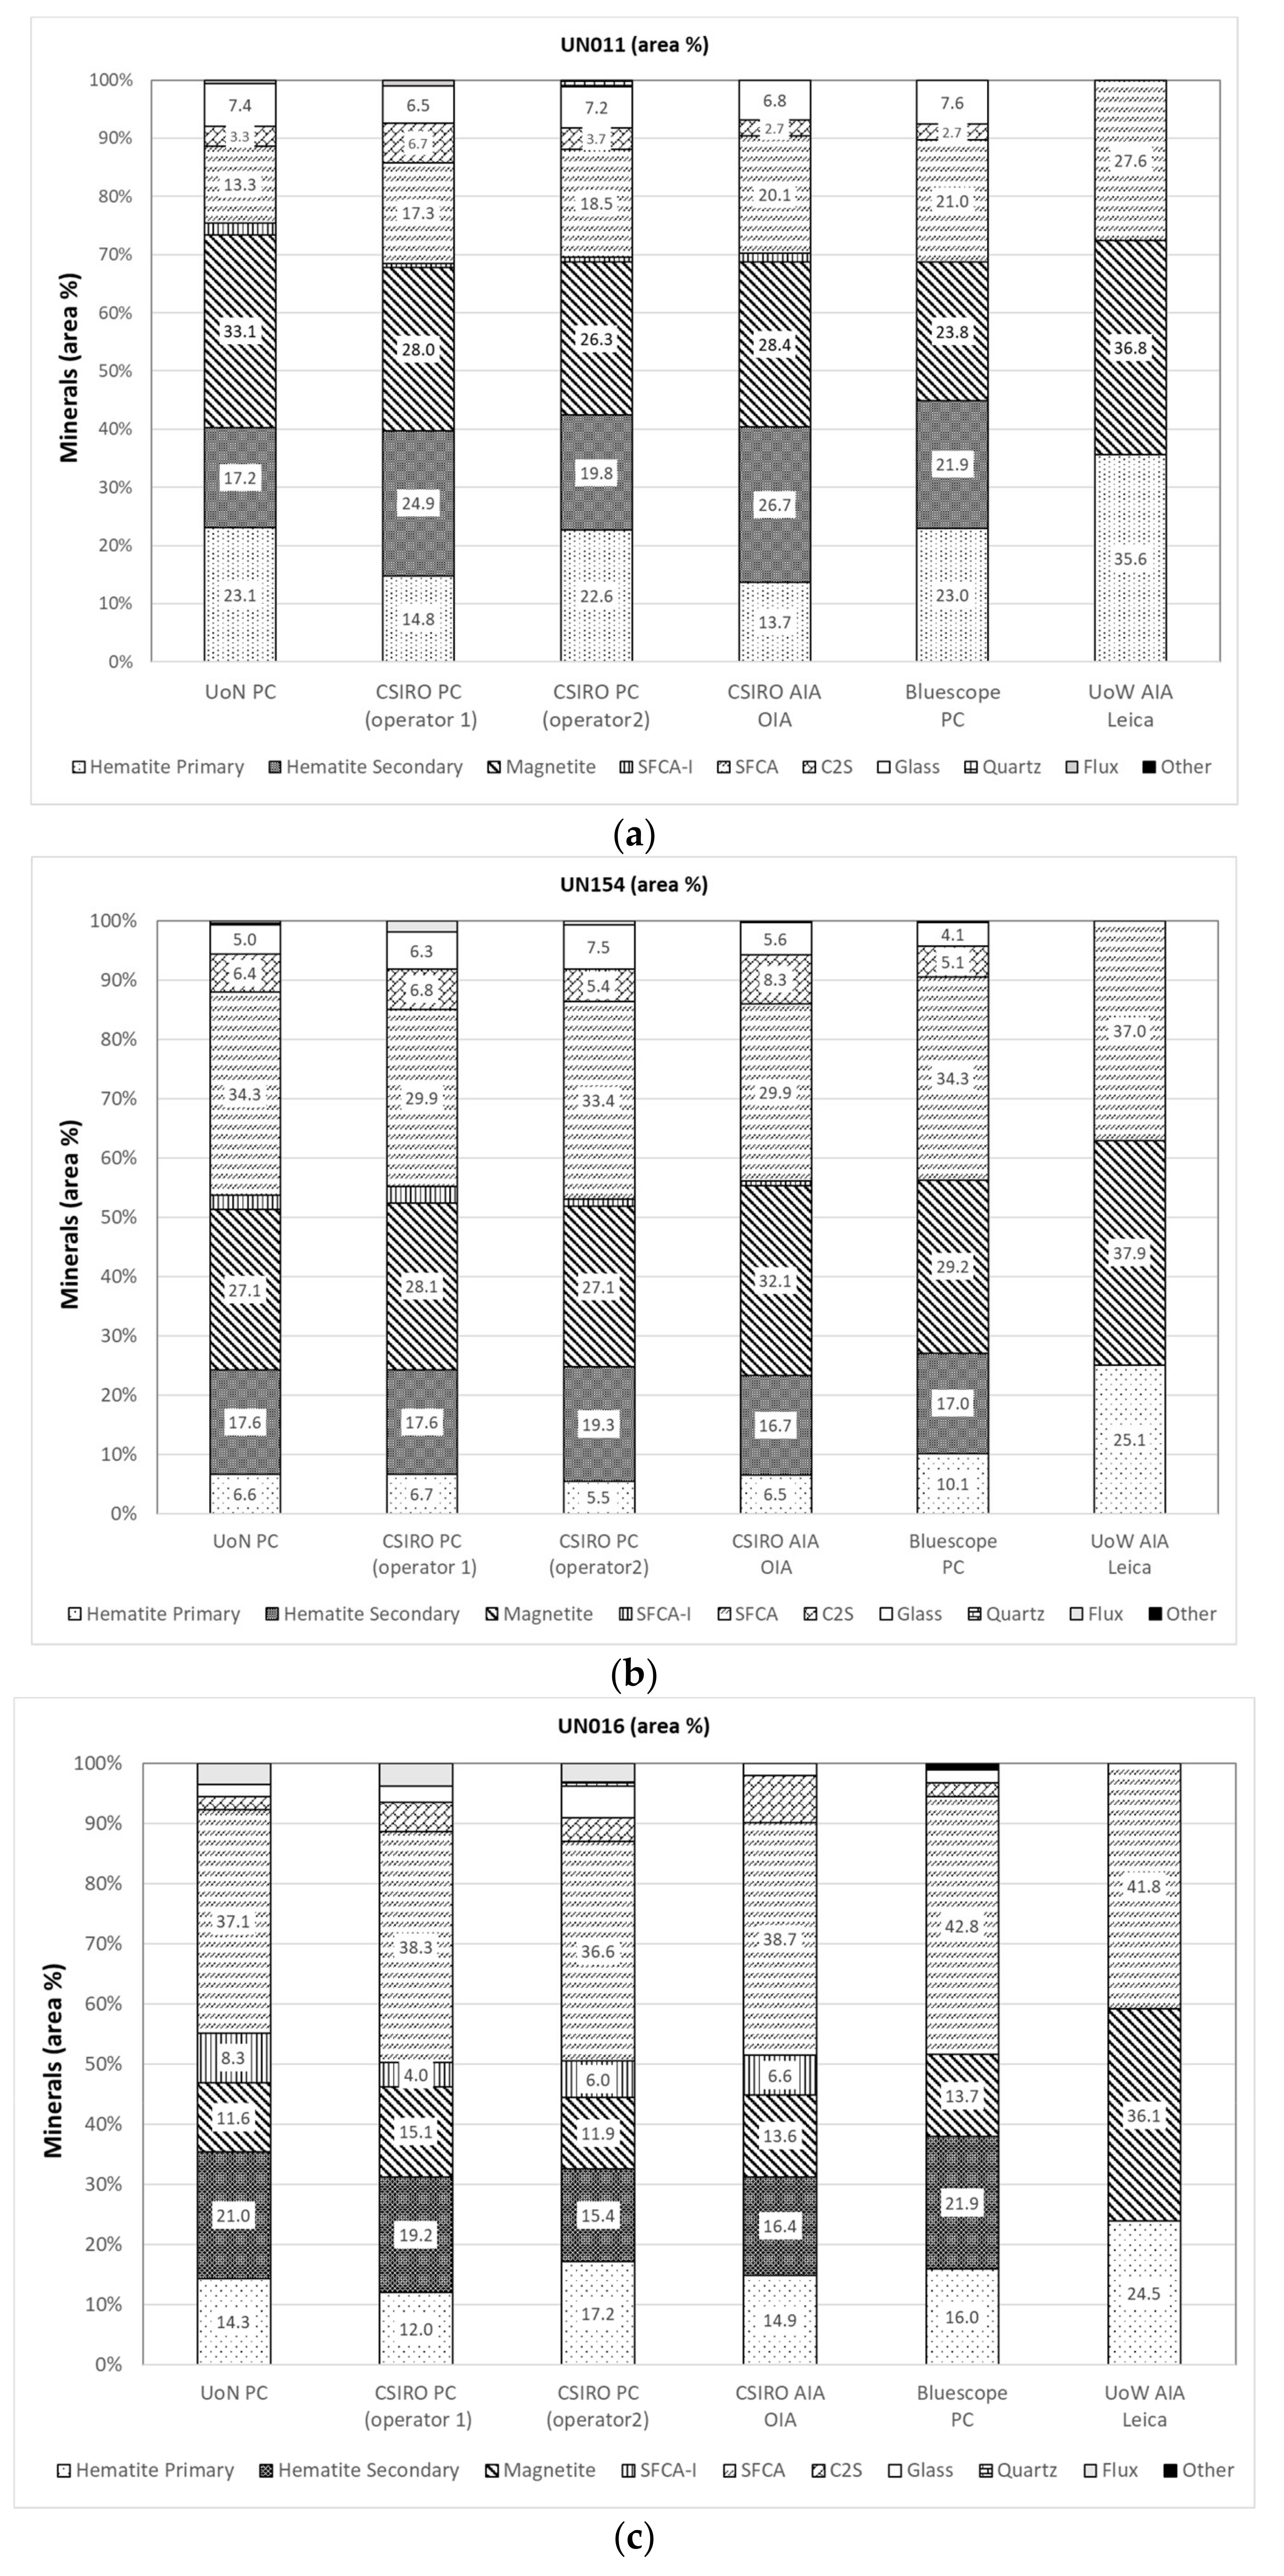
3.1. Reflected Light Microscopy
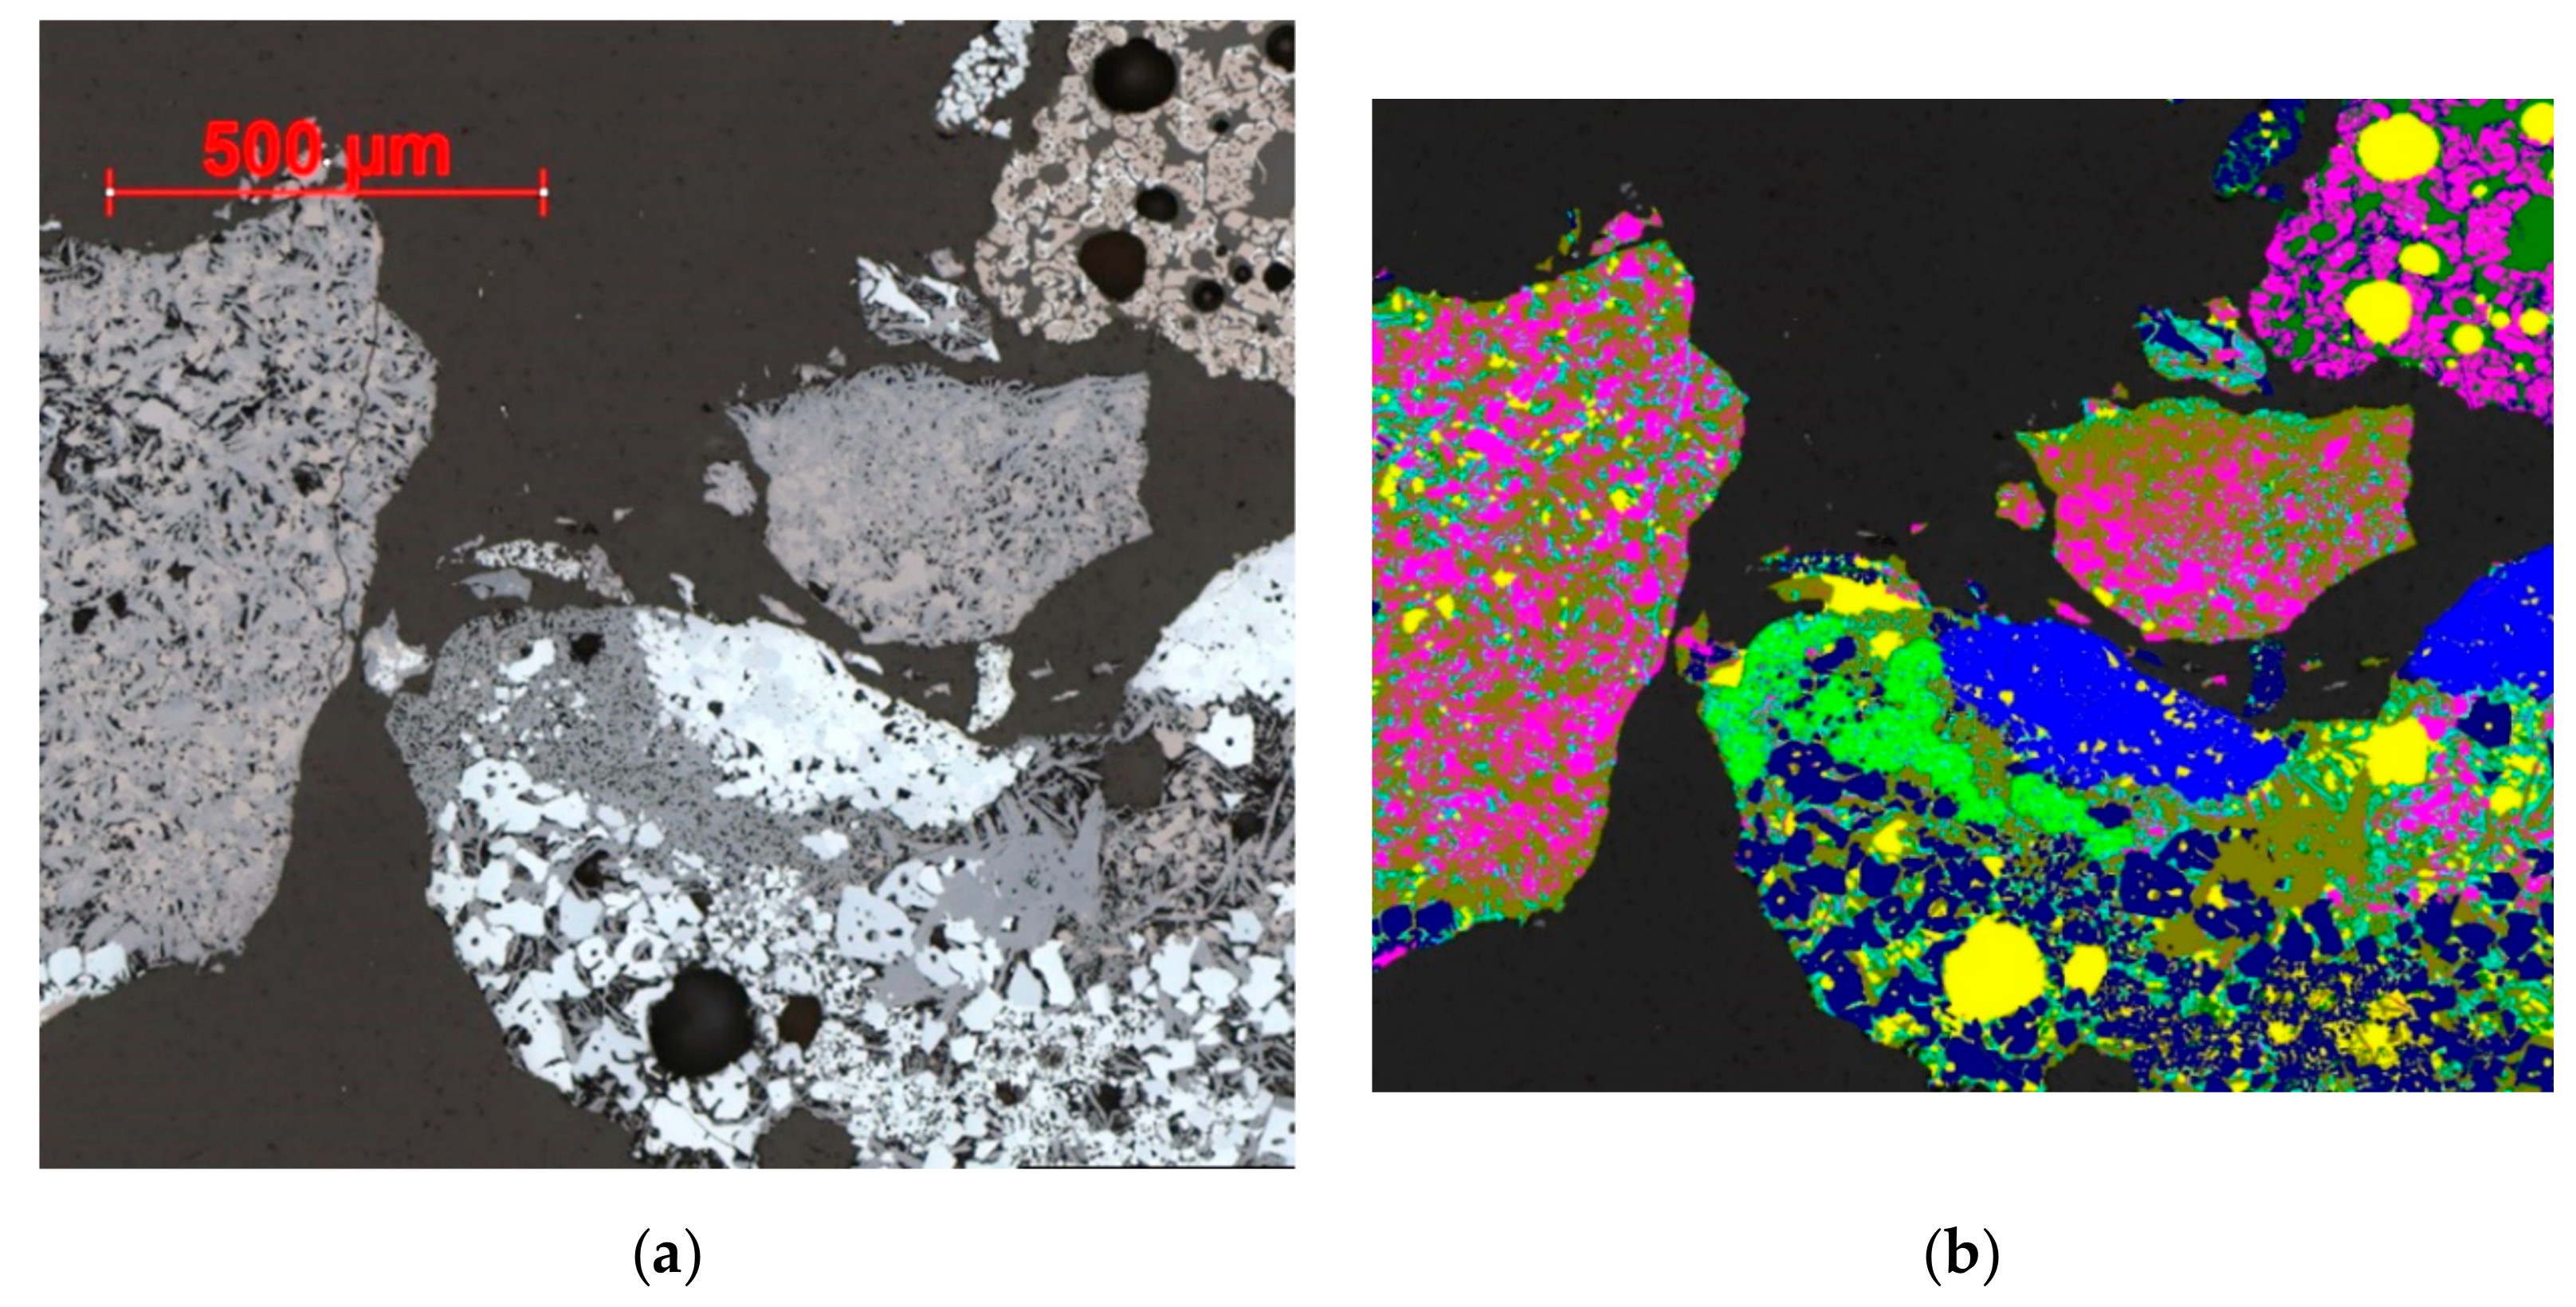
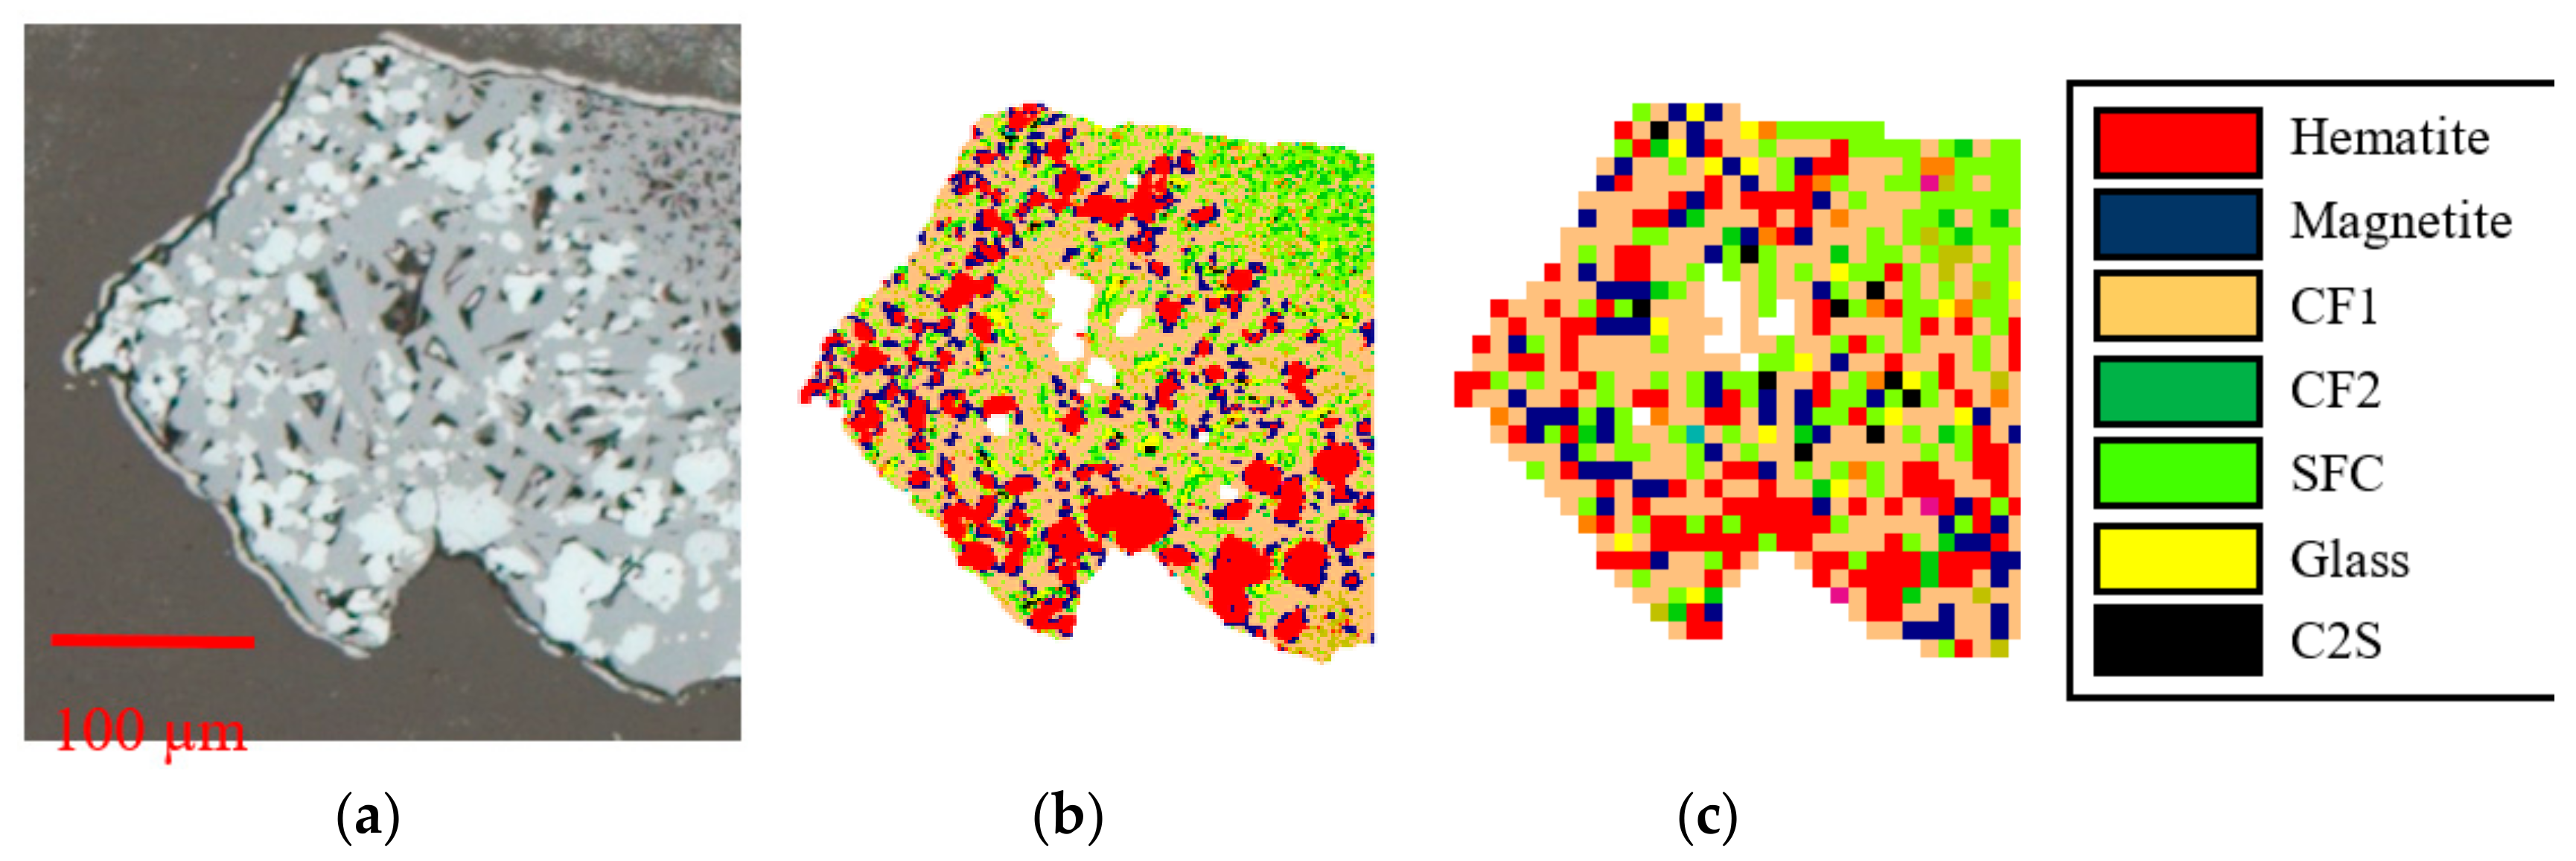
3.2. Automated Image Analysis (AIA)
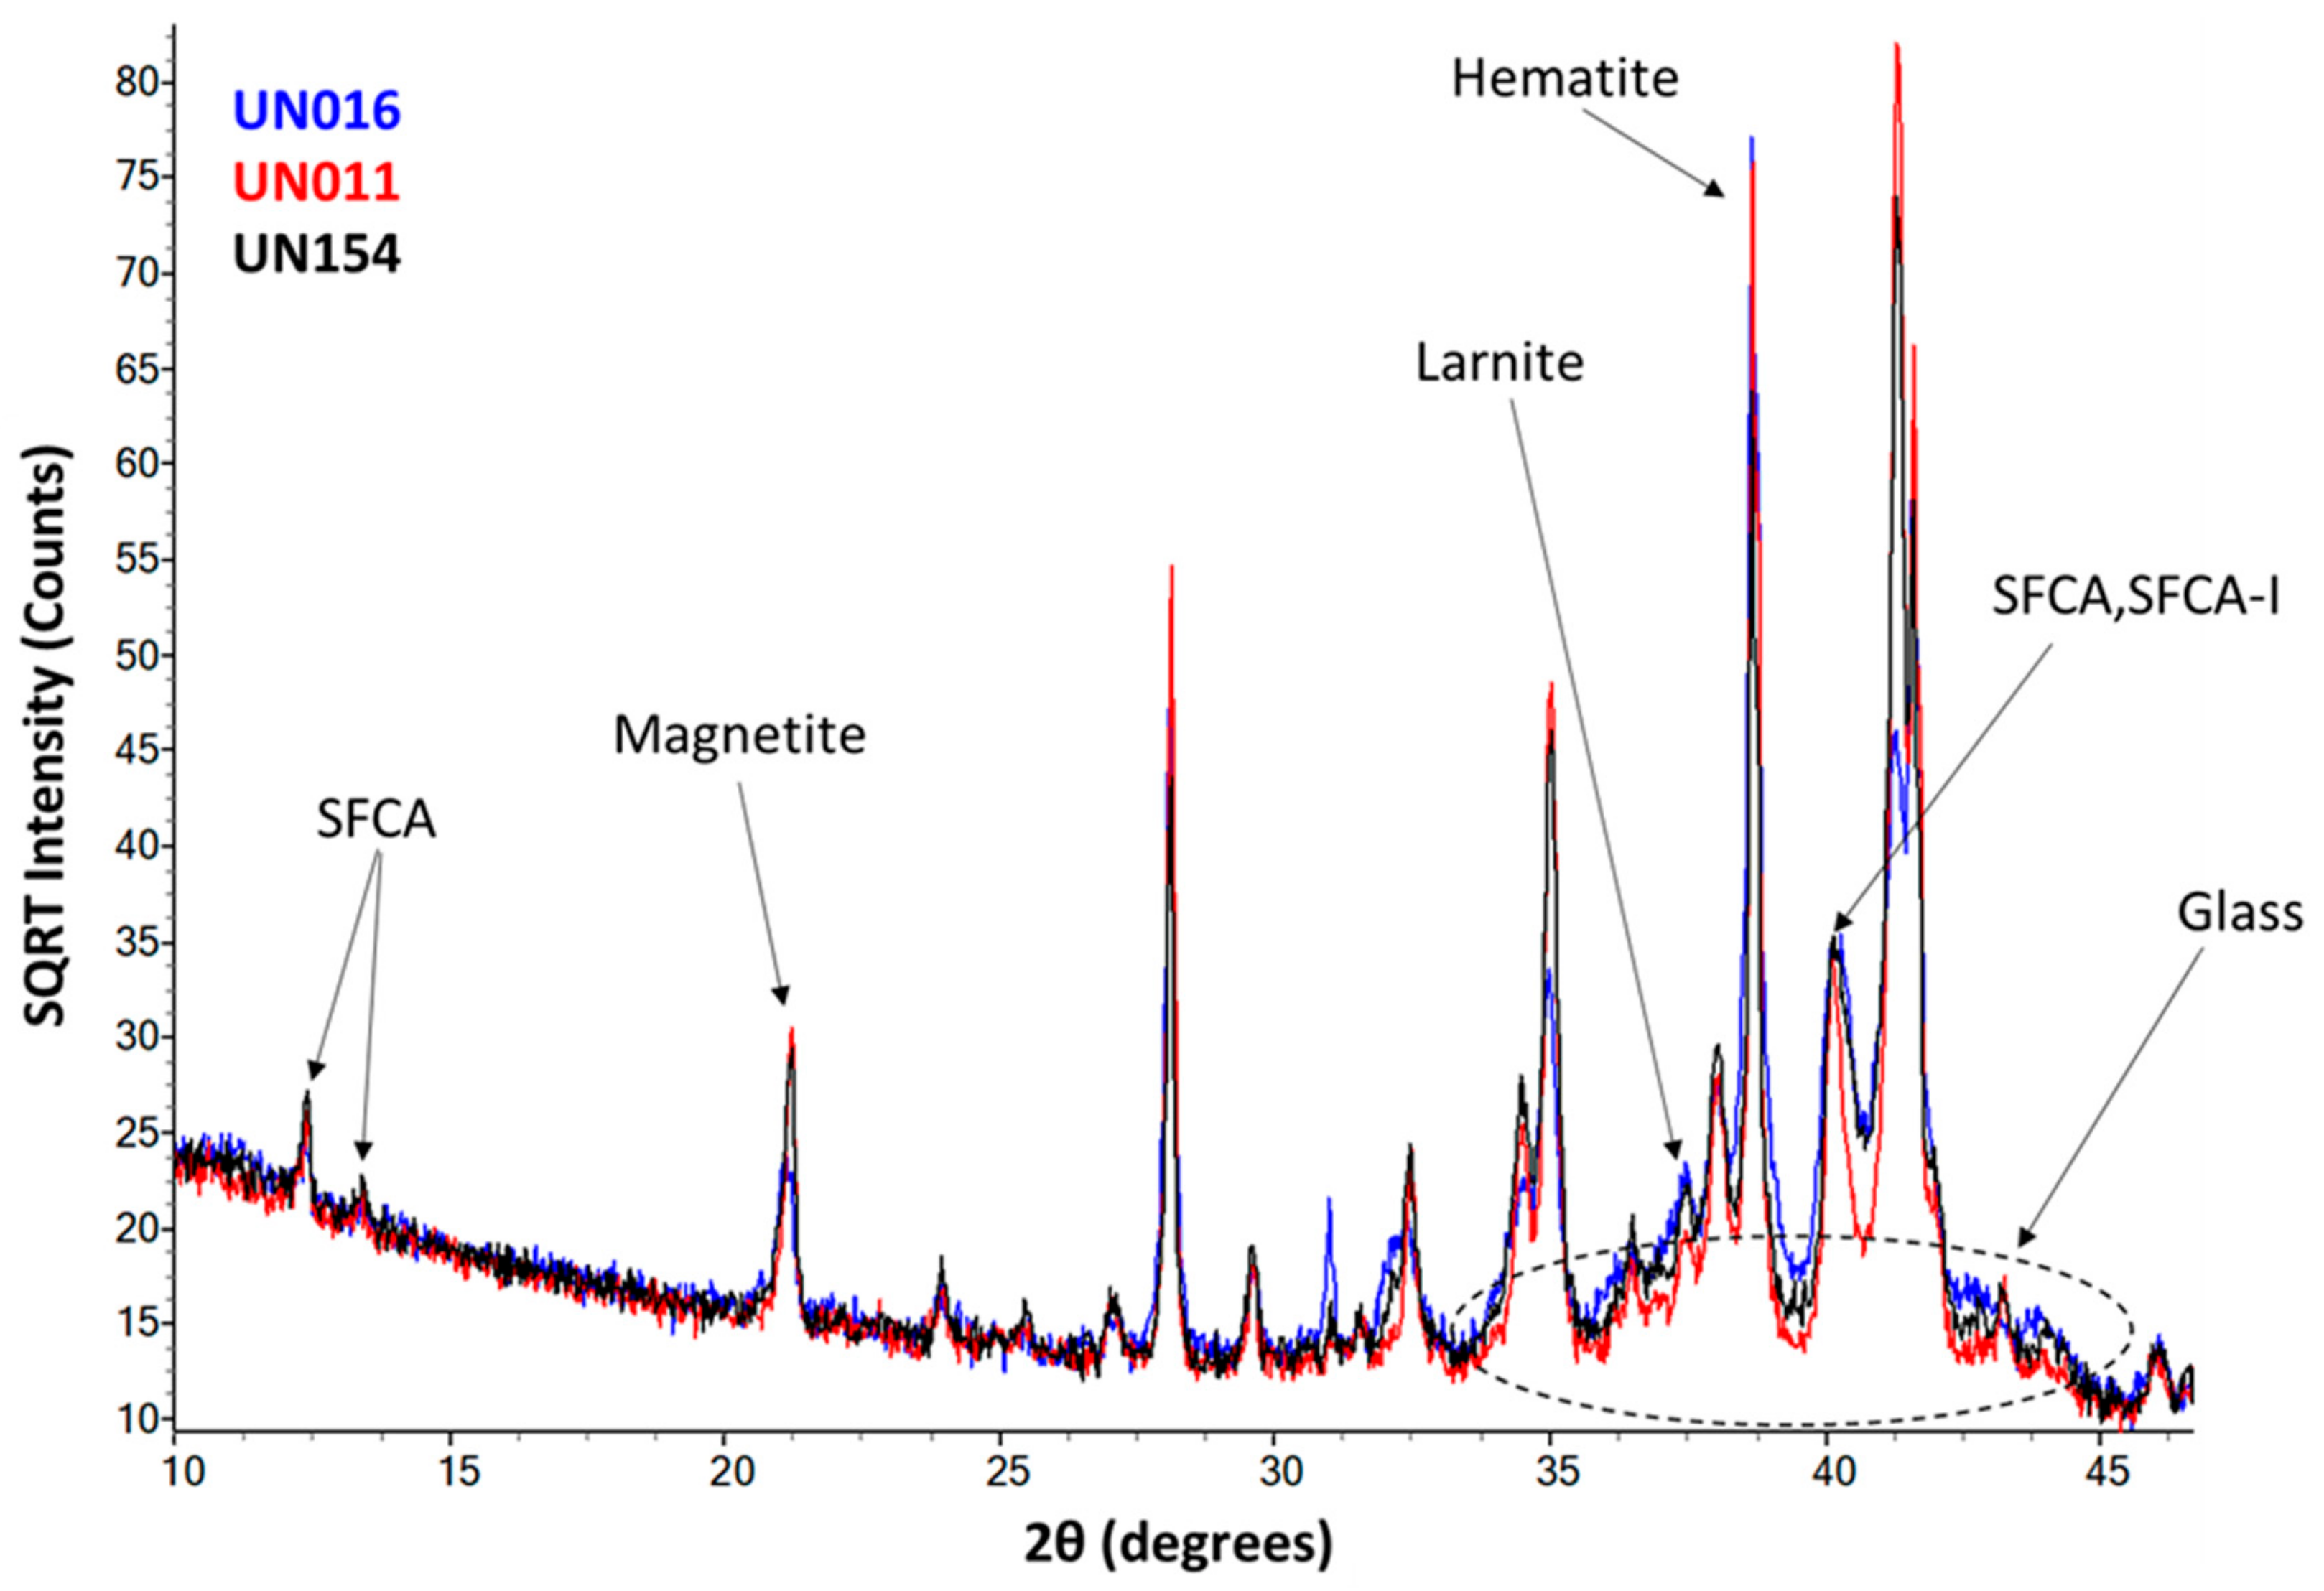
3.3. Quantitative X-Ray Diffraction
3.4. SEM
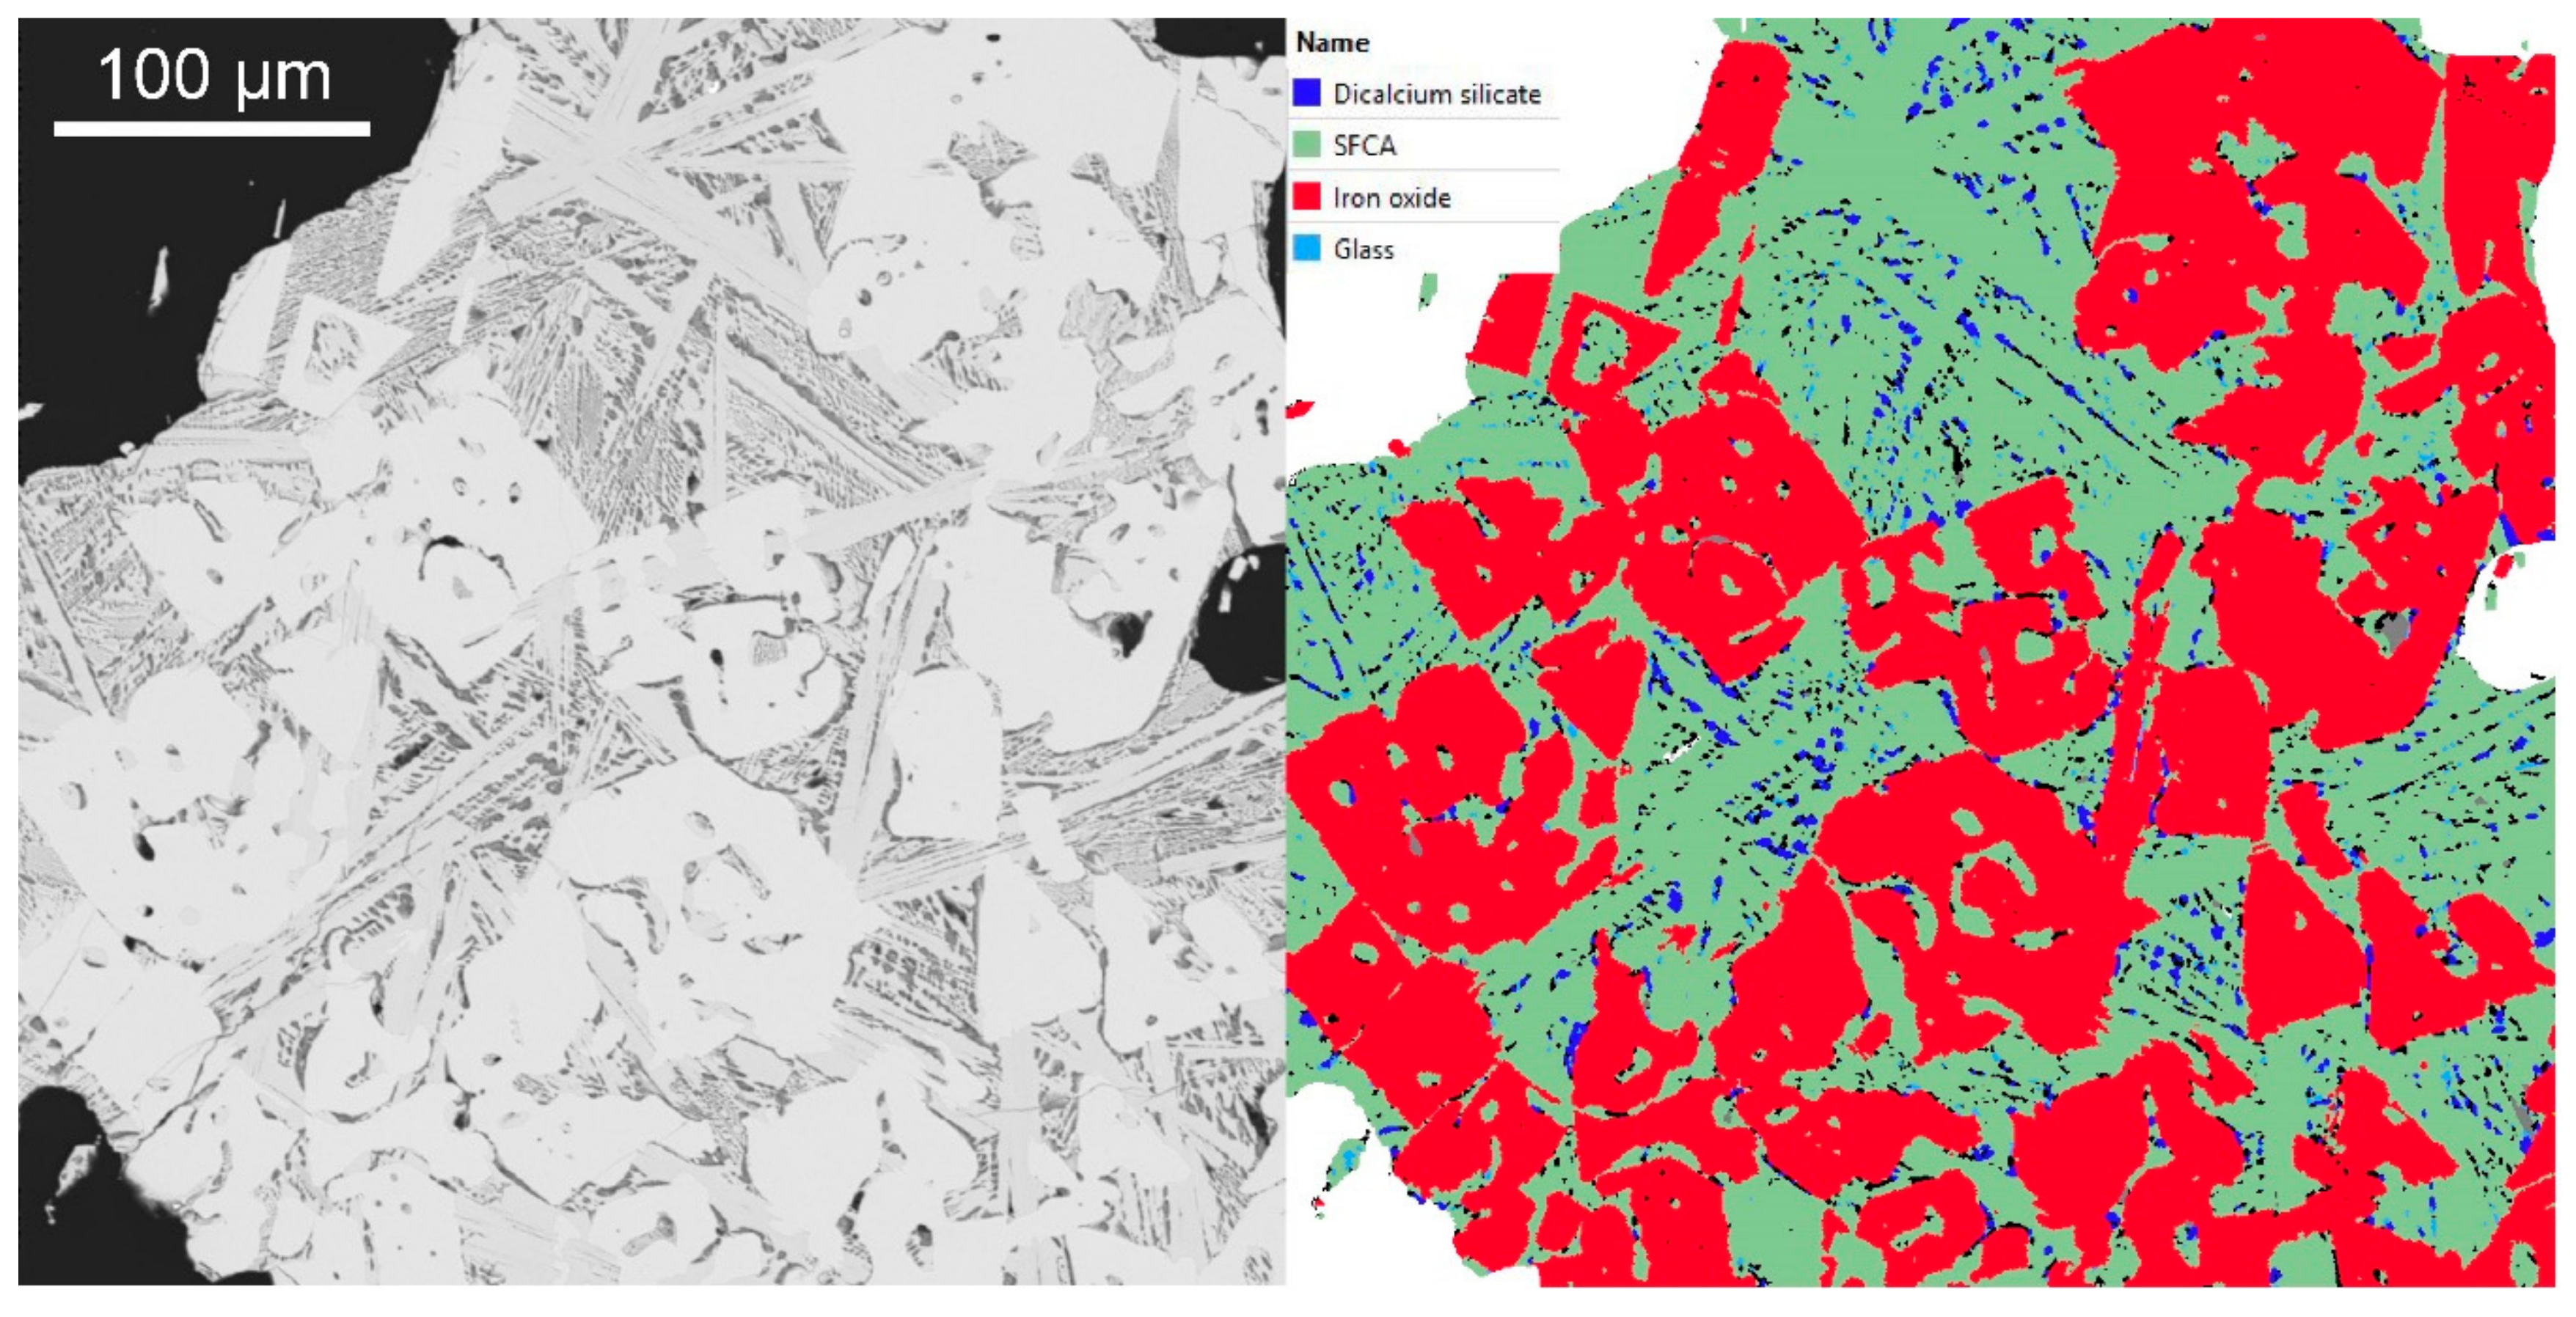
3.4.1. QEMSCAN
3.4.2. TIMA
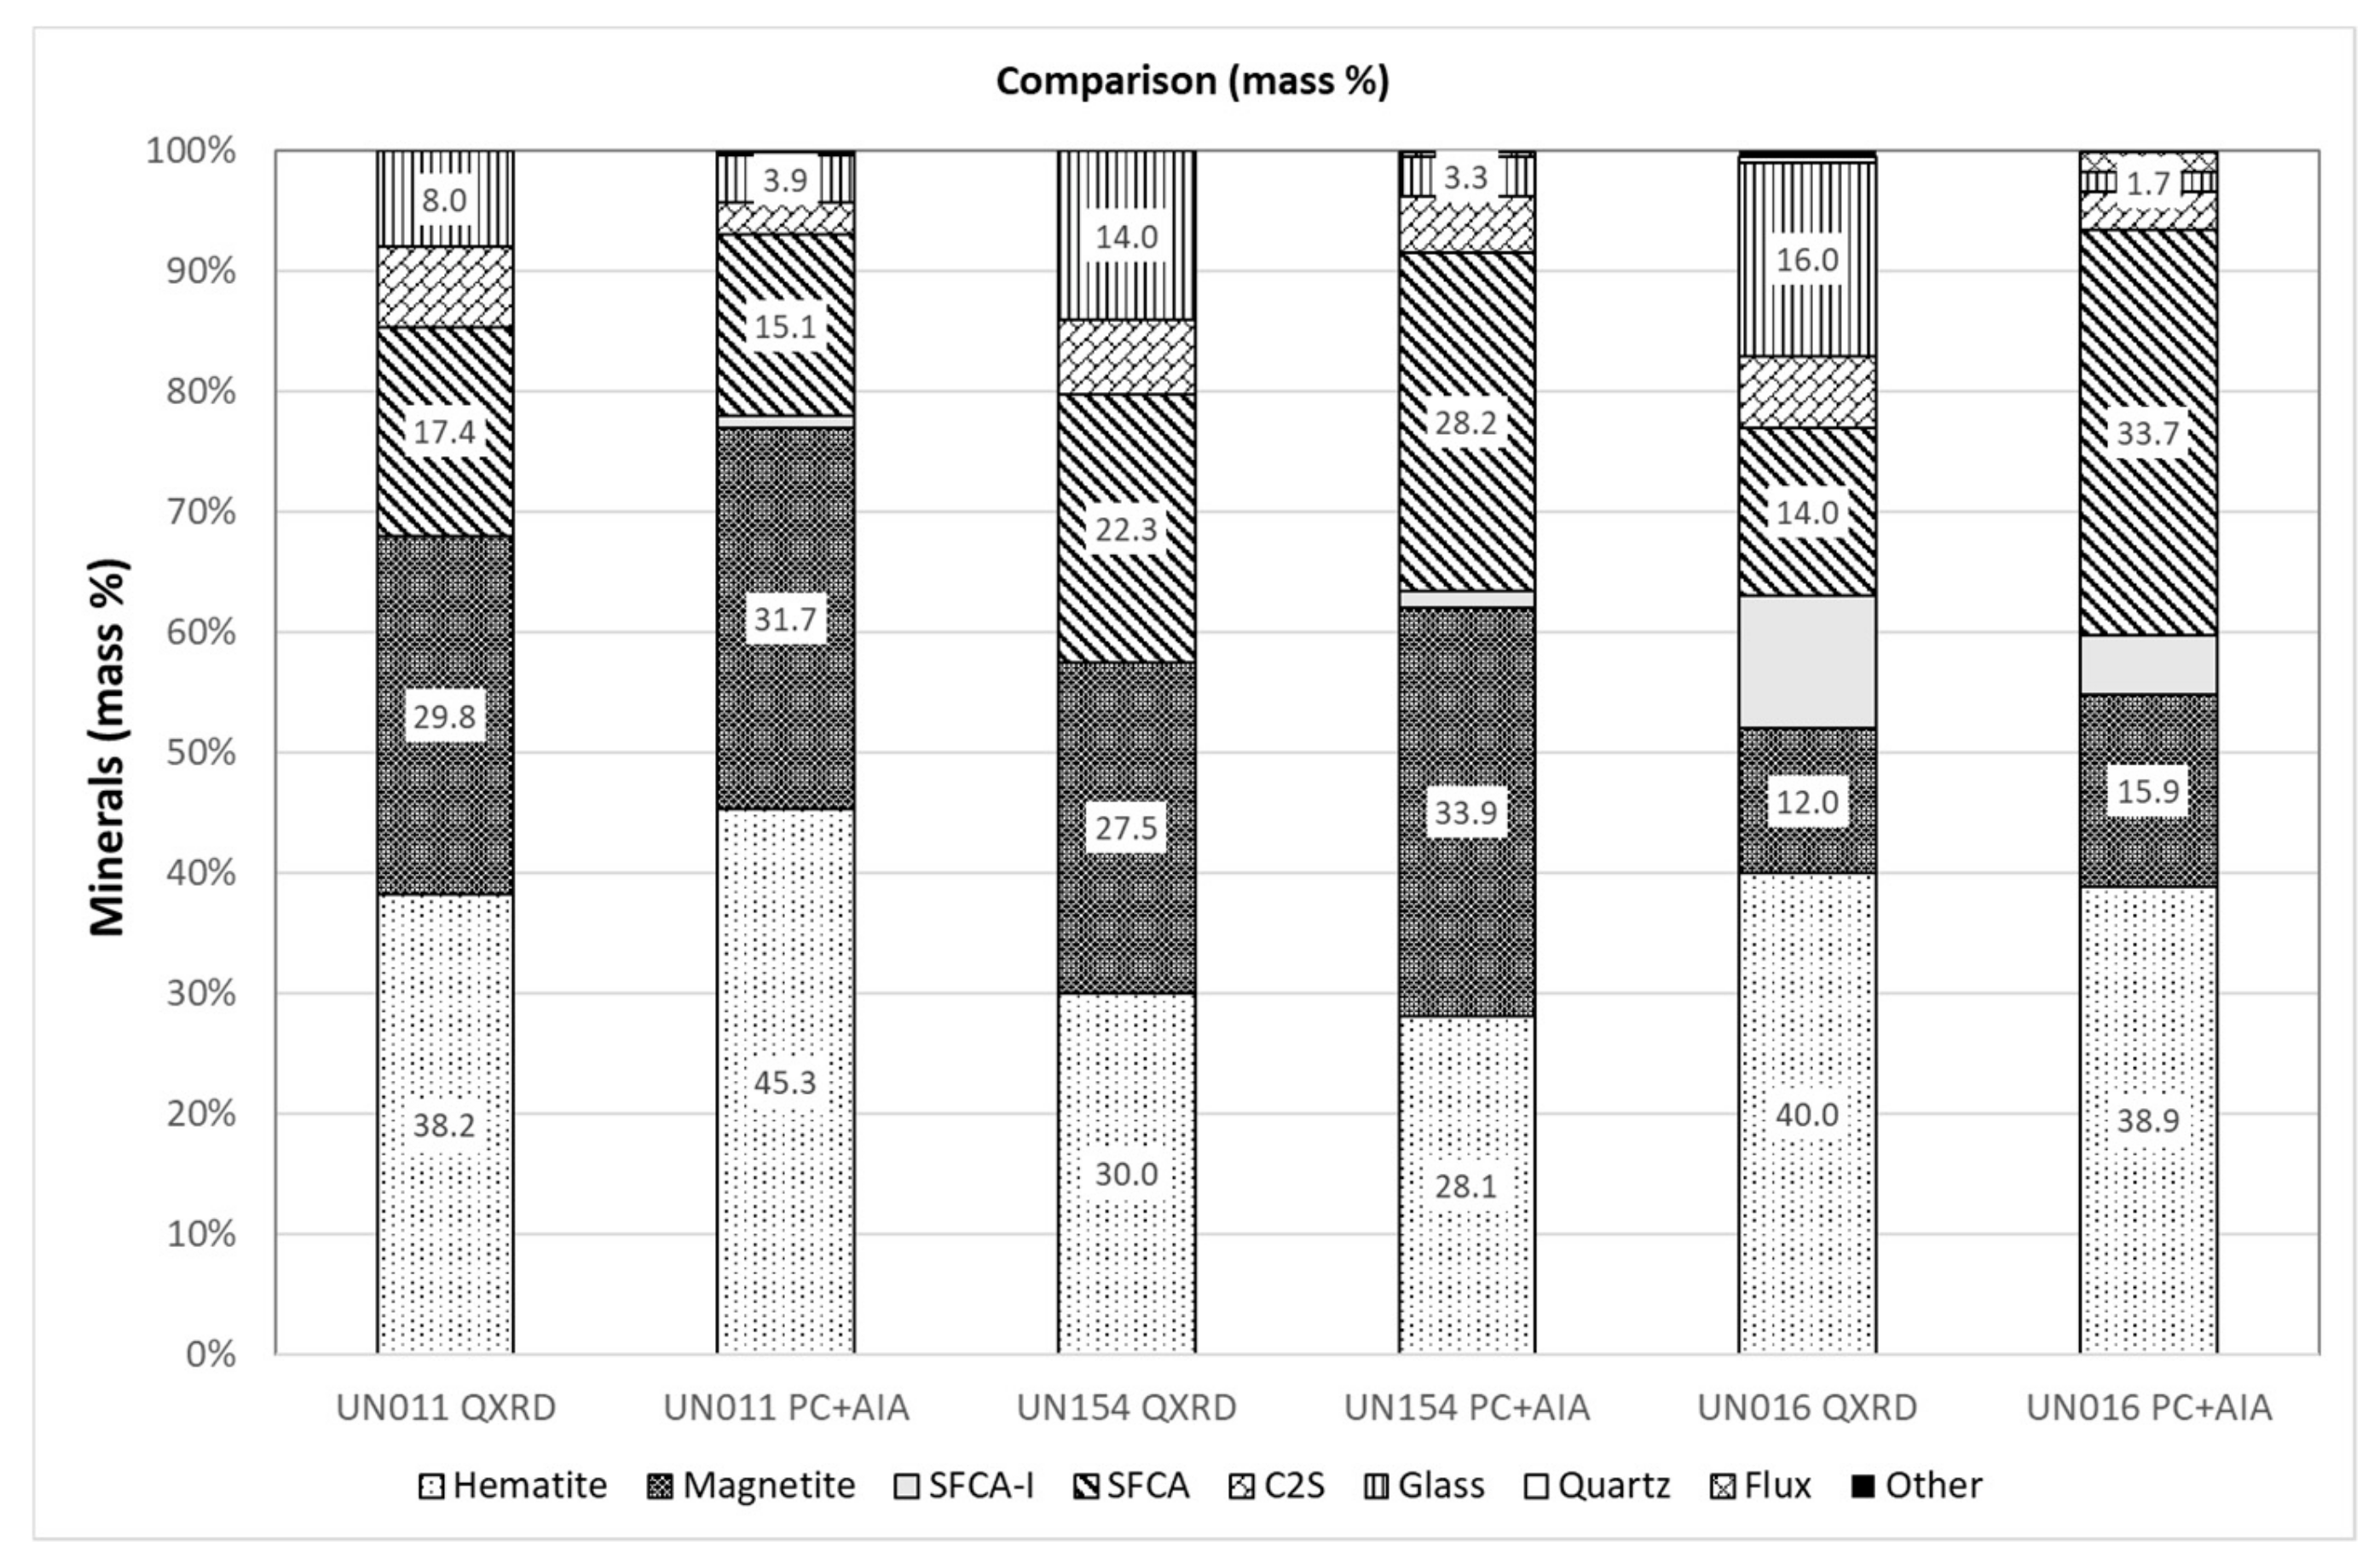
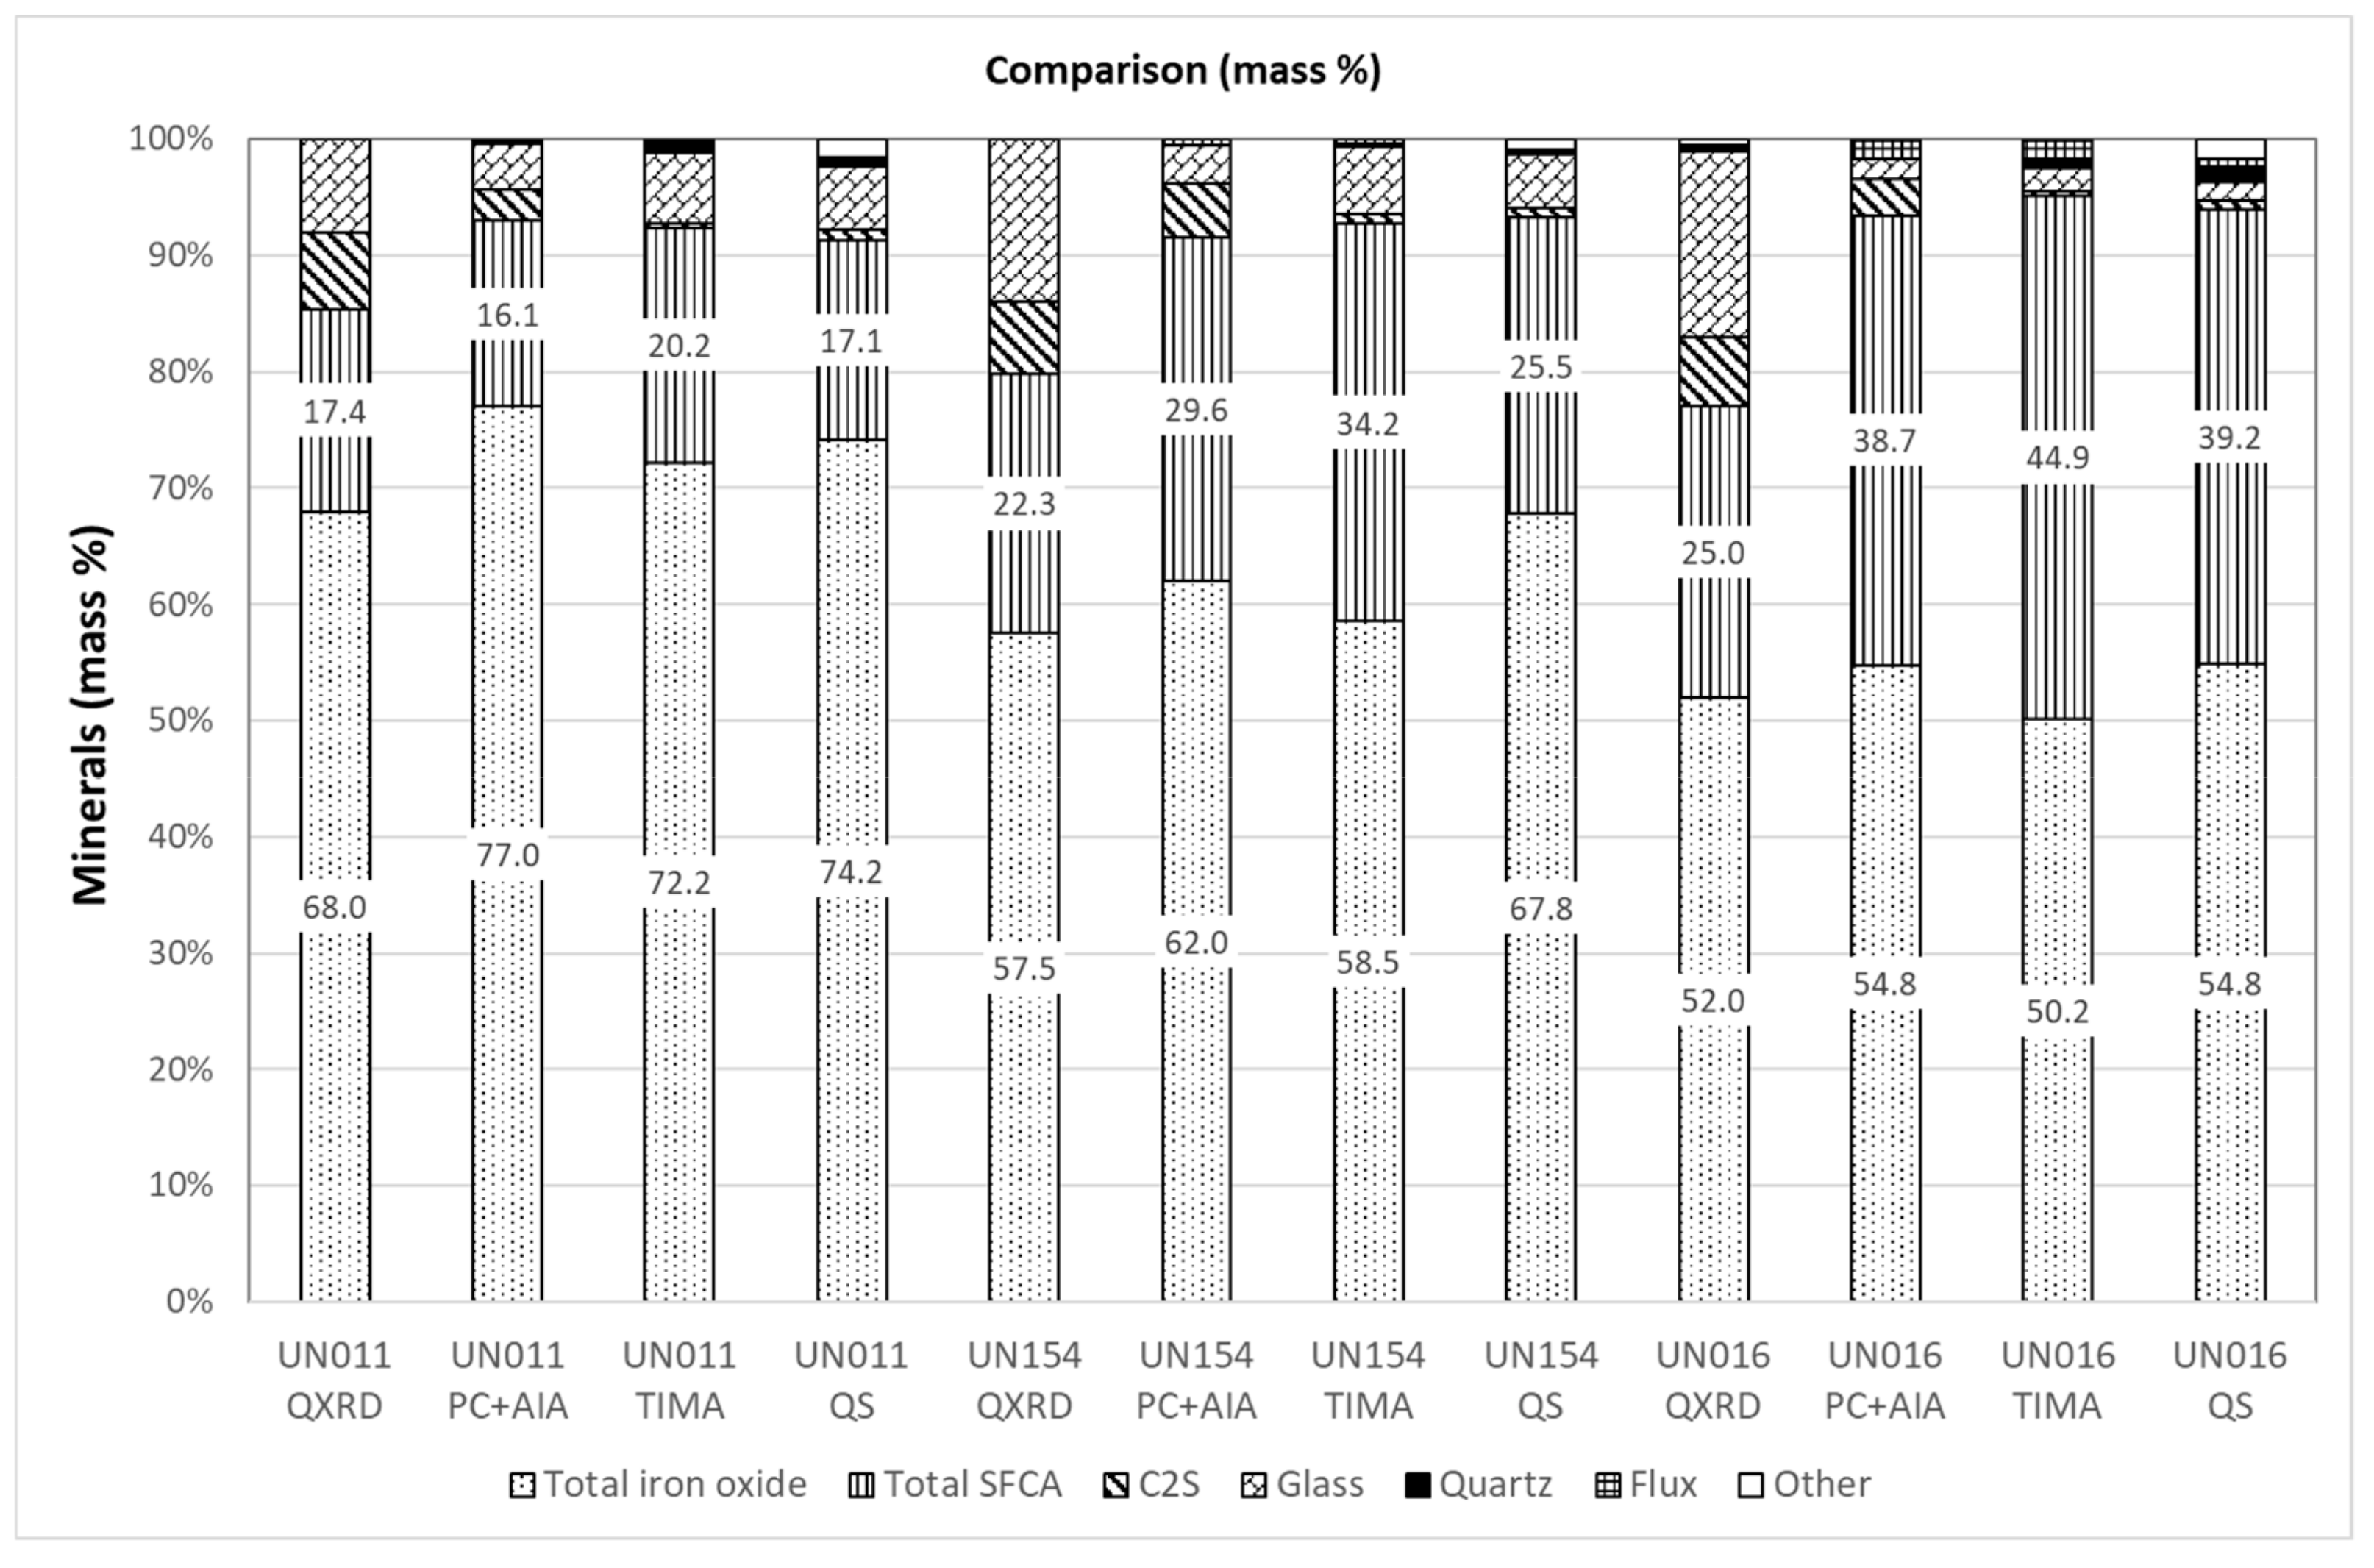
3.5. Comparison of Modal Abundance Data from Different Techniques
4. Conclusions
Author Contributions
Funding
Acknowledgments
Conflicts of Interest
References
- Cai, B.; Watanabe, T.; Kamijo, C.; Susa, M.; Hayashi, M. Comparison between reducibilities of columnar silico-ferrite of calcium and aluminum (SFCA) covered with slag and acicular SFCA with fine pores. ISIJ Int. 2018, 58, 642–651. [Google Scholar] [CrossRef]
- Maruoka, D.; Mataoka, S.; Murakami, T.; Kasai, E. Influence of crystal structure and chemical composition of silico-ferrite of calcium and aluminum on its reducibility. In Proceedings of the 8th International Congress on Science and Technology of Ironmaking, Vienna, Austria, 25–28 September 2018; pp. 367–372. [Google Scholar]
- Honeyands, T.; Manuel, J.; Matthews, L.; O’Dea, D.; Pinson, D.; Leedham, J.; Monaghan, B.; Li, H.; Chen, J.; Hayes, P.; et al. Characterising the mineralogy of iron ore sinters—State-of-the-art in Australia. In Proceedings of the Iron Ore 2017, Perth, Australia, 24–26 July 2017; pp. 49–60. [Google Scholar]
- Nicol, S.; Chen, J.; Pownceby, M.; Webster, A. A review of the chemistry, structure and formation conditions of silico-ferrite of calcium and aluminum (‘SFCS’) phases. ISIJ Int. 2018, 58, 2157–2172. [Google Scholar] [CrossRef]
- Mezibricky, R.; Frolichova, M. Silico-ferrite of calcium and aluminum characterization by crystal morphology in iron ore sinter microstructure. ISIJ Int. 2016, 56, 1111–1113. [Google Scholar] [CrossRef]
- Hamilton, J.; Hoskins, B.; Mumme, W.; Borbidge, W.; Montague, M.A. The crystal structure and crystal chemistry of Ca2.3Mg0.8Al1.5Si1.1Fe8.3O20(SFCA): solid solution limits and selected phase relationships of SFCA in the SiO2-Fe2O3-CaO(-Al2O3) system. Neues Jahrb. Mineral. Abh. 1989, 161, 1–26. [Google Scholar]
- Mumme, W.; Clout, J.; Gable, R. The crystal structure of SFCA-I, Ca3.18Fe3+14.30Fe2+0.55O25, a homologue of the aenigmatite structure type, and new crystal structure refinements of β-CFF, Ca2.99Fe3+14.30Fe2+0.55O25 and Mg-free SFCA, Ca2.45Fe3+9.04Fe2+0.16O20. Neues Jahrb. Mineral. Abh. 1998, 173, 93–117. [Google Scholar]
- Patrick, T.; Pownceby, M. Stability of silico-ferrite of calcium and aluminum (SFCA) in air-solid solution limits between 1240 °C and 1390 °C and phase relationships within the Fe2O3–CaO–Al2O3–SiO2; (FCAS) system. Metall. Mater. Trans. B 2002, 33, 79–89. [Google Scholar] [CrossRef]
- Webster, N.; Pownceby, M.; Madsen, I.; Kimpton, J. Silico-ferrite of calcium and aluminum (SFCA) iron ore sinter bonding phases: new insights into their formation during heating and cooling. Metall. Mater. Trans. B 2012, 43, 1344–1357. [Google Scholar] [CrossRef]
- Tonzetic, I.; Dippenaar, A. An alternative to traditional iron-ore sinter phase classification. Miner. Eng. 2011, 24, 1258–1263. [Google Scholar]
- Donskoi, E.; Poliakov, A.; Manuel, J.; Peterson, M.; Hapugoda, S. Novel developments in optical image analysis for iron ore, sinter and coke characterisation. Appl. Earth Sci. 2015, 124, 227–244. [Google Scholar] [CrossRef]
- Donskoi, E.; Hapugoda, S.; Lu, L.; Poliakov, A.; Peterson, M.; Haileslassie, A. Advances in optical image analysis of iron ore sinter. In Proceedings of the Iron Ore 2015, Perth, Australia, 13–15 July 2015; pp. 543–548. [Google Scholar]
- Hapugoda, S.; Lu, L.; Donskoi, E.; Manuel, J. Mineralogical quantification of iron ore sinter. Miner. Process. Extr. Metall. 2016, 125, 156–164. [Google Scholar] [CrossRef]
- Malvern Panalytical. X’Pert HighScore Plus; Version 4; PANalytical B V: Almelo, The Netherlands, 2014. [Google Scholar]
- Rietveld, H. A profile refinement method for nuclear and magnetic structures. J. Appl. Crystallogr. 1969, 2, 65–71. [Google Scholar] [CrossRef]
- Bruker AXS. TOPAS V5: General Profile and Structure Analysis Software for Powder Diffraction Data; Bruker AXS: Karlsruhe, Germany, 2013. [Google Scholar]
- Blake, R.; Hessevick, R.; Zoltai, T.; Finger, L. Refinement of the hematite structure. Am. Min. 1966, 51, 123–129. [Google Scholar]
- Hamilton, W. Neutron diffraction investigation of the 119°K transition in magnetite. Phys. Rev. 1958, 110, 1050–1057. [Google Scholar]
- Liles, D.C.; de Villiers, J.P.; Kahlenberg, V. Refinement of iron ore sinter phases: A silico-ferrite of calcium and aluminium (SFCA) and an Al-free SFC, and the effect on phase quantification by X-ray diffraction. Miner. Petrol. 2016, 110, 141–147. [Google Scholar] [CrossRef]
- Tsurumi, T.; Hirano, Y.; Kato, H.; Kamiya, T.; Daimon, M. Crystal structure and hydration of belite locality: synthetic. Ceram. Trans. 1994, 40, 19–25. [Google Scholar]
- Madsen, I.; Scarlett, N. Quantitative Phase Analysis. In Powder Diffraction: Theory and Practice; Royal Society of Chemistry: London, UK, 2008; pp. 298–331. [Google Scholar]
- Goodall, W. Characterisation of mineralogy and gold deportment for complex tailings deposits using QEMSCAN. Miner. Eng. 2008, 21, 518–523. [Google Scholar] [CrossRef]
- Hrstka, T.; Gottlieb, P.; Skala, R.; Breiter, K.; Motl, D. Automated mineralogy and petrology – applications of TESCAN Integrated Mineral Analyzer (TIMA). J. Geosci. 2018, 63, 47–63. [Google Scholar] [CrossRef]
- Ostwald, J. Mineralogy and microtexture of Australian iron ore sinters. BHP Tech. Bull. 1981, 25, 13–20. [Google Scholar]
- Webster, N.; Pownceby, M.; Madsen, I.; Studer, A.; Manuel, J.; Kimpton, J. Fundamentals of Silico-ferrite of Calcium and Aluminum (SFCA) and SFCA-I Iron Ore Sinter Bonding Phase Formation: Effects of CaO:SiO2 Ratio. Metall. Mater. Trans. B 2014, 45, 2097–2105. [Google Scholar] [CrossRef]
- Webster, N.; Churchill, J.; Tufaile, F.; Pownceby, M.; Manuel, J.; Kimpton, J. Fundamentals of Silico-Ferrite of Calcium and Aluminum (SFCA) and SFCA-I iron ore sinter bonding phase formation: Effects of titanomagnetite-based ironsand and titanium addition. ISIJ Int. 2016, 56, 1715–1722. [Google Scholar] [CrossRef]
- Murao, R.; Harano, T.; Kimura, M.; Jung, I. Thermodynamic modeling of the SFCA phase Ca2(Fe,Ca)6(Fe,Al,Si)6O20. ISIJ Int. 2018, 58, 259–266. [Google Scholar] [CrossRef]
- Webster, N.; Pownceby, M.; Madsen, I. In situ X-ray Diffraction Investigation of the Formation Mechanisms of Silico-Ferrite of Calcium and Aluminum-I-type (SFCA-I-type) Complex Calcium Ferrites. ISIJ Int. 2013, 53, 1334–1340. [Google Scholar] [CrossRef]


| Analyte | UN011 (Plant) | UN154 (Plant) | UN016 (Pot) |
|---|---|---|---|
| Fe total | 57.38 | 56.73 | 56.87 |
| Fe2+ | 5.45 | 5.91 | 4.45 |
| SiO2 | 5.56 | 5.43 | 4.95 |
| Al2O3 | 1.80 | 1.87 | 1.73 |
| P | 0.06 | 0.07 | 0.05 |
| CaO | 9.24 | 10.04 | 9.83 |
| MgO | 0.95 | 1.76 | 1.79 |
| Basicity (CaO/SiO2) | 1.66 | 1.85 | 1.99 |
| UN011 Average | UN011 SE | UN154 Average | UN154 SE | UN016 Average | UN016 SE | |
|---|---|---|---|---|---|---|
| Primary Hematite | 19.4 | 24 | 7.1 | 25 | 14.9 | 13 |
| Secondary Hematite | 22.1 | 17 | 17.6 | 6 | 18.8 | 15 |
| Total Hematite | 41.5 | 5 | 24.7 | 6 | 33.7 | 9 |
| Magnetite | 31.7 | 12 | 32.0 | 7 | 13.2 | 11 |
| SFCA-I | 1.0 | 44 | 1.8 | 54 | 6.2 | 28 |
| SFCA | 15.1 | 17 | 32.0 | 7 | 37.5 | 7 |
| C2S | 2.6 | 44 | 6.4 | 20 | 4.2 | 55 |
| Glass | 3.9 | 6 | 5.7 | 23 | 2.8 | 50 |
| Mineral | UN011 (Plant) | UN154 (Plant) | UN016 (Pot) |
|---|---|---|---|
| Hematite | 38.2 | 30.0 | 40.0 |
| Magnetite | 29.8 | 27.5 | 12.0 |
| SFCA-I | N.D. | N.D. | 11.0 |
| SFCA | 17.4 | 22.3 | 14.0 |
| C2S | 6.6 | 6.2 | 6.0 |
| Mordenite | N.D. | N.D. | 0.5 |
| Quartz | N.D. | N.D. | 0.5 |
| Glass (amorphous) | 8.0 | 14.0 | 16.0 |
| Total | 100.0 | 100.0 | 100.0 |
© 2019 by the authors. Licensee MDPI, Basel, Switzerland. This article is an open access article distributed under the terms and conditions of the Creative Commons Attribution (CC BY) license (http://creativecommons.org/licenses/by/4.0/).
Share and Cite
Honeyands, T.; Manuel, J.; Matthews, L.; O’Dea, D.; Pinson, D.; Leedham, J.; Zhang, G.; Li, H.; Monaghan, B.; Liu, X.; et al. Comparison of the Mineralogy of Iron Ore Sinters Using a Range of Techniques. Minerals 2019, 9, 333. https://doi.org/10.3390/min9060333
Honeyands T, Manuel J, Matthews L, O’Dea D, Pinson D, Leedham J, Zhang G, Li H, Monaghan B, Liu X, et al. Comparison of the Mineralogy of Iron Ore Sinters Using a Range of Techniques. Minerals. 2019; 9(6):333. https://doi.org/10.3390/min9060333
Chicago/Turabian StyleHoneyands, T., J. Manuel, L. Matthews, D. O’Dea, D. Pinson, J. Leedham, G. Zhang, H. Li, B. Monaghan, X. Liu, and et al. 2019. "Comparison of the Mineralogy of Iron Ore Sinters Using a Range of Techniques" Minerals 9, no. 6: 333. https://doi.org/10.3390/min9060333