Article

Studying the Flotation of Gold-Bearing Ores Using Carrier Minerals

by
Sergei Ivanovich Evdokimov
1,
Nikolay S. Golikov
2,*,
Denis A. Zadkov
2,*,
Elena V. Voitovich
3,
Viktor V. Kondratiev
4,
Aleksey A. Petrovskiy
4,
Vladimir Yu. Konyukhov
5 and
Vitaliy A. Gladkikh
6
1
Department of Mineral Processing, North Caucasian Institute of Mining and Metallurgy, State Technological University, 362011 Vladikavkaz, Russia
2
Department of Mechanical Engineering, Saint-Petersburg Mining University, 199106 St. Petersburg, Russia
3
Department of Industrial and Civil Engineering, Moscow Polytechnic University, 107023 Moscow, Russia
4
Laboratory of Geochemistry of Ore Formation and Geochemical Methods of Prospecting, A. P. Vinogradov Institute of Geochemistry of the Siberian Branch of the Russian Academy of Sciences, 664033 Irkutsk, Russia
5
Department of Automation and Control, Irkutsk National Research Technical University, 664074 Irkutsk, Russia
6
Stroytest Research and Testing Center, Moscow State University of Civil Engineering, 26, Yaroslavskoye Shosse, 129337 Moscow, Russia
*
Authors to whom correspondence should be addressed.
Minerals 2024, 14(1), 88; https://doi.org/10.3390/min14010088
Submission received: 3 November 2023 / Revised: 3 January 2024 / Accepted: 8 January 2024 / Published: 11 January 2024
(This article belongs to the Special Issue Design, Modeling, Optimization and Control of Flotation Process)

Abstract

:
This work is aimed at the analysis of the development of flotation technology by applying carrier minerals. Based on the concepts of continuum mechanics, a theoretical analysis of the influence of the carrier minerals (wall) on the motion of a single solid particle is provided, taking into account their hydrodynamic interaction (in the case of low Reynolds numbers). A correction was obtained in the form of a ratio of the particle size to its distance from the wall to take into account the influence of the wall on the hydrodynamic force acting on the particle. The influence of the wall is manifested through a rapid approximation of the liquid vortex flow in the gap between the solid wall and the particle to the steady-state mode, accompanied by the suppression of the transverse movement of particles. When the liquid slides along a wall-mounted gas–liquid layer with a reduced viscosity, the liquid flow increases in the interfacial gap, which can be analyzed by a dimensionless correction that includes values describing the properties of a continuous medium (dynamic viscosity) and a disperse phase (geometric particle size). The reason for the decrease in the induction time when gold grains adhere to each other is assumed to be due to the forces of hydrophobic attraction (when the grains have a mirror-smooth surface) and the sliding of the flow along the hydrophobic surface of the particles along the gas layer (when the grains have a rough surface). When polydisperse particles are aggregated, the threshold energy of the fast coagulation was established to be lower than that arising during the interaction of monodisperse particles, whose aggregation requires a large depth of the potential pit. Performing natural experiments on the ore using a rougher concentrate as a carrier material showed that the concentrate yield decreases by 20.52% rel. In the second case, the gold extraction was higher by 4.69% abs. While maintaining the achieved level of gold extraction, the double mixing of the rougher concentrate and the initial feed increased the gold content in the rougher concentrate from 4.97 to 6.29 g/t.

1. Introduction

Modern gold mining companies in Russia and worldwide are facing problems with optimizing production costs. These are caused by intense price competition on the one hand and deteriorating the mining and geological conditions on the other hand, subsequently decreasing the gold content of the ore, increasing the depth of development, and reducing unallocated reserves [1]. One of the current trends of sustainable economic development existing in the country, taking into account the need to increase the reserves and the consumption of mineral resources, is the introduction of innovative technologies that use a wide range of minerals [2].
A significant part of gold ore resources are represented by sulfide ores, which are difficult to obtain via extraction and require the application of highly efficient new technologies for processing low-grade and refractory materials [3]. Extracting the ores and concentrates, in which fine gold is associated with pyrite or arsenopyrite, needs much more complex technological schemes due to the fact that, during grinding, such gold is only slightly revealed, and the bulk of it remains in the sulfides. It is not dissolved during cyanidation, and in the processes of gravity and flotation enrichment, it is extracted together with the carrier minerals [4].
In recent decades, the gold content of ores has significantly decreased, and the share of poor and rather difficult-to-uncover, refractory, gold-bearing raw materials involved in processing has increased to 40% [5].
Improving the efficiency of processing hard-to-process gold-bearing ores and concentrates, which are characterized by complex mineralogical and geochemical compositions, submicroscopic grain sizes, heterogeneous textures, and a variety of genetic processes of ore formation, leads to a fine dispersion of gold particles in waste rock minerals. This also requires the assessment of structural and textural parameters [6] and the modeling of technological processes [7], the possible use of selective disintegration and separation technologies [8], and reducing the amount of gold in waste rock minerals.
The main enrichment process for such ores is flotation, which is a complex, multiphase process, and the works of many researchers have focused on optimizing this operation as a key link in enrichment technology [9].
The ores in which finely disseminated gold is associated with sulfide minerals, such as pyrite, arsenopyrite, or antimonite, are processed using complex technological schemes. In the case of fine dissemination of gold in sulfide minerals, the very fine grinding of ores is required. However, in the case of a significant decrease in the particle size, the hydrodynamic field of the bubbles that flow up significantly reduces the efficiency and selectivity of the flotation process [10,11,12]. Due to inertia forces, coarse particles are known to approach the surface of bubbles along a rectilinear trajectory, either by the impact or by the effect followed by sliding along the surface of the bubbles. When the particle size decreases, its hydrodynamic interaction with the bubbles depends on the fact that, during the contact time (the time of the particle’s movement from the upper pole of a bubble to its equator and below), the trajectory of the particle’s movement and the liquid flow lines flowing around the bubble curve become twisted and coincide. The inertia-free interaction with a bubble, i.e., displacement along with a liquid flow without contact with the surface of a bubble up to its lower hemisphere, is the main reason for the loss of fine particles during flotation, including gold [13,14]. Regardless of the nature of the liquid flow near the surface of the bubble (Reynolds number is R e   =   ( 2 R b υ b / ν ) > > 1 ) or viscous Stokes (Re < 1), there is a quadratic dependence of the collision efficiency E on the value of the Rp/Rb ratio. In this case, υb is the velocity of the bubble with radius Rb, ν is the kinematic viscosity of the liquid, and Rp is the particle size.
If the high losses of the fine particles are caused by a decrease in the collision efficiency and a decrease in the particle size due to hydrodynamic interactions, then the deterioration in the selectivity of their separation is associated with the developing balance of the surface forces [15,16,17,18,19] acting on the separated particles.
An obvious (but technically far from being simple) solution to the problem of fine particle flotation is the use of nanobubbles [20,21,22,23]. Another promising direction in the flotation of fine particles is their preliminary aggregation [24,25].
The adhesion of the fine particles to the surface of the bubble is possible under the condition of their convergence to distances coinciding with the long-range potential minimum. But the collision followed by the subsequent adhesion of the particle to the surface of the bubble without the formation of a contact angle is indiscriminate, and, in the case of the selective flotation of ores, it reduces the efficiency of the mineral separation process.
To increase the flotation efficiency of the microdispersions of minerals, conditions are created for their preliminary aggregation with coarse minerals [26,27]. These technologies are based on the fact that the rate of the adhesion of the fine particles to coarse ones is 400–500 times higher than the rate of the aggregation of the fine particles among themselves [28,29]. And the frequency of the collision of the particles with significantly different sizes tends to unity, while in the case of fine particles, it is negligible [30].
We can assume that during the flotation processes, the particles move in an unlimited liquid, since the value of the ratio is R/l >> 1. Here, R and l are the particle size and the distance from the center of the particle to the wall of the apparatus or to a single coarse particle in the case of a polydisperse system, respectively. The liquid flow lines induced by the motion of the single particles in the unlimited liquid are close to infinity [31,32]. However, when several particles move together, their hydrodynamic interaction manifests itself in the fact that the movement of each particle in the group is influenced by the movement of neighboring particles [33,34,35]. As a result, a single particle is influenced by a greater (than that determined by the Stokes formula) viscous drag force than that which influences each particle in the group. When the value of the R/l ratio decreases, the effect of the volume substitution and the alternating motion of the liquid caused by it, in which the particle participates, begins to manifest itself. The change in the hydrodynamic resistance during the transition from the movement of a single particle in the unlimited liquid to the movement of a group of the particles (or near the wall) was quantitatively described by Brenner [36,37]. The convergence resistance is lower in the case of fine particles, which may be the reason for their effective adhesion to coarse particles [26,27,28].
During the hydrodynamic interaction of the hydrophobic particles, the sliding of the liquid decreases the hydrodynamic resistance to the liquid flow in the gap between the particles. This effect of increasing (against the expected one by calculation when meeting the adhesion condition) the liquid flow is a consequence of its sliding along the gas layer (or nanosized gas bubbles) owing to a large difference in the dynamic viscosity of water and gas (ηl/ηg~50) [38,39,40].
Gold is effectively recovered by flotation after loading xanthogenate [41,42,43,44,45,46]. Valderrama L. demonstrated [23,47] that, due to the adhesion to coarse particles, the extraction of fine gold by xanthogenate is increased by 24%, and the retention is increased by 50% when the flotation rate is increased 3–4 times. Two flotation peaks were revealed when the shear energy was 0.5–2.0 and 3.0–4.0 kW/m3.
The overall positive effect of using analogue technologies based on the aggregation of polydisperse particles is an increase in the extraction of fine-dispersed fractions of the target component. For example, hydrophobic glass beads [48], paraffin, organic polymers, magnetized iron (or magnetite) isolated from ores, and specially prepared monominerals are used [27,49]. However, the development of the attractive forces between polydisperse particles is possible only at a high concentration of coarse particles [50]; in the presence of a large number of microdispersions, the conditions established for the extraction of coarse particles become critical. Therefore, up to 200% (of the mass of the fine particles) of carrier minerals must be introduced into the flotation system [51]. Such flotation carrier platforms are expendable. The organization of the regeneration of their surface for the purpose of reuse in most cases is inefficient and increases capital expenditures and operating costs for conducting the flotation process.
This work is focused on studying the techniques of improving the technology of fine gold flotation using carrier minerals. To improve the technical and economic performance of this technology, the efficiency of using a maximally homogeneous material, including fine gold, i.e., the rougher concentrate isolated from a part of the ore, as carrier minerals is proven [51,52]. The rougher concentrate is the most flotation-active part of the raw material enriched with gold. When it is mixed with the initial feed, an increase in the fine gold extraction is possible due to two effects: the adhesion of the fine particles to the coarse ones and an increase in the gold content in the flotation feed, which is unattainable when using inert materials [30].
The fact that the flotation of the fine particles is a qualitatively new process is proven by using special terms, such as “microflotation” [26] and the flotation of “inertialess particles” [30], when discussing the results of researching it. In terms of modern colloidal chemistry, microflotation is an orthokinetic heterocoagulation. This allows for interpreting the experimental data on the aggregation of hydrophilic particles using two approaches that form the basis of the DLVO theory: dispersion (van der Waals) forces and ion-electrostatic interactions. However, in the case of the aggregation and the flotation of hydrophobic particles, in order to harmonize the theory and the experiment, it is necessary to apply new mechanisms of long-range surface forces. They are collectively called “non-DLVO” forces in the literature [53,54,55] and are taken into account by the extended DLVO theory (XDLVO [56,57,58]). The relationship between the particle adhesion to the bubble during flotation and the interaction forces caused by the altered structure of the liquid present in the wetting film, i.e., hydrophobic attractive forces, is shown in [41,59], including during gold flotation with xanthogenate [44,60,61].
The achieved level of understanding the physical regularities of the flotation of fine particles has allowed for developing the technologies for extracting minerals from ores, reaching high technical and economic indicators. However, the problem of reducing the losses of mineral microdispersions involving flotation waste is still relevant.
The purpose of the work is to develop a flotation technology for gold-bearing ores based on the revealed patterns of the hydrodynamic interaction of polydisperse hydrophobic surfaces used as carrier minerals of fine gold.

2. Materials and Equipment

2.1. Research Object

The research object was composite ore samples obtained from two sites of the Bereznyakovsky gold ore field. The samples were composed of a witness core of the wells and ditches (77 samples 50 mm in size, whose total weight was 143 kg) located at various hypsometric levels. When they were processed at the gold recovery factory, the gold size in the flotation tailings was characterized by the histograms shown in Figure 1.
The histograms of the size distribution of gold grains are based on the results of measuring 100 grains in each sample. The histograms of the size distribution of the gold grains in the flotation tailings of both ore samples have a pronounced asymmetric nature.
The mineralogical studies were conducted using a Nikon Eclipse LV 100 Pol microscope. The X-ray diffraction phase analysis (DRON-3M, Cu-Kα radiation) and the mineralogical studies (Nikon Eclipse Lv 100n Pol microscope, Nikon Instruments Inc., Tokyo, Japan) allowed for revealing the fact that 35%–40% of the material of the two samples belonged to quartz and about 50% of the material was represented by pyrophilite, illite, sericite, and paragonite. The bulk of the sulfides that were present in the samples was composed of pyrite (up to 10% by weight). Tahr ores, secondary copper sulfides, and sulfosalts together amounted to no more than 0.6%, while sphalerite, chalcopyrite, and galena accounted for 0.10%–0.45% (sphalerite predominated, amounting to 0.4%). Pyrite grains (of idiomorphic, hypidiomorphic, and framboidal shapes) had a size ranging from 1–5 µm to 0.05–0.10 mm.
The gold in the ores was mainly accompanied by pyrite, recovered at the operating gold processing plant by flotation into a concentrate, which is subjected to cyanidation after the autoclave gold extraction.

2.2. Flotation Equipment

Full-scale tests of the flotation technology using the rougher concentrate as a carrier mineral were performed on a laboratory bench (Figure 1) [30].
The flotation method of extracting gold was chosen followed by constructing a flow diagram according to the jet principle [28,29,30]. In the experiments on flotation, a laboratory-scale plant with a square cross-section of 47 × 47 mm in size was used for the column flotation (Figure 2).
The bench was based on three column-type flotation machines, each of which received 1/3 of the initial feed. The columns were interconnected by a rougher concentrate flow. The concentrate isolated on the first flotation column was mixed with the initial feed of the second flotation column. Then, the concentrate of the second flotation column was mixed with the initial feed of the third flotation column, and a ready-made rougher concentrate was obtained. Therefore, the ready-made rougher concentrate was isolated in three steps, using the concentrate material of the first two flotation columns as the carrier minerals.
The main part of the bench (Figure 1) consisted of three columns (1) made of corrosion-resistant steel (of the 8X18H10 type) with a square cross-section (47 × 47 mm) that was 2070 mm in height. The feeding depth was 767 mm. The initial feeding system included a sand pump (2) equipped with a thin-layer platelike mixer (3) of the Jones sampler type. The column was countercurrent and was supplied with the initial feed from above the distribution grid (4) and the gas phase from below. The air was supplied by a side-mounted pneumohydraulic aerator of the confusor–diffuser type (5). An airlift (6) served to unload the chamber product; during the emergency unloading of the column, the pulp was discharged through a Teflon gate (7).
Monominerals were floated in a countercurrent column-type flotator that was 64 mm in diameter and 1.7 m in height when the initial feed was supplied under the cleaning zone to a depth of 0.46 m. The flotator was equipped with a pneumohydraulic aerator of the confusor–diffuser type. The cylindrical mixing chamber was placed between the confusor (Ø was 1 mm) and the conical expanding diffuser (Ø was 5.1 mm). The diffuser outlet was closed with a polyurethane mesh, which allowed for calculating the size of the formed air bubbles. The total length of the aerator was 152 mm. Air was supplied to the mixing chamber by a compressor through a vertically mounted connecting pipe with a nozzle of Ø 1.47 mm at a rate of 1.35 m3/min per 1 m2 of the chamber cross-section. The aerator was installed in the bottom part of the column on its outer side and on the side.
The column capacity in terms of the initial feed was 1.5 m3/min per 1 m2 of the chamber section.
The column water balance allowed for the conclusion that at a washing flow rate of 0.34 m3/min per 1 m2 of the column section, the water flux flowing into the tailings exceeded the water flux flowing into the feed by 7%–8%, which made it possible to suppress the mechanical removal of non-floating minerals into the concentrate.
Potassium butyl xanthate was supplied at a rate of 25 mg/dm3 for recleaning.
The air pressure at the entrance to the airlift was 0.14 MPa at a flow rate of 0.045 m3 per 1 m3 of the pulp removed into the tailings.

2.3. Flotation Mode

The base ore, which was 3 mm in size, was ground in a rod mill at a ratio of S:W = 1:1 to a grain size of 80% of a 71 µm class in the presence of sodium sulfide (112 g/t). After being activated with copper sulfate (15 g/t), the sulfides were floated with potassium butyl xanthogenate (85 g/t) and a foaming agent T-92 (35 g/t).
When performing the flotation, the reduced air velocity was 1.75 × 10⁻² m/s at a flow rate of 3.85 × 10⁻⁵ m3/s. The airflow rate was measured by a diaphragm rheometer (sequentially connected to the pneumatic system) or a gasometer of the UGIMETERS type (in some cases, by the volumetric method); the air pressure at the inlet to the ejector was measured by a mercury pressure gauge. The excess air pressure in the pneumatic system could be adjusted in the range from 1.1 × 10⁻² to 1.4 × 10⁻² MPa. The air supply to the ejector was controlled by an adjustable clamp. The indicators of the gas flowmeters were verified by calculating the static pressure drop of the flotation chamber atmosphere, as measured by a U-shaped meter.
The liquid workflow into the ejector was fed from an overflow tank (to maintain a constant level of filling with water) by a water pump through a flow meter equipped with fine-adjustment valves and pressure control implemented by pressure gauges installed at the inlet and outlet. A laboratory shut-off-and-control valve was mounted on the feed pipe; in the working jet, the water pressure was changed in the range from 20.01 × 10⁻² to 25.20 × 10⁻² MPa.
The washing water consumption was 0.4 m3/min per 1 m2 of the chamber section, which provided a 7%–8% excess of the water flow into the tailings compared to the amount of water flow into the feed and the removal of rock minerals that were mechanically trapped from the foam layer.
Air was supplied to the airlift by a compressor through a flow meter, a shut-off armature, and a pressure gauge.
During the flotation, the volumetric capacity of the flotation column was maintained at 1.59 × 10⁻⁵ m3/s when the reduced pulp velocity was ~1 × 10⁻² m/s.

3. Results and Discussion

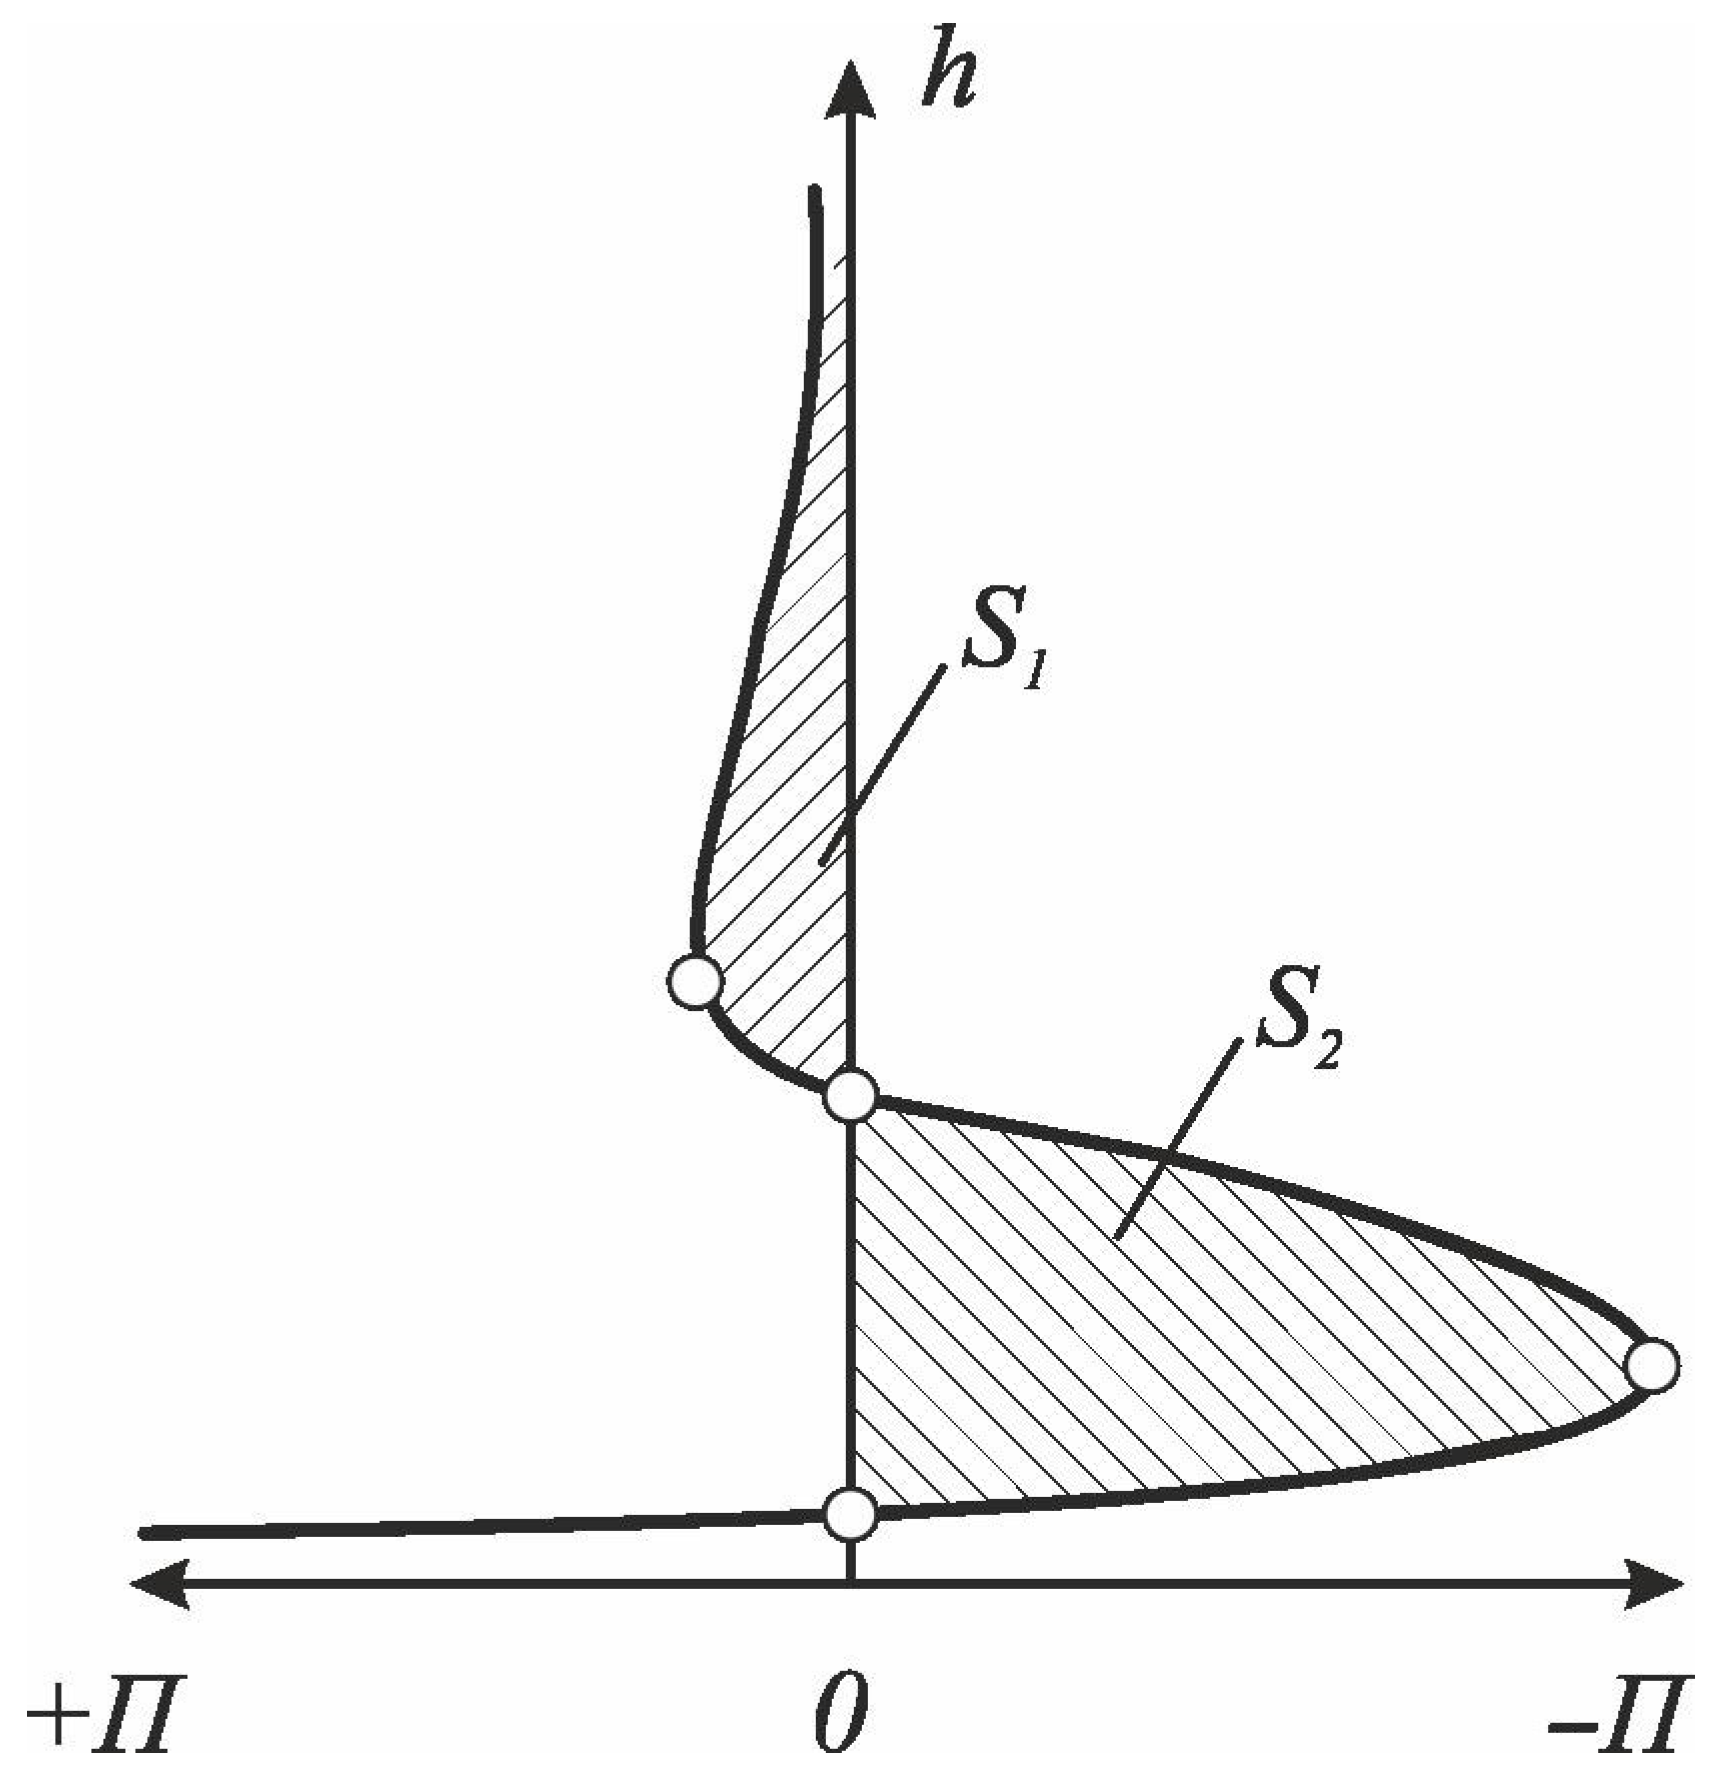
3.1. Studying the Hydrodynamic Interaction of Polydisperse Solid Particles with Carrier Minerals under Flotation Conditions

During flotation using carrier minerals, the formation of a flotation complex should be preceded by the aggregation of polydisperse particles; the accumulation of fine gold occurs on its coarse particles. In order to preliminarily aggregate the polydisperse gold particles, the rougher concentrate isolated from a part of the initial ore is mixed with another part of the ore, and only then flotation is implemented.
At a sufficiently close distance from each other, the particles enter into a hydrodynamic interaction, which manifests itself in the perturbation of the fields of local liquid flows occurring near them. The factors influencing this interaction are, first of all, the sizes of the interacting particles, their velocity, the forces causing their movement, the orientation relative to each other, etc.
The subject of this study is the hydrodynamic interaction of polydisperse particles under flotation conditions, i.e., the adhesion of fine gold onto the coarse particles of a rougher concentrate (carrier minerals). The interaction of a coarse particle and a single solid particle moving along it (a micron-sized mineral) in the case of its Stokes flow is investigated.
Let us assume that the flow of the liquid is symmetrical with respect to the 0z axis and that, therefore, the resultant of forces F of the viscous resistance (r) and pressure (trr) applied to the particle are also directed along the 0z axis and coincide with the direction of the liquid flow (Figure 3).
Integrating the sum of the projections of the pressure forces (trr) and viscous friction (t) on the 0z axis over the entire surface of the particle provides:
F = S ( - t r r c o s θ + t r θ s i n θ ) d S = = 2 π 0 π ( t r r c o s θ + t r θ s i n θ ) R 2 s i n θ d θ = 3 π μ υ R 0 π s i n θ d θ + + 2 π R 3 ρ g 0 π c o s 2 θ s i n θ d θ
or
F = 6 π μ υ R + 4 3 π R 3 ρ g .
Therefore, when:
R e = υ R p / ν < < 1
from the side of the flow of the viscous unlimited liquid, the resistance force acts on a solid particle moving in it [36], which consists of two forces. First, this is the Stokes drag force:
F S t k = 6 π η υ R p
which tends to compensate for the velocity difference between the surrounding liquid and the particle, and, second, the inertial buoyancy force arises:
F A r h = 4 / 3 π R 3 ρ g .
In the case under consideration, the system of basic differential equations of fluid hydrodynamics, taking into account external volumetric forces (external mass forces are neglected) acting on the liquid, consists of the continuity equation:
d ρ d t + ρ d i v υ = 0
and the Stokes equation:
1 ρ p + ν Δ υ = 0
provided that the hydrodynamic force acts on a solid particle whose dimensions Rp are small compared to its distance from the wall l:
R / l < < 1 .
In this case, Re—Reynolds number; υ—typical velocity scale (an absolute value of the vector of the velocity of the incident flotation of the liquid); ν = η / ρ , η—kinematic and dynamic viscosity; ρ—density; Rp—size of the body, streamlined by the liquid or the inner radius of the pipe through which the liquid is flowing; g—free-fall acceleration; t—time; υ —velocity vector; and p—hydrostatic pressure. When writing Equations (6) and (7), the following notations were used:
= i x + j y + k z ; Δ υ =   i   Δ υ x + j Δ υ y + k Δ υ z
where i , j , k are unit vectors along the directions of the Ox, Oy, Oz axes of the Cartesian coordinate system and Δ is the Laplace operator.
The inequality (8) corresponds to the condition of the near-hydrodynamic interaction between the coarse (wall) particle and the fine one moving at a speed of:
u = i u
where   i   is the unit vector along the Ox axis.
Provided that the surface S of the fine particle is on the surface of the coarse particle (wall) Σ, we can write the boundary conditions as follows:
υ ( 1 ) | S = u ¯ ; υ ( 1 ) 0 w h e n r ;
υ ( 2 ) | Σ = υ ( 1 ) ; υ ( 2 ) 0 w h e n r ;
υ ( 3 ) | S = υ ( 2 ) ; υ ( 3 ) 0 w h e n r ;
Taking into account the linearity of Equations (6) and (7), we may represent the fields of local pressures as the sum of the fields:
υ β * = p = υ ( 1 ) β * + υ ( 2 ) β * + υ ( 3 ) β * + = p ( 1 ) + p ( 2 ) + p ( 3 ) +
where β is the dimension sliding factor and velocities:
υ = υ ( 1 ) + υ ( 2 ) + υ ( 3 ) + ,
each member of which satisfies the boundary conditions (11)–(13).
From the side of the unlimited extent of the liquid, the particle moving in it is influenced by the initial field of the velocities υ ( 1 ) and the force corresponding to it:
F ( 1 ) = F .
The boundary condition (12) is equivalent to the field of the velocities υ ( 2 ) neutralizing the initial field υ ( 1 ) on the surface of the carrier mineral Ʃ. The determination of υ ( 2 ) allows for finding the field υ ( 3 ) that, in accordance with the boundary condition (16), neutralizes the field υ ( 2 ) on the surface S of the fine particle.
The calculation of the individual contributions of the fields to the local field of the velocity υ makes it possible to find the force F acting from the side of the liquid, bounded by the carrier mineral, on the fine particle moving along it. At the same time, we should note that, in accordance with the boundary conditions (11)–(13), only the velocity fields with odd indices contribute to the magnitude of the force F :
F = F ( 1 ) + F ( 3 ) +
In accordance with the selected conditions (16) and (17), the total force F acting on the particle from the side bounded by the liquid wall and the force F determining the first contribution to it are opposite to the movement direction of the particle:
F = = - i F F = - i F .
Provided that the fine particle moves along the surface Ʃ or in the plane that is perpendicular to its symmetry, it is possible to write:
υ ( 2 ) = i υ ( 2 ) F ( 3 ) = F υ ( 2 ) u F ( 3 ) = i F ( 3 ) F ( 3 ) = F υ ( 2 ) u
Since the conditions are considered according to G. Lamb, its influence on the hydrodynamic interaction occurring in the system of polydisperse particles consists in the coincidence of the fields created by the moving particle and the force F , located in its center, which can be considered by the following expressions:
υ ( 1 ) β = p ( 1 ) = 1 4 π ( F · ) 1 r + o ( 1 r 2 )
υ ( 1 ) = F 6 π μ r r 2 24 π μ ( F · ) 1 r + o ( 1 r ) .
Using (17), we can obtain an expression for the total resistance force acting on the fine particle from the side of the resistance force limited by the liquid wall:
F = F × ( 1 υ 2 u ) 1 · β
where β is a nondimensional sliding coefficient.
Proceeding from (22), between the magnitude of the velocity υ ( 1 ) and the magnitude of the force F acting on the particle in the unlimited extent of the liquid, there is a directly proportional dependence. On the other hand, in accordance with the conditions (14) and (15), the velocity υ S ( 1 ) on the fine particle surface and the velocity υ Σ ( 2 ) on the carrier–mineral surface (wall) are interrelated linearly. The force F introduced into the expression (22), is proportional to the liquid viscosity μ and the value υ ( 2 ) 0 , provided that l , i.e., when the distance between the particle and the wall is increasing unlimitedly.
Then, the analysis of the dimensionalities leads to the conclusion that the above dimensional quantities are related by the following ratio:
υ ( 2 ) = F 6 π μ l .
By substituting the expression (23) into (21), we obtain an expression for the correction to the hydrodynamic resistance force acting on the fine particle from the liquid side bounded by the wall (the surface of the carrier mineral):
F = F 1 - F 6 π μ l u · β .
Taking into account [36], the expression for the force acting at the time moment t on the solid particle moving in the liquid at the velocity u can be written as:
F 6 π η R u = 1 + R π ν t + 9 16 R l K ( l ν t ) .
Let ϕ = l / ν t , and when φ < 1, the decomposition for the function K(φ):
K ( ϕ ) = 1 16 9 π ϕ + 8 9 π ϕ 3 1 6 ϕ 4 + O ( ϕ 5 )
will be substituted into the expression for the resistance force (25), and for steady flow when t→∞, we can obtain:
F 6 π η R u = 1 + 9 16 R l + 1 2 π R l ( l ν t ) 3
At the initial moment of time t, the particle is located at a sufficiently large distance from the wall, so that φ > 1 and, substituting the decomposition of the function K(φ), we have:
K ( ϕ ) = 1 3 ϕ 2 + 4 3 π ϕ 3 + O ( ϕ 4 )
In the ratio (27), we have an expression for the force in the absence of the wall:
F 6 π η R u = 1 + R π ν t + 9 16 R l ( ν t 3 l 2 ) 3
According to the expression (27), near the coarse particle, the velocity of the approaching of the vortex (nonstationary) liquid flow to the steady state will change in the same way as the value t−3/2 does. Based on the expression (29), at large distances between the particles (in the case of the particle motion in the unlimited liquid), the correction conditioned by the unsteadiness of the liquid flow will be changed in the same way as the value t−1/2 will be. In the case of the Stokes flow, the correction to the hydrodynamic force acting on the particle is of the R/l order. Consequently, during the flotation involving the carrier minerals in the gap between the fine particle and the coarse one, the velocity of the approaching of the liquid flow to the steady-state mode is increased.
During the flotation, the particles hydrodynamically interact with plane (two-dimensional) and axisymmetric (two-dimensional and three-dimensional) fluid flows, for which the components of the velocity vector and the pressure field are determined based on the expressions:
υ r ( r , θ ) = υ c o s θ ( 1 3 2 R r + 1 2 R 3 r 3 ) ; υ θ ( r , θ ) = υ s i n θ ( 1 3 4 R r 1 4 R 3 r 3 ) ; p ( r , θ ) = ( 3 2 μ υ R r 2 + ρ g r ) c o s θ
In the case of these two flows, the distribution of the velocity and the pressure depends on two coordinates (r, θ are polar coordinates), and the continuity equation contains the sum of two derivatives, which allows for introducing a scalar Stokes current function depending on these two coordinates, i.e., the current function ψ ( r , θ ) . In this case, the constituent velocities υr and υθ of the liquid are determined based on the current function in accordance with the equalities:
υ r = υ c o s θ = 1 r 2 s i n θ ψ θ ; υ θ = υ s i n θ = 1 r s i n θ ψ r .
The hydrodynamic interaction of the polydisperse particles can be estimated by the value of the current function for the current line (surface), the movement along which for the deposition of the fine particle on the surface of the coarse one is the boundary ψcr:
E = ψ c r / υ 0 R p ( + )
where υ0 is the velocity of the incoming undisturbed flow, provided that:
r = R p ( + ) + R p ( ) ; θ = π / 2 ; D = [ R p ( + ) R p ( ) / R p ( + ) ] < < 1 D 0 = R p ( ) / R p ( + )
Equation (32) can be obtained in the form of:
E = 2 ϖ υ 0 [ R p ( ) R p ( + ) ] 2 .
Here,
ϖ = υ 0 2 ( 2.00 - l n R e ) ; R e = 2 R p ( + ) υ 0 / ν
where ν is the liquid kinematic viscosity.
The expression for the particle collision efficiency (34) is obtained under the assumption that the condition of the liquid adhesion to the hydrophilic surface of the mineral is observed. In the flotation conditions, during the hydrodynamic interaction of hydrophobic polydisperse particles, when determining the collision efficiency, it is necessary to take into account an inaccurate compliance with the adhesion condition, i.e., the sliding of the liquid along the hydrophobic surface. The change in the hydrodynamic mode of the interaction during the transition from hydrophilic solid particles to hydrophobic solid polydisperse particles can be considered by obtaining an expression for the current function when taking into account the liquid sliding.
Based on Oseen’s equation:
( υ · ) υ = 1 ρ p + ν Δ υ ,
the velocity components are:
υ r = A 0 r 2 + 2 A 1 c o s θ r 3 C 0 e k r ( 1 c o s θ ) 2 k r 2 [ 1 + k r ( 1 c o s θ ) ] + υ c o s θ υ θ = A 1 s i n θ r 3 + C 0 s i n θ 2 r e k r ( 1 c o s θ ) υ s i n θ
when δ r < < 1 (where δ = υ / 2 ν ) has the following form:
υ r = A 0 r A 1 c o s θ r 2 + υ 0 c o s θ C 0 2 [ 1 δ r + c o s θ ( γ + ln 1 2 δ r ) c o s θ ] ,
υ θ = A 1 s i n θ r 2 υ 0 s i n θ C 0 2 ( γ + ln 1 2 δ r ) s i n θ .
Here, γ is the Euler constant, and A0, A1 and C0 are the constants whose values must be obtained from the boundary conditions.
Based on the boundary condition that υ r = 0 , when r = R p ( + ) by equating the coefficient to zero, when c o s θ , and when a member does not contain c o s θ , the following is true:
A 0 = C 0 2 δ ; A 1 = υ 0 R b 2 C 0 R p 2 ( + ) 2 ( 1 γ ln 1 2 δ r ) .
If the condition υ θ = 0 corresponds to the adhesion of the liquid, then the condition of the equality of the tangential stress p r θ to the tangential force takes into account the sliding of the liquid along the surface of the coarse particle r = R p ( + ) :
υ 0 β * = p r θ = η ( υ θ r + υ r r θ υ θ r ) r = R p ( + ) .
Using (38) and (39), based on (41), when r = R p ( + ) , we have:
A 1 ( β * η + 4 R p ( + ) ) = β * η R p 2 ( + ) [ υ 0 + C 0 2 ( λ + l n 1 2 δ r ) ] ,
from which:
C 0 = 2 υ 0 ( 1 γ ln 1 2 δ R p ( + ) ) 1 2 ( 1 + 2 η β * R p ( + ) ) 1 ; A 1 = C 0 R p 2 ( + ) 4 ( 1 + 2 η β * R p 2 )
Proceeding from the condition that:
{ d ψ = r υ r d θ υ θ d r ψ = 0 g h b r = R p ( + ) η β * R p ( + ) < < 1 ,
we will obtain:
E = 2 ϖ υ 0 ( R p ( ) R p ( + ) ) 2 ( 1 + 2 η β * R p ( ) ) .
The comparison of the expressions (34) and (45) allows for stating that the correction for slip is given by the expression:
f E = ( 1 + 2 η β * R p ( ) ) .
In view of this, taking into account the sliding, the efficiency of the collision the fine particle with the coarse one is higher by correction, whose value is determined by the ratio (46).
A comparison of the expressions (20), (22) and (26), (37) allows for stating that during the flotation of the microdispersions of minerals using carrier minerals, the adhesion of fine particles to coarse ones is facilitated by the rapid approach of the vortex liquid flow in the interphase gap to the steady-state mode accompanied by suppressing transverse particle movements. In the case of the Stokes flow, this fact can be considered by the correction having the R/l order to the hydrodynamic force acting on the particle. The coefficient value of the capturing by a bubble of an aggregate consisting of hydrophobic particles is higher by the slip correction value in the form of:
( 1 + 2 η β * R p ( ) ) .

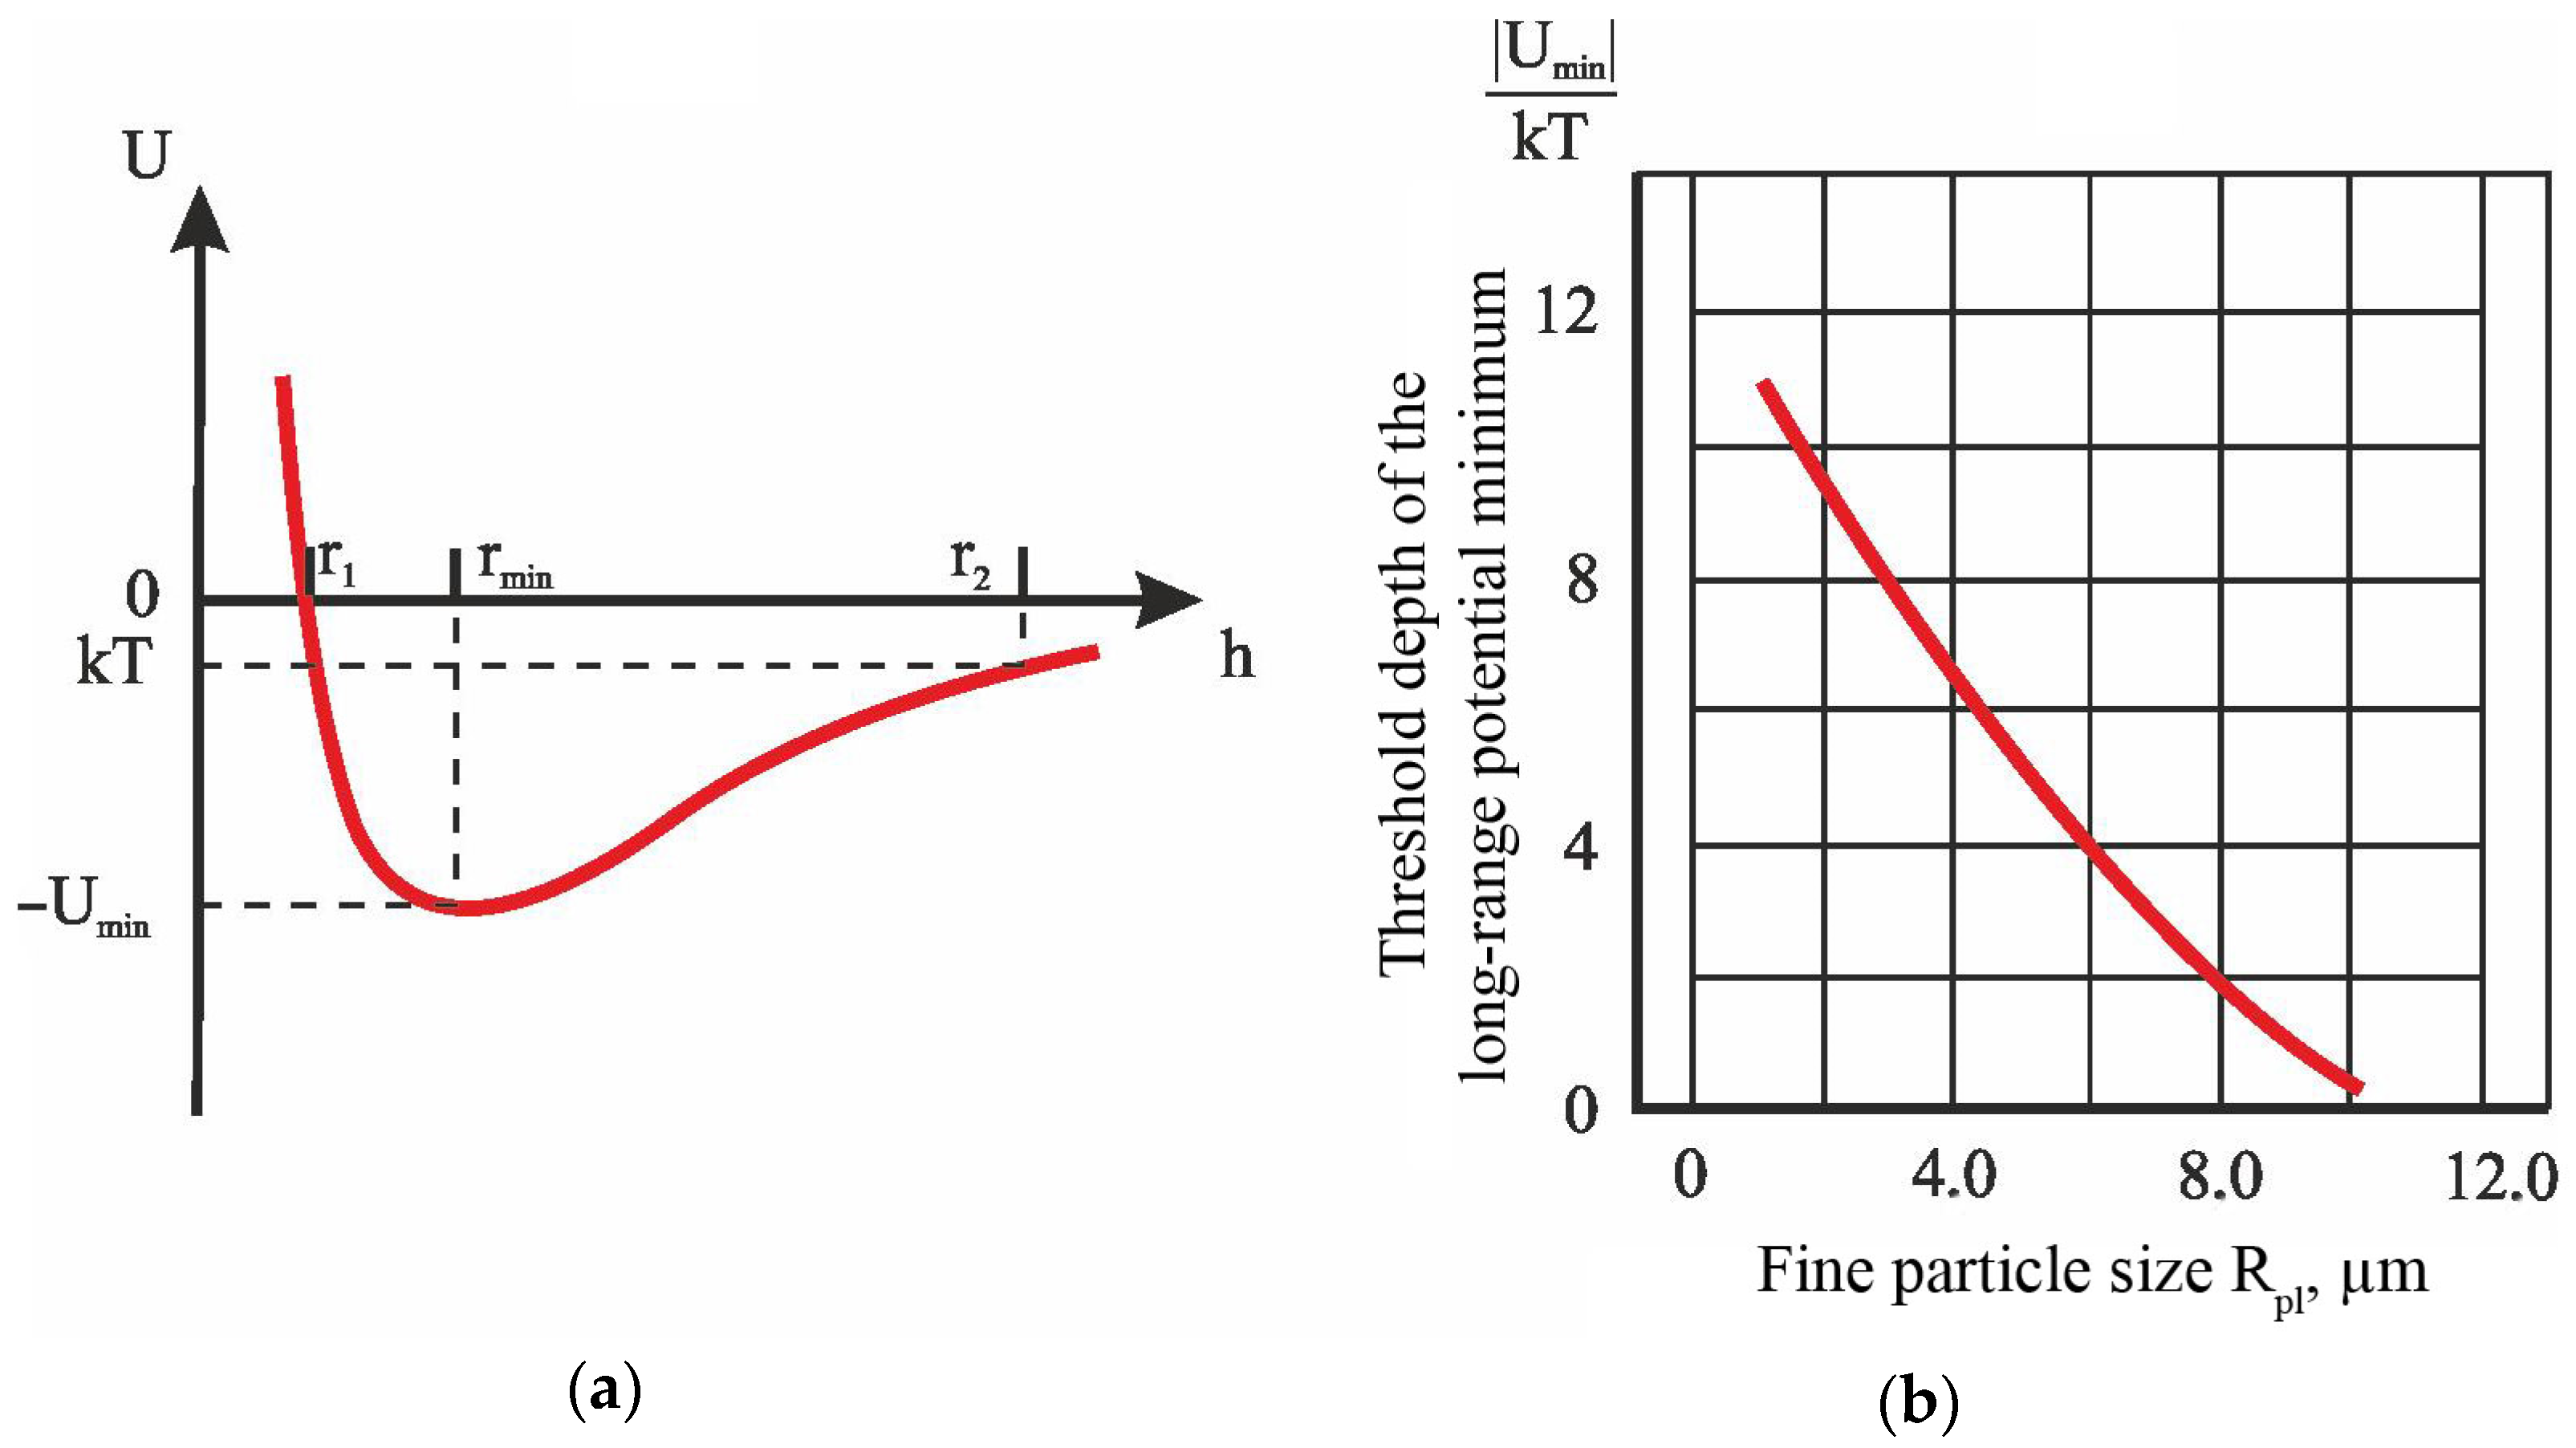
3.2. Flotation of Gold Microdispersions Using Carrier Minerals

Based on the obtained estimates, the influence of the polydispersity of the particles and the conditions of adhesion/sliding of the liquid along the hydrophobic surface on the result of their hydrodynamic interaction was analyzed. This was analyzed according to the method related to the preliminary adhesion of hard-to-extract forms of the minerals (their microdispersions) to the carrier minerals that were specially introduced into the flotation system. The purpose of this section of the work was to obtain experimental evidence for the technological effectiveness of the flotation technology using the rougher concentrate as carrier minerals.
The aggregation process of the minerals in the flotation cells occurs in the turbulent mode of their movement. Therefore, the methods used for studying the aggregation in a calm suspension, even after mixing, cannot fully reflect the ongoing changes in the particle size. The method of studying the aggregation of the fine particles during their mixing should more fully reflect the change in the dispersed composition of the mineral as compared to static methods.
In order to study the kinetics of the thinning and breakthrough of the symmetric interphase films formed during the interaction of the polydisperse grains of gold, the induction time was measured when the grains adhered to each other. The influence of temperature and the gold samples on the induction time was studied. To solve this problem, a change was introduced to the device design: the system used for generating a gas bubble was replaced by a cantilever beam (probe) containing a grain of gold, glued according to the method that was developed and tested in [62]. When assembling the probe, the most flattened grains were selected: thin plates, scales, and leaves of native gold. The selected gold grains, when mounted on the probe, were oriented towards the material placed in the cuvette by a larger surface, i.e., a face (wall). Providing a predetermined grain position on the probe, the induction time was measured when individual grains adhered to the “gold wall” and not to its edge or corner. Nevertheless, the lack of geometric similarity of the interphase gap during the interaction of the flat wall with the polyhedral gold grains in the material layer was the main reason for the measurement error.
Gold grains of a given coarseness were isolated by sedimentometric analysis.
For the first experiment (Figure 4a, curve 1), native gold grains with a mirror-smooth surface without any relief, corrosive shells on the periphery of the grains, or signs of hypergenic transformation of the gold faces were selected. On the contrary, for the second experiment (Figure 4a, curve 2), the research object was non-rounded gold grains with a shagreen (rough), pitted, and bumpy surface. When using the high-resolution electron microscope, randomly (mosaic) located micron-sized depressions (ranging from fractions of a micron to 1–3 microns in size) of a geometrically regular shape in the form of “honeycombs” were marked on the faces of the gold grains.
The native gold grains were treated with a 10−3 M solution of ethyl xanthogenate.
In the first case (Figure 4a, curve 1), the induction time decrease when the temperature increased can be explained by an increase in the hydrophobic interaction forces, i.e., an endothermic process associated with the difference in the structure and properties of the water located in the boundary layer and in the volume [19,59,63]. This also includes the cases of adsorption of ethyl xanthogenate on the gold surface [42,44,64]. A sharp increase in the dependence of the induction time on temperature when the rough surface particles interact (Figure 4a, curve 2) can be associated with the manifestation of the effect of the water flow sliding along the hydrophobic surface of the particles as a result of stratifying the wall-mounted gas–liquid layer [65,66] or separating stable nanobubbles from the surface relief irregularities [39,67].
The experimental results were processed along with rejecting the measurement runs; if the empirical dispersion of the measurement runs was noticeably greater, then the significance of its difference from the rest was checked by comparing it according to Cochran’s test (G-criterion). The critical (tabular) values of the G-criterion were determined at a significance level of 0.95. The points shown in Figure 4 belong to the midpoints of the confidence intervals constructed using Student’s t-distribution.
The induction time measurement was supplemented by an experiment conducted on the flotation of native gold of different sizes and samples. The experiments were carried out in a counterflow flotation column that was 64 mm in diameter when the xanthogenate concentration was 15.6 mg/L and the foaming agent concentration was 0.025 mg/L. Washwater was not supplied to the foam layer.
To determine the diameter of the air bubbles (db, mm), its dependence (approximation accuracy was R2 = 0.98) on the pressure drop occurring between the phases (p, MPa) and the outlet hole diameter (d, mm) was in the form of [57]:
d b = 33.81 × 10 2 + 60.08 × p + 18.15 × d + 430.02 × p d .
In the experiments, high-assay copper (870‰–930‰) native gold (of reddish color) admixed with platinum and with inclusions of ilmenite and magnetite was used; no signs of hypergenic transformations were noted on the surface of the angular gold grains. Only individual grains had a low assay (680‰–770‰); their surface differed by a heterogeneous structure, and they had endogeneous deformation signs and corrosion shells. Small classes of coarseness were enriched with lamellar and flake morphotypes of semiangular grains. Native gold of three size classes was used: (−100 + 71) µm (Figure 4b, curve 1), (−71 + 40) µm (Figure 4b, curve 2), and −20 µm (Figure 4b, curve 3).
The flotation rate constant was determined to decrease (Figure 4b) when the bubble size increased and the Rp/Rb ratio value decreased. The obtained result is explained by the influence of the hydrodynamic interaction of the particles with the bubbles on the flotation complex formation. The result can be explained by the low efficiency of the collision of the fine particles with the large bubbles (the action of viscous forces) and the high efficiency of the collision of the coarse particles with the bubble surface due to the action of inertia forces.
The change in the inertia forces during flotation by the developed method is possible due to the adhesion of gold microdispersions to the coarse particles of the carrier minerals. Moreover, there is an interaction of the particles whose surface is hydrophobized by a collecting reagent. The surface hydrophobization increases the area of the isotherm of the wedging pressure in the region of its negative values (from S1 to S2), under which the attraction forces prevail over the repulsion forces (Figure 5).
The decrease in the surface hydrophilicity was associated with the adsorption of the collector, whose hydrocarbon radicals were the cause of the appearance of the interaction forces caused by a change in the structure of the liquid, i.e., the forces of hydrophobic attraction. When the thickness h of the wetting film decreased, when the particles approached, the energy of their interaction U was determined by the additive contribution of the energies of a different nature [68,69,70]:
  • Molecular attraction VA
V A = A 123 6 h R p 1 R p 2 R p 1 + R p 2
  • Electrostatic repulsion VR
V R = π ε 0 R p 1 R p 2 R p 1 + R p 2 ( ψ 1 2 + ψ 2 2 ) { 2 ψ 1 ψ 2 ψ 1 2 + ψ 2 2 l n [ 1 + e x p ( κ h ) 1 e x p ( κ h ) ] + l n [ 1 e x p ( 2 κ h ) ] }
  • Hydrophobic attraction VS
V S = 2 π R p 1 R p 2 R p 1 + R p 2 K λ e x p ( h λ ) λ = 12.2 k 1 ; K = 2.51 × 10 3 π k 1 ; k 1 = e x p ( θ / 100 0 ) 1 e 1
The values | U m i n | / k T were calculated during the interaction of the gold grains, whose sizes were Rp1 = 1–10 µm and Rp2 = 100–150 µm (Figure 6b). The calculation conditions were as follows. A123 = 4.1 × 10⁻¹² erg is the Hammaker constant for the interaction of gold grains (indices “1” and “2”) through a symmetrical film of water (index “3”). ε0 = 8.85 × 10⁻¹² F/m is the electrical constant of the dispersion medium. φ1, φ2 = −14.7 mV is the Stern potential of the particles (approximated by their ζ-potential, whose experimental values were determined by the electrophoretic mobility of the particles in water using the Henry equation, a Dispersion DT-310 electroacoustic spectrometer (Dispersion Technology Inc., New York, the United States) and a Zetasizer Nano ZS device, Malvern Instruments Ltd, Malvern, United Kingdom). σ0 = 3 × 10¹⁴ charge/cm2 is the surface-charge density of the gold grains. κ = 0.92 × 106 cm−1 is the parameter of the double electric layer corresponding to the inverse Debye shielding radius (the parameter κ was determined based on the electrical conductivity data). h is the distance between the particles Rp1 and Rp2 (κh < 3). K is the parameter characterizing the magnitude of surface structural forces, J/m2 [58,71]. θ = 640 is the contact angle. λ is the parameter characterizing the long-range action of the forces, nm [58,71]. e = 2.718 is the transcendental constant. k = 1.381 × 10⁻²³ J/K is the Boltzmann constant. T = 293 K is the absolute temperature. The calculations were performed in the Maple 2021 environment.
Figure 6a shows the change in the potential energy of the interaction of the particles when the distance between them was increased from r1 to r2. The selected distance between the particles corresponds to the length of the long-range potential minimum; starting from the distance rr1, the potential energy of the interaction of the particles is U < 0; r2 is the distance between the particles, at which the energy of their interaction is | U | = k T .
When the size of the fine particles increased (Figure 6b), the absolute value of the threshold depth of the long-range potential minimum decreased from 0.56 (when the minimum coordinate was rmin = 11.6 nm) to 0.36 (when rmin = 15.4 nm). Therefore, when the particle size increased, the area of their interaction increased; the polydisperse particles were aggregated at a smaller depth of the long-range potential minimum.
The results of studying the aggregation and flotation of gold allowed for reaching a conclusion about the probability of efficiently recovering the microdispersions of minerals, including native gold, by flotation using the carrier minerals intended for sticking the fine particles onto the coarse ones. This process is followed by the flotation of the formed aggregates containing the bubbles of a reduced size.
Using the two samples of ores, which differed in gold content, experiments were set up to compare the technological indicators obtained using competing technologies that have been adopted at an operating gold recovery factory and developed using the rougher concentrate as carrier minerals. The set of the experiments differed in the fact that the ready-made concentrate was obtained on the ore of sample-1 according to the full technological scheme, and the ore of sample-2 allowed for releasing only the rougher concentrate. This made it possible to evaluate the technological regularities of the scheme as a whole and the main flotation operation efficiency in particular. The experiments were conducted according to the continuous process principle.
During the flotation of the ores of sample-1 according to the technological scheme adopted at the operating gold extraction factory, 82.93% of the gold was extracted into a sellable concentrate when the concentrate yield was 3.07% and the gold content was 20.80 g/t.
Figure 7 shows a qualitative and quantitative scheme of the sample-1 flotation when the rougher concentrate was mixed twice and provided with the initial feed.
During the flotation and proceeding according to the scheme shown in Figure 6, when the rougher concentrate was first mixed with the base ore, the gold content in the main flotation feed increased from 0.77 to 1.22 g/t and up to 1.62 g/t during the second mixing, i.e., by 58.4 and 110.4% rel. with respect to the base ore. The consequence of increasing the gold content in the initial feed of the rough flotation operation was the operational extraction increase in the metal from 83.74 to 91.28 and 94.40%, respectively. The gold extraction into a sellable concentrate was 87.62% when the Au content was 27.65 g/t and the Δγ concentrate yield decreased by:
Δ γ = 3.07 2.44 3.07 × 100 = 20.52 % .
Table 1 shows the experimental results of extracting the rougher concentrate from the ores of sample-2 in the mode adopted at the operating gold processing factory and the results of testing the flotation mode using the rougher concentrate material as carrier minerals (Figure 2).
Table 1 concludes that, while maintaining the achieved level of gold extraction (74.95%), the double-mixing of the rougher concentrate with the initial feed made it possible to increase the gold content in the rougher concentrate from 4.97 to 6.29 g/t (the gold concentration degree increased from 5.199 to 6.579) when the concentrate yield decreased.
Figure 8 demonstrates the dependences of the operational gold extraction on the metal content in the initial feed of the main flotation operation obtained using the material of sample-1 (Figure 8a) and sample-2 (Figure 8b). A similar dependence (Figure 8c) proceeded from the data processing results obtained at the stage of the preliminary research works related to developing the ores of the deposit.
Figure 8 shows that when using the rougher concentrate material as carrier minerals, a mixture was obtained, which, in terms of the extracted mineral content and the flotability, was identical to the base ore with an increased content of the valuable component.
Various methods of processing refractory sulfide gold concentrates are possible; their implementation requires significant operating expenses. Therefore, reducing the gold concentrate amount delivered for metallurgical processing provides a significant economic effect.
The cost of processing the persistent sulfide flotation concentrates by various technologies was calculated using the data given in [72]. When using the developed method of the ore flotation, the possibility of reducing operating costs attributed to 1 ton of the initial ore has been established, which increases the economic efficiency of its processing.

4. Conclusions

A flotation technology of processing gold-bearing ores, which was developed in order to increase the completeness of extracting the fine particles of the valuable component, was studied in this paper.
A correction was obtained for the hydrodynamic drag force acting from the liquid side on the fine particles under conditions of their flotation applying the carrier minerals.
A decrease in the induction time when the temperature increases was revealed when studying the kinetics of the thinning and breakthrough of the symmetrical interphase films formed by the gold grains with a mirror-smooth surface without any relief. The obtained results can be explained by an increase in the forces of hydrophobic interactions. The decrease in the induction time, when the gold grains adhere to the rough surface, can be associated with the manifestation of the effect of the liquid sliding along the gas layer.
The influence of the liquid sliding effect is considered by a dimensionless correction to the magnitude of the collision efficiency of the aggregate of hydrophobic particles with an air bubble. The correction expression includes the values that describe the properties of a continuous medium (dynamic viscosity) and a disperse phase (geometric particle size); the correction value is always greater than one.
We have revealed that the flotation rate constant decreases when the size of the bubbles increases and the ratio of the particle size to the bubble size decreases.
We have found that during the aggregation of polydisperse particles, the threshold energy of the rapid coagulation is lower than that occurring during the interaction of monodisperse particles, whose aggregation requires a large depth of the potential pit.
When performing full-scale experiments using the ore of sample-1, sellable concentrates were obtained according to two complete technological schemes. The first has been adopted at the existing gold recovery factory and the second uses the rougher concentrate as a carrier material. We have established the fact that when the concentrate yield decreased by 20.52% rel. in the second case, the gold extraction was 4.69% abs. higher.
According to the example of the ore of sample-2, when comparing two technologies used for extracting the rougher concentrate (the factory one and the developed one using the rougher concentrate as a carrier material), we have shown that while maintaining the achieved level of gold extraction (74.95%), the double-mixing of the rougher concentrate with the initial feed allowed for obtaining an increase in the gold content in the rougher concentrate from 4.97 to 6.29 g/t. At the same time, the degree of the gold concentration increased from 5.199 to 6.579.
A possible level of increasing the commercial efficiency indicators of production has been shown when using the developed approach to extracting microdispersions of minerals.

Author Contributions

Conceptualization, S.I.E.; methodology, A.A.P.; formal analysis, V.Y.K.; investigation, V.A.G.; data curation, A.A.P., V.Y.K. and V.A.G.; writing—original draft preparation, S.I.E., N.S.G. and D.A.Z.; writing—review and editing, E.V.V. and V.V.K.; supervision, S.I.E.; project administration, E.V.V. and V.V.K.; visualization, N.S.G. and D.A.Z. All authors have read and agreed to the published version of the manuscript.

Funding

This research received no external funding.

Institutional Review Board Statement

Not applicable.

Informed Consent Statement

Not applicable.

Data Availability Statement

The data presented in this study are available from the corresponding authors upon reasonable request.

Conflicts of Interest

The authors declare no conflicts of interest.

References

  1. Marinin, M.; Marinina, O.; Wolniak, R. Assessing of Losses and Dilution Impact on the Cost Chain: Case Study of Gold Ore Deposits. Sustainability 2021, 13, 3830. [Google Scholar] [CrossRef]
  2. Litvinenko, V.S.; Petrov, E.I.; Vasilevskaya, D.V.; Yakovenko, A.V.; Naumov, I.A.; Ratnikov, M.A. Assessment of the role of the state in the management of mineral resources. J. Min. Inst. 2023, 259, 95–111. [Google Scholar] [CrossRef]
  3. Boduen, A.; Zalesov, M.; Melamud, V.; Grigorieva, V.; Bulaev, A. Combined Bacterial and Pressure Oxidation for Processing High-Sulfur Refractory Gold. Processes 2023, 11, 3062. [Google Scholar] [CrossRef]
  4. Ivanik, S.A.; Ilyukhin, D.A. Flotation extraction of elemental sulfur from gold-bearing cakes. J. Min. Inst. 2020, 242, 202–208. [Google Scholar] [CrossRef]
  5. Fedotov, P.K.; Senchenko, A.E.; Fedotov, K.V.; Burdonov, A.E. Studies of enrichment of sulfide and oxidized ores of gold deposits of the Aldan shield. J. Min. Inst. 2020, 242, 218–227. [Google Scholar] [CrossRef]
  6. Duryagina, A.M.; Talovina, I.V.; Lieberwirth, H.; Ilalova, R.K. Morphometric parameters of sulphide ores as a basis for selective ore dressing. J. Min. Inst. 2022, 256, 527–538. [Google Scholar] [CrossRef]
  7. Aleksandrova, T.N.; Nikolaeva, N.V.; Lvov, V.V.; Romashev, A.O. Ore processing efficiency improvements for precious metals based on process simulations. Obogashchenie Rud 2019, 2, 8–13. [Google Scholar] [CrossRef]
  8. Alexandrova, T.N.; Nikolaeva, N.V.; Kuznetsov, V.V. Study of the strength properties of gold ore from the Bam deposit. Gorn. Zhurnal 2021, 11, 851. [Google Scholar] [CrossRef]
  9. Yakovleva, T.A.; Romashev, A.; Mashevsky, G.N. Digital technologies for optimizing the dosing of flotation reagents during flotation of non-ferrous metal ores. Min. Informational Anal. Bull. 2022, 175–188. [Google Scholar] [CrossRef]
  10. Wang, D.; Lin, Q. Hydrodynamics of froth flotation and its effects on fine and ultrafine mineral particle flotation: A literature review. Miner. Eng. 2021, 173, 107220. [Google Scholar] [CrossRef]
  11. Xie, L.; Wang, J.; Lu, Q.; Hu, W.; Zeng, H. Surface interaction mechanisms in mineral flotation: Tals, measurements, and perspectives. Adv. Colloid Interface Sci. 2021, 295, 102491. [Google Scholar] [CrossRef] [PubMed]
  12. Yin, W.Z.; Tang, Y. Interactive effect of minerals on complex ore flotation: A brief review. Int. J. Miner. Metall. Mater. 2020, 27, 571–601. [Google Scholar] [CrossRef]
  13. Kiventera, J.; Golek, L.; Yliniemi, J.; Ferreira, V.; Dejce, J.; Llikainen, M. Utilization of sulphidictailinds from gold mine as a raw material in geopolymerization. Int. J. Miner. Process. 2016, 149, 104–110. [Google Scholar] [CrossRef]
  14. Zhang, J.; Zhang, Y.; Richmond, W.; Wang, H.-P. Processing technologies for gold-telluride ores. Int. J. Miner. Met. Mater. 2010, 17, 1–10. [Google Scholar] [CrossRef]
  15. Long, Q.; Wang, H.; Jiang, F.; Tan, W.; Xu, Z. Enhancing flotation separation of fine copper oxide from silica by microbubble assisted hydrophobic aggregation. Miner. Eng. 2020, 189, 107863. [Google Scholar] [CrossRef]
  16. Li, Z.; Yoon, R.-H. AFM force measurements between gold and silver surface treated in ethyl xanthate solutions: Effect of applied potentials. Miner. Eng. 2012, 36–38, 126–131. [Google Scholar] [CrossRef]
  17. Nguyen, A.V.; Nalaskowski, J.; Miller, J.D.; Butt, H.-J. Attraction between hydrophobic surface studied by atomic microscopy. Int. J. Miner. Process. 2003, 72, 215–225. [Google Scholar] [CrossRef]
  18. Gillies, G.; Kappl, M.; Butt, H.-J. Direct measurements of particle-bubble interactions. Adv. Colloid Interface Sci. 2005, 114–115, 165–172. [Google Scholar] [CrossRef]
  19. Skvarla, J. Hydrophobic interaction between macroscopic and microscopic surfaces. Unification using surface thermodynamics. Adv. Colloid Interface Sci. 2001, 91, 335–390. [Google Scholar] [CrossRef]
  20. Capponi, F.; Azevedo, A.; Oliveira, H.; Rubio, J. Column rougher flotation of fine niobium-bearing particles assisted with micro and nanobubbles. Miner. Eng. 2023, 199, 108119. [Google Scholar] [CrossRef]
  21. Zhang, Z.; Ren, L.; Zhang, Y. Role of nanobubbles in the flotation of fine rutile particles. Miner. Eng. 2021, 172, 107140. [Google Scholar] [CrossRef]
  22. Li, C.; Li, D.; Zhang, H. Surface nanobubbles on the hydrophobic surface and their implication to flotation. Int. J. Miner. Metall. Mater. 2022, 29, 1491–1492. [Google Scholar] [CrossRef]
  23. Jadhav, A.J.; Barigou, M. Bulk nanobubbles: That is the question. Langmuir 2020, 36, 1699–1708. [Google Scholar] [CrossRef] [PubMed]
  24. Sviridov, V.V.; Sviridov, A.V.; Nikiforov, A.F. Physico-Chemical Bases of Microflotation Processes; Lan: St. Petersburg, Russia, 2018. [Google Scholar]
  25. Bryk, P.; Bryk, M. Effective interactions in polydisperse colloidal suspensions investigated using Ornstkin-Zernike integral equations. J. Colloid Interface Sci. 2009, 338, 92–98. [Google Scholar] [CrossRef]
  26. Xue, J.; Ren, D.; Chen, T.; Bu, X.; Wan, X.; Song, Z.; Zhao, C. Hydrophobic agglomeration flotation of oxidized digenite fine particles induced by Na2S and butyl xanthate. Miner. Eng. 2021, 168, 106932. [Google Scholar] [CrossRef]
  27. Hu, Y.; Qiu, G.; Miller, J.D. Hydrodynamic interactions between particles in aggregation and flotation. Int. J. Miner. Process. 2003, 70, 157–170. [Google Scholar] [CrossRef]
  28. Verrelli, D.I.; Albijanic, B. A comparison of methods for measuring the induction time. Miner. Eng. 2015, 80, 8–13. [Google Scholar] [CrossRef]
  29. Xia, W. Role of surface roughness in the attachment time between air bubble and flat ultra-low-ash coal surface. Int. J. Miner. Process. 2017, 168, 19–24. [Google Scholar] [CrossRef]
  30. Evdokimov, S.I.; Panshin, A.M.; Solodenko, A.A. Mineralurgy. In Successes of Flotation; OOO NPKP “MAVR”: Vladikavkaz, Russia, 2010; Volume 2, p. 2109. [Google Scholar]
  31. Chorru, F.; Larrieu, E. Motion of a particle near a rough wall in a viscous shear flow. J. Fluid Mech. 2007, 570, 431453. [Google Scholar]
  32. Yahiaoui, S.; Feuillebois, F. Lift on a sphere moving near a wall in a parabolie flow. J. Fluid Mech. 2010, 662, 447–474. [Google Scholar] [CrossRef]
  33. Asmolov, E.S.; Feuillebois, F. Far-field disturbance flow induced by a small non-neutrally buoyant sphere in a linear shear flow. J. Fluid Mech. 2010, 643, 449–470. [Google Scholar] [CrossRef]
  34. Lebedeva, N.A.; Asmolov, E.S. Migration of settling particles in a horizontal viscous flow through a vertical slot with porous walls. Int. J. Multiph. Flow. 2011, 27, 453–461. [Google Scholar] [CrossRef]
  35. Maximov, R.N. Interaction of particles with the wall of the concentrator channel with a screw pulp flow. Min. Inf. Anal. Bull. 2008, 344–347. [Google Scholar]
  36. Protodiakonov, I.O.; Lyublinskaya, I.E.; Ryzhkov, A.E. Hydrodynamics and Mass Transfer in Disperse Liquid-Solid Systems; Chemistry: Leningrad, Russia, 1987; 336p. [Google Scholar]
  37. Nasyrov, V.V.; Nasyrova, M.G. On the applicability of Stokes’ law. Math. Struct. Model. 2020, 2, 40–48. [Google Scholar] [CrossRef]
  38. Zuo, H.; Javadpour, F.; Deng, S.; Jiang, X.; Li, Z.; Li, H. Reassessing water slippage in hydrophobic nanostructures. J. Chem. Phys. 2020, 153, 191101. [Google Scholar] [CrossRef]
  39. Malkin, A.Y.; Patlazhan, S.A. Wall slip for complex liquids—Phenomenon and its canses. Adv. Colloid Interface Sci. 2018, 257, 42–57. [Google Scholar] [CrossRef]
  40. Wu, Y.; Cai, M.; Li, Z.; Song, X.; Wang, H.; Pei, X.; Zhou, F. Slip flow of diverse liquids on robust super omniphobic surface. J. Colloid Interface Sci. 2014, 414, 9–13. [Google Scholar] [CrossRef]
  41. Pan, L.; Jung, S.; Yoon, R.-H. A fundamental study on the role of collector in the kinetics of bubble-particle interaction. International. J. Miner. Process. 2012, 106–109, 37–41. [Google Scholar] [CrossRef]
  42. Wang, J.; Yoon, R.-H.; Morris, J. AFM surface force measurements conducted between gold surface treated in xanthate solutions. Int. J. Miner. Process. 2013, 122, 13–21. [Google Scholar] [CrossRef]
  43. Kemppinen, J.; Aaltonen, A.; Sihvonen, T.; Leppinen, J.; Siren, H. Xanthate degradation occurring in flotation process waters of a gold concentrator plant. Miner. Eng. 2015, 80, 1–7. [Google Scholar] [CrossRef]
  44. Golik, V.I.; Klyuev, R.V.; Martyushev, N.V.; Kondratiev, V.V.; Tynchenko, V.S.; Gladkikh, V.A.; Iushkova, L.V.; Brigida, V. Reuse and Mechanochemical Processing of Ore Dressing Tailings Used for Extracting Pb and Zn. Materials 2023, 16, 7004. [Google Scholar] [CrossRef] [PubMed]
  45. Gul, A.; Kangal, O.; Sirkeci, A.A.; Onal, G. Beneficiation of the goldbearing ore le gravity and flotation. Int. J. Miner. Metall. Mater. 2012, 19, 106–110. [Google Scholar] [CrossRef]
  46. Afanasova, A.V.; Aburova, V.A.; Prokhorova, E.O.; Lushina, E.A. Investigation of the influence of depressors on flotation-active rock-forming minerals in sulphide gold-bearing ore flotation. Min. Informational Anal. Bull. 2022, 161–174. [Google Scholar] [CrossRef]
  47. Valderrama, L.; Rubio, J. High intensity conditioning and the carrier flotation of gold fine particles. Int. J. Miner. Process. 1998, 52, 273–285. [Google Scholar] [CrossRef]
  48. Arriagada, S.; Acuna, C.; Vera, M. New technology to improve the recovery of fine particles in froth flotation based on using hydrophobized glass bubbles. Miner. Eng. 2020, 156, 106364. [Google Scholar] [CrossRef]
  49. Liu, S.; Xie, L.; Liu, G.; Zhang, H.; Zeng, H. Understanding the hetero-aggregation mechanism among sulfide and oxide mineral particles driven by bifuctional surfactants: Intensification flotation of oxide minerals. Miner. Eng. 2021, 169, 106928. [Google Scholar] [CrossRef]
  50. McKee, C.; Walz, J.Y. Interactionforcesbetweencolloidalparticlesinasolutionoflike-charged, adsorbing nanoparticles. J. Colloid Interface Sci. 2012, 365, 72–80. [Google Scholar] [CrossRef]
  51. Evdokimov, S.I.; Golik, V.I.; Gerasimenko, T.E.; Rubtsov, A.S. Flotationregime of gold-bearing ores with acirculationof therougher concentrate. News Tula State Univ. Geosci. 2023, 1, 382–404. (In Russian) [Google Scholar]
  52. Evdokimov, S.I.; Gerasimenko, T.E. Development of the flotation mode of gold-bearing ores by an air mixture and water vapor. Phys.-Tech. Probl. Dev. Miner. Resour. 2021, 2, 162–177. [Google Scholar]
  53. Bal, V. Stability characteristics of nanoparticles in a laminar linear shear flow in the presence of DLVO and non-DLVO forces. Langmuir 2019, 35, 11175–11187. [Google Scholar] [CrossRef]
  54. Grasso, D.; Subramaniam, K.; Butkus, M.; Strevett, K.; Bergendahl, J. A review of non-DLVO interactions in environmental colloidal systems. Environ. Sci. Biotechnol. 2002, 1, 17–38. [Google Scholar] [CrossRef]
  55. Li, K.; Wang, W.; Xiao, F.; Ge, Y.; Jin, H.; Yu, Z.; Gong, J.; Gao, W.; Peng, Z. Atomic force microscopy study of non-DLVO interactions between drops and bubbles. Langmuir 2021, 37, 6830–6837. [Google Scholar] [CrossRef] [PubMed]
  56. Ojaniemi, U.; Riihimaki, M.; Manninen, M.; Pattikangas, T. Wall function model for particulate fouling applying XDLVO theory. Chem. Eng. Sci. 2012, 84, 57–69. [Google Scholar] [CrossRef]
  57. Brant, J.A.; Childress, A.E. Membrane–colloid interactions: Comparison of extended DLVO predictions with AFM force measurements. Environ. Eng. Sci. 2002, 19, 413–427. [Google Scholar] [CrossRef]
  58. Gomez-Flores, A.; Solongo, S.K.; Heyes, G.W.; Ilyas, S.; Kim, H. Bubble−particle interactions with hydrodynamics, XDLVO theory, and surface roughness for flotation in an agitated tank using CFD simulations. Miner. Eng. 2020, 152, 106368. [Google Scholar] [CrossRef]
  59. Wu, Z.; Wang, X.; Liu, H.; Zhang, H.; Miller, J.D. Some physicochemical aspects of water-soluble mineral flotation. Adv. Colloid Interface Sci. 2016, 235, 190–200. [Google Scholar] [CrossRef]
  60. Pan, L.; Yoon, R.-H. Measurement of hydrophobic forces in thin liquid films of water between bubbles and xanthate-treated gold surfaces. Miner. Eng. 2016, 98, 240–250. [Google Scholar] [CrossRef]
  61. Liu, J.; Cui, X.; Xie, L.; Huang, J.; Zeng, H. Probing effects of molecular-level heterogeneity of surface hedrophobicity on hydrophobic interactions in air/water/solid systems. J. Colloid Interface Sci. 2019, 557, 438–449. [Google Scholar] [CrossRef]
  62. Ong, Q.K.; Sokolov, I. Attachment of nanoparticles to the AFM tips for direct measurements of interaction between a single nanoparticle and surface. J. Colloid Interface Sci. 2000, 310, 385–390. [Google Scholar] [CrossRef]
  63. Miller, J.D.; Wang, X.; Jin, J.; Shrimali, K. Interfacial water structure and the wetting of mineral surfaces. Int. J. Miner. Process. 2016, 156, 62–68. [Google Scholar] [CrossRef]
  64. Nizkaya, T.V.; Dubov, A.L.; Mourran, A.; Vinogradova, O.I. Probing effective slippage on superhydrophobic stripes by atomic force microscopy. Soft Matter. R. Soc. Chem. 2016, 12, 6910–6917. [Google Scholar] [CrossRef] [PubMed]
  65. Zhou, J.; Smiatek, J.; Asmolov, E.S.; Vinogradova, O.I.; Schmid, F. Application of Tunable-Slip Boundary Conditions in Particle-Based Simulations. High Perform. Comput. Sci. Eng. 2015, 13, 19–30. [Google Scholar]
  66. Theodorakis, P.E.; Che, Z. Surface nanobubbles: Theory, simulation, and experiment. A review. Adv. Colloid Interface Sci. 2019, 272, 47–61. [Google Scholar] [CrossRef]
  67. Sukharev, I.S. Experimental determination of the size of gas bubbles during effluence in the air/water system. Bull. Volga State Acad. Sports 2016, 46, 198–204. [Google Scholar]
  68. Lu, S.T. On the role of hydrophobic interaction in flotation and flocculation. Colloid J. 1990, 52, 858–864. [Google Scholar]
  69. Vigdergauz, V.E.; Schrader, E.A.; Sarkisoa, L.M.; Kuznetsova, I.N. Evaluation of long-range interactions between hydrophobic surfaces as applied to the flotation of sulfide minerals. Phys.-Tech. Probl. Miner. Dev. 2006, 5, 107–114. [Google Scholar]
  70. Zhang, N.; Pang, T.; Han, R.; Chen, S.; Li, Z.; Yu, Y.; Shi, Z.; Liu, L.; Qu, J.; Zhou, A. Interactions between bubble and particles of key minerals of diasporic bauxite through the extended DLVO theory. Int. J. Min. Sci. Technol. 2022, 32, 201–214. [Google Scholar] [CrossRef]
  71. Churaev, N.V. Surface forces and physicochemistry of surface phenomena. Success Chem. 2004, 73, 26–38. [Google Scholar]
  72. Ficeriova, J.; Balaz, P. Leaching of gold from a mechanically and mechanochemically activated waste. Acta Montan. Slovaca 2010, 15, 183–187. [Google Scholar]
Figure 1. Experimental curves of the grain size distribution of gold in the flotation tailings during the flotation of the ores of the first (a) and second (b) samples obtained at the gold recovery factory.
Minerals 14 00088 g001
Figure 2. Machine flow sheet of the laboratory bench of the column flotation: 1—columns; 2—pump; 3—thin-layer platelike mixer; 4—distribution grid; 5—side-mounted pneumohydraulic aerator of the confusor–diffuser; 6—airlift; 7—Teflon gate.
Minerals 14 00088 g002
Figure 3. Components of the resistance force acting on the solid particle in the viscous liquid flow.
Minerals 14 00088 g003
Figure 4. Dependence of the induction time τind on the temperature T (a) and the constant of the flotation rate and the size of the gas bubble Rb (b).
Minerals 14 00088 g004
Figure 5. The view of the isotherm of the wedging pressure П(h) of the wetting film.
Minerals 14 00088 g005
Figure 6. The scheme (a) and the calculation results (b) of the threshold depth of the long-range potential minimum for the fine particles of various sizes.
Minerals 14 00088 g006
Figure 7. Results of enriching sample-1 in the experiment, modeling a closed cycle.
Minerals 14 00088 g007
Figure 8. Gold extraction as a function of its content in the initial feed of the flotation operation for sample-1 (a), sample-2 (b), and according to research works (c).
Minerals 14 00088 g008
Table 1. Results of the experiments on the ore flotation using competing flotation schemes.
No. ItemProduct NameYield, %Au Content, g/tAu Extraction, %
Sample-2 flotation in the factory mode
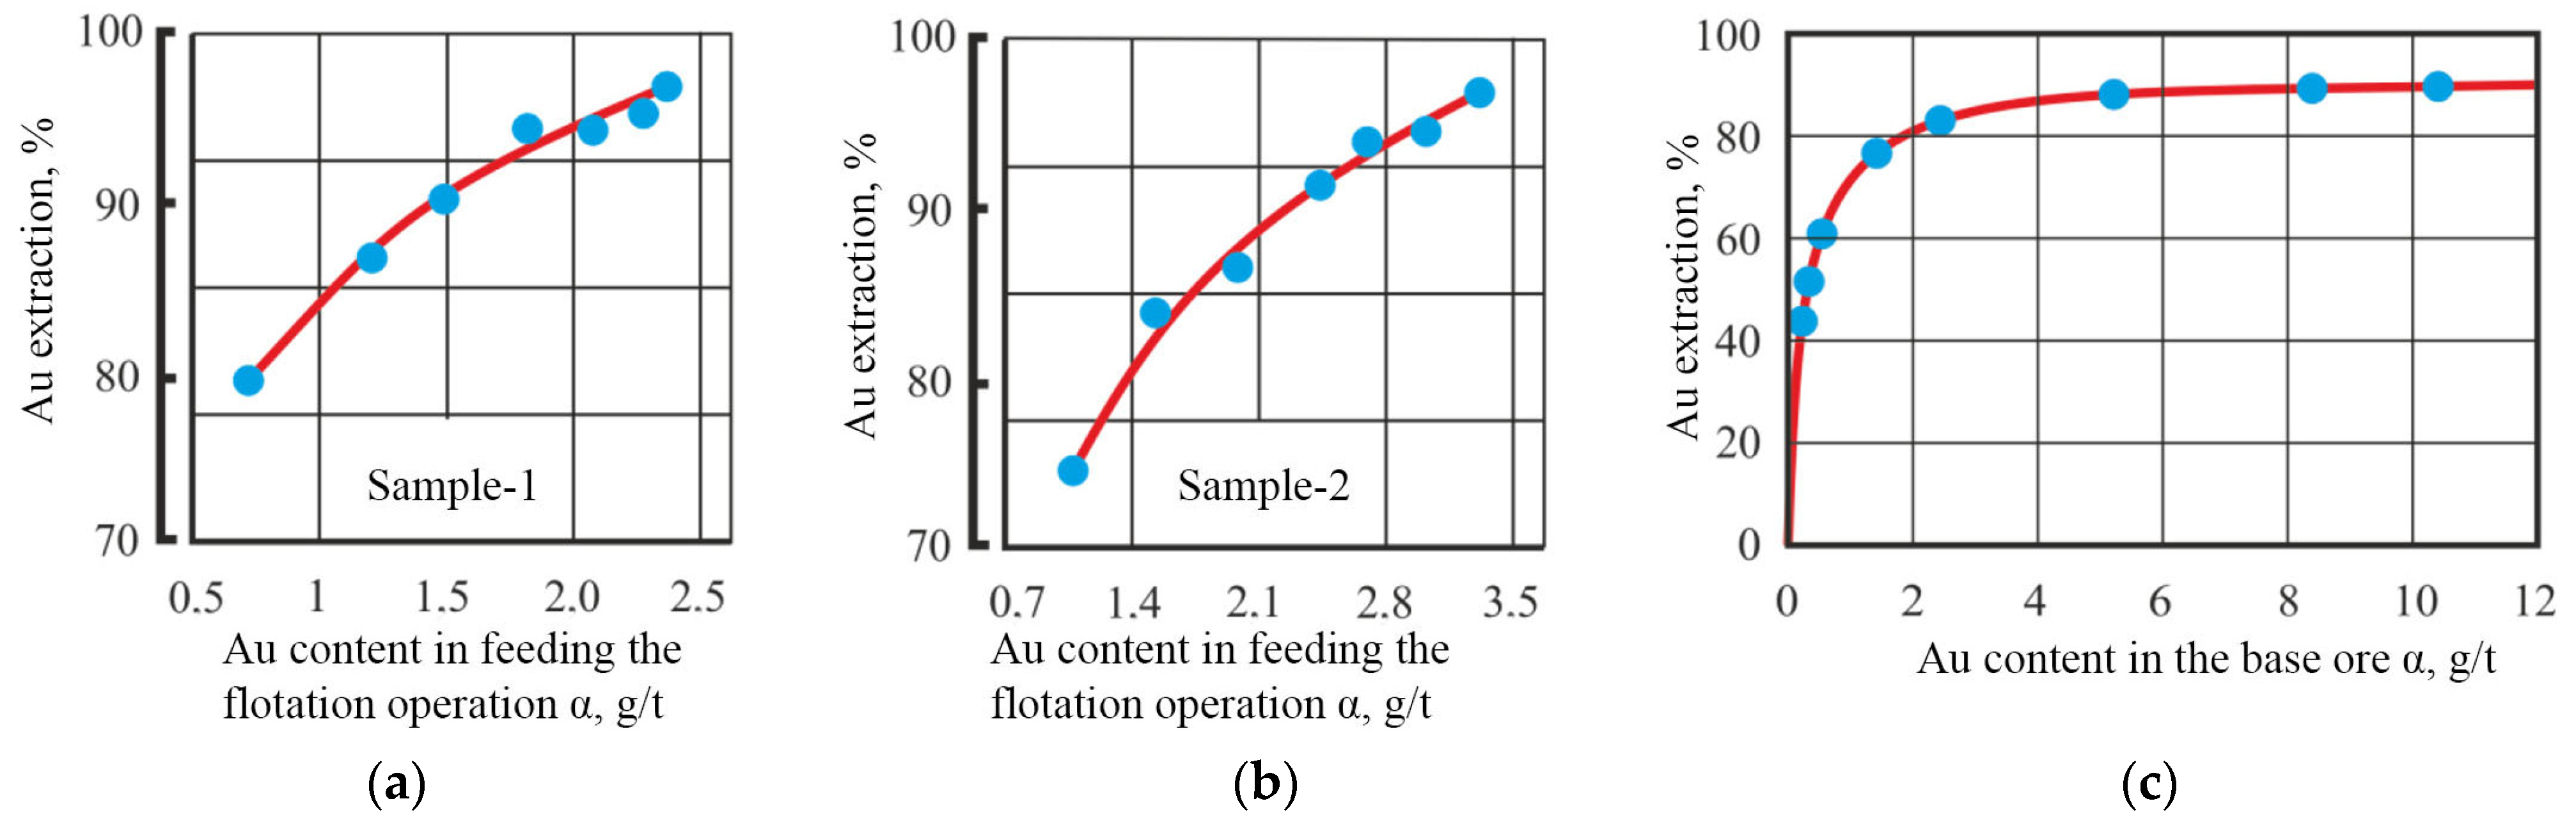
1Rougher concentrate14.4174.9774.95
2Flotation tailings85.5830.28025.05
3Base ore100.00.956100.0
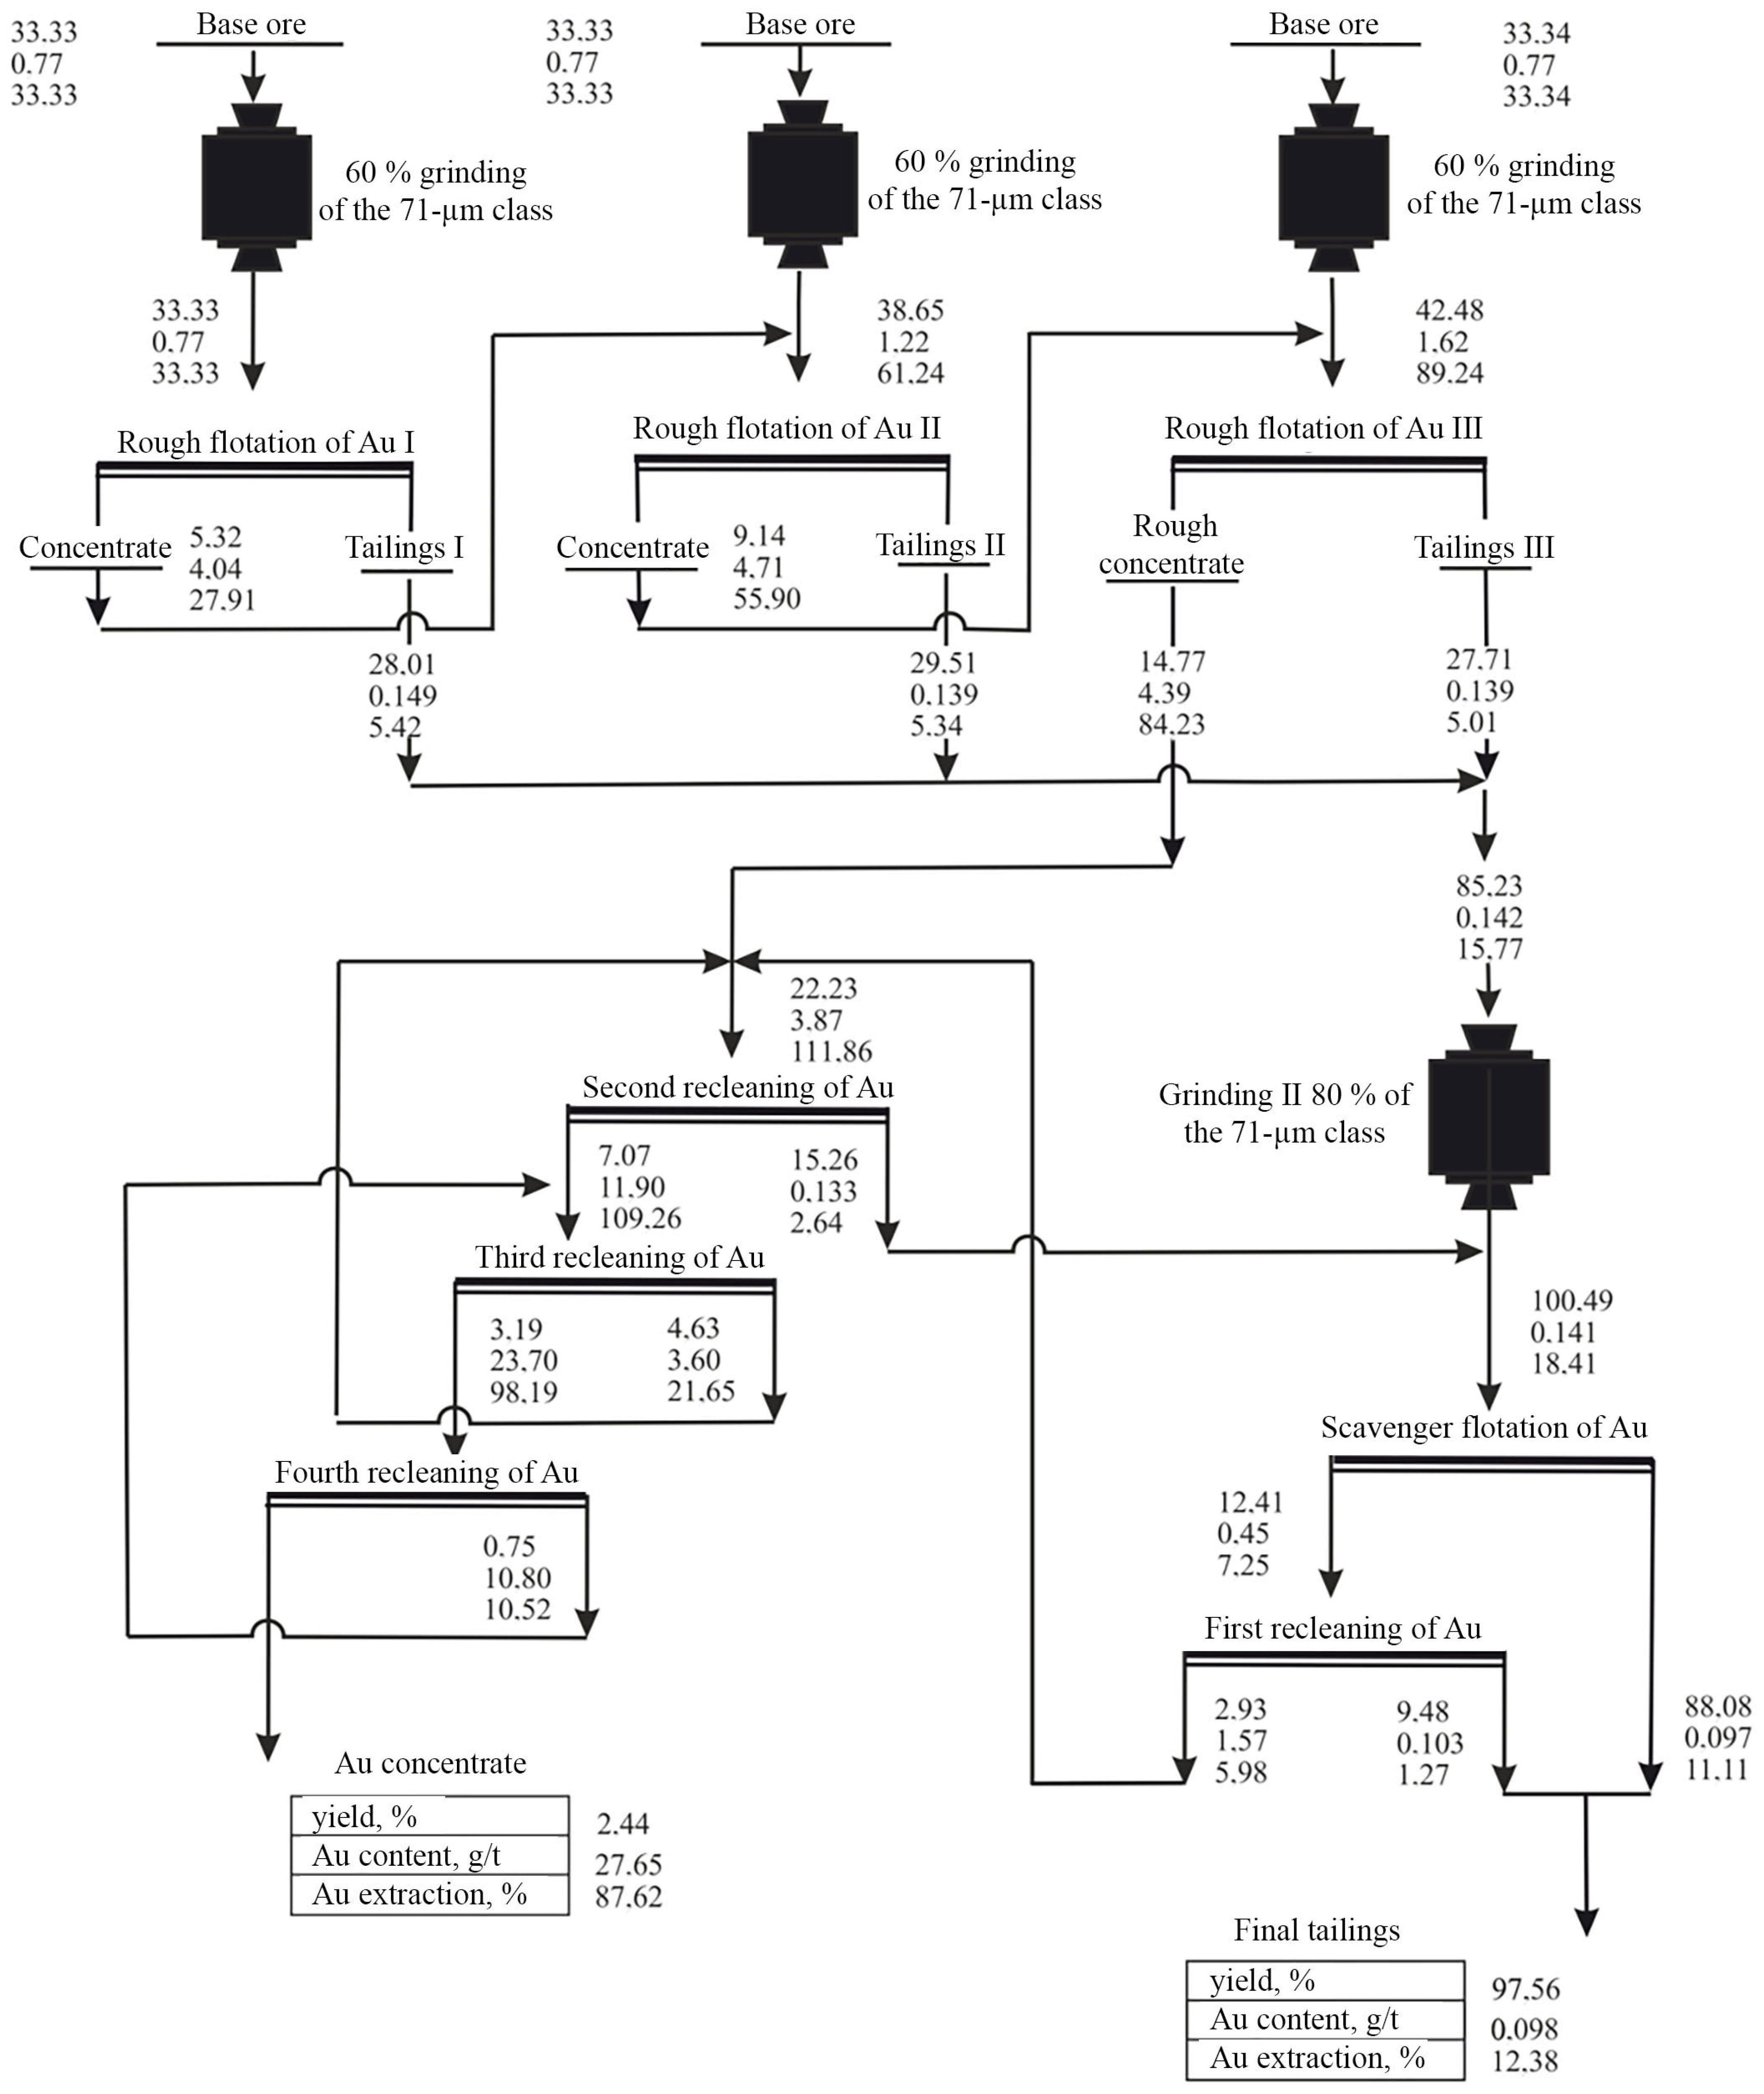
Sample-2 flotation using carrier minerals
4Rougher concentrate11.406.2974.95
5Tailings-129.760.2979.24
6Tailings-229.420.2748.43
7Tailings-329.420.2407.38
8General tailings88.600.27025.05
9Base ore100.00.956100.0
Disclaimer/Publisher’s Note: The statements, opinions and data contained in all publications are solely those of the individual author(s) and contributor(s) and not of MDPI and/or the editor(s). MDPI and/or the editor(s) disclaim responsibility for any injury to people or property resulting from any ideas, methods, instructions or products referred to in the content.

