Appendix A
Table A1.
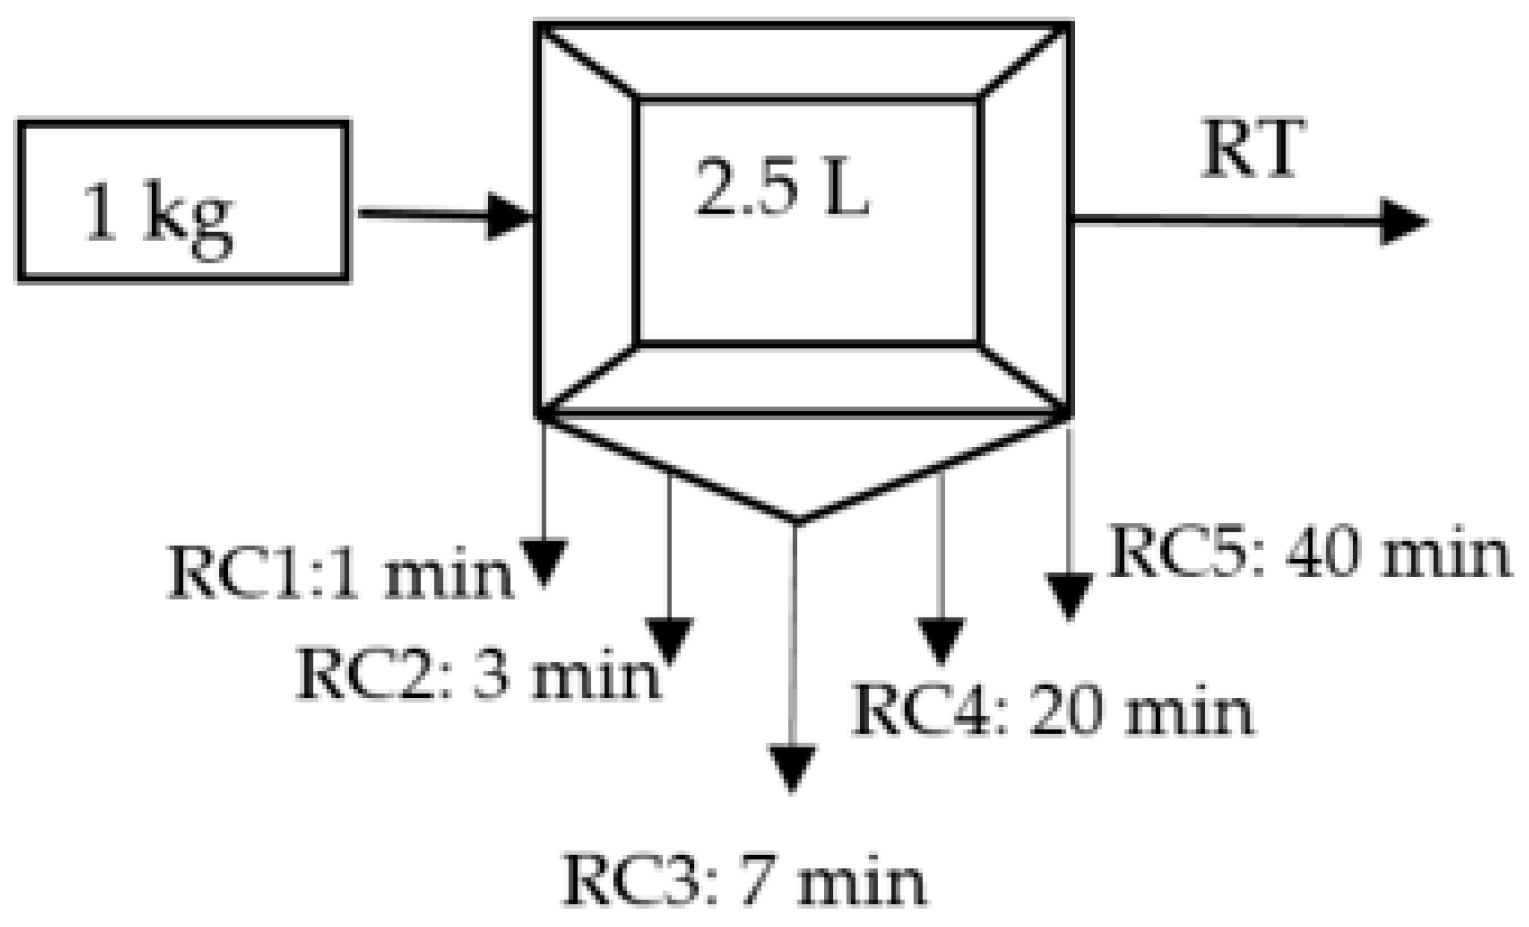
Experimental flotation tests on the Platreef samples with different reagent dosing.
Table A1.
Experimental flotation tests on the Platreef samples with different reagent dosing.
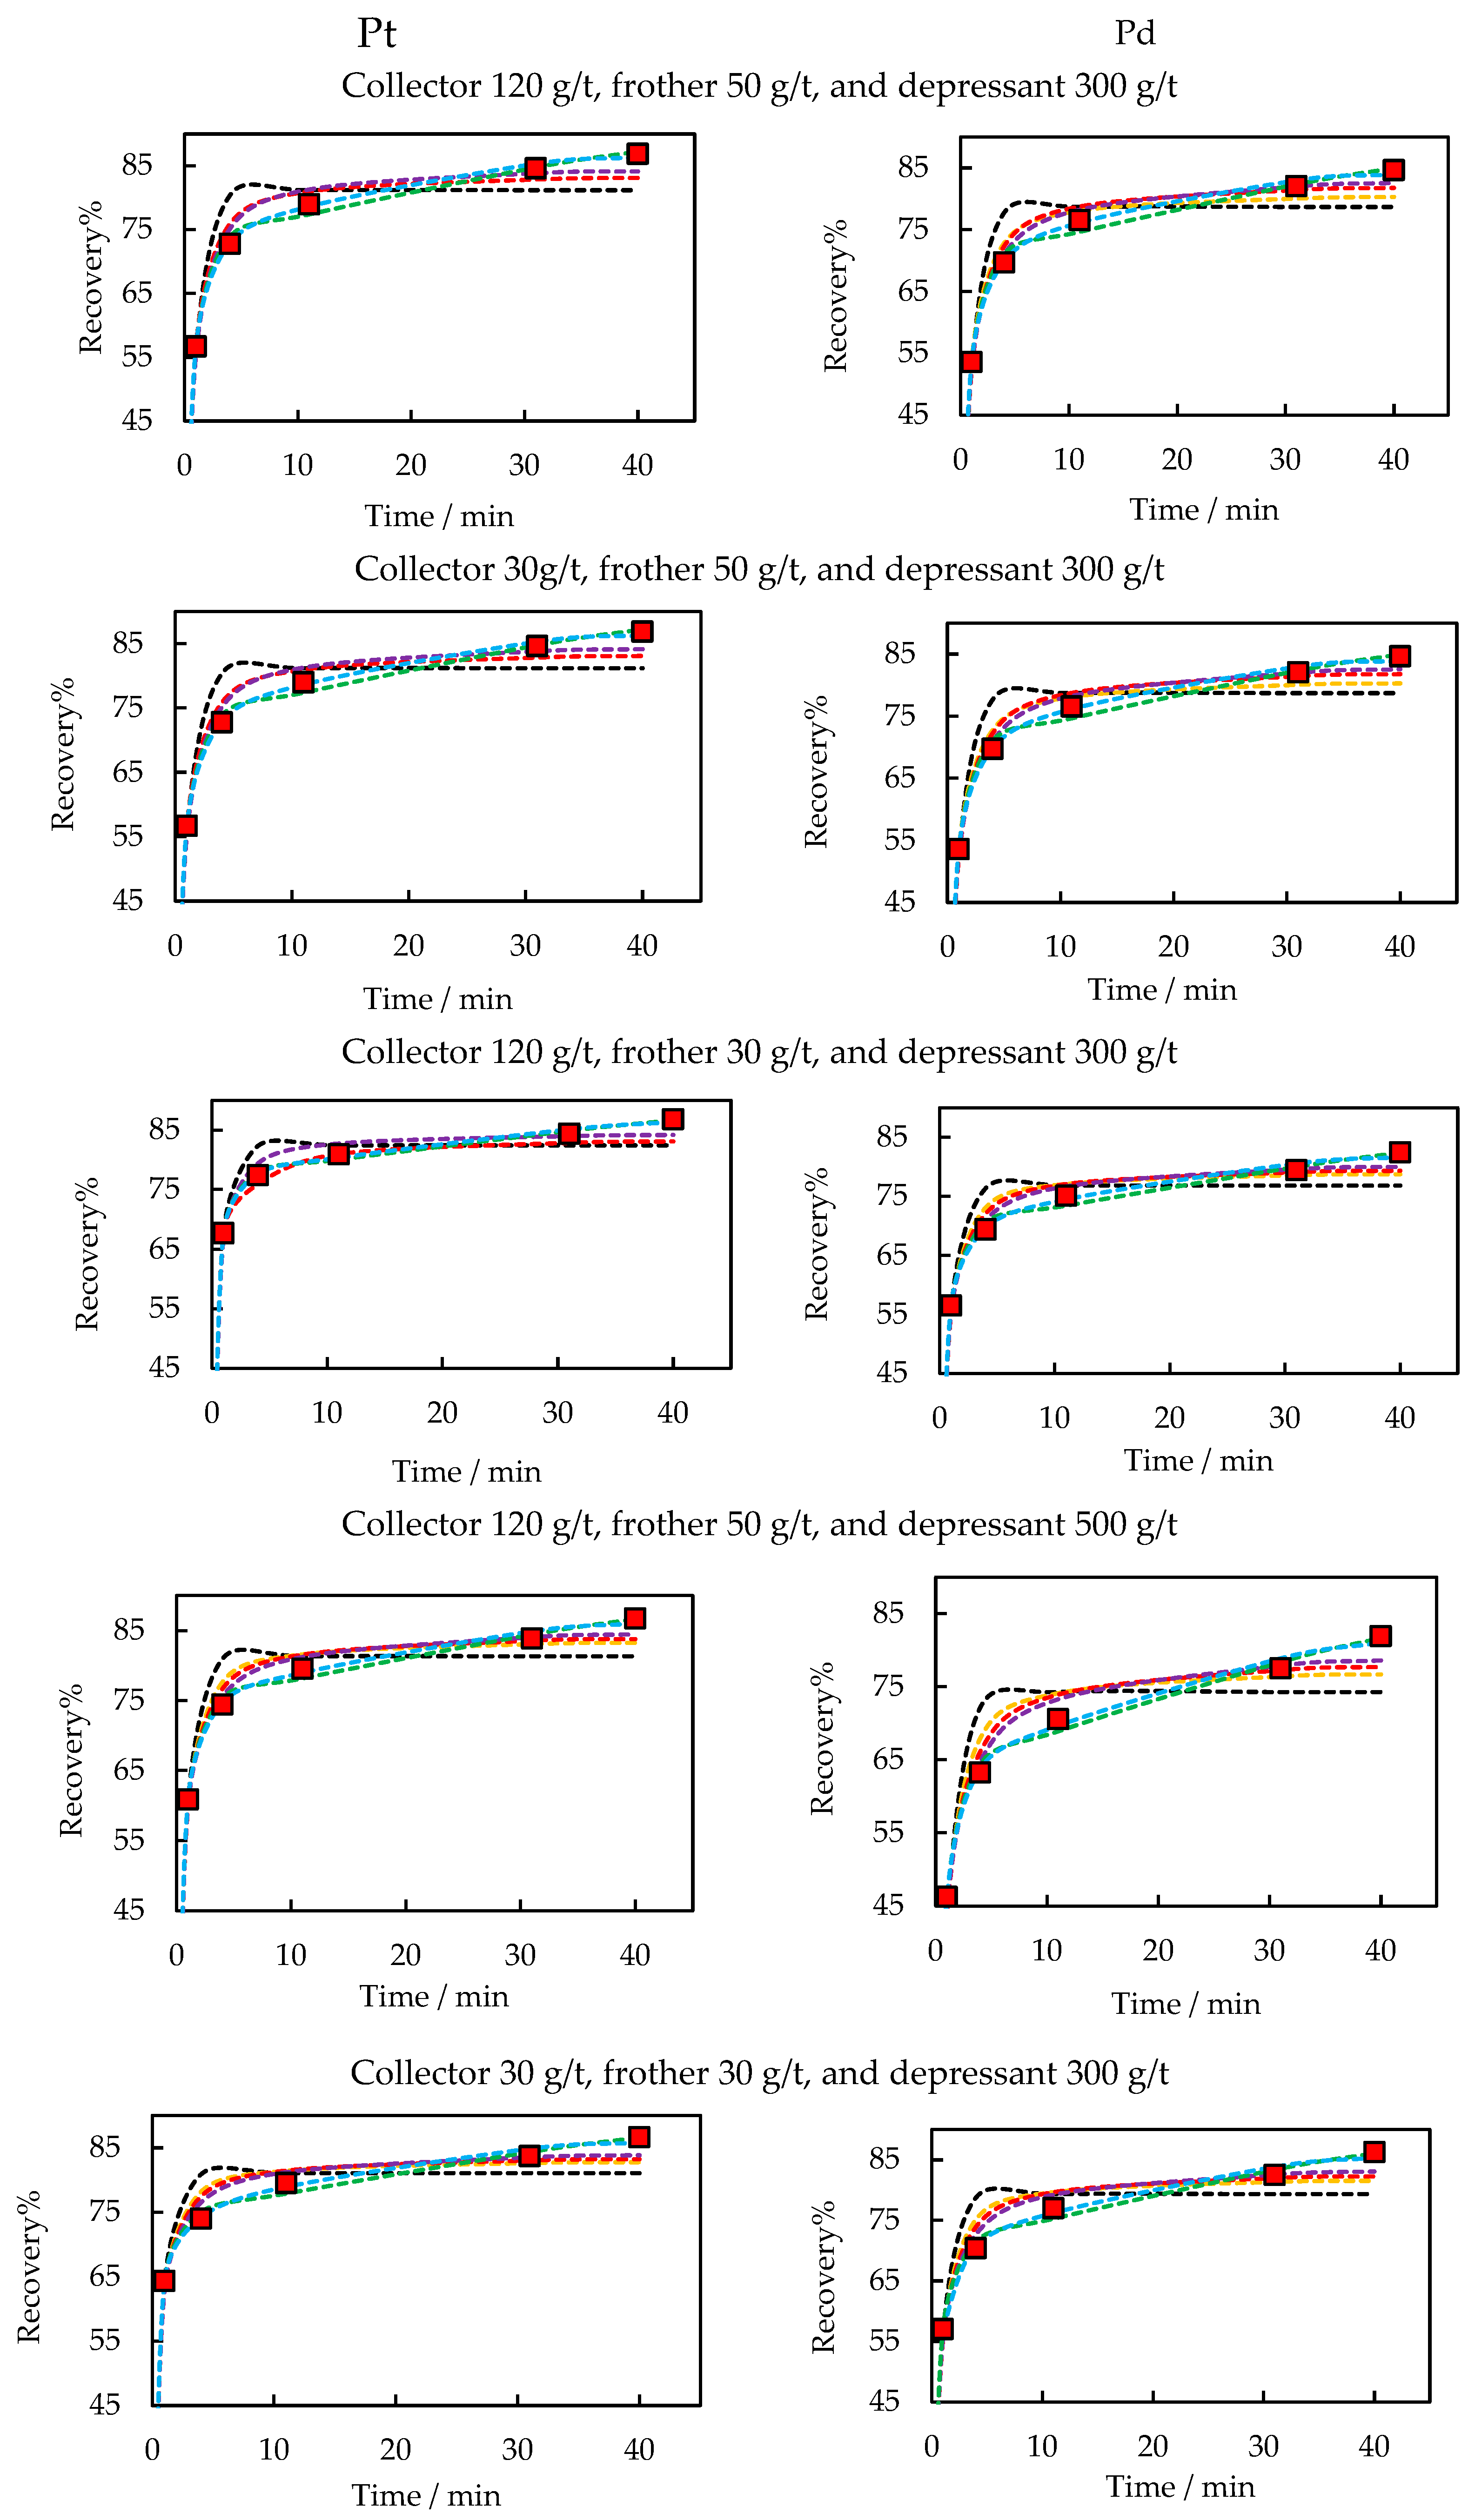
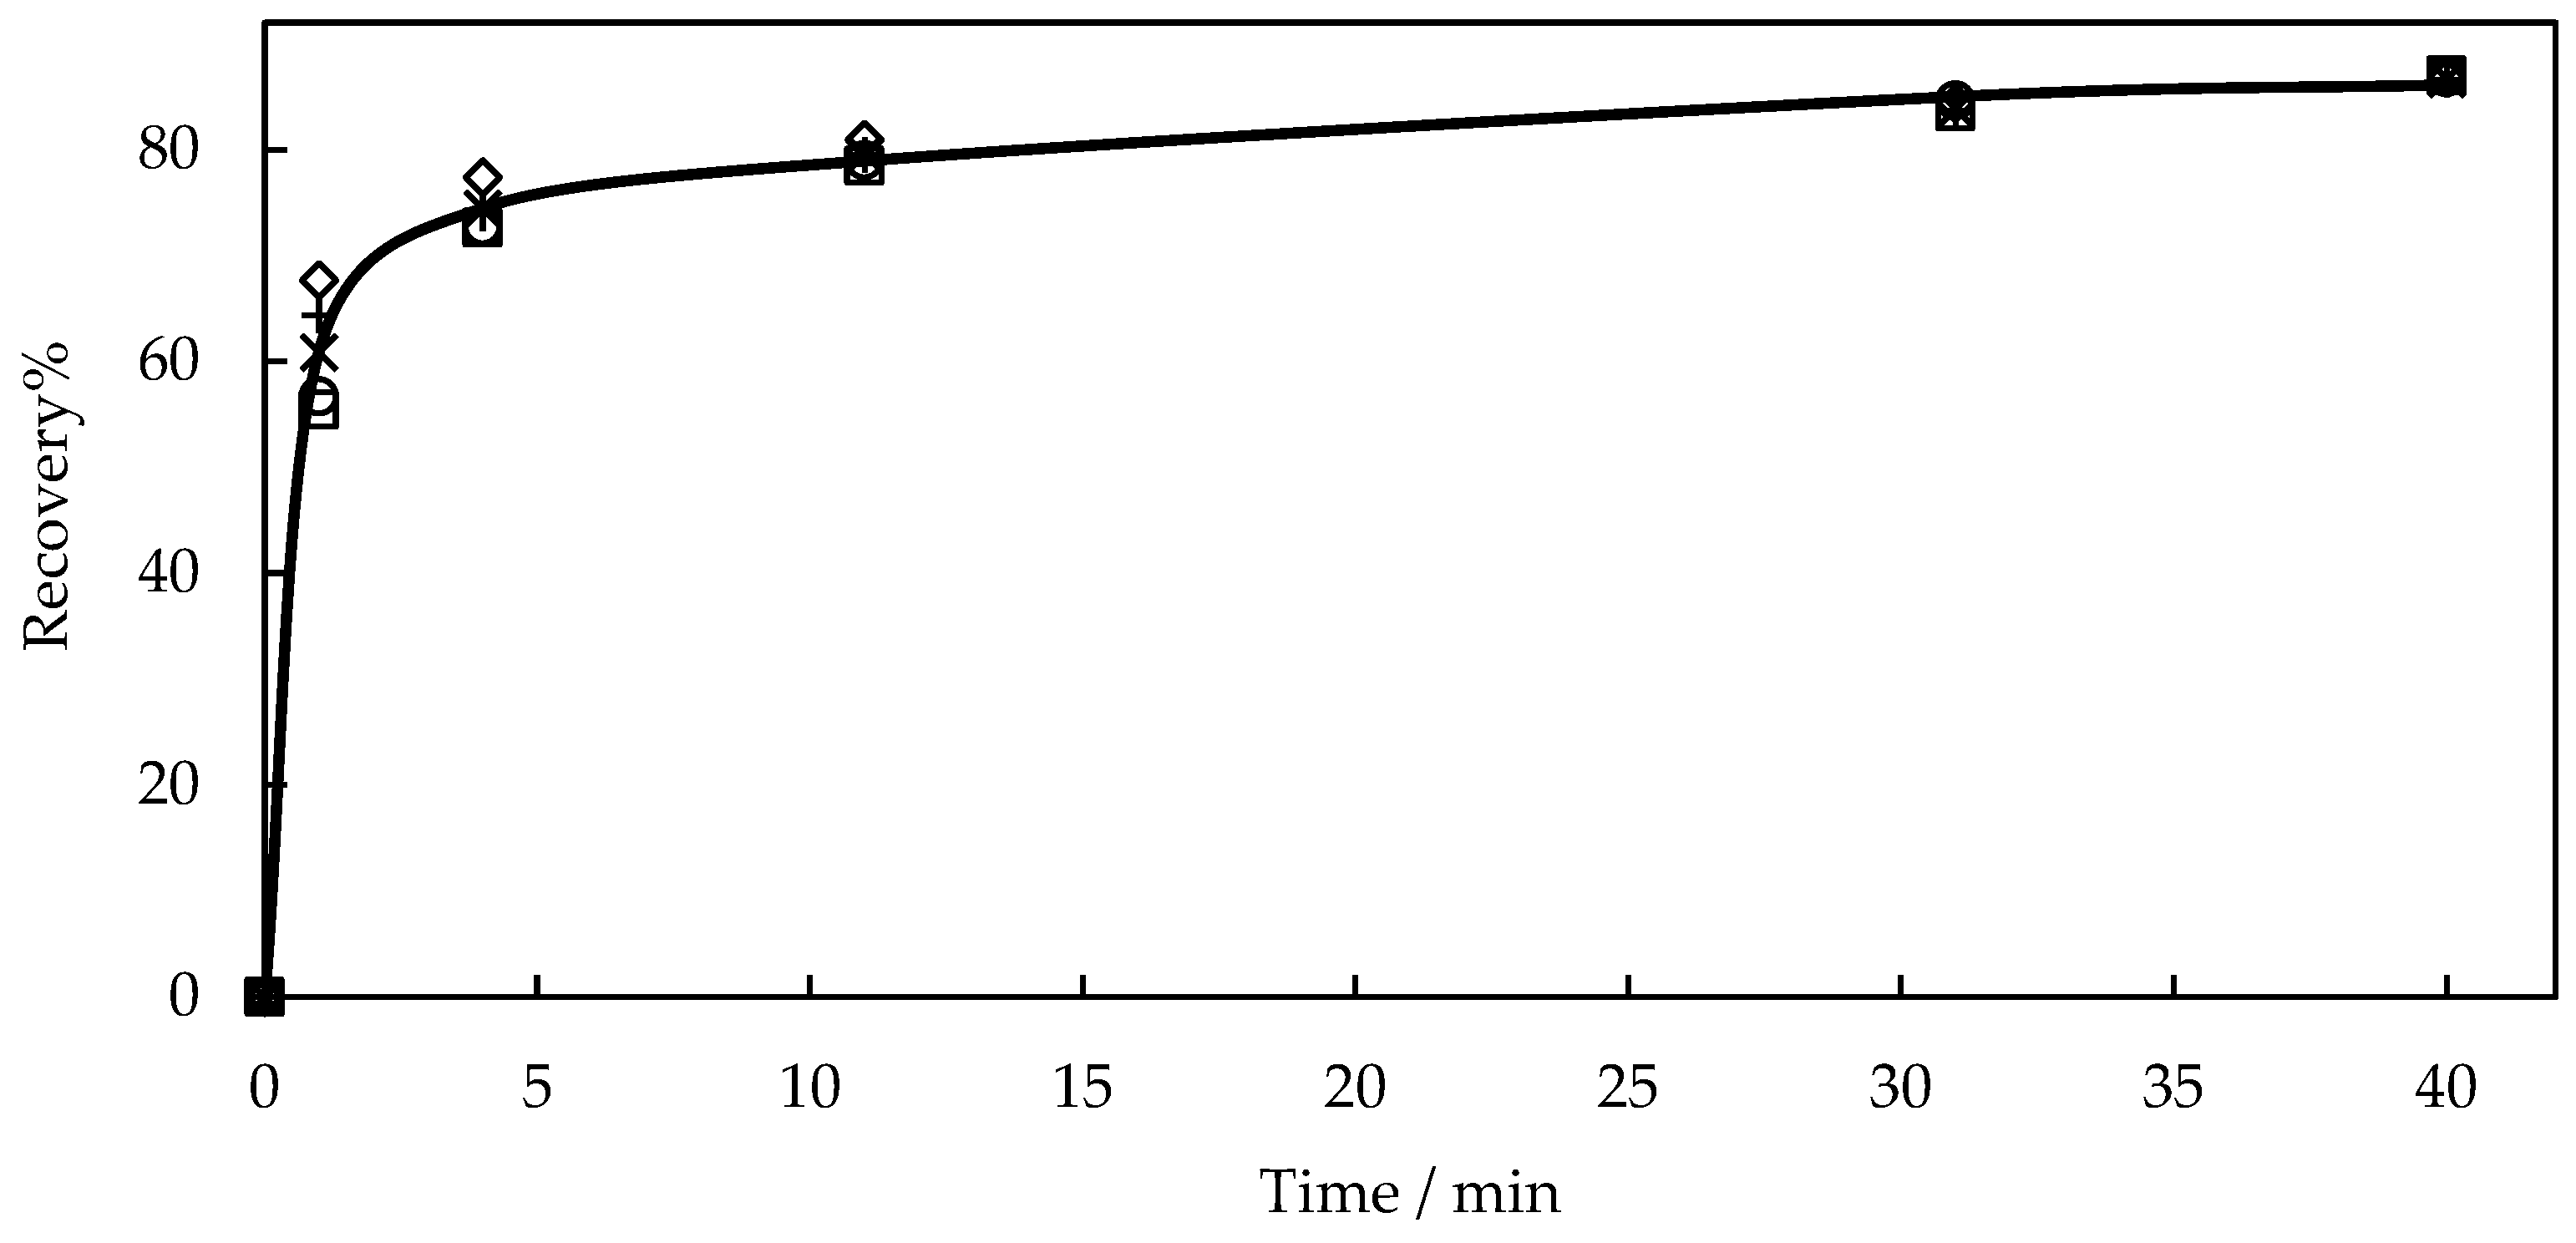
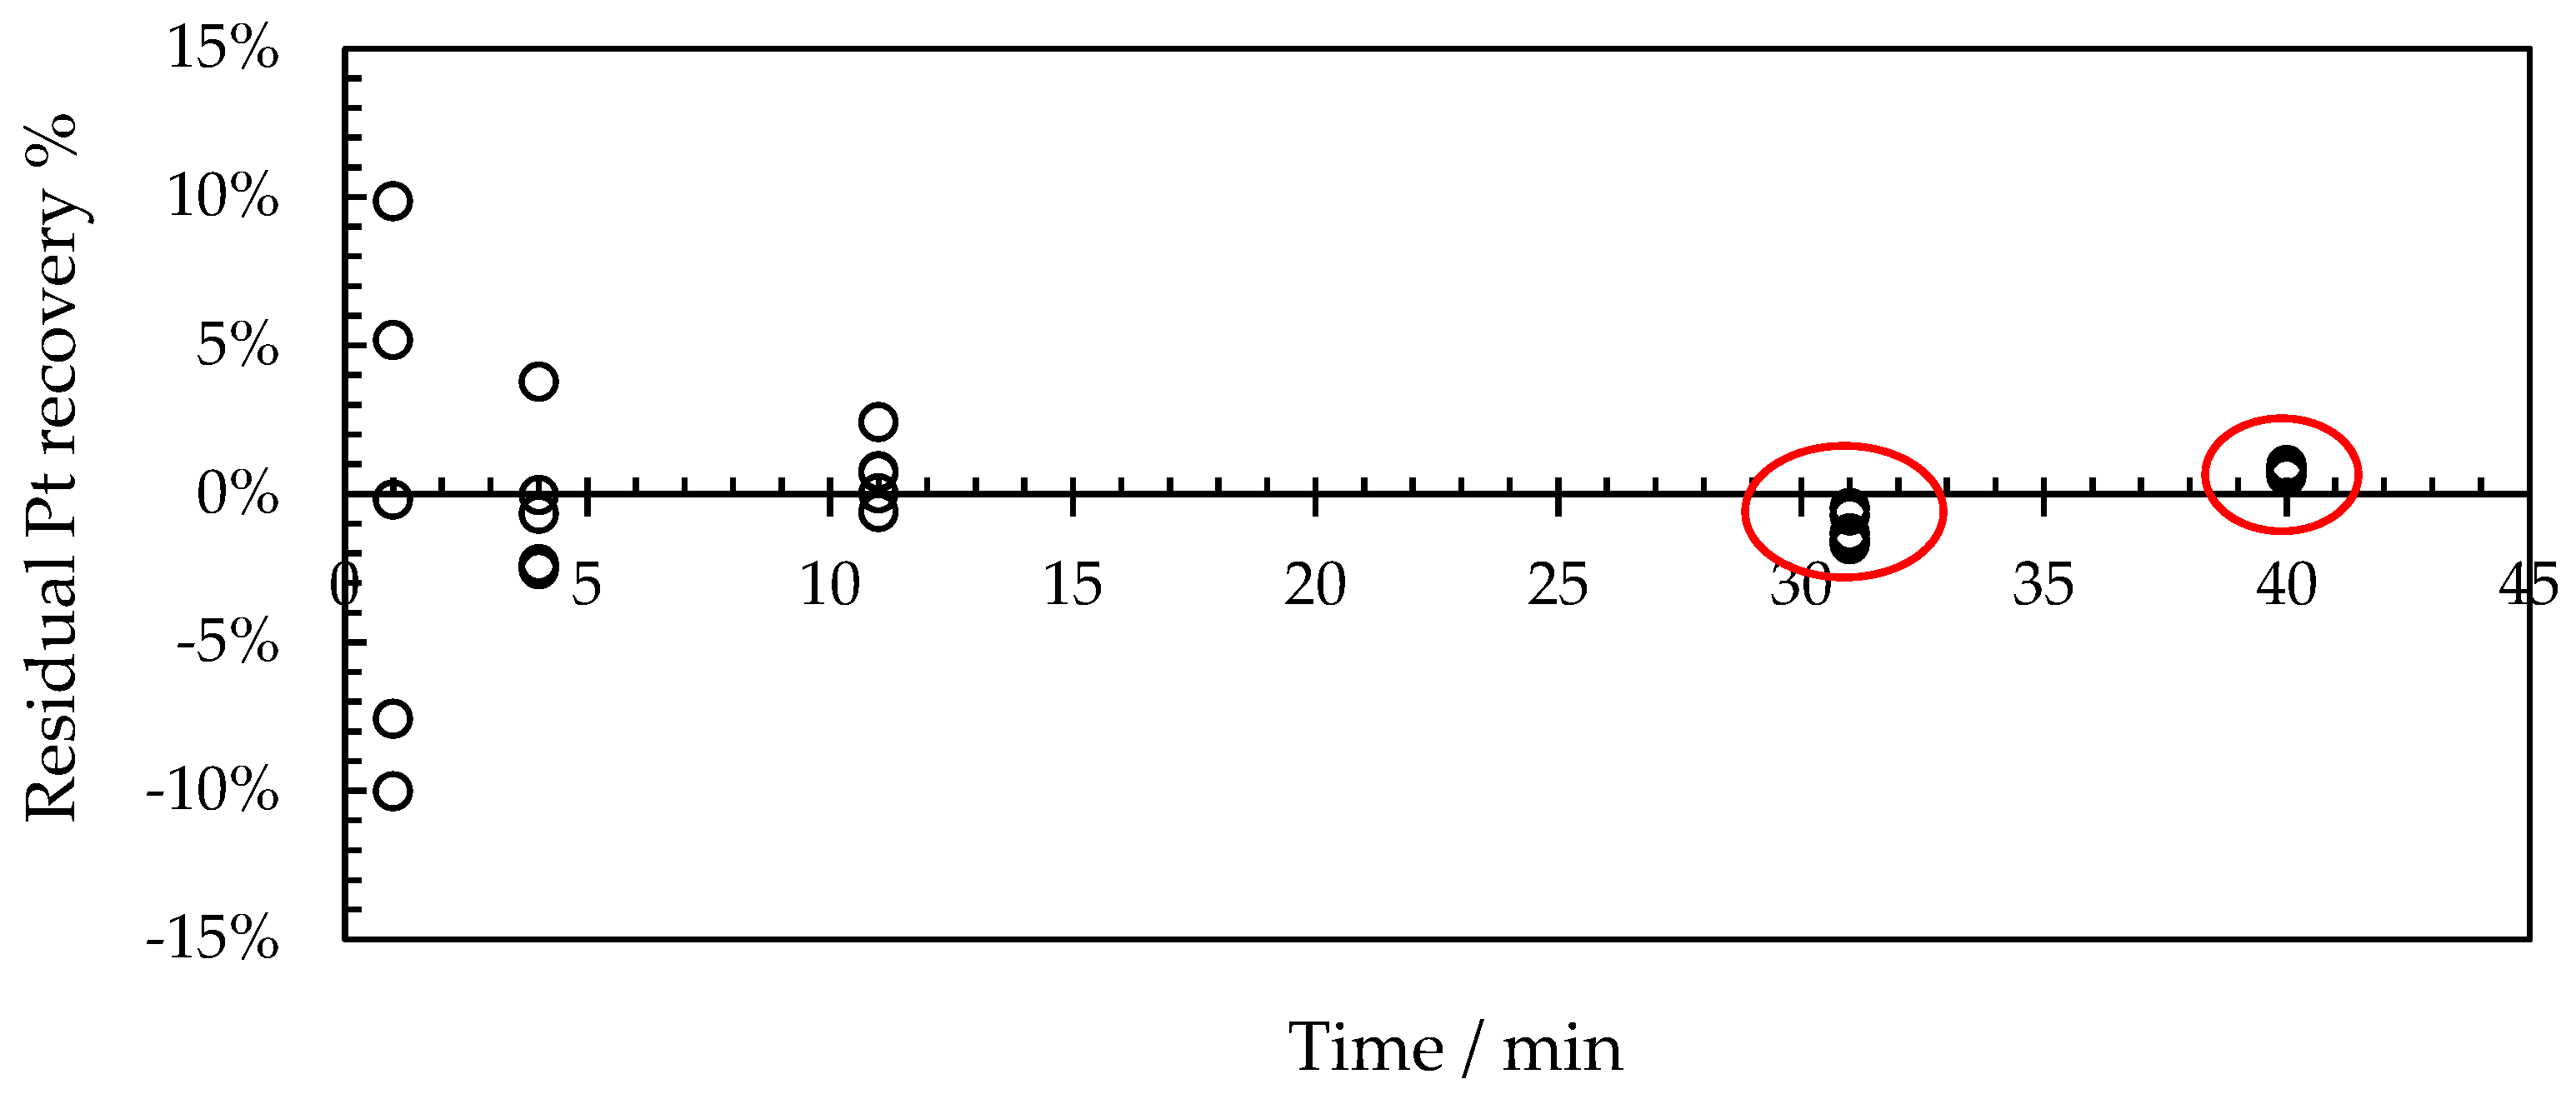
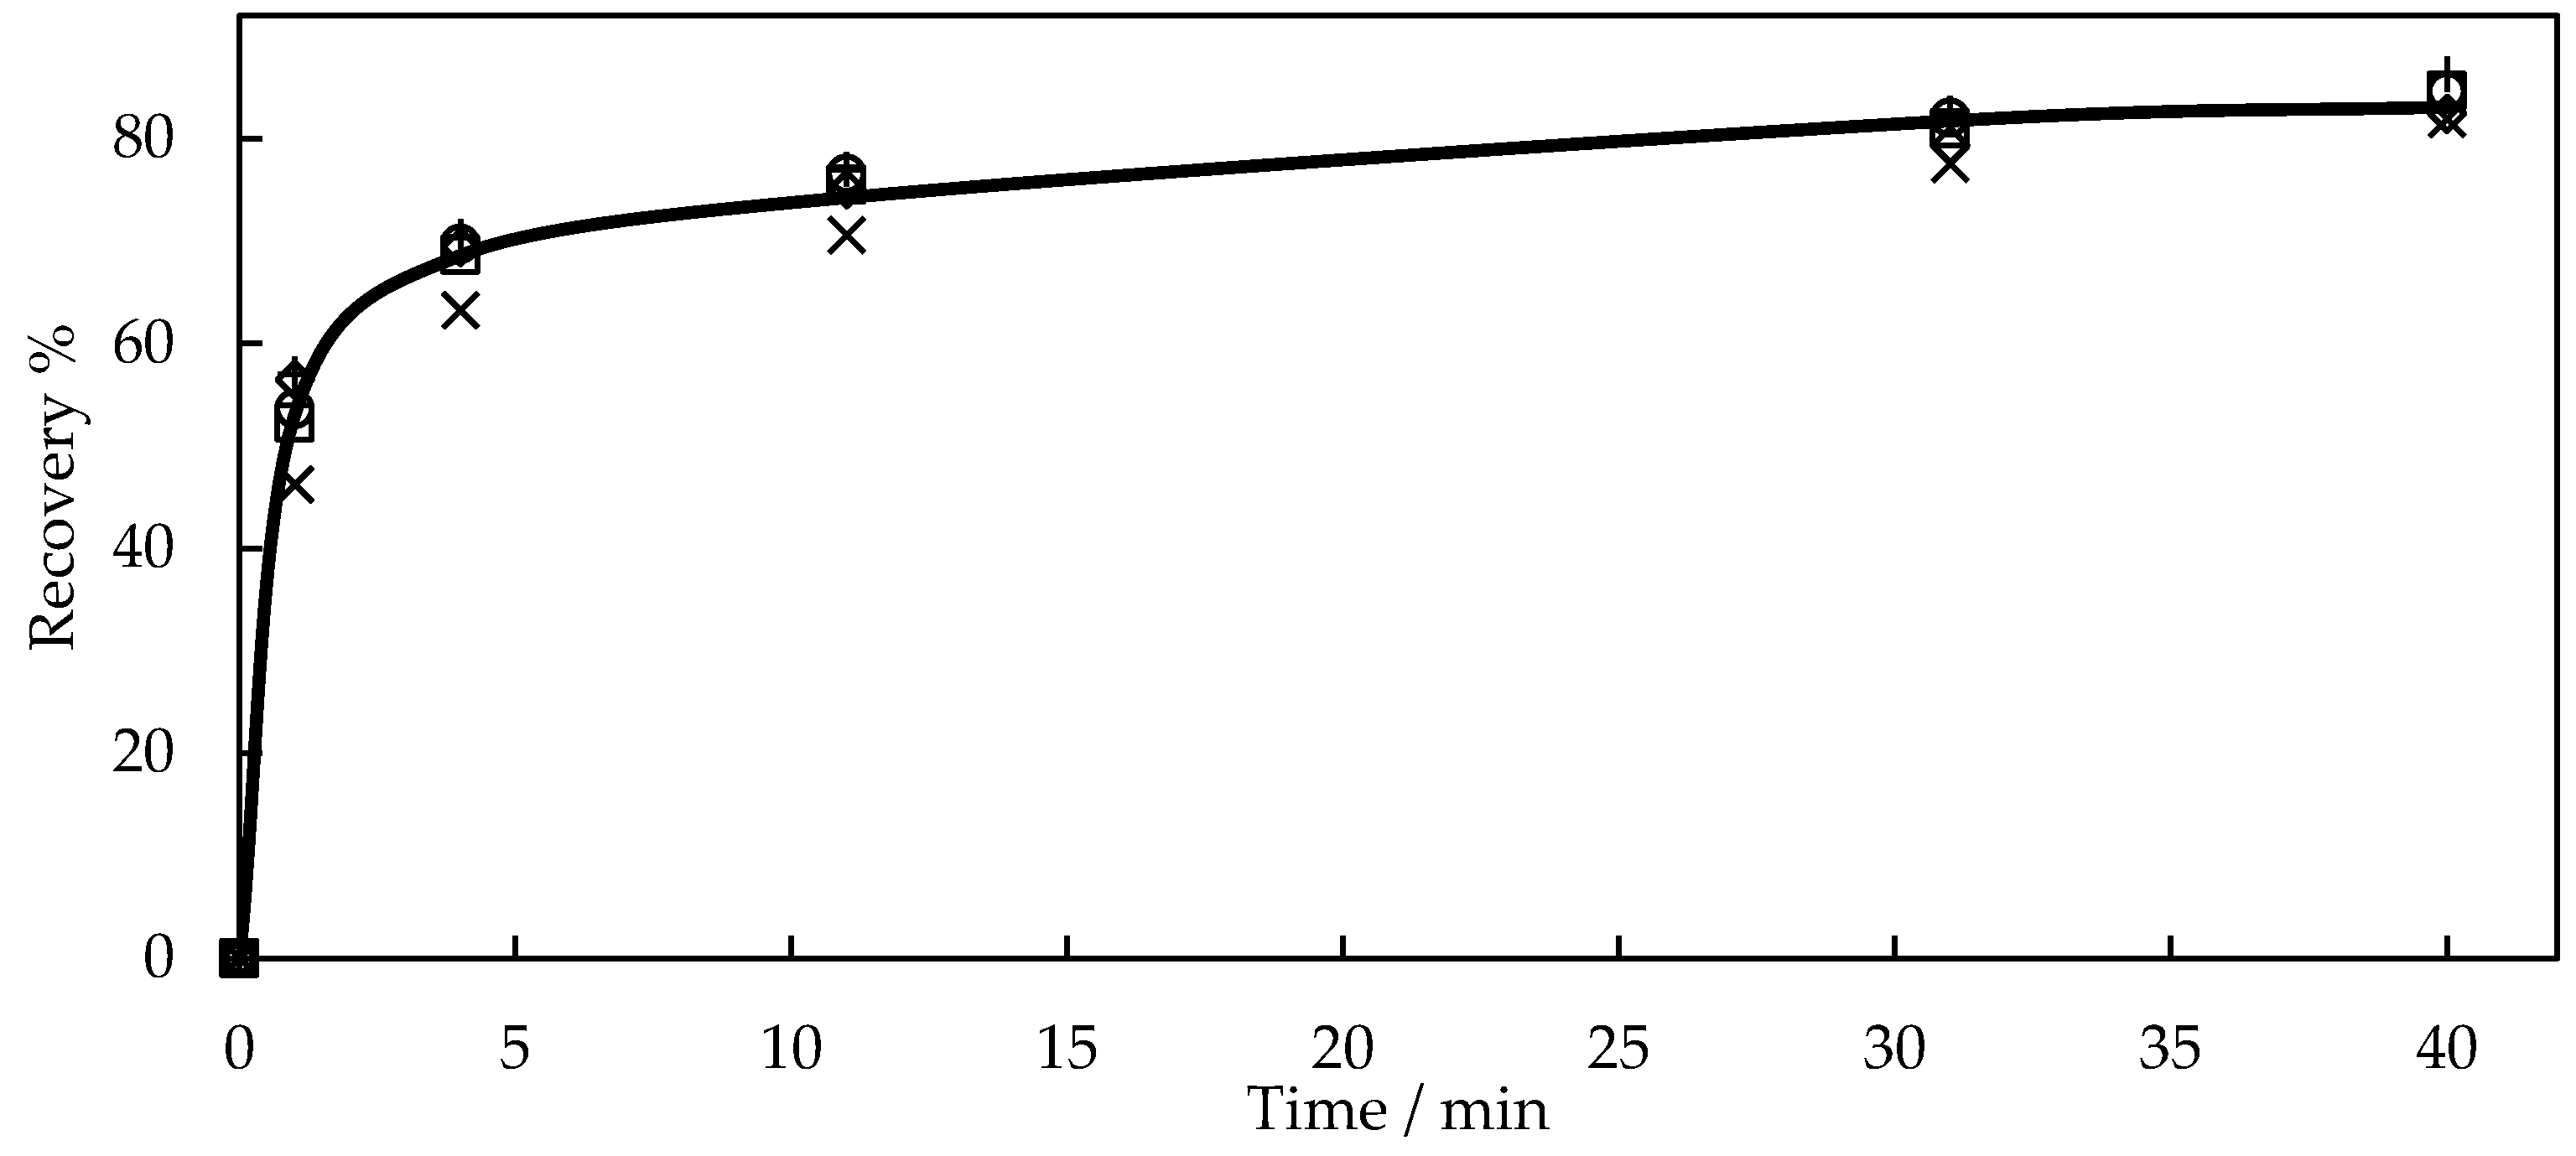
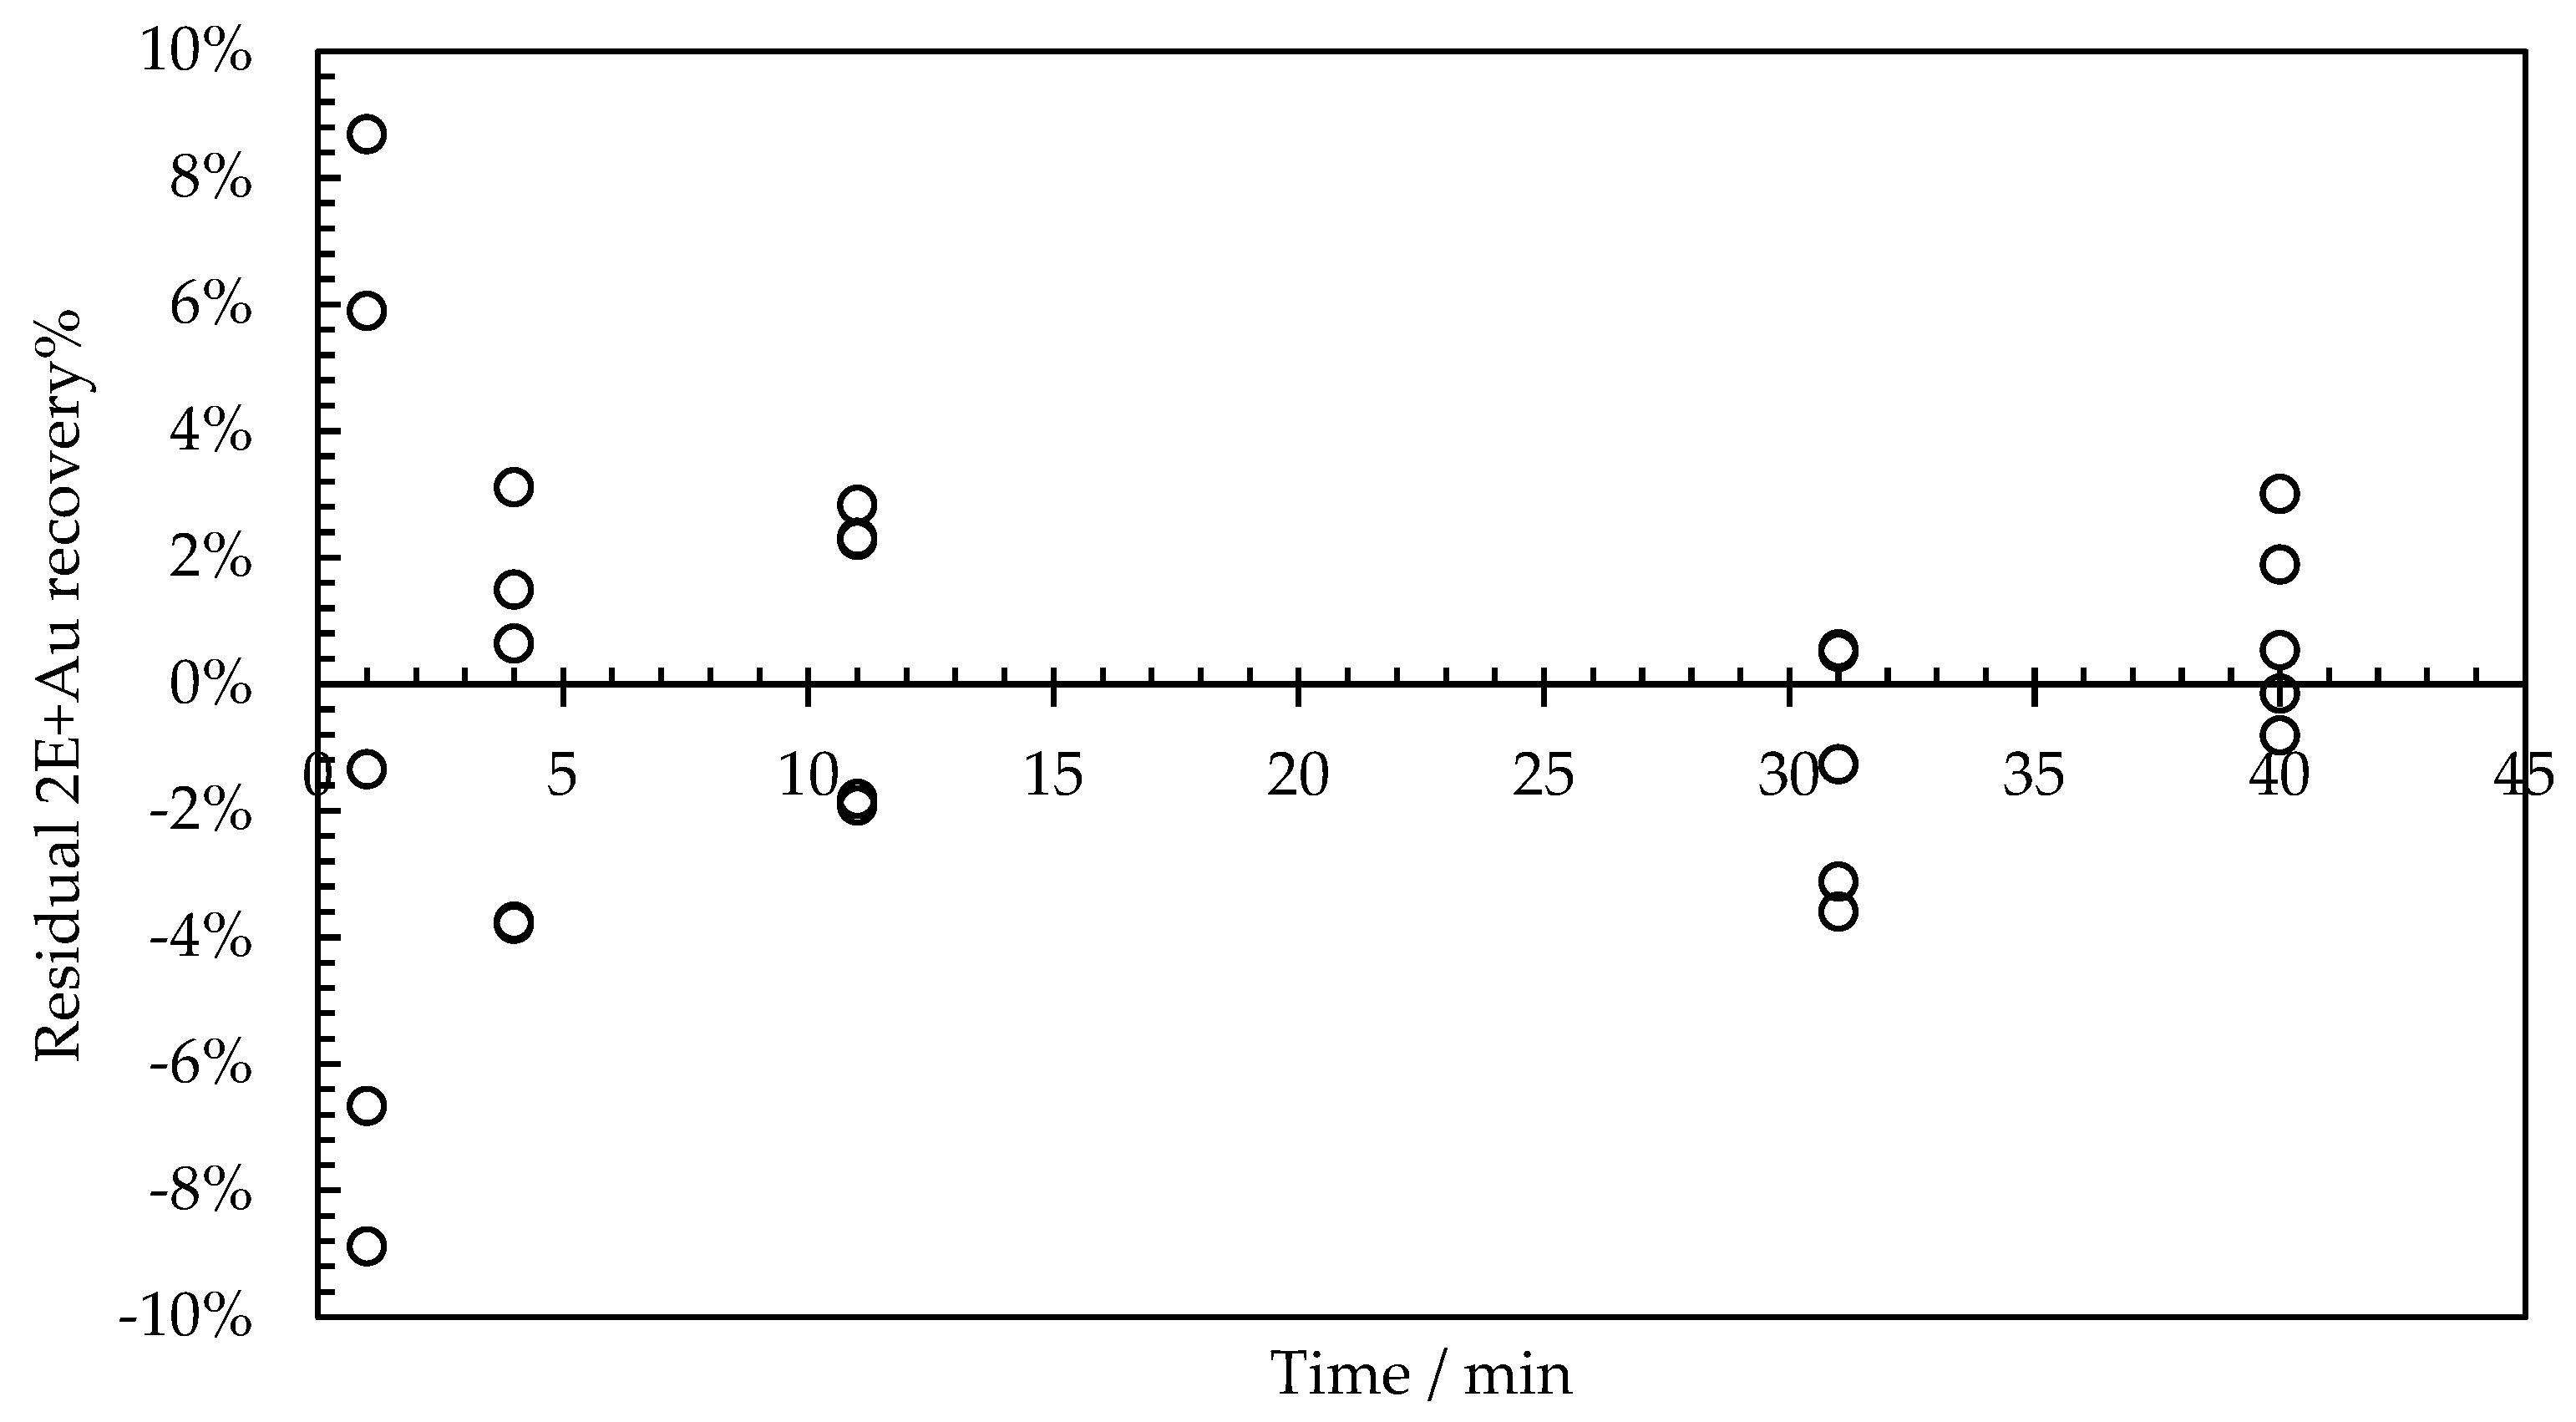
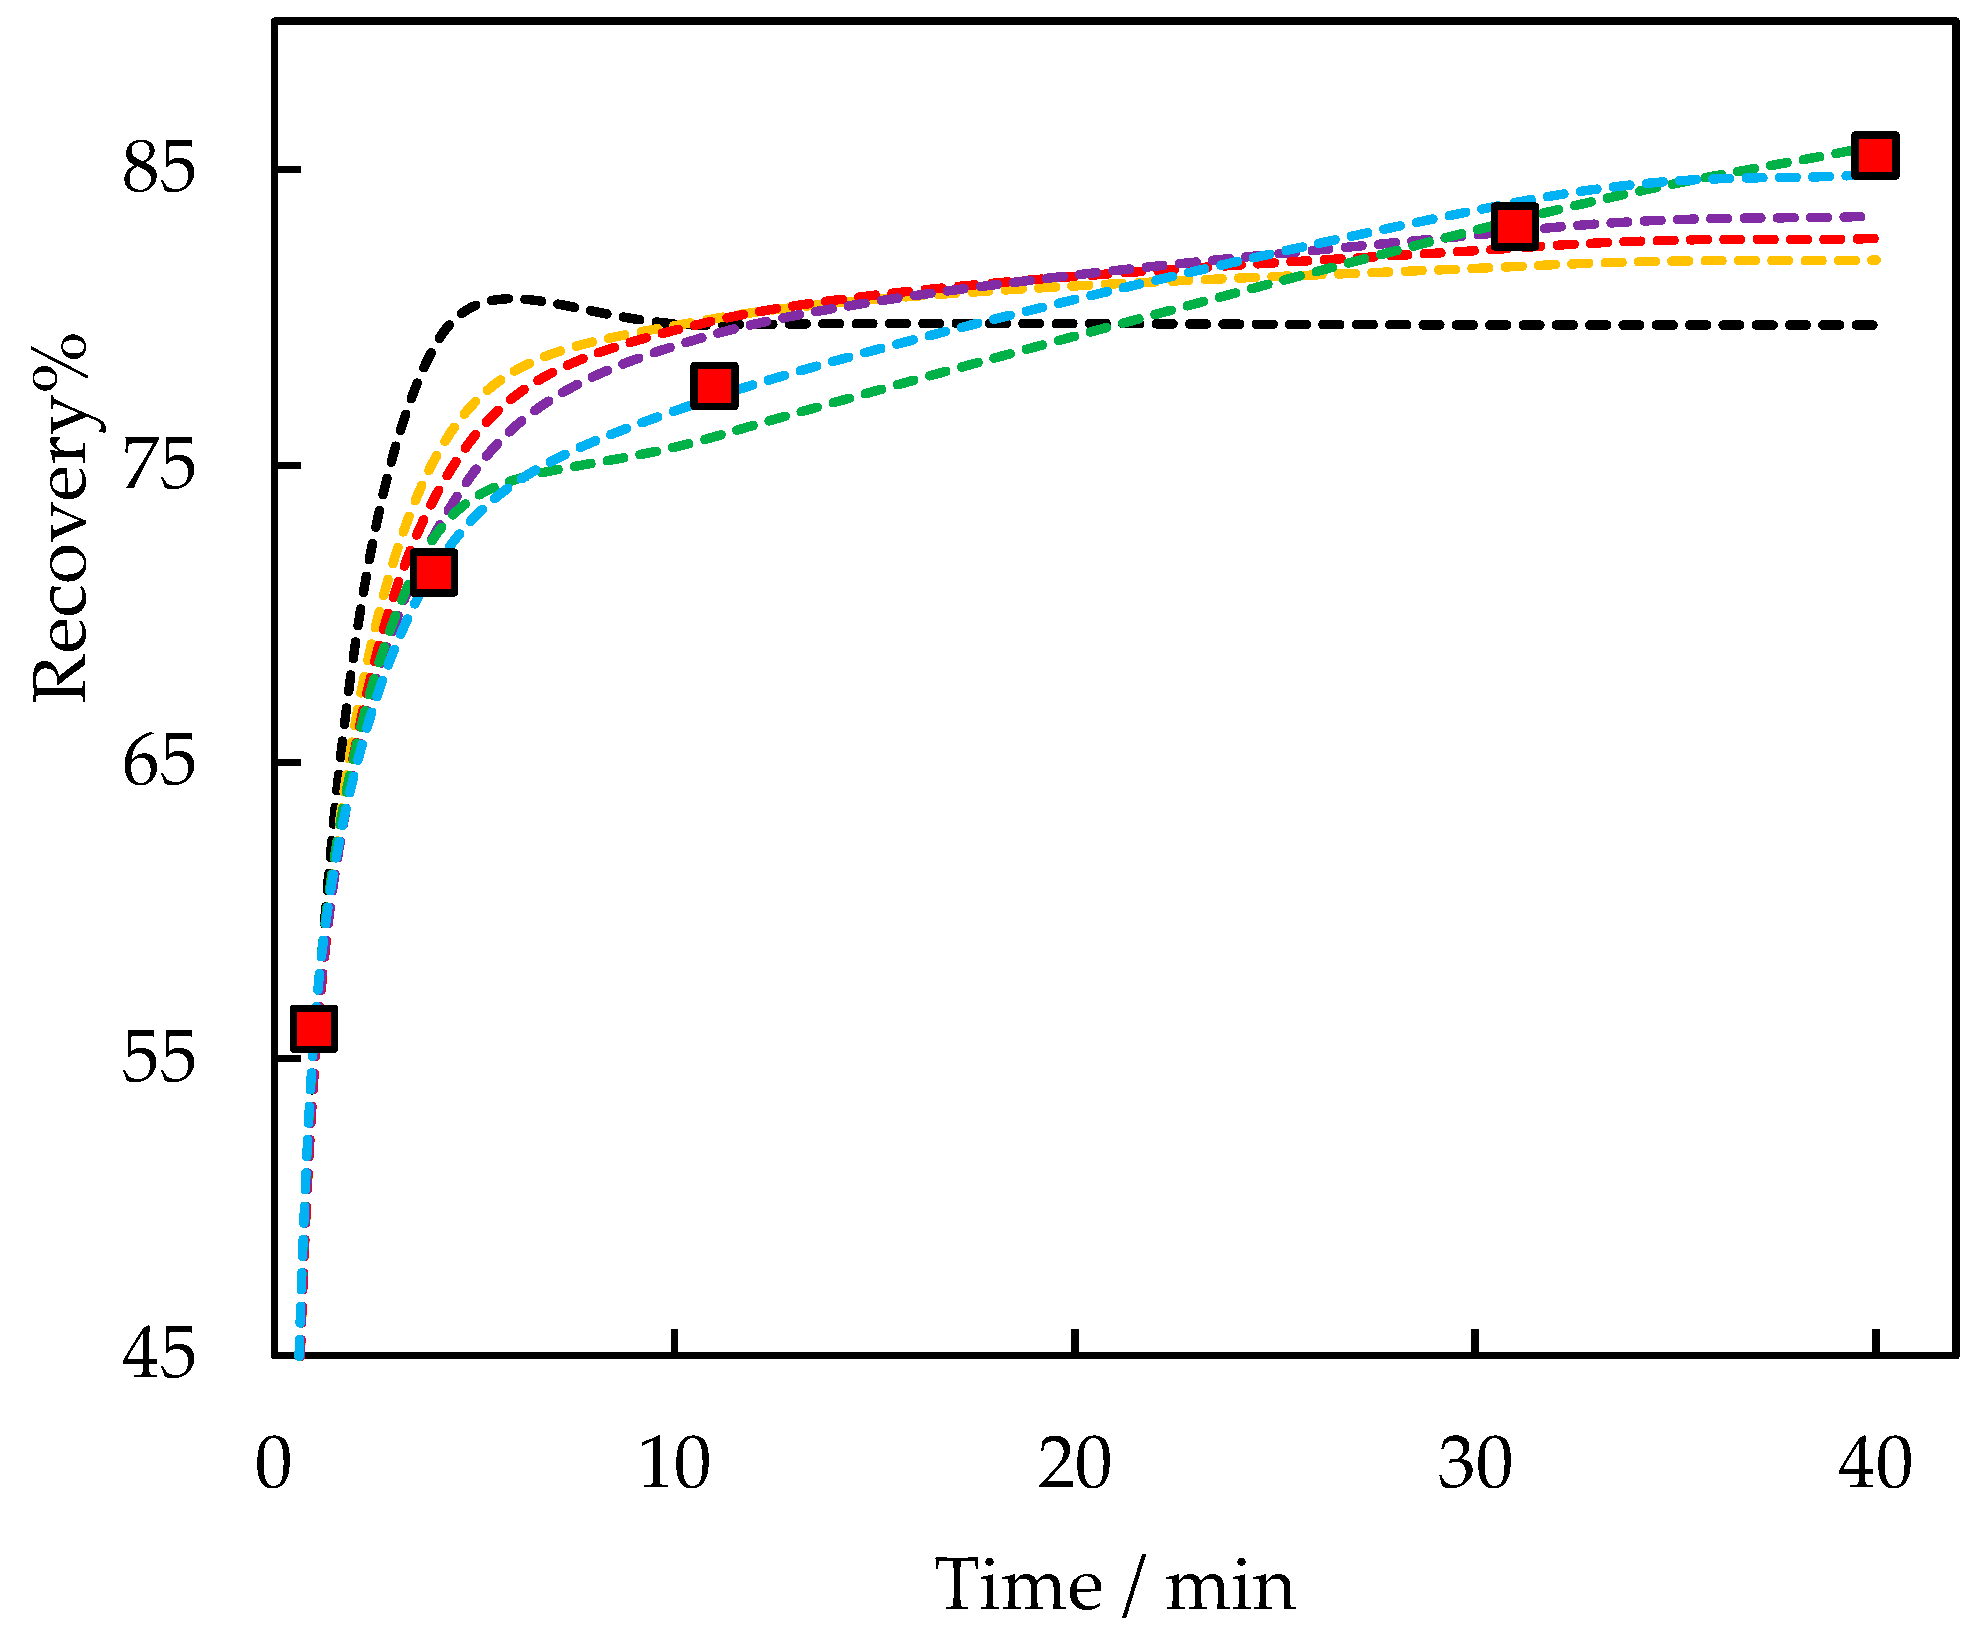
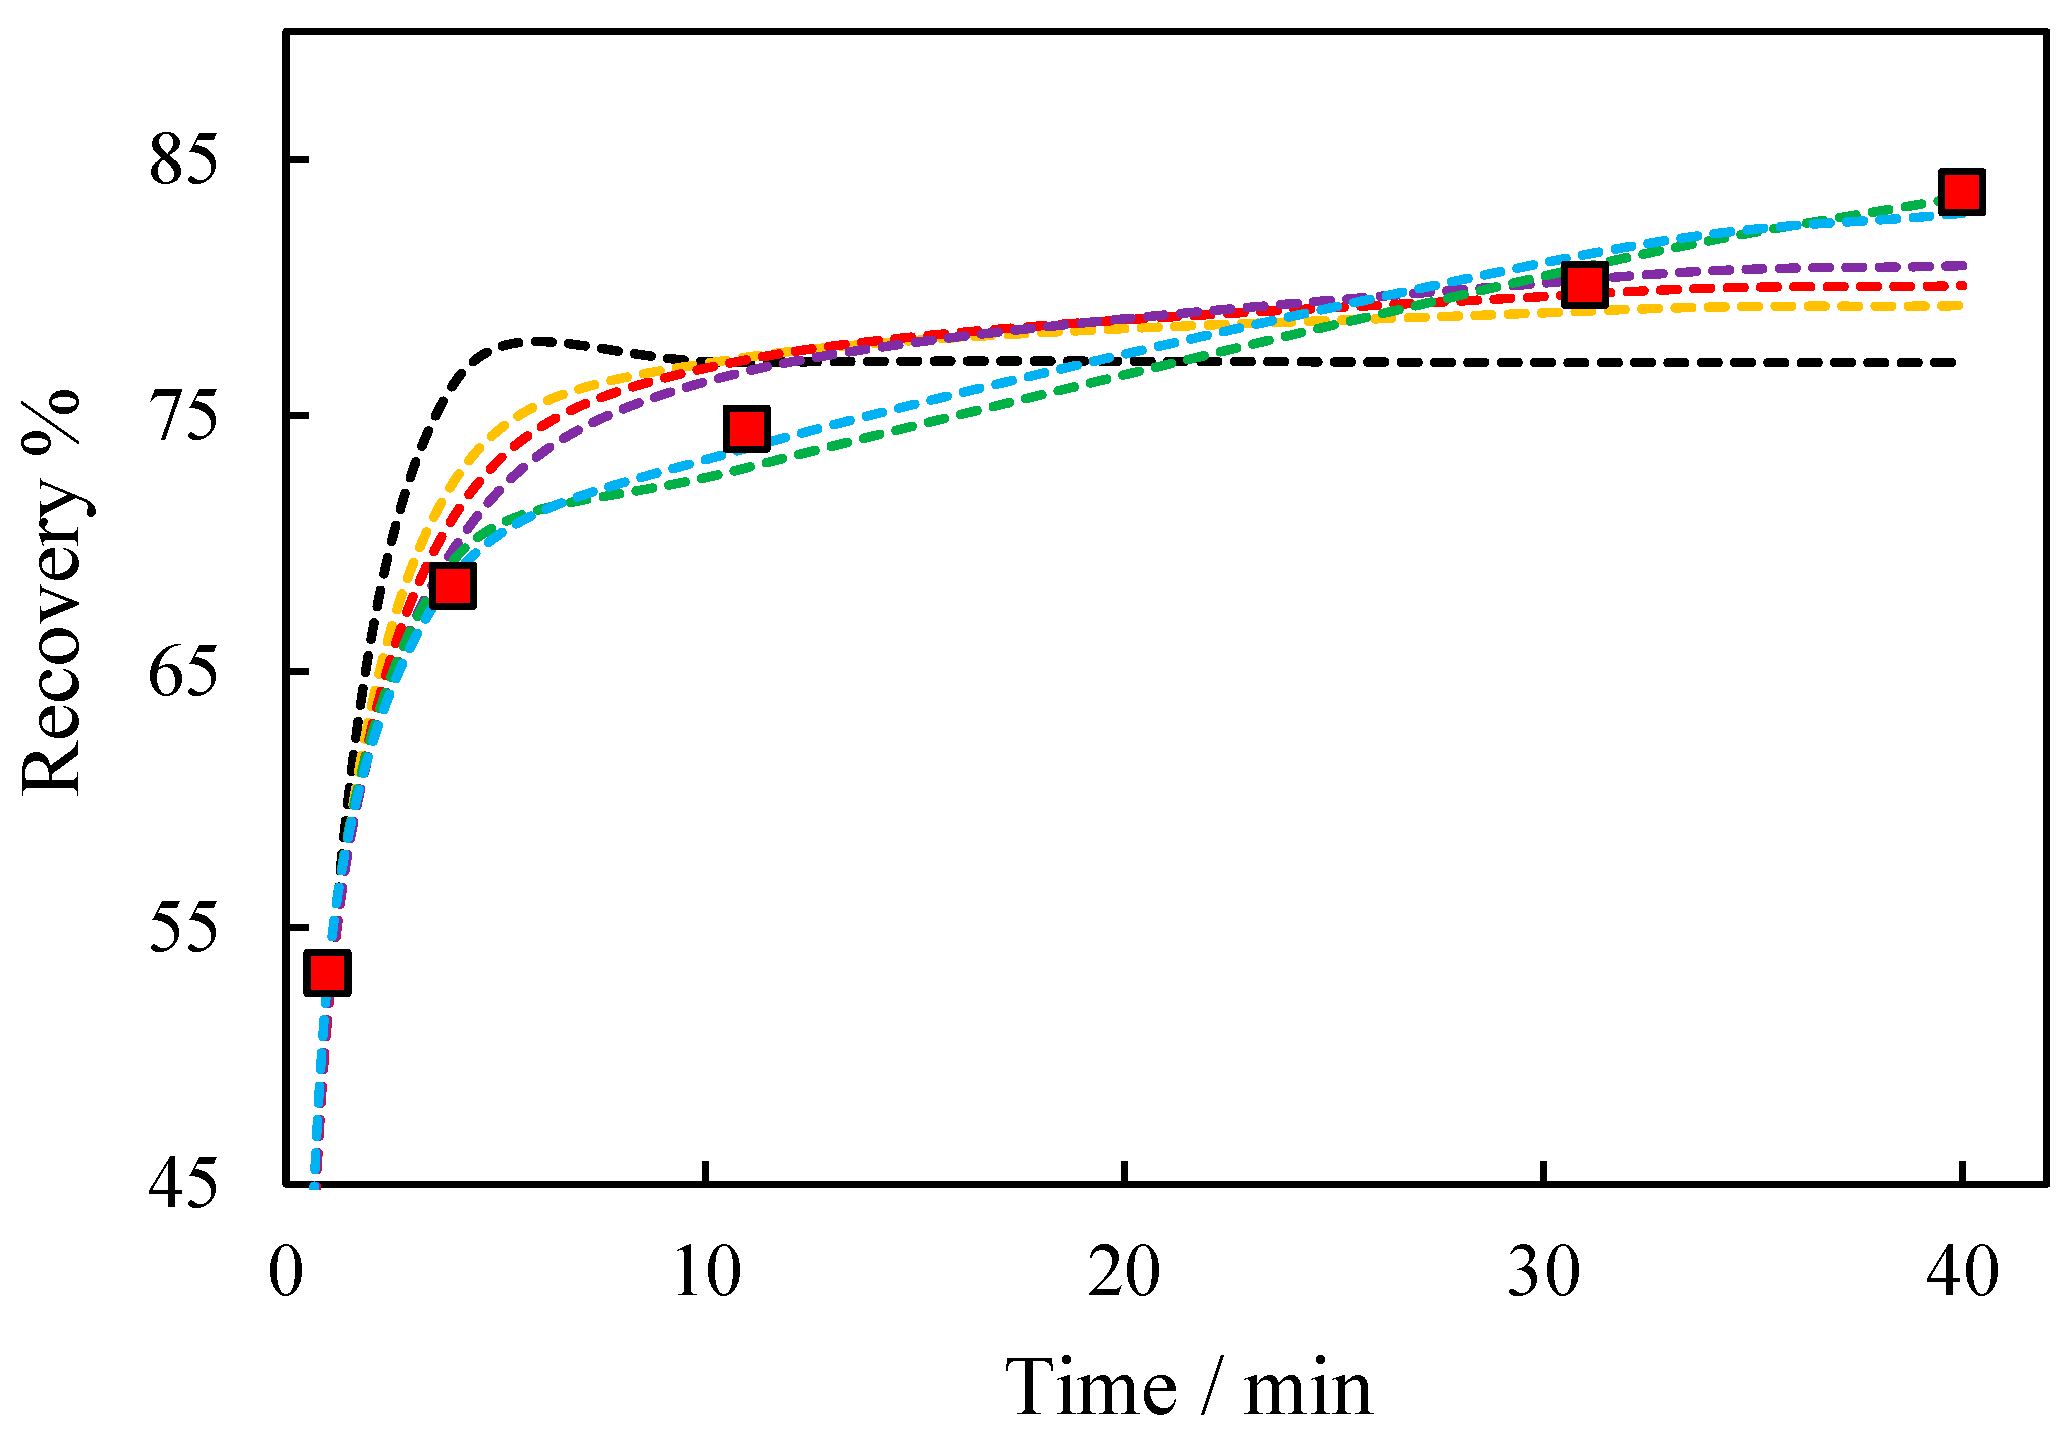
Figure A1.
PGE recovery data fit results 2E+Au with depressant, collector, and frother concentrations of 300, 120, and 50 g/t, respectively.
![Minerals 13 01350 i001]()
Experimental data;
--- classic model;
--- Klimpel model;
--- second order,
--- second-order Klimpel;
--- Kelsall; and
--- modified Kelsall.
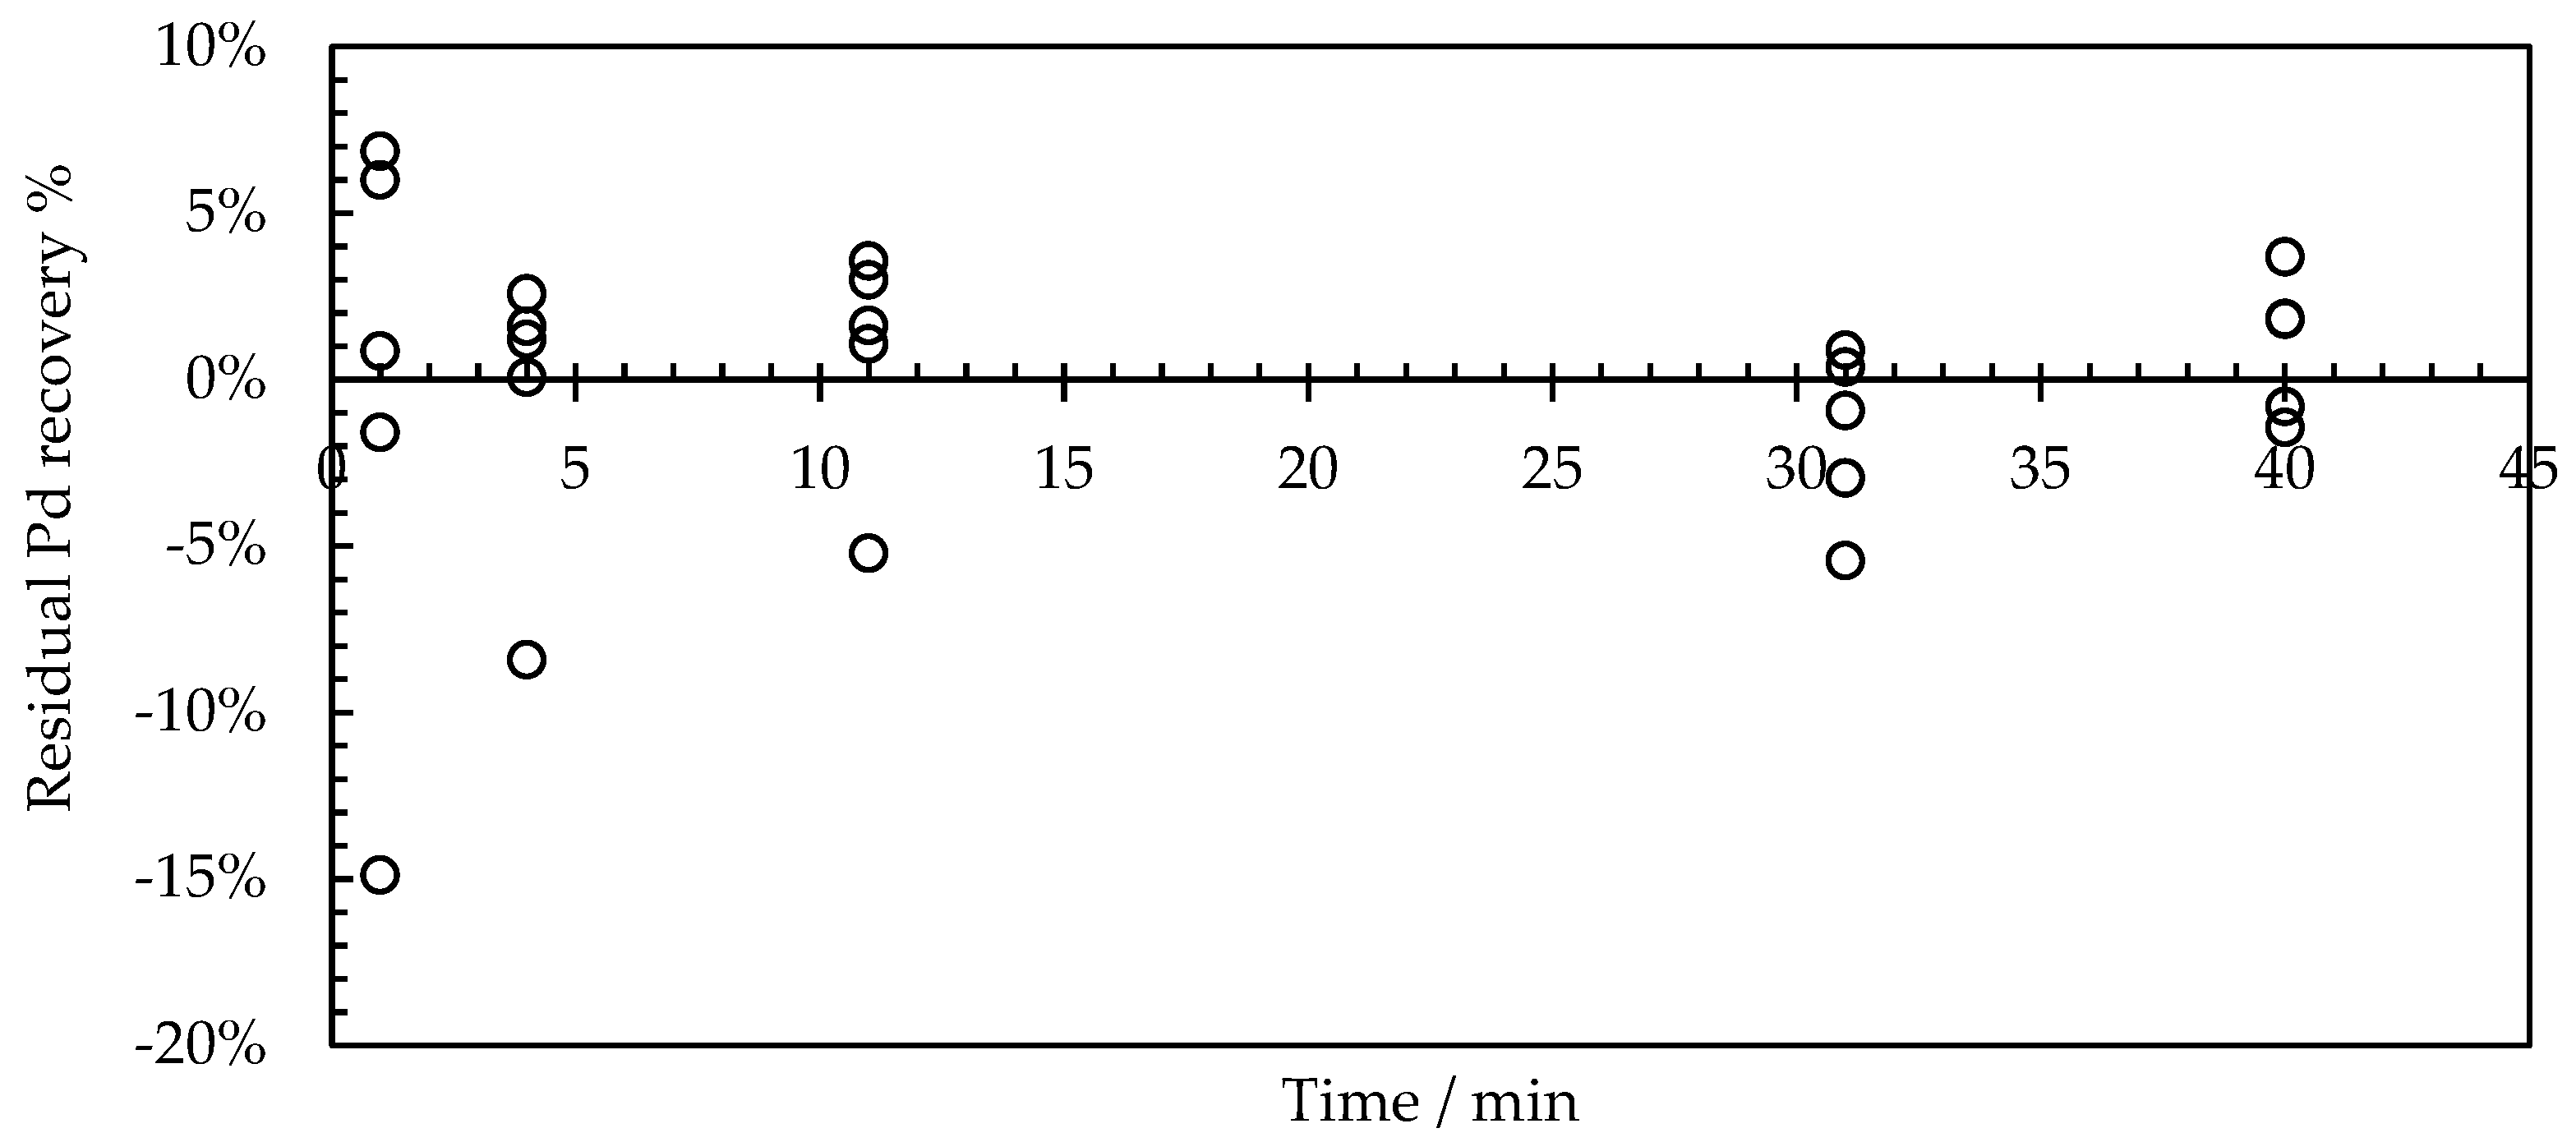
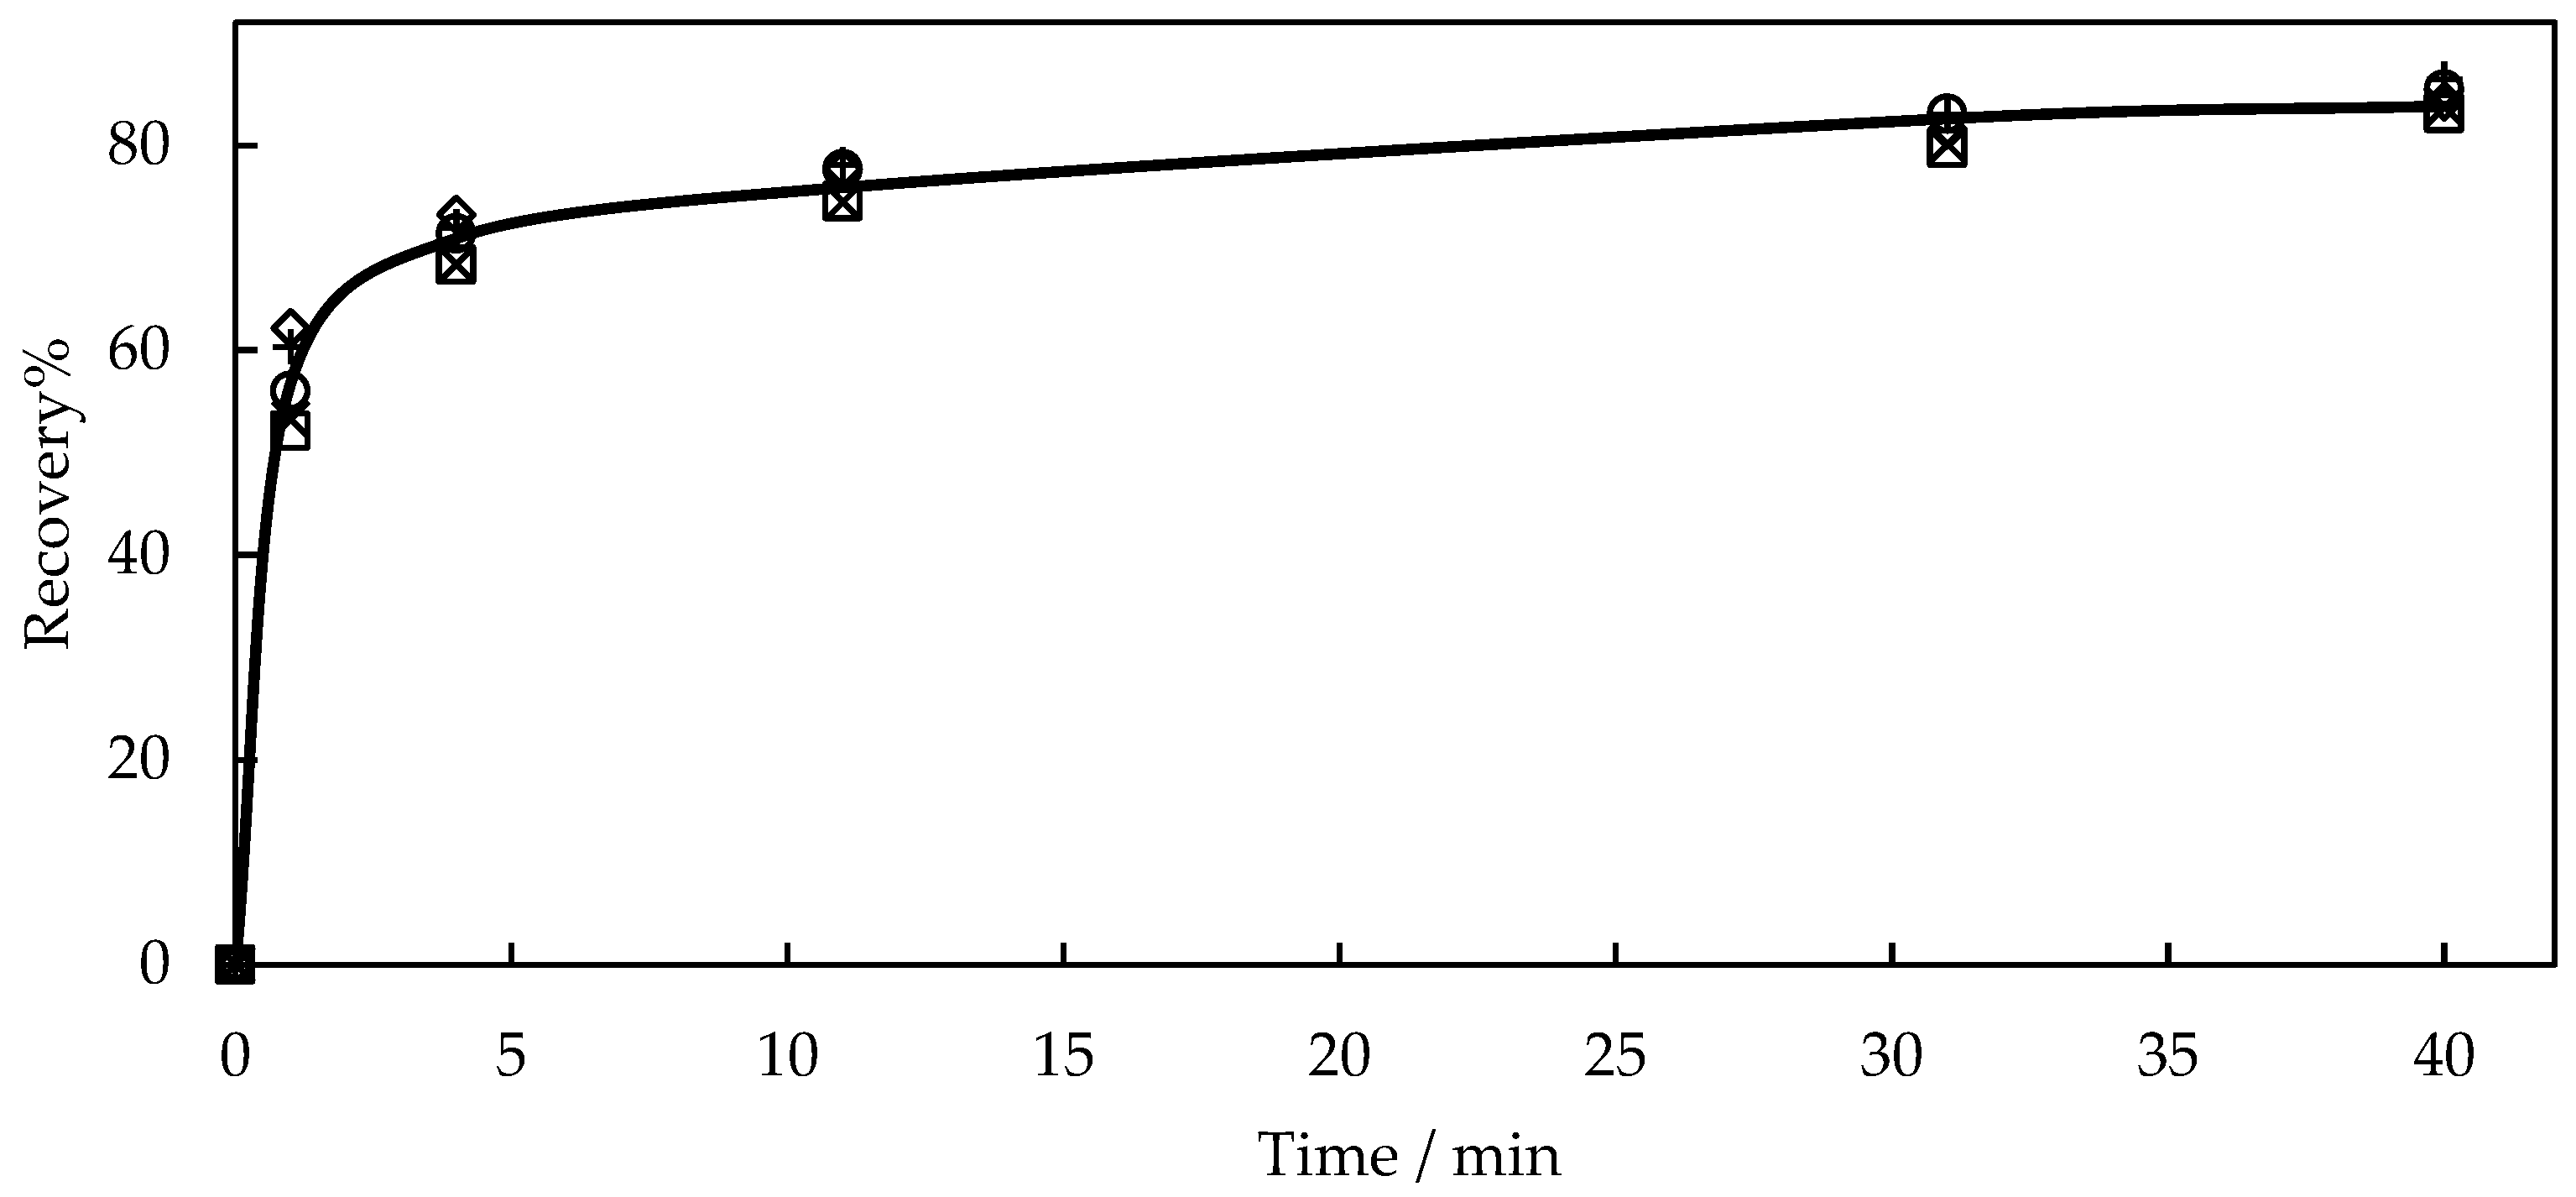
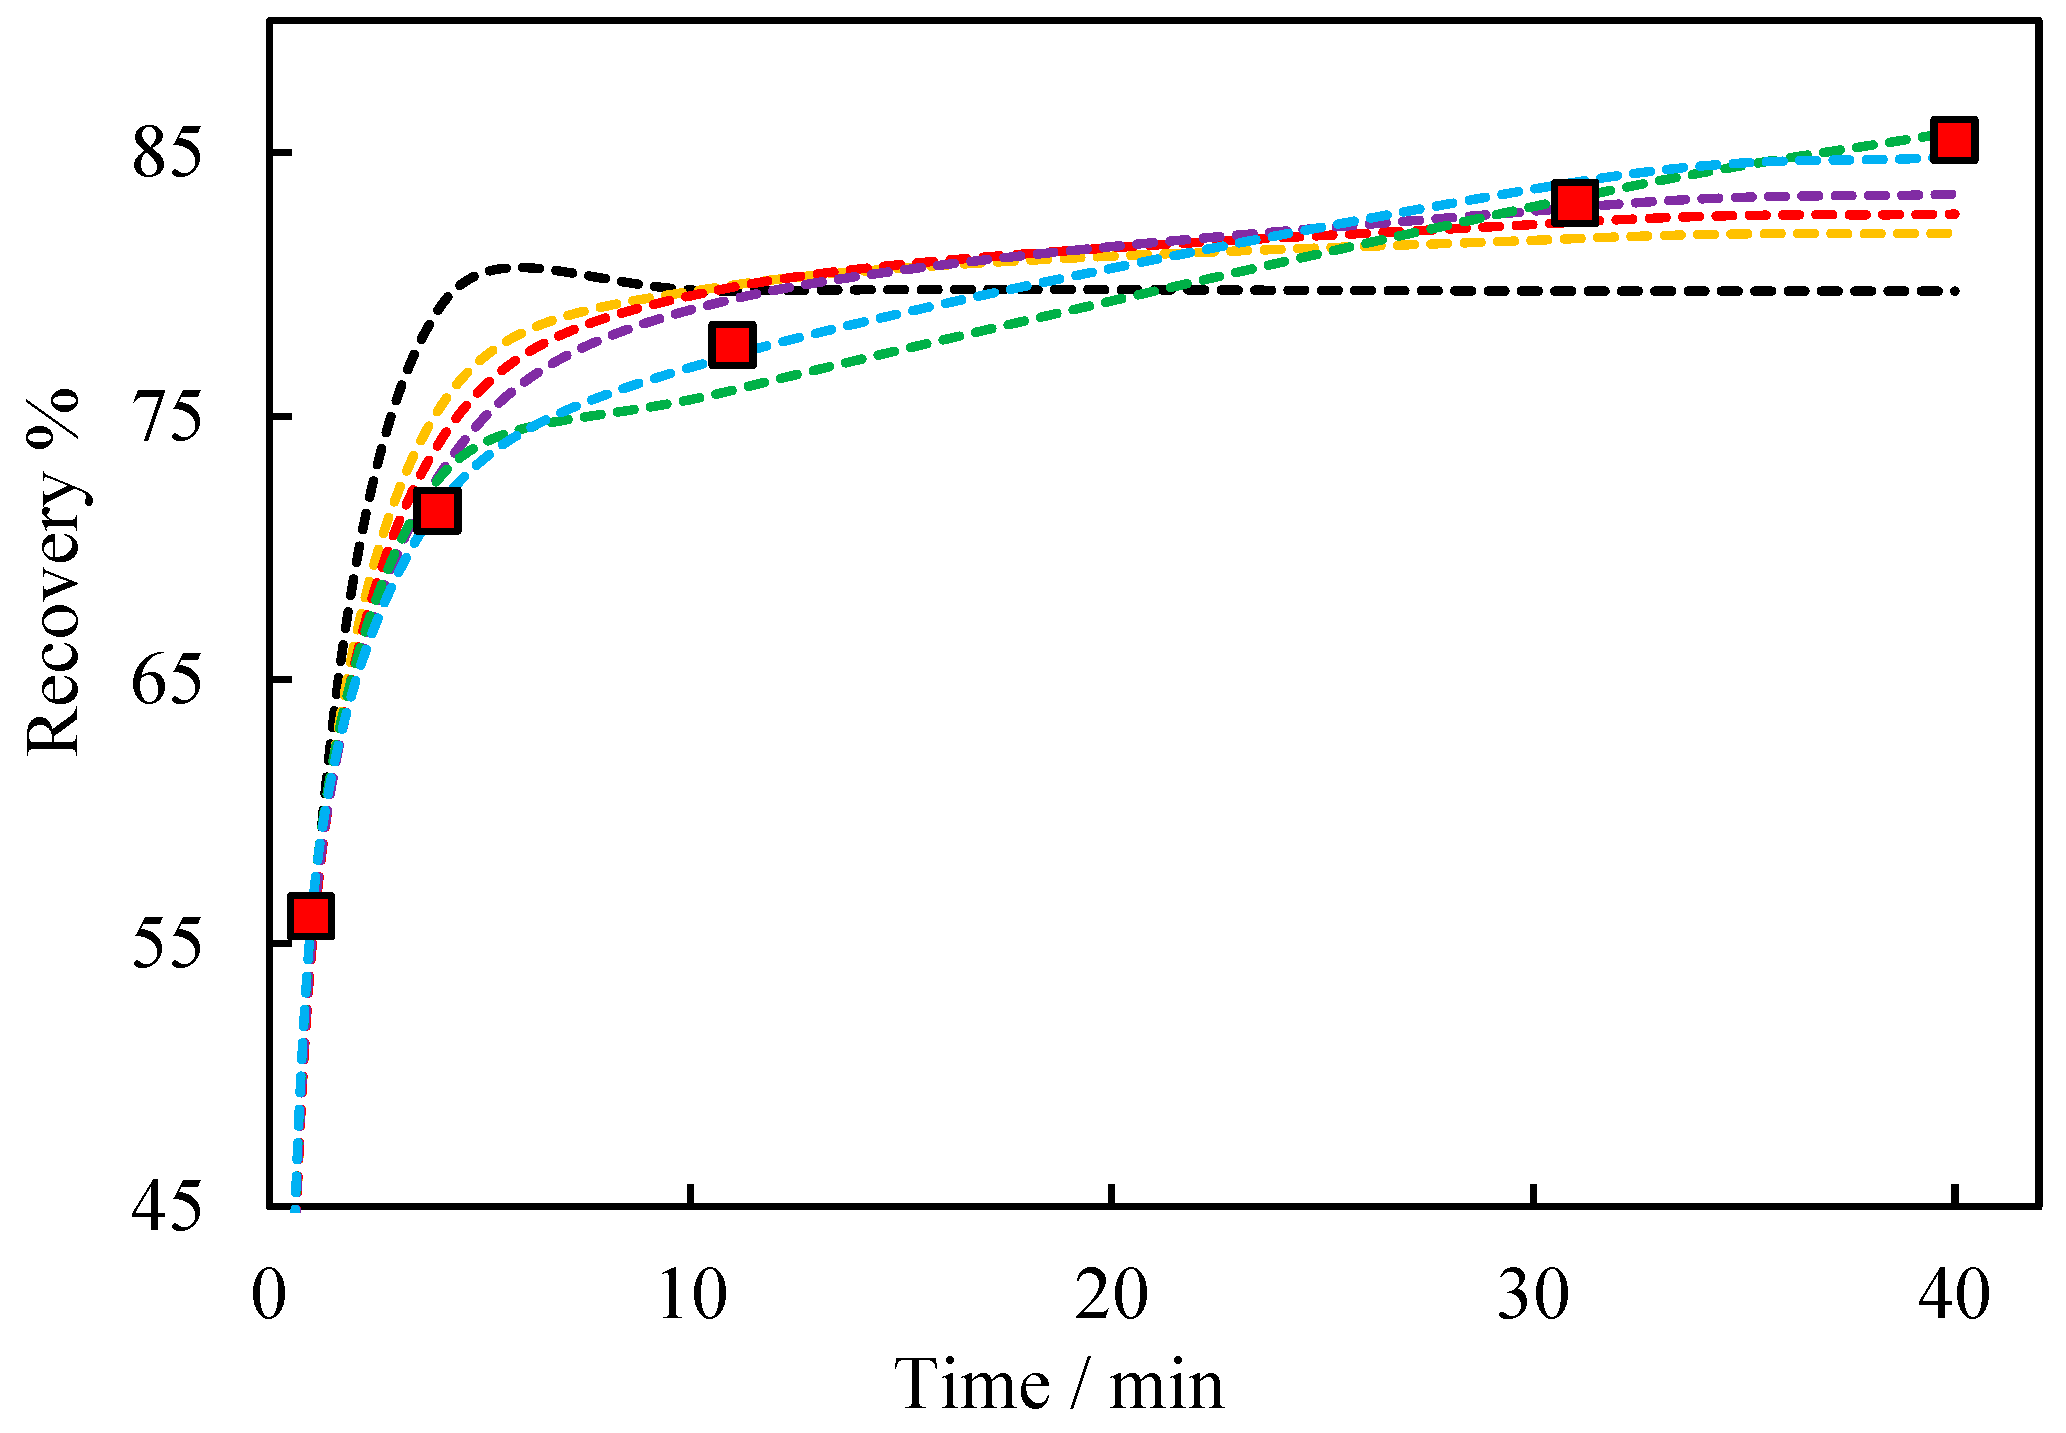
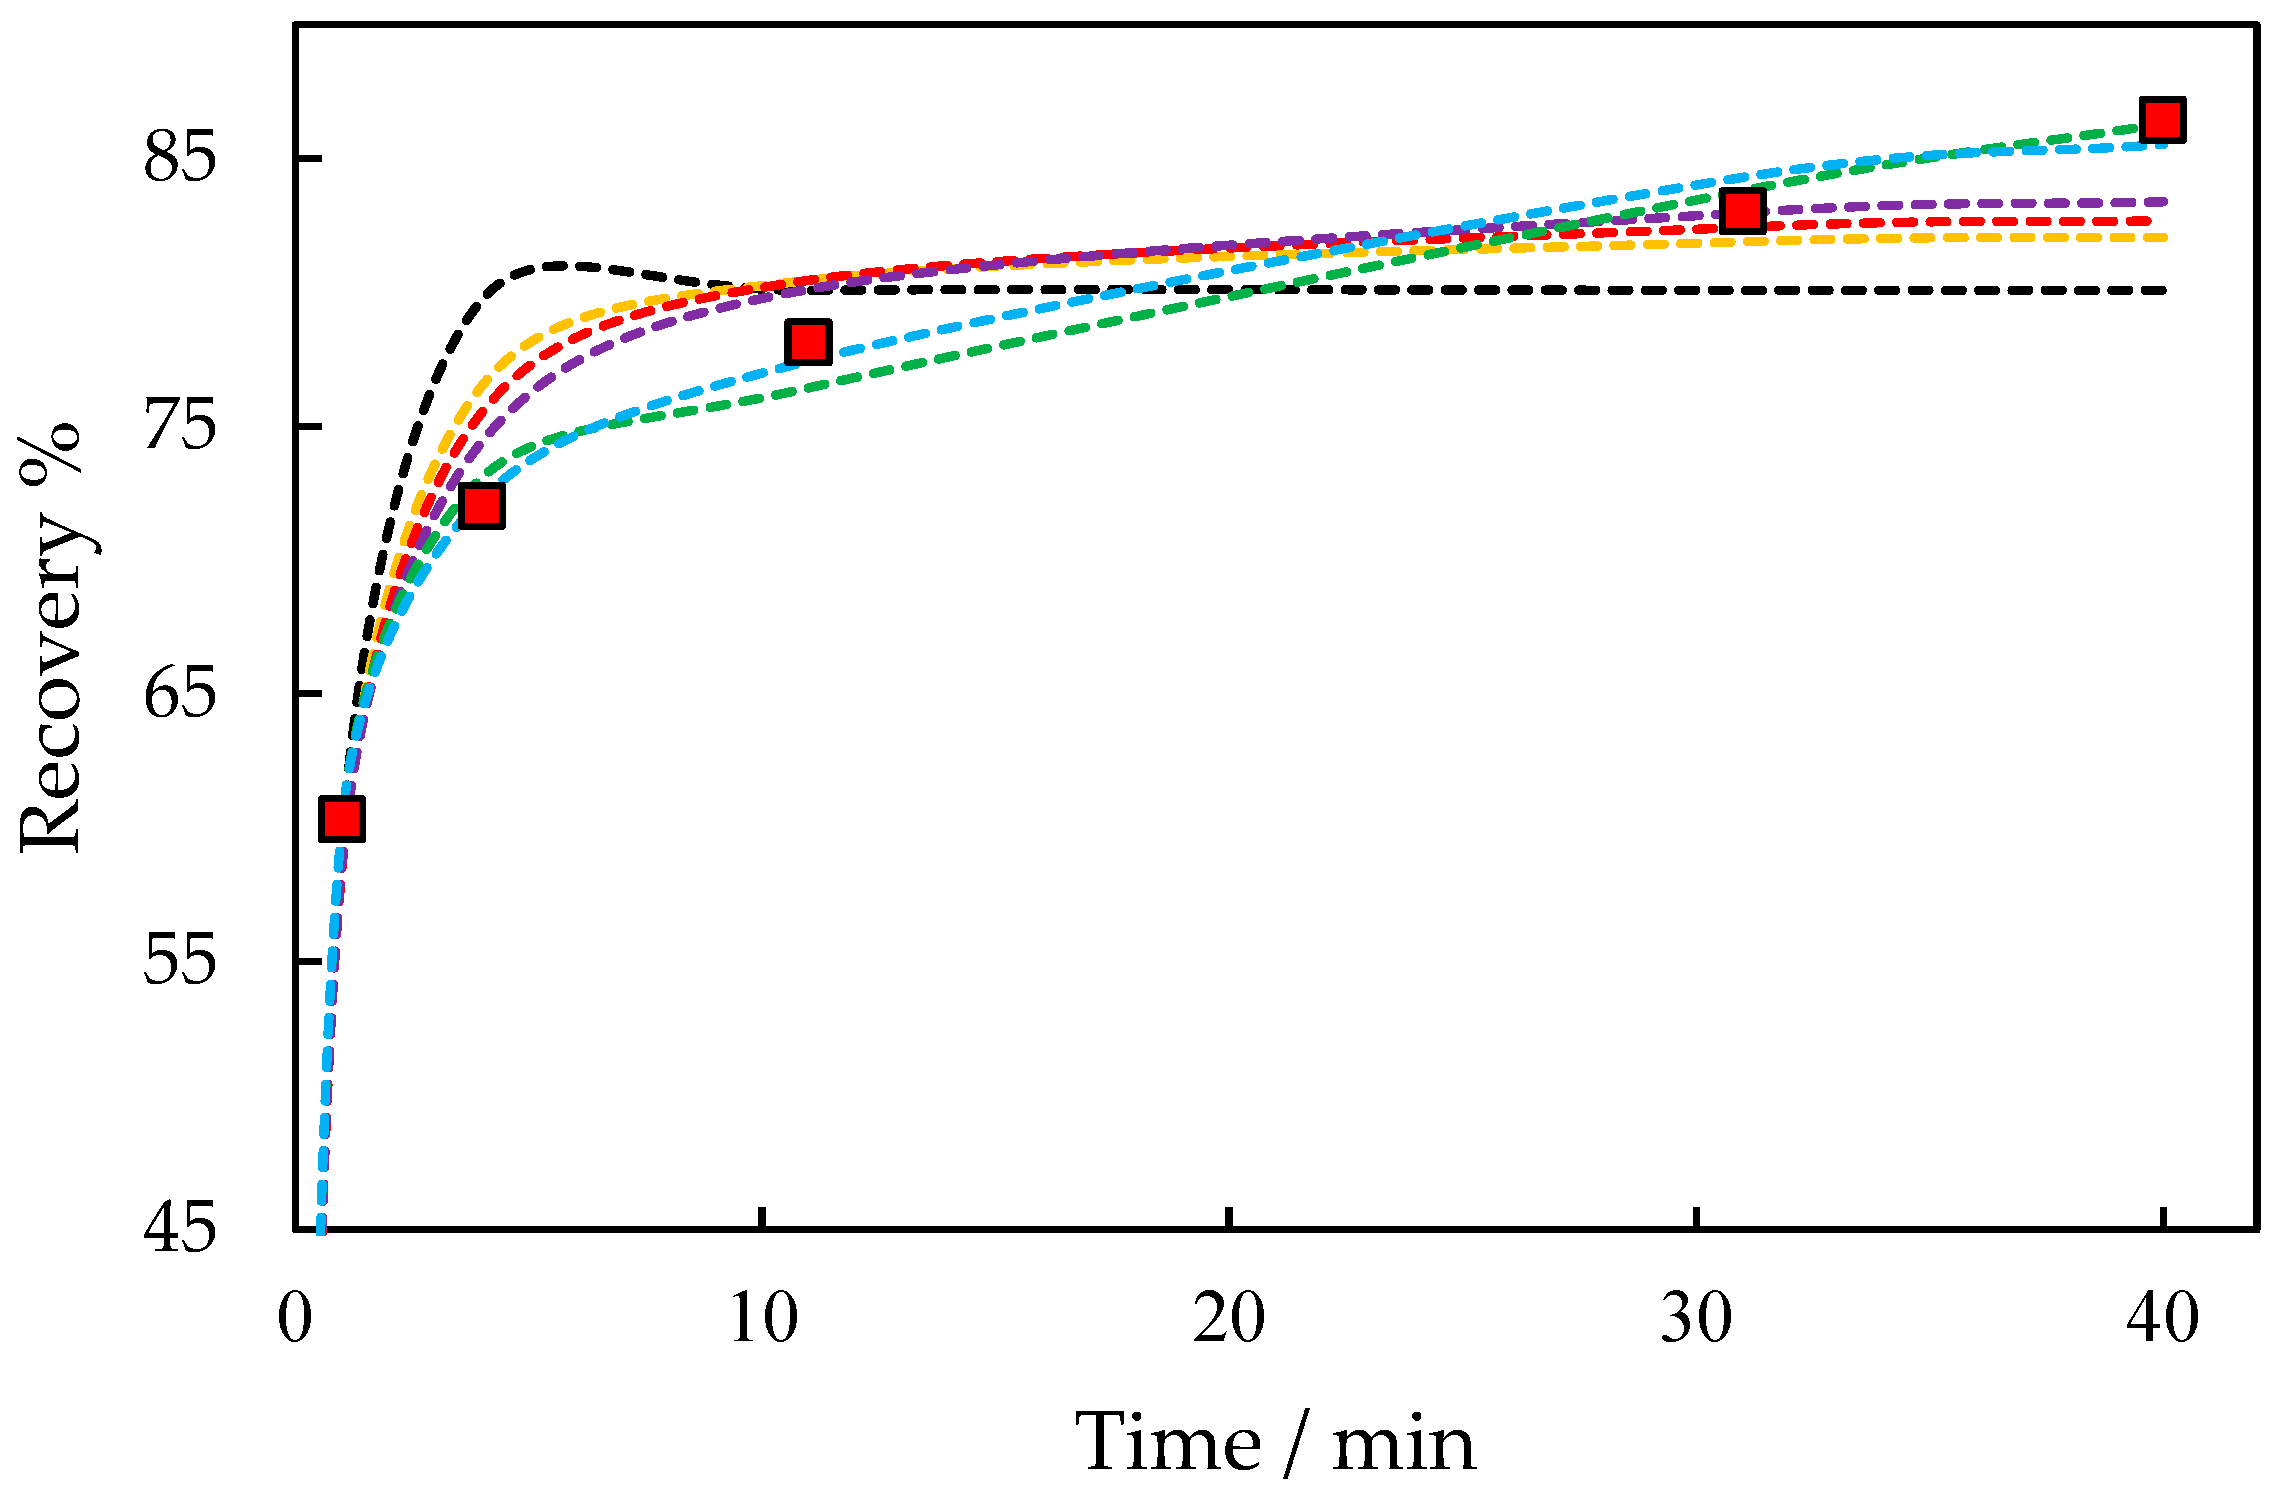
Figure A2.
Recovery data fit results 2E+Au with depressant, collector, and frother concentrations of 300, 50, and 30 g/t, respectively.
![Minerals 13 01350 i001]()
Experimental data;
--- classic model;
--- Klimpel model;
--- second order,
--- second-order Klimpel;
--- Kelsall; and
--- modified Kelsall.
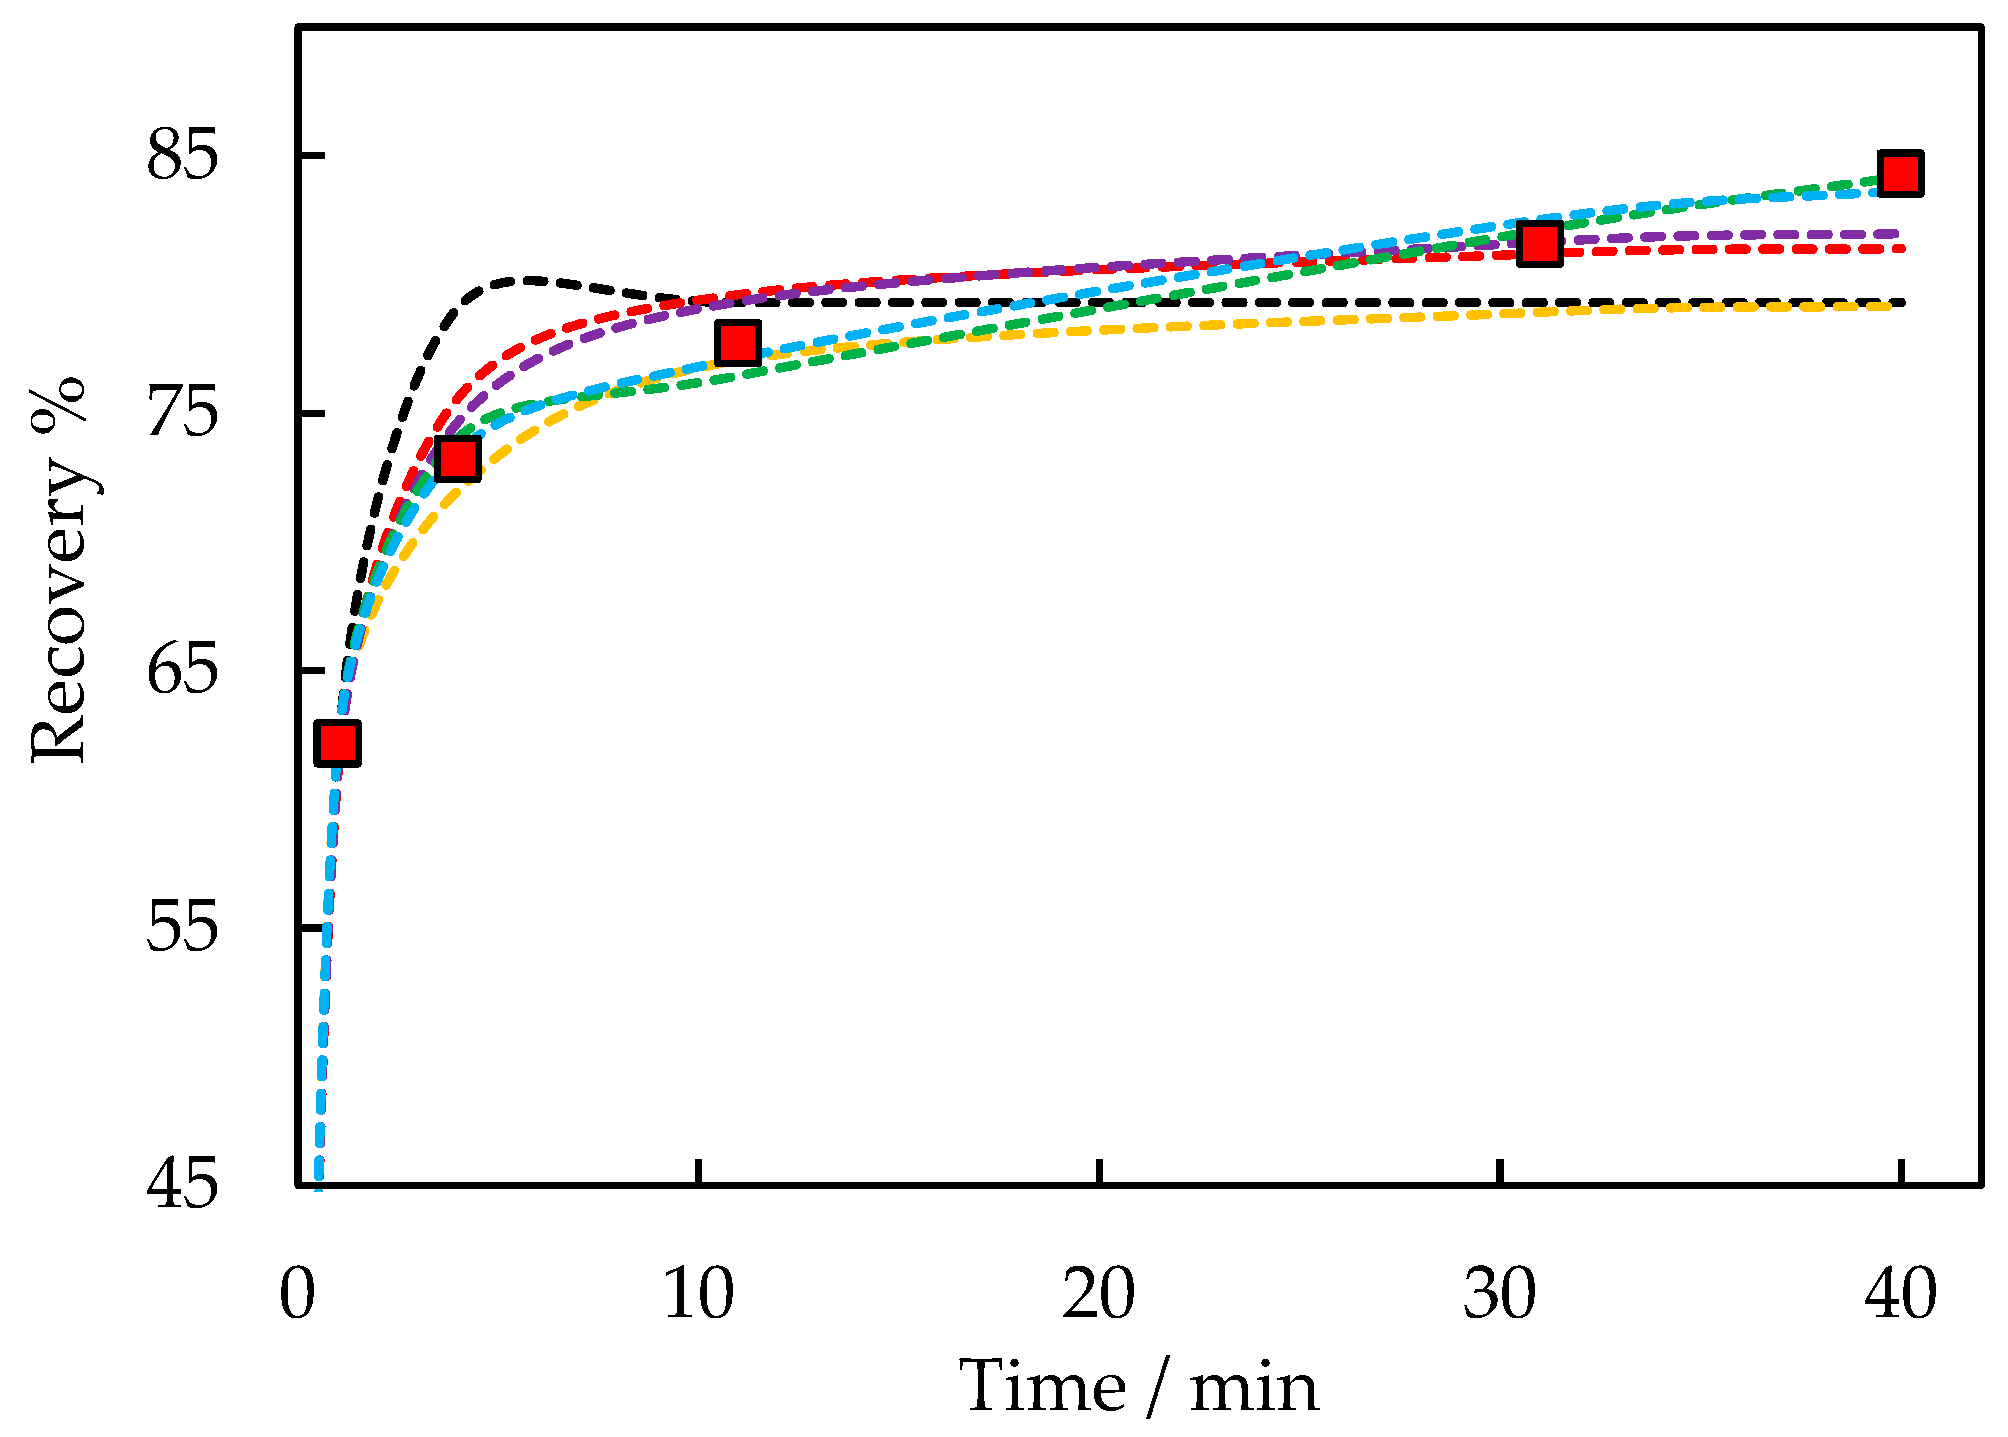
Figure A3.
Recovery data fit results 2E+Au with depressant, collector, and frother concentrations of 300, 120, and 30 g/t, respectively.
![Minerals 13 01350 i001]()
Experimental data;
--- classic model;
--- Klimpel model;
--- second order,
--- second-order Klimpel;
--- Kelsall; and
--- modified Kelsall.
Figure A4.
Recovery data fit results 2E+Au with depressant, collector, and frother concentrations of 500, 120, and 50 g/t, respectively.
![Minerals 13 01350 i001]()
Experimental data;
--- classic model;
--- Klimpel model;
--- second order,
--- second-order Klimpel;
--- Kelsall; and
--- modified Kelsall.
Figure A5.
Recovery data fit results 2E+Au with depressant, collector, and frother concentrations of 300, 30, and 30 g/t, respectively.
![Minerals 13 01350 i001]()
Experimental data;
--- classic model;
--- Klimpel model;
--- second order,
--- second-order Klimpel;
--- Kelsall; and
--- modified Kelsall.
Table A2 presents PGE recovery data fit results of Pt, Pd, and 2E+Au with depressant, collector, and frother concentrations of 300, 120, and 50 g/t, respectively. The analysis of various flotation models for Pt, Pd, and 2E+Au in Platreef ore for this experimental condition reveals that the modified Kelsall model performs exceptionally well in predicting the flotation behaviour of these PGEs. The model exhibits high
Rmax values for Pt, Pd, and 2E+Au, indicating their favourable floatability and potential for efficient recovery. The model’s ability to capture the kinetics of flotation, including fast and slow flotation rate constants, provides valuable insights into the attachment and detachment processes of PGM particles during flotation. With high correlation coefficients (R2) and low root mean square error (RMSE) values, the modified Kelsall model (parameterised for this work) demonstrates its accuracy and reliability in predicting the flotation performance of Pt, Pd, and 2E+Au in Platreef ore. Overall, Pt demonstrates the highest floatability, followed by Pd and 2E+Au.
Table A2.
PGE recovery data fit results (a) Pt, (b) Pd, and (c) 2E+Au with collector, frother, and depressant concentrations of 120, 50, and 300g/t, respectively.
Table A2.
PGE recovery data fit results (a) Pt, (b) Pd, and (c) 2E+Au with collector, frother, and depressant concentrations of 120, 50, and 300g/t, respectively.
| Pt |
| Classic | Rmax = 0.808, k = 1.119 min−1, R2 = 0.92580, RMSE = 0.414 |
| Klimpel | Rmax = 0.839, k = 2.619 min−1, R2 = 0.97588, RMSE = 0.509 |
| Second order | Rmax = 0.850, k = 2.077 min−1, R2 = 0.98560, RMSE = 0.473 |
| Second-order Klimpel | Rmax = 0.870, k = 4.686 min−1, R2 = 0.99281, RMSE = 0.275 |
| Kelsall | Rfast = 0.717, kfast = 1.448 min−1, kslow = 0.019 min−1, R2 = 0.99758, RMSE = 0.020 |
| Modified Kelsall | Rmax = 0.888, Rfast = 0.70, kfast = 1.52 min−1, kslow = 0.05 min−1, R2 = 0.99822, RMSE = 0.006 |
| Pd |
| Classic | Rmax = 0.780, k = 1.058 min−1, R2 = 0.90703, RMSE = 0.560 |
| Klimpel | Rmax = 0.811, k = 2.427 min−1, R2 = 0.96647, RMSE = 0.664 |
| Second order | Rmax = 0.824, k = 1.939 min−1, R2 = 0.97979, RMSE = 0.650 |
| Second-order Klimpel | Rmax = 0.846, k = 4.153 min−1, R2 = 0.98972, RMSE = 0.452 |
| Kelsall | Rfast = 0.678, kfast = 1.434 min−1, kslow = 0.018 min−1, R2 = 0.99614, RMSE = 0.027 |
| Modified Kelsall | Rmax = 0.856, Rfast = 0.646, kfast = 1.561 min−1, kslow = 0.060 min−1, R2 = 0.99758, RMSE = 0.005 |
| 2E+Au |
| Classic | Rmax = 0.769, k = 1.086 min−1, R2 = 0.91573, RMSE = 0.474 |
| Klimpel | Rmax = 0.799, k = 2.514 min−1, R2 = 0.97094, RMSE = 0.574 |
| Second order | Rmax = 0.811, k = 2.063 min−1, R2 = 0.98258, RMSE = 0.552 |
| Second-order Klimpel | Rmax = 0.832, k = 4.389 min−1, R2 = 0.99127, RMSE = 0.360 |
| Kelsall | Rfast = 0.677, kfast = 1.434 min−1, kslow = 0.016 min−1, R2 = 0.99669, RMSE = 0.025 |
| Modified Kelsall | Rmax = 0.844, Rfast = 0.649, kfast = 1.543 min−1, kslow = 0.056 min−1, R2 = 0.99787, RMSE = 0.005 |
Table A3 presents recovery data fit results of Pt, Pd, and 2E+Au with depressant, collector, and frother concentrations of 30, 50, and 300 g/t, respectively. The results reveal distinct variations in the floatability of these PGEs. Among the models employed, the modified Kelsall model exhibited remarkable performance, demonstrating high
Rmax values and yielding excellent
R2 and low RMSE values. This suggests that the modified Kelsall model accurately captured the flotation kinetics and proved effective in predicting the floatability of Pt, Pd, and 2E+Au. Notably, Pt demonstrated favourable floatability, as indicated by its high
Rmax value and the model’s robust fit. Pd exhibited slightly lower
Rmax values but still demonstrated good flotation response according to the model. On the other hand, 2E+Au displayed lower
Rmax values compared to Pt and Pd, indicating relatively lower floatability for this PGE group.
Table A3.
PGE recovery data fit results (a) Pt, (b) Pd, and (c) 2E+Au with collector, frother, and depressant concentrations of 30, 50, and 300 g/t, respectively.
Table A3.
PGE recovery data fit results (a) Pt, (b) Pd, and (c) 2E+Au with collector, frother, and depressant concentrations of 30, 50, and 300 g/t, respectively.
| Pt |
| Classic | Rmax = 0.812, k = 1.162 min−1, R2 = 0.92237, RMSE = 0.382 |
| Klimpel | Rmax = 0.859, k = 2.757 min−1, R2 = 0.97779, RMSE = 0.00 |
| Second order | Rmax = 0.853, k = 2.171 min−1, R2 = 0.98509, RMSE = 0.543 |
| Second-order Klimpel | Rmax = 0.872, k = 4.94 5 min−1, R2 = 0.99336, RMSE = 0.366 |
| Kelsall | Rfast = 0.719, kfast = 1.514 min−1, kslow = 0.0197 min−1, R2 = 0.99719, RMSE = 0.020 |
| Modified Kelsall | Rmax = 0.874, Rfast = 0.683, kfast = 1.668 min−1, kslow = 0.071 min−1, R2 = 0.99935, RMSE = 0.002 |
| Pd |
| Classic | Rmax = 0.787, k = 1.095 min−1, R2 = 0.91489, RMSE = 0.4490 |
| Klimpel | Rmax = 0.819, k = 2.70 min−1, R2 = 0.97530, RMSE = 0.00 |
| Second order | Rmax = 0.830, k = 2.033 min−1, R2 = 0.98381, RMSE = 0.601 |
| Second-order Klimpel | Rmax = 0.851, k = 4.431 min−1, R2 = 0.99285, RMSE = 0.408 |
| Kelsall | Rfast = 0.691, kfast = 1.453 min−1, kslow = 0.018 min−1, R2 = 0.99591, RMSE = 0.028 |
| Modified Kelsall | Rmax = 0.849, Rfast = 0.646, kfast = 1.6411 min−1, kslow = 0.077 min−1, R2 = 0.99886, RMSE = 0.002 |
| 2E+Au |
| Classic | Rmax = 0.798, k = 1.174 min−1, R2 = 0.91997, RMSE = 0.368 |
| Klimpel | Rmax = 0.827, k = 2.767 min−1, R2 = 0.97316, RMSE = 0.552 |
| Second order | Rmax = 0.838, k = 2.238 min−1, R2 = 0.98393, RMSE = 0.561 |
| Second-order Klimpel | Rmax = 0.857, k = 5.016 min−1, R2 = 0.99264, RMSE = 0.394 |
| Kelsall | Rfast = 0.707, kfast = 1.532 min−1, kslow = 0.018 min−1, R2 = 0.99664, RMSE = 0.020 |
| Modified Kelsall | Rmax = 0.859, Rfast = 0.668, kfast = 1.706 min−1, kslow = 0.073 min−1, R2 = 0.99910, RMSE = 0.001 |
Table A4 presents PGE recovery data fit results of Pt, Pd, and 2E+Au with depressant, collector, and frother concentrations of 120, 30, and 300 g/t, respectively. Among the models employed, the modified Kelsall model exhibited excellent performance, with high
Rmax values, strong
R2, and low RMSE values. This indicates the model’s ability to accurately describe the flotation kinetics of Pt, Pd, and 2E+Au under condition 3. Notably, Pt displayed favourable floatability, as evidenced by its high
Rmax value and the robust fit obtained from the model. Pd exhibited slightly lower
Rmax values but still demonstrated good flotation response according to the model. In contrast, 2E+Au exhibited relatively lower
Rmax values compared to Pt and Pd, indicating reduced floatability for this PGE grouping under condition 3.
Table A4.
PGE recovery data fit results (a) Pt, (b) Pd, and (c) 2E+Au with collector, frother, and depressant concentrations of 120, 30, and 300 g/t, respectively.
Table A4.
PGE recovery data fit results (a) Pt, (b) Pd, and (c) 2E+Au with collector, frother, and depressant concentrations of 120, 30, and 300 g/t, respectively.
| Model | Parameters |
|---|
| Pt |
| Classic | Rmax = 0.824, k = 1.712 min−1, R2 = 0.95475, RMSE = 0.047 |
| Klimpel | Rmax = 0.990, k = 3.00 min−1, R2 = 0.98522, RMSE = 0.00 |
| Second order | Rmax = 0.847, k = 4.403 min−1, R2 = 0.98621, RMSE = 0.342 |
| Second-order Klimpel | Rmax = 0.858, k = 4.686 min−1, R2 = 0.99161, RMSE =0.296 |
| Kelsall | Rfast = 0.767, kfast = 2.101 min−1, kslow = 0.014 min−1, R2 = 0.99879, RMSE = 0.002 |
| Modified Kelsall | Rmax = 0.895, Rfast = 0.758, kfast = 2.170 min−1, kslow = 0.037 min−1, R2 = 0.99900, RMSE = 0.001 |
| Pd |
| Classic | Rmax = 0.768, k = 1.304 min−1, R2 = 0.92176, RMSE = 0.227 |
| Klimpel | Rmax = 0.794, k = 3.161 min−1, R2 = 0.97113, RMSE = 0.485 |
| Second order | Rmax = 0.802, k = 2.752 min−1, R2 = 0.98062, RMSE = 0.528 |
| Second-order Klimpel | Rmax = 0.819, k = 6.074 min−1, R2 = 0.98958, RMSE = 0.413 |
| Kelsall | Rfast = 0.689, kfast = 1.677 min−1, kslow = 0.014 min−1, R2 = 0.99624, RMSE = 0.012 |
| Modified Kelsall | Rmax = 0.829, Rfast = 0.659, kfast = 1.841 min−1, kslow = 0.063 min−1, R2 = 0.99785, RMSE = 0.002 |
| 2E+Au |
| Classic | Rmax = 0.793, k = 1.518 min−1, R2 = 0.93867, RMSE = 0.101 |
| Klimpel | Rmax = 0.941, k = 2.759 min−1, R2 = 0.97315, RMSE = 0.006 |
| Second order | Rmax = 0.821, k = 3.548 min−1, R2 = 0.98561, RMSE = 0.431 |
| Second-order Klimpel | Rmax = 0.834, k = 8.474 min−1, R2 = 0.99007, RMSE = 0.361 |
| Kelsall | Rfast = 0.726, kfast = 1.902 min−1, kslow = 0.014 min−1, R2 = 0.99768, RMSE = 0.005 |
| Modified Kelsall | Rmax = 0.855, Rfast = 0.708, kfast = 2.025 min−1, kslow = 0.051 min−1, R2 = 0.99842, RMSE = 0.001 |
Table A5 presents recovery data fit results of Pt, Pd, and 2E+Au with depressant, collector, and frother concentrations of 120, 50, and 500 g/t, respectively. Among the models applied, the modified Kelsall model demonstrated superior performance, exhibiting high
Rmax values, strong
R2, and low RMSE values. This indicates the model’s effectiveness in describing the flotation kinetics of Pt, Pd, and 2E+Au under this test condition. Notably, Pt displayed favourable floatability, as evidenced by its high
Rmax value and the excellent fit obtained from the model. Pd exhibited slightly lower
Rmax values but still exhibited satisfactory flotation response according to the model. In contrast, 2E+Au exhibited relatively lower
Rmax values compared to Pt and Pd, suggesting reduced floatability for this PGE grouping.
Table A5.
PGE recovery data fit results of (a) Pt, (b) Pd, and (c) 2E+Au with collector, frother, and depressant concentrations of 120, 50, and 500 g/t, respectively.
Table A5.
PGE recovery data fit results of (a) Pt, (b) Pd, and (c) 2E+Au with collector, frother, and depressant concentrations of 120, 50, and 500 g/t, respectively.
| Pt |
| Classic | Rmax = 0.813, k = 1.359 min−1, R2 = 0.93434, RMSE = 0.181 |
| Klimpel | Rmax = 0.839, k = 3.369 min−1, R2 = 0.97721, RMSE = 0.421 |
| Second order | Rmax = 0.847, k = 2.834 min−1, R2 = 0.98469, RMSE = 0.450 |
| Second-order Klimpel | Rmax = 0.863, k = 6.731 min−1, R2 = 0.99200, RMSE = 0.333 |
| Kelsall | Rfast = 0.737, kfast = 1.712 min−1, kslow = 0.017 min−1, R2 = 0.99756, RMSE = 0.009 |
| Modified Kelsall | Rmax = 0.877, Rfast = 0.715, kfast = 1.827 min−1, kslow = 0.056 min−1, R2 = 0.99846, RMSE = 0.002 |
| Pd |
| Classic | Rmax = 0.771, k = 1.129 min−1, R2 = 0.88364, RMSE = 1.010 |
| Klimpel | Rmax = 0.801, k = 2.614 min−1, R2 = 0.95269, RMSE = 0.912 |
| Second order | Rmax = 0.812, k = 2.148 min−1, R2 = 0.97116, RMSE = 0.859 |
| Second-order Klimpel | Rmax = 0.832, k = 4.592 min−1, R2 = 0.98391, RMSE = 0.618 |
| Kelsall | Rfast = 0.673, kfast = 1.520 min−1, kslow = 0.017 min−1, R2 = 0.99664, RMSE = 0.035 |
| Modified Kelsall | Rmax = 0.859, Rfast = 0.651, kfast = 1.618 min−1, kslow = 0.049 min−1, R2 = 0.99741, RMSE = 0.011 |
| 2E+Au |
| Classic | Rmax = 0.771, k = 1.129 min−1, R2 = 0.90524, RMSE = 0.436 |
| Klimpel | Rmax = 0.801, k = 2.614 min−1, R2 = 0.96364, RMSE = 0.625 |
| Second order | Rmax = 0.812, k = 2.148 min−1, R2 = 0.97652, RMSE = 0.646 |
| Second-order Klimpel | Rmax = 0.832, k = 4.592 min−1, R2 = 0.98711, RMSE = 0.483 |
| Kelsall | Rfast = 0.673, kfast = 1.520 min−1, kslow = 0.017 min−1, R2 = 0.99702, RMSE = 0.017 |
| Modified Kelsall | Rmax = 0.859, Rfast = 0.651, kfast = 1.618 min−1, kslow = 0.049 min−1, R2 = 0.99790, RMSE = 0.005 |
Table A6 presents recovery data fit results of Pt, Pd, and 2E+Au with depressant, collector, and frother concentrations of 120, 50, and 500 g/t, respectively. Among the models applied, the modified Kelsall model exhibited excellent performance, demonstrating high
Rmax values, strong
R2, and low RMSE values. This indicates the effectiveness of the model in describing the flotation kinetics of Pt, Pd, and 2E+Au. Pt displayed favourable floatability, as evidenced by its high
Rmax value and the excellent fit obtained from the model. Pd exhibited slightly lower
Rmax values but still demonstrated satisfactory flotation response according to the model. 2E+Au exhibited relatively lower
Rmax values compared to Pt and Pd, indicating its reduced floatability.
Table A6.
PGE recovery data fit results of (a) Pt, (b) Pd, and (c) 2E+Au with collector, frother, and depressant concentrations of 30, 30, and 300 g/t, respectively.
Table A6.
PGE recovery data fit results of (a) Pt, (b) Pd, and (c) 2E+Au with collector, frother, and depressant concentrations of 30, 30, and 300 g/t, respectively.
| Pt |
| Classic | Rmax = 0.810, k = 1.563 min−1, R2 = 0.92304, RMSE = 0.104 |
| Klimpel | Rmax = 0.833, k = 4.058 min−1, R2 = 0.96640, RMSE = 0.487 |
| Second order | Rmax = 0.839, k = 3.560 min−1, R2 = 0.97401, RMSE = 0.583 |
| Second-order Klimpel | Rmax = 0.853, k = 8.671 min−1, R2 = 0.98363, RMSE = 0.546 |
| Kelsall | Rfast = 0.733, kfast = 2.051 min−1, kslow = 0.017 min−1, R2 = 0.99641, RMSE = 0.004 |
| Modified Kelsall | Rmax = 0.870, Rfast = 0.704, kfast = 2.293 min−1, kslow = 0.066 min−1, R2 = 0.99796, RMSE = 0.00 |
| Pd |
| Classic | Rmax = 0.793, k = 1.232 min−1, R2 = 0.89751, RMSE = 0.339 |
| Klimpel | Rmax = 0.822, k = 2.895 min−1, R2 = 0.95712, RMSE = 0.662 |
| Second order | Rmax = 0.833, k = 2.358 min−1, R2 = 0.97028, RMSE = 0.741 |
| Second-order Klimpel | Rmax = 0.852, k = 6.527 min−1, R2 = 0.98247, RMSE = 0.623 |
| Kelsall | Rfast = 0.692, kfast = 1.684 min−1, kslow = 0.020 min−1, R2 = 0.99615, RMSE = 0.012 |
| Modified Kelsall | Rmax = 0.876, Rfast = 0.666, kfast = 1.826 min−1, kslow = 0.056 min−1, R2 = 0.99730, RMSE = 0.002 |
| 2E+Au |
| Classic | Rmax = 0.801, k = 1.374 min−1, R2 = 0.90802, RMSE = 0.205 |
| Klimpel | Rmax = 0.827, k = 3.355 min−1, R2 = 0.96085, RMSE = 0.576 |
| Second order | Rmax = 0.836, k = 2.821 min−1, R2 = 0.97148, RMSE = 0.670 |
| Second-order Klimpel | Rmax = 0.852, k = 6.526 min−1, R2 = 0.98271, RMSE = 0.593 |
| Kelsall | Rfast = 0.711, kfast = 1.839 min−1, kslow = 0.019 min−1, R2 = 0.99623, RMSE = 0.007 |
| Modified Kelsall | Rmax = 0.873, Rfast = 0.683, kfast = 2.018 min−1, kslow = 0.060 min−1, R2 = 0.99758, RMSE = 0.001 |


 Experimental data; --- classic model; --- Klimpel model; --- second order, --- second-order Klimpel; --- Kelsall; and --- modified Kelsall.


