Article

Effect of Temperature and Water Salinity on Electrical Surface Conduction of Clay Particles

by
Md Farhad Hasan
1,2,* and
Hossam Abuel-Naga
1
1
Department of Civil Engineering, La Trobe University, Melbourne, VIC 3086, Australia
2
Department of Energy, Environment and Climate Action, Victoria State Government, Melbourne, VIC 3083, Australia
*
Author to whom correspondence should be addressed.
Minerals 2023, 13(8), 1110; https://doi.org/10.3390/min13081110
Submission received: 27 June 2023 / Revised: 17 August 2023 / Accepted: 18 August 2023 / Published: 21 August 2023

Abstract

:
In this study, the combined effect of temperature (T) and pore water salinity on electrical surface conduction parameters was investigated. Two new electrical surface conduction parameters, namely, electrical conductivity of effective solid (σs) and size of diffuse double layer (DDL) water per unit volume of soil (χ), were considered in this study. The tested samples included two commercially available clays and four natural clay soils with diverse physico-chemical properties. The two surface conduction parameters were also used to assess the influence of temperature (T) and pore water salinity, as well as the electrical conductivity of free water (σFW), on the evolution of the free swelling index (FSI) of clays/clay soils through experimental methods. The findings suggested that elevated temperature and σFW increased σs but reduced χ, as well as the FSI of clays/clay soils. Furthermore, the rate of reduction for both χ and FSI augmented under the influence of increased free water salinity, particularly for clays/clay soils with high swelling capacity. The combined reductions of χ and FSI provided substantial evidence that clay DDL thickness decreases as T and σFW increase concurrently.

1. Introduction

Temperature has a significant impact on the physico-chemical properties of soils. Electrical conductivity (EC) is one of the properties of soils which is influenced by temperature [1,2], as well as pore water salinity [3,4,5,6], soil mineralogy [7], moisture content [8,9], porosity [10,11], and soil anisotropy [12,13], to name a few. The advantage of using EC in geotechnical engineering has been widely discussed, and this approach is favoured, particularly in the investigation of subsurface ground [14,15,16,17]. However, the efficacy of EC measurements in geotechnical applications could be improved by understanding changes in influential parameters, such as the electrical surface conductivity and swelling behaviour of clays as functions of temperature and pore water salinity. This would provide a more comprehensive understanding of the relevance of electric response in surveys with possible improvements for future applications. Meanwhile, it is a well-known fact that swelling in soil can pervasively damage light structures such as railroads or highways [3,18]. Elevated temperatures around the globe due to incessant climate change may not adversely affect structures, but they can certainly govern coupling effects to cause negative outcomes in the environment on a broader scale, such as continuous soil swelling and shrinkage (total volume change), evapotranspiration, and vegetation loss. Among these, the swelling behaviour can be determined by understanding the soil mineralogy and chemical composition; however, this is an extremely complicated process in engineering practice [19]. Consequently, EC has been identified as a suitable metric for predicting soil swelling potential [20,21,22]. Nevertheless, this practice is appropriate in a laboratory-based environment, where temperature variations are not considered. At an elevated temperature, the ECs of soil and water and the degree of free swelling of soils will be impacted. Therefore, the collective response of the electrical and swelling properties of soils as a function of temperature will be pivotal in improving the accuracy of EC-based geotechnical equipment, such as electrical resistivity tomography (ERT).
Soil is a complex material that can be considered as a multi-phase unit consisting of a solid and a pore water/fluid phase. The pore water typically contains different salt concentrations (molarity) which can directly influence electrical conduction through the soil–liquid phase. However, soil electrical conduction also varies with the mineralogical properties which control fluid–particle interactions; this can lead to the formation of a surface conduction layer that surrounds the solid particle surface [23,24,25]. This layer is called the diffuse double layer (DDL) and it plays an integral role in the overall electrical conductivity of clay. The electrical properties of this layer are controlled by the pore water salinity and surface charge properties of clay particles. The electrical properties of DDL water are different from those of free water but have similarities with those of bound water [26,27]. The thickness of the DDL surrounding clay particles is governed by the salt concentration and the cation(s) existing within the suspension [28,29]. Due to the strong attraction between the cation(s) and anion(s) in the DDL, ions in the DDL possess less mobility than those in free water. Increasing the salt concentration within a solution can lead to a reduction in the DDL thickness. Cations within the proximity of clay particles are held dominantly by negative charges, and therefore, the mobility of the ions in the DDL decreases. As a consequence, the water content within the clay also controls the thickness of the DDL. A dry clay sample can still have a DDL [26], but its thickness will be quite marginal and difficult to measure experimentally. Therefore, most of the published works on soil EC models have ignored the inclusion of a DDL. The development of the DDL largely depends on the minerology of the clays and the type of water considered in a specific sample. Prior to the full development stage, the DDL will exhibit a gradual increase in swelling, i.e., similar to the expansion of clay. Clay mixed with distilled water will not have a fully developed DDL, as most of the clay particles will remain isolated [30]. It is a known fact that water is attracted to the mineral surface of clay, and since the DDL is not fully developed within distilled water, it is evident that conventional free swelling tests alone will not be an ideal observation method to investigate changes in DDL thickness. Therefore, investigation of changes in the swelling of clay with water with different salt concentrations and at different temperatures remains a requirement to understand the effect on the DDL.
The effect of pore water salinity on surface conduction and the DDL has been acknowledged by several researchers [31,32,33]. As the pore water salinity increases, the surface conduction effect increases due to an increase in ion mobility [12,23]. On the other hand, elevated temperature affects the fluid viscosity and, consequently, increases the EC of soils by causing spatio-temporal variations in the measurements. There have been some studies in the past where temperature was considered as a major variable in understanding the sensitivity to the physical properties of clays, but only a few researchers mentioned EC, due to the complexities involved in understanding this metric. Recently, Ko et al. [1] reviewed the existing methodologies on soil EC models and presented a modified equation which incorporates temperature variations. While the findings were improvements in the EC–temperature area, the possible outcome of those works when applied to soils with higher plasticity remained inconclusive, despite considering bentonite in the experiment. A high swelling clay like bentonite can have a liquid limit of up to 500%, with a comparatively greater DDL thickness [12,32]; therefore, analysing the effect of temperature on the EC of soils by only considering low plastic clay should not be a standard practice. In addition, changes in the DDL of clay particles need to be included as well.
The combined effects of pore water salinity and temperature on the DDL have been inconclusive without substantial evidence. Mitchell and Soga [31] demonstrated that with an increase in temperature, the DDL thickness increases, since the dielectric constant decreases, whereas for a constant surface charge, the surface potential increases as the dielectric constant decreases. Therefore, considering both characteristics, changes in DDL thickness have a negligible impact as a function of temperature. The small variations in dielectric constant × temperature (DT) values serve as the foundation of the statement of Mitchell and Soga [31]. Sposito [33] showed that the D of water in soil could be between 2 and 50, which makes the assumptions of Mitchell and Soga [31] doubtful. Furthermore, it was observed that the D of a substance (for example, water) decreases as the temperature increases. However, the dependency of D on temperature for soil is more complicated due to the existence of surrounding or bound water. As the temperature increases, the molecular vibrations of the water and cations attracted to the soil particles affect the dipole. In reality, the effect of temperature on D is highly dependent on the type of soil. According to Seyfried and Murdock [34], D can either increase or decrease as the temperature increases, but the impact is not negligible and requires further explanation. In addition, the concept explained by Mitchell and Soga [31] was derived considering the Gouy-Chapman model for the DDL [35,36]. The Gouy-Chapman theory for DDL has numerous limitations, as the theory does not consider the interaction between clay particles, the electrical properties of water, the hydration properties of clay, and interactive attractive forces [37,38]. As clay particles come into contact with free water, there is a degree of flocculation observed, and these enhanced flocs will affect the microstructural configuration of clay particles. In addition, during the hydration process, interparticle repulsive forces will exist; this will depend on the water content, pore water salinity, and minerology of the clay particles. Those effects are all connected to clay–water interaction and, finally, DDL. Therefore, the concept regarding DDL thickness, as presented in the Gouy-Chapman theory, should be revised to take into account the aforementioned shortcomings.
Based on the above discussion, it could be inferred that further investigations are required to collectively understand the effect of temperature on soil electrical surface conduction parameters and free swelling. This will lead to observations of changes in the DDL of soils. In fact, determining these properties will provide a major advantage in terms of our understanding of the electro-chemical behaviour of soils in geotechnical engineering applications, allowing us developing an accurate soil electrical conductivity model. Here, the DDL could be integrated as a major element [12,23]. The present study aimed to measure the surface electrical conductivity of clay particles under different temperatures and water salinity levels using the methodology introduced by Hasan et al. [12] and to provide a better explanation of the changes in DDL thickness of clays with experimental evidence. In order to achieve this, parametric sensitivity analyses of electrical surface conduction parameters and free swelling as functions of temperature and pore water salinity were conducted. Two electrical surface conduction parameters (σs and χ) were re-utilised from a series of works published by the authors [12,23]. Later, numerous free swelling tests were conducted under different pore water salinity levels and elevated temperatures, considering both natural clay soils and laboratory-based clays.

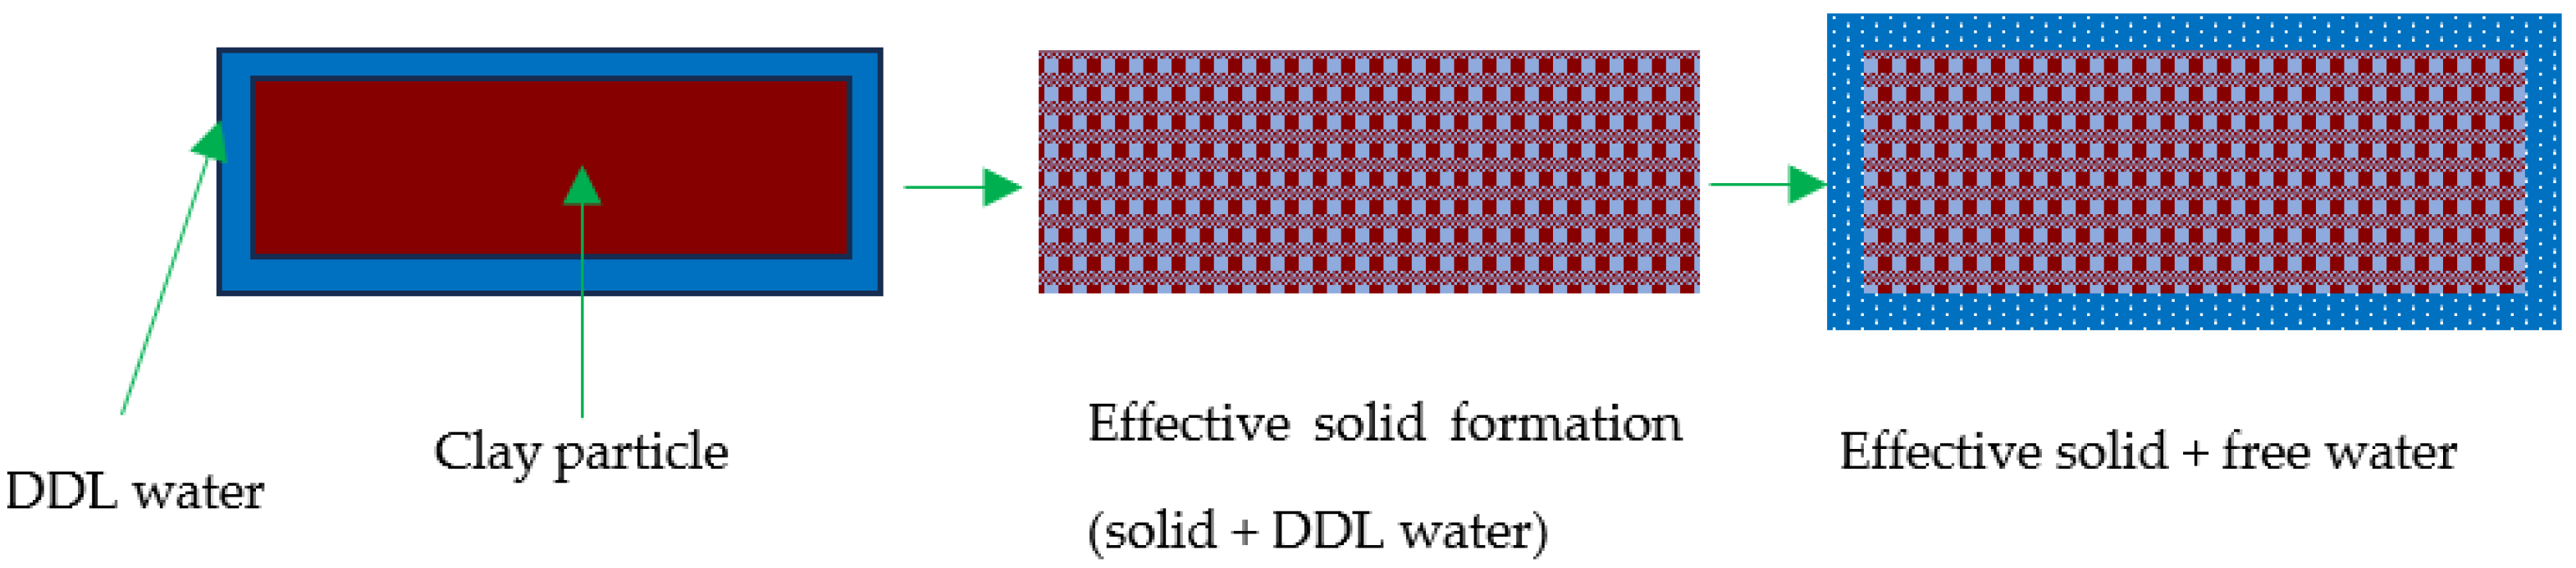
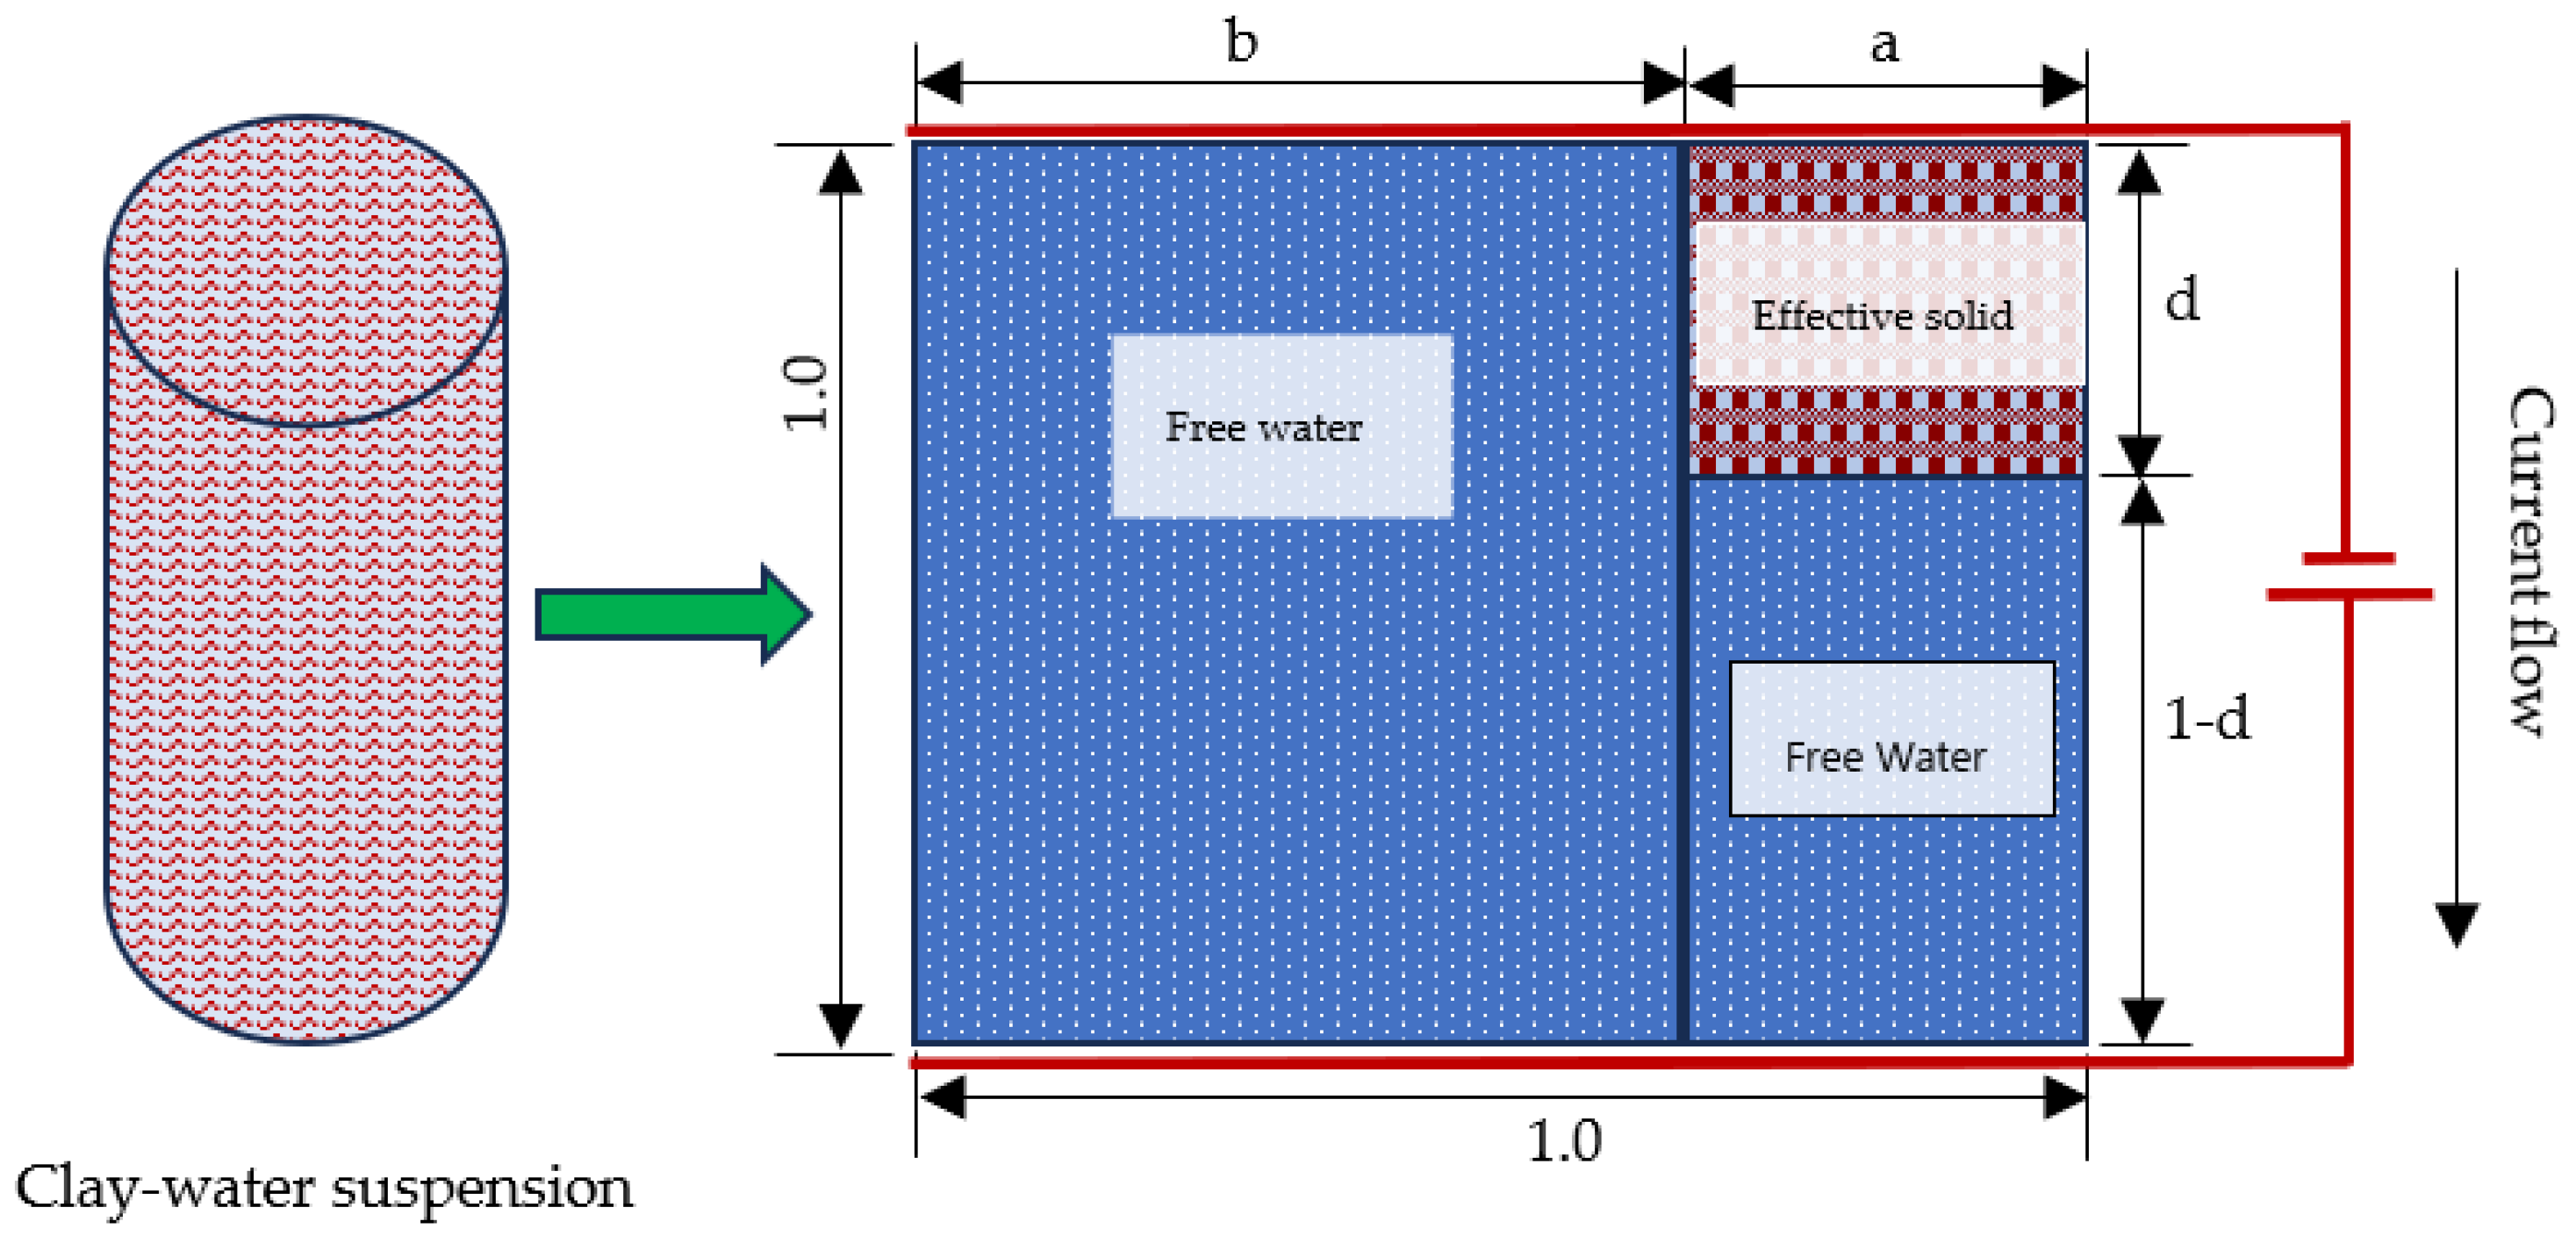
2. Surface Conduction Parameters

Most of the existing clay conductivity models consider each solid clay particle as an insulating material and assume that electrical conduction goes through the conductive fluid path only. In order to include the role of the DDL in the electrical conductivity of clays, the present approach considers the clay particle and its surrounding diffuse double layer as a single unit, called an effective clay particle [12,23], as shown in Figure 1. Following the concept of an effective solid phase, the total volume of saturated clay, V, can be expressed as follows [12]:
V = V w f + V s e
where V w f and V s e are the volumes of the free water and effective solid, respectively. These volumes are different from the total volume of water, Vw, and volume of solid, Vs, and can be determined as follows [12]:
V w f = V w V w D D L = n 1 n ( χ 1 ) V
V s e = V s + V w D D L = 1 n χ V
where
χ = V s e V s
n = V v V
n e = V w f V
χ = 1 n e 1 n
Here, V w D D L   and Vv are the volumes of DDL water and void, respectively, n is the porosity, and ne is the effective porosity. The volumes of both the free water ( V w f ) and effective solid ( V s e ) can be determined from Equations (2) and (3), respectively. Parameter χ represents the ratio of V s e and Vs, and based on the definition of the effective solid, V s e ≥ Vs. Therefore, χ (≥1.0) can indirectly express the overall size of DDL water per unit volume of clay.
Figure 1. Visual representation of effective clay particle/effective solid formation with DDL water (based on [23]).
Minerals 13 01110 g001
As the temperature increases, the solid undergoes physical changes as its volume changes due to thermal expansion. The thermal expansion can be observed in terms of changes in shape, area, volume, and density, as a function of temperature. In this study, thermal expansion is considered to change the volume of the soil and is hence referred to as soil thermal expansion of volume. At the elevated temperature, the soil particles start to oscillate and become mobile. Therefore, the interparticle distance increases, leading to an expansion of the solid material. The thermal expansion coefficient of soil explains how the size of soil volume changes with temperature, particularly the fractional change in the total volume of the soil as temperature increases.
In this case, the thermal expansion coefficient of soil solids is considered to determine the volume of the solid. This can be expressed as follows:
V s = Vs T T α + 1
where V s   is the final volume of the solid at elevated temperature T, and T is room temperature (typically 25 °C). Parameter α is the thermal expansion coefficient of solid soils and has a typical value of 10−5 °C−1 [39,40,41]; this was applied when determining V s .
An experimental test was conducted in this study to determine the volume and the electrical properties of effective clay particles (solid + DDL water). The method involved measuring the electrical conductivity of a diluted clay–water system, σmix. This system can be mathematically expressed using the series-parallel approach (Figure 2) as follows (Ohm’s law) [12]:
σ m i x = a d σ s + 1 d σ F w + b σ w
where σFw is the electrical conductivity of free water, and σs is the electrical conductivity of the effective solid. Considering that the electrical conductivity of a diluted clay–water system is isotropic (a = d), the parameters in Equation (9) can be determined as follows [12]:
a d = 1 n e
a = 1 n χ
b = 1 1 n χ
Therefore, Equation (10) can be written as follows:
σ m i x = 1 n χ 1 n χ σ s + 1 1 n χ σ F w + 1 1 n χ σ F w
To find unknown electrical surface conduction parameters χ and σs, the electrical conductivity of two different diluted clay–water systems, in terms of their n value (n1, n2), should be measured experimentally. The results of the tests can be used to find χ and σs by back-calculation, as follows [12]:
χ = ( N 2 N 1 ) σ m i x 1 w σ m i x 2 w σ F w ( N 2 ) 2 σ m i x 1 N 1 2 σ m i x 2 + σ F w { N 1 2 N 2 2 }
σ s = N 1 N 2 N 1 N 2 σ F w σ m i x 1 w σ m i x 2 w N 2 σ m i x 1 w + N 1 σ m i x 2 w N 1 2 N 2 2 σ m i x 1,2 w σ m i x 1 w σ m i x 2 w N 1 N 2 [ σ m i x 1 w σ m i x 2 w { N 2 2 σ m i x 1 w N 1 2 σ m i x 2 w } ] + σ F w { N 2 4 σ m i x 1 w 2 + N 1 4 σ m i x 2 w 2 }
Details of the notations and expressions in Equations (14) and (15) can be found in the appendices of a previously published work by the present authors [12].

3. Problem Statement and Assumptions

The objective of the present study was to validate the effect of T and σFW on DDL thickness by observing the changes in σs, χ, and FSI. As per proven conventional theory, increasing T will increase σFW, and consequently, increasing σFW will increase the σs of the soils [12,23]. However, the major focus of this study was on applying the combined changes in χ and FSI to provide evidence of changes in the thickness of the DDL. As shown in Figure 3a, it can be observed that in an uninterrupted clay/clay soil–water homogeneous suspension, clay particles surrounded by a DDL will settle at the base due to sedimentation. As time progresses, the suspension will lose most of its homogeneity in the top half of the beaker, and most of the clay particles will settle at the bottom, as shown in Figure 3b. Considering that each clay particle is surrounded with a DDL, in accordance with Figure 1 and Figure 2, the settled agglomerates will exhibit different degrees of swelling based on the physico-chemical properties of clay materials. For example, bentonite demonstrates a more pronounced swelling behaviour compared to the other clays. However, if the free swelling as well as χ are reduced, the observed height of the settled clay particles (h in Figure 3b) will be reduced (h’ in Figure 3c), which will effectively indicate a reduction in the DDL thickness (h > h′). Experimental validation was needed to prove this assumption.
As per the above explanation, it was necessary to provide substantial evidence of the DDL thickness as a function of T and σFW. As a result, the collective effects of T and σFW on both χ and FSI were experimentally investigated in this study. According to Equation (7), term χ can indirectly express the overall size of DDL water per unit volume of clay. However, the reduction in χ as a function T and σFW may not be an ideal indicator alone in terms of drawing conclusions about the effect on the DDL. Therefore, the FSI test was included in our study. It is evident that the FSI test should only be conducted in de-ionised water. However, in order to prove the aforementioned assumptions, saline solutions were required to add variations in the observations. Therefore, the FSI test was also conducted using two different saline solutions, namely, saline-1 (0.5 g/L NaCl) and saline-2 (1 g/L NaCl); this test was referred to as the “modified FSI test” in this study.

4. Materials and Methods

The experimental programmes were divided into two major phases. The first phase included the experiment to determine χ and σs, as described in Hasan et al. [12]. The second and last phase consisted of the free swelling test at elevated temperatures to observe the changes in χ and σs.

4.1. Sensors and Equipment

At the beginning, soils were passed through sieve no. 200 (75 μm). Each soil sample was then oven-dried for 24 h before the preparation for the experiments. The oven-dried soils were poured into a 500 mL aluminium container. A MATEST suspension mixture, which has a rotary blade attached to a metal rod, was used to prepare the homogenous suspensions. The mixing process continued for at least 30 min. Each suspension was subjected to EC measurement using an EC meter, manufactured by Horiba Scientific, Piscataway, NJ, USA (LAQUA-PC1100).
One of the major objectives of this study was to include variable temperatures up to 40 °C, with a view to observing the effect of temperature on the EC parameters as well as the pore water salinity. The desired temperature was attained using a temperature controlling water bath, manufactured by Thermo Scientific. Prior to the EC reading of each suspension, the temperature was carefully checked. The EC meter also came with additional sensors which can provide the temperature and pH of any solution or suspension. The temperature sensor of the EC meter was also calibrated with the temperature controlling water bath in order to maintain the consistency and accuracy of the readings.
The modified FSI test did not require the preparation of suspensions. Beakers of 100 mL volume were used for the FSI tests. Each sample was kept inside an oven for 24 h at a fixed temperature ranging from 25 °C to 40 °C (as required) to observe the changes in the swelling as a function of temperature. Each beaker was also covered with a lid which was resilient to constant overnight heating. This process ensured that the evaporation of water did not affect the experiments. Similar tests were conducted for all the considered soils at different salt concentrations.

4.2. Tested Clays and Clay Soils

Six types of samples were considered in this study, i.e., laboratory-based kaolin and bentonite clays and four other natural clay soils, namely, dermosol, chromosol, flowerdale, and craigieburn. The natural clay soils were collected from different locations in Australia. Dermosol and chromosol were collected from the Goulburn Broken Region in Victoria. Craigieburn clay soil was named after Craigieburn in Victoria and was obtained from there. Flowerdale was collected from Katoomba, New South Wales. The available geotechnical properties of the tested samples from the suppliers have been mentioned in Table 1.

4.3. Determining EC Parameters at Elevated Temperature

The experiment to determine the EC parameters consisted of preparing two different diluted clay–water homogeneous suspensions based on two different clay concentrations (10 g/L and 20 g/L) [12,23]. The value of σFW was known prior to mixing. All the tested samples were oven-dried for at least 24 h prior to the experiments.
However, Hasan et al. [12,23] did not consider changes in temperature. Therefore, the water temperature was varied in a laboratory environment for this study. The process involved preparing two identical suspensions inside a temperature bath chamber to elevate the temperature to four different levels (25 °C, 30 °C, 35 °C, and 40 °C). Once the targeted temperature had been reached, σFW, σmix1, and σmix2 were measured and Equations (14) and (15) were utilised to determine χ and σs, respectively.

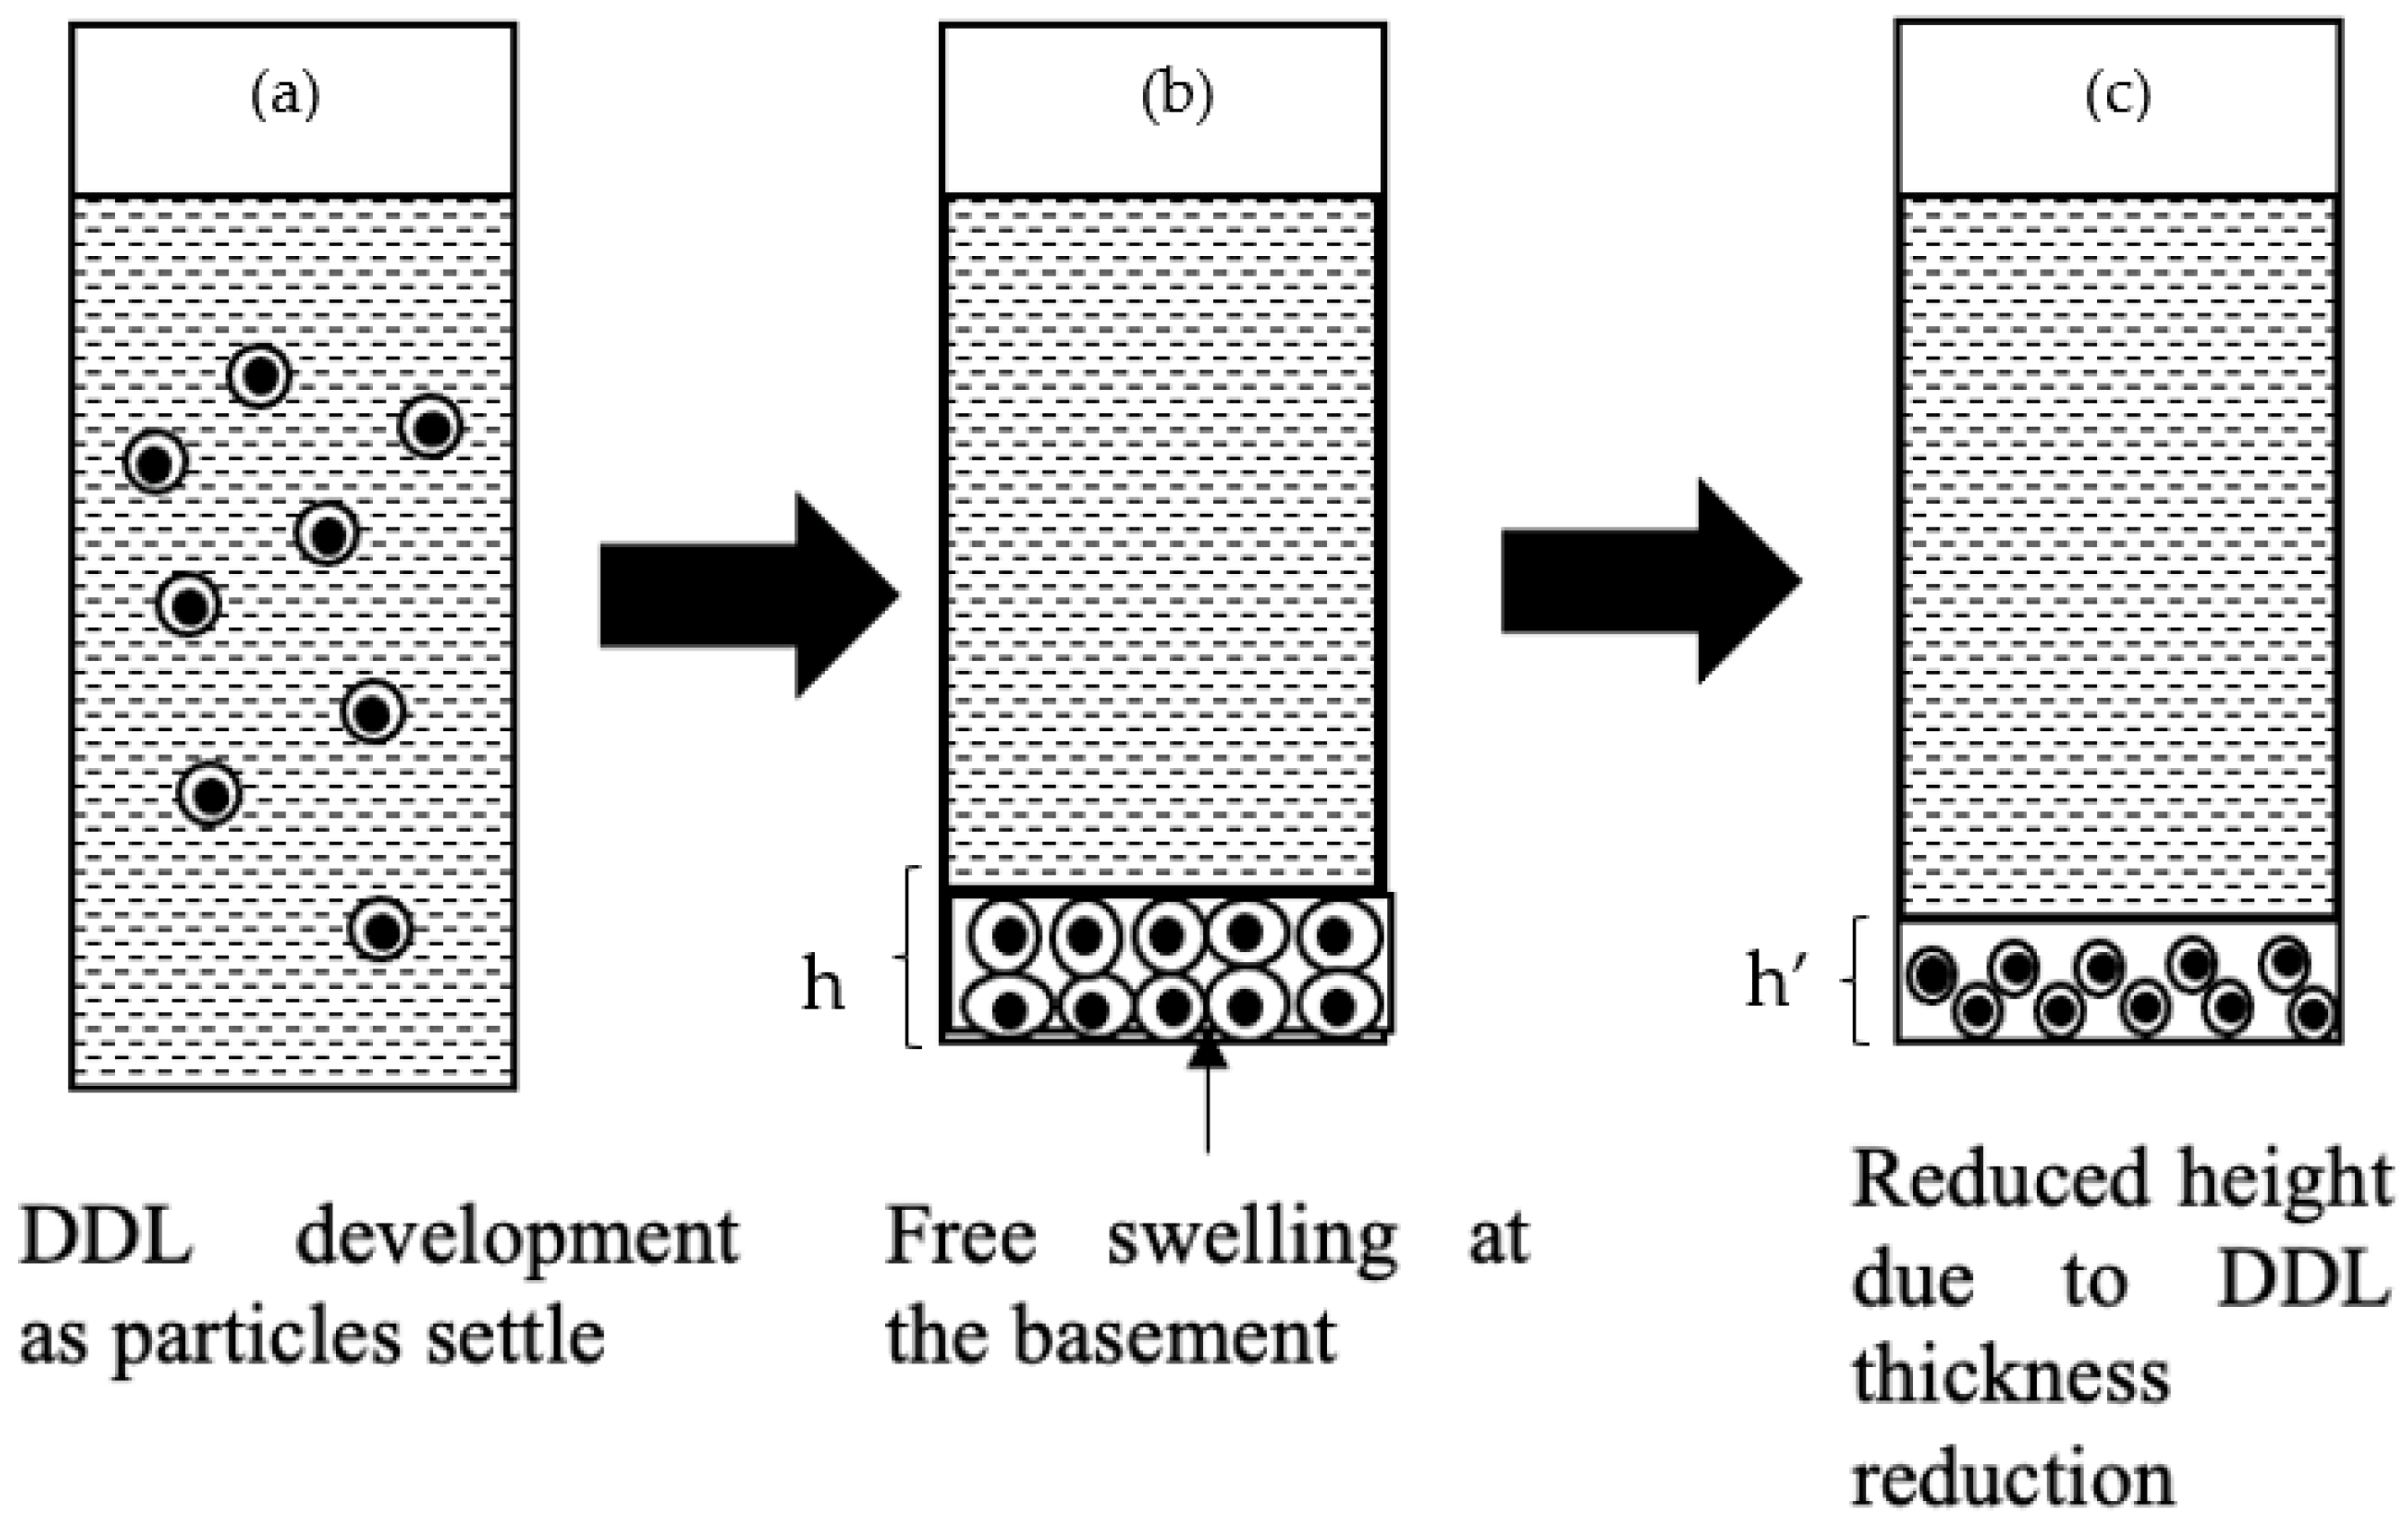
4.4. Modified FSI Test

The experimental programme to determine FSI was also modified to incorporate the effect of temperature. The standard FSI test was conducted as described in the literature [42,43]. However, since the motivation of this study was to investigate the effect of temperature and pore water salinity on the EC parameters and FSI, the modified FSI was also conducted at different temperatures, ranging from 25 °C to 40 °C. Free swell is defined as the increase in the soil volume from a loose and dry powder form once it is poured into water freely. The free swell is expressed as a percentage of the original volume of the dry soil. In general, the FSI test is conducted at constant room temperature (25 °C). The following equation is universally accepted to determine the FSI of soils:
F S I = F i n a l v o l u m e V F i n i t i a l v o l u m e ( V i ) i n i t i a l v o l u m e ( V i ) × 100

5. Results and Discussions

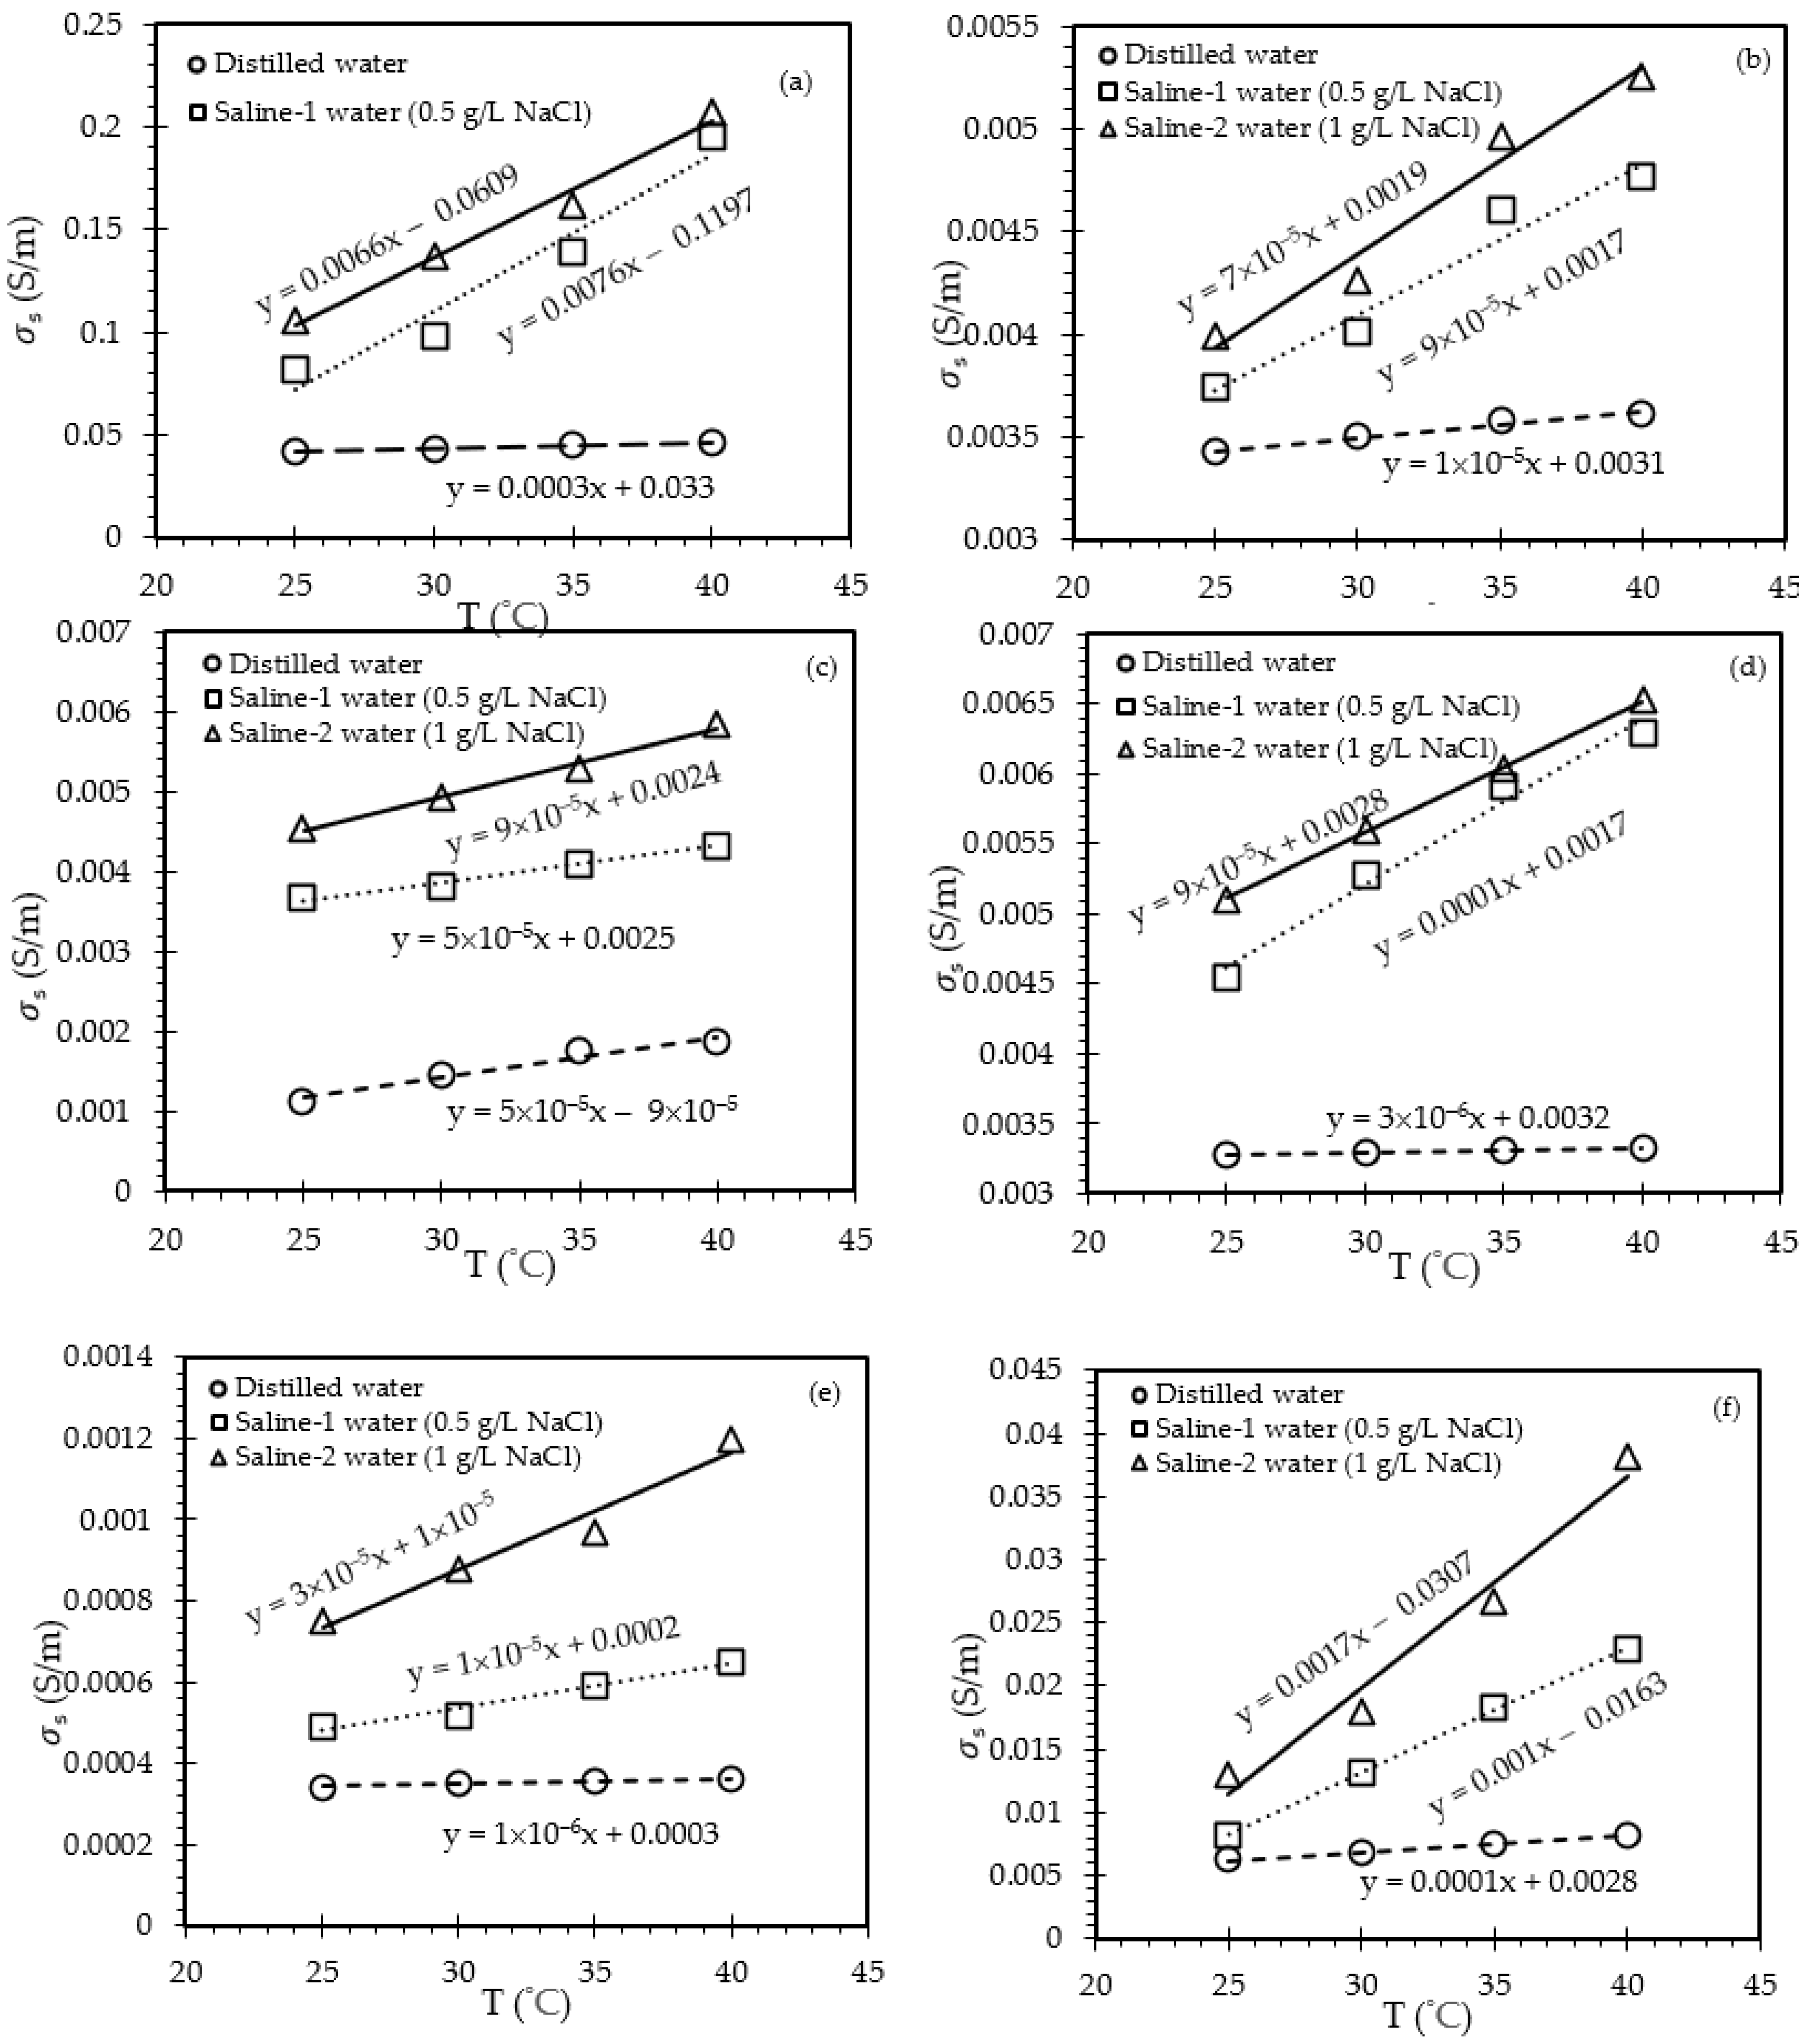
5.1. Concurrent Effect of Temperature and Pore Water Salinity on σs

Figure 4 illustrates the evolutions of electrical conductivity parameter σs as a function of σFW and T for all of the tested materials. In total, each sample had 12 measured data, 4 each for each type of saline water. As T increased, σFW increased consequently, and with an increase in both T and σFW, the electrical surface conductivity (σs) will increase concurrently. However, the increasing rate of σs will depend on the type of water solution considered when preparing the clay/clay soil–water suspension to predict σs.
Figure 4 shows that the slopes for both the saline-1 and saline-2 solutions were steeper than for distilled water and so were independent of the nature of the clay sample. This indicates that the pore water salinity, as well as elevated temperature, had influential impacts on σs. Although the trendlines and associated equations were found to be linear, the increasing rate varied based on the type of the sample. For example, the σs of bentonite increased from 0.082 S/m to 0.1957 S/m as the T increased from 25 °C to 40 °C in saline-2 solution, which was approximately a 139% increase (Figure 4a). Bentonite has a higher specific surface area and possesses higher surface conduction. Therefore, it requires more water during the hydration process. Another laboratory-based clay, i.e., kaolin had comparatively lower electrical surface conduction, and therefore, the increasing trend of σs kaolin was less influenced by the increase in T and σFW (Figure 4b). In terms of natural clay soils, both dermosol (Figure 4c) and chromosol (Figure 4d) had quite similar increasing trends; however, the σs values of chromosol were more influenced by the elevated T and σFW. In fact, the σs measurements of chromosol for saline-1 and saline-2 water almost overlapped, indicating a big leap from the values obtained from the distilled water solution. Therefore, compared to dermosol, the σs values were more influenced by the increasing T and σFW for chromosol (Figure 4d). The accelerated changes in chromosol could be explained by revisiting Table 1, where it was demonstrated that chromosol possessed about 55% greater CEC than dermosol. Flowerdale was the most inert among the samples, and the increasing rate of surface conduction was marginal, as shown in Figure 4e. Although the changes in σs values for the distilled water solution showed quite steady trends, the values were still increasing, although compared to the two other saline water solutions, the changes seemed to be less influential. Finally, craigieburn soil (Figure 4f) also demonstrated a large increment in σs values due to its higher electrical surface activity, with its augmentation rate increasing significantly with an increase in the salt concentration in the solutions. While the σs values increased by approximately 151% (saline-1) and 107% (saline-2) as T increased from 25 °C to 40 °C, the changes were recorded to be only 17% in terms of distilled water within a similar T range. The observations from this section provide evidence that although increasing T rapidly increases the electrical surface conduction, the rate of augmentation varies based on the type of saline solution and the properties of samples. However, this finding was expected, as increasing T and σFW always increases the electrical conductivity of clays. It was important to assess the changes on DDL thickness as well, which will be discussed in the coming section.

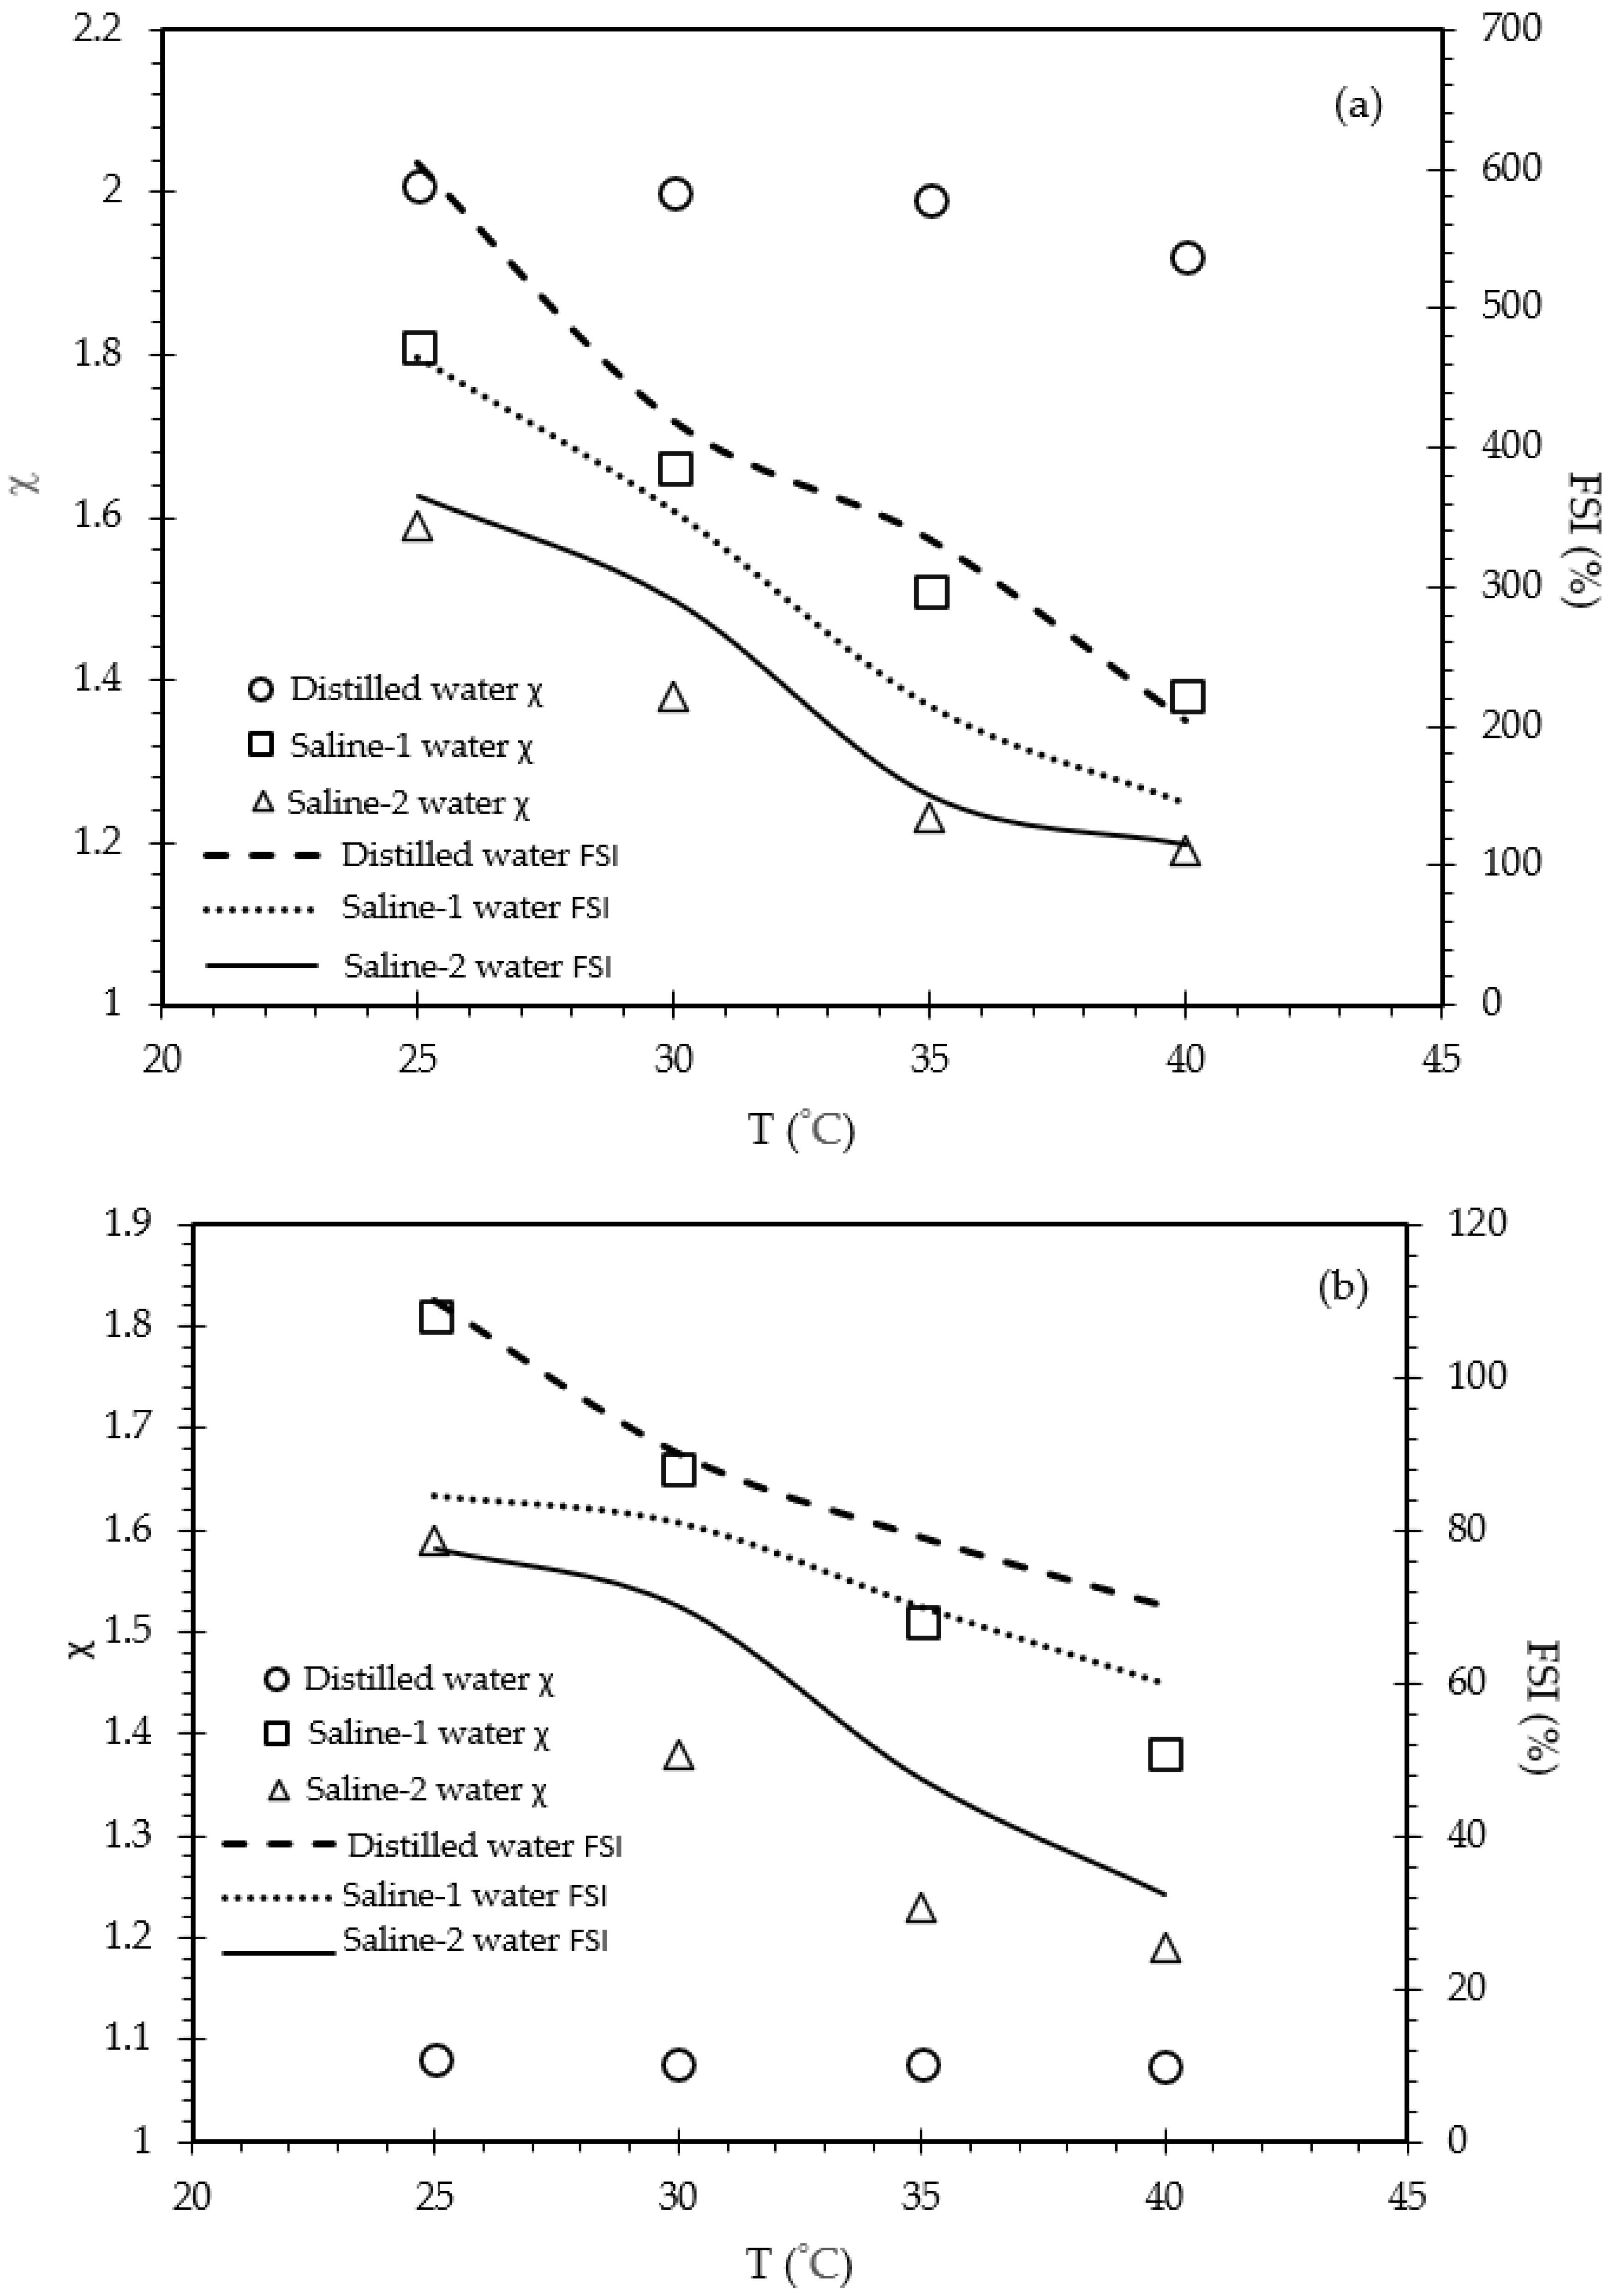
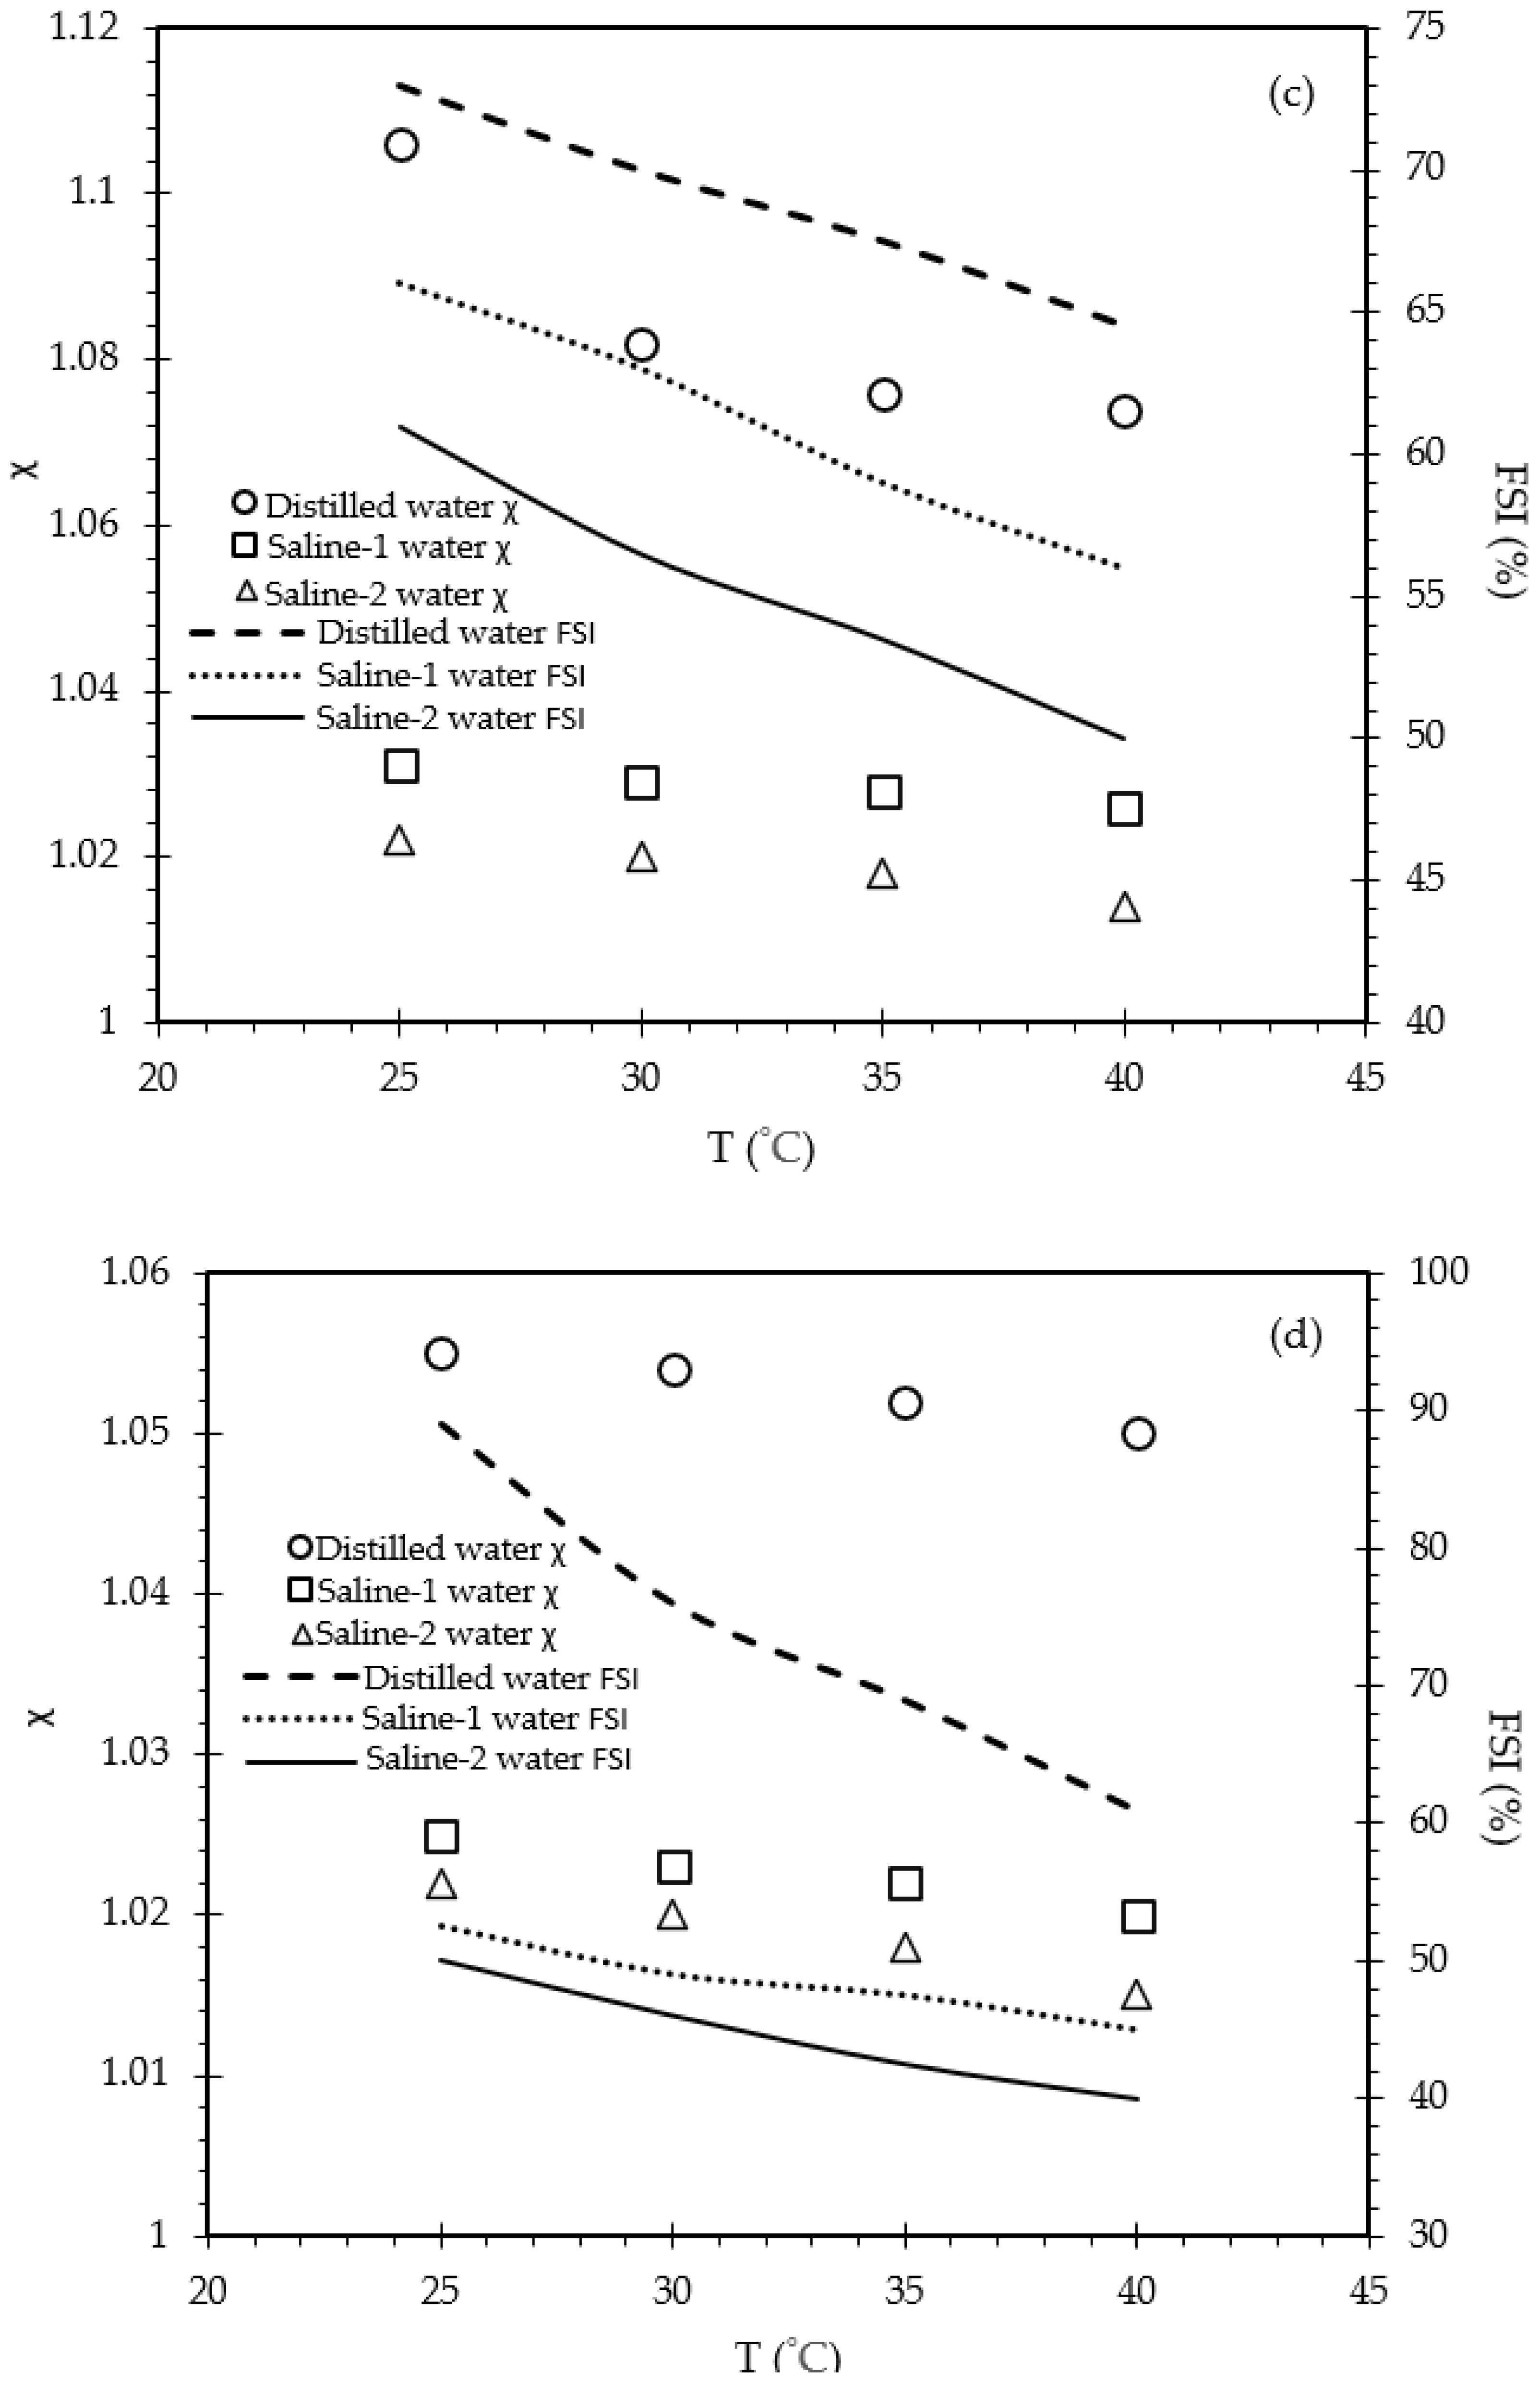
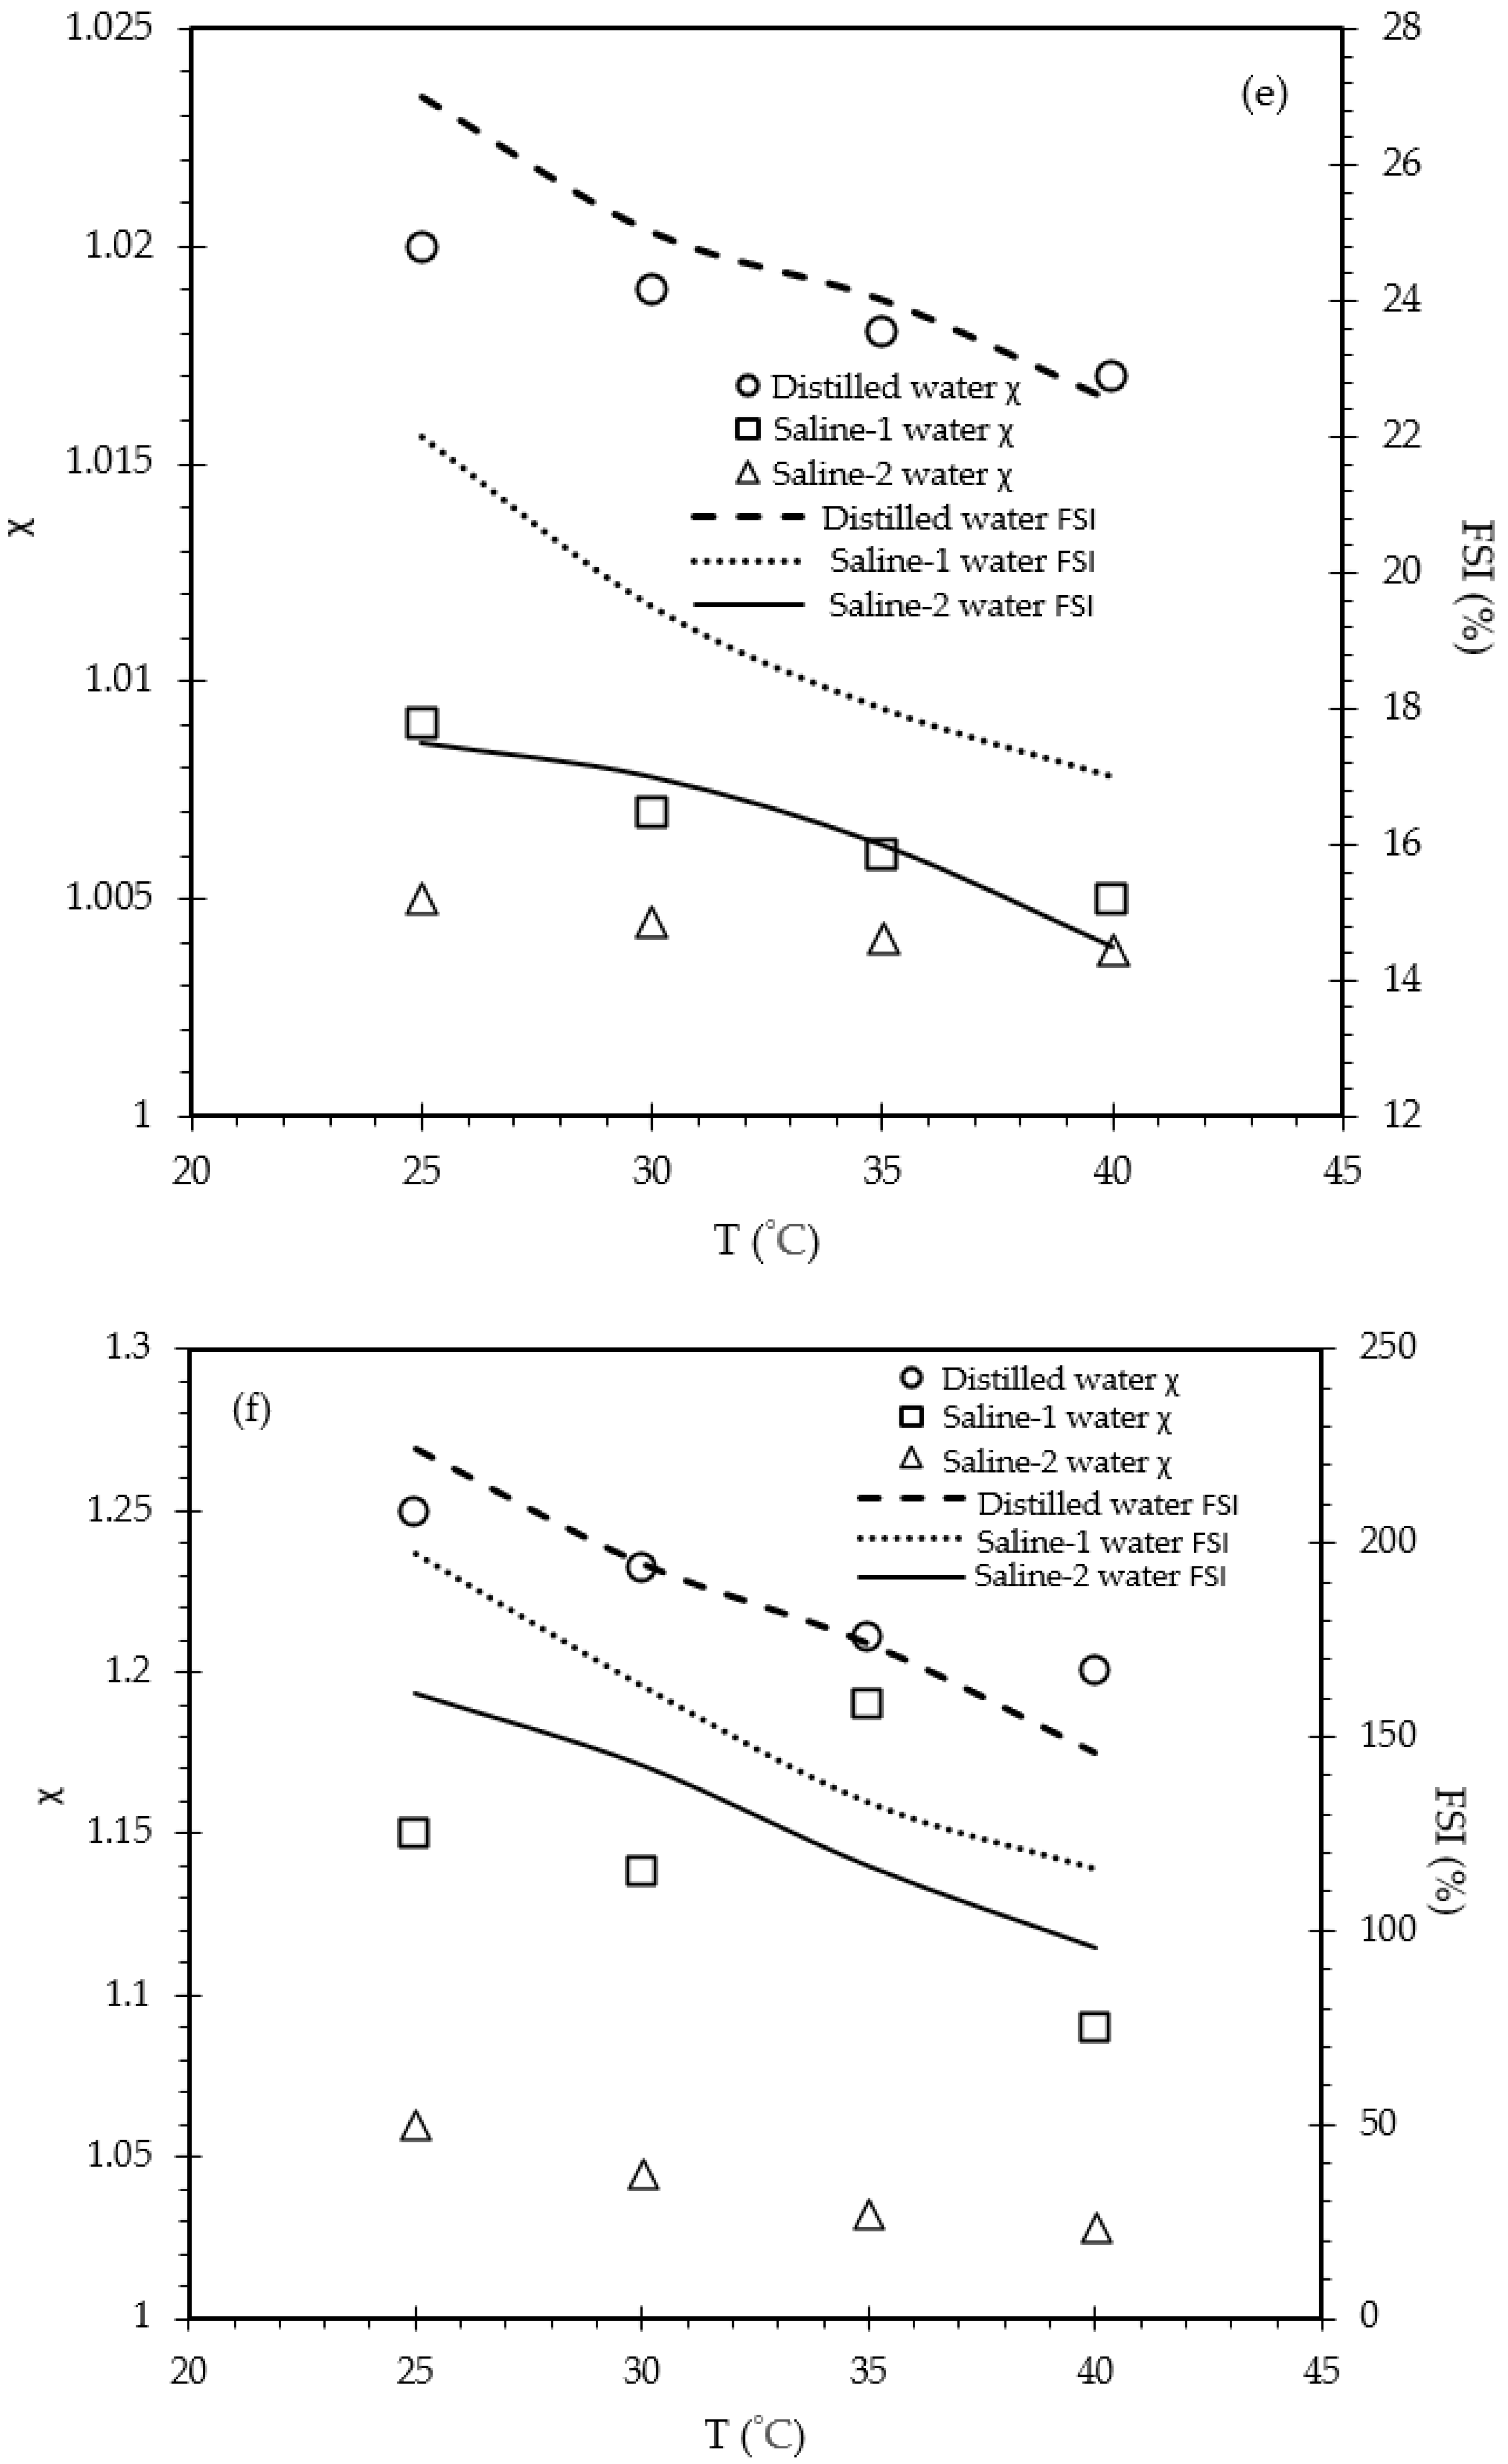
5.2. Changes in χ and FSI Due to the Combined Effects of Temperature and Pore Water Salinity

In this segment of the study, the combined effects of σFW and T were investigated on χ. The χ values indirectly represent the DDL thickness and were found to decrease as σFW and T increased. In order to understand the influence of T and σFW, the changes in χ for all of the tested samples were observed experimentally. Furthermore, the experimental results from FSI were analysed together for each sample to demonstrate how changes in the DDL can be observed experimentally. For ease of understanding, both the χ and FSI values have been plotted in the same figures with two vertical axes and refer to the provided legends within each frame in Figure 5.
As per Figure 5, all the tested samples exhibited similar characteristics in terms of both χ and FSI. It could be seen that as T increased, both χ and FSI plummeted. However, the decreasing rates were more pronounced in the saline-1 and saline-2 solutions due to the increased salt concentrations. The reduction in χ could be explained in terms of the reduction in the volume of DDL water; this observation was found to be in accordance with data from previously published works [12,23]. Overall, bentonite had χ∈[1.08, 2.01] as σFW and T varied, which showed greater variation compared to the other clays/clay soils. However, unlike the σs variations, higher χ values were recorded for distilled water. When the saline-1 and saline-2 water solutions were considered, a rapid reduction in χ was observed for bentonite (Figure 5a). The other samples (Figure 5b–f) also demonstrated a similar trend, but those possessed comparatively lower electro-chemical surface activities, and therefore, the decreasing rate was not highly accelerated (while remaining noticeable). To summarise, the values of χ decreased at different rates as T and σFW increased, regardless of the type of clay/clay soil.
On the other hand, Figure 5 also demonstrates the changes in FSI as a function of T and σFW for all of the tested materials (right side of the vertical axis in each frame). In general, it may be seen that as T increased, FSI decreased concurrently. However, the rate of decrease and the local maxima and minima were not similar with different σFW. The maximum FSI was recorded in the standard FSI test, i.e., when the clay or clay soil was poured into distilled water at T = 25 °C. For example, bentonite demonstrated the highest FSI value, i.e., 605%, at T = 25 °C in distilled water, as shown in Figure 5a. However, as T increased, the σFW of the distilled water marginally increased, which reduced the electro-osmotic potential of bentonite. Therefore, FSI decreased accordingly. Likewise, in terms of saline-1 water, the FSI value decreased from its original value (from the distilled water FSI test) due to the increased salinity. The salinity was influenced by the inclusion of salt, as well as due to the elevated T. Therefore, the local maxima and minima of FSI for the saline-1 solution plummeted. Saline-2 water contained a higher salt concentration than saline-1 water. As a result, the FSI values further decreased due to the effect of salinity on the swelling potential. Similar characteristics were observed for all of the other tested samples, as represented in Figure 5b–f. Among the natural clay soils, flowerdale exhibited the lowest FSI; this was in accordance with an earlier demonstration, as it had quite inert mineralogical properties (Table 1). While the FSI of bentonite was observed to be 605% in distilled water at 25 °C, this decreased to 365% at the same temperature when σFW = 0.002 S/m (1 g/L NaCl concentrated saline water) was used [12,23]. These significant changes were also in accordance with experimental data reported by Shirazi et al. [44] and Yukselen-Aksoy et al. [45], where the former showed that the liquid limit of bentonite decreased from 497% to 112% when distilled water was replaced by 0.5 M of NaCl solution, and the latter demonstrated that the impact of saline water on free swelling was extensively influenced when the soil had a liquid limit of more than 110%. While bentonite showed the most noteworthy changes, other clays were considered to show that the changes depicted in this study are universal for all types of clay and clay soils, regardless of the geotechnical properties.

5.3. Confirmation of Assumptions

Pore water salinity affects the microstructure configuration of clay particles; this can be controlled by the interparticle repulsive forces during the hydration process [31]. It was observed that as the salinity increased, clay plasticity decreased, which led to a reduction in the interparticle repulsive forces [46]. The steady trend in σs values could be attributed to the monomodal pore size microstructure (also known as uniform pore size). Meanwhile, increased salinity created an aggregated microstructure (also known as a bimodal pore size) [47,48].
The predominant forces, namely, the attractive and repulsive forces among the clay particles, play significant roles in determining the size of DDL. The physico-chemical interactions took place once clay particles came in contact with the water, which led to the formation of an adsorbed water layer. The adsorbed layer behaved similarly to a typical electrolytic solution, which allowed electrostatic interactions to occur. The interactions led to ion exchange between the negatively charged clay particle surfaces and the pore water. Therefore, double layer repulsion occurred during the ion exchange, which was actually the electrostatic repulsion among the clay particles. An increase in temperature significantly influenced both the attractive and repulsive forces, and as a consequence, the charges of the clay particles were changed. Therefore, the temperature increased the pore water salinity and, in combination, these parameters reduced the DDL thickness as well as the orientation/structure of the clay particles (clay fabric) and dielectric properties [49], thus confirming the assumptions stated in Section 3.
Comprehensive results are presented in Table 2 for overall comparisons of the findings from this study. Terms V1 and V2 refer to the two identical tests conducted at the same time to avoid experimental errors, and Vavg refers to the mean values calculated from V1 and V2.

5.4. Significance of this Study

ERT is a geophysics method based on the electrical properties of clays; it is used to determine the electrical resistivity distribution of a subsurface by assessing the obtained data from the ground level. A proper understanding of the EC and DDL of clays concomitantly with temperature, pore water salinity, and finally, finally, free swelling will provide extended information on sub-setting a specific geographic location.
The concept of surface conduction parameters came into being during the development of electrical resistivity/conductivity models for clays. A comprehensive literature can be found in Hasan et al. [12], where the shortcomings in this field were thoroughly discussed. Among the different EC models, series–parallel combined and either series or parallel models were found to be popular. However, most of the concepts fundamentally relied on deliberating clay or soil as an insulated material due to the absence of prior research considering the surface conduction parameter and DDL. In fact, some models considered air, which cannot be a realistic approach. Clay contains a DDL, which can be incorporated into an EC model by forming an effective conductive solid. Therefore, the inclusion of an effective conductive solid provides a more accurate approach in the series-parallel model compared to the use of solid soil particles as direct insulators (Figure 1 and Figure 2). Hasan et al. [12,23] introduced σs and χ, providing physical definitions for fine-grained and coarse-grained clays, respectively. This concept was later utilised and further investigated in several well-written published works which focused on different applications of clays [1,50,51,52]. The major limitations of previously published works by the authors [12,23] were the absence of variable temperature; temperature affects not only the pore water salinity but also the surface conduction activities, as well as the DDL and FSI of clays and clay soils. Therefore, it was important to understand the effect of temperature and pore water salinity on σs, χ, and FSI, with a view to observing the effects on the DDL thickness of clays.
Finally, the tools and methodologies considered in this study were easier to collect, operate, and reproduce. The present study also provided adequate information for the purpose of adding more clays/soils into the database to observe other important changes in the physico-chemical properties.

5.5. Variations in the Properties of the Tested Samples

As mentioned earlier, the present study considered six different types of clay and clay soils. Among them, two clays were synthetics and the other four were collected across different locations in Australia. The consideration of those six samples with diverse properties was sufficient to prove the research hypotheses of this study due to the variability in their properties. Most clays or soils found in nature have a liquid limit between 20% and 100%. The four natural clay soils considered in this study had liquid limits between 29% to 97%, which covered the liquid limit at a lower range (flowerdale 29%), a mid-range (chromosol 58%, dermosol 59%), and a higher range (craigieburn 97%). In addition, dermosol does not have strong texture and is mostly siliceous, whereas chromosol is also siliceous but has a strong contrasting texture, i.e., the abrupt change in the texture of soil between topsoil and subsoil. The percentage of fine contents was also different. Therefore, diversity in this part was also ensured. In addition, two widely used laboratory clays, i.e., kaolin and bentonite, were considered in the experiments. As Table 1 suggests, bentonite has a liquid limit of 504%, which is beyond any typical liquid limit range of other clays or soils.
While the typical FSI test for clays is straightforward, the test for bentonite can be challenging due to its high sensitivity to salt concentration and temperature. The present study considered a modified FSI approach where the water salinity was varied. In order to have more confidence of the veracity of the experimental results, two identical samples were prepared (V1, V2), and the average volume (Vavg) was considered as reported in Table 2. The water salinity was prepared each time by fixing the amount of NaCl (g) as well as the temperature. Despite the complexities involved in the time-sensitivity and precision, the obtained data were still found to be sufficient to investigate the evolutions in EC surface conduction parameters and to observe the decreasing trends in DDL thickness.

6. Conclusions

The present study investigated the effects of temperature and water salinity on two EC parameters, namely, surface conduction (σs) and the size of DDL water per unit volume of clay or clay soil (χ), as well as on the free swelling index. A simple experimental approach was conducted in this study to prepare the setup in order to measure these new parameters mathematically. The effects of pore water salinity (σFW) and temperature (T) on these parameters were also investigated experimentally. The results showed that surface conductivity (σs) increased with increasing salinity, and that χ decreased concurrently due to the reduction in the electrical surface potential, which is responsible for the development of the DDL. However, as the temperature increased, the thickness of the DDL decreased whereas σs increased due to the increase in pore water salinity, i.e., the electrical conductivity of free water. Six different clay materials were considered in this study to observe the aforementioned changes.
A modified free swelling index (FSI) test was introduced, where experiments were conducted at temperatures ranging from 25 °C to 40 °C with three different salt concentrations in the water, rather than the conventional FSI test at room temperature with clays/clay soils mixed with distilled water only. Clay materials with different geotechnical properties were considered to establish more confidence in the approach, with liquid limits ranging from 29% to 504% and electrical conductivity ranging from 0.000342 S/m to 0.0412 S/m. The results obtained from the modified test showed that FSI decreased as the water salinity and temperature increased. The agreement between the physical meaning of the surface conduction parameters and the FSI experimental results provided confidence in the finding of this study, i.e., that clay DDL can be influenced by external factors, particularly by temperature. The reductions in χ and FSI concurrently as temperature and water salinity increased provided compelling evidence that the DDL of clay decreases with an increase in the temperature and electrical conductivity of the free water.

Author Contributions

Conceptualization, M.F.H. and H.A.-N.; methodology, M.F.H. and H.A.-N.; software, M.F.H. and H.A.-N.; validation, M.F.H. and H.A.-N.; formal analysis, M.F.H. and H.A.-N.; investigation, M.F.H. and H.A.-N.; resources, M.F.H. and H.A.-N.; data curation, M.F.H. and H.A.-N.; writing—original draft preparation, M.F.H.; writing—review and editing, M.F.H. and H.A.-N.; visualization, M.F.H. and H.A.-N.; supervision, H.A.-N.; project administration, H.A.-N.; funding acquisition, M.F.H. and H.A.-N. All authors have read and agreed to the published version of the manuscript.

Funding

This work was carried out when the first author was pursuing a PhD at La Trobe University and was fully financially supported by postgraduate research fellowship from La Trobe University Graduate Research School.

Data Availability Statement

Complete data are provided in tabular format in the manuscript. Further can be provided upon request.

Acknowledgments

The authors are grateful to the technical support staff of Engineering Department of La Trobe University, particularly for their contributions during the COVID-19 pandemic.

Conflicts of Interest

The authors declare no conflict of interest.

References

  1. Ko, H.; Choo, H.; Ji, K. Effect of temperature on electrical conductivity of soils—Role of surface conduction. Eng. Geol. 2023, 321, 107147. [Google Scholar] [CrossRef]
  2. Ma, R.; McBratney, A.; Whelan, B.; Minasny, B.; Short, M. Comparing temperature correction models for soil electrical conductivity measurement. Precis. Agric. 2011, 12, 55–66. [Google Scholar] [CrossRef]
  3. Wang, R.; Cheng, J.-J.; Gao, L.; Li, Z.-G.; Qi, Y.-L.; Wang, M.-T.; Ding, B.-S. Research on the swelling mechanism of high-speed railway subgrade and the induced railway heave of ballastless tracks. Transp. Geotech. 2021, 27, 100470. [Google Scholar] [CrossRef]
  4. Kargas, G.; Soulis, K.X. Performance evaluation of a recently developed soil water content, dielectric permittivity, and bulk electrical conductivity electromagnetic sensor. Agric. Water Manag. 2019, 213, 568–579. [Google Scholar] [CrossRef]
  5. Lu, Y.; Abuel-Naga, H.; Al Rashid, Q.; Hasan, F. Effect of Pore-Water Salinity on the Electrical Resistivity of Partially Saturated Compacted Clay Liners. Adv. Mater. Sci. Eng. 2019, 2019, 7974152. [Google Scholar] [CrossRef]
  6. Zhang, T.; Deng, Y.; Cui, Y.; Lan, H.; Zhang, F.; Zhang, H. Porewater salinity effect on flocculation and desiccation cracking behaviour of kaolin and bentonite considering working condition. Eng. Geol. 2019, 251, 11–23. [Google Scholar] [CrossRef]
  7. Oh, T.-M.; Cho, G.-C.; Lee, C. Effect of Soil Mineralogy and Pore-Water Chemistry on the Electrical Resistivity of Saturated Soils. J. Geotech. Geoenviron. Eng. 2014, 140, 06014012. [Google Scholar] [CrossRef]
  8. Wang, D.; Yang, W.; Meng, C.; Cao, Y.; Li, M. Research on vehicle-mounted soil electrical conductivity and moisture content detection system based on current–voltage six-terminal method and spectroscopy. Comput. Electron. Agric. 2023, 205, 107640. [Google Scholar] [CrossRef]
  9. Brevik, E.C.; Fenton, T.E.; Lazari, A. Soil electrical conductivity as a function of soil water content and implications for soil mapping. Precis. Agric. 2006, 7, 393–404. [Google Scholar] [CrossRef]
  10. Thanh, L.D.; Jougnot, D.; Van Do, P.; Van Nghia, A.N. A physically based model for the electrical conductivity of water-saturated porous media. Geophys. J. Int. 2019, 219, 866–876. [Google Scholar] [CrossRef]
  11. Cai, J.; Wei, W.; Hu, X.; Wood, D.A. Electrical conductivity models in saturated porous media: A review. Earth Sci. Rev. 2017, 171, 419–433. [Google Scholar] [CrossRef]
  12. Hasan, F.; Abuel-Naga, H.; Broadbridge, P.; Leong, E.-C. Series-parallel structure-oriented electrical conductivity model of saturated clays. Appl. Clay Sci. 2018, 162, 239–251. [Google Scholar] [CrossRef]
  13. Friedman, S.P. Soil properties influencing apparent electrical conductivity: A review. Comput. Electron. Agric. 2005, 46, 45–70. [Google Scholar] [CrossRef]
  14. Cassiani, G.; Boaga, J.; Barone, I.; Perri, M.T.; Deidda, G.P.; Vignoli, G.; Strobbia, C.; Busato, L.; Deiana, R.; Rossi, M.; et al. Ground-based remote sensing of the shallow subsurface: Geophysical methods for environmental applications. In Developments in Earth Surface Processes; Elsevier: Amsterdam, The Netherlands, 2020; pp. 55–89. [Google Scholar] [CrossRef]
  15. Oldenborger, G.A.; Short, N.; LeBlanc, A.-M. Electrical conductivity and ground displacement in permafrost terrain. J. Appl. Geophys. 2020, 181, 104148. [Google Scholar] [CrossRef]
  16. Hanssens, D.; Delefortrie, S.; Bobe, C.; Hermans, T.; De Smedt, P. Improving the reliability of soil EC-mapping: Robust apparent electrical conductivity (rECa) estimation in ground-based frequency domain electromagnetics. Geoderma 2018, 337, 1155–1163. [Google Scholar] [CrossRef]
  17. De Almeida, H.; Marques, M.C.G.; Sant’ovaia, H.; Moura, R.; Marques, J.E. Environmental Impact Assessment of the Subsurface in a Former W-Sn Mine: Integration of Geophysical Methodologies. Minerals 2023, 13, 55. [Google Scholar] [CrossRef]
  18. Ozer, M.; Ulusay, R.; Isik, N.S. Evaluation of damage to light structures erected on a fill material rich in expansive soil. Bull. Eng. Geol. Environ. 2012, 71, 21–36. [Google Scholar] [CrossRef]
  19. Vardon, P.J. Climatic influence on geotechnical infrastructure: A review. Environ. Geotech. 2015, 2, 166–174. [Google Scholar] [CrossRef]
  20. Kumar, T.A.; Thyagaraj, T.; Robinson, R.G. Swell–shrink behaviour of fly ash-stabilised expansive soils. Proc. Inst. Civ. Eng. Ground Improv. 2022, 176, 160–171. [Google Scholar] [CrossRef]
  21. Chu, Y.; Liu, S.; Bate, B.; Xu, L. Evaluation on expansive performance of the expansive soil using electrical responses. J. Appl. Geophys. 2018, 148, 265–271. [Google Scholar] [CrossRef]
  22. Thomas, P.J.; Baker, J.C.; Zelazny, L.W. An Expansive Soil Index for Predicting Shrink-Swell Potential. Soil Sci. Soc. Am. J. 2000, 64, 268–274. [Google Scholar] [CrossRef]
  23. Hasan, F.; Abuel-Naga, H.; Leong, E.-C. A modified series-parallel electrical resistivity model of saturated sand/clay mixture. Eng. Geol. 2021, 290, 106193. [Google Scholar] [CrossRef]
  24. Mojid, M.; Cho, H. Estimating the fully developed diffuse double layer thickness from the bulk electrical conductivity in clay. Appl. Clay Sci. 2006, 33, 278–286. [Google Scholar] [CrossRef]
  25. Klein, K.A.; Santamarina, J.C. Electrical Conductivity in Soils: Underlying Phenomena. J. Environ. Eng. Geophys. 2003, 8, 263–273. [Google Scholar] [CrossRef]
  26. Mojid, M.A.; Rose, D.A.; Wyseure, G.C.L. A model incorporating the diffuse double layer to predict the electrical conductivity of bulk soil. Eur. J. Soil Sci. 2007, 58, 560–572. [Google Scholar] [CrossRef]
  27. Heimovaara, T.J.; Bouten, W.; Verstraten, J.M. Frequency domain analysis of time domain reflectometry waveforms: A four-component complex dielectric mixing model for soils. Water Resour. Res. 1994, 30, 201–209. [Google Scholar] [CrossRef]
  28. Schofield, R.K. Calculation of Surface Areas from Measurements of Negative Adsorption. Nature 1947, 160, 408–410. [Google Scholar] [CrossRef]
  29. Van Olphen, H. An Introduction to Clay Colloid Chemistry. Soil Sci. 1964, 97, 290–435. [Google Scholar] [CrossRef]
  30. Nye, P. Diffusion of Ions and Uncharged Solutes in Soils and Soil Clays. Adv. Agron. 1980, 31, 225–272. [Google Scholar] [CrossRef]
  31. Mitchell, J.K.; Soga, K. Fundamentals of Soil Behavior; John Wiley & Sons: New York, NY, USA, 2005; Volume 3. [Google Scholar]
  32. Abu-Hassanein, Z.S.; Benson, C.H.; Blotz, L.R. Electrical Resistivity of Compacted Clays. J. Geotech. Eng. 1996, 122, 397–406. [Google Scholar] [CrossRef]
  33. Sposito, G. The Chemistry of Soils; Oxford University Press: New York, NY, USA, 1989. [Google Scholar]
  34. Seyfried, M. Murdock Response of a New Soil Water Sensor to Variable Soil, Water Content, and Temperature. Soil Sci. Soc. Am. J. 2001, 65, 28–34. [Google Scholar] [CrossRef]
  35. Chapman, D.L. LI. A contribution to the theory of electrocapillarity. Lond. Edinb. Dublin Philos. Mag. J. Sci. 1913, 25, 475–481. [Google Scholar] [CrossRef]
  36. Gouy, M.J.J.P.T.A. Sur la constitution de la charge électrique à la surface d’un électrolyte. J. Phys. Theor. Appl. 1910, 9, 457–468. [Google Scholar] [CrossRef]
  37. Bharat, T.V.; Sivapullaiah, P.V.; Allam, M.M. Novel procedure for the estimation of swelling pressures of compacted bentonites based on diffuse double layer theory. Environ. Earth Sci. 2012, 70, 303–314. [Google Scholar] [CrossRef]
  38. Sogami, I.; Ise, N. On the electrostatic interaction in macroionic solutions. J. Chem. Phys. 1984, 81, 6320–6332. [Google Scholar] [CrossRef]
  39. Cui, W.; Potts, D.M.; Zdravković, L.; Gawecka, K.A.; Taborda, D.M. An alternative coupled thermo-hydro-mechanical finite element formulation for fully saturated soils. Comput. Geotech. 2018, 94, 22–30. [Google Scholar] [CrossRef]
  40. Zhou, H.; Kong, G.; Liu, H.; Laloui, L. Similarity solution for cavity expansion in thermoplastic soil. Int. J. Numer. Anal. Methods Géoméch. 2017, 42, 274–294. [Google Scholar] [CrossRef]
  41. Maranha, J.R.; Pereira, C.; Vieira, A. Thermo-Viscoplastic Subloading Soil Model for Isotropic Stress and Strain Conditions. In Advances in Laboratory Testing and Modelling of Soils and Shales (ATMSS); Springer: Berlin/Heidelberg, Germany, 2017; pp. 479–485. [Google Scholar] [CrossRef]
  42. Zumrawi, M. Swelling potential of compacted expansive soils. Int. J. Eng. Res. Technol. 2013, 2, 1–6. [Google Scholar]
  43. Holtz, W.G.; Gibbs, H.J. Engineering Properties of Expansive Clays. Trans. Am. Soc. Civ. Eng. 1956, 121, 641–663. [Google Scholar] [CrossRef]
  44. Shirazi, S.M.; Kazama, H.; Oshinbe, M. Permeability of bentonite and bentonite-sand mixtures. Aust. Geomech. 2005, 40, 27–36. [Google Scholar]
  45. Yukselen-Aksoy, Y.; Kaya, A.; Ören, A.H. Seawater effect on consistency limits and compressibility characteristics of clays. Eng. Geol. 2008, 102, 54–61. [Google Scholar] [CrossRef]
  46. Mokni, N.; Romero, E.; Olivella, S. Chemo-hydro-mechanical behaviour of compacted Boom Clay: Joint effects of osmotic and matric suctions. Géotechnique 2014, 64, 681–693. [Google Scholar] [CrossRef]
  47. Thyagaraj, T.; Salini, U. Effect of pore fluid osmotic suction on matric and total suctions of compacted clay. Géotechnique 2015, 65, 952–960. [Google Scholar] [CrossRef]
  48. Manca, D.; Ferrari, A.; Laloui, L. Fabric evolution and the related swelling behaviour of a sand/bentonite mixture upon hydro-chemo-mechanical loadings. Géotechnique 2016, 66, 41–57. [Google Scholar] [CrossRef]
  49. Kułacz, K.; Waliszewski, J.; Bai, S.; Ren, L.; Niu, H.; Orzechowski, K. Changes in structural and dielectric properties of nontronite caused by heating. Appl. Clay Sci. 2020, 202, 105952. [Google Scholar] [CrossRef]
  50. Choo, H.; Park, J.; Do, T.T.; Lee, C. Estimating the electrical conductivity of clayey soils with varying mineralogy using the index properties of soils. Appl. Clay Sci. 2022, 217, 106388. [Google Scholar] [CrossRef]
  51. Duan, Z.; Yan, X.; Sun, Q.; Tan, X.; Chen, X. New models for calculating the electrical resistivity of loess affected by moisture content and NaCl concentration. Environ. Sci. Pollut. Res. 2021, 29, 17280–17294. [Google Scholar] [CrossRef]
  52. Ming, F.; Li, D.Q.; Chen, L. Electrical Resistivity of Freezing Clay: Experimental Study and Theoretical Model. J. Geophys. Res. Earth Surf. 2020, 125, e2019JF005267. [Google Scholar] [CrossRef]
Figure 2. Schematic representation of a diluted clay–water system (based on [12]).
Minerals 13 01110 g002
Figure 3. The assumptions considered in this study where (a) generic DDL development along with settling clay particles are shown, (b) free swelling at the base is theorised, and (c) reduction in the DDL thickness is anticipated.
Minerals 13 01110 g003
Figure 4. Changes in σs as a function of T and σFW for clays (a) bentonite and (b) kaolin; and clay soils (c) dermosol, (d) chromosol, (e) flowerdale, and (f) craigieburn.
Minerals 13 01110 g004
Figure 5. Combined effect of T and σFW on χ and FSI on (a) bentonite and (b) kaolin clays; and clay soils (c) dermosol, (d) chromosol, (e) flowerdale, and (f) craigieburn.
Minerals 13 01110 g005aMinerals 13 01110 g005bMinerals 13 01110 g005c
Table 1. Properties of the tested samples.
PropertiesKaolinBentoniteDermosolChromosolFlowerdaleCraigieburn
Liquid Limit (%)7450459582997
Plastic Limit (%)325329272131
Specific gravity (Gs)2.582.682.62.592.562.6
Fine content (%)1001004661660
pH in water (28–40% solid)
CEC 1 (meq/100 g)
7
0.075
9.5
80
5.17
2.9
5.5
4.5
4.9
-
7.4
-
1 Cation Exchange Capacity.
Table 2. Comprehensive experimental results for the clays and clay soils tested in this study.
Sample TypeWater Typeσfw (S/m)T (°C)V1 (mL)V2 (mL)Vavg (mL)FSI (%)σs (S/m)χ
Bentonite *Distilled0.00008525697270.56050.04122.01
0.000092305153504200.04362.00
0.00009635444343.53350.0451.99
0.000140313030.52050.04641.92
Saline-10.001425555856.54650.082011.81
0.0019530484345.53550.098291.66
0.002635303331.52150.139511.51
0.0047240262324.51450.1957231.38
Saline-20.00225474646.53650.105931.59
0.002915303939392900.137381.38
0.003616352426251500.161471.23
0.0049640222121.51150.207661.19
Distilled0.000085252121211100.0034251.08
0.00009230191919900.00351.077
0.000096351817.817.9790.003581.076
Kaolin * 0.000140171717700.0036141.075
Saline-10.00142518.418.518.4584.50.003741.042
0.001953018.21818.1810.004011.034
0.002635171717700.004611.029
0.0047240161616600.0047631.020
Saline-20.002251817.517.7577.50.0039881.024
0.00291530171717700.0042571.021
0.003616351514.514.7547.50.0049631.018
0.00496401313.513.2532.50.0052581.014
Distilled0.0000852517.317.317.3730.001121.106
0.00009230171717700.001471.082
Dermosol ^0.0000963516.716.816.7567.50.001781.076
0.00014016.416.516.4564.50.001861.074
Saline-10.00142516.516.716.6660.0036611.031
0.001953016.316.316.3630.003811.029
0.00263515.915.915.9590.0041031.028
0.004724015.615.615.6560.004331.026
Saline-20.002251616.216.1610.0045321.022
0.0029153015.715.615.6556.50.004931.020
0.0036163515.415.315.3553.50.0053011.018
0.0049640151515500.005841.014
Chromosol ^Distilled0.000085251918.818.9890.0032791.055
0.0000923017.517.717.6760.0032911.054
0.000096351716.816.9690.0033061.052
0.00014016.21616.1610.0033181.050
Saline-10.00142515.315.215.2552.50.004541.025
0.00195301514.814.9490.0052841.023
0.00263514.814.714.7547.50.005911.022
0.004724014.514.514.5450.0062941.020
Saline-20.00225151515500.0051041.022
0.0029153014.714.514.6460.0055981.020
0.0036163514.314.214.2542.50.0060351.018
0.0049640141414400.006521.015
Flowerdale ^Distilled0.0000852512.712.712.7270.0003421.02
0.0000923012.512.512.5250.0003511.019
0.0000963512.412.412.4240.0003551.018
0.00014012.212.312.2522.50.000361.017
Saline-10.00142512.312.112.2220.0004911.011
0.00195301211.911.9519.50.0005181.009
0.00263511.811.811.8180.000591.007
0.004724011.711.711.7170.0006481.006
Saline-20.0022511.811.711.7517.50.000751.005
0.0029153011.711.711.7170.000881.0045
0.0036163511.611.611.6160.000971.0041
0.004964011.511.411.4514.50.00121.0038
Distilled0.0000852532.532.332.42240.006211.25
0.0000923029.529.429.45194.50.00681.232
Craigieburn ^0.0000963527.527.327.41740.00751.211
0.00014024.624.624.61460.00821.2
Saline-10.00142529.629.829.71970.008131.15
0.001953026.426.226.31630.01321.138
0.00263523.323.323.31330.01831.19
0.004724021.721.521.61160.02281.09
Saline-20.002252626.226.11610.0131.06
0.0029153024.424.124.25142.50.0181.045
0.0036163521.821.521.65116.50.02671.032
0.004964019.719.419.5595.50.03811.028
* Laboratory clays. ^ Natural clay soils.
Disclaimer/Publisher’s Note: The statements, opinions and data contained in all publications are solely those of the individual author(s) and contributor(s) and not of MDPI and/or the editor(s). MDPI and/or the editor(s) disclaim responsibility for any injury to people or property resulting from any ideas, methods, instructions or products referred to in the content.

