Article

Surface Chemistry Tuning Solutions for Flotation of Fine Particles

1
Department of Physical Chemistry, Sofia University, 1 James Bourchier Blvd, 1164 Sofia, Bulgaria
2
School of Minerals and Energy Resources Engineering, University of New South Wales, Sydney, NSW 2052, Australia
3
Department of Medical Physics and Biophysics, Medical Faculty, Medical University–Sofia, Zdrave Str. 2, 1431 Sofia, Bulgaria
4
Department of Mineral Processing Engineering, Istanbul Technical University, Istanbul 34469, Turkey
*
Author to whom correspondence should be addressed.
Minerals 2023, 13(7), 957; https://doi.org/10.3390/min13070957
Submission received: 23 June 2023 / Revised: 13 July 2023 / Accepted: 14 July 2023 / Published: 18 July 2023
(This article belongs to the Special Issue Recent Advances in Flotation Process)

Abstract

:
This paper analyses the basic obstacles preventing the fine particles from floating and suggests solutions for the wetting zone between the bubble and the particle during their collision. It has been shown in our recent paper that the basic problem of fine particle flotation is not the low frequency of collisions with the bubbles, but it consists of the efficiency of these collisions. Moreover, there exists a thermodynamic lower size limit for flotation of fine hydrophobized particles in the sub-micron range, and it is weakly dependent on the size of the bubbles. It was shown that fast flotation with high recovery of fine particles can be achieved by means of: (i) electrostatic attraction between particles and bubbles; (ii) a significant increase in the level of their hydrophobicity; (iii) existence of fine bubbles in the flotation cell. It was shown as well that the drainage of the wetting film between bubbles and particles is unimportant, but the deformation of the bubble by the particle during their clash plays a major role in its rupturing. Electrostatic attraction between bubbles and fine silica particles was achieved with hexylamine. It causes a moderate increase of their hydrophobicity from contact angle = 39.5° ± 2.5° to contact angle = 51.7° ± 7.5° and gave almost 90% recovery within 2 min. Unfortunately, the selectivity of this collector is unsatisfactory if the fine silica particles are mixed with fine magnesite particles. It was shown that even being hydrophilic, the recovery of fine particles can jump to almost 50% if strong electrostatic attraction with the bubbles exists. It was demonstrated as well with the collector hexamethyldisilazane causes significant increase of the hydrophobicity of the fine silica particles (contact angle ≈ 90°) results in skin flotation with 100% recovery when alone and 97% recovery when being mixed with fine magnesite particles (51/49). A new collector significantly increasing the hydrophobicity of magnesite fine particles was tested (disodium dodecyl phosphate) resulting in 89% recovery of fine magnesite particles alone and about 98% recovery in a mixture with fine silica particles.

1. Introduction

Flotation of fine particles has been considered a problem for many years [1,2,3,4,5,6,7,8,9,10,11,12,13]. It has been assumed for a long time that the problem consists of the low frequency of bubble–fine particle collisions [12]. This assumption has been accepted based on the theoretical approach of von Smoluchowski and Sutherland [14,15], accounting for the streamlines of the fluid carrying a particle and flowing near the bubble. This physical picture, however, assumes a laminar flow at low Reynolds numbers. This approach has been advanced by Yoon and Luttrell [16] to Re = 400. The application of this approach to real flotation reactor predicted a low frequency of bubble–fine particles collisions, thus misleading the flotation research community that this is the basic problem for the low recovery of the fine particles. Fortunately, there is another more realistic theoretical approach (e.g., [17,18]) accounting for the bubble–particle collisions under high turbulence. This theoretical approach predicts a significantly higher frequency of collisions [13,17]. A recent work of ours [13] concluded that the problem consists of the low efficiency of the collisions. Analysis based on the capillary theory of Scheludko et al. [19] indicated the existence of a thermodynamic lower size limit of the fine particles to float [13] in the nano-scale range, which is weakly dependent on the size of the bubbles. Basically, the capillary theory of Scheludko et al. [19] on the attachment of particles to a liquid surface is based on the minimum level of penetration of the particles into the air/water (A/W) interface, required for the formation of three-phase contact line (TPCL). To penetrate sufficiently into the bubble across the thin wetting film, assumed here as membrane, the particle, driven by hydrodynamic push force, is supposed to overcome a specific resistance force. The larger the hydrophobicity of the particle, the smaller the resistance force for the formation of TPCL is, and vice versa. Only in such a case, the particle can attach to the bubble. The calculated lower size limit of particles with contact angle θ = 80° is in the range of 200 nm to 400 nm. Particles below this size cannot be captured by the bubbles. Particles above this size can be captured because their hydrodynamic push force is larger than the resistance force for the formation of TPCL. The rate of flotation of such particles depends on the level of exceeding the push force over the resistance force. According to the calculations in ref. [13], hydrophobized particles (θ = 80°) with sizes in the range of 0.2 μm to 2 μm are permitted to float, but with a small flotation rate because their push force exceeds just a little bit of the resistance force for the formation of TPCL. The capillary theory of Scheludko et al. [19] assumes the thin wetting film as a membrane. The emergence of a thin wetting film entrapped between the bubble and the particle decelerates the particle nearby the bubble, due to the emergence of hydrodynamic drag force [20,21], thus increasing the induction time. If the contact time of the particle and the bubble is shorter than their induction time, the particle will retrace. On the contrary, if the contact time is longer than the induction time, the particle will be captured by the bubble. Hence, it was applied in ref. [13] the hydrodynamic theory of thin wetting films for the case particle approaching the bubble in a normal direction. According to this theory the fine particles (R < 2 μm) approach the bubbles very quickly, and it is up to their momentum if they will break the wetting films. Surprisingly, the calculations show that the coarser particles (R > 2 μm) require the induction time to be significantly larger than the contact time due to the substantial drag forces of their wetting films. Hence, such particles should always retrace from the bubbles. On the contrary, the scientific literature reports that the coarser hydrophobic particles have a higher flotation rate (e.g., Refs. [22,23]) than the finer hydrophobic particles. This contradiction at first glance between theory and experiment is welcome, because it supports the old idea that the precipitation (or cavitation) of the dissolved in the water air in close proximity to hydrophobic surfaces (bubble and hydrophobic particle) induces the emerging of gas capillary bridge between the bubble and the particle, thus rupturing the wetting film even at high film thickness (h > 100 nm). Therefore, it appears that the precipitation of dissolved in the water air is a powerful factor in the flotation of mineral particles. It is induced when two very hydrophobic surfaces approach each other. So, it appears that the quality of hydrophobization is mostly important for achieving of high flotation rate of the mineral particles. Therefore, the selection of collectors for each particular case is very important. This could be a key factor for excellent separation of gangue minerals from valuable fine-sized minerals with sufficiently high recovery and flotation yield. This study is focused on the separation of pure silica fine particles and pure magnesite fine particles along with composite magnesite mineral particles. For this reason, it is important to select proper collectors either for the silica or magnesite fine particles, able to cause high levels of hydrophobization and possible electrostatic attraction between bubbles and particles. It has been reported [24,25] that phosphate ions adsorb well on the magnesite surface. Hence, this work suggests a collector, which contains a phosphate group in its molecule to maximally hydrophobize the magnesite particles.
This paper is a continuation of our former paper “Physical restrictions of the flotation of fine particles and ways to overcome them” [13]. It contains part of the material published in ref. [13], but this material is analyzed in accordance with our more advanced understanding on the fine particle flotation. For example, ref. [13] describes the capillary theory of Scheludko [19], while here some more details about this theory are explained from a different viewpoint, which gives better understanding to the reader about the mechanism of attachment of the particles to the bubble.

2. Theoretical Background

The literature pre-history of the problem. The surface force analysis in the present study is based on the celebrated DLVO theory [26,27], named for the famous scientists Derjaguin and Landau from the Soviet Union and Verwey and Overbeek from Holland. There are many works devoted to the DLVO theory and its predictions. Only some of them, which are assumed important for the analysis hereafter, are outlined here. In short, this theory regards the stability of lyophobic dispersed systems, despite being either bubbles (or oil droplets) or solid (or soft) particles or both, as in the case of flotation systems. The flotation of valuable particles under high turbulence reveals multiple phenomena, which are controlled by (i) the overall hydrodynamics of the system—velocity and momentum vector fields and (ii) bubbles-bubbles interaction, bubbles-particles interaction, and particles-particles interaction occurring during their collisions [22]. Once one of the abovementioned pairs emerges via collision, a thin liquid film forms. This work is focused on thin wetting films between bubbles and particles. In short, when a collision between a bubble and a particle occurs, the following scenarios are possible [22,28]: (i) the particle slides on the surface of the bubble and finally detaches—this usually happens with the fine particles (see Figure 1); (ii) the particle deform the front part of the bubble, thus switching on the capillary “squeezing” pressure pushing the particle and the bubble toward each other, finally ending either in attachment or detachment (see Figure 1). The latter usually happens with larger and heavier particles.
Ref. [13] reports that the basic problem of the fine particle flotation is not the low rate of their collisions with the bubbles, as already thought for a long time (e.g., ref. [12]), but in the low efficiency of this collision. The particle, pushed by the normal projection of random hydrodynamic force towards the bubble, exhibits usually four forces: (i) hydrodynamic drag force slowing down the speed of its motion in the normal direction, but it can slide following the shape of the bubble; (ii) capillary force originating from the deformation of the bubble at the very bubble-particle collision (it pushes the particle and the bubble towards each other); (iii) electrostatic force originating from Coulomb interaction with the bubble; (iv) van der Waals force, originating from electrodynamic interactions with the solvent (water) and the particle. The random hydrodynamic and capillary forces drive the particle toward the bubble in the normal direction. These four forces are supposed to determine the induction time, but it is interesting to note that none of them are related to the level of hydrophobicity of the particle, although the most important in the flotation of the particles is their hydrophobicity.
Hydrodynamics of the wetting film. The behavior of the wetting film entrapped between the bubble and particle determines the induction time. The basic factors affecting its behavior are described hereafter. To understand better the most important flotation factors in the bubble–particle collision, the time of approach of a particle to the bubble’s surface from a distance of 1 μm to a distance of 0.02 μm is calculated [13]: The well-known equation of Stefan–Reynolds for film pressed by two parallel discs was applied:
V Re = 8 F z 3 π μ R f 4 h 3
where F z is the hydrodynamic random pushing force of the particle towards the bubble ( F z = F z h + F z c ), μ is the dynamic viscosity of the water, R f is the radius of the wetting film, and h is the thickness of the wetting film, which is the distance between the particle and the contact area of the bubble. Equation (1) has another equivalent for containing the push force expressed as push pressure (difference between the capillary P σ and disjoining pressure Π ), which is often used in the interferometric studies of wetting films:
V Re = 8 h 3 3 π μ R f 2 ( P σ Π )
For simplicity, the effect of the disjoining pressures is neglected. It is considered only the hydrodynamic random and the capillary forces. This can be justified if the ionic strength is larger than 0.01 mol/L (screened electrostatic interaction) and the van der Waals interaction becomes significant at a thickness of less than 10 nm. As far as it is assumed a planar wetting film, the capillary force can be presented by:
F z c = 2 σ A / L R b π R f 2
The pushing force is a very important factor, so silica particles with radii in the range of 0.1 µm to 100 µm moving with a speed of 0.1 m/s and collision time of 1 ms are assumed. Bubbles with a radius R b = 200 µm are assumed as well.
DLVO surface forces in wetting film. To estimate the importance of the DLVO forces, a series of experiments by the interferometric setup of Scheludko-Exerowa [29] on draining wetting films on various minerals in water and in the presence of a collector and a frother are conducted. Of course, this experiment on wetting films on plates of minerals, pressed only by the capillary pressure, deviates significantly from the real picture of colliding particles and bubbles, but it indicates some important phenomena occurring during this collision.
The electrostatic disjoining pressure between bubble and particle at constant surface potential with equal signs of the potentials and super-position approximation [30] can be described by Equation (4):
Π e l = 64 c R T tanh ( F Ψ s 1 4 R T ) tanh ( F Ψ s 2 4 R T ) exp ( κ h )
where c is the electrolyte concentration (in the case of DI water c = 3 × 10 3 mol / m 3 due to the dissolved carbon dioxide), R is the gas constant, T is absolute temperature, F is the Faraday constant, h is the thickness of the wetting film (distance between the mineral surface and the bubble), κ = 2 F 2 c / ε ε 0 R g T is the Debye constant (in SI unit), ε and ε 0 are the static dielectric permittivities of water and free space, respectively, and Ψ s 1 and Ψ s 2 are the surface potentials of the bubble and the mineral surface, respectively. In the case of oppositely charged film surfaces, the electrostatic disjoining pressure can be described by [30]:
Π e l = ε ε 0 κ 2 2 π 2 Ψ s 1 Ψ s 2 cosh ( κ h ) ( Ψ s 1 2 + Ψ s 2 2 ) sinh 2 ( κ h )
The van der Waals disjoining pressure, Π v d W ,as a function of the film thickness, h, for both the non-retarded and retarded regimes can be described as:
Π v d W = A ( h , κ ) 6 π h 3 + 1 12 π h 2 d A ( h , κ ) d h
where A(h,κ) is the Hamaker-Lifshitz function, which depends on the film thickness and the Debye constant, κ, due to the electromagnetic retardation effect and is described as:
A ( h , κ ) 132 = 3 k B T 4 ( 1 + 2 κ h ) e 2 κ h + 3 ω 16 2 ( n 1 2 n 3 2 ) ( n 2 2 n 3 2 ) ( n 1 2 n 2 2 ) { I 2 ( h ) n 2 2 + n 3 2 I 1 ( h ) n 1 2 + n 3 2 }
I j ( h ) = [ 1 + ( h λ i ) q ] 1 q
λ i = 2 2 c ω π 1 n 3 2 ( n i 2 + n 3 2 )
where = 1.055 × 10⁻³⁴ Js/rad is the Planck constant (divided by 2π), ω is the absorption frequency in the UV region (around 2.068 × 10¹⁶ rad/s for water), n 1 , n 2 , and n 3 are the refractive indices of the air and mineral and the water: n 1 2 = 1 for air, n 3 2 = 1.887 for water, n 2 2 = 2.28 for magnesite ( n 2 2 = 2.359 for crystalline quartz), c = 3 × 10 8 m/s is the speed of light in free space, and q = 1.185, λ 1 and λ 2 are characteristic wavelengths of the air/water and the water/solid surfaces of the wetting film, respectively.
Formation of three-phase contact line (TPCL). The above-mentioned features of the wetting film entrapped between the bubble and the particle regard only the rate of approach of the particle toward the bubble, but not the physical reason for the film rupture. Ref. [19] reports on a thermodynamical criterion for the formation of TPCL between the bubble and the particle. Hence, according to ref. [19], the particle should have a certain minimal level of penetration across the wetting film into the bubble to break the latter one. Figure 2 shows a sketch of a spherical particle with radius R. It penetrates into a bubble and forms a three-phase contact line (TPCL) with radius r . The central angle α defines the level of penetration of the particle regarding the surface of the bubble. In addition, it is also the angle between the center of the particle and the radius of the TPCL. The angle β is the angle between the tangent of the sphere regarding the radius of the particle at the very point of the TPCL and the vertical line. The angle θ R is the contact angle of the particle at the point of the TPCL.
The critical level of penetration for the formation of TPCL, expressed by the central angle αc is described by Equation (10):
t g α c = k R σ A / L ( 1 cos θ )
where σ A / L is the surface tension of the air/liquid interface, k is the line tension of TPCL, and θ is the contact angle of a small water droplet on a flat plate of the mineral. One can see that at larger contact angles θ (more hydrophobic particles), the critical central angle α c required for the formation of TPCL is smaller. In other words, more hydrophobic particles are easier to form TPCL. The penetration of the particle into the bubble is related to the overcoming of certain resistance forces:
f c = 2 π R σ L / A 1 + [ R σ L / A k ( 1 cos θ ) ] 2
If the normal projection of the random hydrodynamic push force is larger than the critical resistance force for the formation of TPCL, as shown in Equation (11), the wetting film should rupture and the particle should attach to the bubble. The more hydrophobic particles should have lower critical resistance for the formation of TPCL, and vice versa. The critical questions raised here are: (i) Is this the only mechanism for the formation of TPCL or there exist other additional factors making the wetting film rupture? (ii) How long is the thin film supposed to drain before rupturing of the film, and is this time larger or smaller than the contact time between the bubble and the particle? It is well-known that the contact time is in the order of milliseconds. Is the wetting film able to drain sufficiently for less than one millisecond? As mentioned above, the capillary theory of Scheludko et al. [19] considers the wetting film between the bubble and the particle as a membrane. Hence, according to this theory, the drainage of the wetting film is not an important factor, but the only important factor is the sufficient deformation of the bubble in its contact area with the particle (level of penetration into the bubble across the wetting film, observed here is membrane). It is important to know if this is the real picture of bubble-particle attachment and if the drainage of the wetting film has any impact.

3. Materials

Reagents. The following reagents, all of them being analytical grade, were used:
Chemicals from Sigma–Aldrich, St. Louis, MO, USA:
  • Hexamethyldisilazane;
  • Hexylamine;
  • Disodium dodecyl phosphate;
  • Disodium hydroxi phosphate;
  • Dodecylammonium chloride;
  • Hydrochloric acid;
  • Acetone;
  • Ethanol;
Chemicals from BASF, Ludwigshafen, Germany:
9.
Methyl isobutyl carbinol (MIBC).
The deionized water was produced by a water purification system (Pure Option, Elga Labwaters, High Wycombe, UK).
Minerals. The following high-purity polished crystal plates (2 mm × 2 mm), kindly delivered by Helmholtz-Zentrum Dresden-Rossendorf (HZDR), were used:
  • Quartz (SiO2);
  • Magnesite (MgCO3);
  • Calcite (CaCO3);
  • Fluorite (CaF2);
  • Pyrite (FeS2);
  • Chalcopyrite (CuFeS2).
Mineral particles. The following mineral particles were used:
Particles from Sigma–Aldrich:
  • Silica particles (SiO2, −10 μm);
  • Silica particles (SiO2, −38 µm + 20 µm);
  • Magnesite particles (MgCO3, −10 μm).
Particles from Unimin Australia Ltd.:
4.
Graded silica 100 G.
Particles from Grecian Magnesite, Greece:
5.
Kerma 90-45 Magnesite mineral particles (89.61% MgCO3 and 6.36% SiO2); d90, d50, and d10 values of the sample were determined as 29.09, 6.65, and 0.75 µm, respectively.
6.
Steriles MS—45 Gangue mineral particles (33.26% MgCO3 and 41.22% SiO2); d90, d50, and d10 values of the sample were determined as 28.06, 7.25, and 0.96, respectively.
Steriles MS—45 is the richest of SiO2 as compared to Kerma 90-45. For this reason, it is considered a gangue mineral. Kerma 90-45 contains a significant amount of MgCO3. One can see that the mineral particles are fine and suitable for studying the principles of fine particle flotation.

4. Experimental Techniques and Procedures

Interferometry of thin wetting films and surface forces. The interaction between a bubble and solid surface (particle) can be studied employing interferometry within the thin liquid film setup of Scheludko-Exerowa [20,21,29].
Figure 3 presents the interferometric setup of Scheludko-Exerowa [29]. Typically this setup is used for studying foam and emulsion film, but it can be adjusted for wetting films on opaque mineral surfaces, as (see Figure 3) [31]. The experiment on the wetting films was performed at T = 20 °C. The experimental setup consists of a glass cell for formation of wetting films. Initially, a water droplet was positioned into the film holder. Moreover, a piece of the mineral (square of 2 mm × 2 mm) was positioned on the top of the film holder as (see Figure 3). A certain amount of liquid was pumped out by means of a micro-syringe, thus forming a wetting film between the mineral and the apex of the water droplet. The film was illuminated vertically by means of metallurgical inverted microscope (model IX 51, Olympus Corporation, Japan), whose reflection causes interference fringes (the Newton rings) in polychromatic light. The evolution of the film in form of dynamic interferogram was captured by a CCD camera and transferred to a computer. It was furthermore stored as a movie for the next processing. The frames of the movie were extracted by means of Irfan view software. The frames of each movie were processed by means of the free-of-charge “Image J” software (National Institutes of Health and the Laboratory for Optical and Computational Instrumentation (LOCI, University of Wisconsin, USA). They were filtrated digitally with a green filter (λ = 547 nm). The pixel signal from selected small areas of the interference patterns of the film throughout all the frames was derived. The film radii were measured as well. The film thickness was calculated with an average deviation in the range of ±2 nm. In this way the evolution of the wetting films with time was derived. An alternative option is to derive the thickness of the film along a certain line throughout the interferogram. Figure 4 shows an example of an interferogram with many parallel lines, allowing us to calculate the thickness profile of each one of them followed by assembling them in 3D diagrams of the wetting film.
The film thickness was calculated by means of the following interferometric equation (Equation (12)):
h = λ 2 π n 2 [ l π ± arcsin Δ ( 1 + r 12 r 23 ) 2 ( 1 r 12 r 23 ) 2 + 4 r 12 r 23 Δ ]
where r 12 = ( n 2 n 1 ) / ( n 2 + n 1 ) and r 23 = ( n 2 n 3 ) / ( n 2 + n 3 ) are Fresnel reflection coefficients with the refractive indexes of air ( n 1 ), water ( n 2 ), and mineral ( n 3 ), λ = 547 nm is the wavelength of the green light, l is the order of interference, Δ = ( I I min ) / ( I max I min ) , I is the instantaneous intensity of the derived signal by means of Image J, I min and I max are its minimum and maximum, respectively. The sign “ ± ” in Equation (12) is related to the part of the order of interference, because each order of interference (excluding zero order) consists of two parts.

Flotation Experiments

Micro-flotation experiments: A Hallimond tube was used as a flotation cell. The particles meant for floating were conditioned preliminary, particularly for every specific case. The suspensions were with concentration 1 wt.%. After the conditioning, 90 mL of the suspension was transferred into the flotation cell and the flotation test began immediately. Nitrogen with a flux in the range of 0.2–0.3 L/min was sparged into the flotation cell, whose porous frit was with 16 μm average size of the pores. The flotation time was selected to be 2 min. After that, the concentrates and the tailings were dried, weighted, and delivered for thermo-gravimetrical analysis in the cases where this was needed.
Conventional flotation experiments: The silica particles (graded silica 100 G) were wet sieved to 20 μm. So, −20 μm fraction for the experiment was produced. The particles were purified by soaking for 24 h in a 1:10 solution of HCl, which was decanted. After this the particles were dispersed in deionized (DI) water and decanted afterwards, and this was repeated until reaching the pH = 5.8 (the intrinsic pH). Denver flotation cell was used for the flotation experiments [32]. It was approx. 3.5 L and equipped with a deflector block. As beginning, DI water was added into the cell, and the slurry of 1% w/w was added and conditioned with the impeller with a speed of 1000 rpm. Then, the collector hexylamine was added into the suspension at a concentration of 0.05 mol/L and the slurry was conditioned for 10 min. The pH thus obtained was pH = 11.82. The froth depth during the flotation experiment was maintained at 20 mm while the superficial gas velocity (Jg) was set to 0.5 cm/s. The scrapping rate [33] was once of 5 s. The products were collected at different times within a period of 240 s. The concentrates and the tailings were dried and weighed for further analysis.
Bubble–particle attachment time measurements. The way in which the particles attach to the bubble is very important for flotation performance. As far as the contact angle defines the hydrophobicity of the particles, the bubble-particle attachment time gives us the time required for the particle to attach to the bubble. It can be conducted in the mineral’s intrinsic state or in presence of surfactant. Such experimental results are important to understand the overall picture of the flotation. The shorter the bubble attachment time, the higher the flotation recovery is. In addition, the hydrophobicity of minerals can be studied by this method. Generally, the interaction between bubble and particle occur in three independent steps: (i) a collision between particle and bubble (Step 1), (ii) attachment of the particles to the bubble (Step 2), and (iii) the stability of bubble-particle aggregate (Step 3). A sketch of the bubble attachment time setup is also presented in Figure 5. It consists of: (i) force sensor head; (ii) a long-distance working lens; (iii) and CCD camera; (iv)a micro-translation stage; (v) an illuminator; and (vi) computer. The interactions between the bubbles and particles within the real flotation are based on the bubble-particle attachment time (induction time). Furthermore, the effect of the physical parameters (particle size, bubble size, pH, temperature) on the bubble-particle attachment time should be investigated as well [34,35,36].
In fact, the “bubble-particle attachment time” measurement provides the minimum time required for the particle to attach to the bubble. The bubble-particle attachment time experiments were carried out with BCT-100 (Bratton Engineering and Technical Associates, LLC, USA) bubble-particle attachment time measurement unit. It is possible to produce bubbles of different sizes by means of specially selected capillary tubes with sizes of about 2, 1, and 0.5 mm. The experiments are conducted in the following way: A bubble with a 2 mm radius is first created using a micro-syringe followed by adjustment of the distance to the particulate bottom of the cell. After this, the capillary tube with the bubble on its top is shot toward the particulate bottom and held there for a certain time (ms), followed by fast detaching from the bottom. After this, the attached particles on the bubble surface are observed. Every experiment is repeated at least 20 times in different parts of the particulate bed. After this, the observations are converted to graphs, and the time needed for 50% attachment time is determined as the bubble-particle attachment time [37].
Procedures for manipulation of the surface properties of the minerals. The hydrophobicity and the surface potential of the mineral particles are very important for their capturing by the bubbles. The first one is responsible for the emergence of cavitation and breaking of the wetting films entrapped between the bubbles and the mineral particles, while the second one affects the speed of thinning of the wetting films. As far as the fine particles suffer from a lack of sufficient momentum during their collisions with the bubbles, they should be maximally hydrophobic and electrostatically attracted to the bubbles. For this reason, a goal to search for different ways to manipulate the surface properties of the particles was set.
Hydrophobization of fine silica particles. A well-known procedure for hydrophobization of glass slides [31,38] was applied to fine silica particles. The particles were not cleaned preliminary just to approach the industrial conditions. The method consists of exposure of the particles to vapors of hexamethyldisilazane in a desiccator for about 30 h.
The hydrophobization of the silica particles is realized by means of a chemical reaction between the collector hexamethyldisilazane and the surface Si−OH groups of the silica particles (see Figure 6). One can see that this procedure is a dry conditioning with the vapors of the collector. It causes significant hydrophobization of the silica particles from a contact angle value ≈ 30° to a contact angle value ≈ 95°.
Hydrophobization of fine magnesite particles. Disodium dodecyl phosphate (C12H25PO4Na2) was chosen as a collector. This collector is difficult to dissolve in water, but at 60° and under intensive stirring it dissolves. The critical micelle concentration (CMC) of this collector is 2.9 mmol/L, which corresponds to a surface tension of 22 mN/m [39]. Then, 3 mmol/L of this collector as an operating concentration was chosen with 2 h of conditioning. The magnesite particles were added into the thus-prepared solution and additionally conditioned for one hour. Similar to the hydrophobization of the silica particles, the hydrophobization of the magnesite particles is conducted again by means of a chemical reaction (see Figure 7). This causes increasing of the contact angle value from contact angle ≈ 40° to contact angle value ≈ 95°.
The surface tension isotherm of disodium dodecyl phosphate (C12H25PO4Na2) at T = 60° C is presented in Figure 8 [39]. Such a low value of the surface tension should cause huge Gibbs elasticity and consequently very stable foam, but there should exist a high level of adsorption of the collector on the magnesite particles, thus making them very hydrophobic. The latter is very possible to break the foam, so 5 × 10⁻⁴ mol/L (50 ppm) MIBC was added to achieve better froth stability.
Procedure for production of pH—sensitive silica particles. A well-known procedure [40] for the user-defined adjustment of the isoelectric point (IEP) of minerals covered with OH groups was applied to fine silica particles. The procedure is described in detail in the literature [40]. The idea of the method is to cover the surface of the particles with amino-groups. The latter shifts significantly the iep of the silica particles from pH ≈ 2.5 to ≈9.2. The modification is conducted by means of a chemical reaction between the amino–3–methoxy silane (APTMS) and the hydroxyl groups covering the surface of the silica particles as depicted in Figure 9.
The zeta potential of the modified silica particles versus pH was measured by means of a zeta sizer and the iep was found to be pH = 9.6. At pH = 6, the zeta potential of the silica particles is about 60 mV, while at the same pH, the zeta potential value of the bubbles is about −65 mV. This should correspond to strong electrostatic attraction between the bubbles and the silica particles, especially at low ionic strength. The question here is if only the electrostatic attraction with a complete absence of cavitation (the particles are hydrophilic) can produce high flotation yield.
Zeta potential measurements. The zeta potential measurements of the particles were carried out using ZetaSizer (Malvern Panalytical Ltd., Malvern, UK) at 1 wt.% solids ratio. Thus, data about the particle size and their zeta potential were obtained.
Contact angle measurements. The surface tension and contact angle measurements were carried out by means of an automatic tensiometer/goniometer (model 290, Ramé-Hart Instruments Co., Succasunna, NJ, USA). A small droplet of water (about 3 μL) was positioned into the plate using an automatically controlled dispenser by a computer. The image of the positioned droplet was captured by a camera and delivered to the computer. The image was processed by software of the setup and the contact angle was obtained by automatic solution of the equation of Young-Laplace.

5. Results and Discussion

Thin wetting film experiments. Our primary idea is to study the behavior of the wetting films, pressed by the capillary pressure, on the mineral surface. Of course, such a study on wetting films differs significantly from wetting films formed at the very clashing of bubbles and particles under high turbulence due to their strong push force. Nevertheless, such an experiment hints the mechanism of intrinsic rupture of the wetting film on the mineral surface. The first experiments were conducted with wetting films of DI water on different minerals.
Figure 10 and Table 1 present the average thickness (with average deviation) of film rupturing (Figure 10A) and the average lifetime (with average deviation) of wetting films (Figure 10B) versus the intrinsic average contact angles (with average deviation) of a small water droplet on quartz, magnesite, calcite, fluorite, pyrite, and chalcopyrite minerals.
One can see that:
  • The thickness of film rupturing and the film lifetime is always a random value scattered around a certain average value;
  • The wetting films on the most hydrophobic minerals (chalcopyrite and pyrite, θav > 75°) rupture at significantly high film thickness. It spans in the range of 320 nm to 470 nm. Wetting films on the less hydrophobic minerals (fluorite, calcite, magnesite) with 28° < θav < 75° rupture at significantly lower film thickness, which spans in the range of 14 nm to 170 nm. Wetting films on the least hydrophobic mineral (quartz, θav < 27.4°) are very long-living. They can live many hours. The lifetime of about 800 s was fixed, just to combine them with the other minerals in Figure 10B. It should be noted that the above-mentioned observations are made for the polished flat mineral surfaces. The particles with the contact angle > 40° (e.g., [41]) can float well, which means that their induction times are in the range of a few milliseconds. Of course, the critical value of contact angle, above which there is a sudden increase of the floatability, depends on the particular case, but in all of the particle–related cases this critical value is significantly less than 70°, which is valid for the flat mineral surface. This big difference between the observations on the flat mineral plates and real particles could be due to the surface roughness and surface irregularities of the particles. This is another important factor responsible for the capture of the particles by the bubbles. It is known that intrinsic silica (contact angle = 27.4° ± 7.4°) and magnesite (contact angle = 39.5° ± 2.5°) particles do not float. Evidently, their roughness and irregular shape do not contribute enough for their capturing by the bubbles.
  • The lifetime values of all of the wetting films on the minerals spanned in the range of 0.3 s to many hours.
The basic differences between the wetting films studied in the above-mentioned experiments and the ones in the bubble–particle real clash under high turbulence are the following:
  • The bubble in the interferometric measurement, imitated by a double concaved drop, has a radius of about 2 mm, while in most cases in the real flotation reactors, the bubble sizes are significantly less than 1 mm;
  • The mineral flat plate corresponds to a particle with no curvature, i.e., huge particle, significantly larger than the bubble, while in real flotation the particles are substantially smaller than the bubbles;
  • The only driving force pressing the wetting film to thin in the above experiment is the capillary force, which is significantly smaller than this one in the bubble-particle clash in the flotation due to the large size of the bubble. For comparison, in the real bubble-particle clash a random hydrodynamic force, pressing the particle toward the bubble, exists;
  • The high turbulence in the real flotation reactors with myriads of bubbles aerates the very suspension, which should increase the probability of cavitation of the dissolved air.
All of the above-mentioned comparisons shed light on the significant difference between the induction times in the real floatation of mineral particles and the average lifetimes of the wetting films in the interferometric experiments.
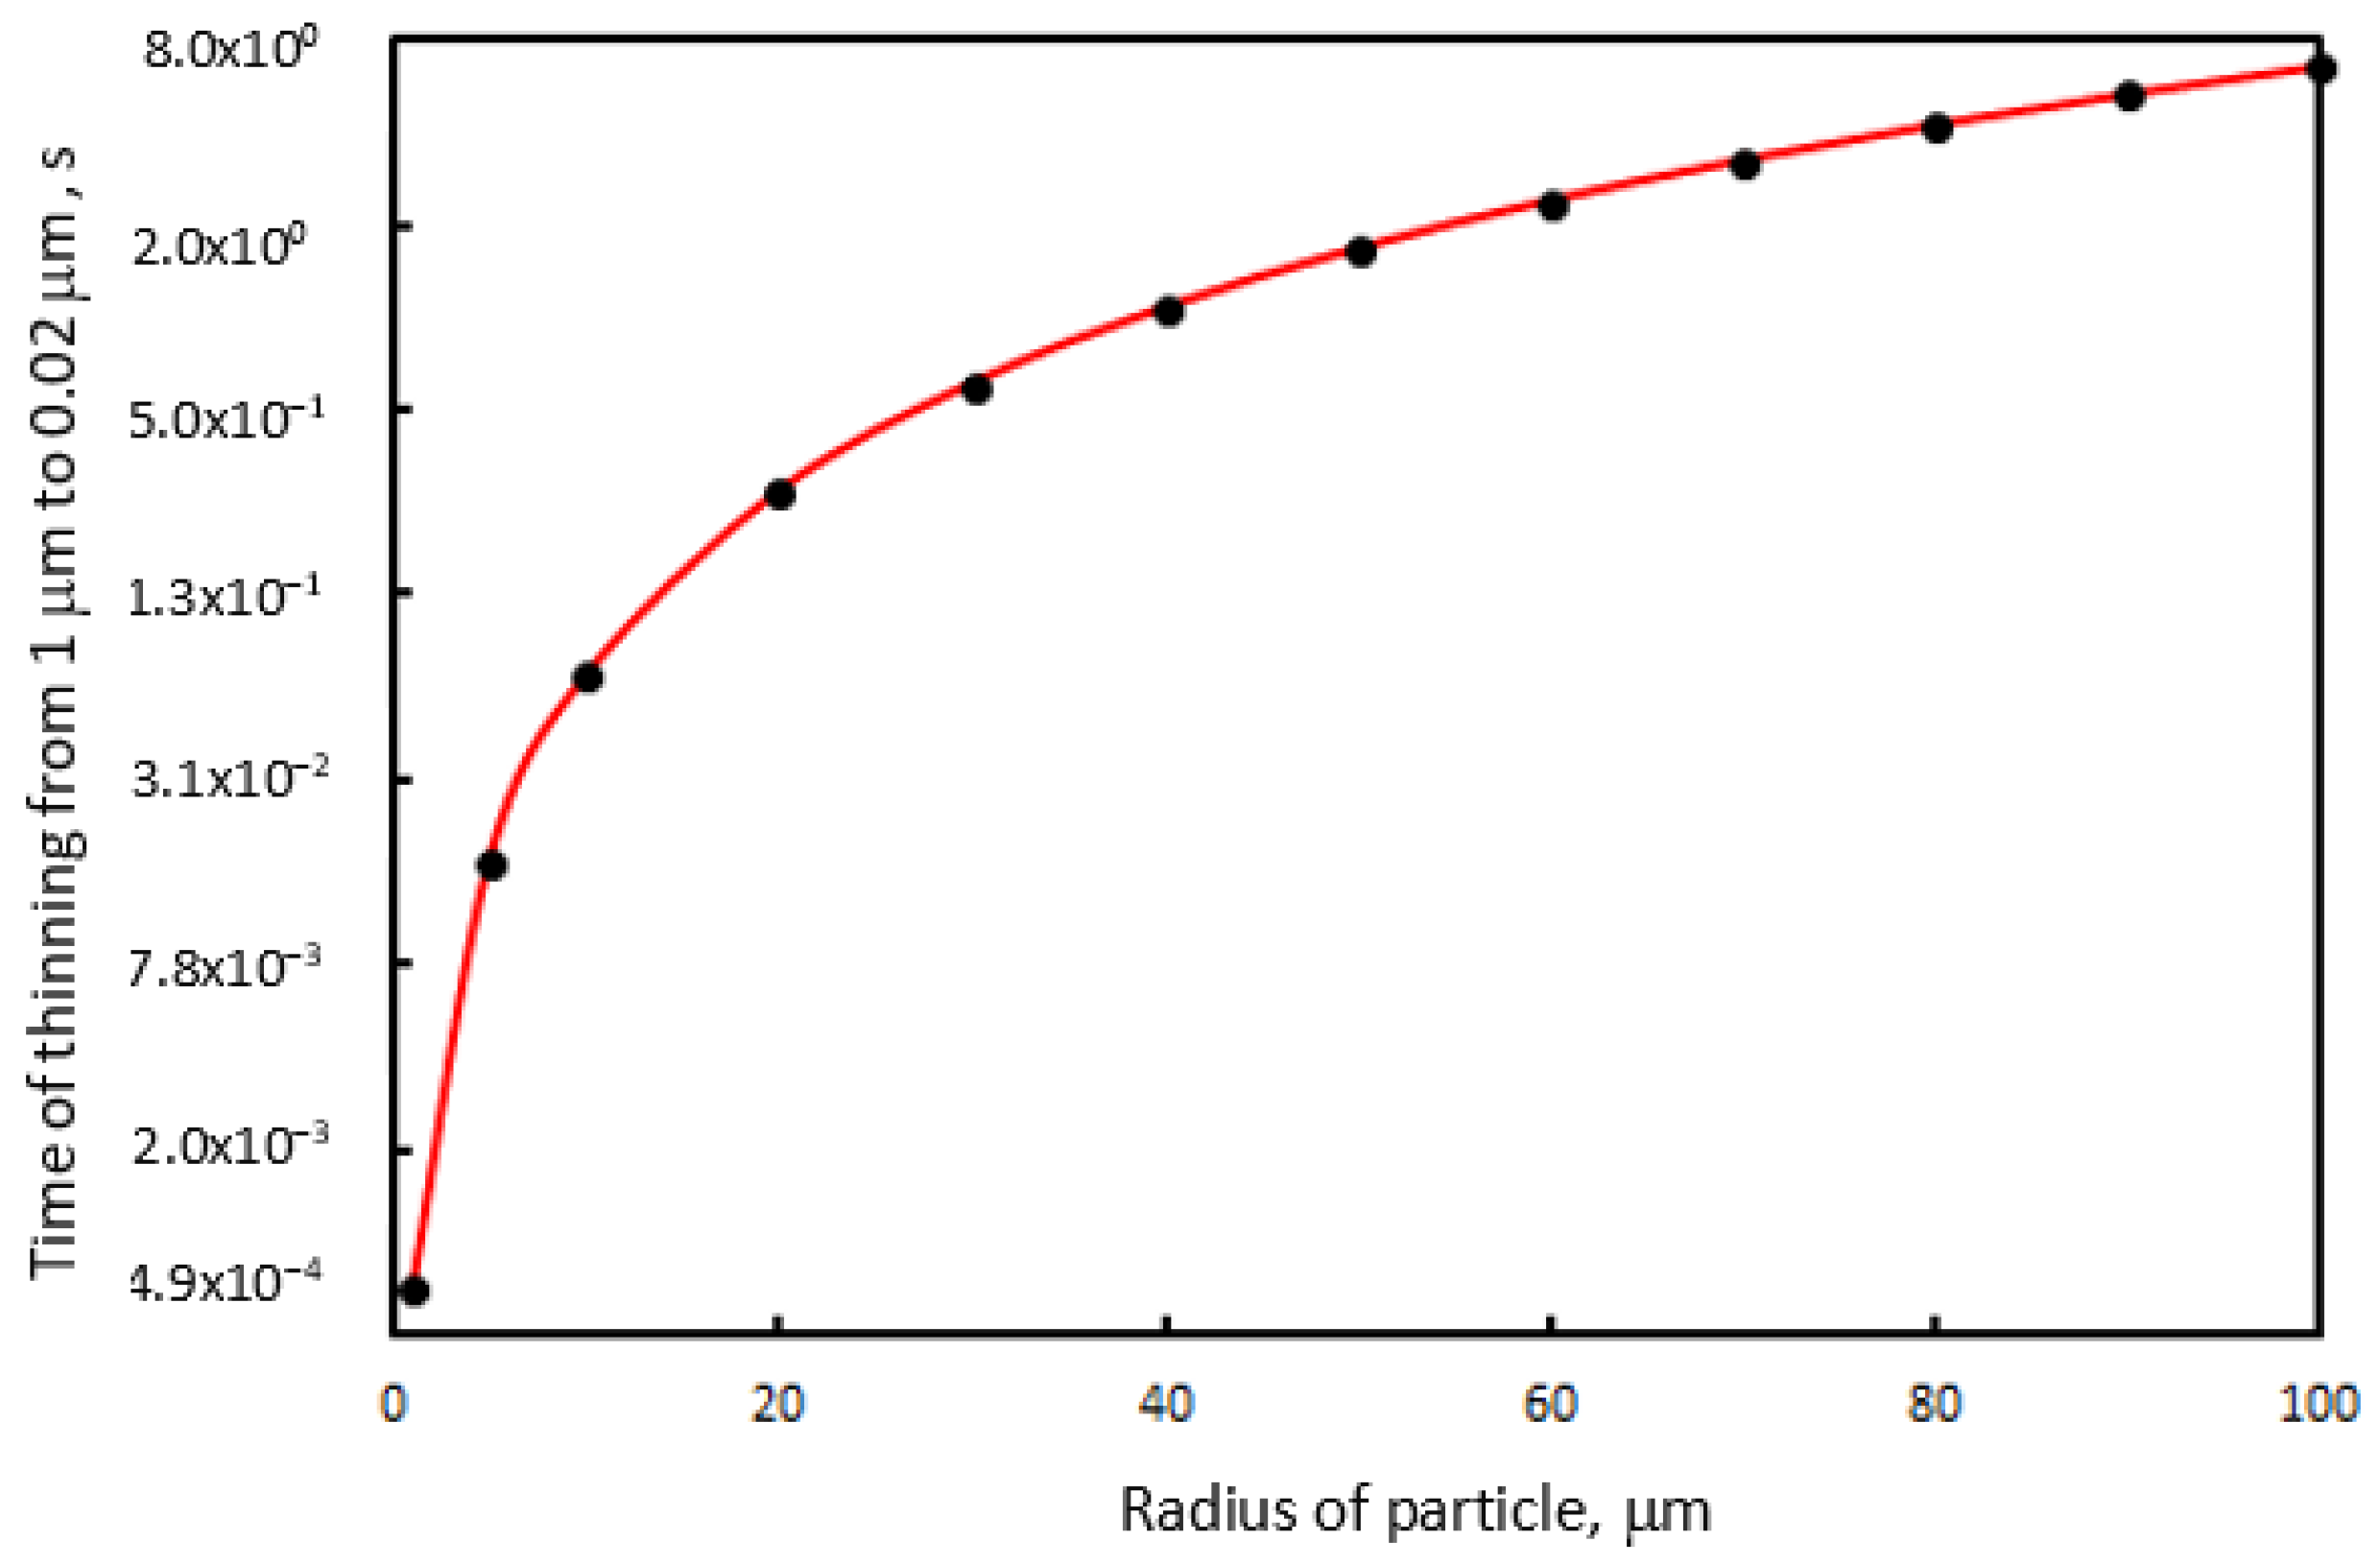
Figure 11 presents the calculations, carried out in ref. [13], on the time for thinning of a wetting film between a silica particle moving with 0.1 m/s and a bubble with a radius of 200 µm from a distance 1 µm to a distance of 0.02 µm from the contact area of the bubble vs. the radius of the particle [13]. One can see that only the fine particles approach the bubble with a speed commensurable with the contact time between the bubble and the particle during their encounter. Unfortunately, their momentum values are often insufficient to penetrate enough into the bubble to cause the formation of TPCL. The coarse particle, according to 
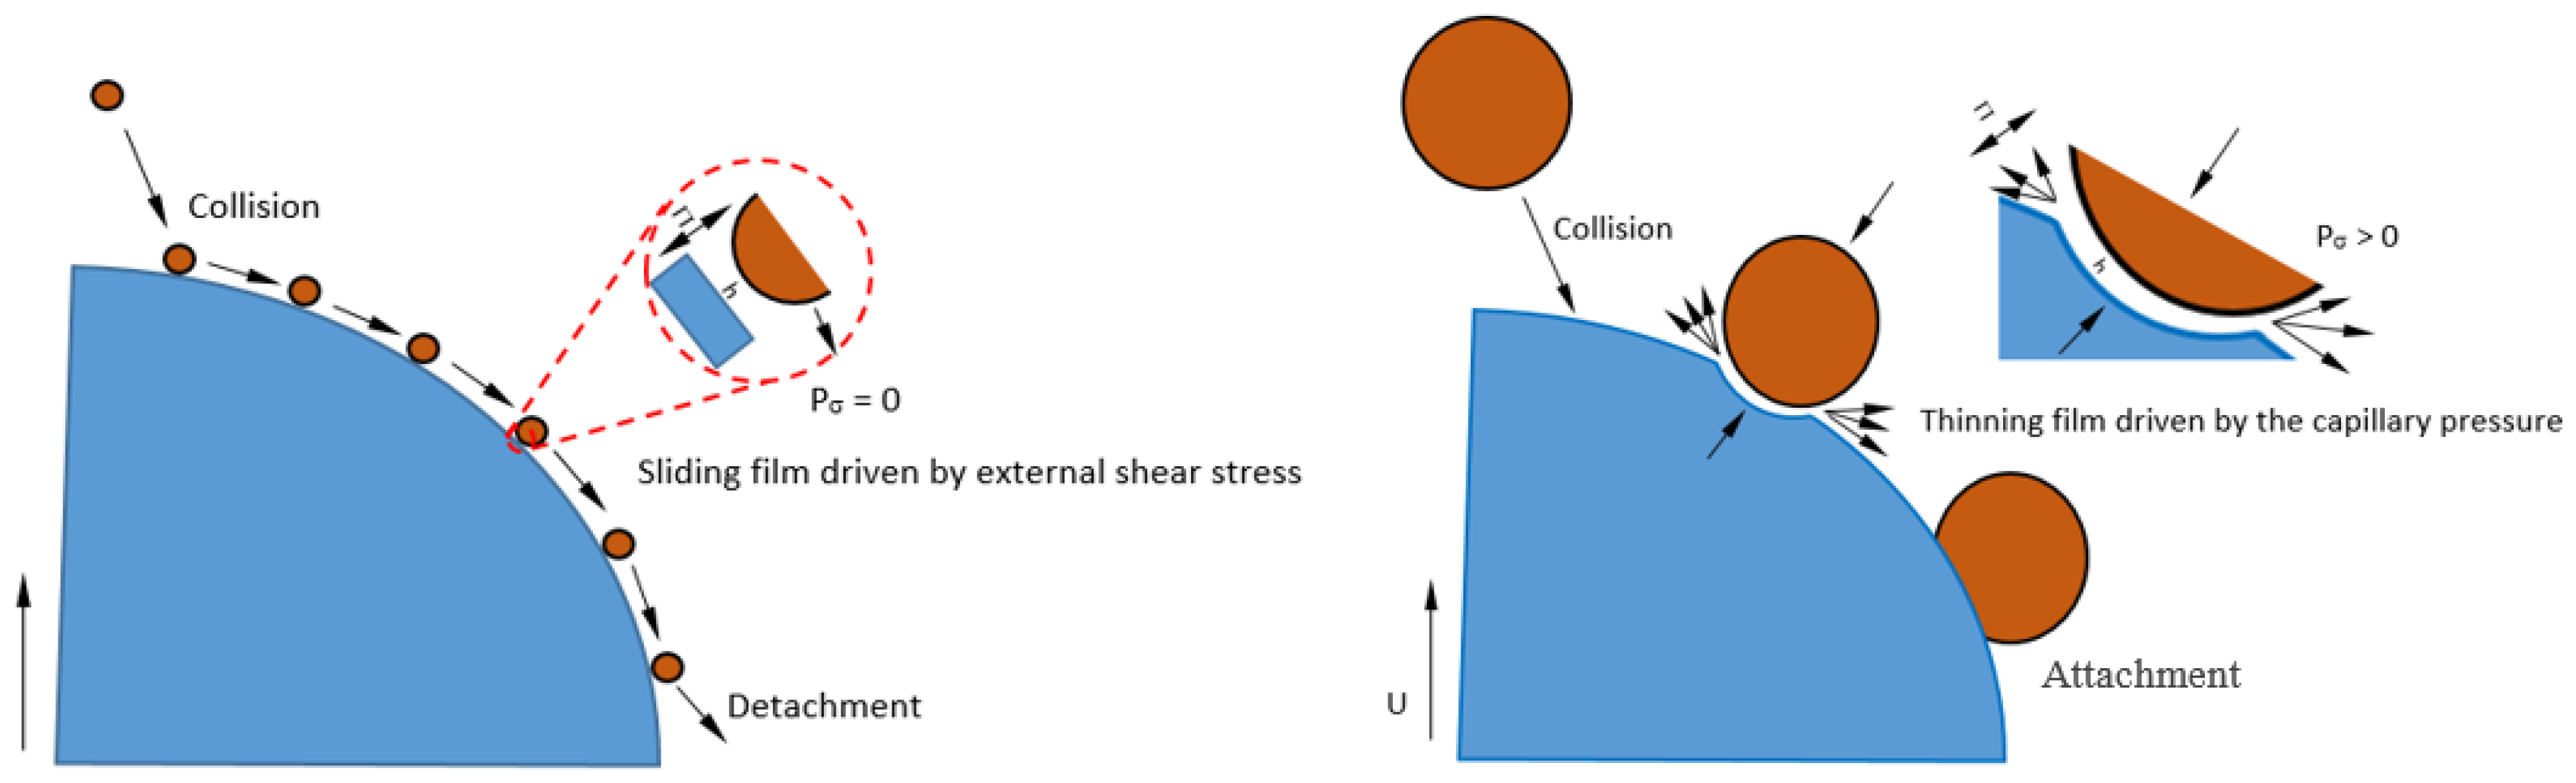
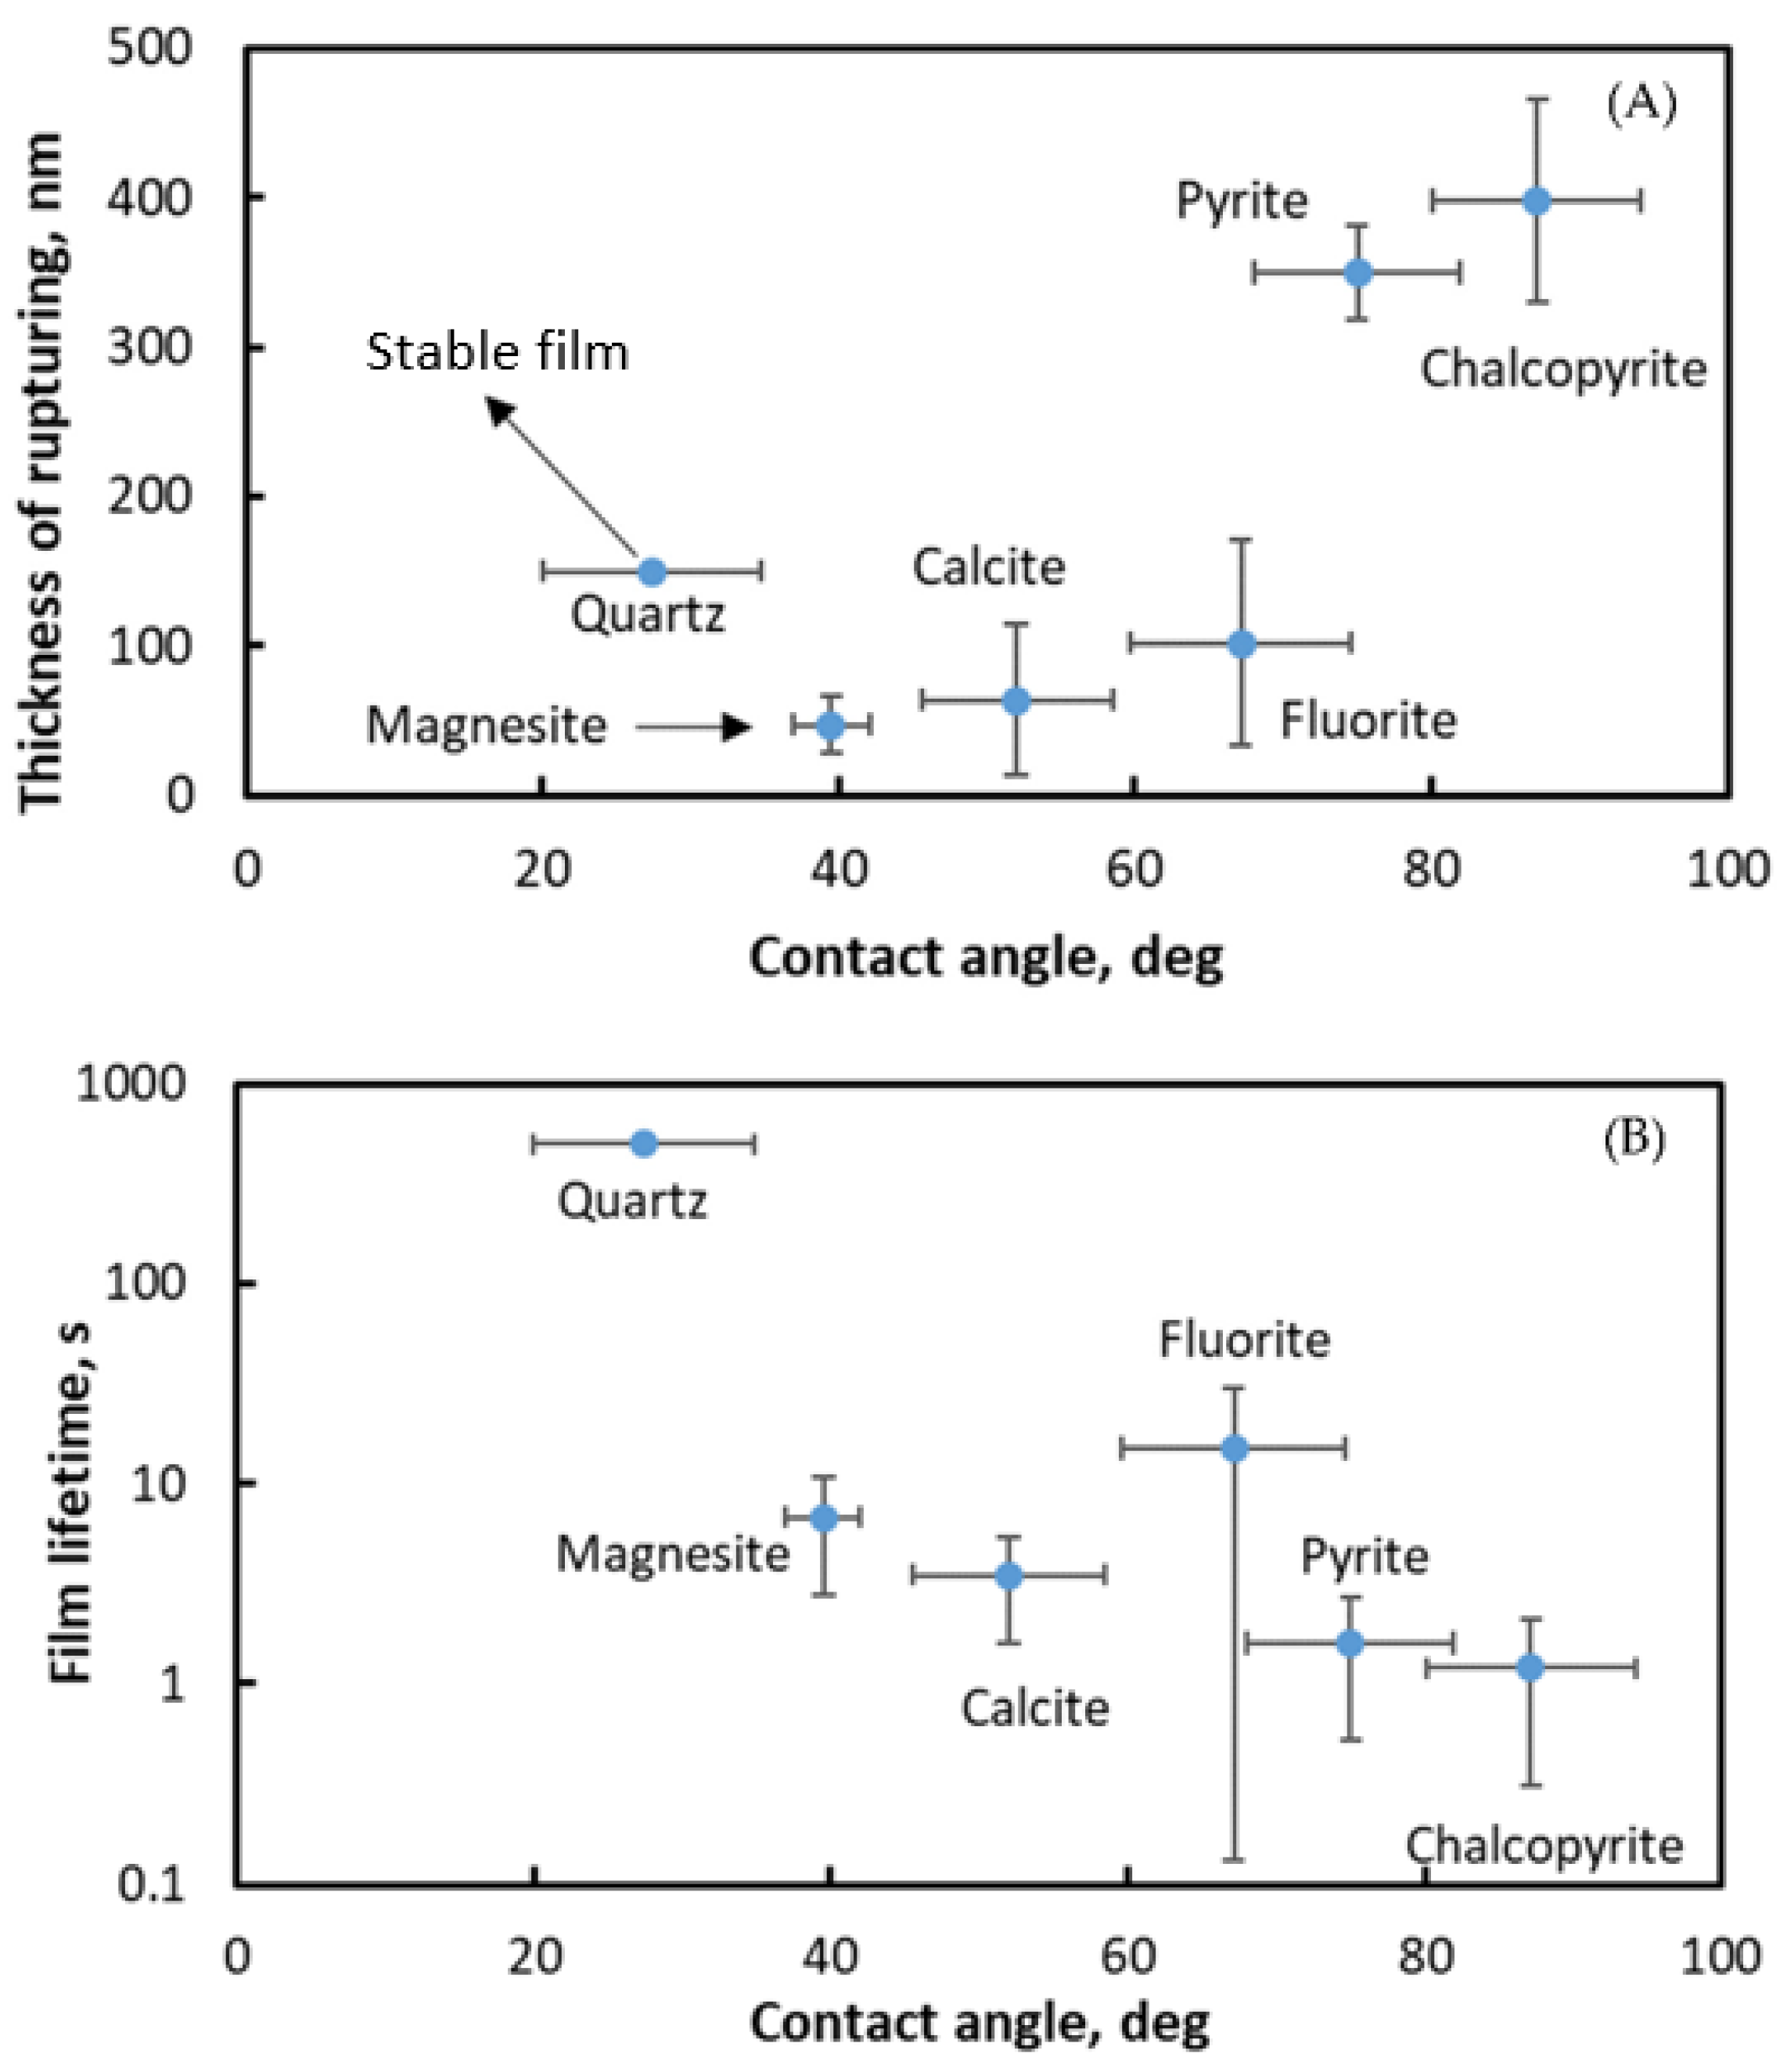
Figure 11, approaches the bubble significantly slower, thus requiring an induction time significantly larger than the contact time of the bubble–particle encounter. Hence, the drainage of the wetting films is not a significant factor in the bubble–particle encounter, but the rupture of the wetting film occurs due to the hydrophobicity of the particle. An interesting question here is the mechanism of film rupturing at such a high film thickness, as depicted in Figure 12 and Table 1. According to the capillary theory of Scheludko et al. [19], the sufficient penetration of the particle into the bubble across the wetting film induces nuclei of TPCL on the surface of the particle, which spontaneously aggregate and form TPCL. Nothing is mentioned about the origin of these nuclei or the mechanism of their aggregation on the surface of the particle. Nevertheless, it can be stated that in the interferometric experiments on flat mineral surfaces, there is no penetration into the bubble, only flattening of the film surfaces and related thin film inhomogeneities (e.g., formation of dimple). Evidently, this deformation of the bubble in contact with the flat surface can induce such nuclei, but as mentioned above, the very formation of TPCL depends on the hydrophobicity of the mineral. In our opinion, this mechanism is related to the dissolution of the air located in the bubble into the water. The smaller the bubble, the larger the rate of air dissolution. The dissolved air can form nuclei and precipitate on a hydrophobic surface. In addition, the deformation of the bubble due to the formation of this wetting film increases the pressure inside the bubble and consequently the rate of air dissolution. This is related to the primary speed of the approach of the particle towards the bubble. In our interferometric experiments, there is a large bubble, slowly approaching the surface of the mineral. So, it is no surprise that the precipitation of the dissolved air on the hydrophobic surface of the mineral takes more time in contrast with the real bubble-particle clash. Yet, it can be seen that such precipitation occurs even at high film thickness. Therefore, two factors are the most important for the flotation—(i) the hydrophobicity of the particles; and (ii) the pressing force of the particles toward the bubbles. Both of them are related to the formation of nuclei of the TPCL on the surface of the mineral. So, two basic factors are focused on here: (i) to cause additional push force between the two surfaces of the film by the selection of a collector able to make the bubble and the particles attract each other electrostatically; and (ii) to select a collector causing significant hydrophobization of the particles.
The air bubbles in DI water have zeta potential about ζ ≈ −65 mV ± 12 mV [42] and its iep is pH ≈ 4. Hence, an air bubble in DI water has surface potential Ψs ≈ −65 mV (pH = 5.8), while at pH = 4, Ψs ≈ 0 mV. It is important here to show the behavior of the wetting film from DI water on a quartz surface. The film thickness versus time of wetting film on quartz surface in DI water is presented in Figure 12. It is evident that the wetting film achieves equilibrium at about 150 nm. This is caused by the strong repulsion between the air/water interface and quartz surface, whose surface potential was calculated by means of these experimental data and the DLVO theory (Ψs ≈ −90 mV).
With pH = 4, it is known that the surface potential of the air bubble vanishes, so there should not be any electrostatic repulsion between the bubble and the quartz surface, but only dispersion repulsion between them should exist (see Figure 13). Shown in Figure 13 are the experimental and theoretical kinetic curves of thinning of wetting film on quartz in 10−4 mol/L MIBC at pH = 4. No electrostatic repulsion in the theoretical Equation (4) is imposed here, but only a van der Waals repulsion (Equations (6)–(9)). The coincidence between the theoretical and experimental curves is satisfactory. One can see that the film drained until about 30 nm, which appears to equilibrium thickness, due to the van der Waals repulsion between the quartz and the bubble.

Hexylamine—Collector Causing Electrostatic Bubble-Particle Attraction and Moderate Increase of Their Hydrophobicity

The quartz surface was treated with hexylamine C6H13NH2. The latter one hydrolyzes in water, making its pH value very alkaline (pH = 11.2):
C 6 H 13 NH 2 + H 2 O   C 6 H 13 NH 3 + + OH
The surface—active cations, shown in Equation (13), should adsorb on both the quartz surface and the bubbles. The quartz plate was treated as follows: Firstly, it was cleaned with acetone and ethanol and rubbed with a special tissue. After this, it was soaked in 0.05 mol/L aqueous solution of hexylamine for 24 h under stirring with a magnetic bar. After this, the plate was flushed with DI water and dried. After this, a wetting film of DI water on the thus processed plate was studied by means of the above-described interferometric method.
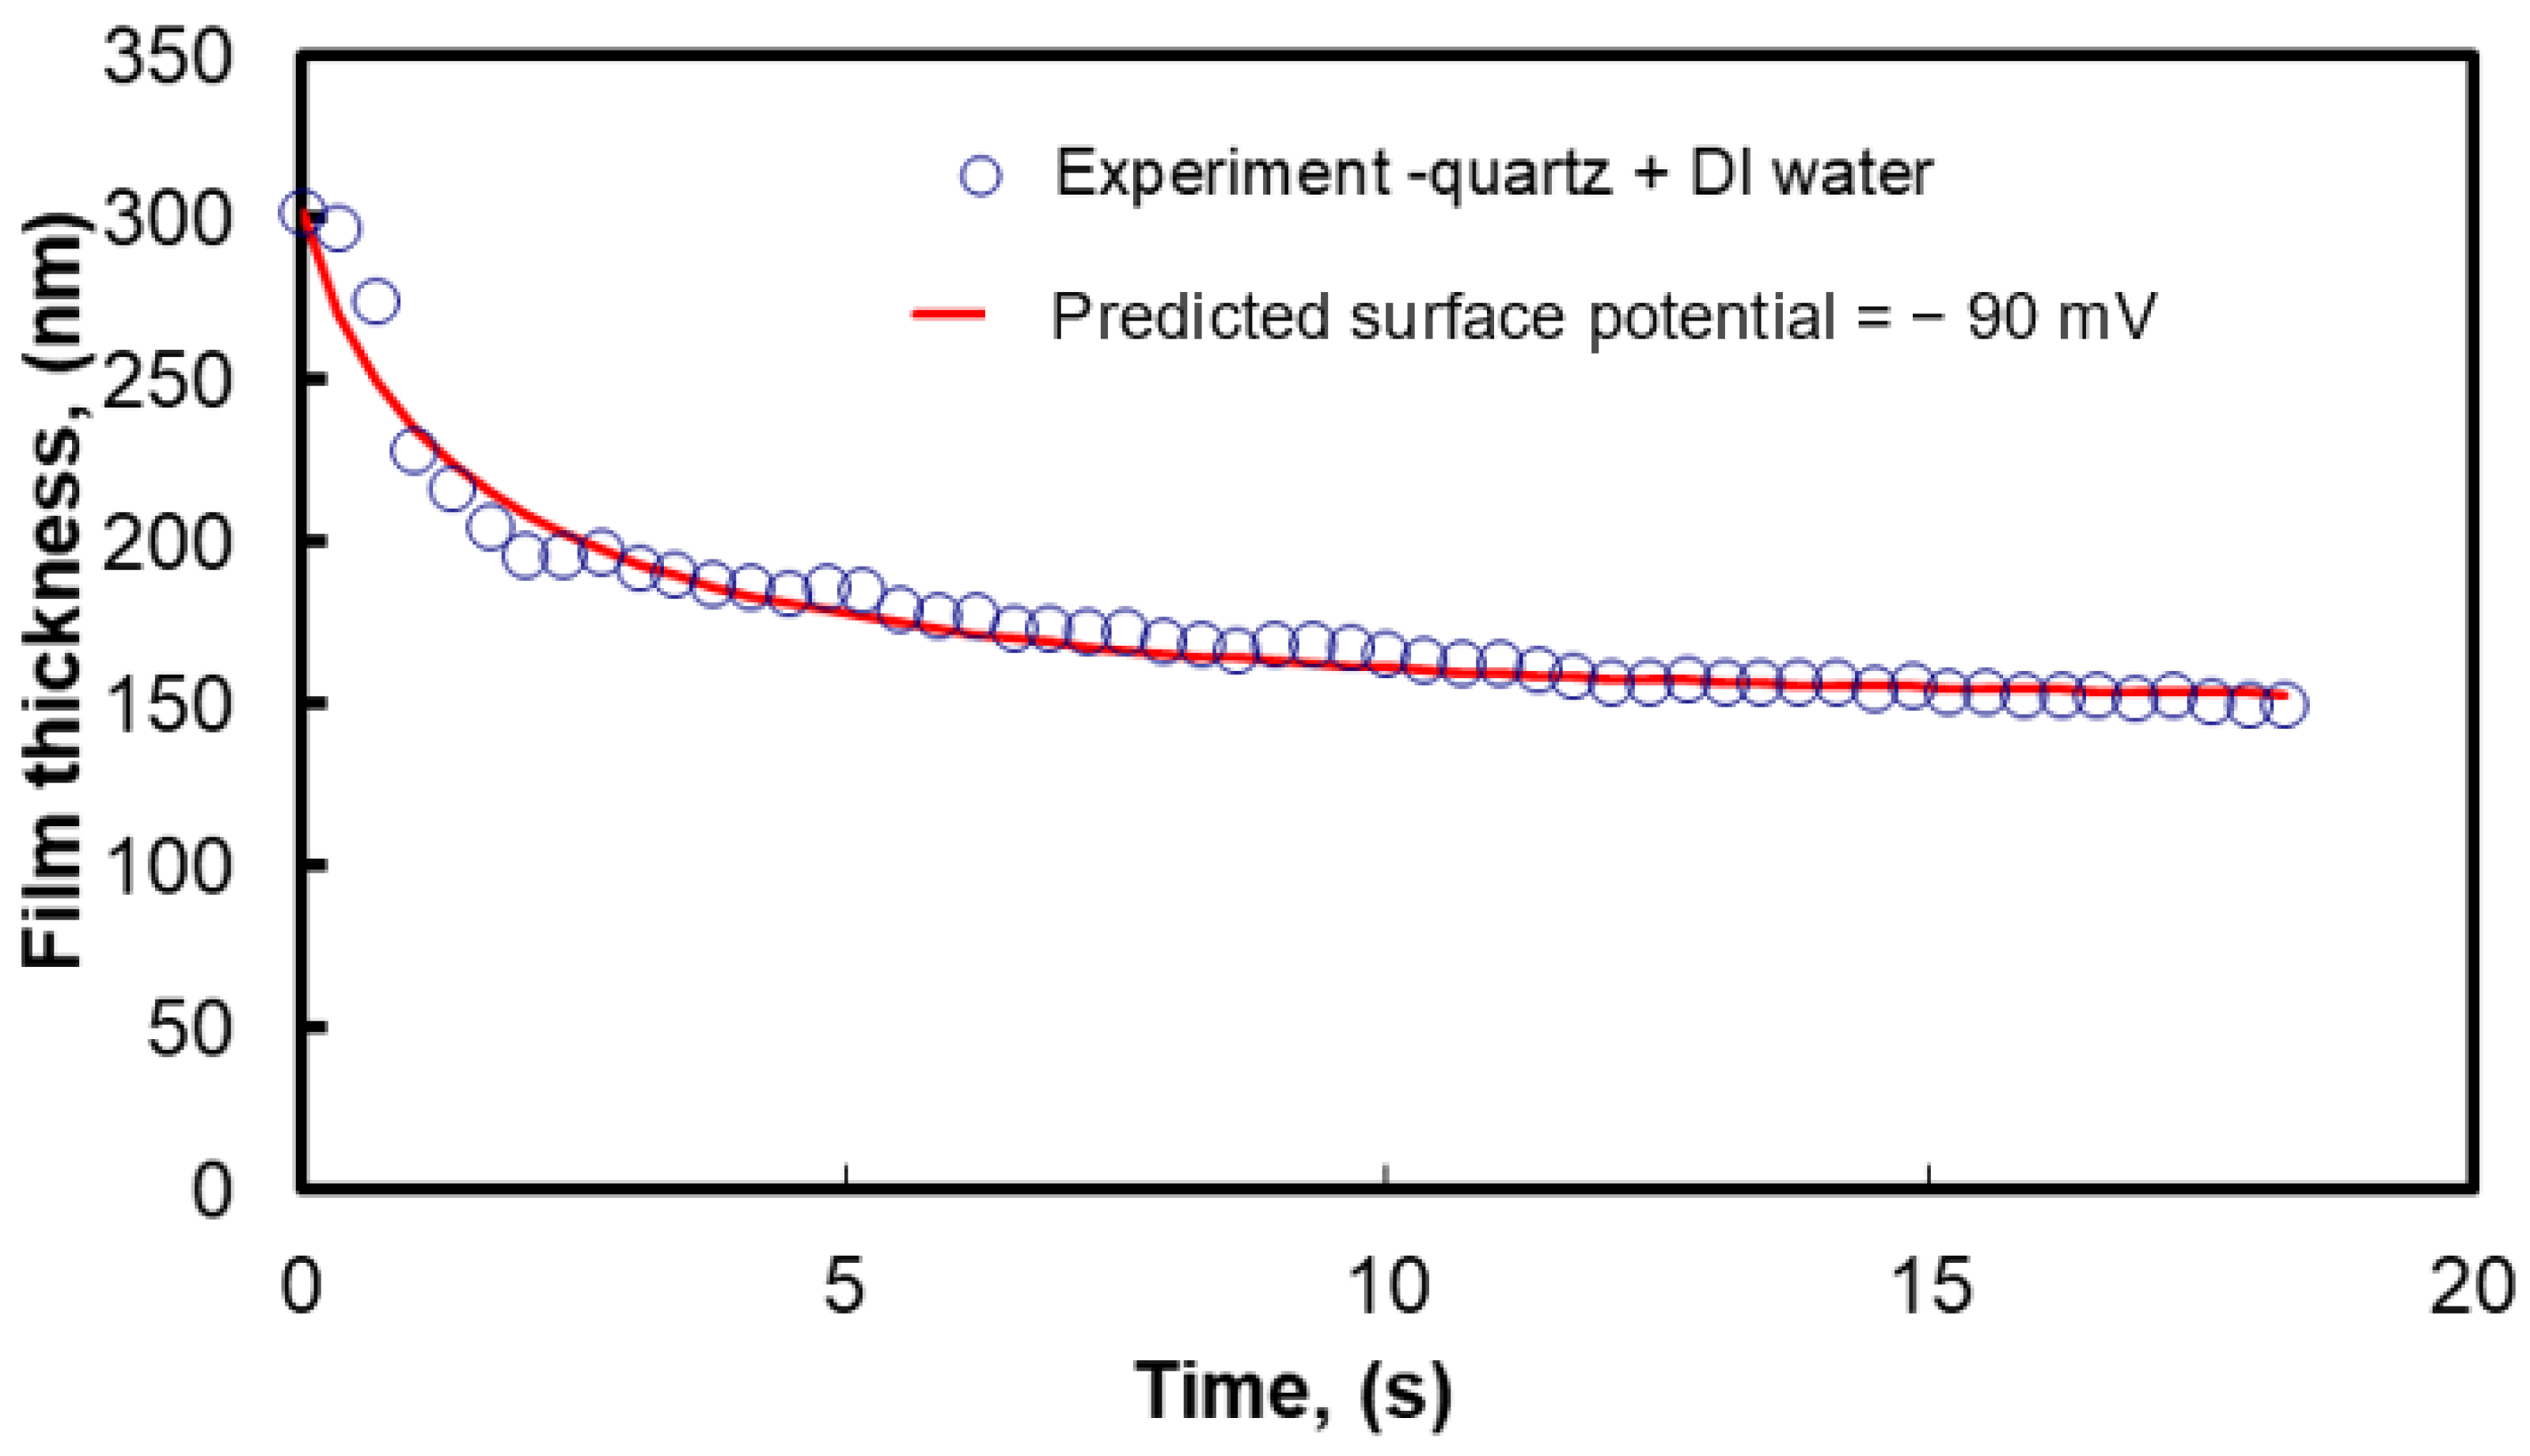
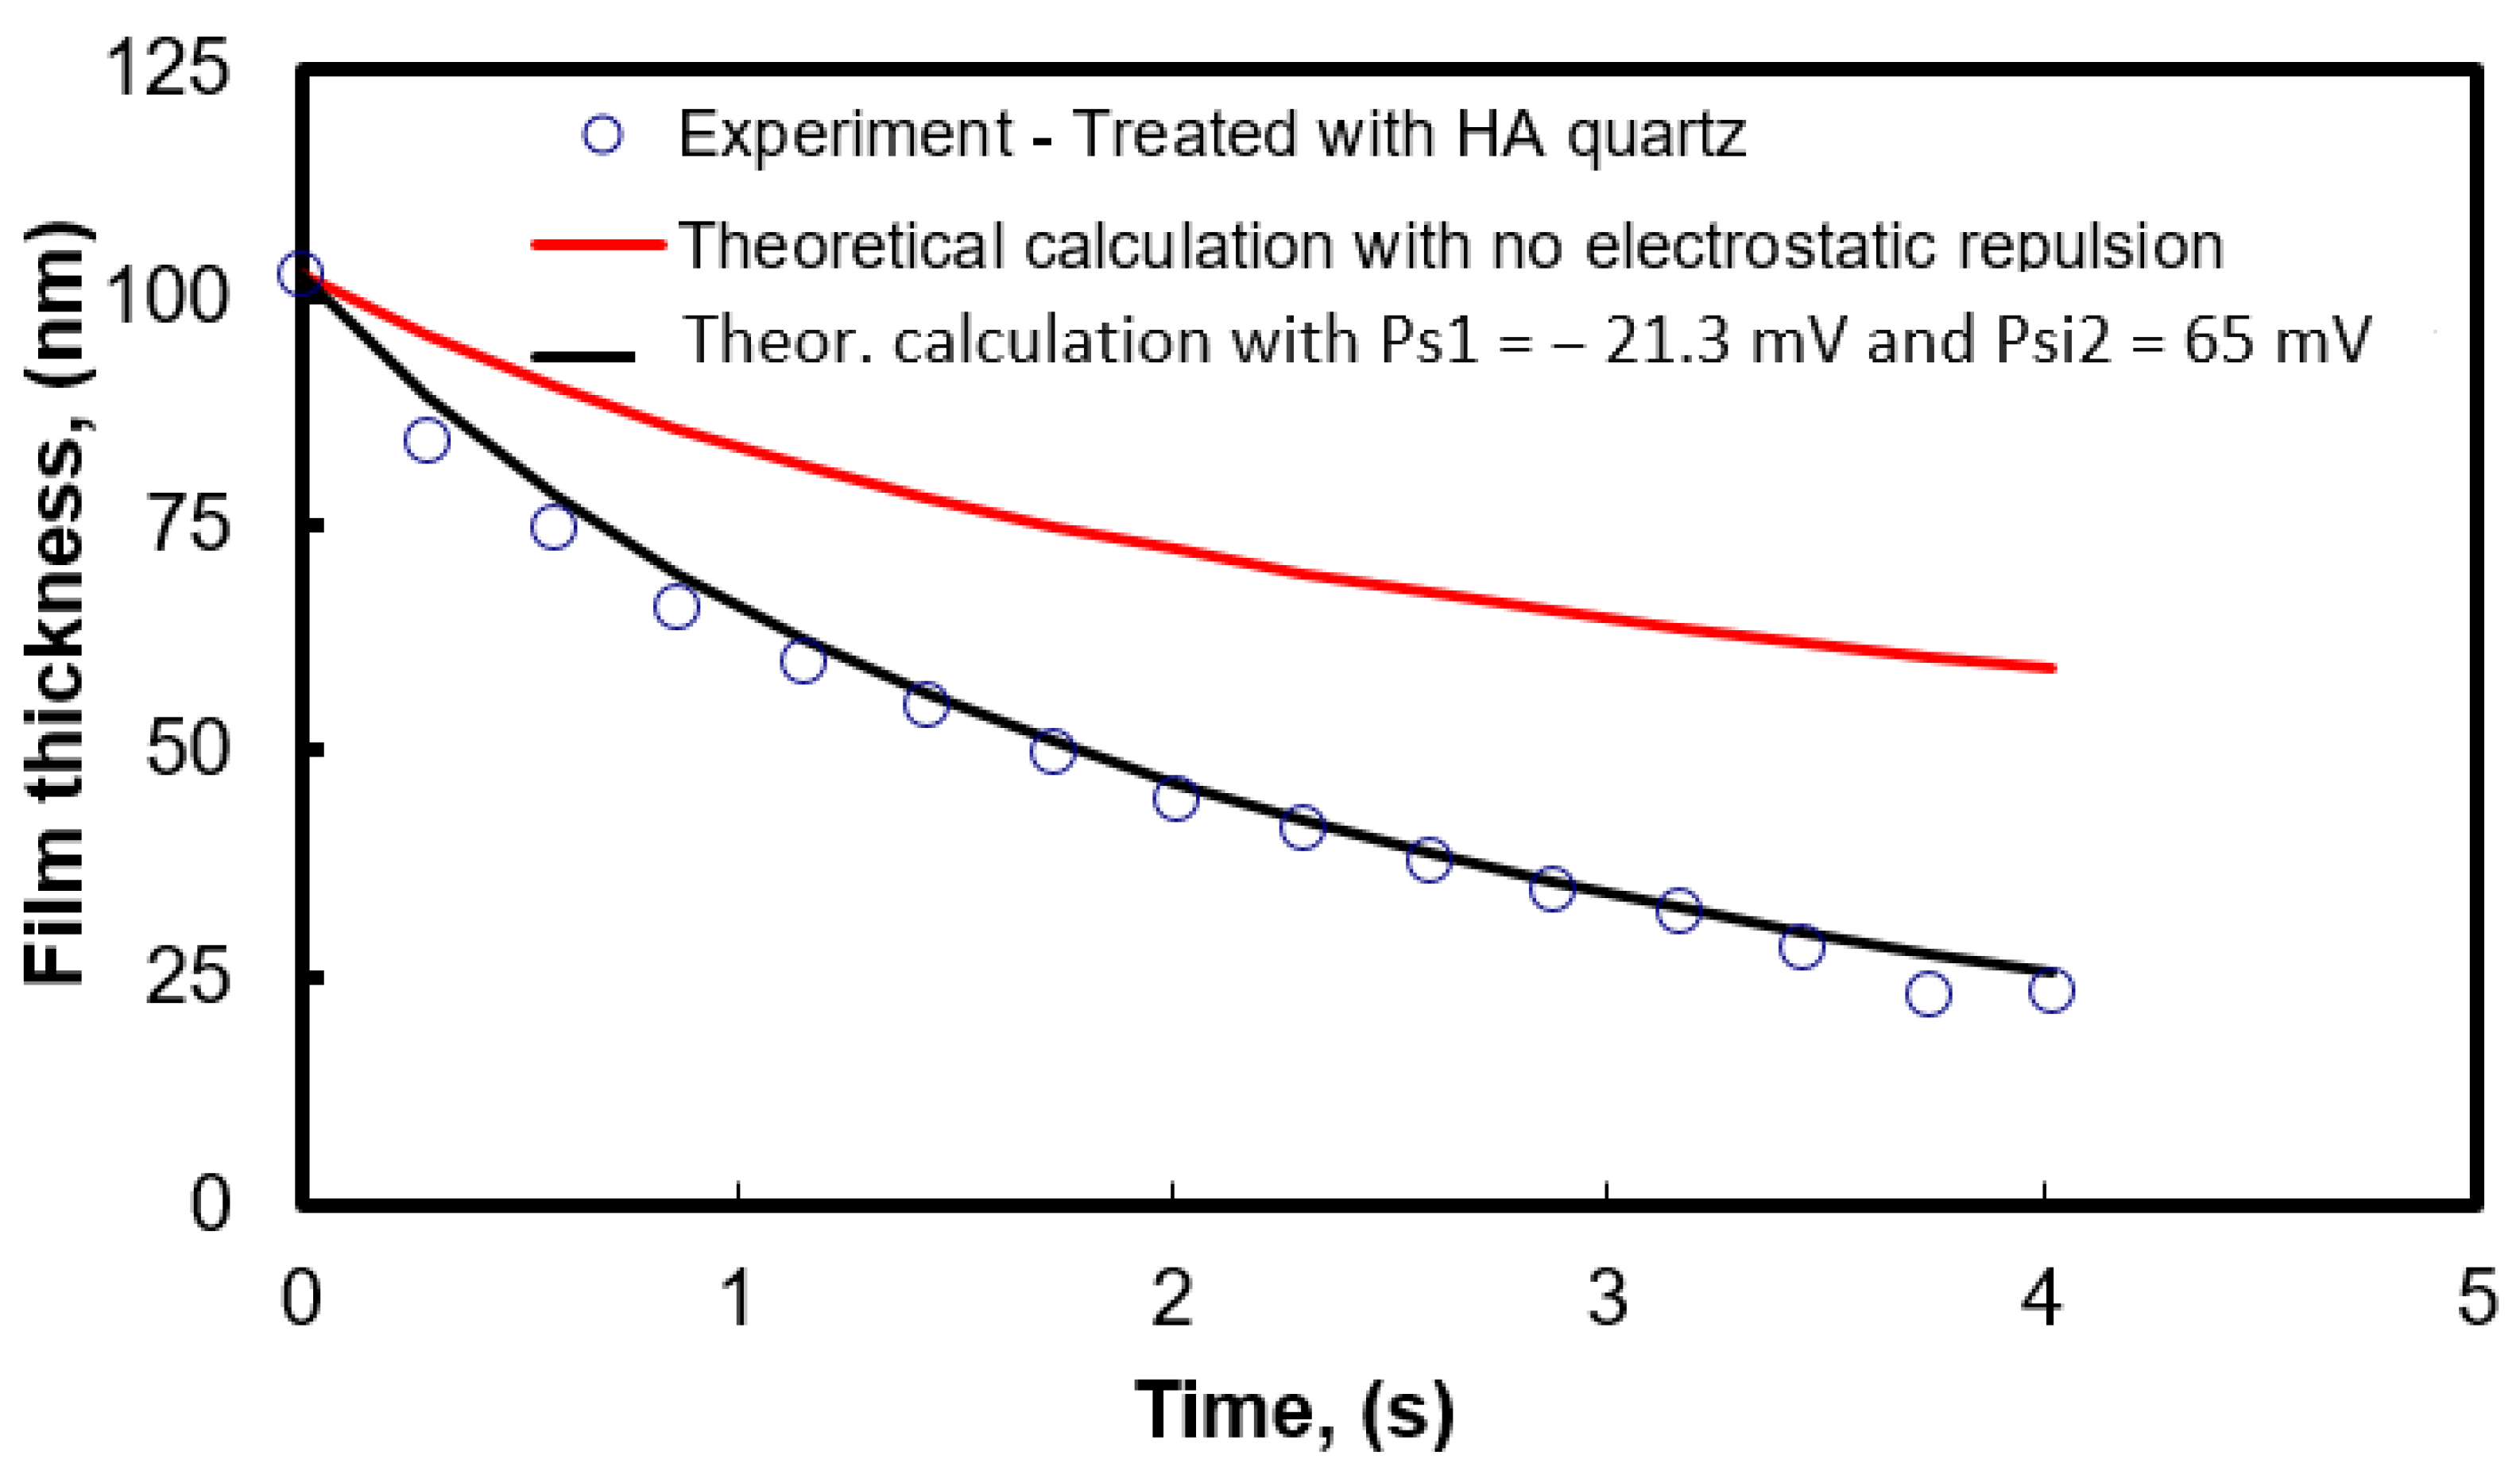
Figure 14 presents the kinetic curve of draining wetting film treated with hexylamine quartz in DI water. The experimental data are presented by the dots, while the red line is the theoretical kinetics with no electrostatic repulsion between the two surfaces of the film. The black line presents the theoretical curve assuming the surface potentials of both surfaces: Ψs = −21 mV (quartz surface) and Ψs = 65 mV (air/water interface). It is evident that the film drains faster than what the theory with excluded electrostatic interaction predicts. Hence, one can see that electrostatic attraction between the surface and the bubble emerges. Therefore, with Ψs = −21 mV for the quartz surface and Ψs = 65 mV for the air/water interface, there is a good coincidence between theory and experiment. To better justify this procedure, as model particles gangue fine particles from Yerakini mines in Greece, named here STERILES—MS45 were taken. Most of the particles are in the range of 5 μm to 10 μm sizes. In addition, we accommodated magnesite fine particles, named here KERMA 90-45, kindly provided by the same company.
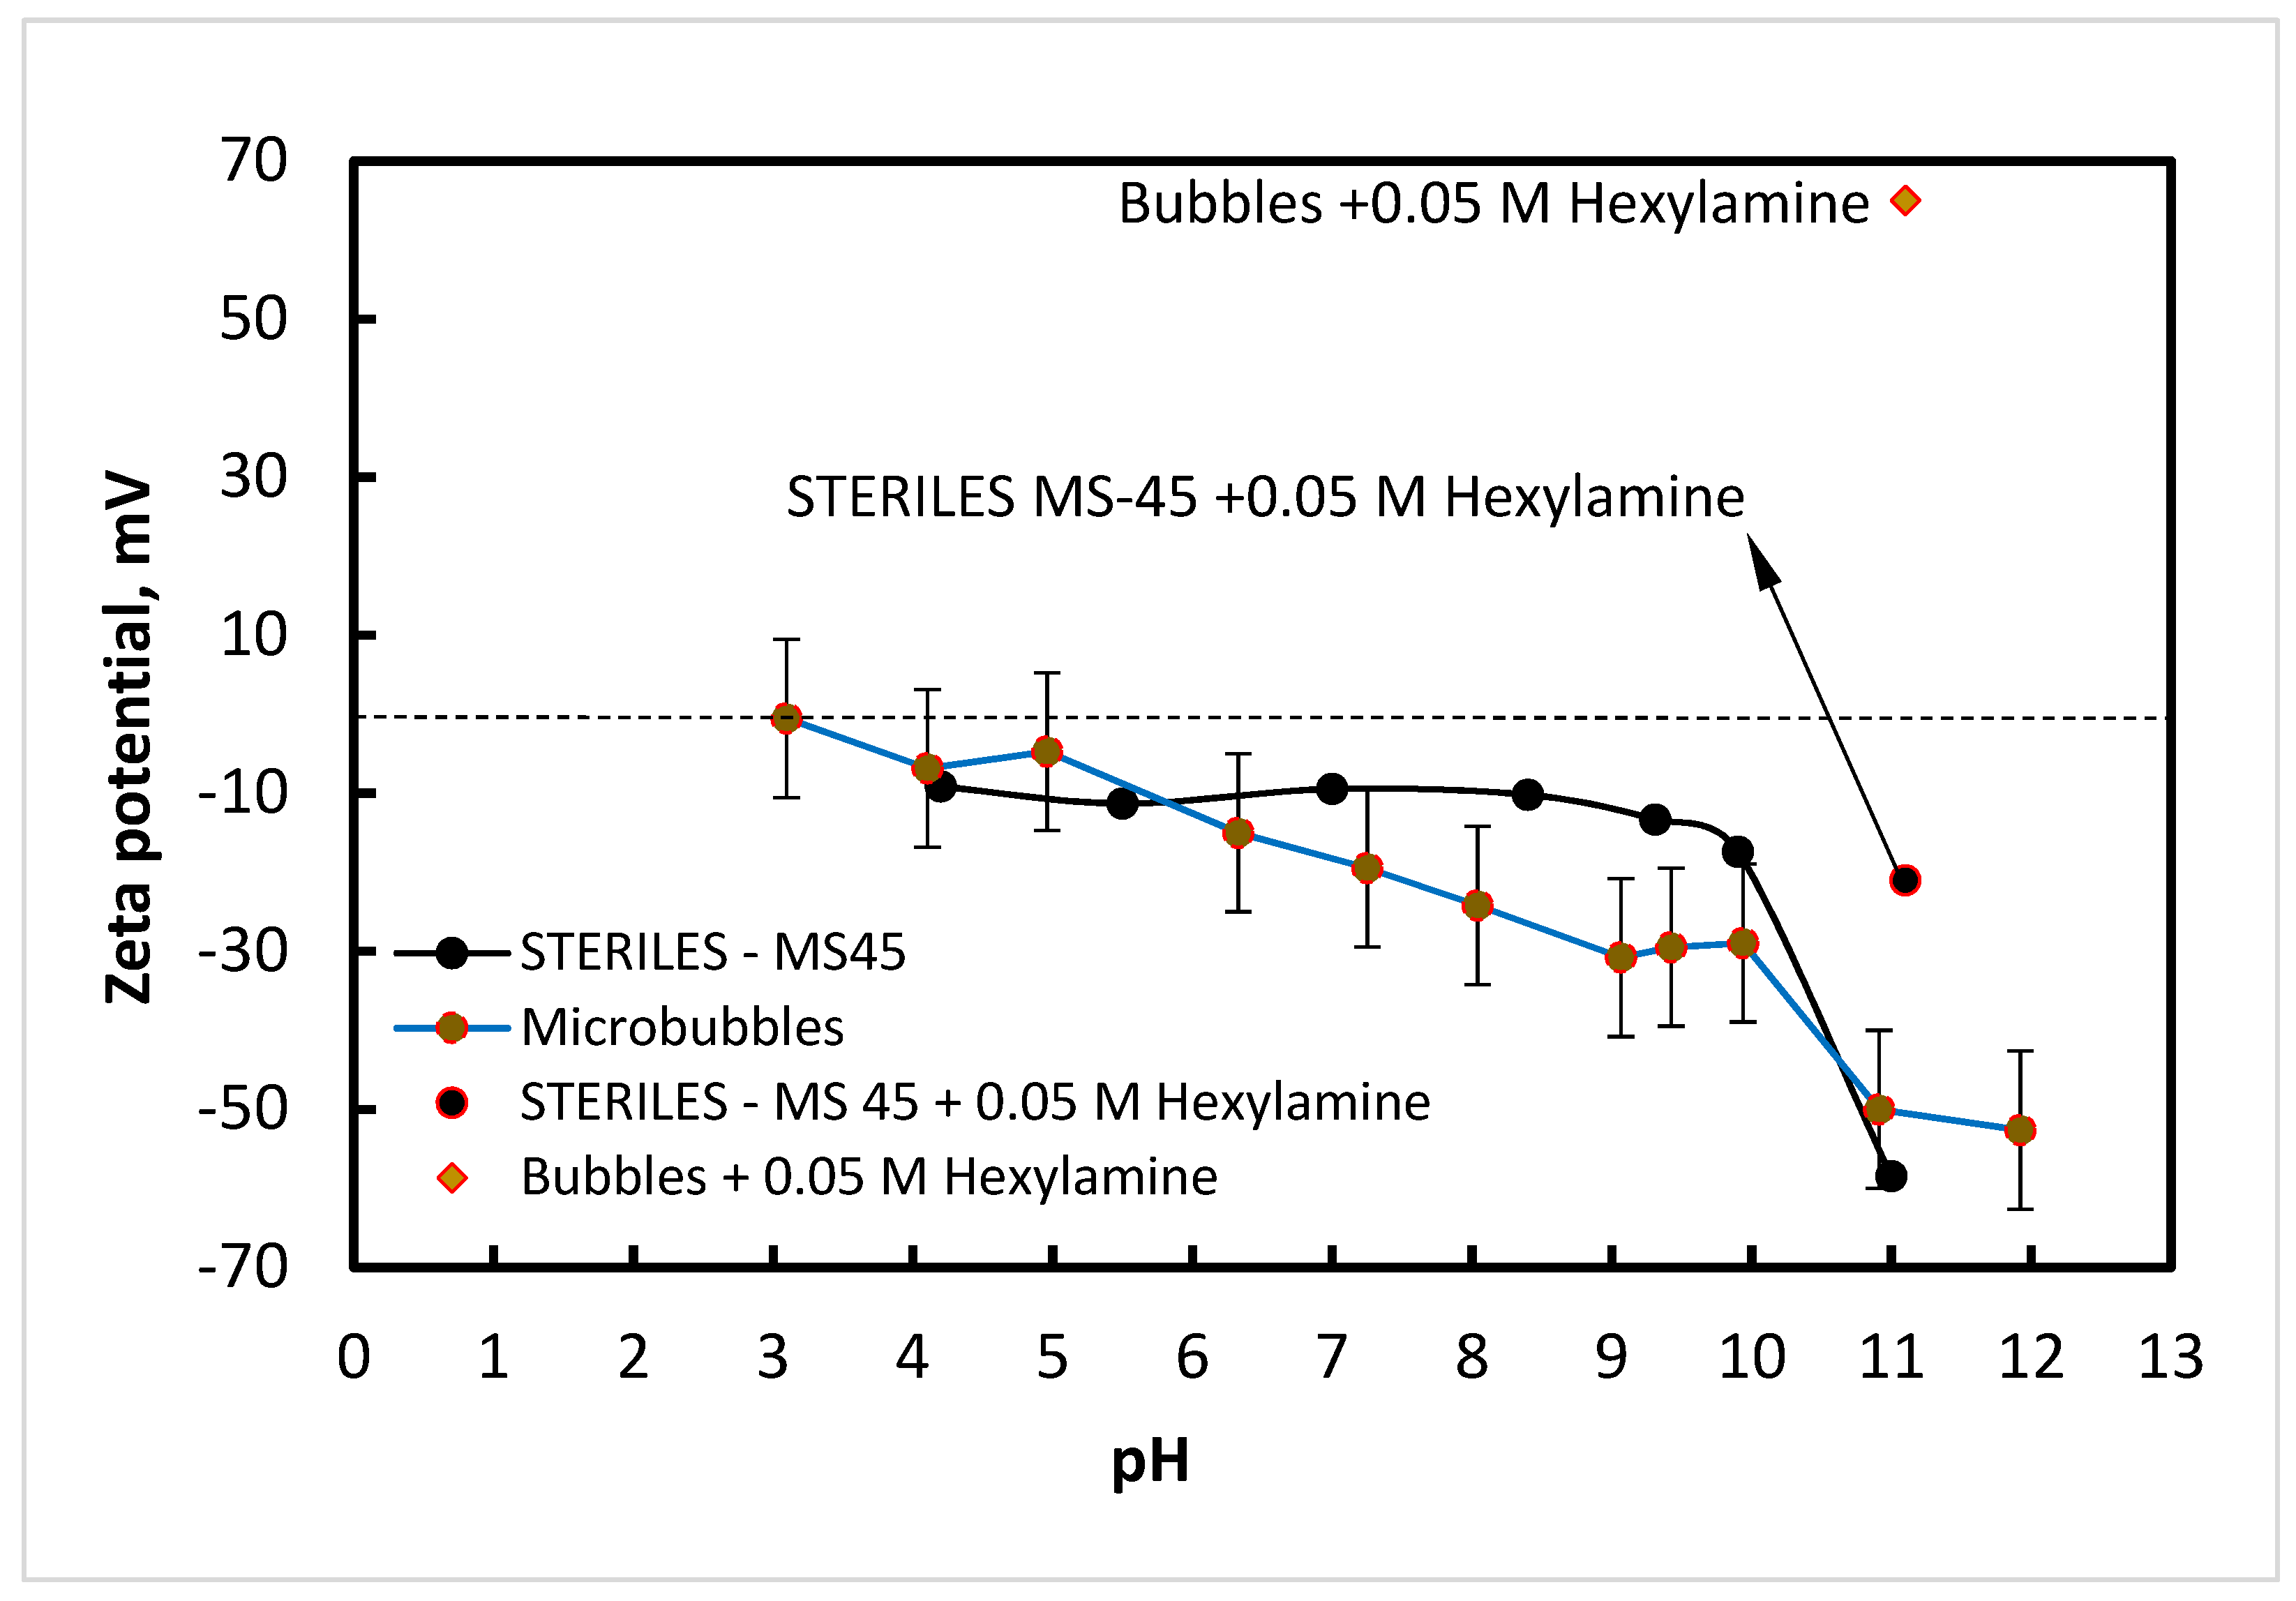
The zeta potential of STERILES–MS 45 versus pH and in 0.05 mol/L hexylamine and air microbubbles in 0.01 mol/L NaCl versus pH and 0.05 mol/L hexylamine is was measured. (see Figure 15). With the treatment with hexylamine, the zeta potential of STERILES–MS 45 particles in DI water changes from very negative (ζ < −65 mV) at pH = 11.2 to less negative (ζ = −21.3 mV). This value was taken in the calculation of the electrostatic attraction kinetic curve in Figure 14. The zeta potential of STERILES–MS 45 particles in 0.05 mol/L hexylamine is ζ = −18.6 mV. Following the DLVO theory, the surface potential of the air bubbles in 0.05 mol/L Hexylamine (Ψs = 65 mV), depicted in Figure 15, was calculated. Hence, there is evident electrostatic attraction between the air bubbles being positively charged and the gangue mineral particles being negatively charged.
Moreover, it is curious to know how much the hydrophobicity of the quartz was increased after treatment with hexylamine and how this modification affected the average thickness of rupturing and the average lifetime of the wetting films.
Flotation experiments. Table 2 presents the average contact angle values, the average thickness of film rupture, and the average lifetime of the wetting films on intrinsic and treated with hexylamine quartz. One can see that the contact angle of the quartz after the modification with hexylamine increased twice and the wetting films started rupturing, but judging from Table 1, this improvement is not sufficient to activate cavitation of dissolved gas. For this reason, flotation experiments with a Hallimond tube at 1 wt.% suspension of STERILES–MS 45 particles for 2 min were conducted.
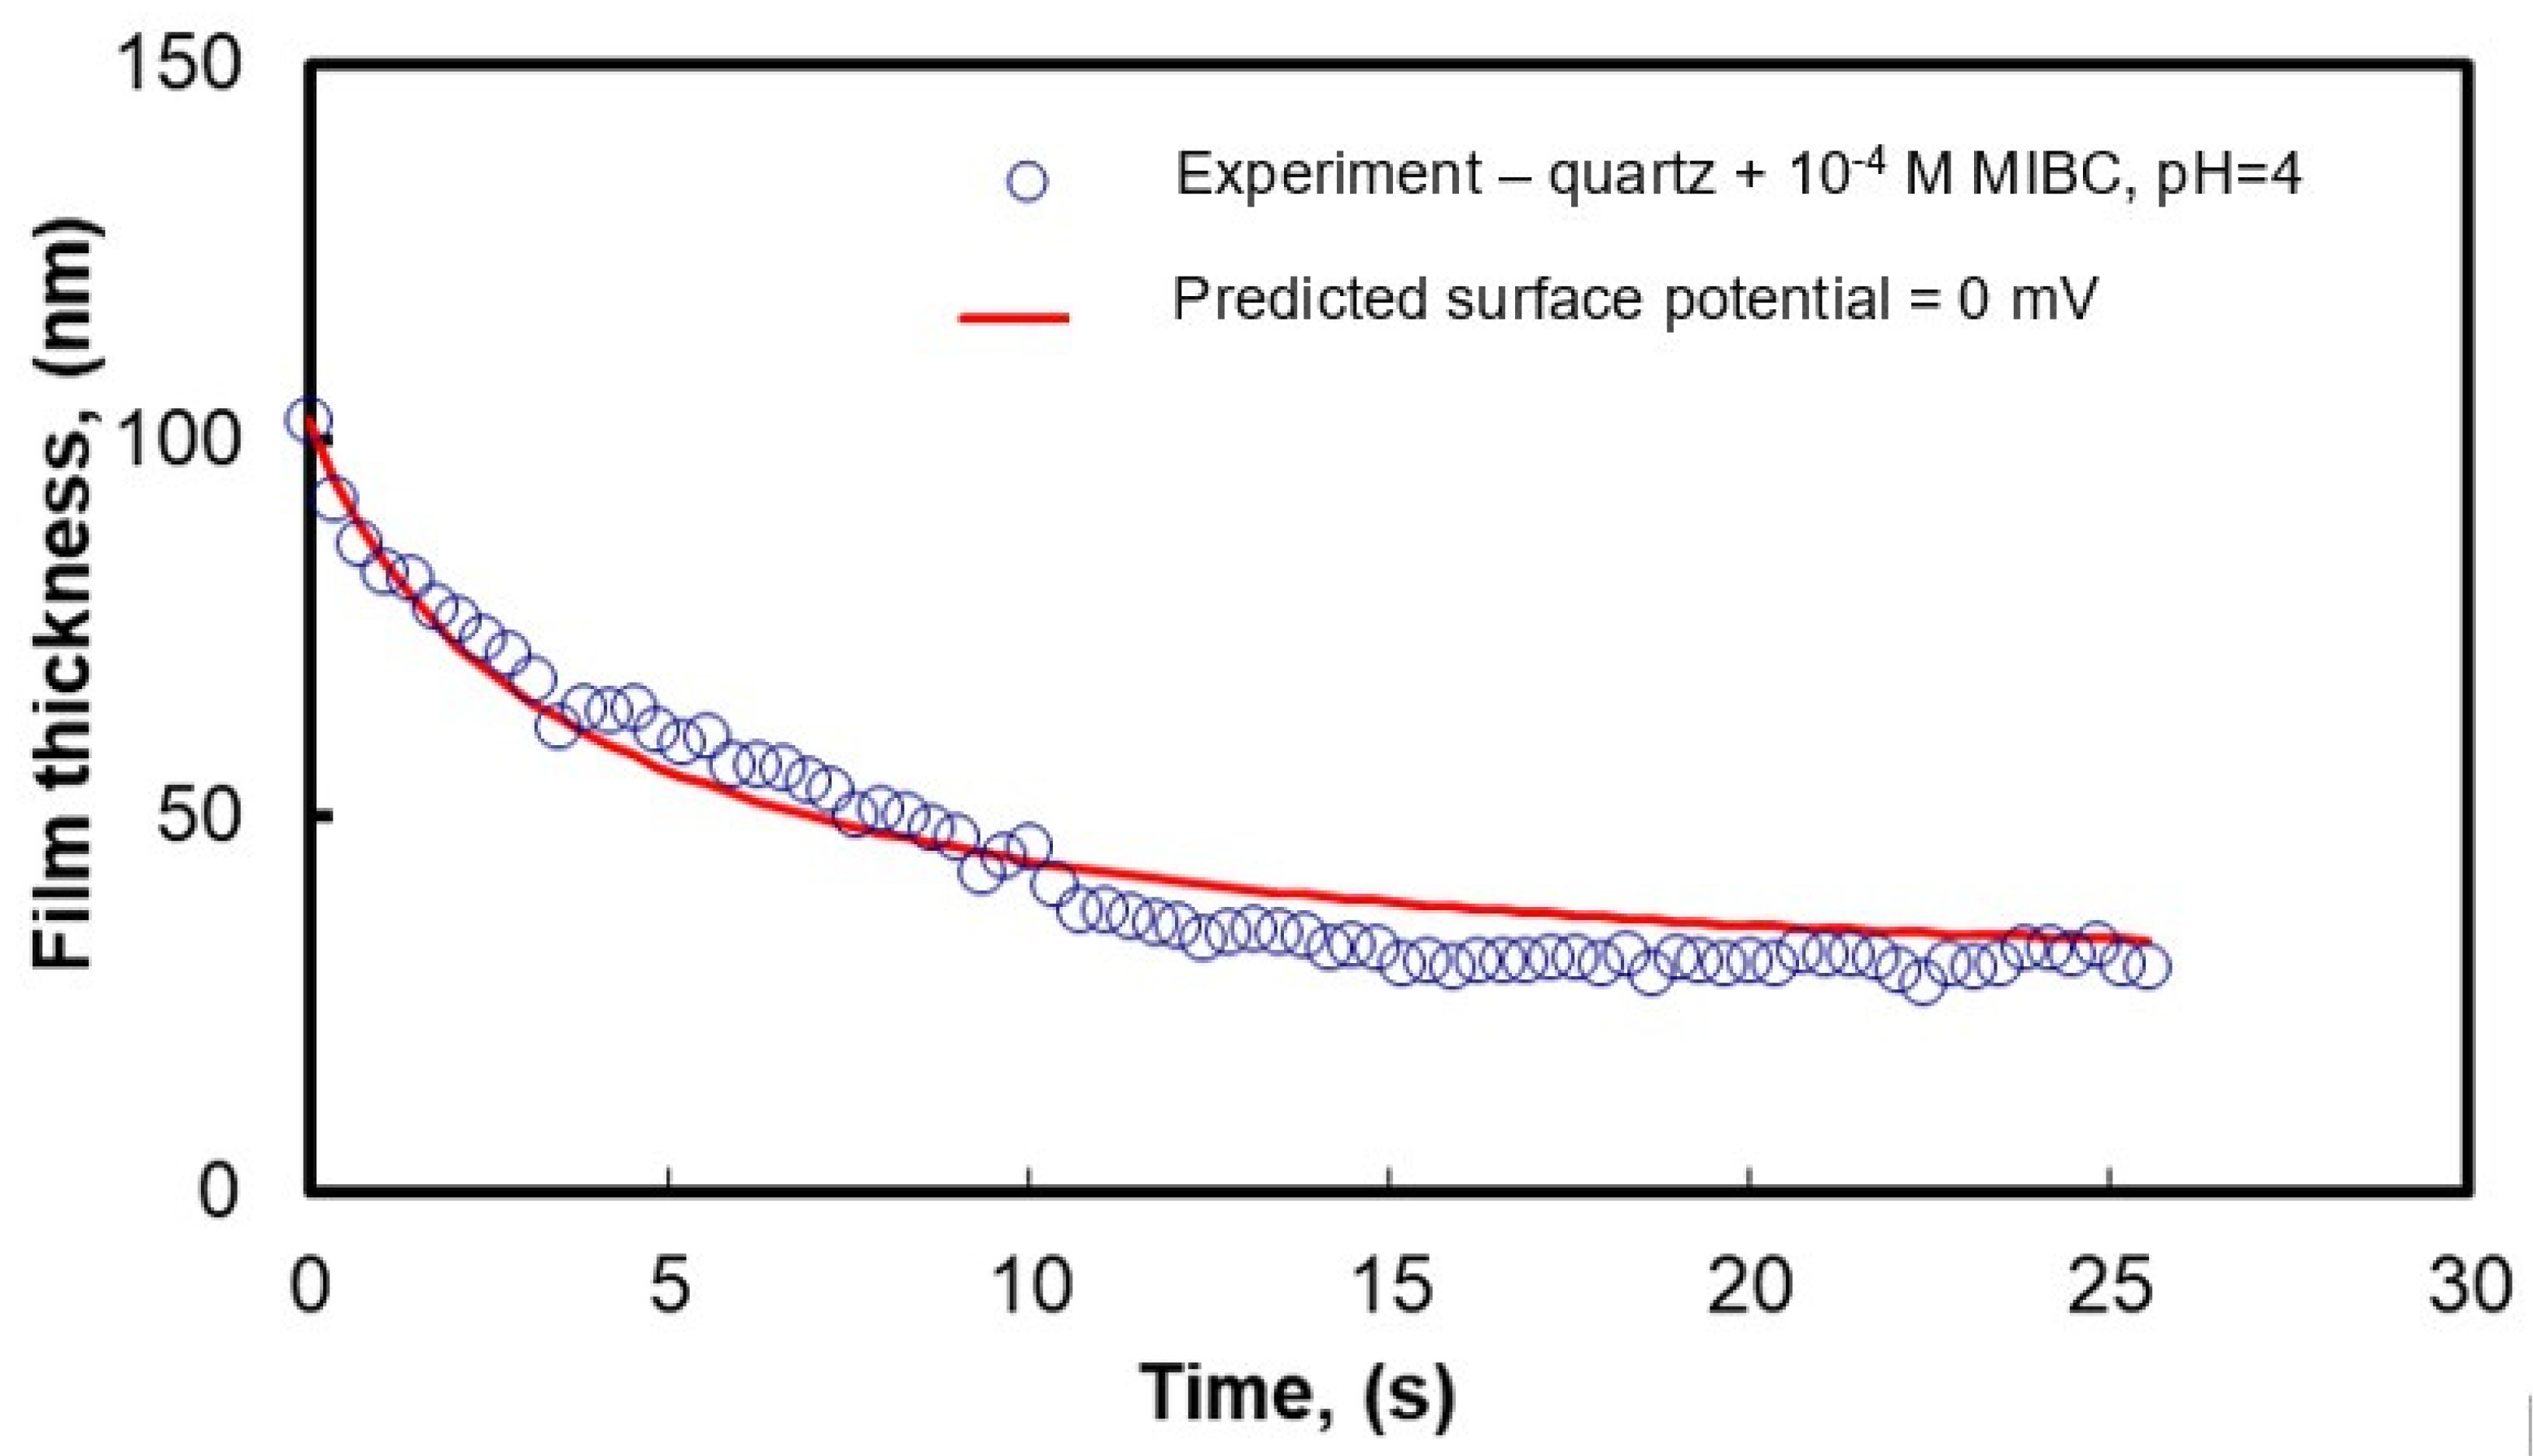
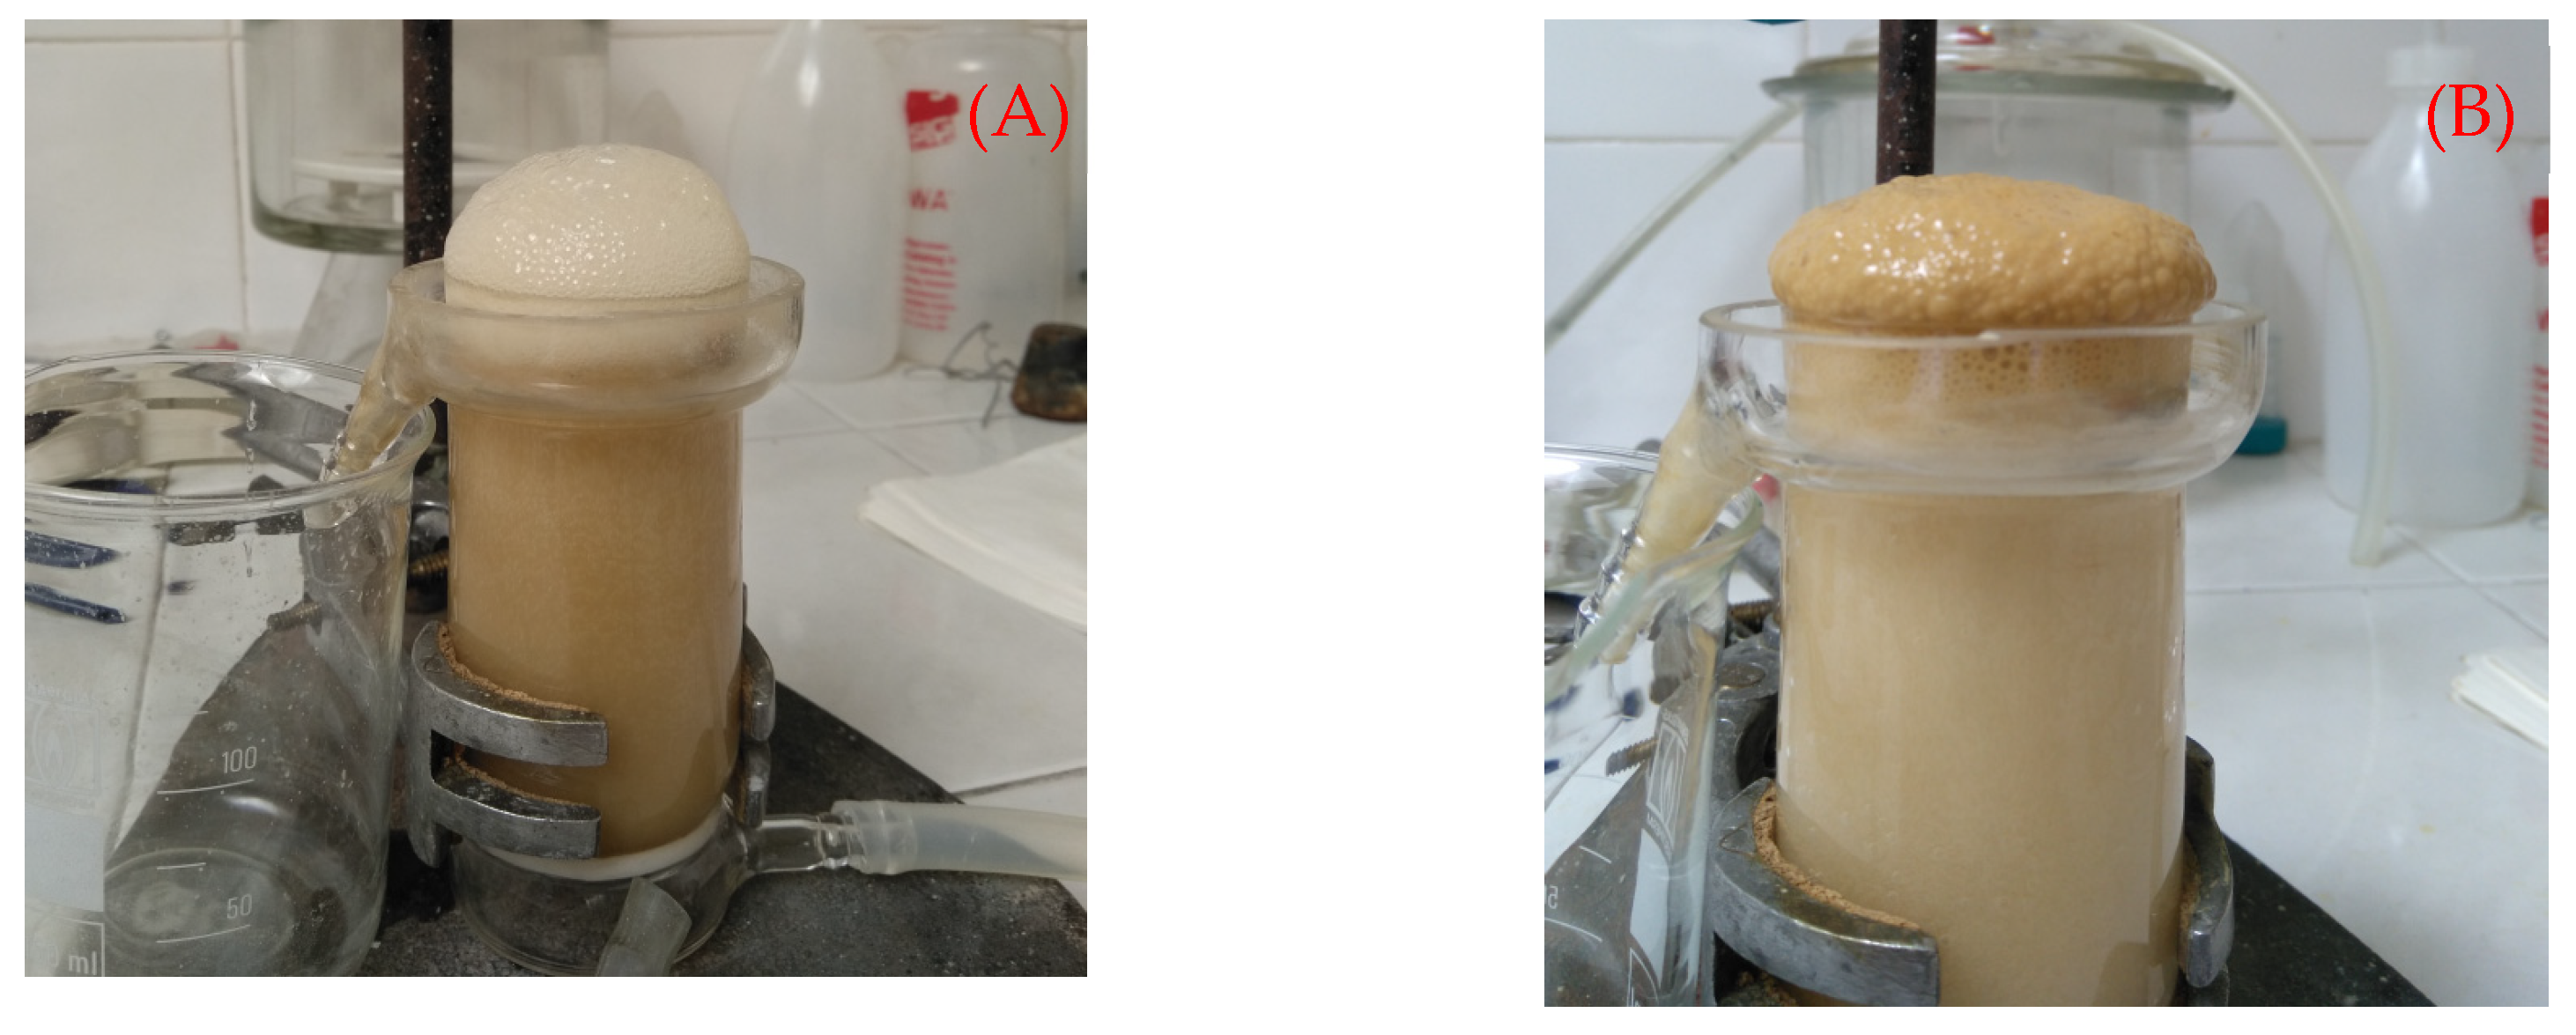
Two tests, with 10−4 mol/L MIBC and with 0.05 mol/L hexylamine, were conducted. There is an electrostatic repulsion between bubbles and particles in the case of MIBC (ζ1 = −65 mV, ζ2 = −13.3 mV) resulting in flotation yield = 7% (entrained particles) and electrostatic attraction in the case of hexylamine (ζ1 = 65 mV, ζ2 = −18.6 mV), resulting in flotation yield = 61%. One can see photos of the flotation tests in Figure 16. Hence, the electrostatic attraction between bubbles and particles contributes to a satisfactory flotation yield of fine particles. It is important to know how this concept works for magnesite (KERMA 90-45). The zeta potential of bubbles in the presence of 0.05 mol/L hexylamine (ζ1 = 65 mV) were measured.
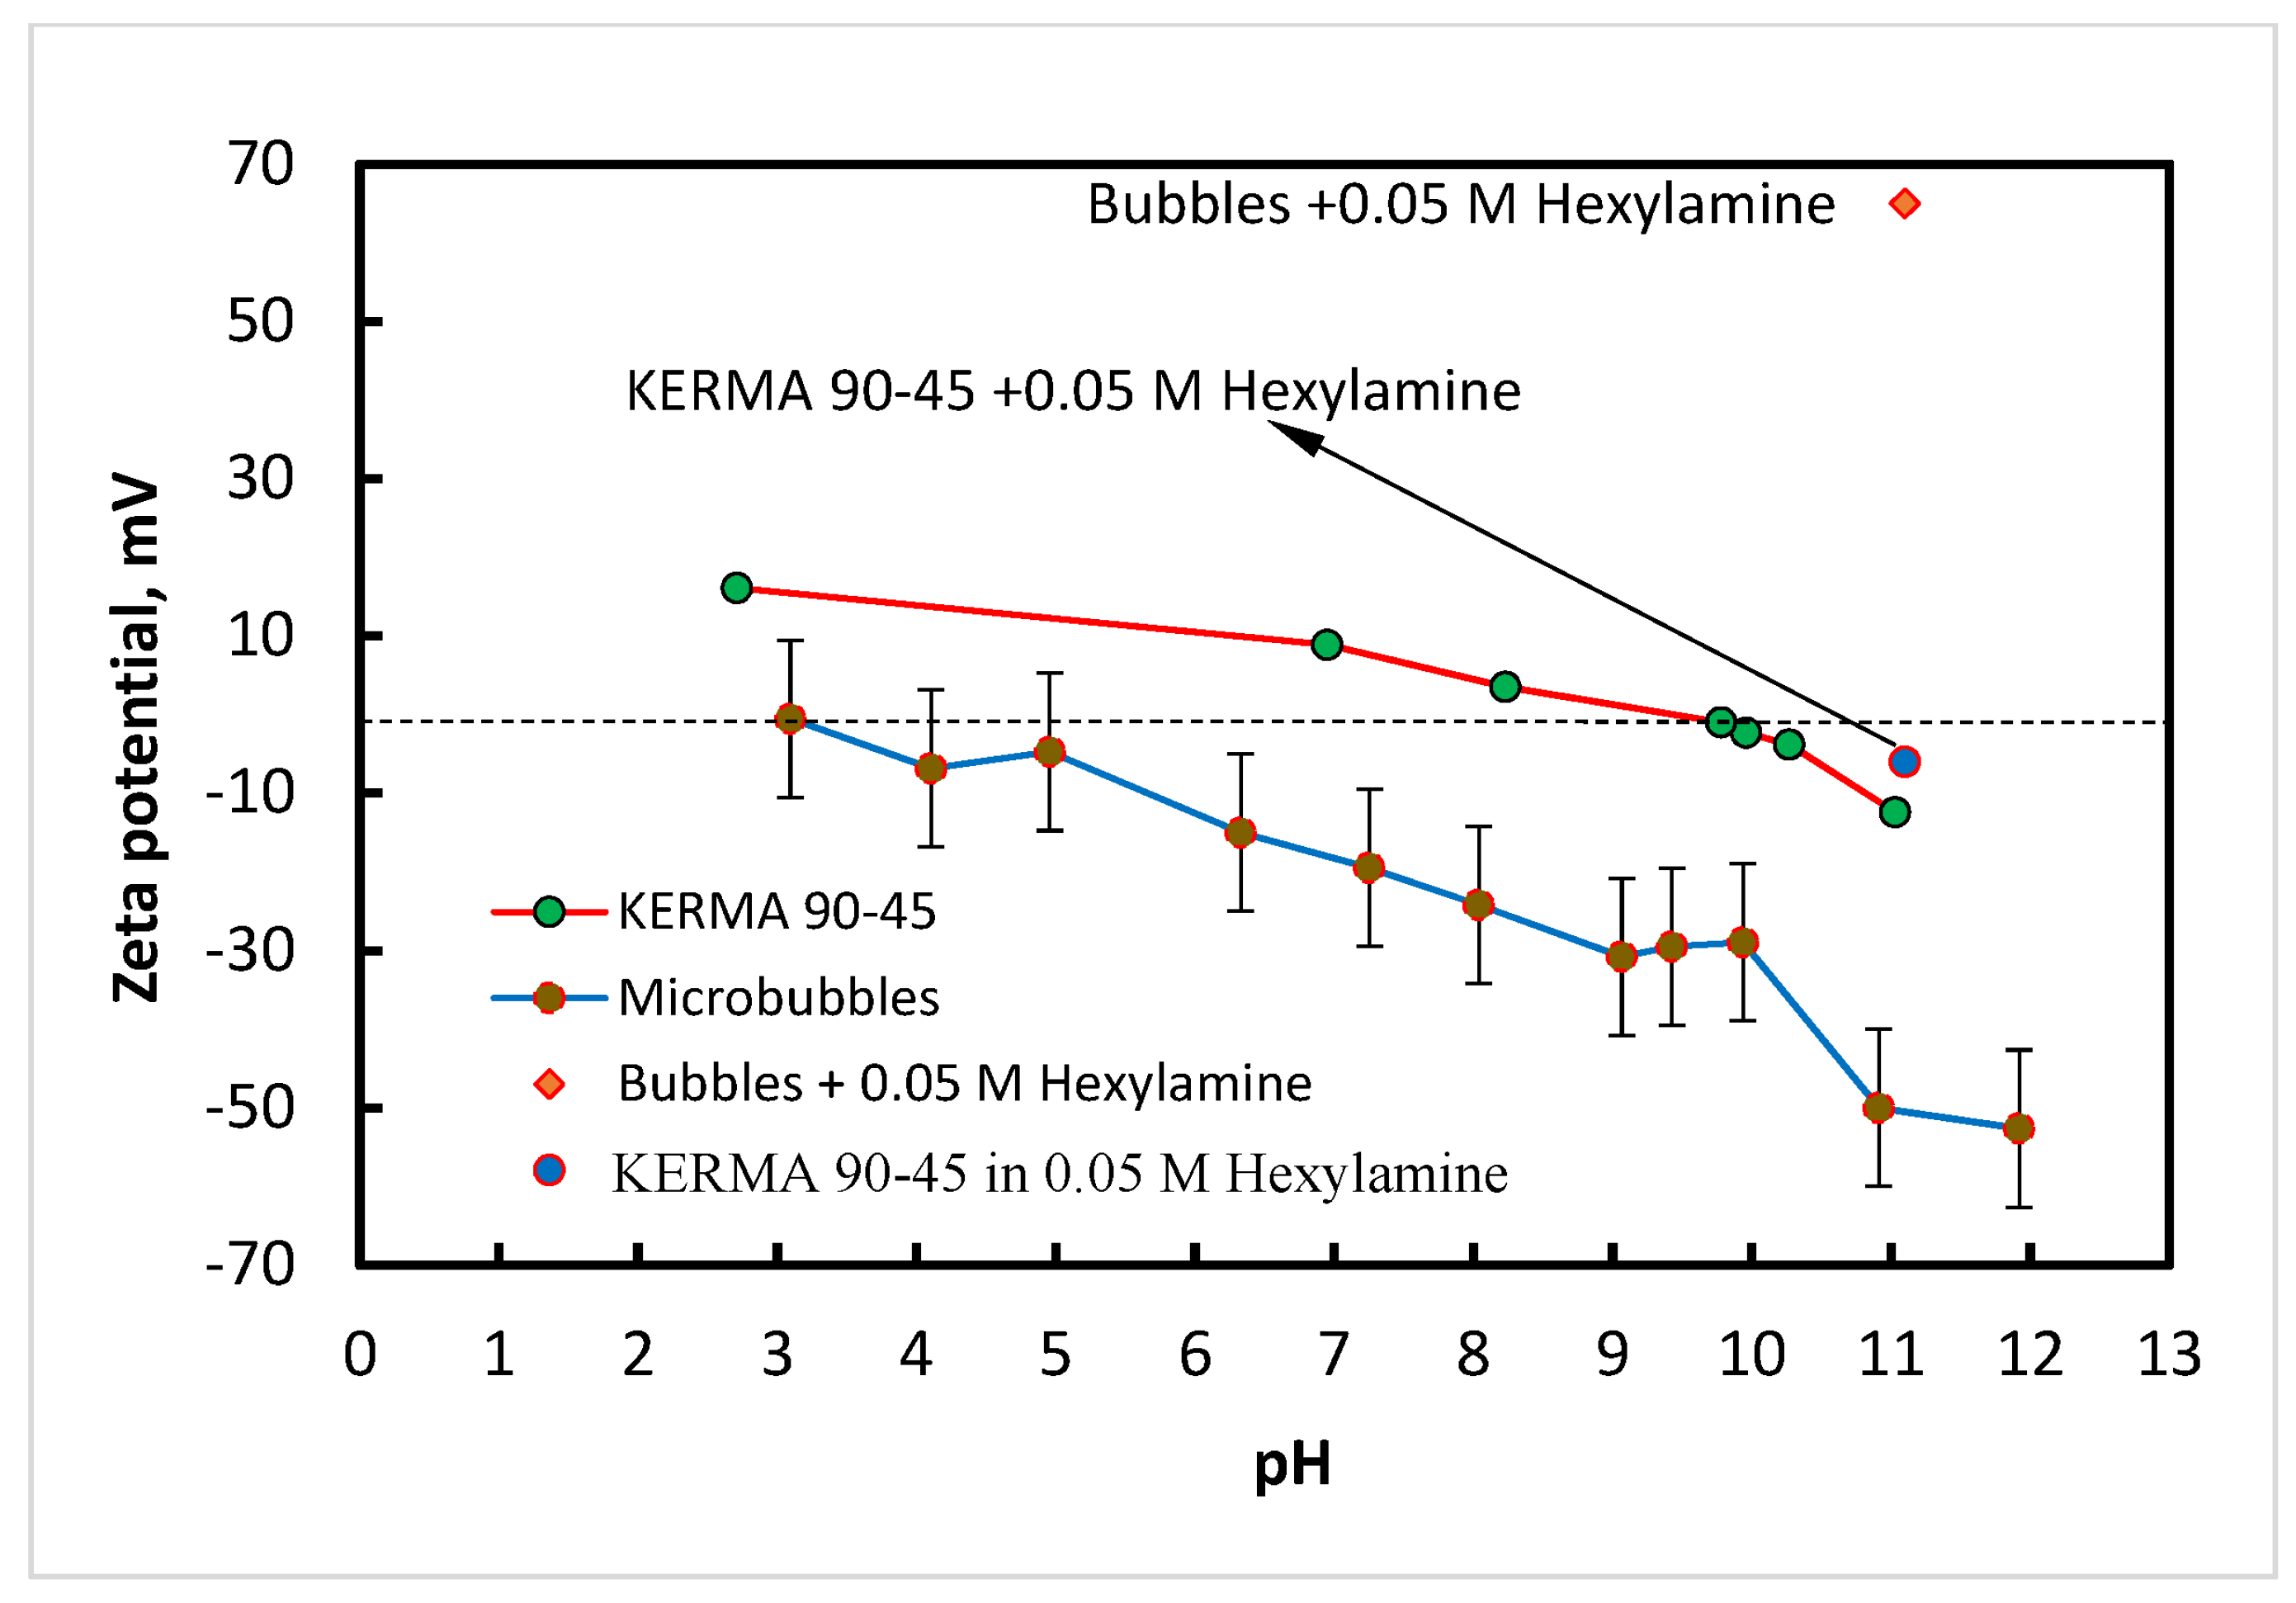
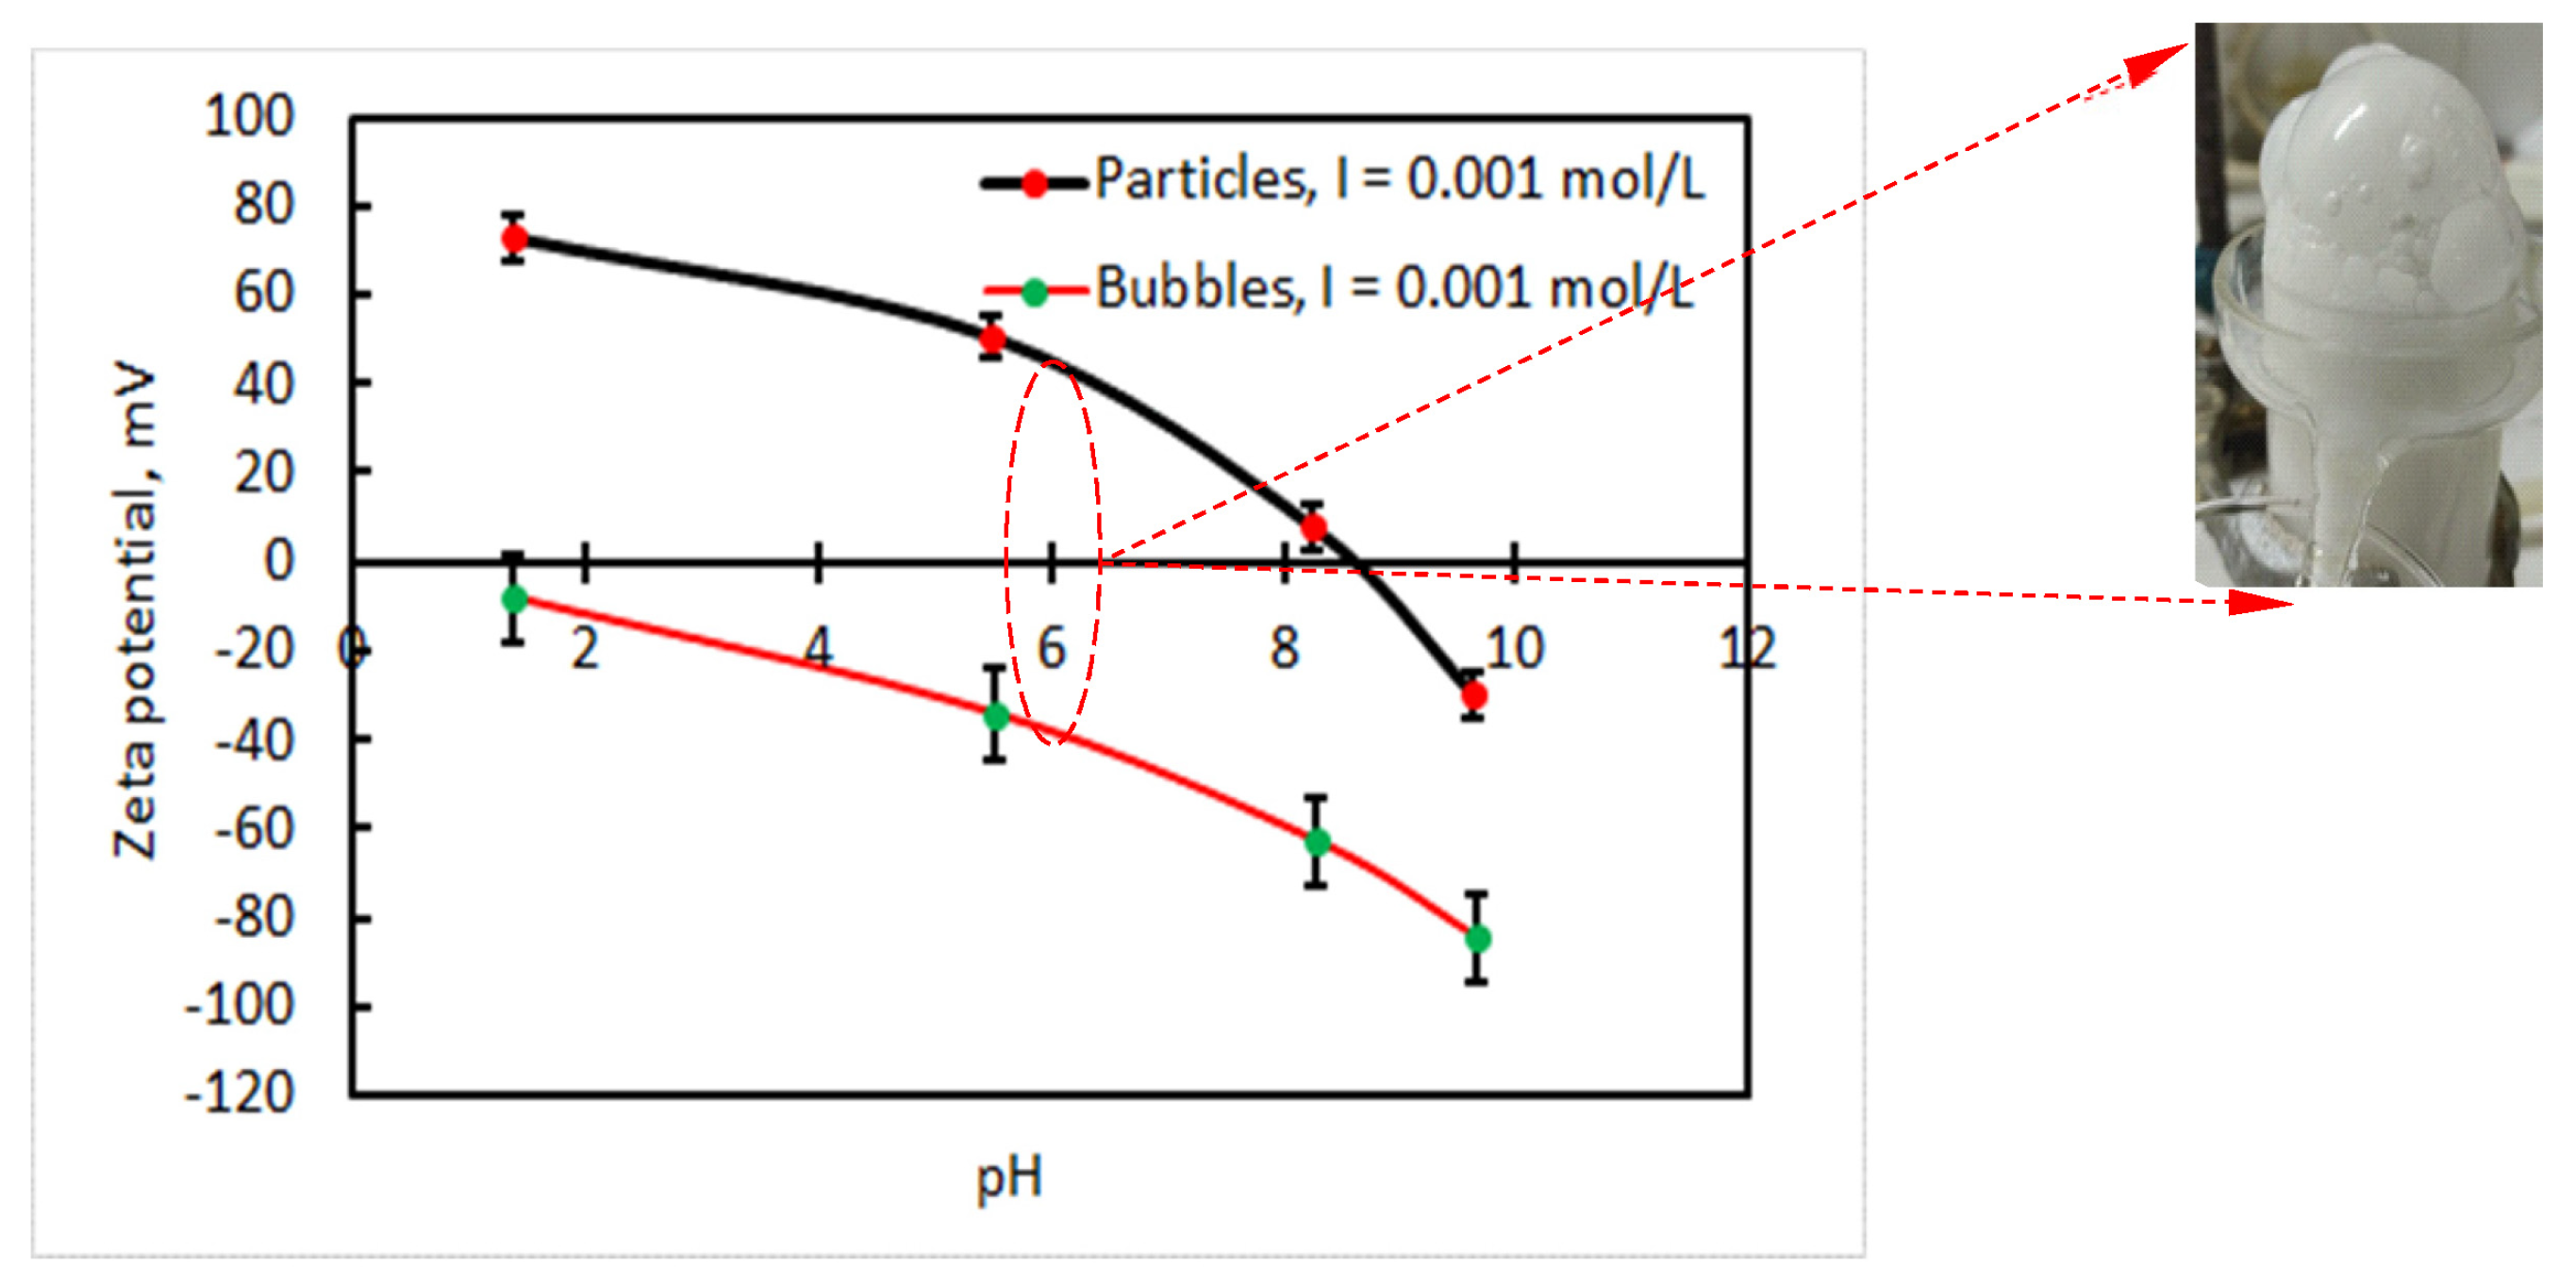
Figure 17 presents the zeta potential of KERMA 90-45 magnesite particles versus pH and in 0.05 mol/L hexylamine and air microbubbles in 0.01 mol/L NaCl versus pH. In addition, it presents the zeta potential of the bubbles and the particles in 0.05 mol/L hexylamine. One can see that at pH = 11.2, the zeta potential of KERMA 90-45 magnesite particles changes from ζ = −12.6 mV to ζ = −6 mV in 0.05 mol/L hexylamine. The zeta potential of treated with hexylamine KERMA 90-45 particles in DI water is ζ = −0.47 mV. So, there should again exist electrostatic attraction between bubbles and particles, but weaker compared to the case of STERILES–MS 45.
Table 3 shows the average contact angle values, the average thickness of film rupture, and the average lifetime of the wetting films on intrinsic and treated with hexylamine magnesite. One can see that the contact angle of the magnesite after the modification with hexylamine increased, and the wetting films ruptured at a little bit larger average thickness. The average lifetime is a little bit shorter too, but judging from Table 1, this improvement is not sufficient to activate the cavitation of dissolved gas.
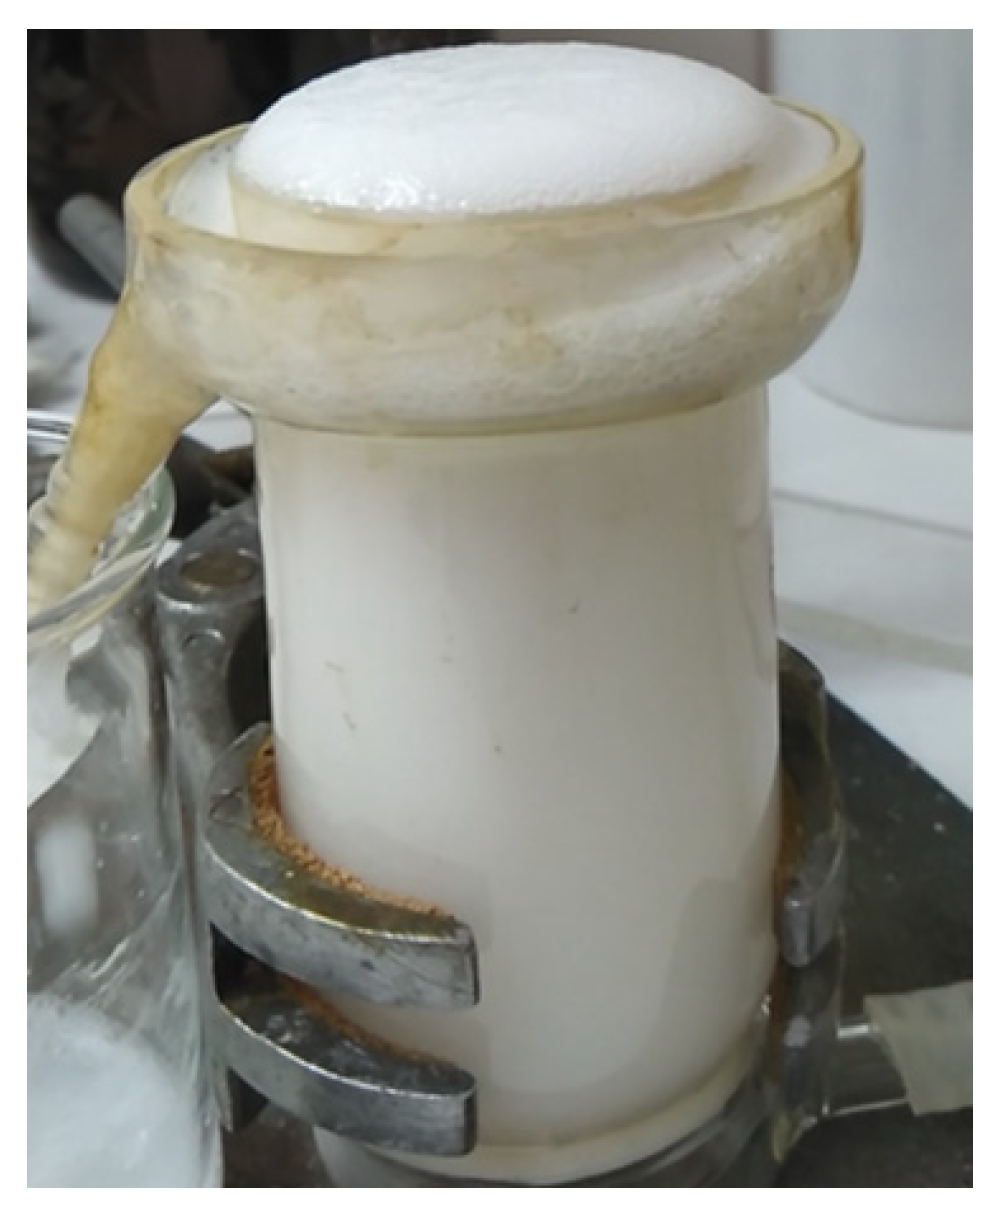
The flotation test of KERMA 90-45 similar to this one with STERILES–MS45 was conducted. The flotation yield is 18% (see Figure 18)
The results with non-mixed particles on the flotation test in the Hallimond tube in 0.05 mol/L Hexylamine and 10−4 mol/L MIBC are presented in Table 4. The comparative test with MIBC was conducted to roughly estimate the level of entrained flotation for each one of the cases. The recovery of SiO2 is higher than the recovery of MgCO3 (92.2% versus 22.2%). This is because the MgCO3 particles are positively charged, while those of SiO2 are negatively charged.
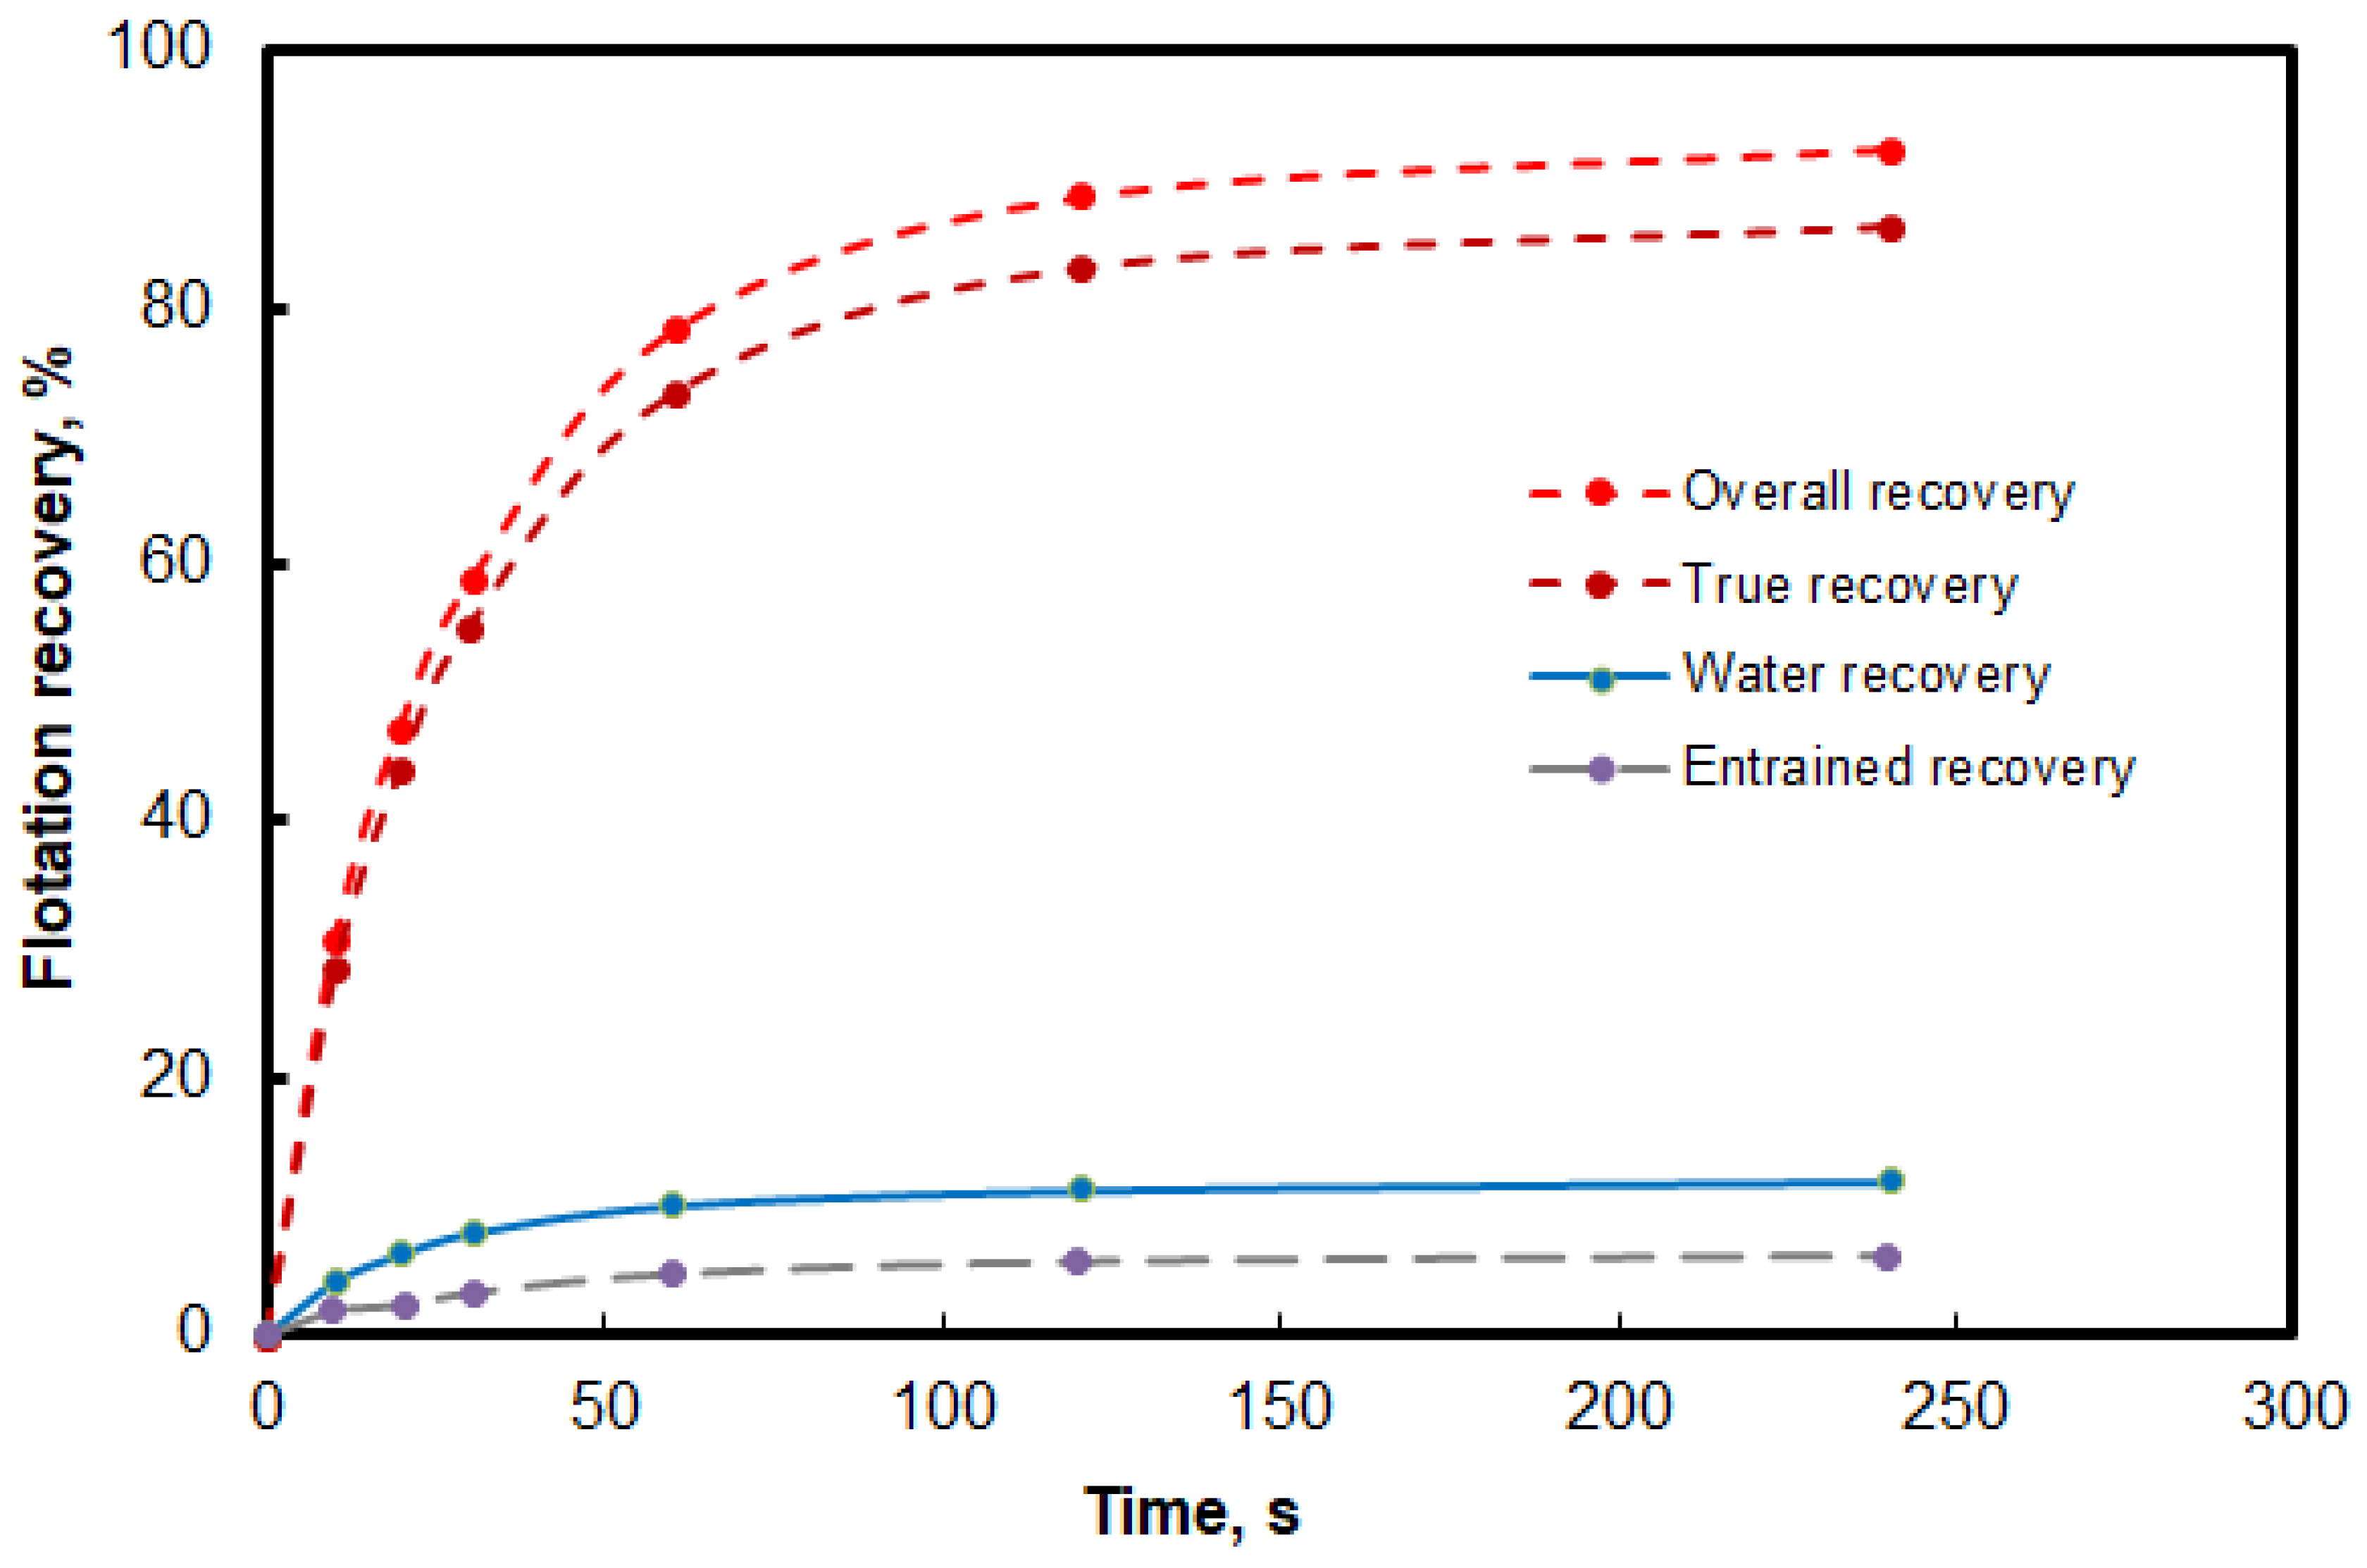
Figure 19 shows the recoveries of fine silica particles versus time. It also shows the recovery of the water. The maximum recovery is 90.4%. It is important to comment on the entrainment of particles. Fine particles usually are disposed to entrainment [44]. It is due to the net flow of water in the pneumatic foam. A degree of entrainment, ENT, has been defined [45].
Ref. [45] reported the level of entrainment of quartz particles finer than 20 μm of 0.4501. A general theory for recovery of gangue by entrainment for a given size fraction i , R e n t ,   i , is reported by ref. [45]. The true recovery by flotation was calculated by correcting the overall recovery by the entrained recovery (see Figure 19). The maximum recovery by true flotation was then calculated to be 84.7%, thus showing the collecting power of hexylamine on fine silica. One can conclude from these results that the electrostatic attraction between bubbles and fine particles causes excellent flotation. In addition, it must be noted that this collector causes moderate increase of the hydrophobicity of the fine particles (see Table 2). Hence, both the electrostatic attraction and the increase of hydrophobicity causes excellent recovery of the fine particles.
Table 5 shows the results from the flotation of the mixture of MgCO3 and SiO2 fine particles in presence of 0.05 mol/L hexylamine. One can see that the flotation yield of the fine particles is high (83%), and the concentrate is a little bit richer in SiO2 than the feed. The recoveries of both MgCO3 and SiO2 are high (92% and 77%), probably due to electrostatic attraction between the positively charged MgCO3 and the negatively charged SiO2. The inverted grade of the particles mixture on the bottom of the cell is however satisfactory—MgCO3/SiO2 = 67.6/32.4 versus 55/45 feed, but unfortunately the inverted flotation yield is 17%. All these observations show that hexylamine makes the negatively charged fine particles (with a significant amount of SiO2) float with satisfactory yield, but this collection suffers from a lack of selectivity.
To continue this study, it should be elucidated: what will happen if the hydrophobicity of the particles is not increased but only make them attractive with the bubbles electrostatically? For this reason, a special procedure was applied to modify the silica particles, thus shifting their isoelectric point (IEP) to pH = 9.2. Therefore, the bubbles will be negatively charged, while the silica particles will be positively charged at pH = 5.8, which is the intrinsic pH of the DI water in contact with air. Therefore, the surface potential of the silica particles becomes pH-sensitive.
Experiments on flotation with the Hallimond tube with 1 wt.% suspension of modified [40] fine silica particles (−10 μm) in 10 ppm MIBC (pH = 5.8) and 120 s flotation time seconds resulted in 47% recovery (see Table 6). Figure 20 shows a photo of the flotation froth. The modified particles have isoelectric point (IEP) at pH ≈ 9.2. For comparison, the intrinsic isoelectric point of the silica particles is at pH ≈ 2.5 [46]. The modified silica particles have the same level of hydrophobicity as the intrinsic ones (contact angle ≈ 30°). The question here is if hydrophilic particles can float due to their electrostatic attraction with the bubbles. The microbubbles and the modified silica particles, as ((see Figure 20), have opposite signs of the zeta potential (ξb = −22 mV, ξp = 60 mV) at pH = 5.8. In addition, the photo of the flotation froth (see Figure 20) looks particulate. This is an indication of a large number of captured particles.
The conclusion which can be made at this point is that the electrostatic attraction between bubbles and particles, as indicated above, can increase the flotation yield of the fine particles significantly, even for a flotation time of several minutes. Yet, this is not enough to be applied in the industry. A critical question here is how this collector is able to separate magnesite from quartz in their real mixture.
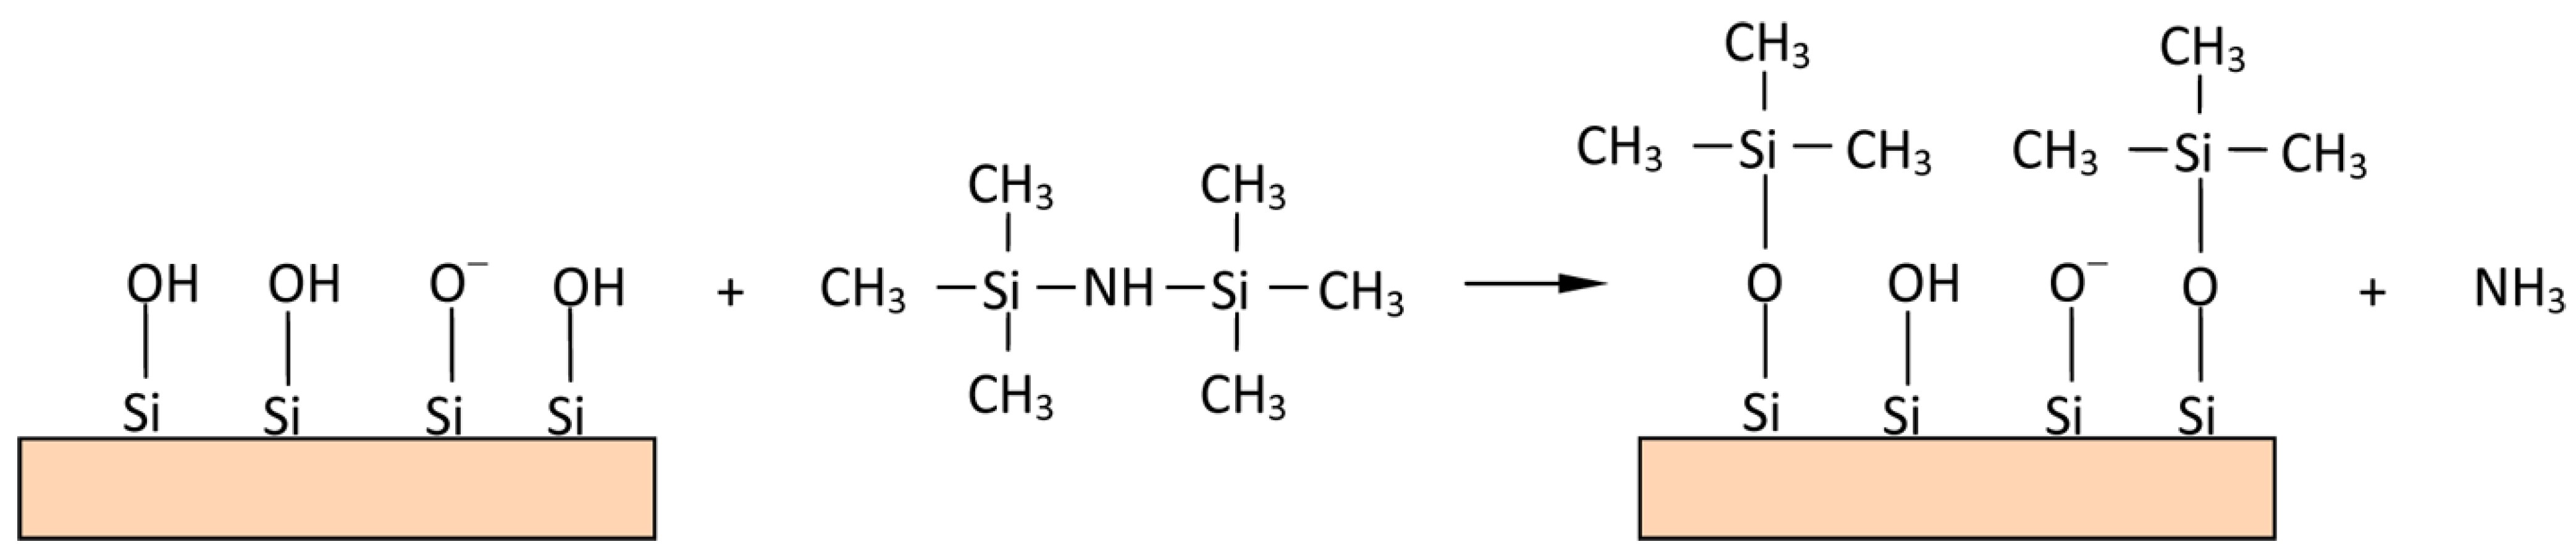
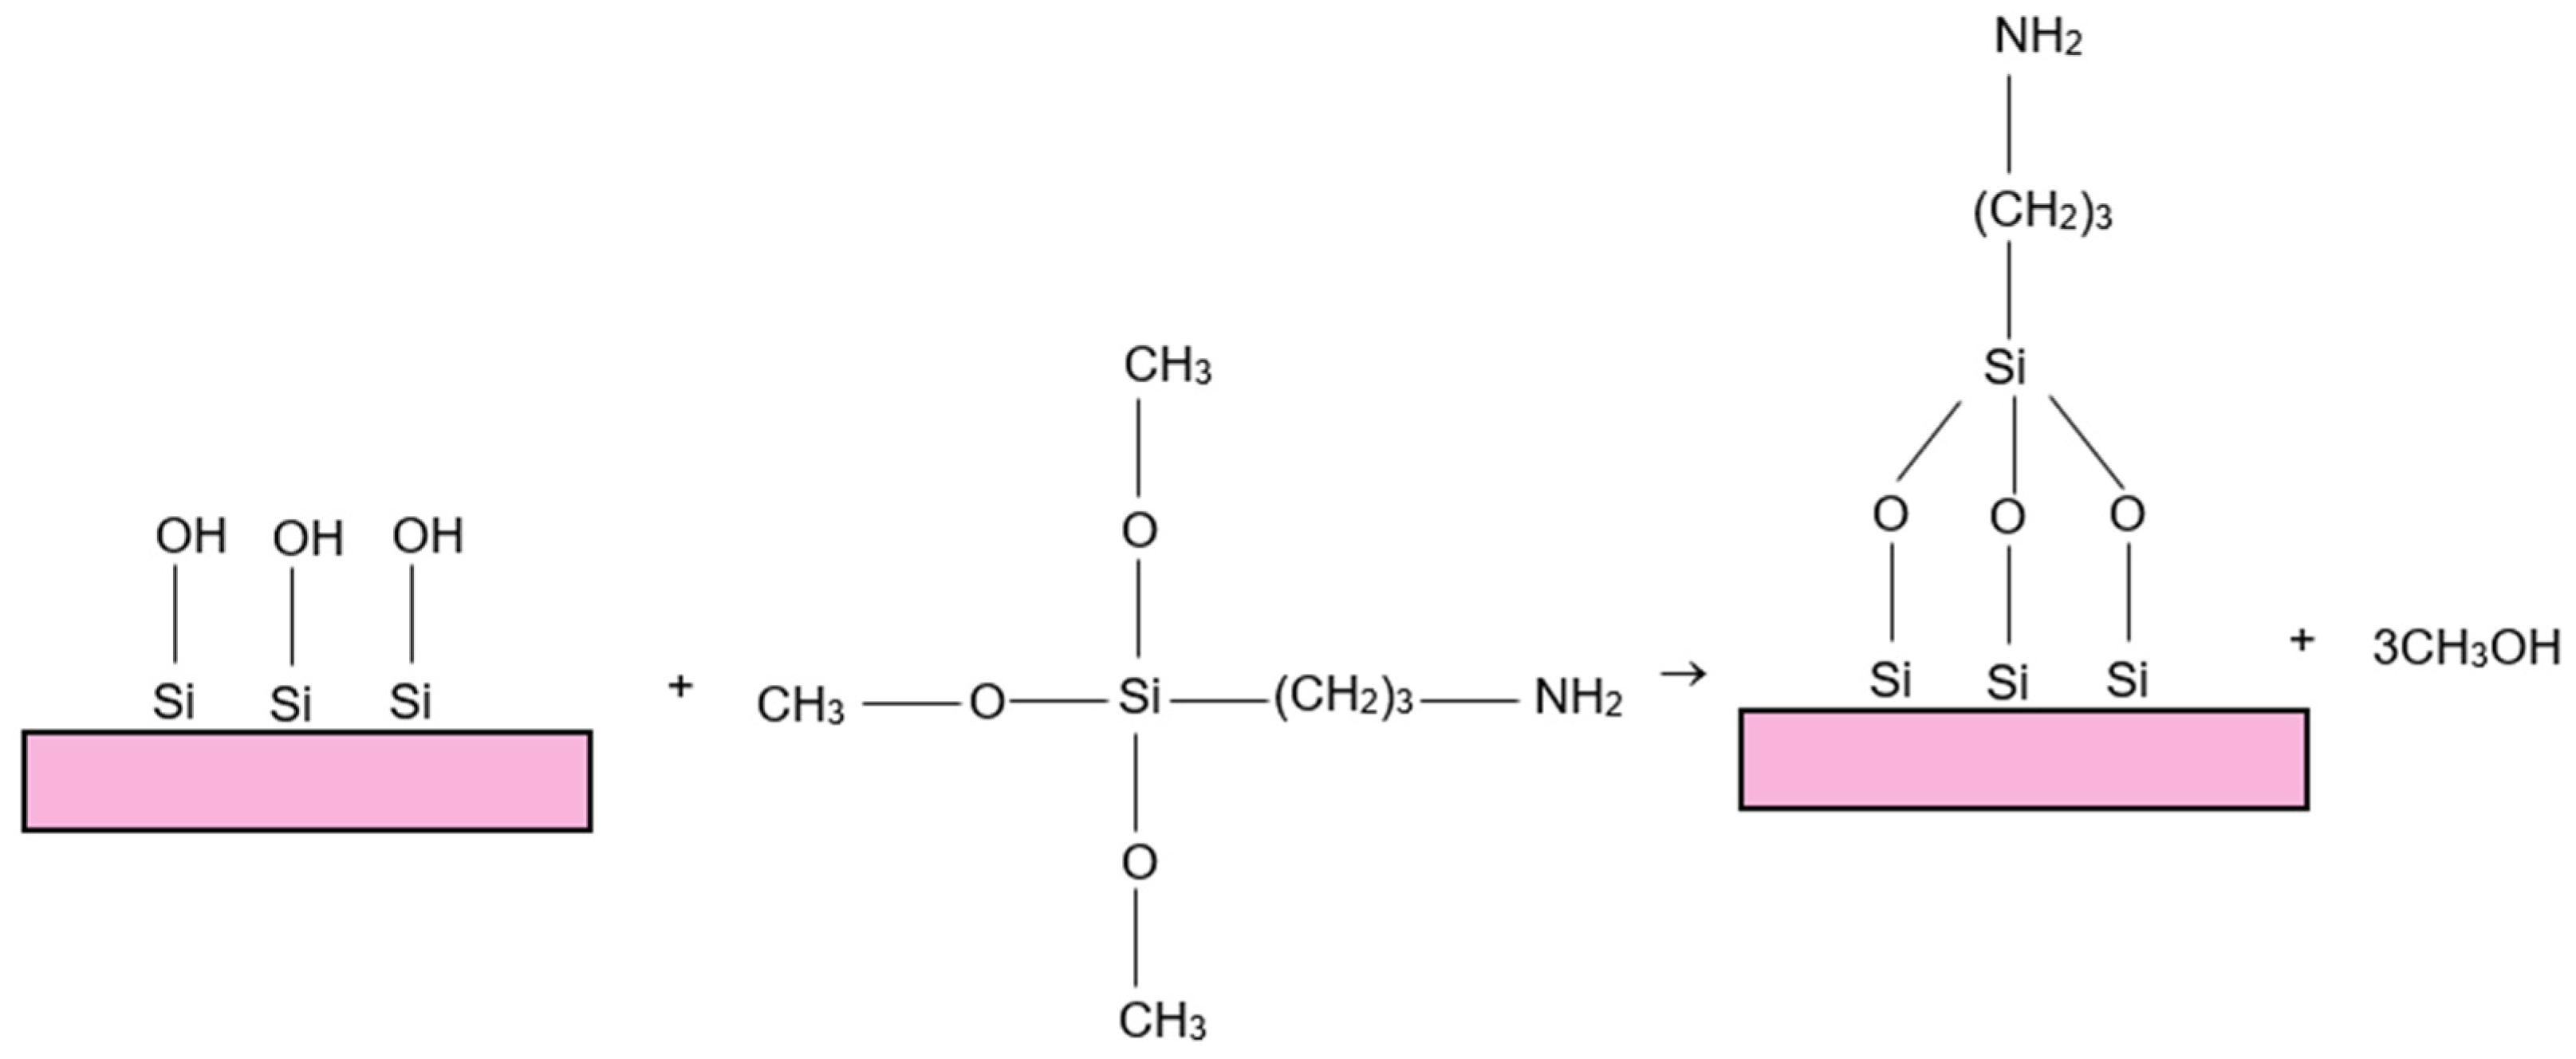
Another important factor for the flotation of fine particles is the level of their hydrophobicity. For this reason, a collector, which chemically binds to silica and hydrophobize it significantly, was selected—hexamethyldisilazane.
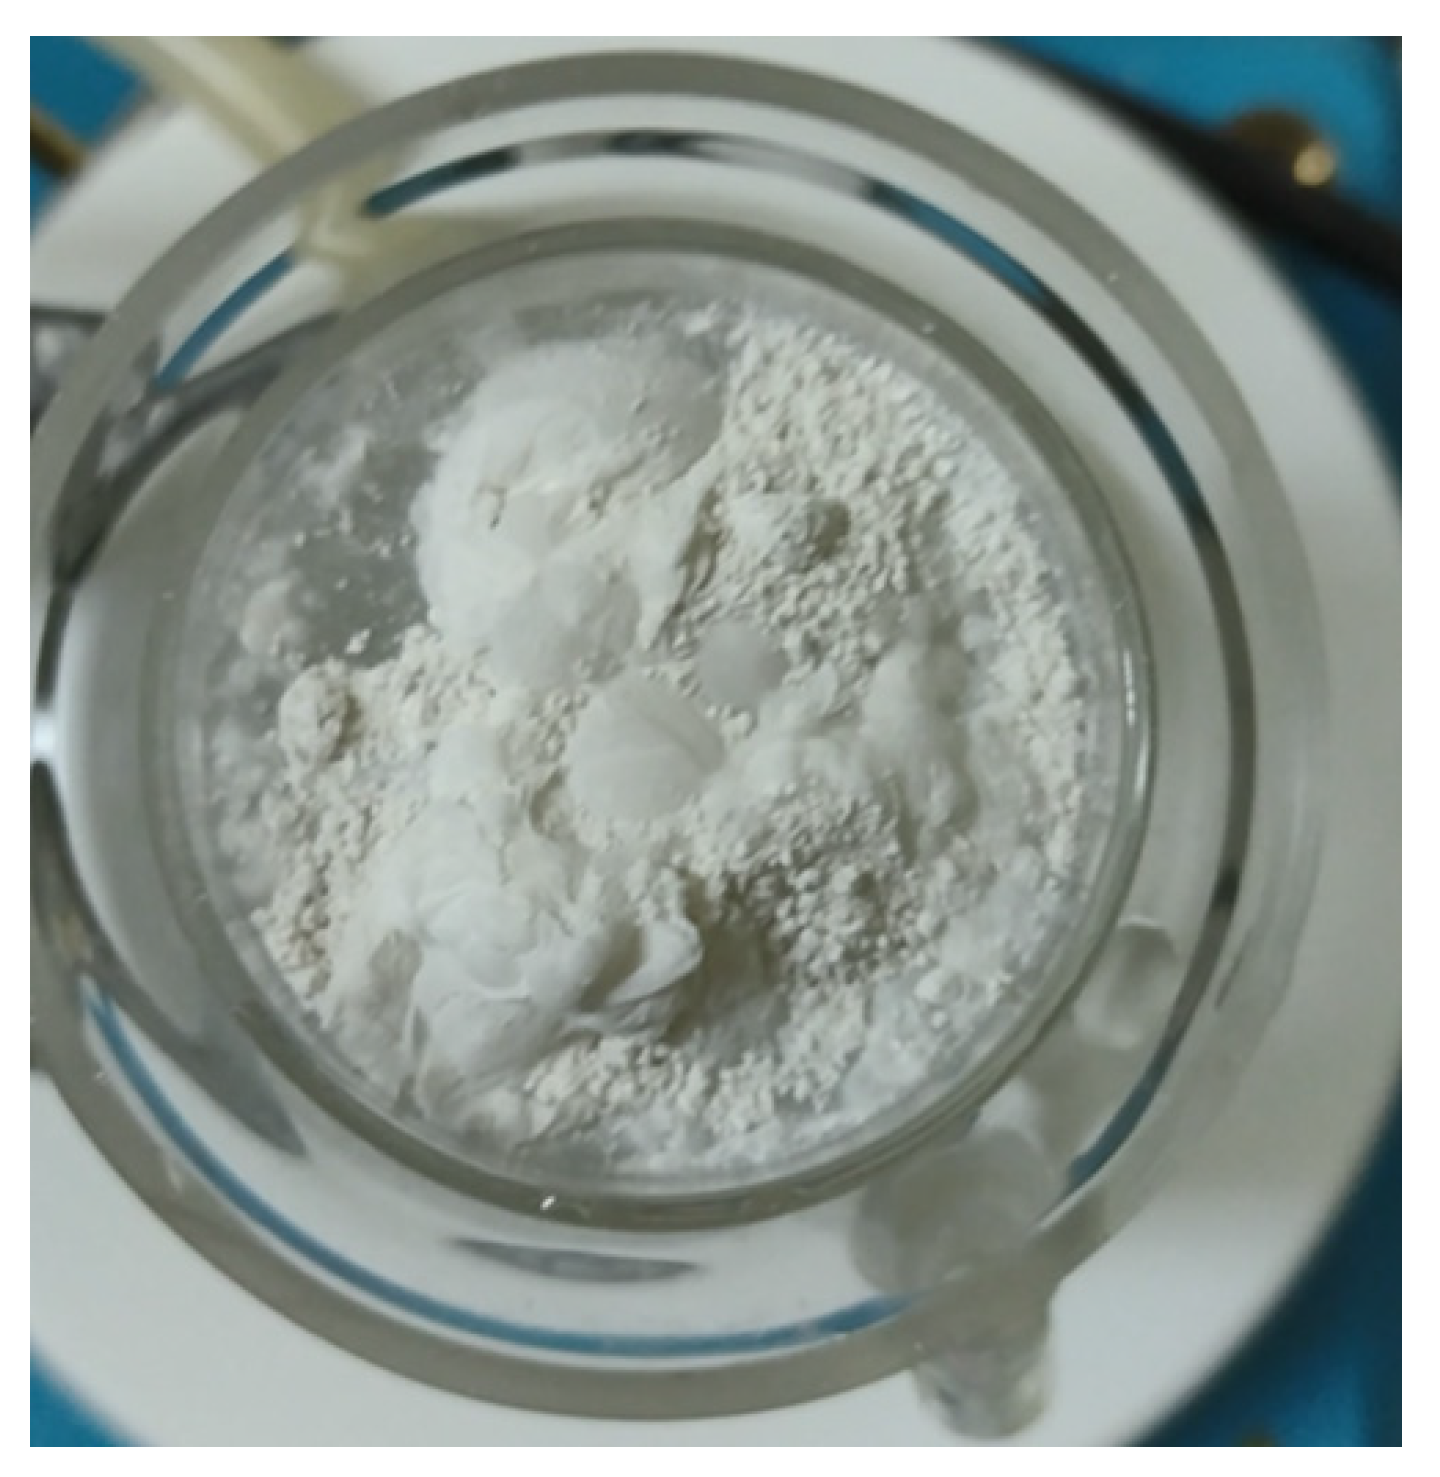
Hydrophobization of fine silica particles by dry conditioning with hexamethyldisilazane. The hydrophobized silica particles by means of hexamethyldisilazane did not become wet and all of it floated on the air/water interface (see Figure 21), thus realizing the so-called skin flotation [48]. Hence, the flotation of these particles in the presence of 10−4 mol/L MIBC (10 ppm) ended in a 100% flotation yield.
Table 7 shows the results from the flotation experiments of SiO2 and the mixture of MgCO3 and SiO2. One can see that this method works well for the artificial mixture of particles, the fraction of which can be hydrophobized. However, this method could be applicable for ores only at a very high level of liberation of ore particles. For this reason, a collector, who selectively binds to the MgCO3 areas on the magnesite particles, is needed.
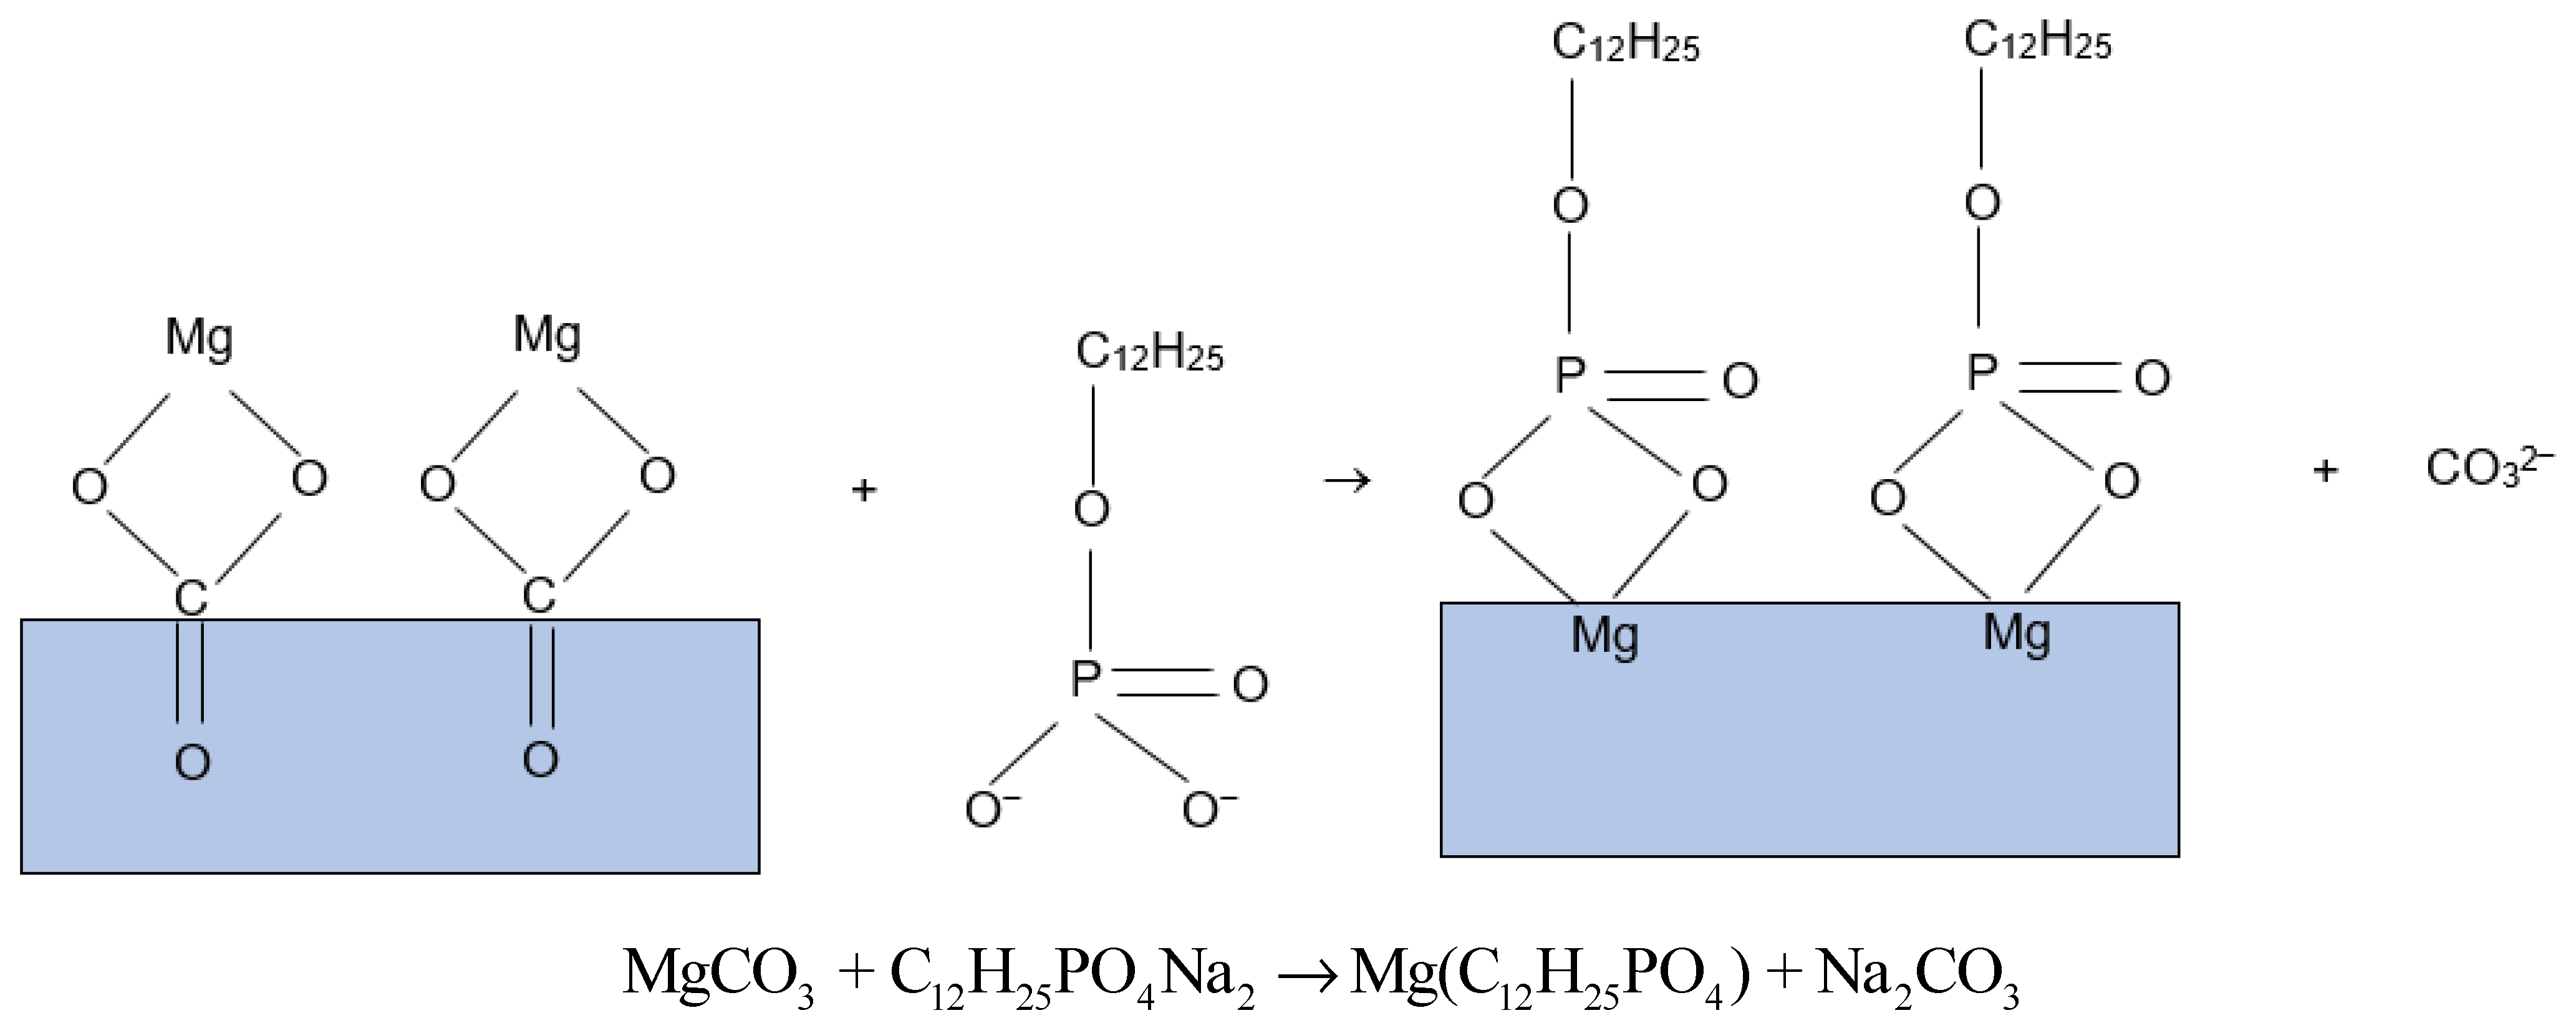
Selection of collector binding to Magnesite. It has been indicated here above that the significant hydrophobization of the fine particles can make them float well. For this reason, such a collector was sought. It has been reported [24,25,49] that phosphate ions adsorb well on the magnesite surface. Hence, a collector, which contains a phosphate group in its molecule to maximally hydrophobize the magnesite particles, was suggested. Table 8 shows the contact angle values of small water droplets on non-treated and treated with 3 mmol/L disodium dodecyl phosphate (C12H25PO4Na2) for 2 h at a temperature of 60° magnesite crystal. One can see a significant increase in the contact angle after the treatment. This corresponds to significant hydrophobization of the magnesite surface by means of the treatment with C12H25PO4Na2. Such a high level of hydrophobization should cause a high recovery of magnesite if the liberation of the magnesite ore particles is sufficient.
As described above, the flotation of the different samples was conducted immediately after the conditioning. The results are presented in Table 9. One can see a very good performance of the phosphate-based collector in the case of pure magnesite and the case of a mixture of pure magnesite and quartz fine particles. 
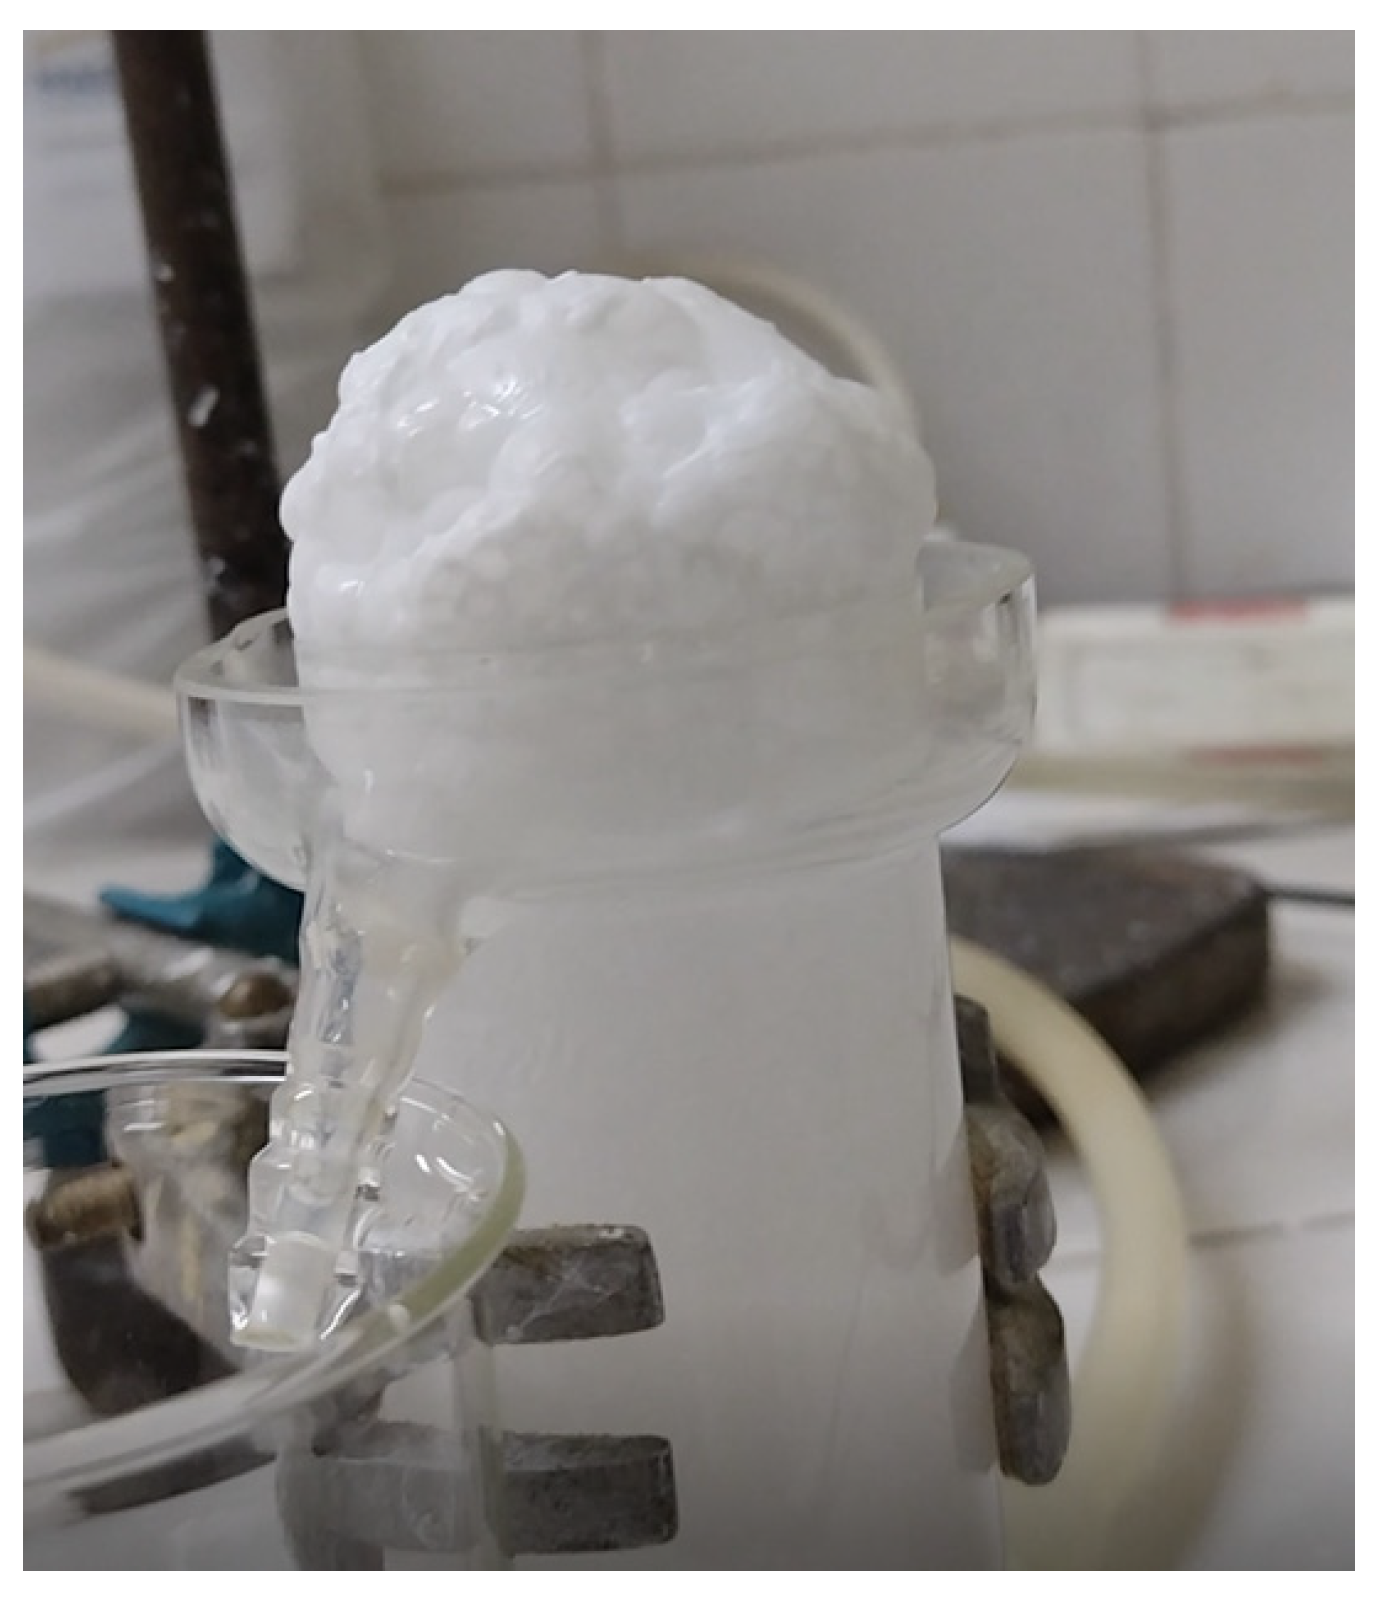
Figure 22 shows a photo of the flotation froth with magnesite particles.
One can see that the froth is dry and rich in particles. To achieve better separation of a mixture of mineral, a good level of liberation is needed.
Importance of the fine bubbles for flotation of fine particles. One can confirm from the above-presented results the importance of both—(i) the electrostatic attractions between bubbles and particles and (ii) the high level of hydrophobization of the latter ones for the flotation of fine particles. In addition, the high level of liberation of the particles is very important as well. Another additional important factor as confirmed from the literature (e.g., ref. [11]) is the size of the bubbles. According to the literature [50], the presence of fine bubbles increases the flotation rate of the fine particles significantly. Our analysis in ref. [13] show that the clash between fine particles and fine bubbles causes higher capillary pressure, pressing the bubbles and particles towards each other. For comparison, the clash with coarser bubbles results in lower capillary pressure. Yet, the finer bubbles are more difficult to deform than the coarser bubbles. Therefore, the drainage of wetting film between bubble and particle at their encounter is an unimportant factor. More important is the deformation of the bubble at its contact area with the particle. If the fine bubbles are difficult to deform at the very clash with the fine particles, how do they contribute to increasing the flotation rate of the fine particles? In our opinion, the fine bubbles have a higher rate of dissolution in water than the coarser bubbles. So, during the time of their encounter with very hydrophobic fine particles, the dissolved air in the wetting film forms nuclei, which precipitate, thus rupturing the wetting film and forming TPCL between the bubble and the particle. The additional electrostatic attraction between them makes this process even easier.
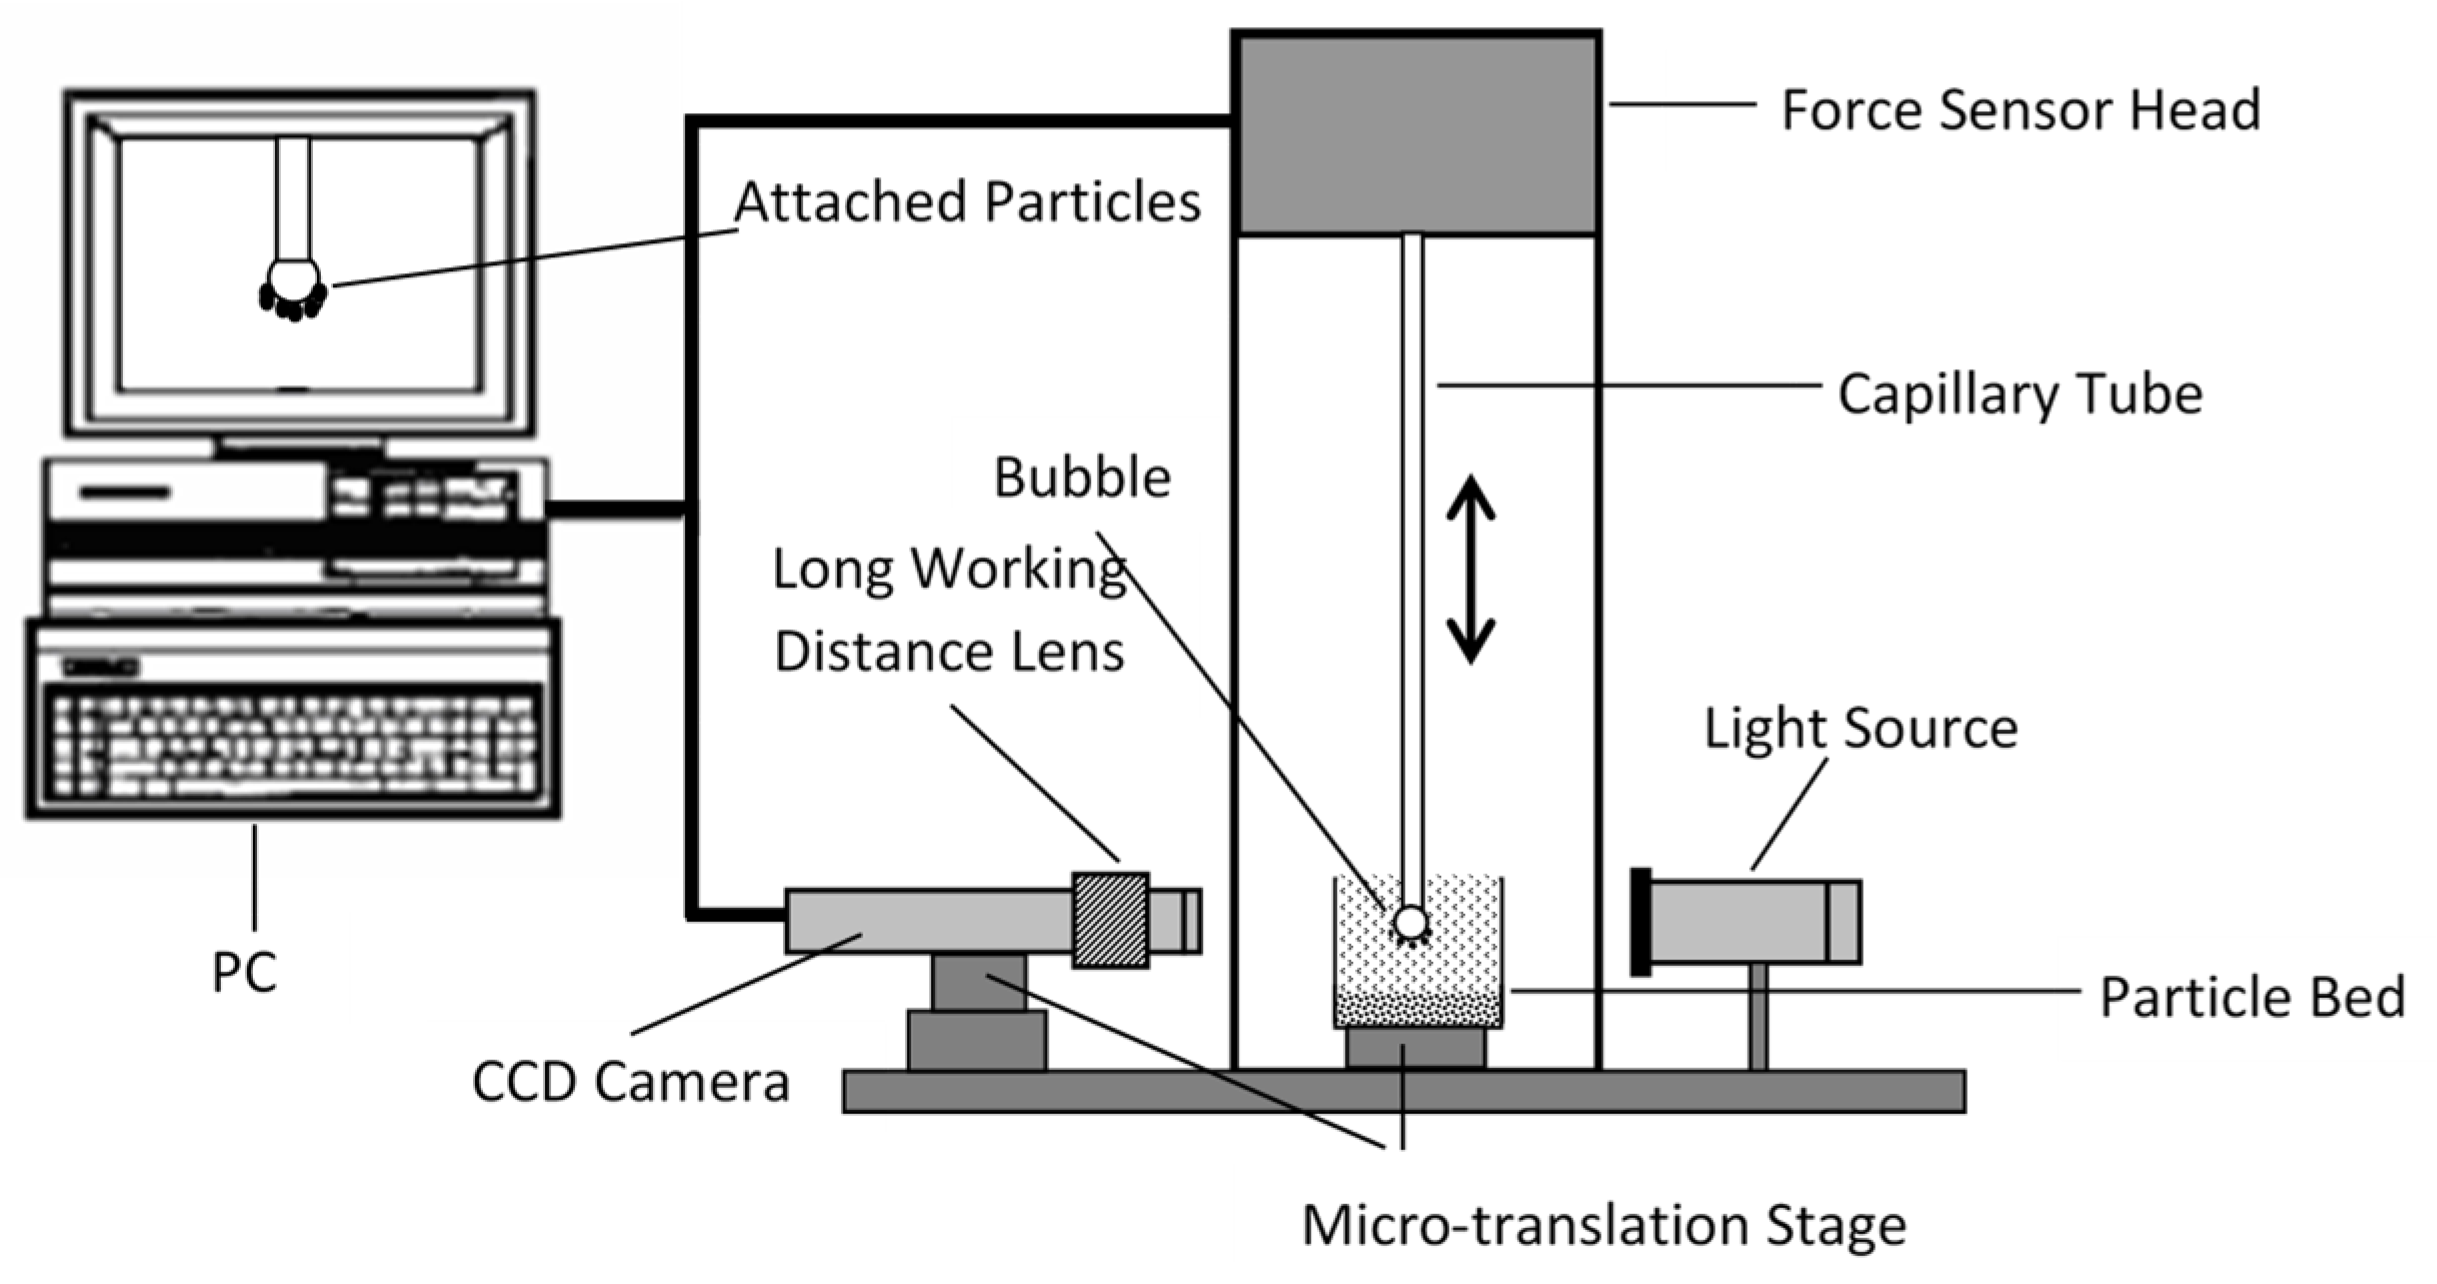
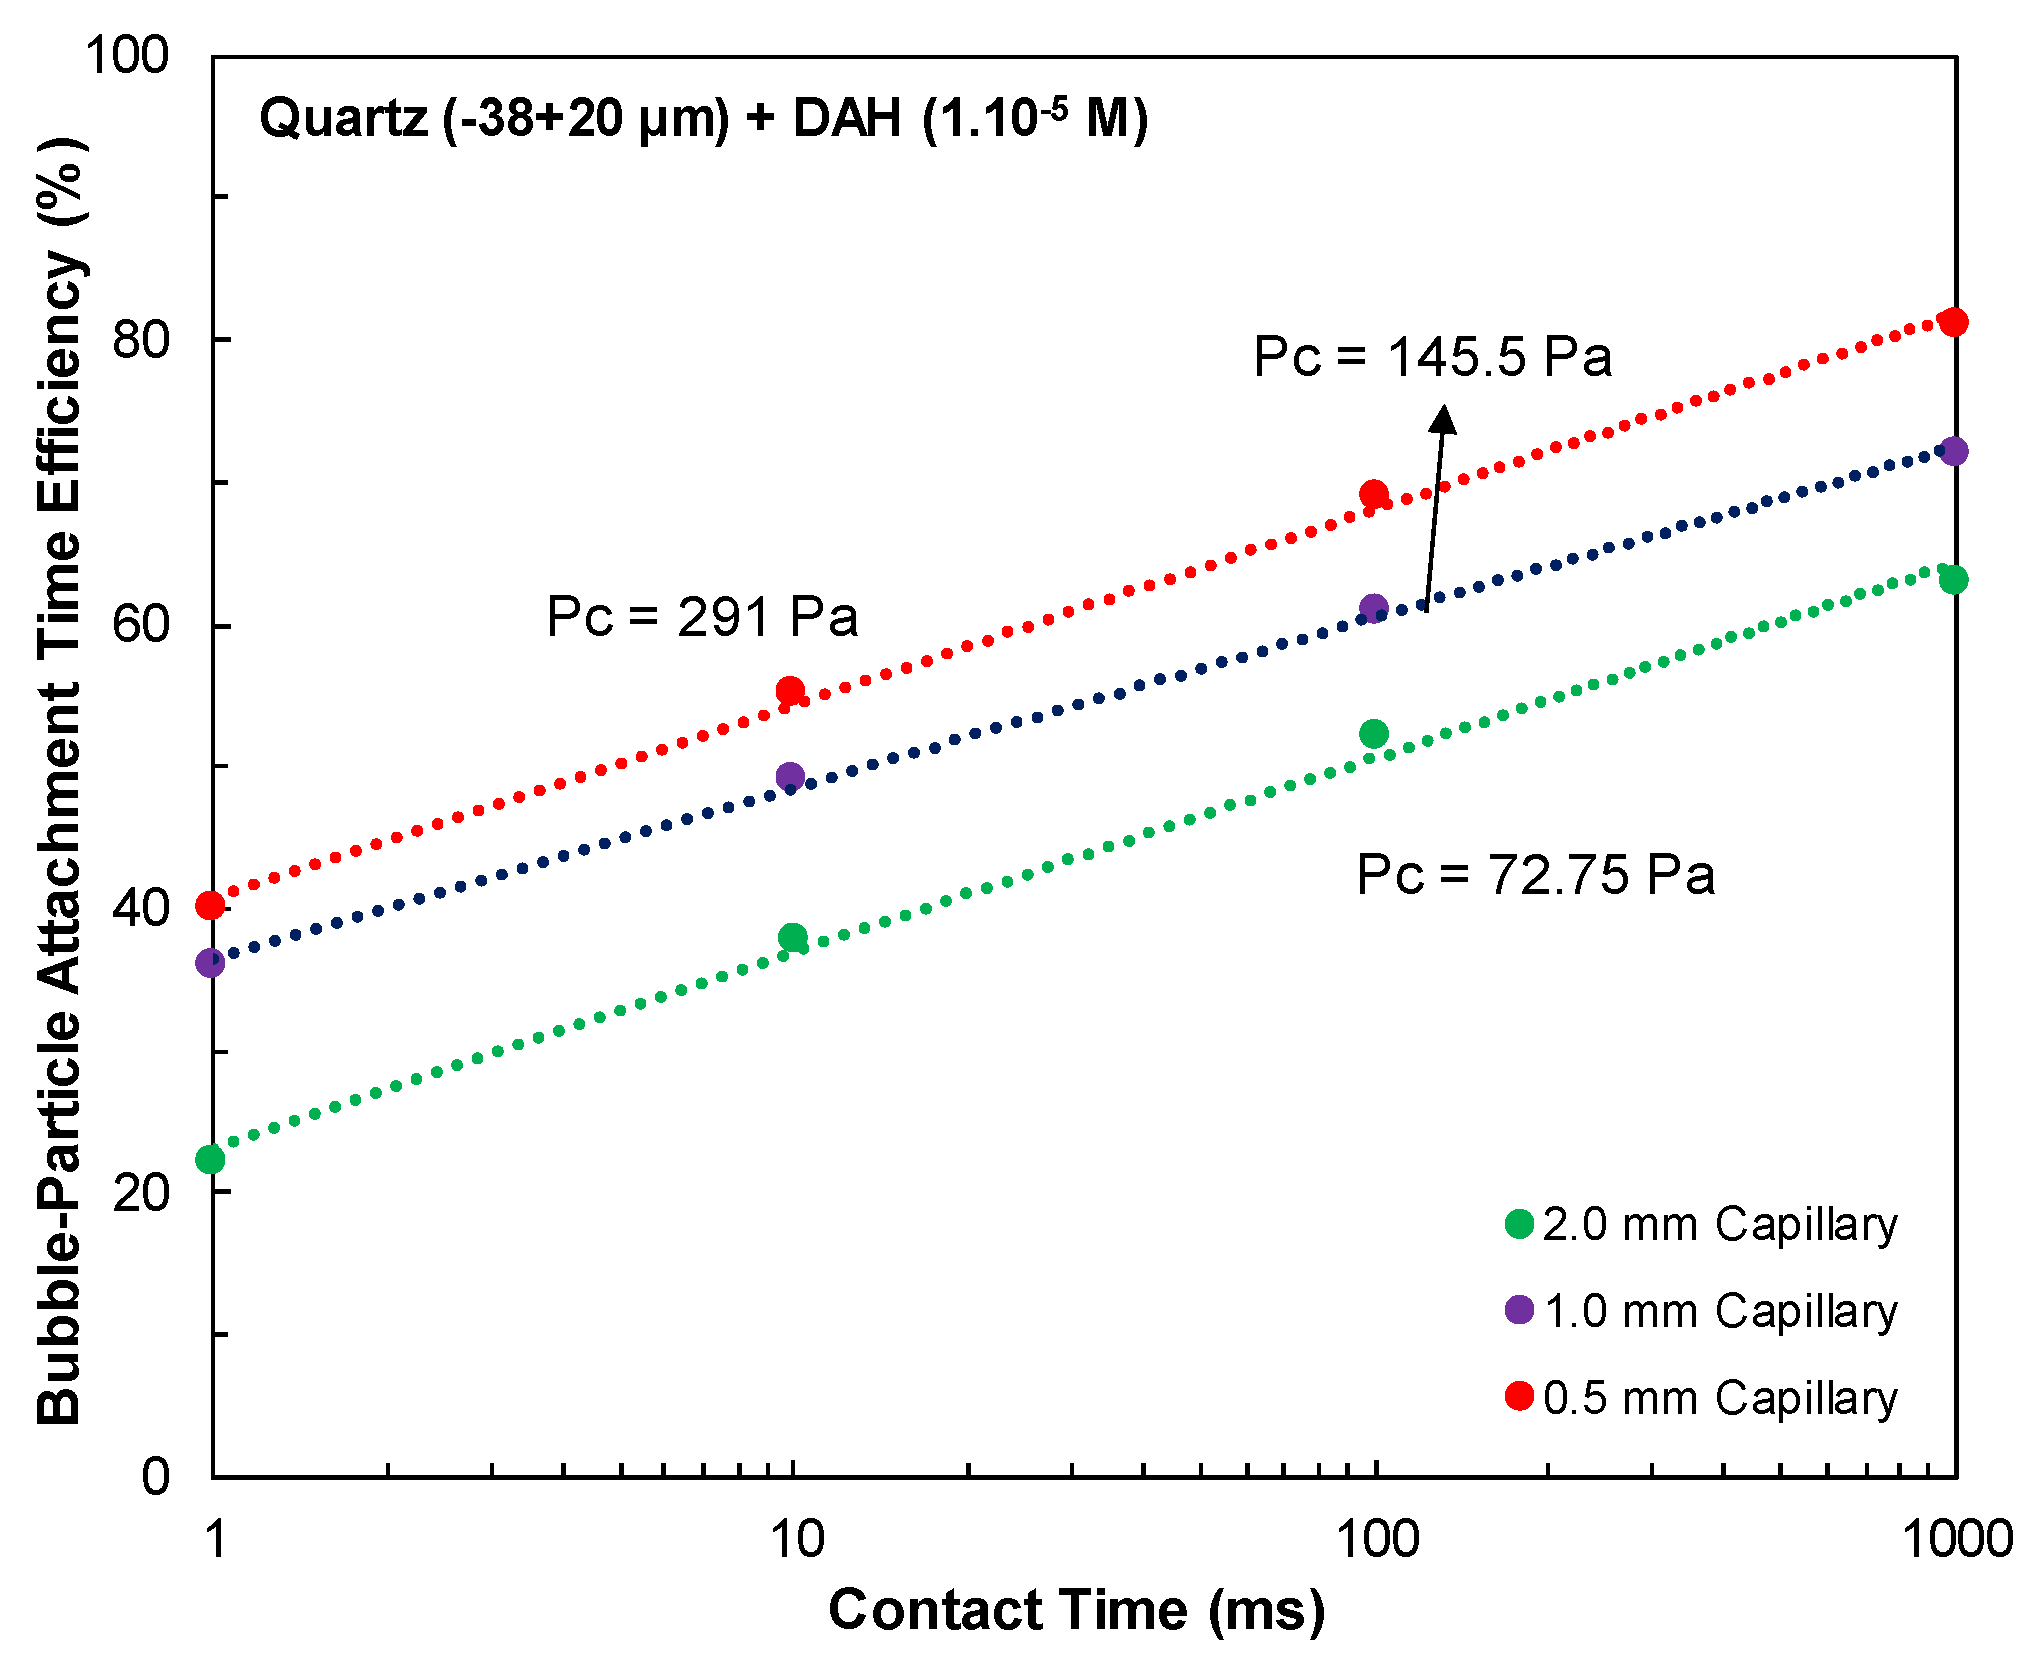
Bubble-particle attachment time experiments. This experiment aims at elucidating the bubble-particle attachment mechanism based on the bubble-particle attachment time values. The efficiency of flotation depends substantially on the ability of air bubbles to collect particles. The induction time, required for capturing of the particles, is a very important factor depending on the physicochemical properties of both bubble and particles. The experiments were carried out on silica particles (−38 µm + 20 µm) and in the presence of 10−5 mol/L DAH. Three different radii of the capillary tubes were used: 0.5 mm, 1 mm, and 2 mm. Figure 23 shows the bubble–particle attachment time efficiency versus the contact time for the three different radii of the capillary tubes—0.5 mm, 1 mm, and 2 mm. It is reasonable to assume that the sizes of both the bubble and the capillary tube coincide. Figure 23 shows the capillary pressure for each one of the tubes. It is evident that the efficiency is proportional to the capillary pressure and the size of the bubble. Hence, the clash of the bubbles with the particulate bottom with fine particles turns on the capillary pressure and higher dissolution of air into the wetting films.

6. Conclusions

This work is the continuation of our former work [13]: “Physical restrictions of the flotation of fine particles and ways to overcome them”. Our latest understanding of mineral particle flotation can be expressed in the following:
  • The drainage of wetting film between the bubble and the particle at their encounter is an unimportant factor during the capture of the particle by the bubble;
  • The wetting film ruptures due to (i) the deformation of the bubble by the particle across the wetting film during their clash, as well as (ii) the dissolution of the air from the bubble outwards towards the particle, thus forming nuclei whose precipitation depends on the level of hydrophobicity of the particle;
  • The fine particles can be floated with high recovery for a short time if: (i) they are sufficiently hydrophobic; (ii) electrostatic attraction between them and the bubble exists; (iii) fine bubbles with a high volume fraction are present;
  • The ore particles should have a high level of liberation.

Author Contributions

Experimental methodology, O.O.; validation, S.I.K., S.A., G.B. and N.A.G.; investigation, S.I.K., N.A.G., K.M., S.H., S.A. and G.B.; resources S.I.K., N.A.G. and S.H.; writing—review and editing, S.I.K.; supervision, O.O. and S.I.K.; project administration, S.I.K. All authors have read and agreed to the published version of the manuscript.

Funding

This paper is supported by European Union’s Horizon 2020 research and innovation program under grant agreement No. 821265, project FineFuture (Innovative technologies and concepts for fine particle flotation: unlocking future fine-grained deposits and Critical Raw Materials resources for the EU).

Conflicts of Interest

The authors declare no conflict of interest.

References

  1. Bennett, A.J.R.; Chapman, W.R.; Dell, C.C. Studies in Froth Flotation of Coal; Third International Coal Preparation Congress: Brussels, Belgium, 1958. [Google Scholar]
  2. De Vivo, D.G.; Karger, B.L. Studies in the flotation of colloidal particulates: Effects of aggregation in the flotation process. Sep. Sci. 1970, 5, 145–167. [Google Scholar]
  3. Reay, D.; Ratcliff, G.A. Experimental testing of the hydrodynamic collision model of fine particle flotation. Can. J. Chem. Eng. 1975, 53, 481–486. [Google Scholar] [CrossRef]
  4. Anfruns, J.F.; Kitchener, J.A. Rate of capture of small particles in flotation. Trans. Inst. Min. Metall. 1977, 86, 9–15. [Google Scholar]
  5. Orwe, D.; Grano, S.R.; Lauder, D.W. Increasing fine copper recovery at the Ok Tedi concentrator, Papua New Guinea. Miner. Eng. 1998, 11, 171–187. [Google Scholar] [CrossRef]
  6. Gaudin, A.M. Flotation; McGraw-Hill: New York, NY, USA, 1932. [Google Scholar]
  7. Anthony, R.M.; Kelsall, D.F.; Trahar, W.J. The Effect of Particle Size on the Activation and Flotation of Sphalerite; Australian Institute of Mining and Metallurgy: Carlton, VIC, Australia, 1975; pp. 47–58. [Google Scholar]
  8. Trahar, W.J. The selective flotation of galena from sphalerite with special reference to the effects of particle size. Int. J. Miner. Process. 1976, 3, 151–166. [Google Scholar] [CrossRef]
  9. Trahar, W.J. A rational interpretation of the role of particle size in flotation. Int. J. Miner. Process. 1981, 8, 289–327. [Google Scholar] [CrossRef]
  10. Feng, D.; Aldrich, C. Effect of particle size on flotation performance of complex sulphide ores. Miner. Eng. 1999, 12, 721–731. [Google Scholar] [CrossRef]
  11. Ahmed, N.; Jameson, G.J. The effect of bubble size on the rate of flotation of fine particles. Int. J. Miner. Process. 1985, 14, 195–215. [Google Scholar] [CrossRef]
  12. Farrokhpay, S.; Filippov, L.; Fornasiero, D. Flotation of Fine Particles: A Review. Miner. Procesing Extr. Metal. Rev. 2021, 42, 473–483. [Google Scholar] [CrossRef]
  13. Karakashev, S.I.; Grozev, N.A.; Ozdemir, O.; Guven, O.; Ata, S.; Bournival, G.; Batjargal, K.; Boylu, F.; Hristova, S.; Çelik, M.S. Physical restrictions of the flotation of fine particles and ways to overcome them. Physicochem. Probl. Miner. Process. 2022, 58, 153944. [Google Scholar] [CrossRef]
  14. Sutherland, K. The physical chemistry of flotation XI. Kinetics of the flotation process. J. Phys. Chem. 1948, 52, 394–425. [Google Scholar] [CrossRef]
  15. Von Smoluchowski, M. Versucheiner Mathematischen Theorie der Koagulations Kinetic Kolloider Lousungen. Z. Phys. Chem. 1917, 92, 129–168. [Google Scholar]
  16. Yoon, R.H.; Luttrell, G.H. The effect of bubble size on fine particle flotation. Miner. Procesing Extr. Metall. Rev. 1989, 5, 101–122. [Google Scholar] [CrossRef]
  17. Abrahamson, J. Collision rates of small particles in a vigorously turbulent fluid. Chem. Eng. Sci. 1975, 30, 1371–1379. [Google Scholar] [CrossRef]
  18. Schubert, H. On the turbulence-controlled microprocesses in flotation machines. Int. J. Miner. Process. 1999, 56, 257–276. [Google Scholar] [CrossRef]
  19. Scheludko, A.; Toshev, B.V.; Bojadjiev, D.T. Attachment of particles to a liquid surface (capillary theory of flotation). J. Chem. Soc. Faraday Trans. 1 1976, 72, 2815–2828. [Google Scholar] [CrossRef]
  20. Scheludko, A. Thin liquid films. Adv. Colloid Interface Sci. 1967, 1, 391–464. [Google Scholar] [CrossRef]
  21. Ivanov, I.B.E. Thin Liquid Films; Marcel Dekker: New York, NY, USA, 1988. [Google Scholar]
  22. Nguyen, A.V.; Schulze, H.J. Colloidal Science of Flotation; Marcel Dekker: New York, NY, USA, 2003; p. 840. [Google Scholar]
  23. Jameson, G.J. The effect of surface liberation and particle size on flotation rate constants. Miner. Eng. 2012, 36–38, 132–137. [Google Scholar] [CrossRef]
  24. Filippov, L.O.; Filippova, I.V.; Fekry, A.M.; Fornasiero, D. Investigation of the effect of phosphoric acid as an acidic medium in flotation separation of dolomite from magnesite. Miner. Eng. 2023, 198, 108079. [Google Scholar] [CrossRef]
  25. Mao, Y.; Liu, W.; Chen, X.; Wang, Z.; Liu, W.; Sun, W.; Shen, Y. The role of sodium tripolyphosphate in wet grinding process of magnesite. Colloids Surf. A Physicochem. Eng. Asp. 2023, 668, 131449. [Google Scholar] [CrossRef]
  26. Derjaguin, B.; Landau, L. Theory of the stability of strongly charged lyophobic sols an of the adhesion of strongly charged particles in solutions of electrolytes. Acta Phys.-Chim. 1941, 14, 633–662. [Google Scholar] [CrossRef]
  27. Verwey, E.J.W.; Overbeek, J.T.G. Theory of the Stability of Lyophobic Colloids; Elsevier: Amsterdam, The Netherlands, 1948; p. 218. [Google Scholar]
  28. Shahbazi, B.; Rezai, B.; Javad Koleini, S.M. Bubble-particle collision and attachment probability on fine particles flotation. Chem. Eng. Process. Process Intensif. 2010, 49, 622–627. [Google Scholar] [CrossRef]
  29. Exerowa, D.; Kruglyakov, P.M. Foam and Foam Films: Theory, Experiment, Application; Marcel Dekker: New York, NY, USA, 1997; p. 796. [Google Scholar]
  30. Kralchevsky, P.A.; Danov, K.D.; Denkov, N.D. Chemical Physics of Colloid Systems and Interfaces. In Handbook of Surface and Colloid Chemistry, 4th ed.; Birdi, K.S., Ed.; CRC Press: Boca Raton, FL, USA; Taylor & Francis Group: Abingdon, UK, 2016; pp. 247–413. [Google Scholar]
  31. Karakashev, S.I.; Stoeckelhuber, K.W.; Tsekov, R. Wetting films on chemically patterned surfaces. J. Colloid Interface Sci. 2011, 363, 663–667. [Google Scholar] [CrossRef] [PubMed]
  32. Australian Standard. Froth Flotation—Basic test (AS 4156.2.1). In Cola Preparation: Part 2.1: Higher Rank Coal; Standards Australia International: Sydney, Australia, 2016; Volume AS 4156.2.1, pp. 1–11. [Google Scholar]
  33. Amelunxen, P.; LaDouceur, R.; Amelunxen, R.; Young, C. A phenomenological model of entrainment and froth recovery for interpreting laboratory flotation kinetic tests. Miner. Eng. 2018, 125, 60–65. [Google Scholar] [CrossRef]
  34. Ozdemir, O.; Karaguzel, C.; Nguyen, A.V.; Celik, M.S.; Miller, J.D. Contact angle and bubble attachment studies in the flotation of trona and other soluble carbonate salts. Miner. Eng. 2009, 22, 168–175. [Google Scholar] [CrossRef]
  35. Ozdemir, O.; Karakashev, S.I.; Nguyen, A.V.; Miller, J.D. Adsorption and surface tension analysis of concentrated alkali halide brine solutions. Miner. Eng. 2009, 22, 263–271. [Google Scholar] [CrossRef]
  36. Gungoren, C.; Ozdemir, O.; Wang, X.; Ozkan, S.G.; Miller, J.D. Effect of ultrasound on bubble-particle interaction in quartz-amine flotation system. Ultrason. Sonochem. 2019, 52, 446–454. [Google Scholar] [CrossRef]
  37. Albijanic, B.; Ozdemir, O.; Nguyen, A.V.; Bradshaw, D. A review of induction and attachment times of wetting thin films between air bubbles and particles and its relevance in the separation of particles by flotation. Adv. Colloid Interface Sci. 2010, 159, 1–21. [Google Scholar] [CrossRef]
  38. Tsekov, R.; Grozev, N.A.; Delcheva, I.V.; Ivanov, I.T.; Balashev, K.; Karakashev, S.I. Delta-Comb Potential in Modeling Three-Phase Contact Line (TPCL) on Periodically Patterned Surfaces. J. Phys. Chem. B 2012, 116, 13248–13253. [Google Scholar] [CrossRef]
  39. Nakayama, K.; Tari, I.; Sakai, M.; Murata, Y.; Sugihara, G. Aggregation Behavior of Sodium Mono-n-Dodecyl Phosphate Surfactant in Aqueous Media, and Function in Catalytic Activity. I. Multi-Step Aggregates Formation and Catalytic Activity for Hydrolysis of p-Nitrophenyl Acetate in Aqueous Solution. J. Oleo Sci. 2004, 53, 247–265. [Google Scholar] [CrossRef] [Green Version]
  40. Anirudhan, T.S.; Jalajamony, S.; Sreekumari, S.S. Adsorption of heavy metal ions from aqueous solutions by amine and carboxylate functionalised bentonites. Appl. Clay Sci. 2012, 65–66, 67–71. [Google Scholar] [CrossRef]
  41. Miller, J.D.; Laskowski, J.S.; Chang, S.S. Dextrin adsorption by oxidized coal. Colloids Surf. 1983, 8, 137–151. [Google Scholar] [CrossRef]
  42. Karakashev, S.I.; Firouzi, M.; Wang, J.; Alexandrova, L.; Nguyen, A.V. On the stability of thin films of pure water. Adv. Colloid Interface Sci. 2019, 268, 82–90. [Google Scholar] [CrossRef] [PubMed]
  43. Bueno-Tokunaga, A.; Pérez-Garibay, R.; Martínez-Carrillo, D. Zeta potential of air bubbles conditioned with typical froth flotation reagents. Int. J. Miner. Process. 2015, 140, 50–57. [Google Scholar] [CrossRef]
  44. Wang, L.; Peng, Y.; Runge, K.; Bradshaw, D.J. A review of entrainment: Mechanisms, contributing factors and modelling in flotation. Miner. Eng. 2015, 70, 77–91. [Google Scholar] [CrossRef]
  45. Wang, L.; Runge, K.; Peng, Y.; Vos, C. An empirical model for the degree of entrainment in froth flotation based on particle size and density. Miner. Eng. 2016, 98, 187–193. [Google Scholar] [CrossRef]
  46. Zurita, L.; Carrique, F.; Delgado, A.V. The primary electroviscous effect in silica suspensions. Ionic strength and pH effects. Coll. Surf. A 1994, 92, 23–28. [Google Scholar] [CrossRef]
  47. Yang, C.; Dabros, T.; Li, D.Q.; Czarnecki, J.; Masliyah, J.H. Measurement of the zeta potential of gas bubbles in aqueous solutions by microelectrophoresis method. J. Colloid Interface Sci. 2001, 243, 128–135. [Google Scholar] [CrossRef]
  48. Wark, I.W. The Physical Chemistry of Flotation I. J. Phys. Chem. 1933, 37, 623–644. [Google Scholar] [CrossRef]
  49. Badawi, M. DFT Calculations on the Adsorption of Phosphate Ions on Magnesite; Karakashev, S.I., Ed.; Université de Lorraine: Nancy, France, 2021. [Google Scholar]
  50. Farrokhpay, S.; Filippova, I.; Filippov, L.; Picarra, A.; Rulyov, N.; Fornasiero, D. Flotation of fine particles in the presence of combined microbubbles and conventional bubbles. Miner. Eng. 2020, 155, 106439. [Google Scholar] [CrossRef]
Figure 1. Two main scenarios of collision between a bubble and fine particle (on the left) and a bubble and coarse particle with attachment (on the right).
Minerals 13 00957 g001
Figure 2. Sketch of spherical particle penetrating a bubble.
Minerals 13 00957 g002
Figure 3. Interferometric setup of Scheludko-Exerowa for studying thin wetting films [31].
Minerals 13 00957 g003
Figure 4. Processed digitally filtrated interferogram of dimple-like wetting film in many parallel lines and the corresponding 3D film thickness profile.
Minerals 13 00957 g004
Figure 5. Schematic presentation of the bubble-particle attachment time unit.
Minerals 13 00957 g005
Figure 6. The reaction of the hexamethyldisilazane molecules with the silica surface Si−OH groups.
Minerals 13 00957 g006
Figure 7. The reaction of disodium dodecyl phosphate with magnesium carbonate on the surface of magnesite mineral.
Minerals 13 00957 g007
Figure 8. Surface tension isotherm of disodium dodecyl phosphate (C12H25PO4Na2) at T = 60° C [39].
Minerals 13 00957 g008
Figure 9. The reaction of amino–3–methoxy silane (APTMS) with the silica surface Si−OH groups.
Minerals 13 00957 g009
Figure 10. The thickness of rupturing of the wetting films (A) and average film lifetime (B) versus the intrinsic contact angle of the minerals.
Minerals 13 00957 g010
Figure 11. Time for thinning of a wetting film between a silica particle moving with 0.1 m/s and a bubble with a radius of 200 µm from a distance of 1 µm to a distance 0.02 µm from the contact area of the bubble vs. the radius of the particle [13].
Minerals 13 00957 g011
Figure 12. Wetting film thickness vs. time on quartz in DI water (pH = 5.8): dots=experimental curve; the red line is the theoretical curve (Equations (2) and (4)).
Minerals 13 00957 g012
Figure 13. Wetting film thickness vs. time on quartz in 10−4 mol/L MIBC at pH = 4: dots=experimental curve; the red line is the theoretical curve (Equations (2) and (4)).
Minerals 13 00957 g013
Figure 14. Wetting film thickness vs. time on modified with hexylamine (HA) quartz in DI water: dots are the experimental curve; the red line is the theoretical curve with excluded electrostatic repulsion (Equation (4)); the black line is the theoretical curve assuming surface potential of the quartz surface Ψs = −21.3 mV, taken from the experiment on zeta potential of treated with hexylamine STERILES–MS 45 particles in DI water. The surface potential of the air/water interface (Ψs = 65 mV) was calculated following the DLVO theory.
Minerals 13 00957 g014
Figure 15. Zeta potential of STERILES–MS 45 gangue particles and air micro-bubbles in 0.01 mol/L NaCl versus pH; the zeta potential of STERILES–MS 45 and air bubble in 0.05 mol/L hexylamine is signified in the figure; the data of the zeta potential were taken from ref. [43] and permitted by Elsevier with license No. 5556490850582.
Minerals 13 00957 g015
Figure 16. Photos of flotation of 1 wt.% STERILES–MS 45 in the presence of (A) 10−4 mol/L MIBC with flotation yield = 7% (ζ1 = −65 mV, ζ2 = −13.3 mV), and (B) 0.05 mol/L hexylamine with flotation yield = 61% (ζ1 = 65 mV, ζ2 = −18.6 mV).
Minerals 13 00957 g016
Figure 17. Zeta potential of KERMA 90-45 magnesite particles and air micro-bubbles in 0.01 mol/L NaCl versus pH; the zeta potential of KERMA 90-45 magnesite particles and air bubble in 0.05 mol/L hexylamine is signified in the figure; the data of the zeta potential were taken from ref. [43] and permitted by Elsevier with license No 5556490850582.
Minerals 13 00957 g017
Figure 18. Photos of flotation of 1 wt.% KERMA 90-45 of 0.05 mol/L hexylamine with flotation yield = 18.3% (ζ1 = 65 mV, ζ2 = −6 mV).
Minerals 13 00957 g018
Figure 19. Recovery of silica fine particles (−20 μm) and water in the presence of 0.05 mol/L hexylamine as a function of time. The true and entrained recoveries were estimated based on a degree of entrainment of 0.4501. The experimental error is about 2% flotation recovery.
Minerals 13 00957 g019
Figure 20. Zeta potential of modified silica particles and micro-bubbles [47] versus pH at I = 0.001 mol/dm3. Photo of flotation froth of modified silica particles at 10 ppm MIBC at pH = 5.8. The IEP of the particles is at pH = 9.26. The experimental error is about 5 mV. The IEP of the particles is at pH = 9.26. The experimental error is about 5 mV; the data of the zeta potential of the bubbles were taken from ref. [43] and permitted by Elsevier with license No 5556490850582.
Minerals 13 00957 g020
Figure 21. A photo of hydrophobized with hexamethyldisilazane silica in the flotation cell.
Minerals 13 00957 g021
Figure 22. Photo of flotation froth containing pure magnesite (MgCO3) with collector 3 × 10⁻³ mol/L disodium dodecyl phosphate and in the presence of 5 × 10⁻⁴ mol/L (50 ppm) MIBC.
Minerals 13 00957 g022
Figure 23. Bubble–particle attachment efficiency versus contact time on silica particles (−38 µm + 20 µm) and in the presence of 10−5 mol/L DAH and three different radii of the capillary tube. The experimental error is about 2% bubble–particles attachment time efficiency.
Minerals 13 00957 g023
Table 1. Minerals, their intrinsic contact angles, an average thickness of film rupture, and an average lifetime of the wetting films from DI water on chalcopyrite, pyrite, fluorite, calcite, magnesite, and quartz.
MineralIntrinsic Contact Angle, degAverage Thickness of Film Rupture, nmAverage Lifetime of the Wetting Film, s
Chalcopyrite87.16 ± 7.0398.5 ± 68.31.20 ± 0.88
Pyrite75.00 ± 7.0350.3 ± 31.91.61 ± 1.08
Fluorite67.13 ± 7.5101.8 ± 68.715.13 ± 15.00
Calcite52.00 ± 6.563.9 ± 50.23.50 ± 1.89
Magnesite39.50 ± 2.547.3 ± 18.96.79 ± 1.40
Quartz27.40 ± 7.4No rupturingMany hours
Table 2. Contact angles, the average thickness of film rupture, and the average lifetime of the wetting films from DI water on intrinsic and treated with hexylamine (HA) quartz.
MineralAverage Contact Angle, degAverage Thickness of Film Rupture, nmAverage Lifetime of the Wetting Film, s
Quartz27.40 ± 7.4No rupturingMany hours
Modified with HA quartz54.50 ± 5.265 ± 528.6 ± 7.6
Table 3. Contact angles, the average thickness of film rupture, and the average lifetime of the wetting films from DI water on intrinsic and treated with hexylamine magnesite.
MineralAverage Contact Angle, degAverage Thickness of Film Rupture, nmAverage Lifetime of the Wetting Film, s
Magnesite39.50 ± 2.547.3 ± 18.96.79 ± 1.40
Modified with HA magnesite51.72 ± 7.566.0 ± 59.05.30 ± 3.3
Table 4. Particles and their flotation yields with 0.05 mol/L hexylamine and 10−4 mol/L MIBC.
ParticlesFlotation Yield in 0.05 mol/L HexylamineFlotation Yield in 10−4 mol/L MIBC
STERILES–MS 45 (−45 μm)63.0%7.2%
KERMA 90-45 (−24 μm)18.3%18%
SiO2 (−10 μm)92.2%7.0%
MgCO3 (−20 μm)22.2%7.9%
Table 5. Feed (MgCO3/SiO2), flotation yield, recoveries and inverted recoveries of MgCO3 and SiO2, and grade of the concentrate and inverted grade of the particles on the bottom of the cell after flotation in the presence of 0.05 mol/L hexylamine.
Feed (MgCO3/SiO2)55/45
Flotation yield %83.00
Recovery SiO2 %92.00
Recovery MgCO3 %77.00
Inverted recovery SiO2 %12.00
Inverted recovery MgCO3 %20.00
Grade (MgCO3/SiO2) %50.9/49.2
Inverted grade (MgCO3/SiO2)67.6/32.4
Table 6. Flotation yield of modified and unmodified fine hydrophilic silica particles; pH = 5.8 at 10−4 mol/L MIBC.
SampleFlotation YieldSurface Potentials of Particle Ψp and Bubble Ψb
Unmodified fine silica particles11.2%Ψp = −70 mV, Ψb = −65 mV
Modified fine silica particles47.4%Ψp = +60 mV, Ψb = −65 mV
Table 7. Flotation yield, recovery, and grade of SiO2 and the mixture of MgCO3 and SiO2 treated with hexamethyldisilazane at 10−4 mol/L (10 ppm) MIBC.
SampleFlotation Yield (%)Recovery of SiO2 (%)Grade of Concentrate
MgCO3/SiO2 (%)
Inverted Recovery of SiO2 (%)Grade of Tailings
MgCO3/SiO2 (%)
SiO210010010000
MgCO3/SiO2 = 51/4966.2597.3428:722.6596.16:3.84
Table 8. Contact angle values of small water droplet on non-treated and treated with 3 mM/L disodium dodecyl phosphate (C12H25PO4Na2) for 2 h at a temperature of 60° magnesite crystal.
MineralIntrinsic Contact Angle, degContact Angle after Treatment, deg
Magnesite39.50 ± 2.594.2 ± 2.5
Table 9. Results from 2 min flotation of 1 wt.% suspensions of different magnesite samples in the presence of 3 mmol/L disodium dodecyl phosphate (C12H25PO4Na2) + 0.5 mM/L MIBC.
SampleFeed GradeFlotation YieldRecovery of MagnesiteConcentrateTailing
MgCO3 (fines)100%89.40%89.4%100%100%
MgCO3/SiO2 (fines)56%/44%78.16%98.43%77.56%/22.44%4%/96%
Disclaimer/Publisher’s Note: The statements, opinions and data contained in all publications are solely those of the individual author(s) and contributor(s) and not of MDPI and/or the editor(s). MDPI and/or the editor(s) disclaim responsibility for any injury to people or property resulting from any ideas, methods, instructions or products referred to in the content.

