Article

Pathway to Prediction of Pyrite Floatability from Copper Ore Geological Domain Data

by
Unzile Yenial-Arslan
1,2,*,
Mayra Jefferson
1,
Catherine Curtis-Morar
3 and
Elizaveta Forbes
1,2
1
Julius Kruttschnitt Mineral Research Centre, Sustainable Minerals Institute, University of Queensland, Brisbane, QLD 4068, Australia
2
ARC Centre of Excellence on Eco-Efficient Beneficiation of Minerals (CE200100009), Shortland, NSW 2307, Australia
3
Glencore Zinc Long-term Strategy, Planning and Projects, Brisbane, QLD 4000, Australia
*
Author to whom correspondence should be addressed.
Minerals 2023, 13(6), 801; https://doi.org/10.3390/min13060801
Submission received: 28 April 2023 / Revised: 5 June 2023 / Accepted: 7 June 2023 / Published: 12 June 2023
(This article belongs to the Special Issue Flotation of Cu-Zn Sulfide Ores)

Abstract

:
The depletion of mining resources forces the mining industry to process more heterogeneous and complex orebodies. The inherent heterogeneity of these orebodies and their relation to processing recoveries have received considerable interest in recent years. The properties of ores, such as mineral composition and association, are known to affect flotation performance. Even ores with similar compositions can vary significantly regarding their texture, where the same minerals can occur in different forms. Therefore, very careful geometallurgical planning is needed to overcome the recovery losses. Glencore’s Mount Isa Copper Operation has reported historical difficulties decreasing the copper losses associated with natural floatable pyrites. Understanding the rock properties of naturally floatable pyrites and how they relate to chalcopyrite losses is crucial for concentrator operations. The Mount Isa geometallurgy team is looking for proxies for predicting copper losses and natural floatable pyrites to improve mine planning. This paper presents an approach for predicting the collector-less flotation of pyrite, as well as chalcopyrite losses from rock properties. The statistical analysis between the rock quality and ore type gives an indication of the chalcopyrite losses and natural floatable pyrites, which has potential use in geometallurgy plans.

1. Introduction

In recent years, the growing global metal demand has driven the mining sector to process lower-grade, more complex, and heterogeneous orebodies. Processing plants were designed for the average ore characteristics and often have limited capacity for mineralogy fluctuations; therefore, they often face difficulties when processing the full spectrum of ore variability [1]. The primary approach for mine production and ore processing is to use the assay data of one or more metals of interest in a particular geological domain and establish a predictive mine planning model. This approach is based on geometallurgical modelling, which integrates geological and metallurgical information into the operation of mining, processing, and metal production, and it also provides an estimate of environmental impacts [2].
Geological domains describe the different regions (domains) by their specific geological, mineralogical, and lithological characteristics within the deposit [3]. Geometallurgical models are developed by considering the intrinsic heterogeneity within an ore domain, which causes variabilities in process mineralogy, liberation, texture, and mineral chemistry, and how it affects the processing recovery [4]. In addition, heterogeneity in ore domains affects the feed characteristics to the downstream processing, such as comminution [5,6,7,8], flotation [9], and leaching, and also their environmental impacts [10].
Ore properties such as mineralogy, rock strength, breakage properties, liberation, and ore grindability significantly affect the product particle size distribution and, therefore, the flotation process. Variations in mineralogy influence a wide range of factors, from particle and mineral grain size to the extent of the mineral surface reactions. Even ores with similar compositions can vary significantly depending on their texture, where the same minerals can occur in different forms. Pyrite is a common mineral associated with other valuable sulphides such as chalcopyrite, sphalerite, galena, or pentlandite. The presence of fine pyrite textures intimately intergrown with valuable sulphides can cause a decrease in concentrate quality [11]. Pyrite exists in various forms and compositions and includes minor and trace elements either as impurities within the crystal structure or as inclusions, depending on the ore’s geological formation [12]. There are several classifications of pyrite textures depending on differences in grain size and shapes in the literature [13,14,15,16,17]. The variability in texture, impurities, and inclusions has a significant influence on their oxidation rate, stability [18], electrochemical activity [19], and surface reactions, and therefore, their flotation response [13].
Xian, Wen, Chen, Deng, and Liu [18] investigated the lattice defects on As-substituted, Co-substituted, intercrystalline Au pyrites, and perfect pyrites, and they found a significant difference in their floatability. Therefore, one separation method (floating or depressing) could not be equally applied to all pyrite types. Forbes, Smith, and Vepsalainen [19] studied two different pyrite textures from different deposits, as one had high arsenic and was characterised by pitting and occlusions (Renison pyrite). In contrast, the other (Huanzala pyrite) had a similar chemical composition with very low trace elements and an almost mirror-smooth surface. They found that the floatability of the two types of pyrite differed significantly, which was attributed to the difference in pyrite surface electrochemical activity and surface oxidation properties. The difference in electrochemical activity was attributed to the varying levels of arsenic within the pyrite matrix, which was consistent with other pyrite studies [13].
Glencore’s Mount Isa Copper Operation is a good example of an industrial mine site with a well-documented presence of variable textured pyrite. The presence of various textured pyrites in their ore deposits was well documented over several decades and was observed to cause a significant variation in flotation performance.

1.1. Site Description and Geological Information

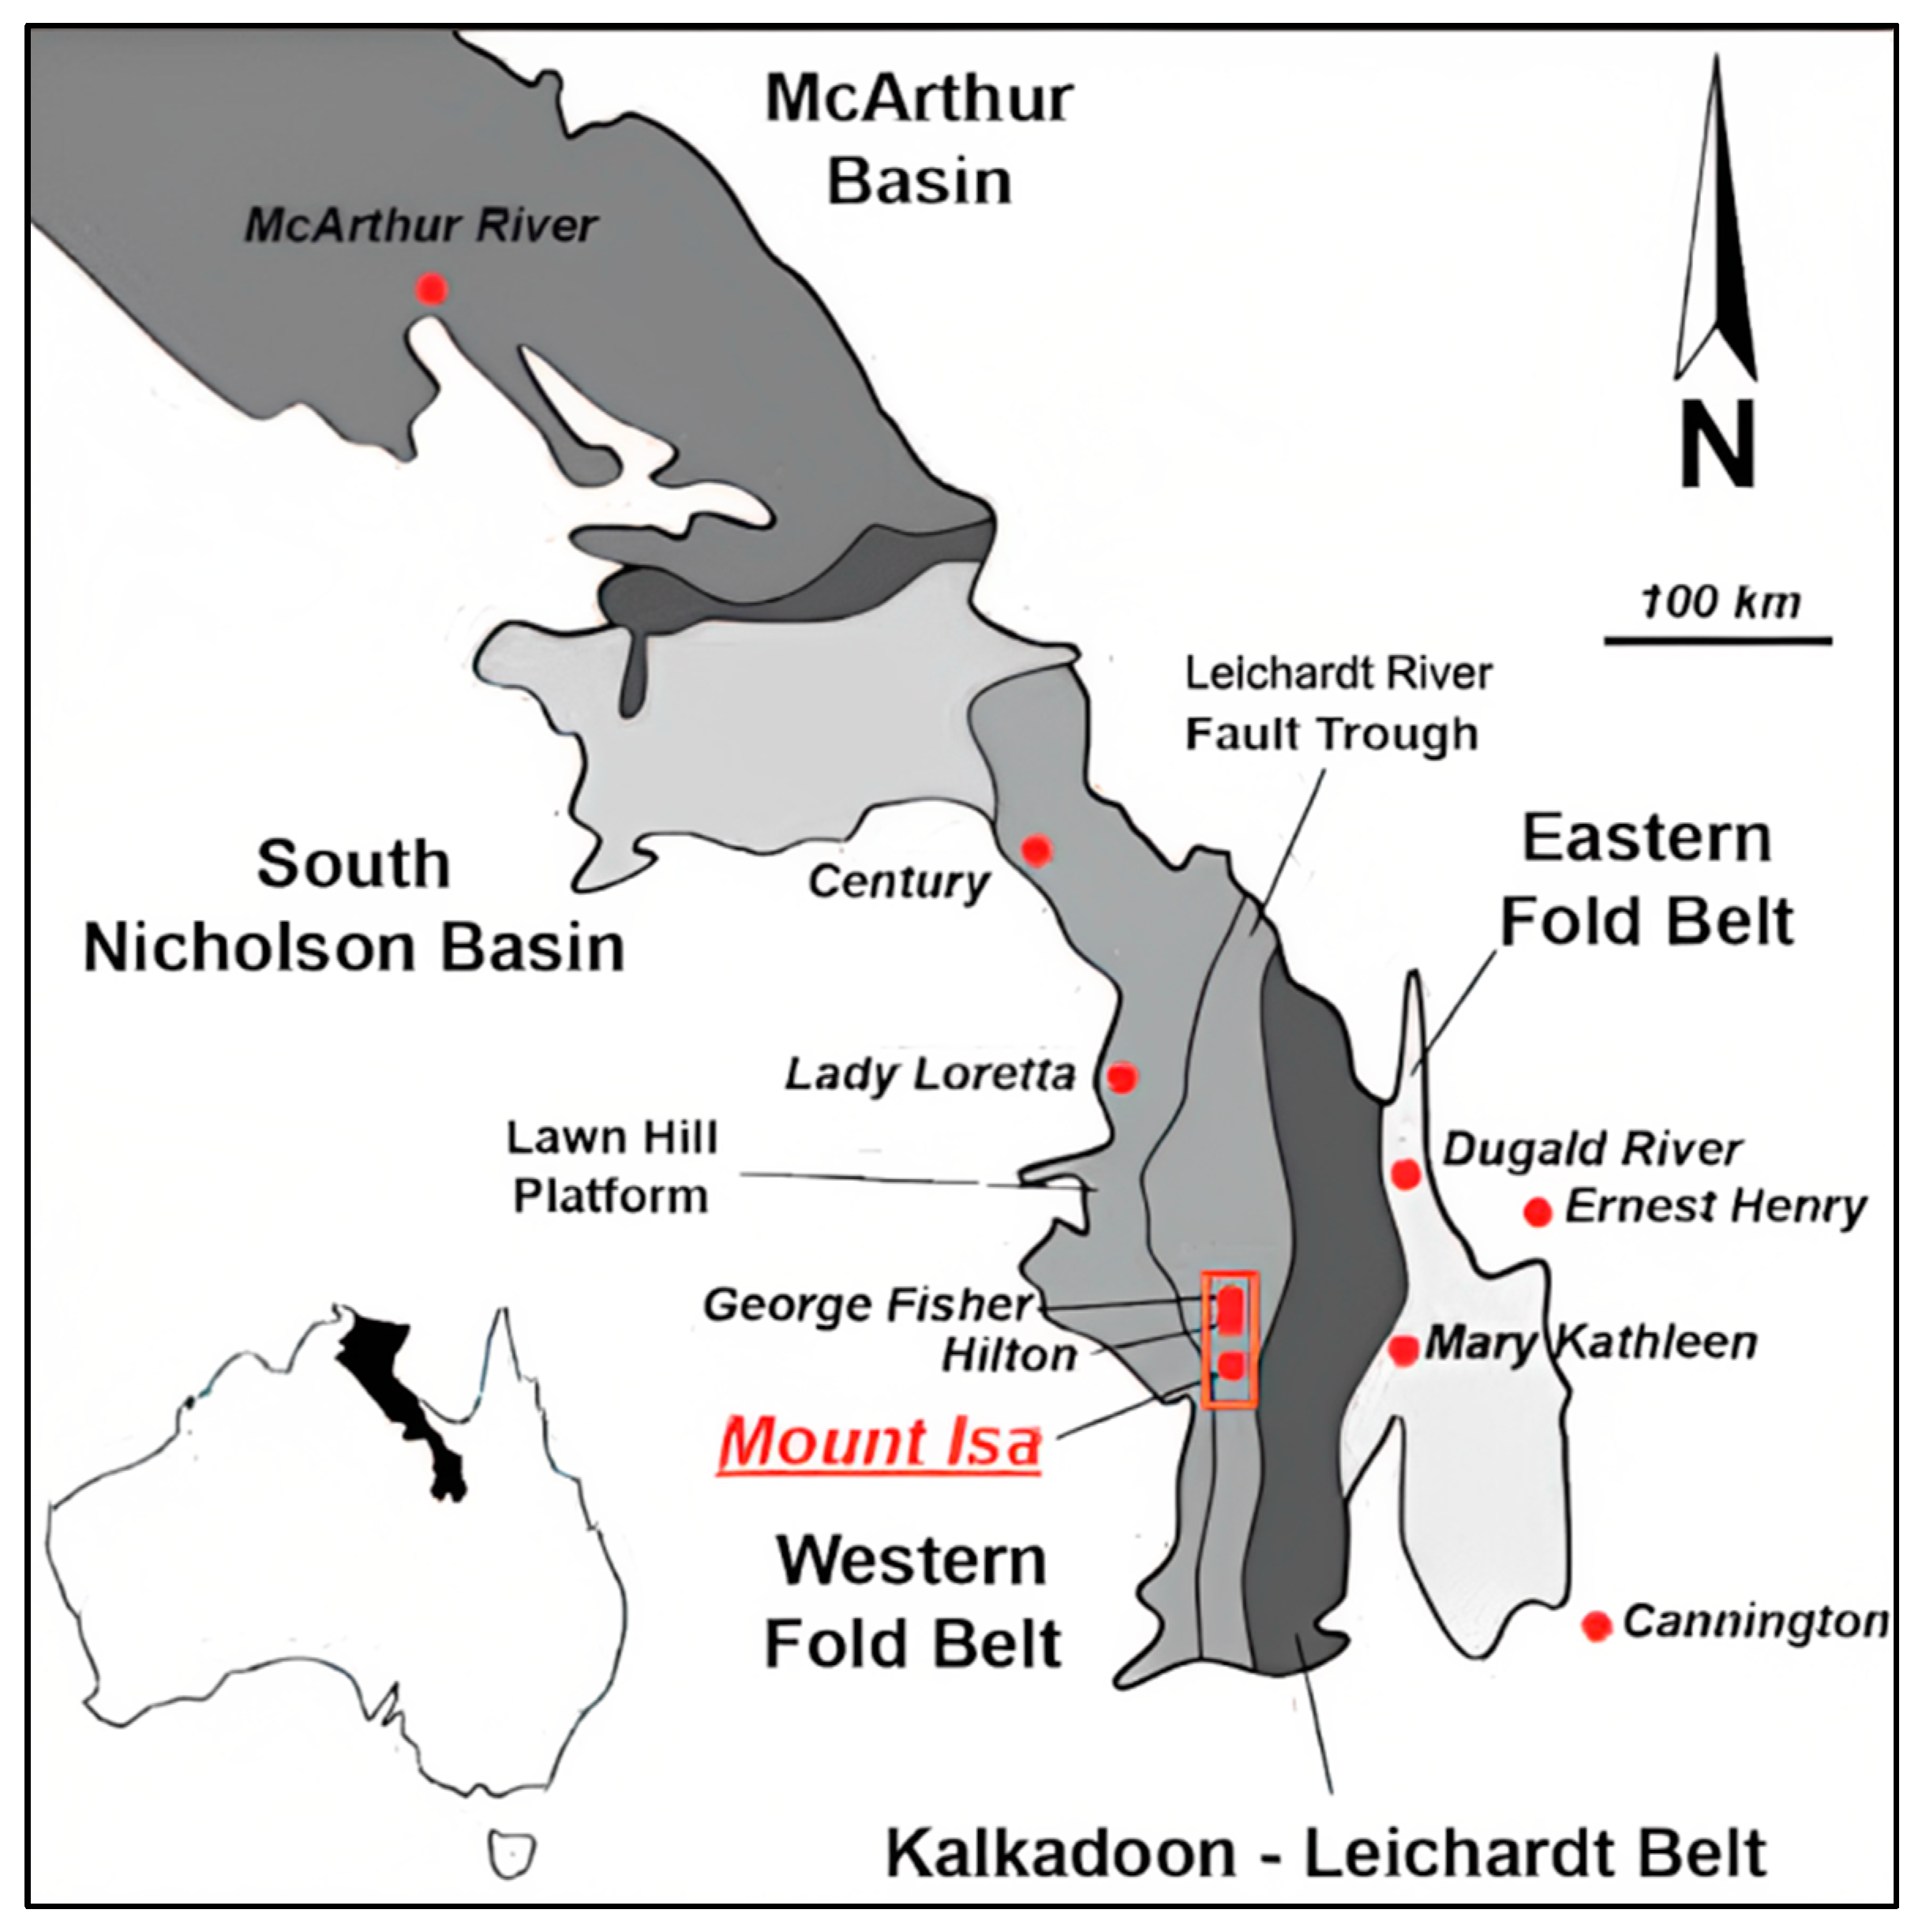
The Mount Isa Mine is located in the Northwest Queensland Minerals Province and has one of Australia’s oldest Processing Operations (Figure 1). The world-class Mount Isa Copper deposit had an estimated 248 Mt at 3.3% Cu before extraction [20]. Copper occurs predominantly as chalcopyrite and is hosted almost exclusively within the mid-Proterozoic Urquhart Shale Formation of the Mount Isa Group, which is a sequence of carbonaceous, carbonate siltstones and mudstones with intermittent fine-grained pyrite beds [21].
Extensive regional deformation resulted in cross-faulting and steeply dipping sediments in the mine area. The metalliferous Urquhart Shale was juxtaposed over the barren Eastern Creek Volcanics by the Paroo fault. The undulous Paroo fault is the basement contact for the Mount Isa copper orebodies and is interpreted as the conduit for the silica-dolomite alteration (e.g., [23]) and later metalliferous fluids.
Silica-Dolomite is host to the Mount Isa copper orebodies. It is a complex range of microfacies caused by progressive metasomatic alteration [24]. The alteration can be divided into two broad zones, an inner siliceous core and an outer dolomitic halo. The main rock types in the deposit are crystalline dolomite, brecciated dolomitic and siliceous shales, recrystallised dolomitic shales, and sheared shales [23].
Late-stage cross-faulting allowed acidic groundwater to circulate through part of the deposit, resulting in a localised area of deep anaerobic leaching [25]. The acidic fluids attacked the host rocks, breaking down the crystalline dolomite to varying degrees, leaving vuggy, cavernous skeletal Silica-Dolomite. The remnant weathered rocks consist of leached carbonates, sulphides, residual quartz, and clay [25,26,27]. The leaching is modelled by depletion in CaO and MgO, two main components of dolomite [26]; an estimated 20% to 50% of the rock volume was removed by leaching [25,27].
The studied ore samples of this work were received from leached and unleached areas in the deposit. The rock types for sampled orebodies are crystalline dolomite, irregularly brecciated shale, recrystallised shales, and sheared shales, and crystalline dolomite is the dominant host to economic copper mineralisation. Sulphide mineralisation is predominantly chalcopyrite, with nodular and euhedral pyrite, subhedral pyrrhotite and minor arsenopyrite. In addition, massive coarse-grained pyrite and pyrrhotite occur in the OD1- lode, often with chalcopyrite [24].
Domain-1 can be broken into leached and primary ore zones, with the southern portions experiencing deep leaching associated with transverse faulting [28]. Late-stage northeast trending transverse faults and northwest cross faulting and shearing are responsible for the oxidation, reaching depths of 200 m and major leaching up to 800 m on the 5800 mN section. Hanging wall and footwall shears bound the high-grade mineralisation trend northward and are seen to be part of a divergent dilation zone. Shearing may be 15 m wide with infill minerals, including carbonate and quartz, graphite, and sometimes carbonaceous rubble.
Domain-2 has been the main ore-producing orebody for over 30 years with the classic Mount Isa halo structure. It has a lobe structure sitting on the Paroo Fault with a high-grade core mass of fractured siliceous shale, a gradational contact outward becoming more dolomitic with irregularly brecciated shales, and then the recrystallised shale, which has been only partly dolomitised. Typical Urquhart shale characteristics can be found with increasing distance outwards from the siliceous core into less-altered shales, bands of fine-grained pyrite inter-finger siliceous dolomitic rock types. The footwall has a large amount of pyritic shale, but within the high-grade ore zones, there is minor high-grade pyrite [29,30].

1.2. Copper Production

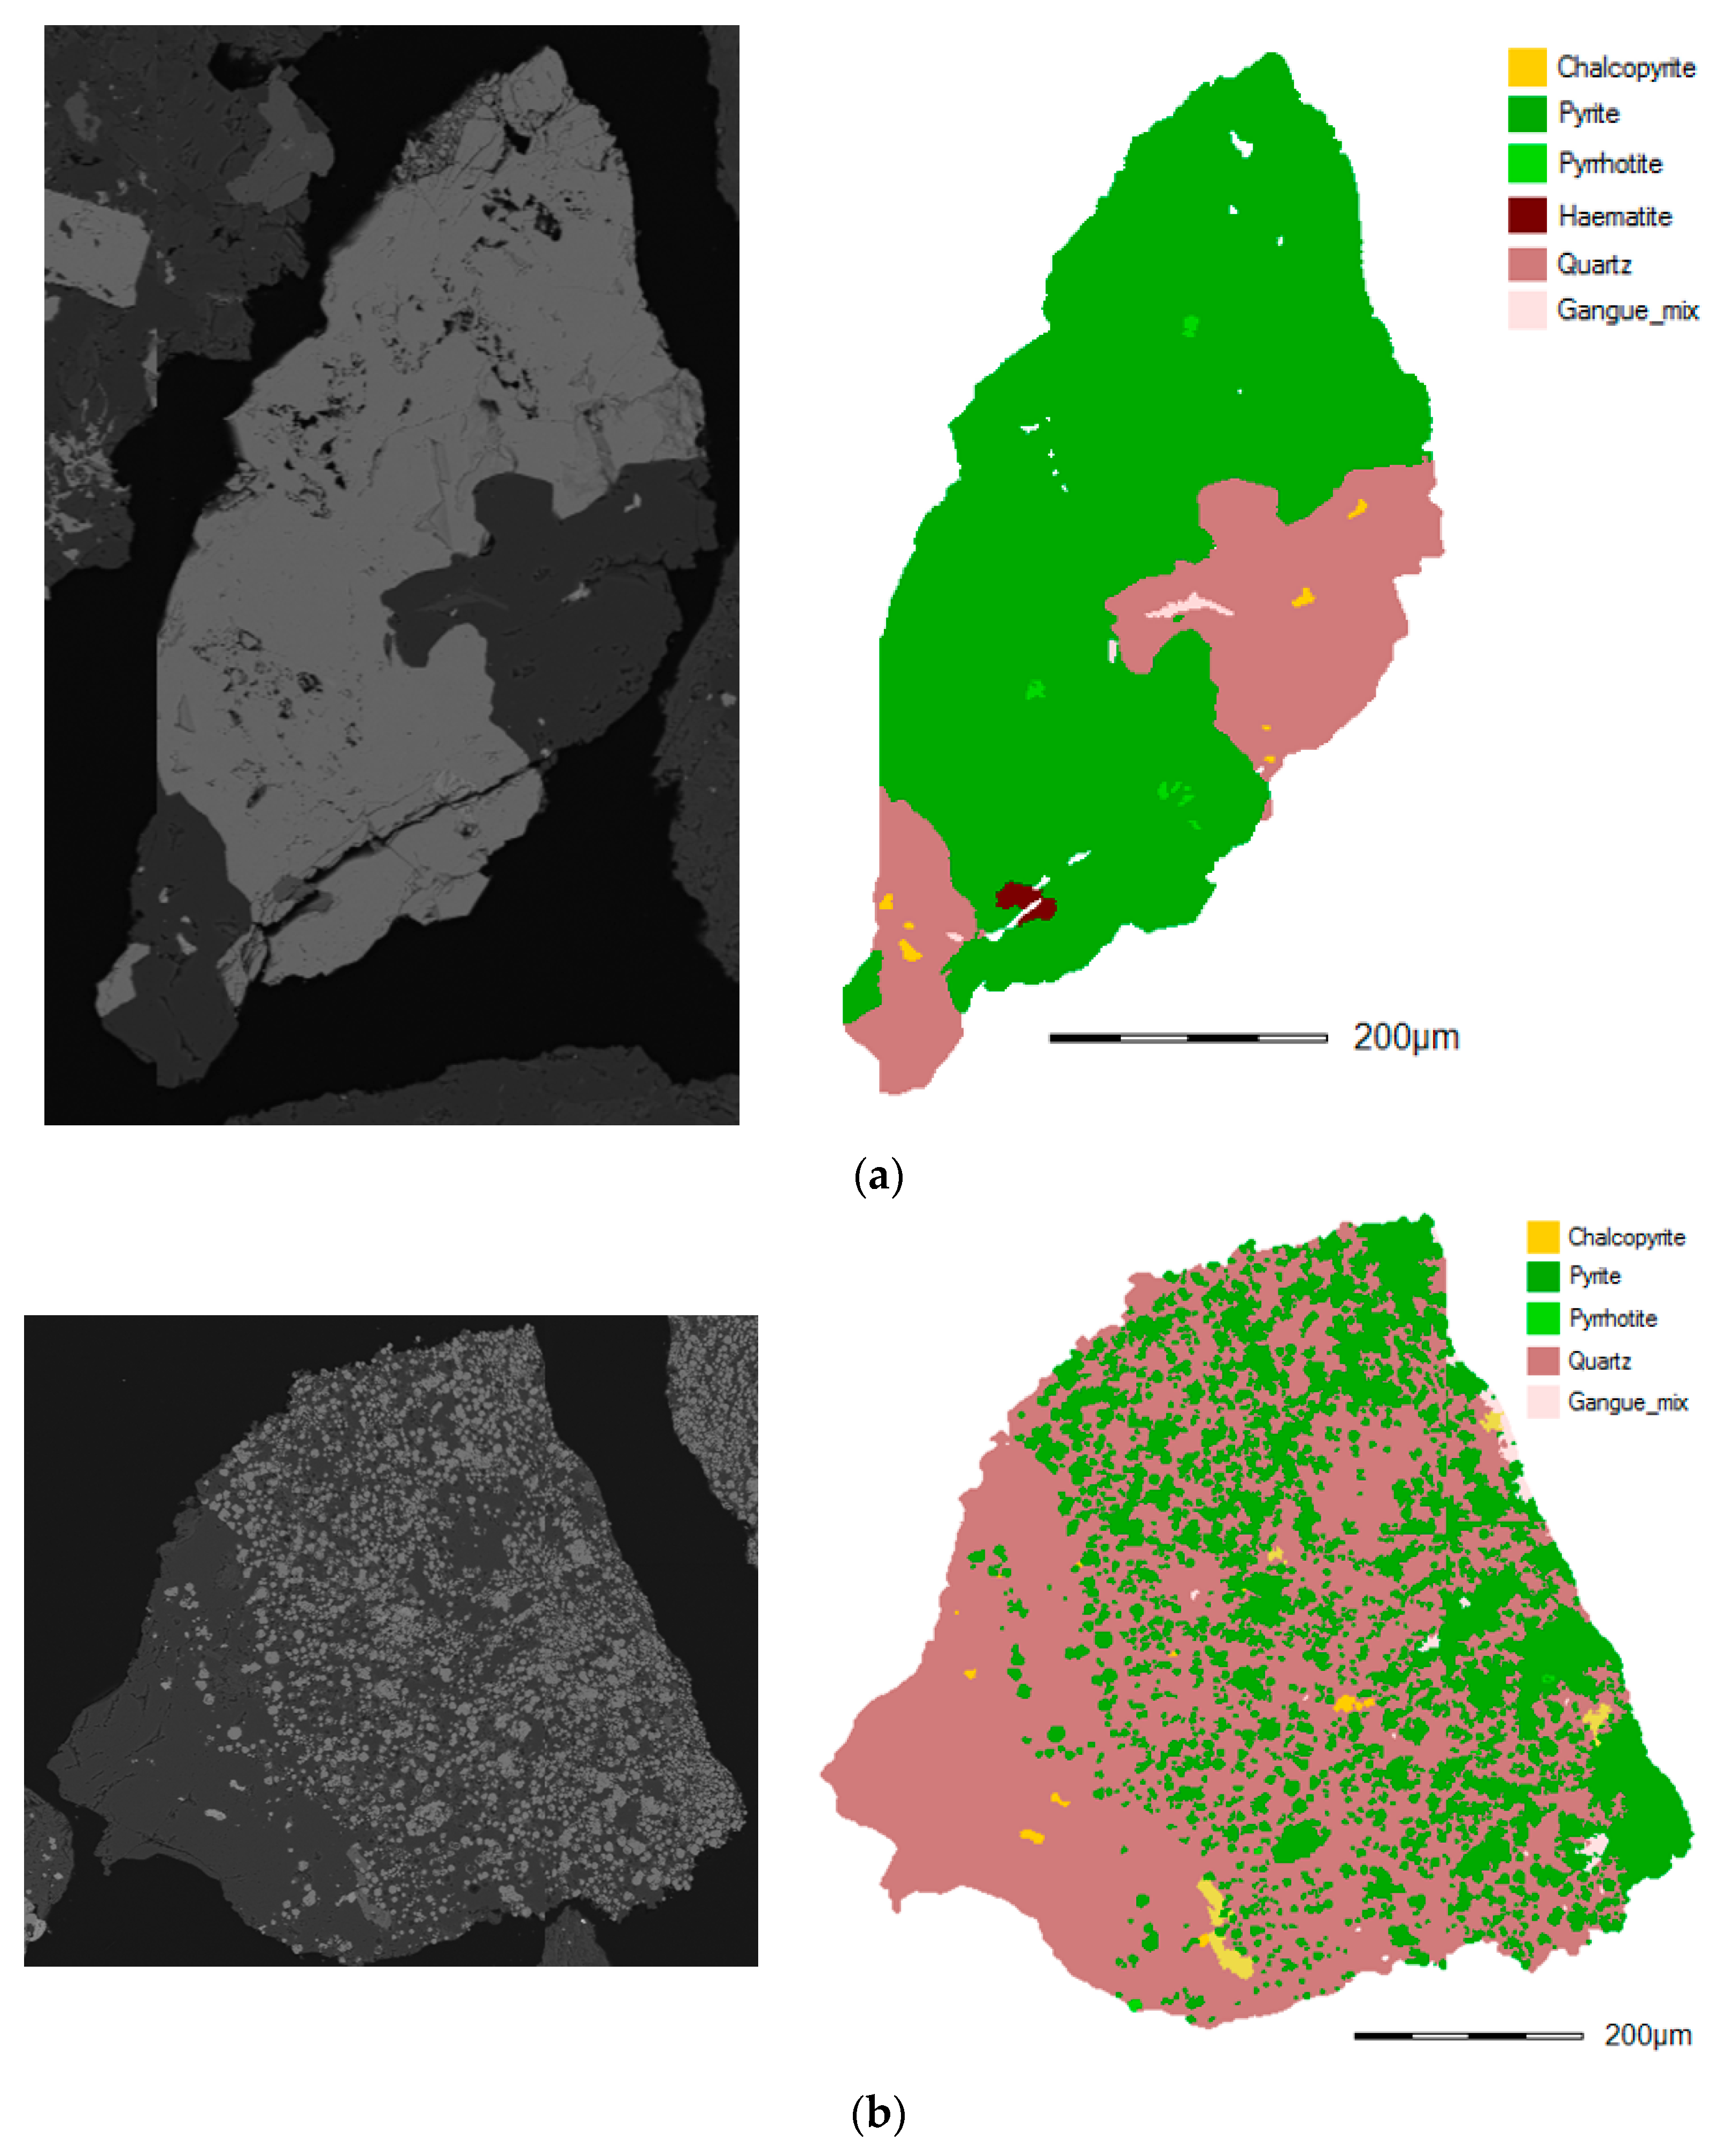
Mount Isa Copper concentrators have been producing copper since 1952. Ore is ground in two stages and then sent to a prefloation circuit, which targets the recovery of talc and carbonaceous material and the depression of chalcopyrite. After separating the prefloat product, the remaining material is sent to the rougher circuit. This primary copper recovery circuit targets the recovery of chalcopyrite and the depression of talc and iron sulphides. The tails from the rougher circuit are further treated in scavenger tank cells, whilst the rougher concentrate is cleaned by three Jameson cells in series. A regrind mill is used to further increase the liberation of coarse composites from the concentrate collected from the scavenger cells. Chalcopyrite is the only economic mineral; gangue minerals such as pyrite, carbonaceous material, and talc are the significant concentrate diluters. Mineralogical assessments indicated that pyrite occurs as fine-grained framboidal and coarse-grained euhedral. Framboidal pyrite occurs as a spherical shape with a relatively small particle size (under 10 µm) and carbon-rimmed surface, and euhedral pyrite has a cubic structure, relatively greater than 50 µm size. The carbon existence in the concentrate is observed in a wide Eh range (from −400 to +400 mV) in the absence of the collector and the addition of cyanide [31]. They found that a substantial proportion of the iron sulphide minerals is naturally floatable because of a surface coating of graphitic carbon formed during ore genesis. The hydrophobic pyrite cannot easily be depressed with cyanide, whereas euhedral pyrite can be. Due to these two pyrite forms, the Mount Isa copper plant uses naphthalene sulphonate and cyanide as pyrite depressants [32]. During the process, the amounts of carbonaceous material and talc vary through orebodies; therefore, it is essential to understand the ore domain characterisation and their relationship with natural floatable pyrite to minimise the copper losses by adjusting the reagent suit.

1.3. Scope and Objectives

As a result of several internal studies and observations of fluctuating flotation performance at Glencore’s Mount Isa Copper Operation, became apparent that a more in-depth analysis of ore variability and its effect on flotation performance is necessary. Discussions with the Mount Isa geometallurgy teams identified the presence of varying pyrite textures (fine grain and coarse grain) within the flotation feed.
From a geometallurgy perspective, it is important to identify periods when a particular “problematic” pyrite texture type will form part of the feed to the processing plant to manipulate the reagent suit during the operation to better prevent copper losses. Currently, the prevalence of individual texture types cannot be quantitatively identified from the available data.
There is a need to find ways in which the presence of “problematic” textures can be identified and flagged from a range of ore domain descriptors/proxies typically available to mine geologists.
This work investigated an approach that links the variability of ore domains, rock properties, and proxies for naturally floatable pyrite found in Mount Isa Mine ore bodies. This information will be coupled with the understanding of how pyrite naturally floats and how it affects chalcopyrite recoveries.

2. Materials and Methods

2.1. Ore Samples Information

2.1.1. Sample Selection

The Mount Isa geology/geometallurgy team selected the ore samples to meet the following criteria explicitly:
  • The samples had to be representative of geometallurgically contrasting ore domains.
  • The samples had to cover a wide range of pyrite textures, as determined by the visual observation of the drill core.
  • The samples had to contain a wide range of Cu/Fe ratios.
The drill core samples were composited into five domains. The five composite samples were used for metallurgical test work. The ore domain descriptions and code names are shown in Table 1:
The core logging and geochemical information from the selected core samples were used to estimate/assign/determine the mineralogical characteristics for the five ore domains for geometallurgical evaluation. The number of samples and their total weight received from logged drill holes for each ore domain are shown in Table 2.

2.1.2. Core Logging and Definitions

The Mount Isa geology team provided the geological core logging database. This database consists of logged descriptive and quantitative analyses of drill hole samples. The descriptive characteristics were categorised according to rock type, ore type, alteration style, copper grade, structure, and ground conditions, such as weathering and oxidation. Throughout the manuscript, the logged data are described as follows:
Rock type: RT.
  • 1A: Shale;
  • 1B: Recrystallised shale;
  • 1C: Brecciated dolomitic shale;
  • 2A: Pyritic shale 5%–20% fine-grained pyrite [33];
  • 2B: Pyritic shale >20% fine-grained pyrite [33];
  • 3A: Siliceous shale;
  • 3B: Brecciated/fractured siliceous shale.
Geometallurgical ore type was classified into three zones, as shown below:
  • Zone 1: Predominantly chalcopyrite in fractured siliceous shale;
  • Zone 2: Chalcopyrite ± pyrite and pyrrhotite;
  • Zone 3: Pyritic recrystallisation with chalcopyrite, pyrrhotite ± talc, carbonate.
Macroscopic pyrite texture: Visually identified, coarse-grained (CGP%), fine-grained (FGP%).
RQD%: Rock quality designation.
Leaching: Leached and non-leached formation.
Whole rock geochemistry.
It is important to note that coarse-grained pyrite is not associated with any amount of fine-grained pyrite (2A and 2B). Any rock type may contain coarse-grained pyrite to any degree.
Mineralogical characteristics of the ore domains were calculated/estimated from the geological characteristics of the individual drill core fragments according to the Mount Isa core logging and geochemical database.
Table 3 summarises the characterisation of ore domains, including rock types, major mineralisation, formation, and degree of alterations. The numerical values were calculated by weighted average, while categorical values were assigned where clear differentiation over 60% of the weight was obtained. The summary table shows the selected features among the many categories listed above. Examples of the visual representation of high and low RQD of drill core samples are shown in Figure 2a,b, respectively.
The rock type classification of each ore domain is illustrated in Figure 3. Almost 70% of the rock type of D1-CGP and D2-CGP were constituted from brecciated dolomitic hale, while D1-FGP and D2-FGP were formed by pyritic shale 5%–20% fine-grained pyrite. The other rock types, shale, and recrystallised shale were common for D1-CGP, D1-FGP, and D2-CGP. Interestingly, the ore domain of D1-Leached was formed by dominantly siliceous shale and brecciated/fractured siliceous shale, which is quite different from the rest of the ore samples.
The leaching formation of each ore domain is shown in Figure 4. Domain-2 is non-leached at all, while Domain-1 has some degree of leaching. The D1-Leached sample formation was observed with the leached formation at 82%, followed by D1-CGP and D1 FGP (27 and 24%).

2.2. Experimental Procedures

2.2.1. Sample Preparation

The drill core samples were split into sub-samples of approximately 1.6 ± 0.07 kg mass using a rotary splitter. These sub-samples were sieved into seven size fractions: +1180 µm, −1180 + 425 µm, −425 + 212 µm, −212 + 106 µm, −106 + 53 µm, −53 + 38 µm, and −38 µm. Each size fraction was characterised by mineral liberation analysis (MLA) before grinding to preserve the ore textures for identification.
For each test, 1.6 kg of the sample was crushed in a Boyd crusher in a closed circuit to 100% finer than 3.35 mm. Then, the freshly crushed ore was mixed with process water at a 60% solids ratio by weight and wet ground in a stainless-steel rod mill. Each ore was ground for different durations to achieve a P80 of 106 µm. This size was chosen according to MLA to reach an 80%–90% liberation profile for all samples used in the study. It was also re-validated with MLA to grind products to minimise the grinding effect when comparing the ore domains. The mill was cleaned by grinding it with sand for 10 min before each test.

2.2.2. Flotation Test Procedure

In each flotation test, 1.6 kg of freshly crushed ore was wet ground in a stainless-steel rod mill at a 60% solid ratio, followed by flotation in a 3 L modified Denver cell at 1200 rpm rotor speed with a 35%–38% solid ratio. This modified flotation cell has an impeller driven from below to allow the whole surface of the froth to be scraped with a paddle at a constant depth and at constant time intervals. The flotation tests were conducted under natural pH and were conditioned with a frother, with no collector addition, to investigate the natural floatability.
The concentration of methyl isobutyl carbinol (MIBC) was kept at 20 ppm during the tests. One minute after the MIBC addition, the concentrate was taken for 3 min by scraping every 10 sec. Each flotation test was replicated three times; all the results were displayed on average. This study focused on the natural floatability of pyrite-associated chalcopyrite losses; therefore, the total recoveries of these tests were not presented here. The multimeter (TPS brand) monitored the pulp chemistry parameters such as pH, dissolved oxygen, oxidation and reduction potential (ORP), conductivity, and temperature. The pulp chemistry conditions were not changed but were monitored continuously throughout the tests.

2.2.3. Flotation Reagents

The frother used was an analytical grade MIBC prepared as a 1% w/v (weight/volume) solution. Frother concentration was kept constant at 20 ppm throughout the experiments, and one minute was added before flotation to maintain an active froth. The flotation gas was high-purity synthetic air used at a flow rate of 8 L/min. The chemicals used to make process water were analytical grades of KCl (Rowe Scientific, Australia), CaCl2 (Sigma Aldrich, Australia), MgSO, (Sigma Aldrich), Na2SO4 (Sigma Aldrich), and Na2CO3 (Rowe Scientific).

2.2.4. Synthetic Process Water

During the experimental campaign, approximately 100 L of process water was prepared and stored in a sealed drum in a flotation laboratory at room temperature (circa 24 °C). The process water specifications were used from the previous study [34]. The analytical grades of KCl, CaCl2, MgSO4, Na2SO4, and Na2CO3 were used in required amounts to make up the process water. The analysis of this process of water is given in Table 4 below.

2.2.5. Elemental and Mineral Analysis

All flotation products (solid and water) were processed and subsequently sent for assay analysis at ALS Global analytical laboratory in Brisbane. The flotation products were assayed for copper and iron by XRF following a lithium borate fusion with the addition of strong oxidising agents to decompose sulphide-rich ores. The total sulphur was analysed with an induction furnace.
The mineralogical characterisation of crushed, ground samples and flotation products was analysed at the Julius Kruttschnitt Mineral Research Centre using the Mineral Liberation Analyser (MLA). The MLA accelerating voltage was 25kV, and the pixel spacing for each size of the fractions is shown below:
  • +1180, +425, +212, +106 µm: 1.55 µm/pixel;
  • +53 µm: 0.66 µm/pixel;
  • +38 µm: 0.52 µm/pixel;
  • −38 µm: 0.39 µm/pixel.

2.3. Data Analysis

2.3.1. Data Validation

A comparison between the elemental assays and estimated geochemical assays was carried out for each domain sample to ensure consistency in the elemental content and lack of bias in the subsequent data analysis. Figure 5a shows that the calculated and assayed head values were consistent for all the assayed elements for each sample domain; in the same way, a comparison between the elemental assays and the MLA-calculated assays was conducted to ensure the correct mineral definition for major sulphides. Figure 5b shows consistency between the datasets for most of the elements assayed, except Co. The Co content was underestimated in the MLA readings. This result suggests that Co can be contained as inclusions in other mineral species not detected by the MLA. Some research in the literature suggest cobaltite formation that occurs as euhedral rims to framboidal pyrite [35,36,37], and others only mentioned it as elemental inclusions where their concentration can go up to 600–700 ppm [38].
The total sulphur analysis of the samples was obtained with the induction furnace method and measured with MLA, which are compared in Figure 6. Both methods showed consistency with the low concentrations (<5%) of sulphur; however, above 10%, MLA measurement gave an overestimation compared to the analysed ones. This erroneous analysis of MLA was caused by the misdetection of very fine-grain pyrite borders, which is extensively discussed in Section 3.1.

2.3.2. Elemental to Mineral Conversions

Chalcopyrite and pyrite amounts were calculated by copper/iron and sulphur assays and validated with mineralogical measurements (MLA analysis). The calculation method was based on the elemental ratios in an ideal mineral crystal unit, and more detailed examples of such conversions can be found in the literature [34]. The comparison between the calculated and measured values for both chalcopyrite and pyrite are shown in Figure 7a and Figure 8a, respectively. The residual values are displayed in Figure 7b and Figure 8b.
The calculation of chalcopyrite showed a highly significant correlation between the measured and calculated chalcopyrite grades, with randomly distributed residual values. However, in the case of pyrite grades, the calculation resulted in a consistent underestimation of the measured values, with consistently negative residuals. The possible reasons for this are twofold.
Firstly, the conversion from elemental to mineral assays is based on an ideal chemical formula for that mineral (e.g., CuFeS2 for chalcopyrite). The calculation accuracy is, therefore, highly dependent on the chemical purity of the mineral in question and the presence/absence of chemical substitutions in the mineral crystal lattice. As discussed in the previous section, within the samples used in this study, pyrite occurs in the form of several distinct mineral textures. Each texture is likely characterised by varying chemical composition, thus deviating from an ideal formula for pyrite (FeS2).
The second reason is the very fine-grained texture of some of the pyrite samples, where pyrite grains measured less than 10 µm in size. For those samples, the MLA measurement could not distinguish between individual grains and classified areas containing a large number of very fine grains as one large pyrite grain (see Section 3.1, Figure 9b for more details). This causes an overestimation of the measured prevalence of pyrite within the sample. The inherent inaccuracy that can be seen when comparing SEM and MLA segmentation images (see Figure 8a,b) means that MLA mineral assays cannot be treated as “ground truth” or, therefore, used to calibrate the element to mineral conversion.
As a result, a decision was made to use the calculated pyrite mineral assays despite the offset, with the understanding that the result may be an overestimation (circa 7%). Furthermore, the offset was relatively uniform across the measured range (see Figure 8b), and the results can be assumed to be self-consistent. This means that the overestimate will have no impact on the observed trends.

2.3.3. Entrainment Analysis

Minerals in typical batch flotation tests were recovered not just by true flotation but also by entrainment. Entrainment is highly dependent on the particle size, where very fine particles (<10 µm) tend to be caught up in the slip-stream of the rising bubbles and become unselectively recovered in the concentrate. The use of entrainment models for steady-state systems has been well documented [39,40,41]. More recent work has outlined the modelling process for batch flotation systems, where the mineral concentration in the pulp does not remain constant. The detailed modelling procedure was described in [42], and only a brief description is provided here.
The recovery by entrainment of any given mineral can be modelled using the entrainment factor (ENTi), calculated for a known fully liberated non-floatable gangue species, as shown in Equation (1). In this case, quartz was used as the non-floatable gangue species in question, resulting in Equation (2). The degree of entrainment for any mineral (i) can then be calculated by multiplying the entrainment factor by the recovery of water, using Equation (3). Finally, the recovery by true flotation for a mineral (i) can be calculated using Equation (4).
E N T i = M a s s   o f   f r e e   g a n g u e   p e r   u n i t   m a s s   w a t e r C o n M a s s   o f   f r e e   g a n g u e   p e r   u n i t   m a s s   w a t e r P u l p
E N T q u a r t z = M q u a r t z C o n M W C o n × M W P u l p M q u a r t z P u l p
R i e n t = E N T q u a r t z · R w a t e r
R i T F . = R i t o t R i e n t

2.3.4. Statistical Analysis

A series of statistical analyses were conducted as follows:
  • Error Bars
All error bars displayed in this work represent the 95% confidence limit of the mean values calculated based on test replicates.
  • Correlation significance
The correlations between data sets (e.g., flotation data vs. geological data) were evaluated using the standard correlation coefficient (R). The significance of the correlation coefficient was determined by calculating the probability value (p) associated with the Student’s t distribution of the correlation coefficient. The t value was calculated using Equation (5), where n is the number of data points [43].
t = R · n 2 1 R 2
The correlation was deemed significant if the probability exceeded 90%.

3. Results

3.1. Mineral Characterisation

The samples used in this study were selected according to the main orebody and their pyritic occurrence in the drill cores and their classification as coarse and fine-grain pyrites. The coarse-grained pyrite domain constitutes mainly blocky pyrite and a lower proportion of fine-grain pyrite, while the fine-grained mineralogy included mostly disseminated and very fine-grained pyrites, as summarised in Table 1. The modal mineralogy of the five ore samples, as determined by MLA, are summarised in Table 5. Some mineral groupings contain the explained minerals as below:
  • Silicates: Quartz, orthoclase, plagioclase, pyroxene, olivine, biotite, pyrophyllite;
  • Phyllosilicates: Muscovite, chlorite, kaolinite, talc;
  • Iron oxides: Hematite, rutile;
  • Deleterious: Tetrahedrite, enargite, arsenopyrite;
  • Other Sulphides: Bornite, covellite, sphalerite;
  • Other: Freibergite, diaspore, smithsonite, monazite, apatite, gypsum, barite.
In addition to measuring the mineral composition of the samples, the MLA measurements provide a useful estimate of different textural characteristics of pyrite. An example comparing the backscatter electron (BSE) images with MLA mineral segmentation is shown in Figure 9a,b. The images clearly show the difference in pyrite grain sizes between the coarse-grained pyrite sample (D1-CGP) and the more finely grained sample (D1-FGP). The P80 of grain sizes for coarse-grain pyrites was 577 µm, whereas it was 905 µm for fine-grained pyrites. Figure 9b also clearly demonstrates the erroneous detection and segmentation of very fine pyrite grains, where a collection of small grains was classified as one large grain. Therefore, the MLA values for the modal pyrite composition of these samples are likely overestimated. This is seen as one of the main reasons for the discrepancy between measured and calculated pyrite grades in elemental to mineral conversion calculations, as shown in Figure 8b and discussed in Section 2.3.2.
The samples were also characterised by their pulp chemistry, and each ore’s measured pH and Eh parameters are presented in Table 6. Significant differences were observed. The weathering of D1-Leached ore caused acidic conditions of pH 4, whereas the others were around pH 8. The alteration also changed the natural Eh. The leached sample had the highest Eh measurements, around 458 mv, while the coarse-grained samples (D1-CGP and D2-CGP) were around 326 mV, and fine-grained ones (D1-FGP and D2-FGP) were 300 mV.

3.2. Flotation Results

The flotation tests were designed to evaluate the natural floatability of both chalcopyrite and pyrite, and as such, are similar to the pre-flotation circuit of the Mount Isa Mines Copper Operation [34,42]. In that circuit, gangue minerals (pyrite and talc) are recovered by natural flotation without a collector. Any chalcopyrite recovered at this stage represents a loss of valuable material. For this reason, all chalcopyrite recoveries reported in this work are referred to as “chalcopyrite losses”.
The flotation results of pyrite and chalcopyrite minerals for all ore domains are shown in Figure 10. A significant natural floatability of pyrite and minor chalcopyrite losses (less than 4%) was observed. However, the difference between the natural flotation behaviour of both minerals differed significantly between the tested ore domains. The highest chalcopyrite loss, 3.8%, was observed for the D1-Leached sample, followed by 2.5% for D1-FGP. The chalcopyrite losses for the other ore samples were less than 1.5%. Circa 13% of pyrite flotation recovery was obtained from FGP samples (D1 and D2) and 10% from the leached sample. Approximately 5% pyrite was recovered in the CGP ore samples (D1 and D2).
The mechanism of natural flotation of sulphide minerals has been extensively documented in the literature [31,44,45]. Collector-less flotation for base metal sulphides is generally attributed to the formation of hydrophobic surface oxidation species, mainly elemental sulphur and sulphoxy compounds [46]. The degree of surface oxidation is highly dependent on two factors: the oxidation potential (Eh) of the flotation pulp and the extent of galvanic interactions between sulphide mineral species (e.g., chalcopyrite and pyrite). Moreover, galvanic interactions can occur between minerals and grinding media, which can significantly affect the subsequent floatability of sulphide minerals [47].
Pyrite minerals with different textures and/or morphologies have been shown to have different oxidation rates in the order of marcasite > framboidal pyrite > cubic massive pyrite [48]. Given that the pyrite present in the tested samples was characterised by vastly different textures and morphologies, it is likely that the difference in natural floatability could be ascribed to the differences in surface oxidation. However, it is not possible to conclusively determine this without analysing the surface characteristics of the flotation products.

3.3. Entrainment Determination

In this work, our explicit objective was to determine the differences in the natural floatability of pyrite in different ore domains. Therefore, it is important to ensure that the recoveries obtained during flotation tests accurately represent true floatability and not recovery by entrainment. Entrainment is defined as the non-selective recovery of minerals whereby fine particles are carried over into the froth phase in the wake of rising bubbles. Therefore, entrainment disproportionately affects very fine particles below 20 μm in size [39,40,41,42].
The particle size distribution of the flotation products, measured with MLA, is presented in Figure 11. The results show that the flotation products, P80 of flotation products, were below 10 µm in all cases. Such fine particles are highly susceptible to entrainment, necessitating a detailed entrainment analysis to determine the true flotation recoveries of these ore samples.
The entrainment and true flotation components of the flotation recoveries were calculated using Equations (1)–(4), as described in Section 2.3.3, with the results presented in Figure 12a,b. The results clearly show that, in the case of chalcopyrite (Figure 12a), a significant portion of the flotation recovery can be ascribed to entrainment. Recovery by entrainment accounted for up to 85% of total chalcopyrite recovery for the D2 samples. The entrainment component similarly accounted for 30%–40% of the D1 samples. These results show that entrainment was the predominant mechanism for chalcopyrite losses. These results agree with previous findings of studies conducted at the Mount Isa pre-floatation circuit [42]. On the other hand, the flotation of pyrite was found to be primarily due to true flotation rather than entrainment. Figure 12b clearly shows that approximately 90% of flotation was associated with true flotation, and the highest entrainment was measured for the D1-Leached ore domain, circa 11%. These results demonstrate that naturally floating pyrite recovery can be ascribed primarily to true flotation and the differences in pyrite surface properties between the tested ore domains.

4. Statistical Correlations between Geological and Flotation Data

Once the natural floatability of the ore samples was established, these results were examined along with geological domain data to see if any useful correlations could be found that can be used as predictive factors in geometallurgical models.
While correlation does not equal causation, if an ore domain parameter is correlated with flotation performance, then it can still be a valuable proxy for performance prediction and can significantly aid in mine planning.
To this end, correlation coefficients were calculated between sets of geological domain and flotation performance data. The probability of significance values (p) was then calculated, where only p-values above 90% were considered statistically significant.
For geological data, the following descriptors were considered (see Table 3 details):
  • Rock type characterisation: rock type, geometallurgical ore type, RQD, and leached formation;
  • Macroscopic pyrite texture: FGP, CGP quantity (CGP% and FGP%);
  • Geochemistry and Pyrrhotite: Co, Pb, Cu, Fe, S, Si, Al, Ca, Mg (e.g., GEO_Cu, etc.).
For flotation data, the flotation results below were considered:
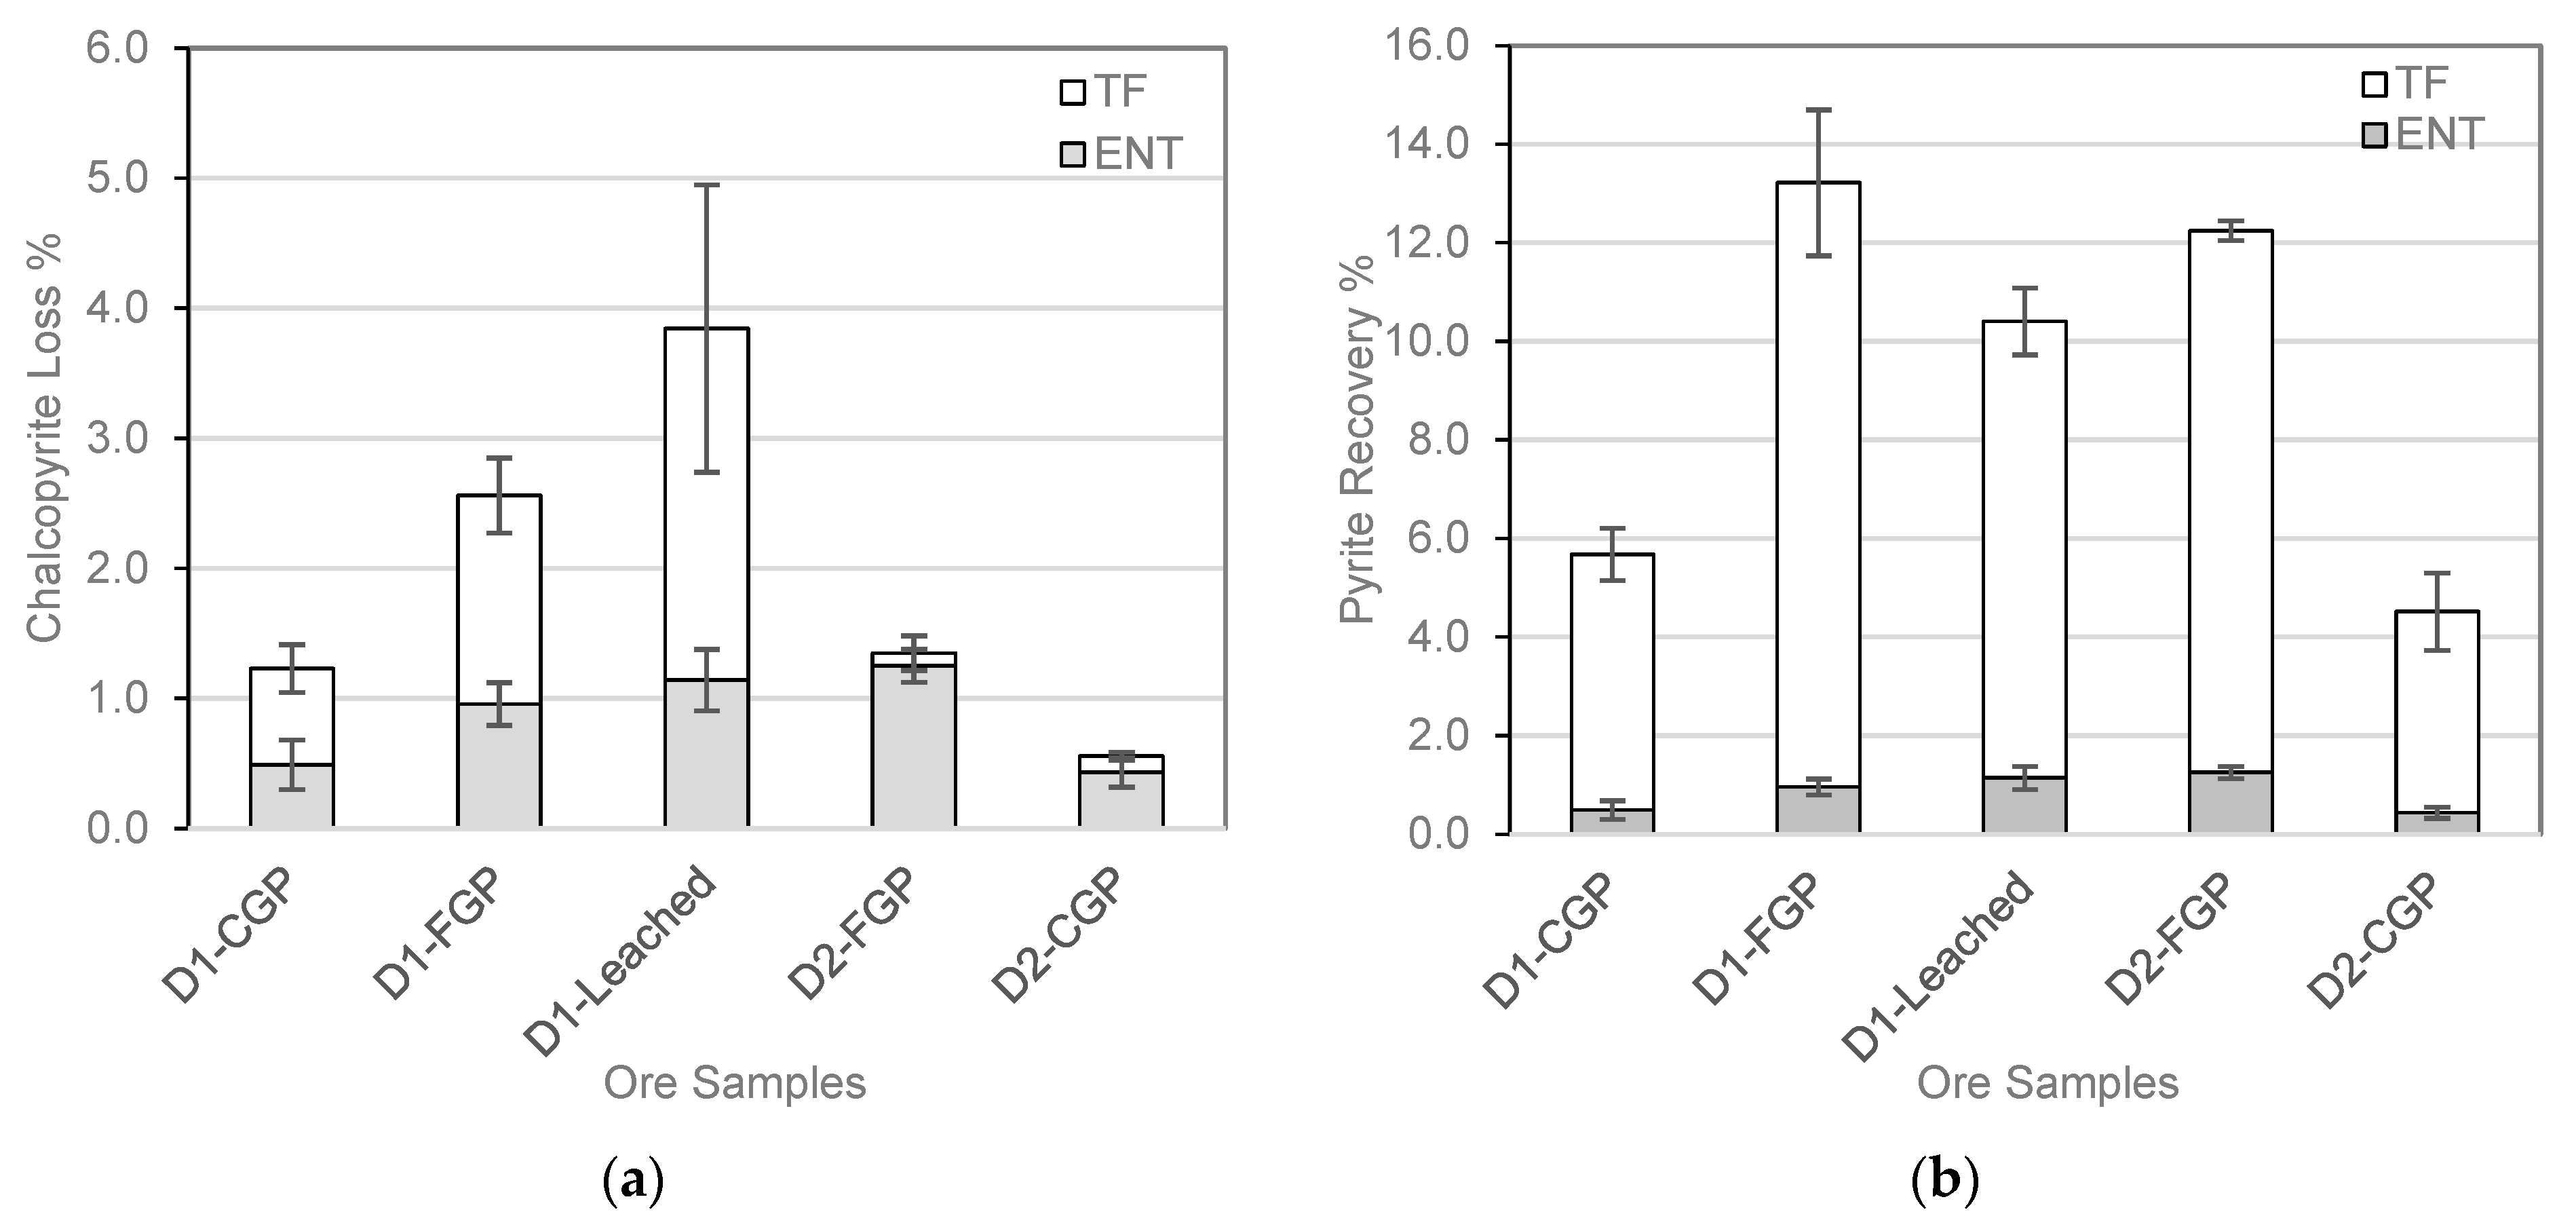
  • Overall chalcopyrite loss and pyrite recovery;
  • True flotation of chalcopyrite loss and pyrite recovery;
  • Entrainment in chalcopyrite loss and pyrite recovery.
Table 7 summarises the overall p-values for flotation data vs. geological data. For clarity, the instances where the p-values exceed 90% of the cells are highlighted in green. The results are discussed in detail in the following sections only if overall and true flotation p-values exceeded 90%.

4.1. Pyrite Recoveries

In cases where the correlation was found to be significant (p > 90%), the trend was plotted on a linear scale, as shown in
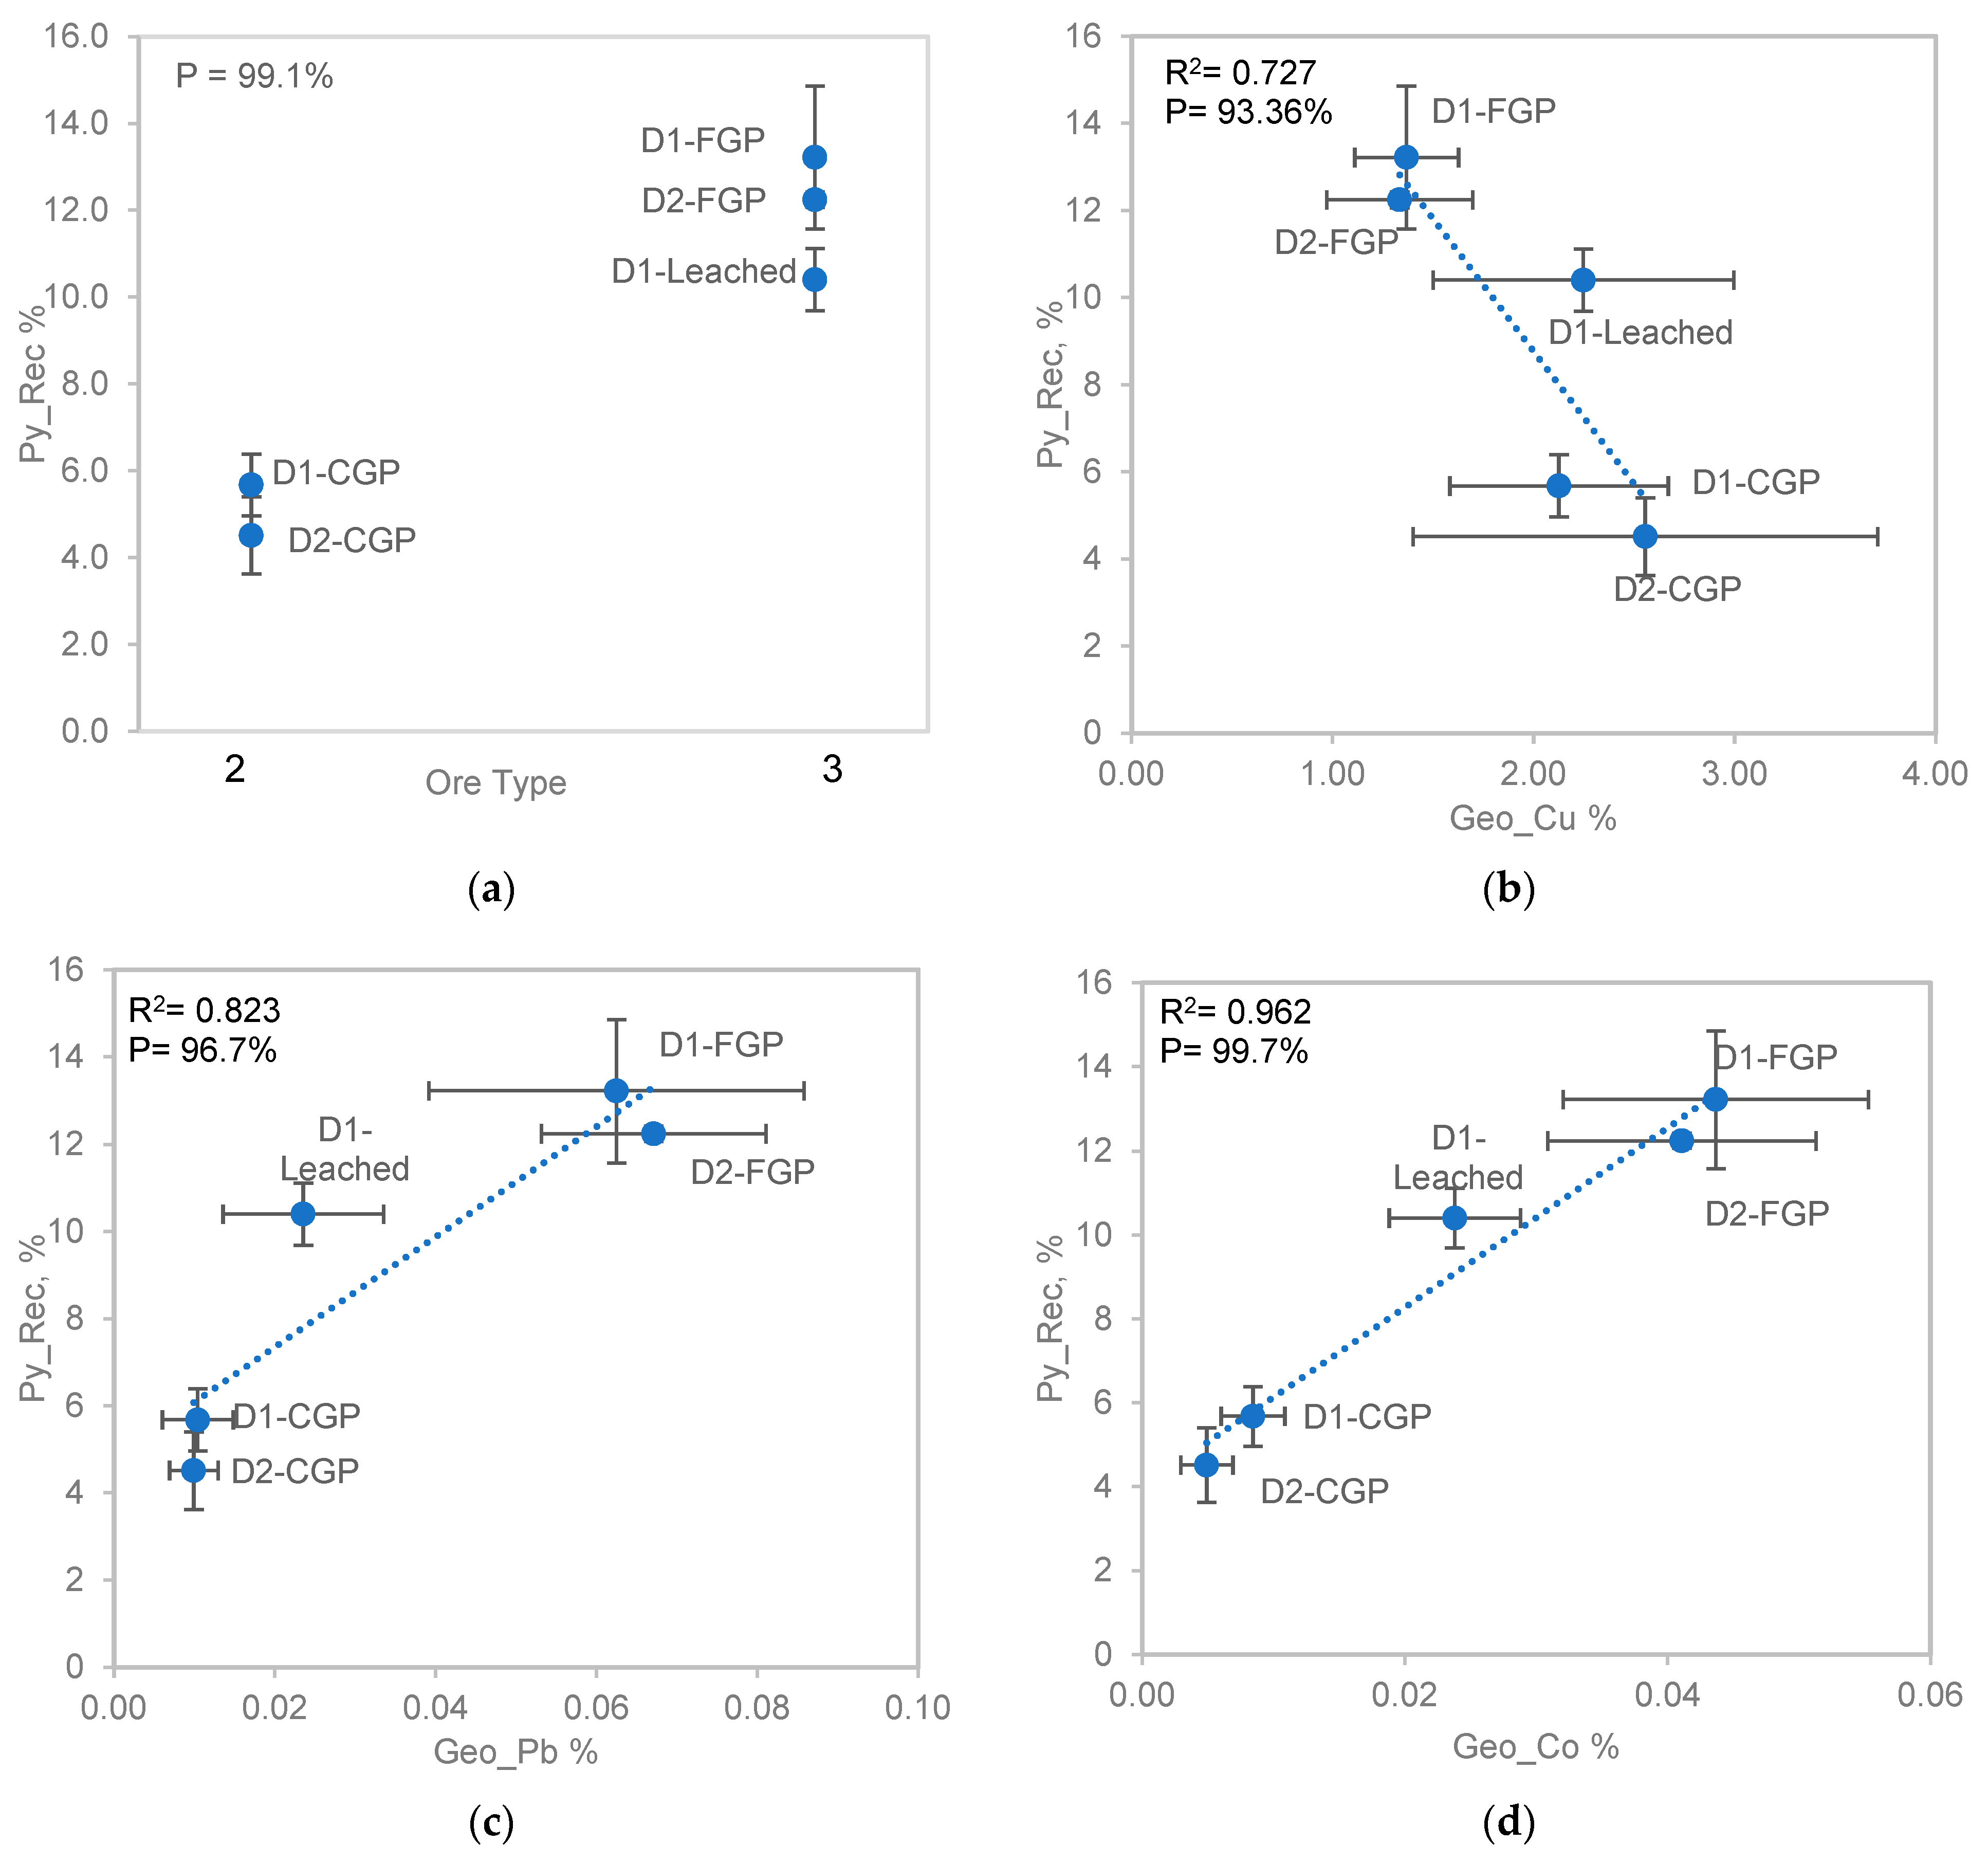
 Figure 13a–d.
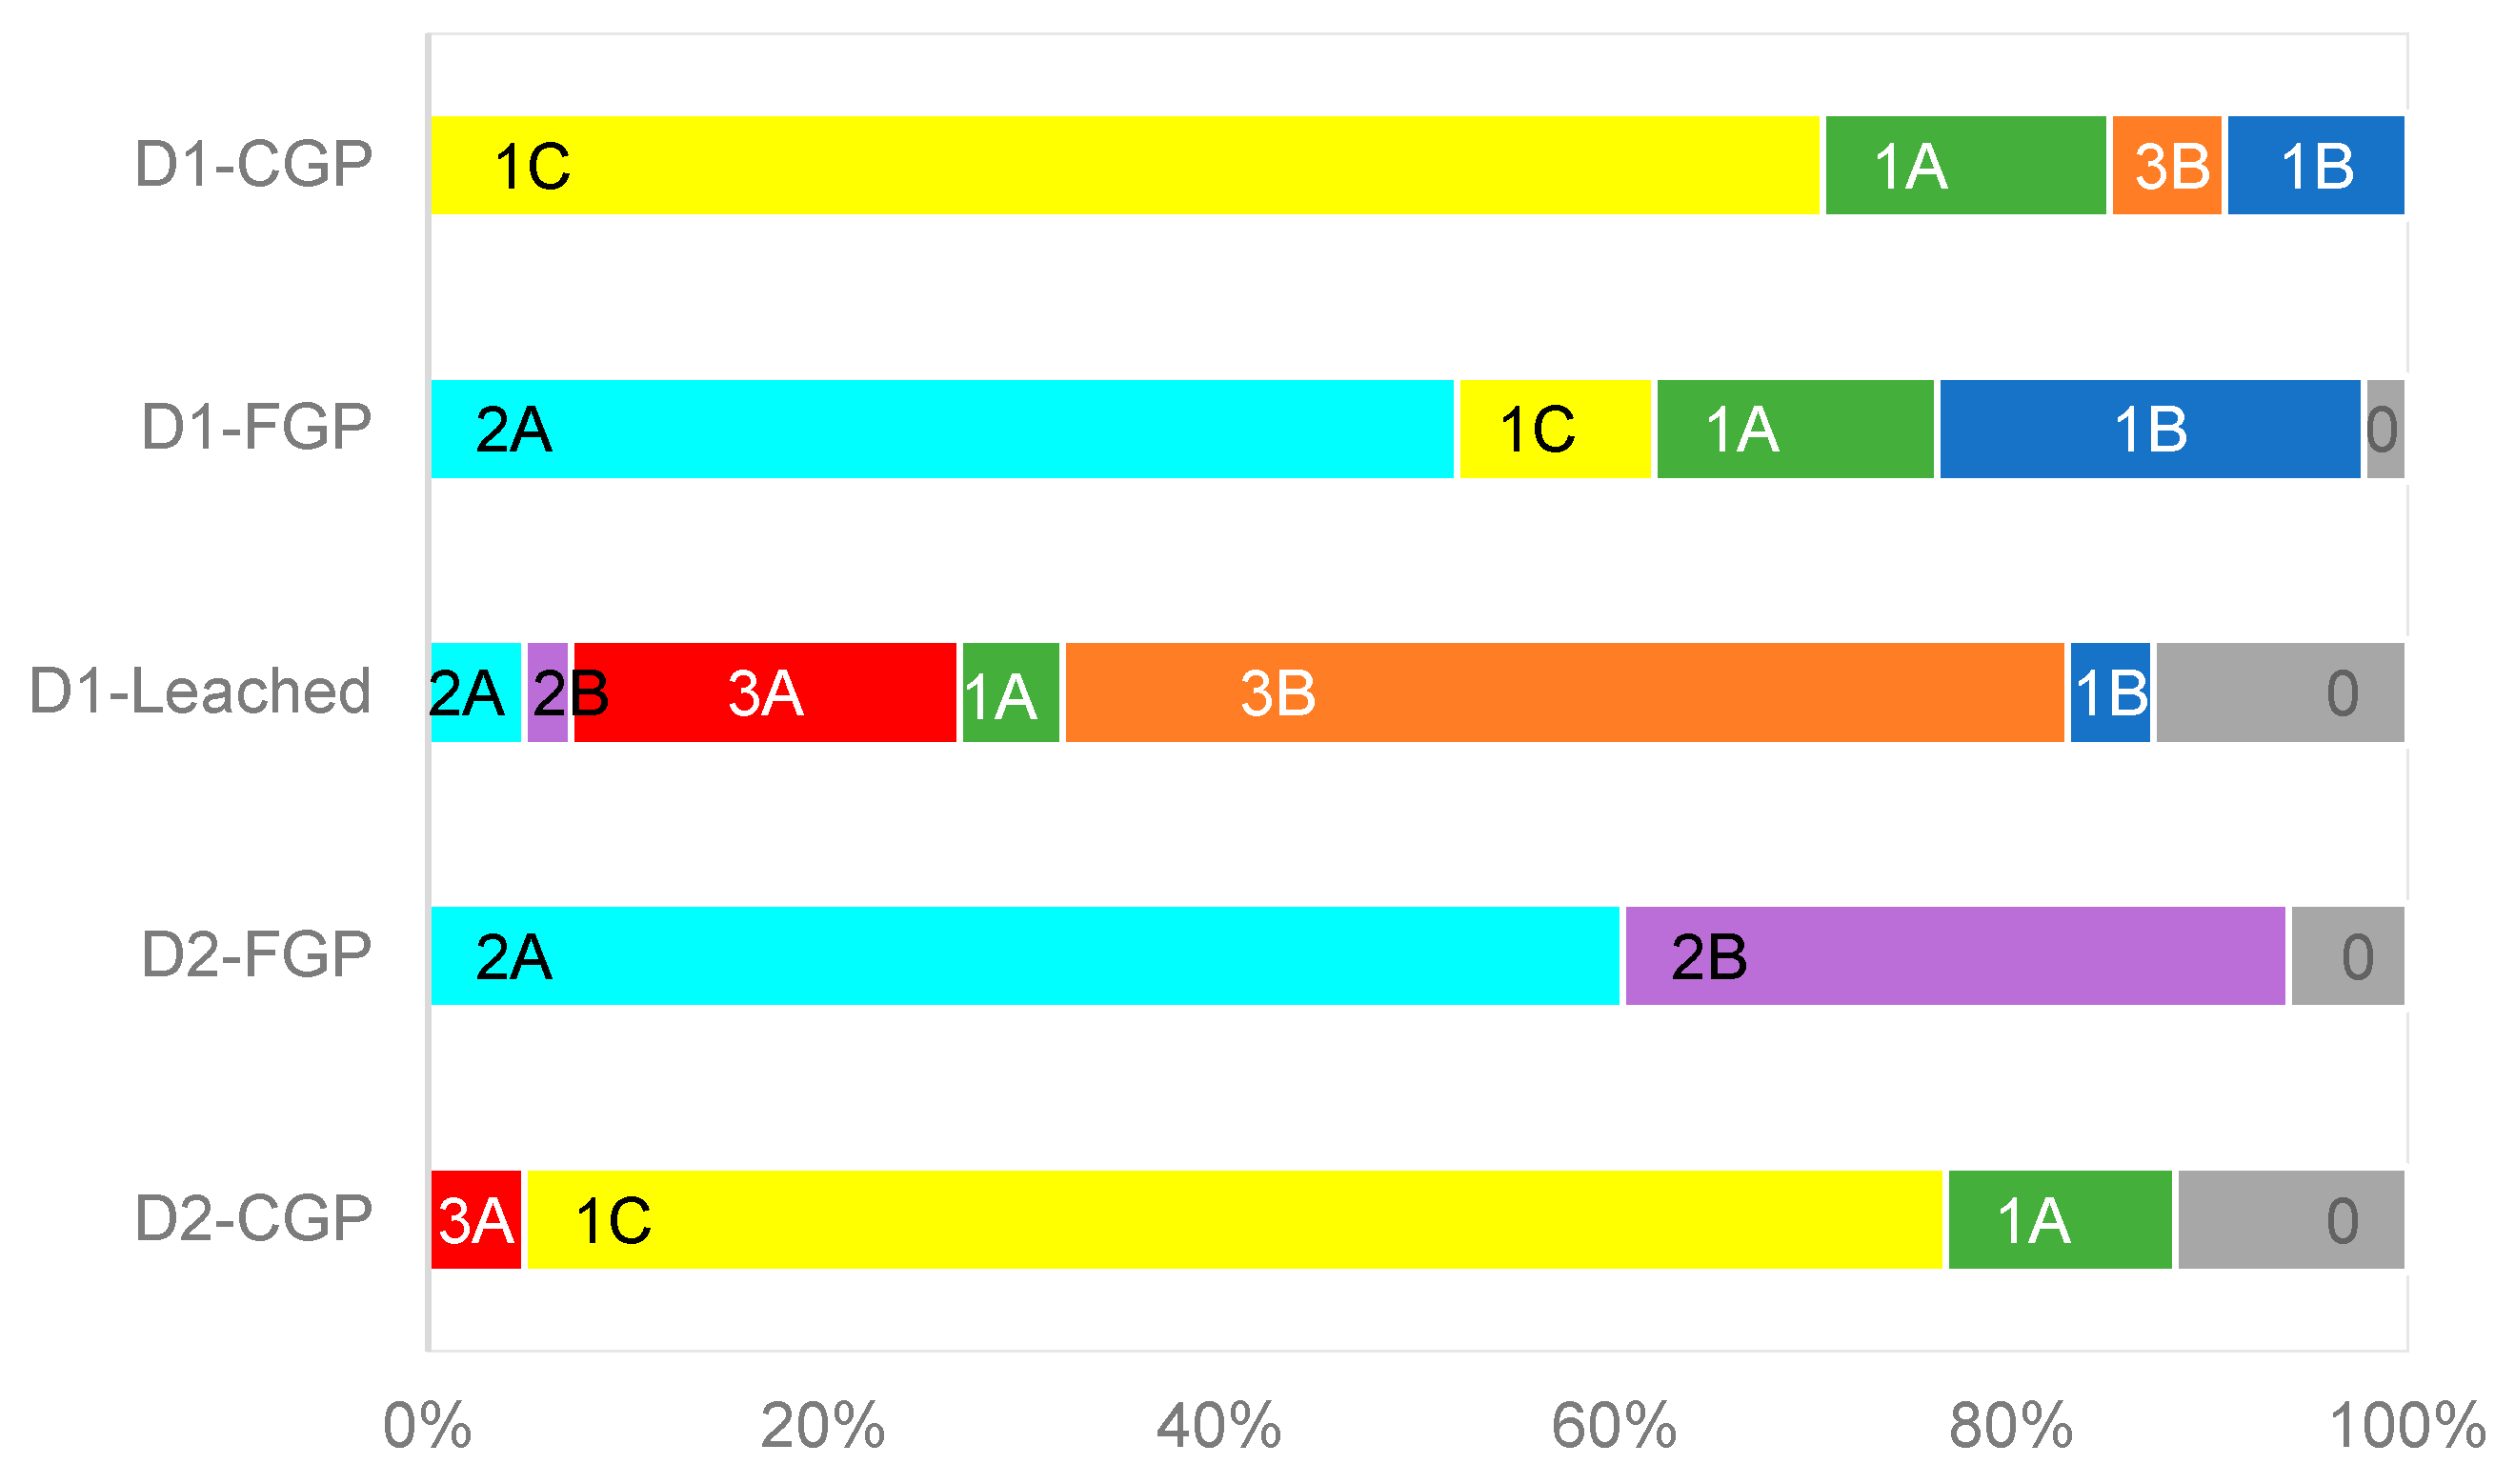
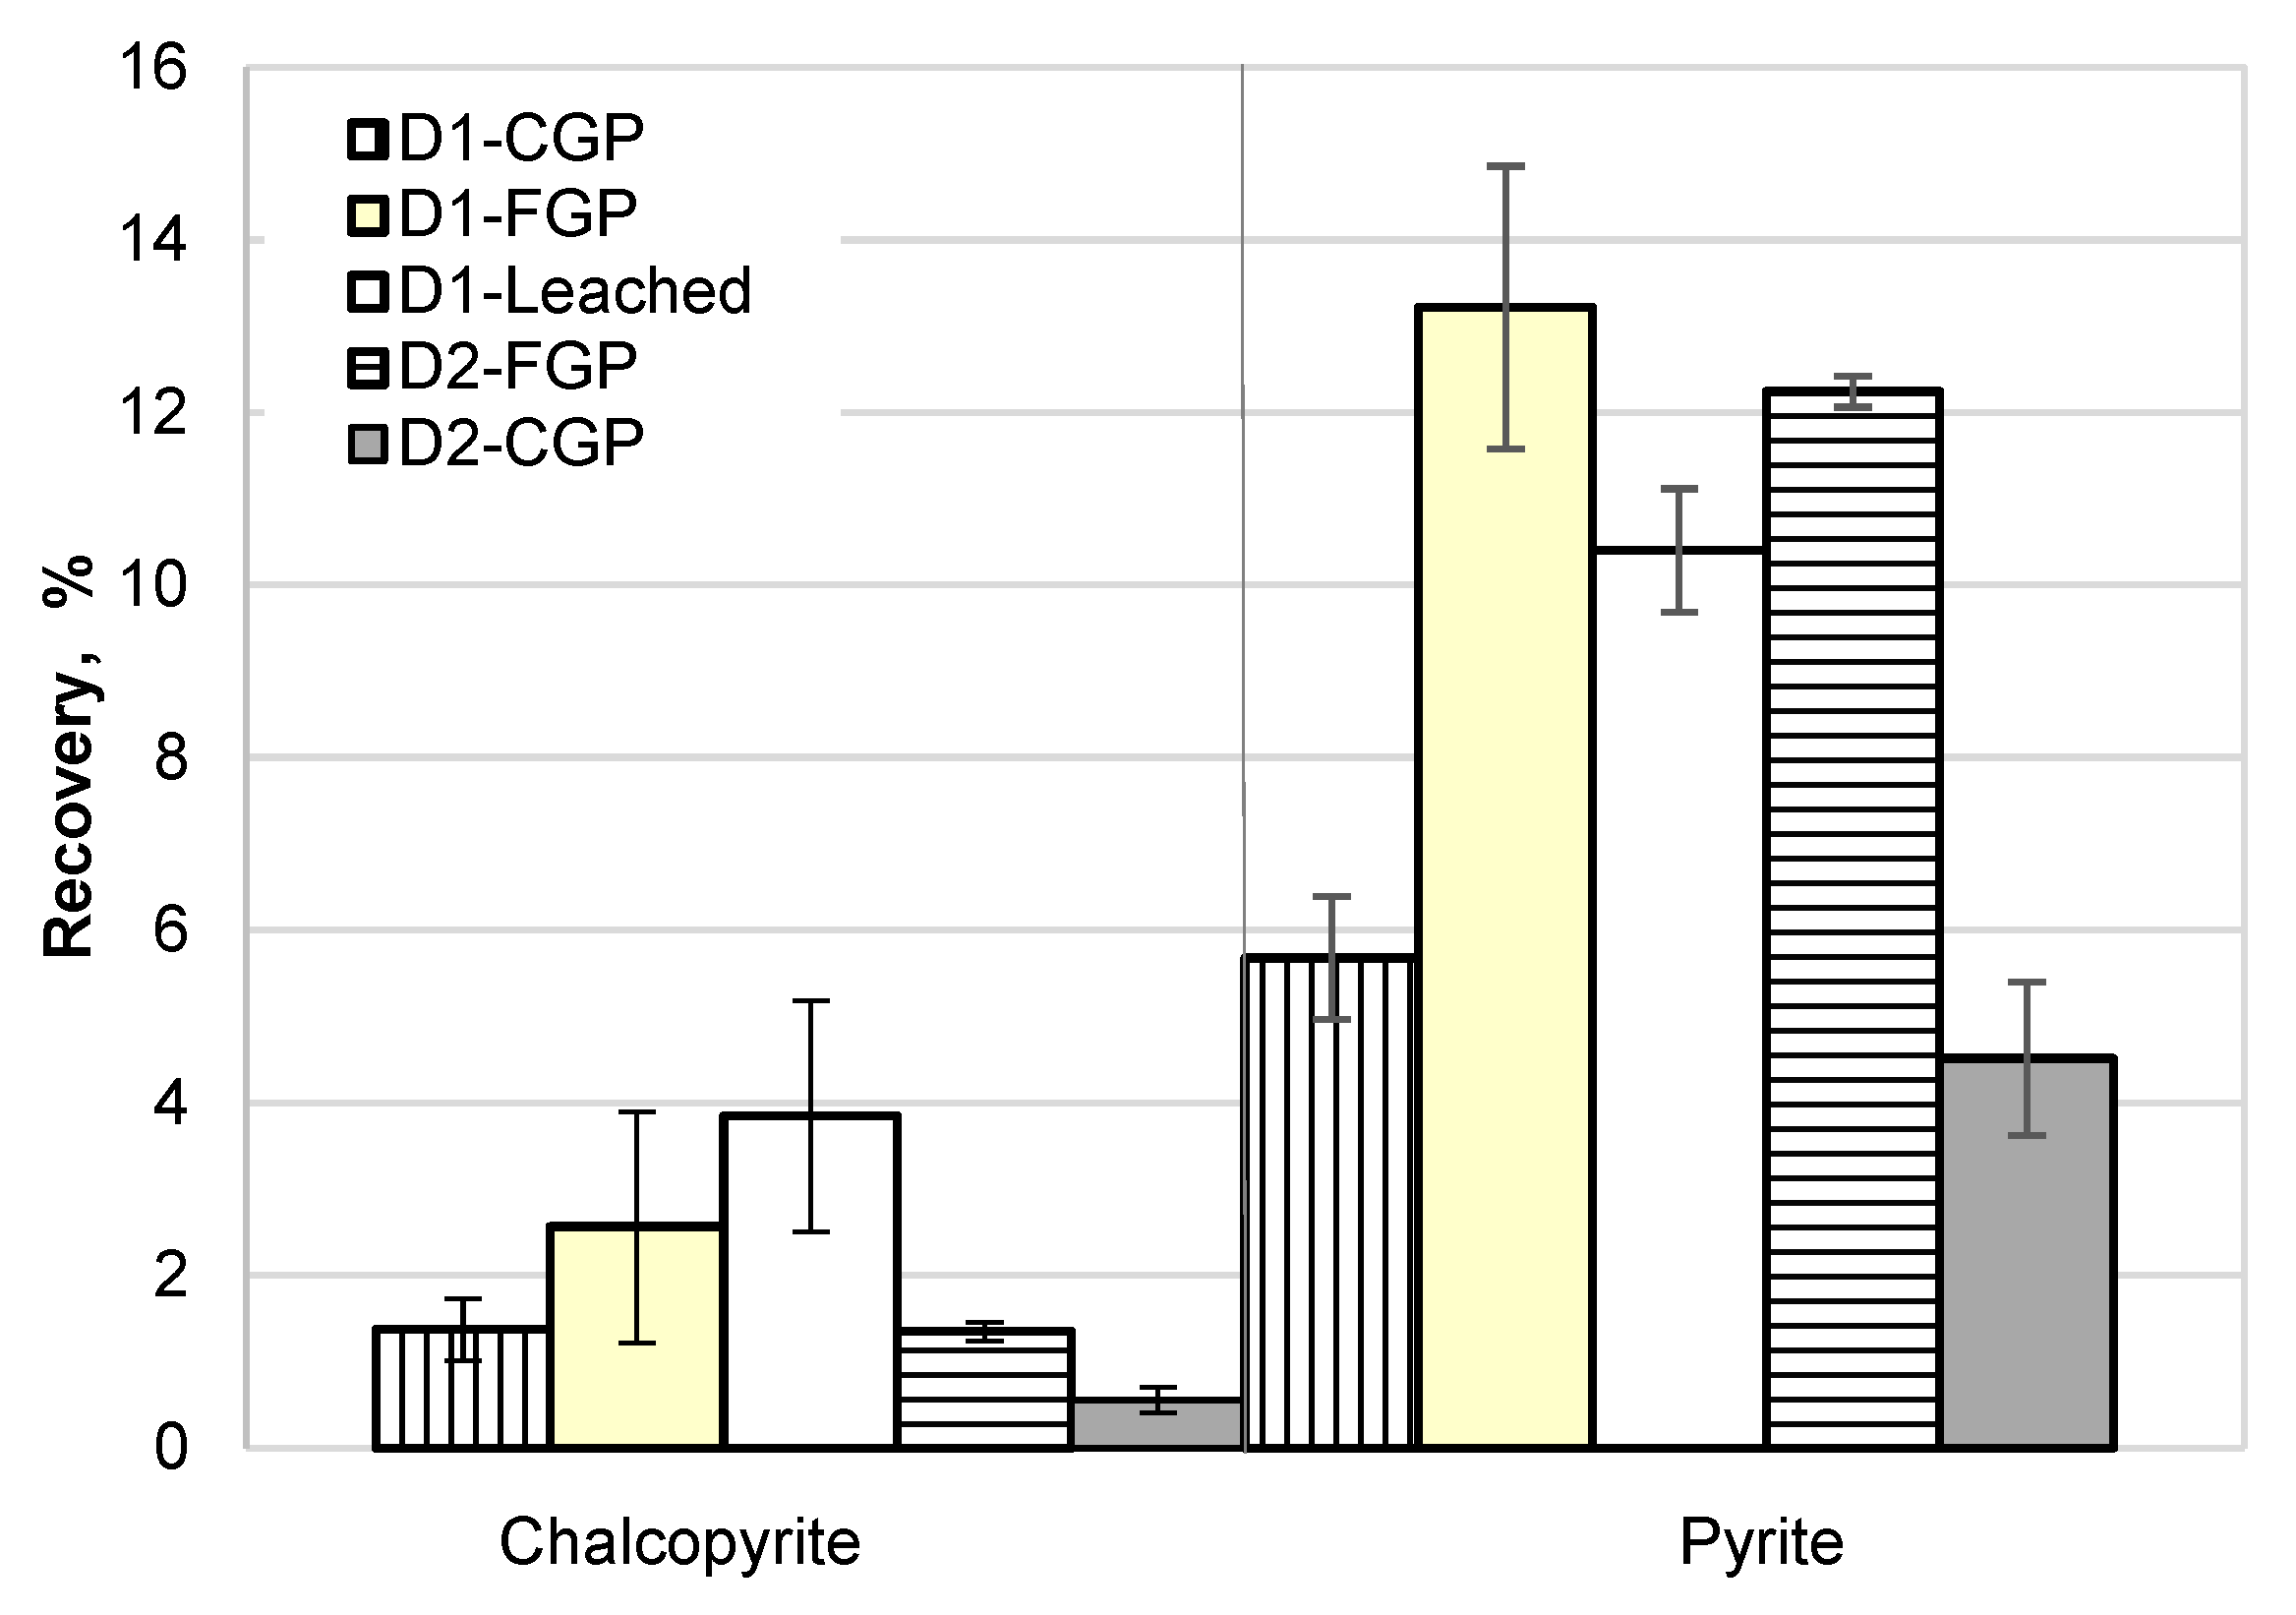
Figure 13a represents the correlation between pyrite flotation performance and geometallurgical ore type. Because this measure is non-numeric, the information can be treated as a classification function rather than a correlation. The results show that they fell into two groups when comparing the flotation results regarding rock type and mineral characteristics.
The D1-CGP and D2-CGP samples fell within the first group, characterised by ore type zone 2, defined as chalcopyrite ± pyrite and pyrrhotite. These samples were characterised by significantly lower pyrite recoveries in overall and true flotation (4%–6% for overall flotation, 4%–5% for true flotation). The second group contains D1-FGP, leached, and D2-FGP samples characterised by zone 3, as pyritic recrystallisation with chalcopyrite, pyrrhotite ± talc, and carbonate. These samples were floated with higher pyrite recoveries of 10%–13% overall and 9%–12% for true flotation.
Figure 13b shows the correlation between pyrite recovery and the Cu grade of that geological domain. Higher pyrite floatability was observed with lower Cu grade in the domain. The rock type associated with high copper grade was brecciated dolomitic shale with chalcopyrite ± pyrite and pyrrhotite minerals for D1-CGP and D2-CGP (see Table 3). The copper grade might not be the direct reason for low recoveries; however, the rock type and mineral association of high-grade copper in ore domains caused differences in the pyrite recoveries.
Another significant correlation was found between pyrite recovery and the lead and cobalt content of the ore domains (Geo_Pb, Geo_Co), as shown in 
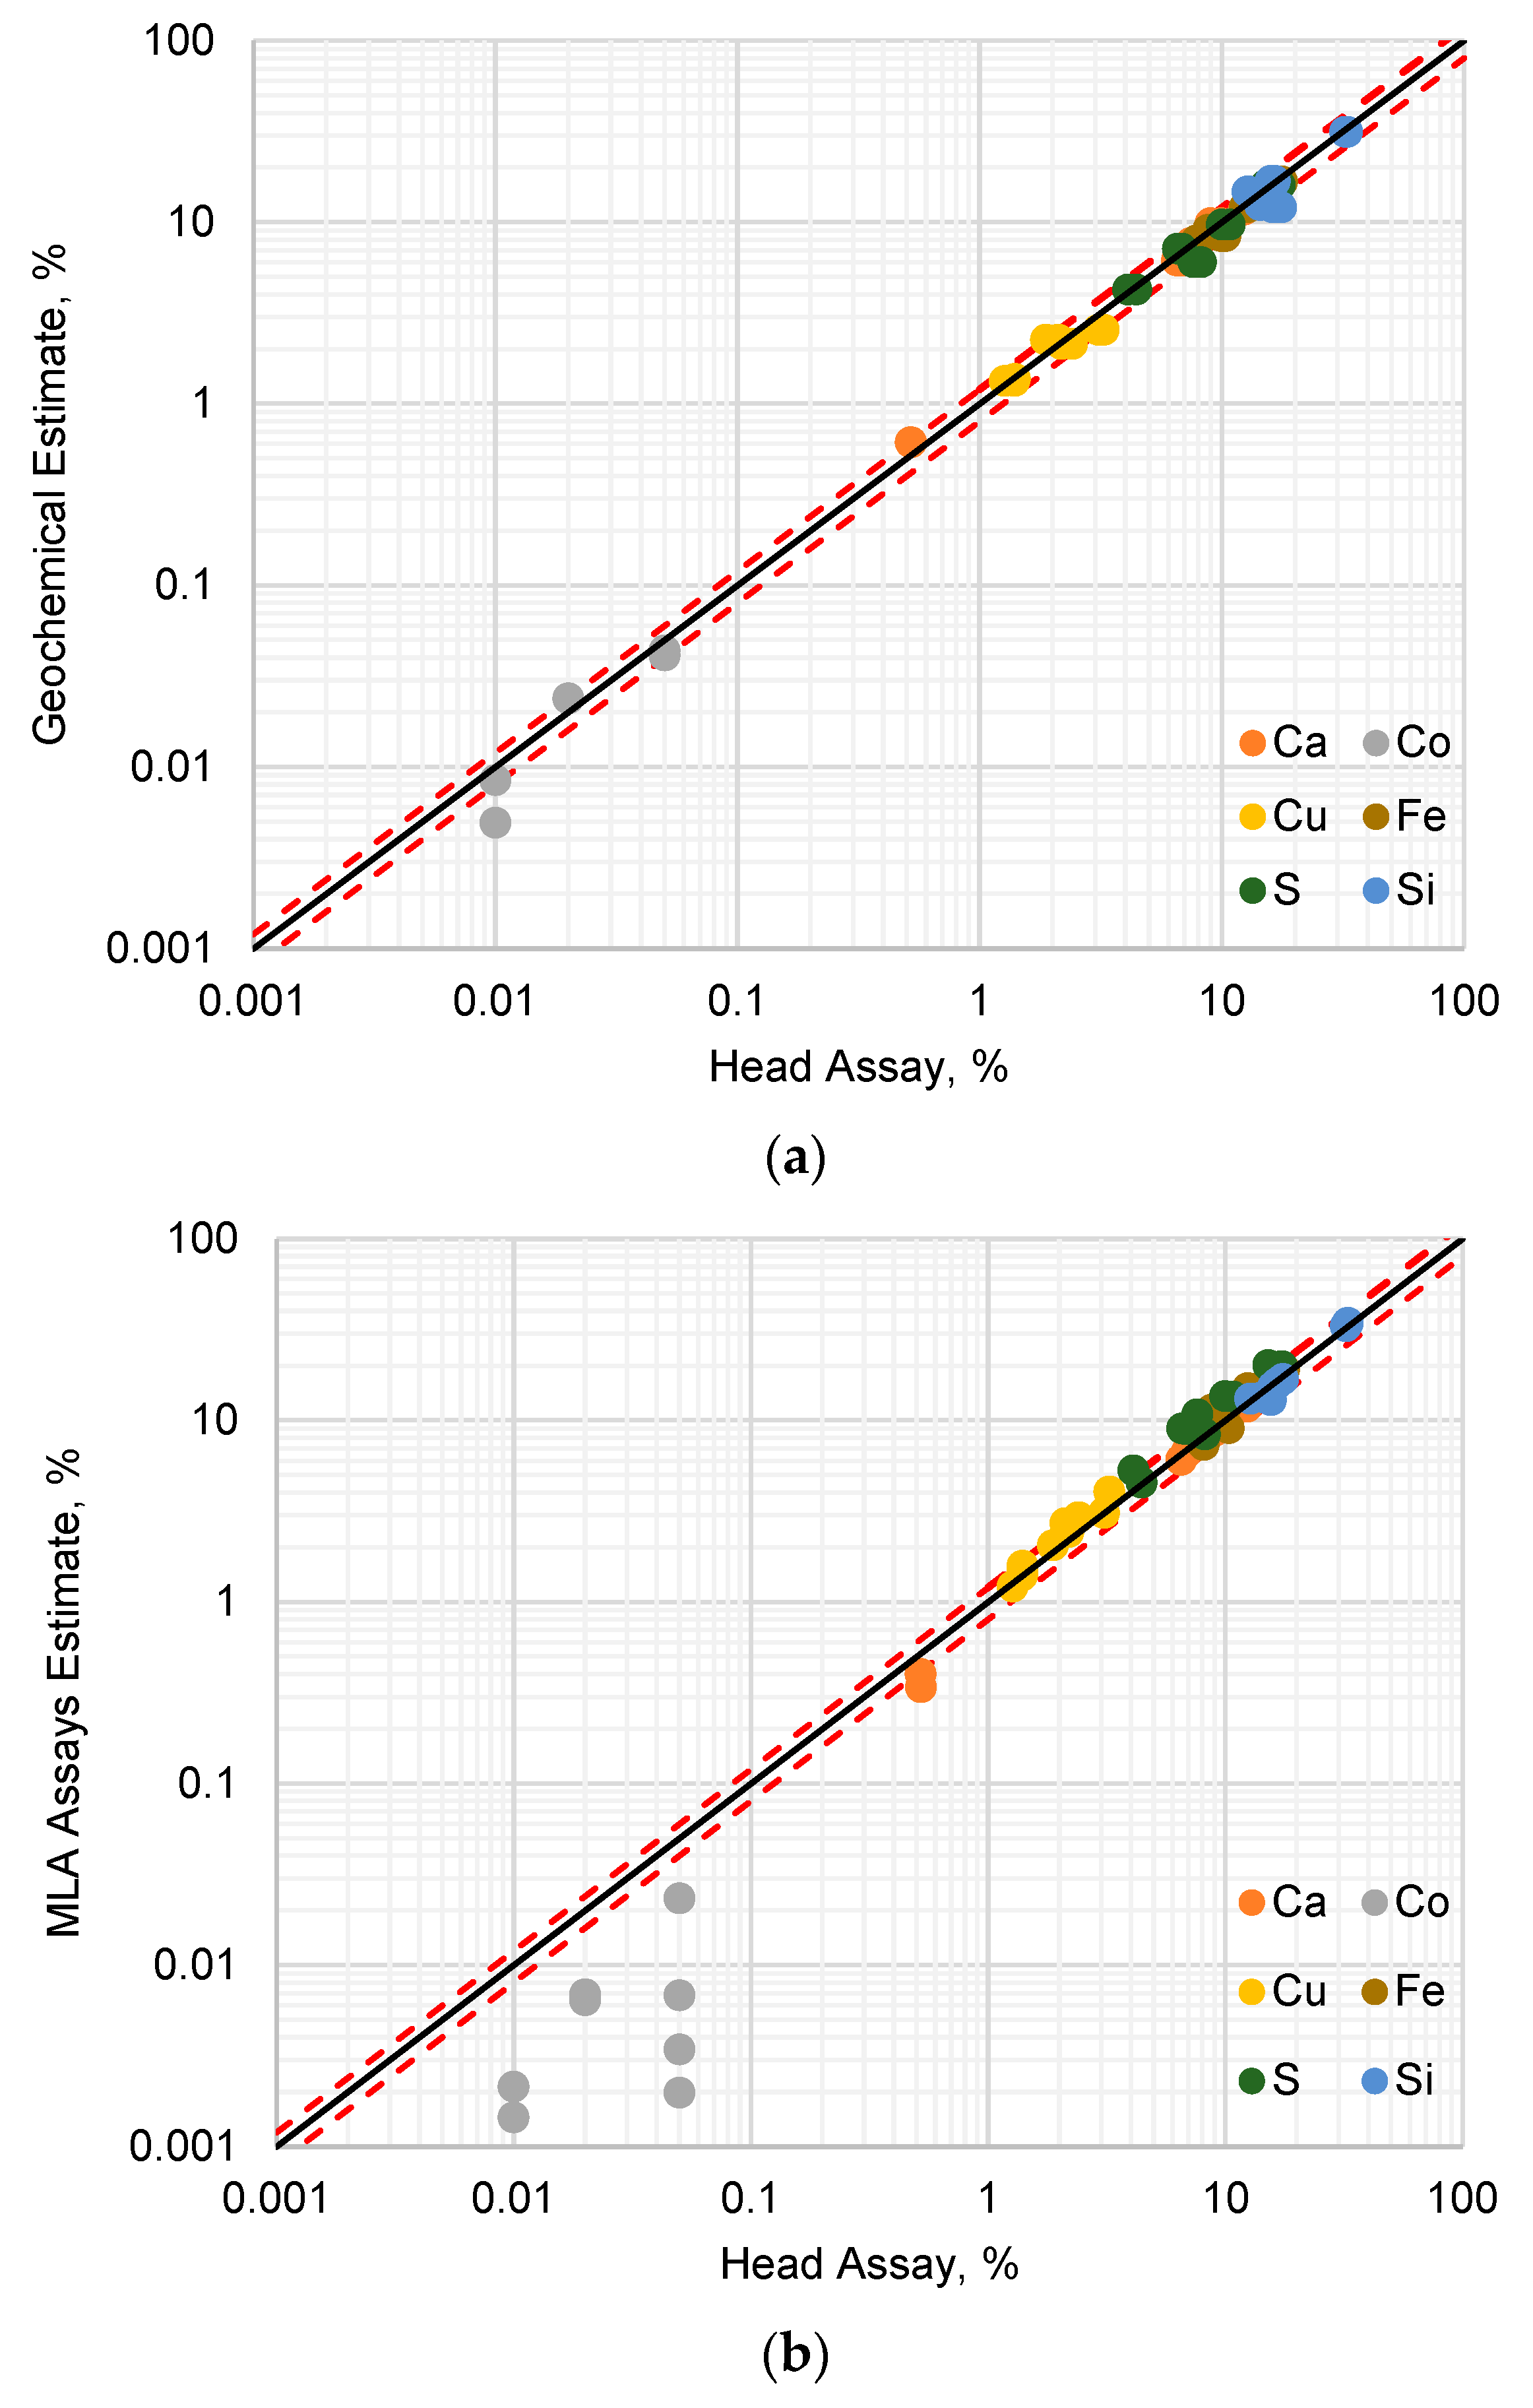
Figure 13c,d. Similar trends have been observed for both metal distributions in the ore domain and how they correlated with pyrite floatability. The MLA for all ore domain samples showed low concentrations of galena and cobaltite (see 
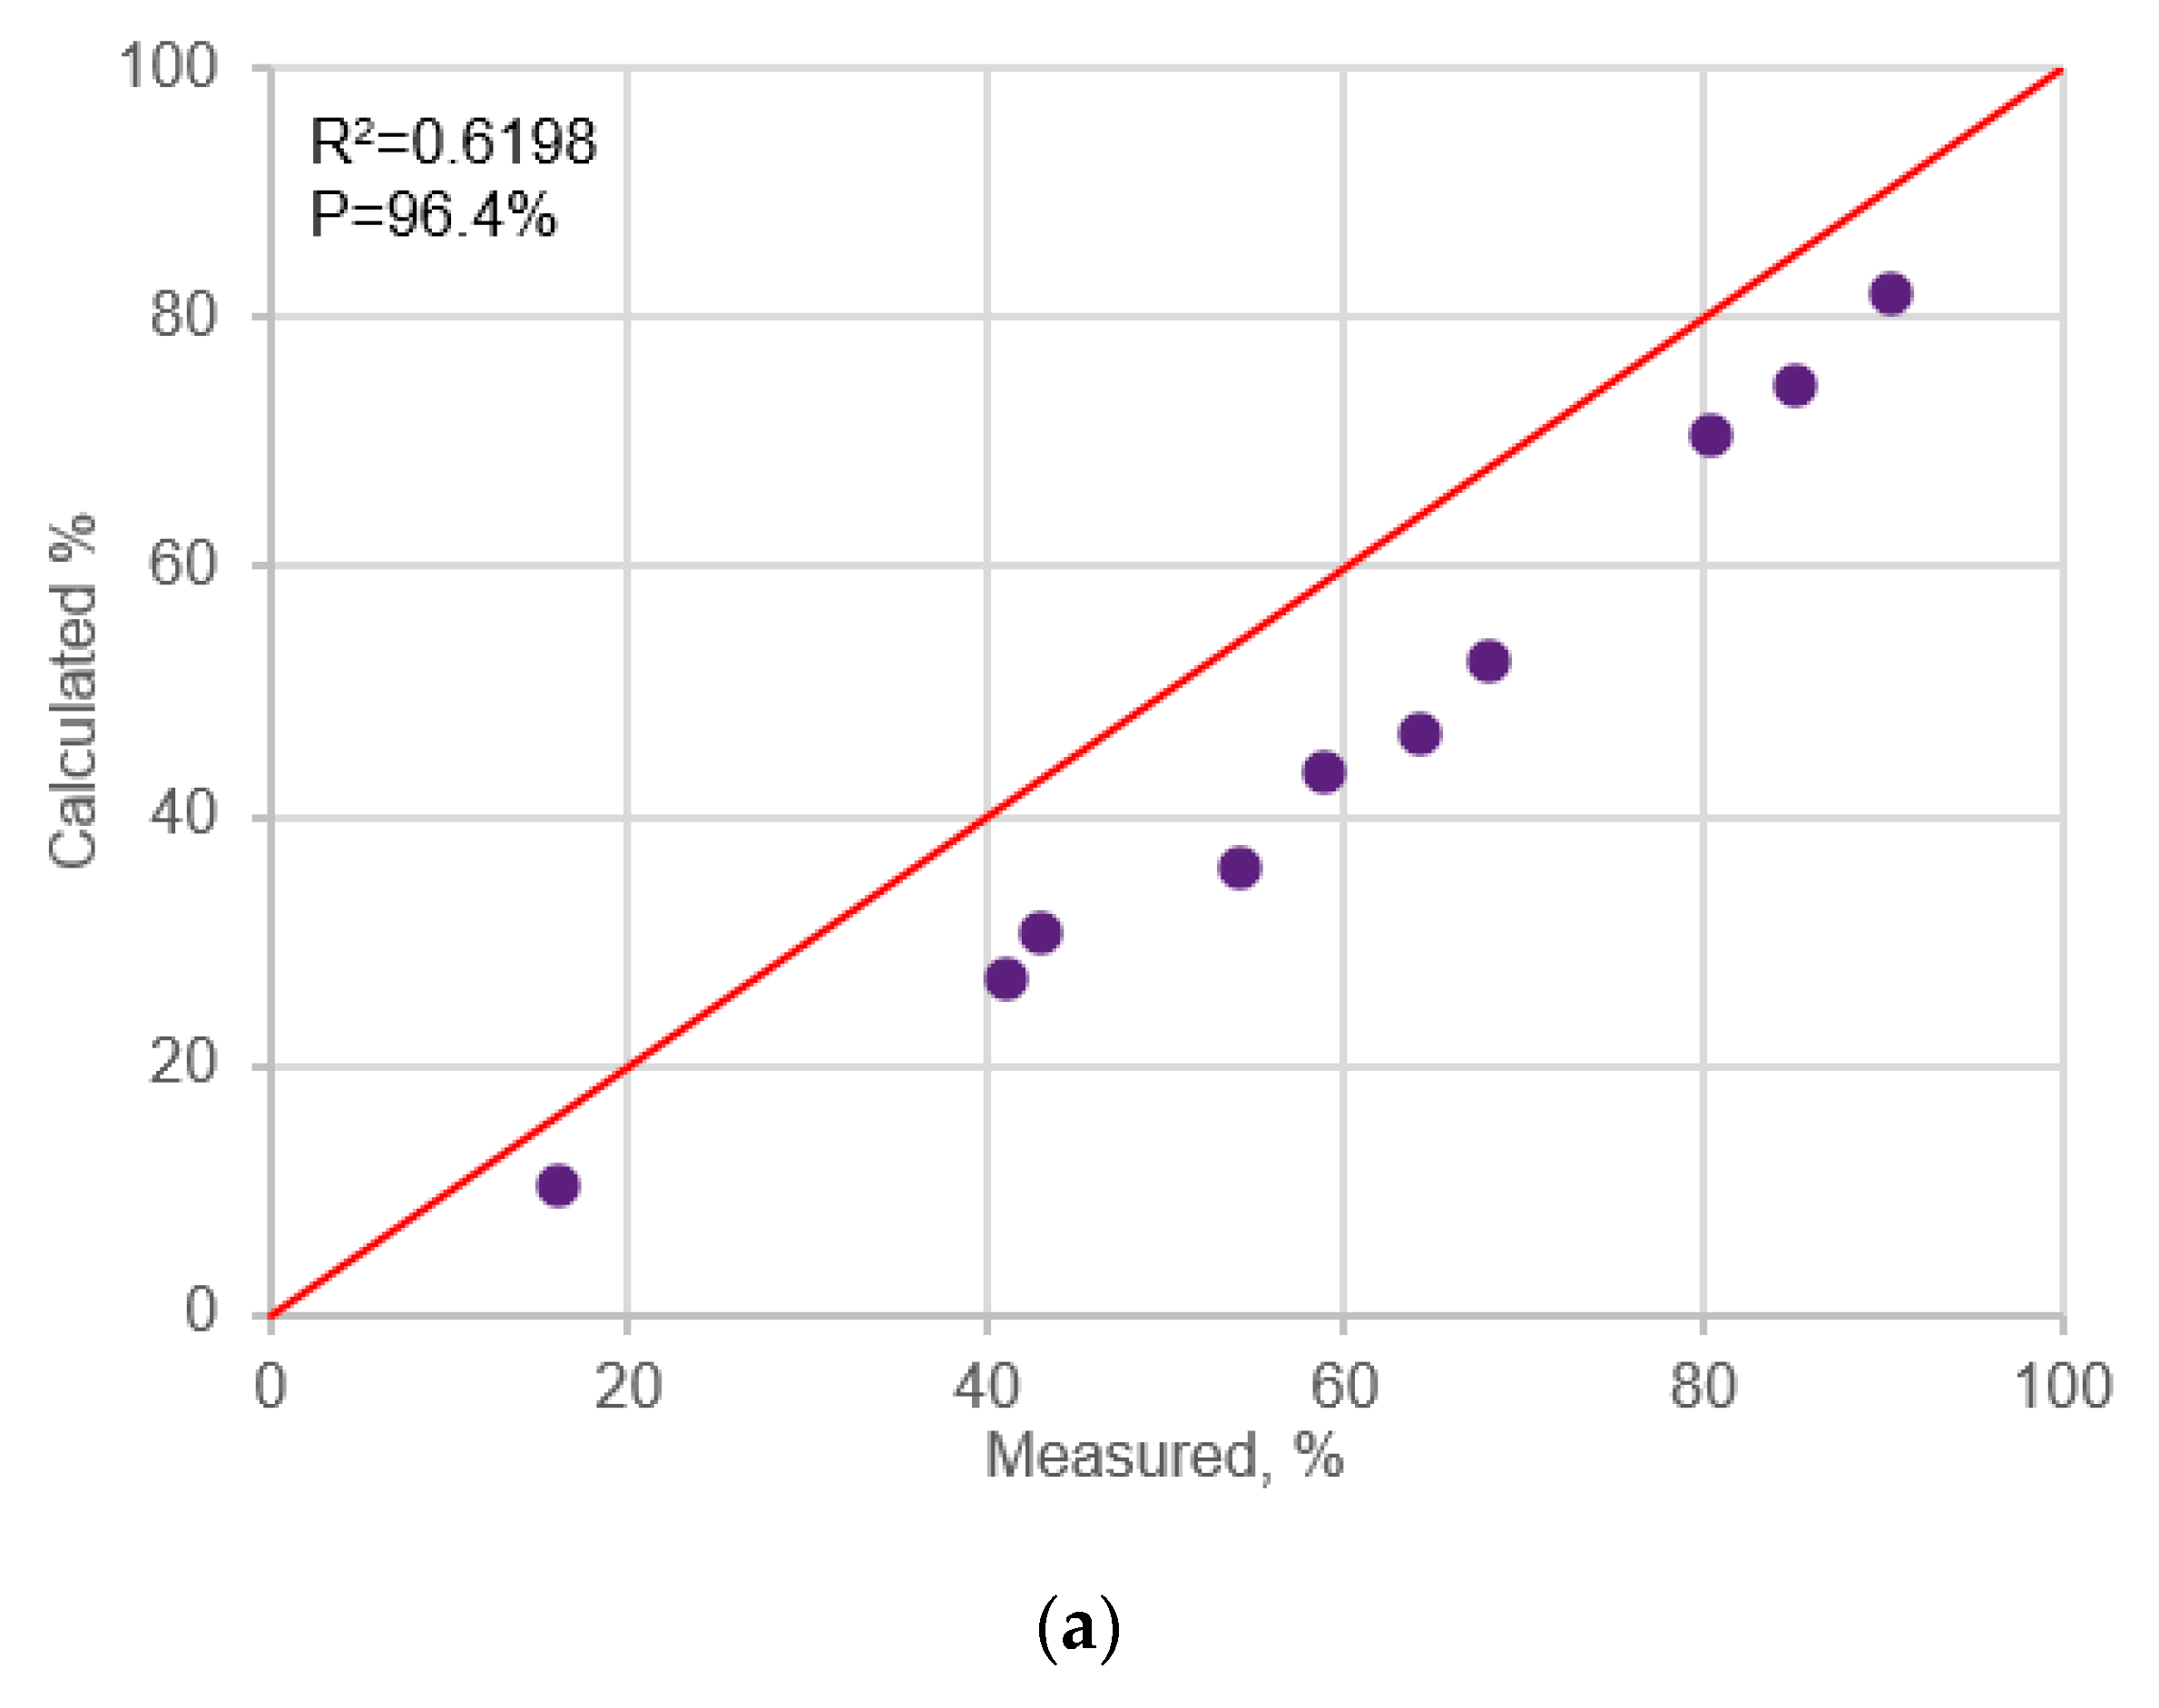
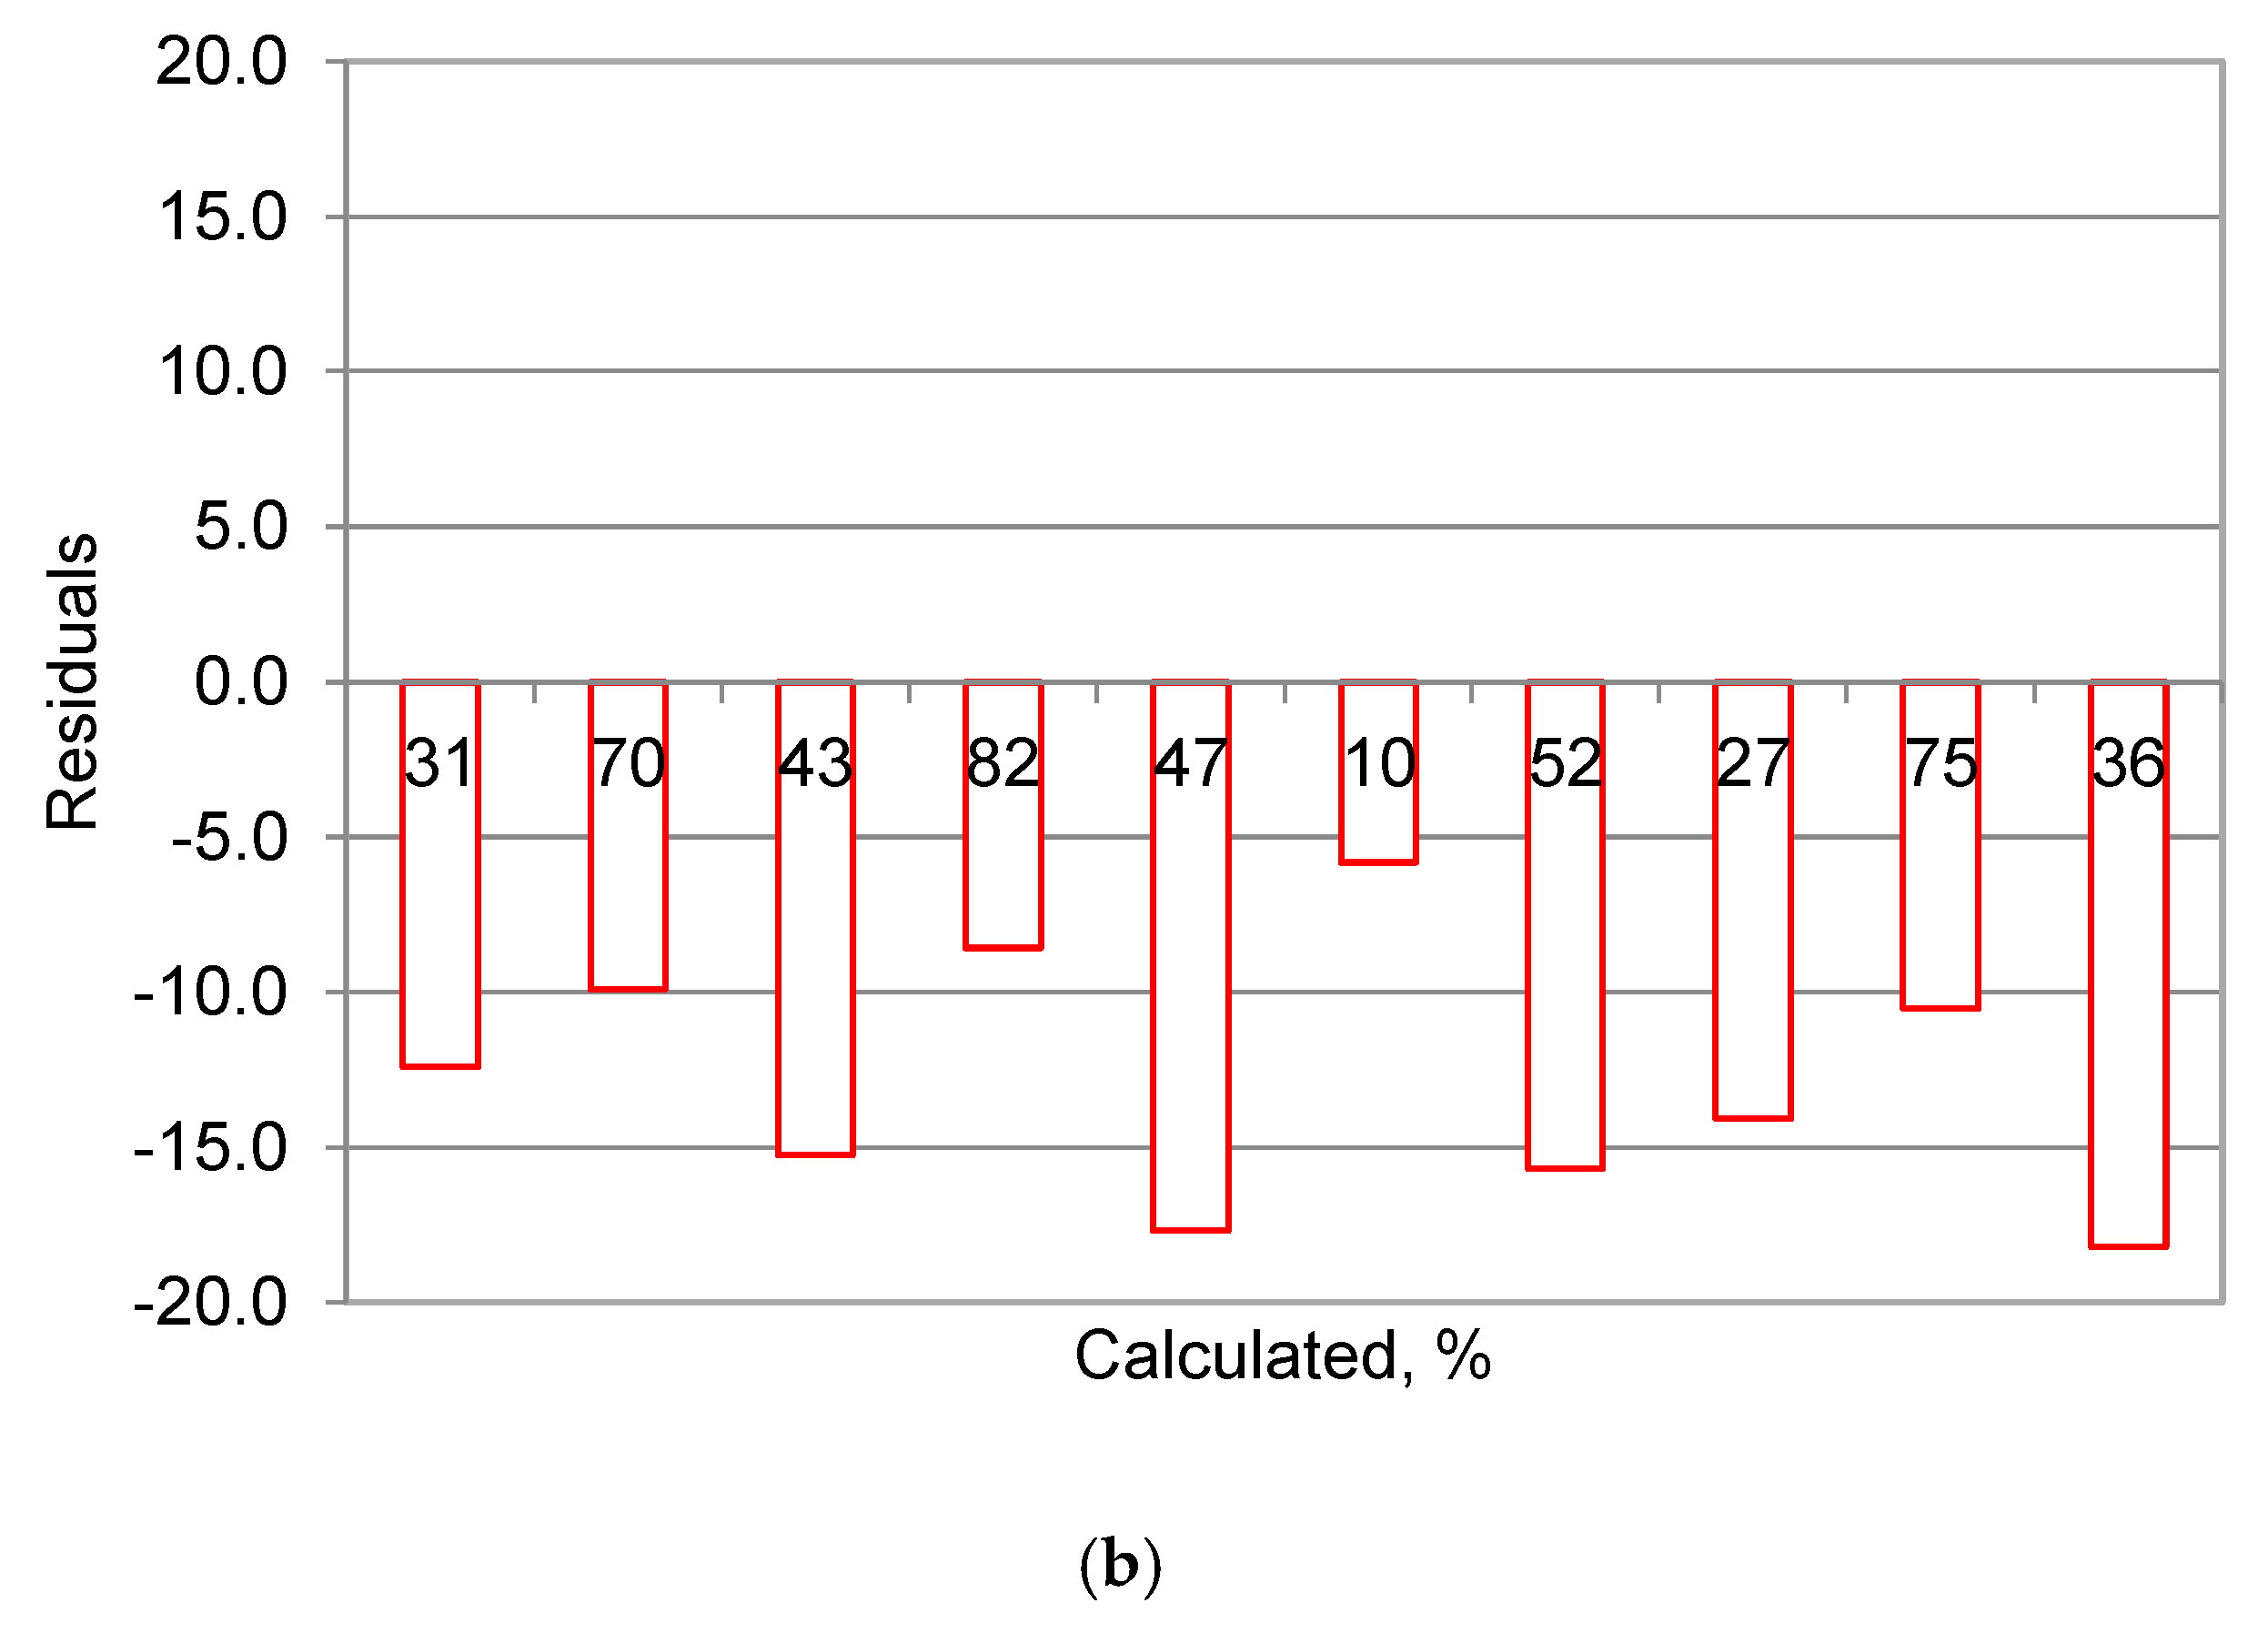
Table 5). The stoichiometrically calculated Co and Pb assays from the MLA mineral distribution were below the assayed values for Co and geochemical estimate for Pb (see Figure 5b); therefore, the Co and Pb distribution in the ore domain are likely to be present as micro inclusions or substitutions in the crystal matrix of other mineral species [37]. The highest concentration of Co and Pb was present in the D1-FGP and D2-FGP samples, compared to the other domains. These domains are also known to contain a prevalence of disseminated fine-grain pyrite texture, thus suggesting that the content of micro inclusions or metal substitution correlates with the prevalence of finer pyrite texture.
In the literature, it is suggested that the trace elements of pyrite vary due to a combination of nano-inclusions (Pb, Ag, Zn) and coupled heterovalent lattice substitution (Tl, As, Cu, Sb) [49]. The Co distribution amongst the lead, zinc, and copper milling products at Mount Isa were investigated [36]. The results showed that, while the cobalt content of the lead-zinc ores was negligible, it was significant in the copper ores. Cobalt showed a positive linear correlation with iron rather than copper, especially in the final copper tailings product, where iron was mostly present as framboidal pyrite.
Elevated Co and Pb substitution indicated galvanic interaction that might occur inside framboids, where the core of framboids might be exchanged with other minerals or elements. Barker, et al. [50] suggested that the increased surface area of framboidal pyrite increases the galvanic interaction with other minerals and their floatability. Further analysis is necessary to prove the metal substitution in/between the fine pyrite grains.

4.2. Chalcopyrite Losses

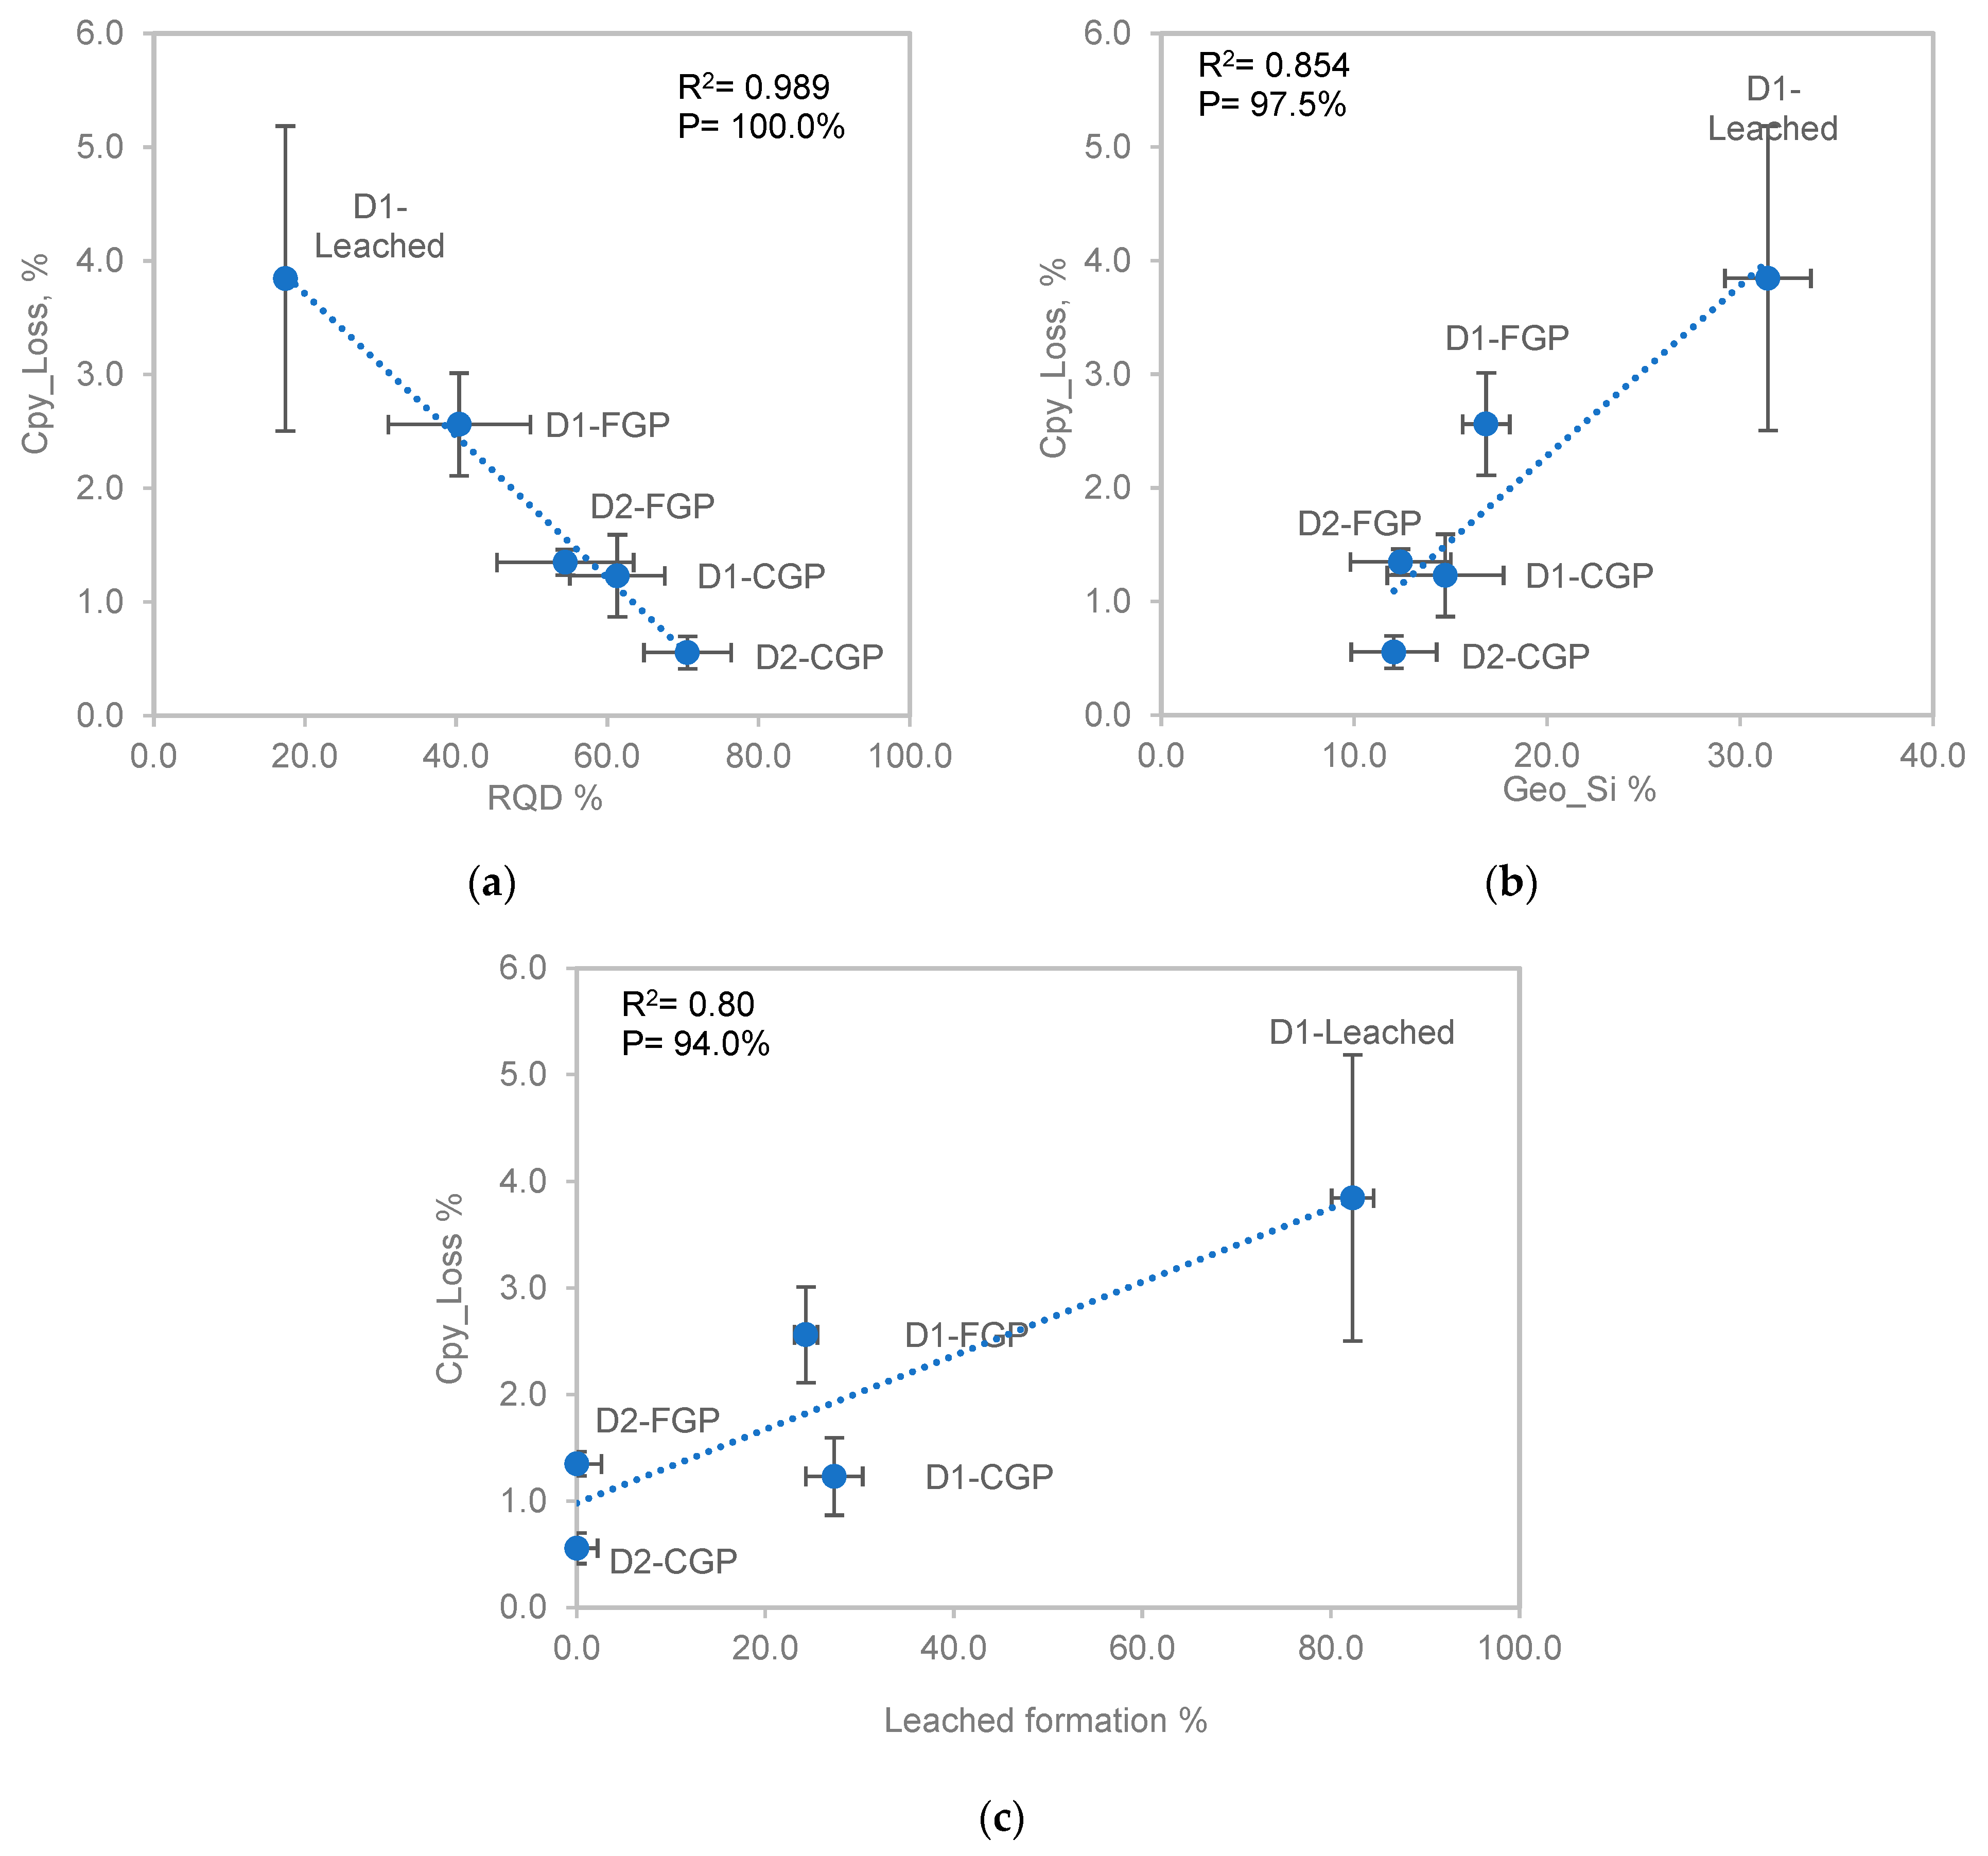
Figure 14a–c shows the correlations and probability of significance values over 90%. The chalcopyrite losses are mainly associated with rock quality, silicification, and weathering.
Figure 14a shows the regression analysis of the calculated RQD values of rock domains and the chalcopyrite recoveries; the p value was found as 100%, and the R2 was found as 0.9895. This strong correlation suggests that the less-competent rock has a higher natural floatability of chalcopyrite. The rock quality designation indicates the rock mass structure; less than 50% is a weakened rock mass. The weakened rock mass mostly comes from the weathering zone. Light weathering in the ore domain improved the hydrophobicity and enhanced the natural floatability of the chalcopyrite [51], which is very well correlated with the findings in this study.
Figure 14b represents the correlation between Geo_Si% data and chalcopyrite loss, and a high (97.5%) probability was calculated between them, supporting RQD correlations. The elevated Si% amounts in this study showed the replacement of carbonates by silicates because of weathering. Therefore, increasing the Si% amount in the ore domain is found to be an indication of leaching, which increases the chalcopyrite loss.
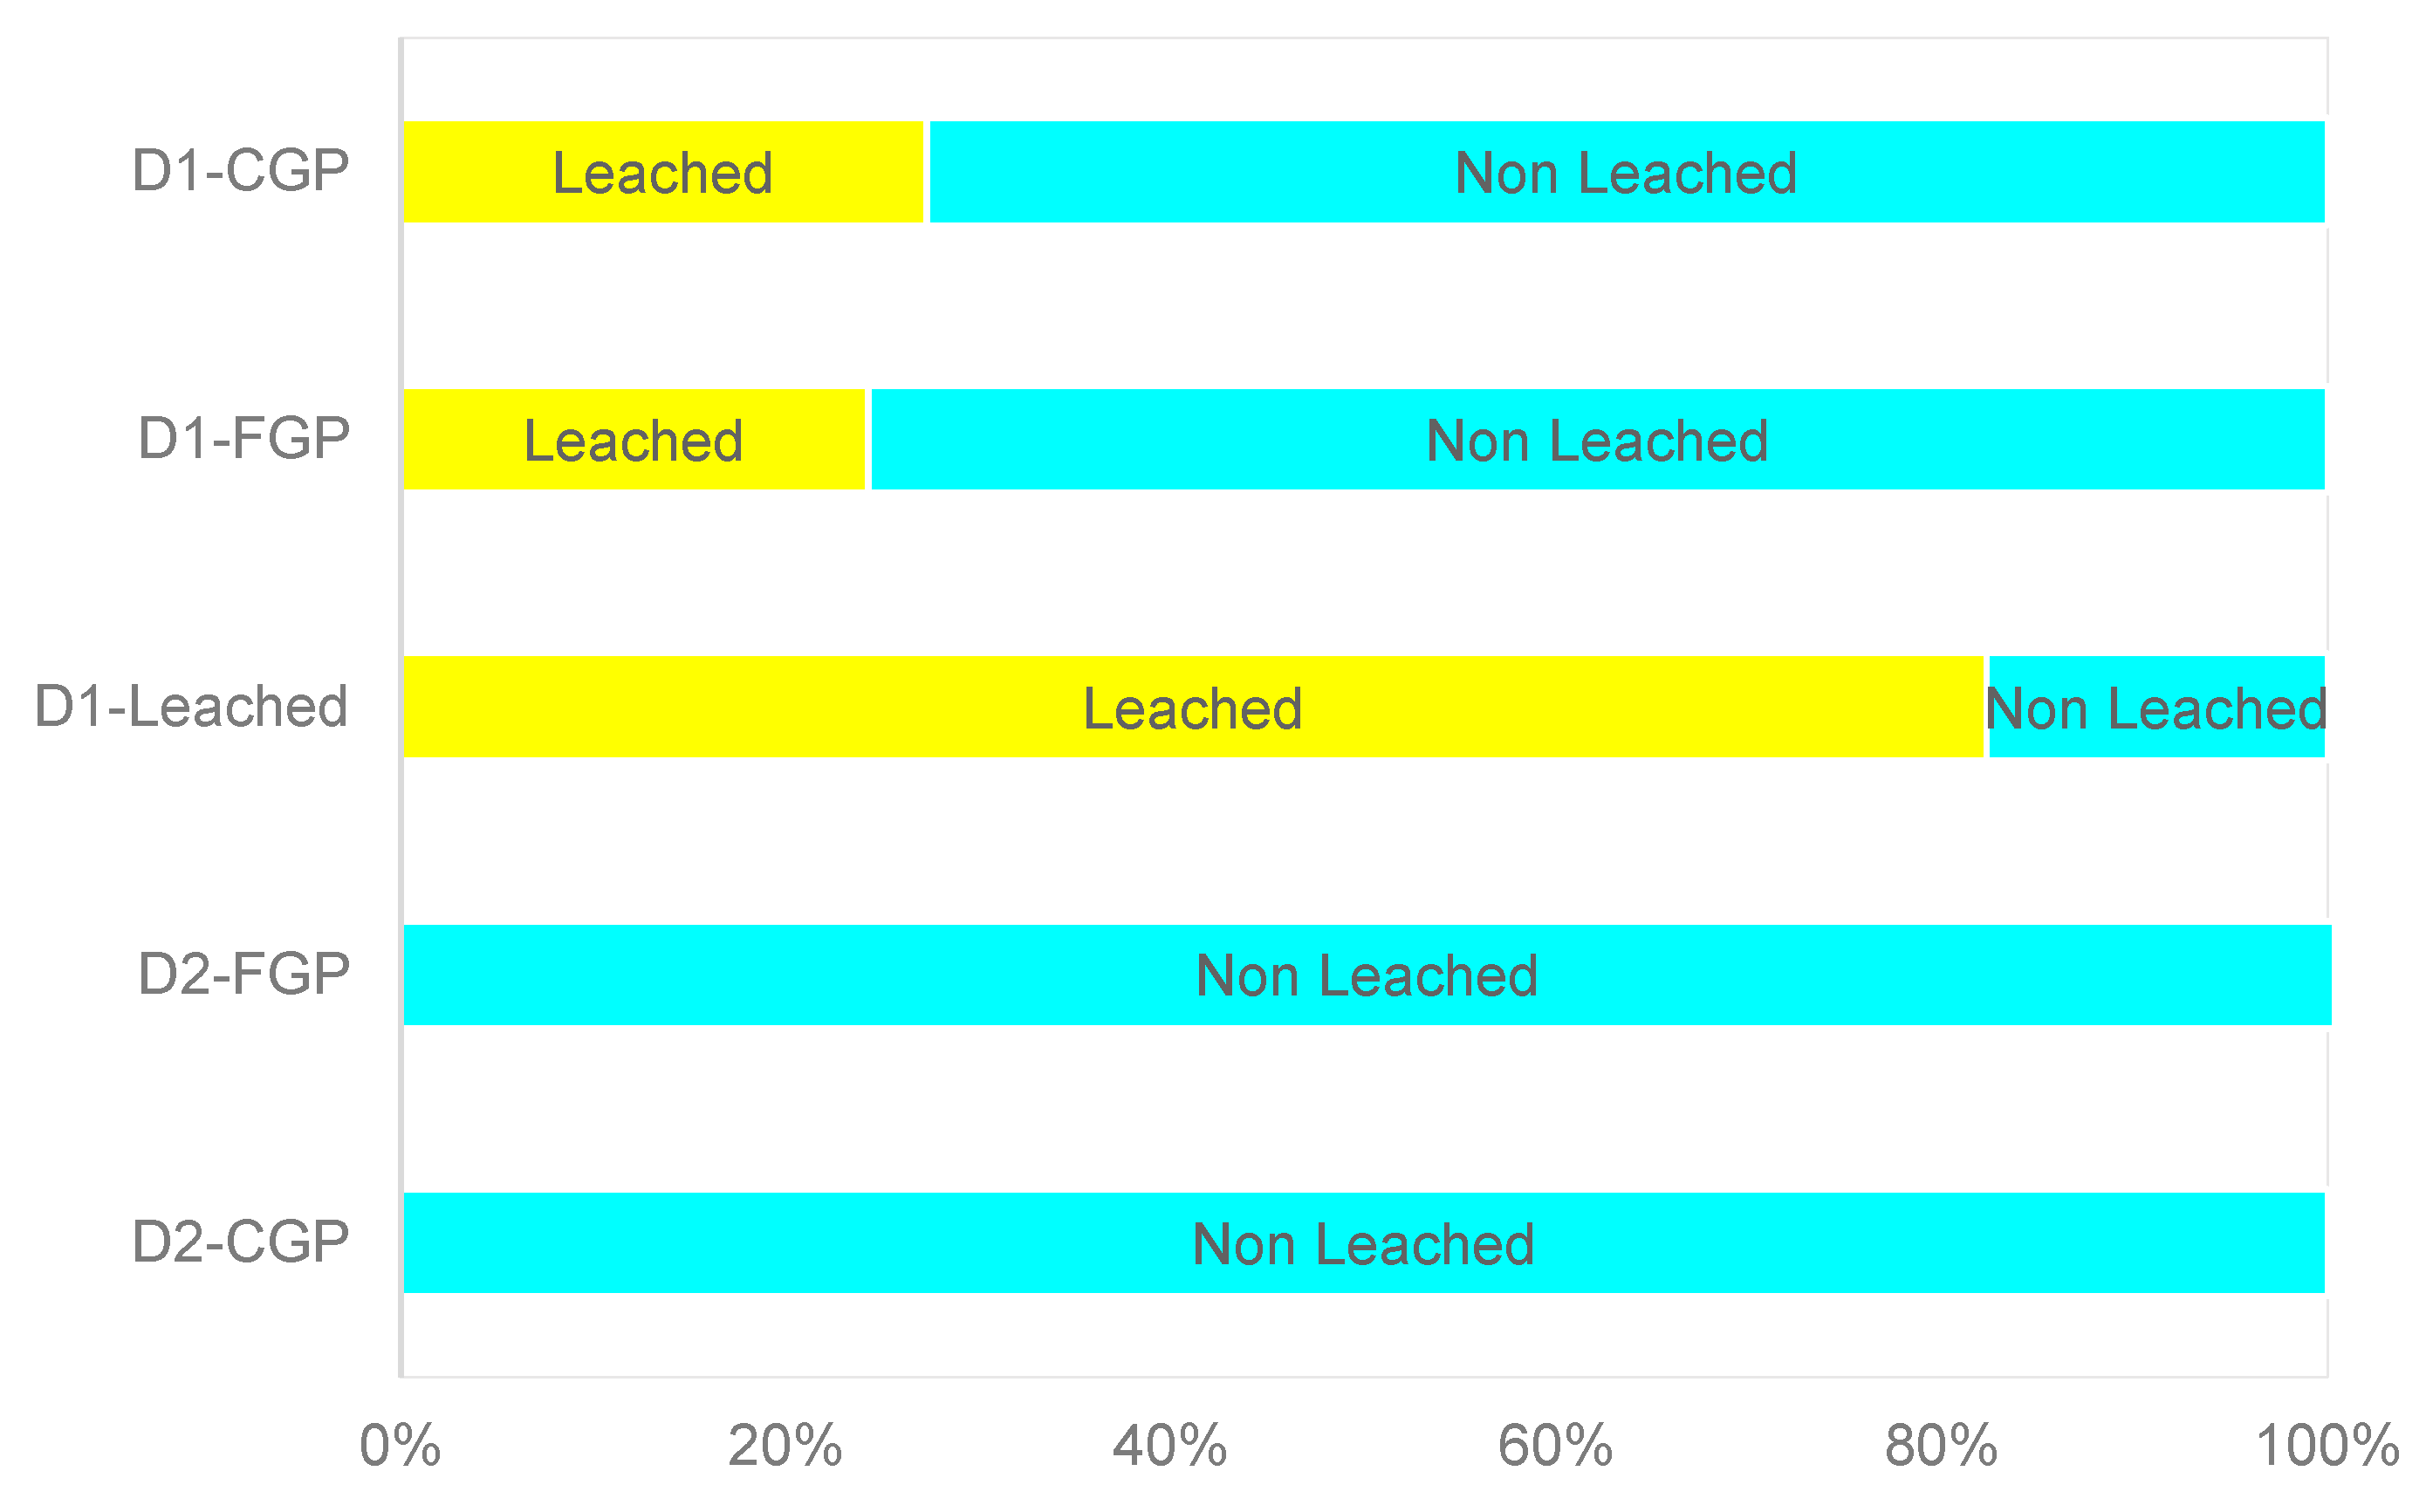
Figure 14c shows the correlations between chalcopyrite loss and leached formation. Not only overall loss but also true flotation and entrainment of chalcopyrite gave a high probability value with leached formation. The true flotation of chalcopyrite increases with leached formation, which agrees with the previous correlation with RQD values. The chalcopyrite losses are mainly induced by entrainment without any leached formation, while increasing leaching in the ore domain results in chalcopyrite losses by true flotation. The weathering effect in chalcopyrite losses was explained in Section 3.2.

5. Conclusions

Five different ore domains, D1-CGP, D1-FGP, D1-Leached, D2-FGP, and D2-CGP from Mount Isa mines, were used to investigate the effects of rock properties on the performance of chalcopyrite loss and pyrite recovery. First, geological characterisation and classification were made on rock type, geometallurgical ore type, leaching and alteration properties, RQD, and major metal contents. Then, these classifications were analysed with the flotation test results to find proxies for estimating chalcopyrite losses and pyrite recoveries.
The pyrite recoveries and chalcopyrite losses were investigated in overall flotation, true flotation, and entrainment. The results were further investigated if only overall flotation and true flotation showed over a 90% probability of significance.
Pyrite recoveries were mainly associated with the type and geochemical metal distribution. On the other hand, chalcopyrite losses were correlated with rock quality and weathering in the ore domain. According to the ore type classification, two main pairs were identified, acting quite similarly. The first pair, D1-CGP and D2-CGP, showed lower pyrite recoveries, mainly from brecciated dolomitic shale. The other pair, D1-FGP, D2-FGP, and D1-Leached, showed higher pyrite recoveries, characterised by pyritic shale with 5%–20% fine-grained pyrite and siliceous/fractured shale. The fine grains and fractured texture of the pyritic rock domain were the primary sources of the natural floatability of pyrite and chalcopyrite losses. This result is seemingly confirmed by the RQD%, leached formation, and Geo_Si% values, which are indicators of rock competency. Higher chalcopyrite losses were observed in lower RQD% values. True flotation was the dominant mechanism for chalcopyrite losses, while the rock was highly weathered, and entrainment took place when the rock formation was more competent. This study showed the pathway of how rock properties indicate the natural floatability of pyrite and chalcopyrite. However, it is worth noting that “correlation does not itself imply causation” [43]. There might be another rock property affecting the floatability of sulphide minerals, which could not be identified within the scope of this study.
In this study, we only focused on five ore domains; however, there is a need to test more individual ore domain samples to validate these results. Within the indications of these findings, we believe that there is a potential to make a multivariable model of geological characteristics and pyrite recovery and chalcopyrite losses in the future.

Author Contributions

Conceptualisation, U.Y.-A., M.J. and E.F.; methodology, U.Y.-A., M.J. and E.F.; software, U.Y.-A. and M.J., validation, U.Y.-A., M.J. and E.F.; formal analysis, U.Y.-A. and M.J.; investigation, U.Y.-A., M.J. and E.F.; resources, C.C.-M.; data curation, U.Y.-A. and M.J.; writing—original draft preparation, U.Y.-A.; writing—review and editing, U.Y.-A., E.F., M.J. and C.C.-M.; visualisation, U.Y.-A. and M.J.; supervision, E.F.; project administration, E.F.; funding acquisition, E.F. All authors have read and agreed to the published version of the manuscript.

Funding

The authors acknowledge the financial support of the Queensland Government and Glencore through the Advance Queensland Industrial Research Fellowship scheme (AQIRF112-2019RD2).

Data Availability Statement

Data sharing is not applicable to this article.

Acknowledgments

The authors wish to thank to Junyu Wang, Ethan Bryant, Esteban Ramirez Maya, and Dylan Carr for their assistance in sample preparation. Tim Napier-Munn is also thanked for helping in statistical analyses. The financial and technical support of this work by the Mount Isa Mines staff is gratefully acknowledged.

Conflicts of Interest

The authors declare no conflict of interest.

Glossary

E N T i Degree of entrainment of component i;
M W Mass of water;
M i Mass of component i ;
R W Recovery of water;
R i t o t Total recovery of component i ;
R i e n t Recovery of component i by entrainment;
R i T F . Recovery of component i by true flotation.

References

  1. Voigt, M.J.; Miller, J.; Bbosa, L.; Govender, R.A.; Bradshaw, D.; Mainza, A.; Becker, M. Developing a 3D mineral texture quantification method of drill core for geometallurgy. J. South. Afr. Inst. Min. Met 2019, 119, 347–353. [Google Scholar] [CrossRef]
  2. Adeli, A.; Dowd, P.; Emery, X.; Xu, C. Using cokriging to predict metal recovery accounting for non-additivity and preferential sampling designs. Miner. Eng. 2021, 170, 106923. [Google Scholar] [CrossRef]
  3. Abildin, Y.; Xu, C.; Dowd, P.; Adeli, A. A hybrid framework for modelling domains using quantitative covariates. Appl. Comput. Geosci. 2022, 16, 100107. [Google Scholar] [CrossRef]
  4. Navarra, A.; Grammatikopoulos, T.; Waters, K. Incorporation of geometallurgical modelling into long-term production planning. Miner. Eng. 2018, 120, 118–126. [Google Scholar] [CrossRef] [Green Version]
  5. Evans, C.L.; Wightman, E.M.; Yuan, X. Quantifying mineral grain size distributions for process modelling using X-ray micro-tomography. Miner. Eng. 2015, 82, 78–83. [Google Scholar] [CrossRef]
  6. Faramarzi, F.; Jokovic, V.; Morrison, R.; Kanchibotla, S.S. Quantifying variability of ore breakage by impact—Implications for SAG mill performance. Miner. Eng. 2018, 127, 81–89. [Google Scholar] [CrossRef]
  7. Tungpalan, K.; Manlapig, E.; Andrusiewicz, M.; Keeney, L.; Wightman, E.; Edraki, M. An integrated approach of predicting metallurgical performance relating to variability in deposit characteristics. Miner. Eng. 2015, 71, 49–54. [Google Scholar] [CrossRef]
  8. Vizcarra, T.G.; Wightman, E.M.; Johnson, N.W.; Manlapig, E.V. The effect of breakage mechanism on the mineral liberation properties of sulphide ores. Miner. Eng. 2010, 23, 374–382. [Google Scholar] [CrossRef]
  9. Can, İ.B.; Özçelik, S.; Ekmekçi, Z. Effects of Pyrite Texture on Flotation Performance of Copper Sulfide Ores. Minerals 2021, 11, 1218. [Google Scholar] [CrossRef]
  10. Parbhakar-Fox, A.; Edraki, M.; Bradshaw, D.; Walters, S. Development of a Textural Acid Rock Drainage Index for Classifying Acid Formation. In Proceedings of the Proceedings of the 10th International Congress for Applied Mineralogy (ICAM), Trondheim, Norway, 1–5 August 2011; pp. 513–521. [Google Scholar]
  11. Chandra, A.P.; Gerson, A.R. A review of the fundamental studies of the copper activation mechanisms for selective flotation of the sulfide minerals, sphalerite and pyrite. Adv. Colloid Interface Sci. 2009, 145, 97–110. [Google Scholar] [CrossRef] [PubMed]
  12. Maslennikov, V.V.; Maslennikova, S.P.; Large, R.R.; Danyushevsky, L.V. Study of Trace Element Zonation in Vent Chimneys from the Silurian Yaman-Kasy Volcanic-Hosted Massive Sulfide Deposit (Southern Urals, Russia) Using Laser Ablation-Inductively Coupled Plasma Mass Spectrometry (LA-ICPMS). Econ. Geol. 2009, 104, 1111–1141. [Google Scholar] [CrossRef]
  13. Abraitis, P.K.; Pattrick, R.A.D.; Vaughan, D.J. Variations in the compositional, textural and electrical properties of natural pyrite: A review. Int. J. Miner. Process. 2004, 74, 41–59. [Google Scholar] [CrossRef]
  14. Basori, M.B.I.; Gilbert, S.; Large, R.R.; Zaw, K. Textures and trace element composition of pyrite from the Bukit Botol volcanic-hosted massive sulphide deposit, Peninsular Malaysia. J. Asian Earth Sci. 2018, 158, 173–185. [Google Scholar] [CrossRef]
  15. England, B.M.; Ostwald, J. Framboid-derived structures in some Tasman fold belt base-metal sulphide deposits, New South Wales, Australia. Ore Geol. Rev. 1993, 7, 381–412. [Google Scholar] [CrossRef]
  16. Grondijs, H.F.; Schouten, C. A study of the Mount Isa ores [Queensland, Australia]. Econ. Geol. 1937, 32, 407–450. [Google Scholar] [CrossRef]
  17. Wei, D.-T.; Xia, Y.; Gregory, D.D.; Steadman, J.A.; Tan, Q.-P.; Xie, Z.-J.; Liu, X.-J. Multistage pyrites in the Nibao disseminated gold deposit, southwestern Guizhou Province, China: Insights into the origin of Au from textures, in situ trace elements, and sulfur isotope analyses. Ore Geol. Rev. 2020, 122, 103446. [Google Scholar] [CrossRef]
  18. Xian, Y.-J.; Wen, S.-M.; Chen, X.-M.; Deng, J.-S.; Liu, J. Effect of lattice defects on the electronic structures and floatability of pyrites. Int. J. Miner. 2012, 19, 1069–1076. [Google Scholar] [CrossRef]
  19. Forbes, E.; Smith, L.; Vepsalainen, M. Effect of pyrite type on the electrochemistry of chalcopyrite/pyrite interactions. Physicochem. Probl. Miner. 2018, 54, 1116–1129. [Google Scholar]
  20. Conaghan, E.; Hannan, K.; Tolman, J. Mount Isa Cu and Pb-Zn-Ag deposits, NW Queensland, Australia. In A Compilation of Geochemical Case Histories and Conceptual Models; CRC LEME: Canberra, Australia, 2003; pp. 1–3. [Google Scholar]
  21. Lilly, R.; Taylor, D.; Spanswick, N. Mount Isa Cu-Pb-Zn Deposit Including George Fisher Deposit, 32nd ed.; The Australasian Institute of Mining and Metallurgy: Melbourne, VIC, Australia, 2017; Volume 32, pp. 473–478. [Google Scholar]
  22. Betts, P.G.; Giles, D.; Mark, G.; Lister, G.S.; Goleby, B.R.; Aillères, L. Synthesis of the proterozoic evolution of the Mt Isa Inlier. Aust. J. Earth Sci. 2006, 53, 187–211. [Google Scholar] [CrossRef]
  23. Bennet, E.M. Lead-Zinc-Copper Deposits of Mount Isa, in Geology of Australian Ore Deposits. In Proceedings of the 8th Commonwealth Mining and Metallurgy Congress, Melbourne, VIC, Australia, 1965; pp. 233–246. [Google Scholar]
  24. Perkins, W. Mount Isa silica dolomite and copper orebodies; the result of a syntectonic hydrothermal alteration system. Econ. Geol. 1984, 79, 601–637. [Google Scholar] [CrossRef]
  25. Hewett, R.L. Deep Leaching and Accelerated Post-mine Oxidation in the 500 Ore Body at Mount Isa; 1967. [Google Scholar]
  26. Shiels, J. Indicator Kriging of Strongly Leached Rock in the 500 Orebody. 2019; Unpublished Internal Memo. [Google Scholar]
  27. Morris, D. Notes on the Work Done for Pre-Feasibility—500 Orebody Block Cave 2007-08; Geomine Design Pty Ltd.: Maryborough, QLD, Australia, 2008. [Google Scholar]
  28. Mathias, B.; Clark, G. Mount Isa Copper and Silver-Lead-Zinc Orebodies—Isa and Hilton Mines; Australasian Institute of Mining and Metallurgy: Carlton, VIC, Australia, 1975; Volume 1, pp. 351–372. [Google Scholar]
  29. Shaw, T. Mount Isa Geological Summary Internal Report. 2005; Unpublished. [Google Scholar]
  30. Robertson, C. The Role Of Pre-Existing Sulfides In Copper-Ore Formation At Mount-Isa, Queensland. BMR J. Aust. Geol. Geophys. 1982, 7, 119–124. [Google Scholar]
  31. Grano, S.; Ralston, J.; Smart, R.S.C. Influence of electrochemical environment on the flotation behaviour of Mt. Isa copper and lead-zinc ore. Int. J. Miner. Process. 1990, 30, 69–97. [Google Scholar] [CrossRef]
  32. O’Donnell, R.M.; Muller, M.L. Selectively Targeting Hydrophobic Gangue Minerals at the Mout Isa Copper Concentrator. In Proceedings of the In Proceedings of the 14th AUSIMM Mill Operators Conference, Brisbane, QLD, Australia, 26–25 June 2018. [Google Scholar]
  33. Neudert, M. A Depositional Model for the Upper Mount Isa Group and Implications for Ore Formation. Ph.D. Thesis, 1983. Unpublished. [Google Scholar]
  34. Forbes, E.; Britoe Abreu, S.; Tungpalan, K.; Sashigunan, R.; Runge, K.; O’Donnell, R. Effect of residual reagents on chalcopyrite losses at Mount Isa Mines copper operation: Part I—Evaluation of mineral recoveries. Miner. Eng. 2022, 185, 107706. [Google Scholar] [CrossRef]
  35. Croxford, N. Origin and significance of volcanic potash-rich rocks from Mount Isa. Trans. Inst. Min. Metall. 1964, 74, 34–43. [Google Scholar]
  36. Croxford, N.J.W. Cobalt mineralization at Mount Isa, Queensland, Australia, with references to Mount Cobalt. Miner. Deposita 1974, 9, 105–115. [Google Scholar] [CrossRef]
  37. Lintvelt, C. Mineralogical Investigation of Silver and Cobalt Trace Metals in the Mount Isa Deposit. Ph.D. Thesis, University of Adelaide, Adelaide, SA, Australia, 2017. [Google Scholar]
  38. Connell, S. Fine-Grained Pyrite Within the Mount Isa (Enterprise) Copper System, NW Queensland; Geological Relationships, Modelled Distribution and Links to Reactive Ground. Ph.D. Thesis, The University of Adelaide, Adelaide, SA, Australia, 2016. [Google Scholar]
  39. Engelbrecht, J.; Woodburn, E. The effects of froth height, aeration rate, and gas precipitation on flotation. J. South. Afr. Inst. Min. Metall 1975, 76, 125–132. [Google Scholar]
  40. Johnson, N. A review of the entrainment mechanism and its modelling in industrial flotation processes. In Proceedings of the Centenary of Flotation Symposium, Brisbane, QLD, Australia, 6–9 June 2005; pp. 487–496. [Google Scholar]
  41. Wang, L.; Peng, Y.; Runge, K.; Bradshaw, D. A review of entrainment: Mechanisms, contributing factors and modelling in flotation. Miner. Eng. 2015, 70, 77–91. [Google Scholar] [CrossRef]
  42. Forbes, E.; Brito e Abreu, S.; Tungpalan, K.; Sashigunan, R.; Runge, K.; O’Donnell, R. Effect of residual reagents on chalcopyrite losses at Mount Isa Mines copper Operation: Part II—Evaluation of flotation mechanisms. Miner. Eng. 2022, 185, 107687. [Google Scholar] [CrossRef]
  43. Napier-Munn, T. Statistical Methods for Mineral Engineers-How to Design Experiments and Analyse Data; Julius Kruttschnitt Mineral Research Centre: Indooroopilly, QLD, Australia, 2014; Volume 5. [Google Scholar]
  44. Ekmekçi, Z.; Demirel, H. Effects of galvanic interaction on collectorless flotation behaviour of chalcopyrite and pyrite. Int. J. Miner. Process. 1997, 52, 31–48. [Google Scholar] [CrossRef]
  45. Lee, R.L.J.; Chen, X.; Peng, Y. Flotation performance of chalcopyrite in the presence of an elevated pyrite proportion. Miner. Eng. 2022, 177, 107387. [Google Scholar] [CrossRef]
  46. Lekki, J.; Drzymala, J. Flotometric analysis of the collectorless flotation of sulphide materials. Colloids Surf. 1990, 44, 179–190. [Google Scholar] [CrossRef]
  47. Cheng, X.; Iwasaki, I. Pulp Potential and Its Implications to Sulfide Flotation. Miner. Process. Extr. Metall. Rev. 1992, 11, 187–210. [Google Scholar] [CrossRef]
  48. Pugh, C.E.; Hossner, L.R.; Dixon, J.B. Oxidation Rate of Iron Sulfides As Affected By Surface Area, Morphology, Oxygen Concentration, And Autotrophic Bacteria. Soil Sci. 1984, 137, 309–314. [Google Scholar] [CrossRef]
  49. Rieger, P.; Magnall, J.M.; Gleeson, S.A.; Oelze, M. Pyrite chemistry records a multistage ore forming system at the Proterozoic George Fisher massive sulfide Zn-Pb-Ag deposit, Mount Isa, Australia. Front. Earth Sci. 2023, 11, 1–19. [Google Scholar] [CrossRef]
  50. Barker, G.J.; Gerson, A.R.; Menuge, J.F. The impact of iron sulfide on lead recovery at the giant Navan Zn-Pb orebody, Ireland. Int. J. Miner Process 2014, 128, 16–24. [Google Scholar] [CrossRef]
  51. Yoon, R.H. Collectorless flotation of chalcopyrite and sphalerite ores by using sodium sulfide. Int. J. Miner. Process. 1981, 8, 31–48. [Google Scholar] [CrossRef]
Figure 1. Location of the Mount Isa deposits from [21] after [22].
Minerals 13 00801 g001
Figure 2. (a) Sample: D1-CGP RQD: 68.15%, drill core diameter: 63.5 mm. (b) Sample: D1-FGP, RQD: 17.97%, drill core diameter: 63.5 mm.
Minerals 13 00801 g002
Figure 3. Rock types of ore domains (1A: shale; 1B: recrystallised shale; 1C: brecciated dolomitic shale; 2A: pyritic shale 5%–20% fine-grained pyrite; 2B: pyritic shale >20% fine-grained pyrite; 3A: siliceous shale; 3B: brecciated/fractured siliceous shale, 0: no data).
Minerals 13 00801 g003
Figure 4. Leaching formation of ore domains.
Minerals 13 00801 g004
Figure 5. (a) Data validation: Elemental assays vs. estimated geochemical assay. The solid line represents the ideal line and the dashed lines represent a ±20% bound. (b) Data validation: Elemental assays vs. calculated MLA assay. The solid line represents the ideal line, and the dashed lines represent a ±20% bound.
Minerals 13 00801 g005
Figure 6. Analysis comparison sulphur assays. The solid red line represents the ideal line. The circles show the sulphur analysis value of both methods.
Minerals 13 00801 g006
Figure 7. (a) Validation of chalcopyrite grade calculation. The solid red line represents the ideal line. The circles show the sulphur analysis value of both methods. (b) Residuals of chalcopyrite grade calculation.
Minerals 13 00801 g007aMinerals 13 00801 g007b
Figure 8. (a) Validation of pyrite grade calculation. The solid red line represents the ideal line. The circles show the sulphur analysis value of both methods. (b) Residuals of pyrite grade calculation.
Minerals 13 00801 g008aMinerals 13 00801 g008b
Figure 9. (a) Coarse-grain blocky pyrite (+425 µm, D1-CGP) BSE image on the left, MLA mapping on the right. (b) Fine-grain disseminated pyrite (+425 µm, D1-FGP) BSE image on the left, MLA mapping on the right.
Minerals 13 00801 g009
Figure 10. Flotation results.
Minerals 13 00801 g010
Figure 11. Particle size distribution of flotation products.
Minerals 13 00801 g011
Figure 12. Entrainment and true flotation of (a) chalcopyrite and (b) pyrite.
Minerals 13 00801 g012
Figure 13. (a) Relation of ore type on pyrite recovery (Zone 2: Chalcopyrite ± pyrite and pyrrhotite Zone 3: Pyritic recrystallisation with chalcopyrite, pyrrhotite ± talc, carbonate). (b) Correlation of Cu of geological domains vs. pyrite. (c) Correlation of Pb in geological domains vs. pyrite. (d) Correlation of Co in geological domains vs. pyrite. The circles represent the relevant data values for each graph, and dotted lines show the regression line.
Minerals 13 00801 g013
Figure 14. (a) Correlation of RQD vs. chalcopyrite loss. (b) Correlation of Geo_Si% and chalcopyrite loss. (c) Correlation of leached formation and chalcopyrite loss. The circles represent the relevant data values for each graph, and dotted lines show the regression line.
Minerals 13 00801 g014
Table 1. Sample description.
OrebodyDescriptionCode
Ore Domain 1Ore rich in chalcopyrite, in combination with “blocky”, coarse-grained pyriteD1-CGP
Ore Domain 1Ore poor in chalcopyrite, in combination with finely disseminated pyrite grainsD1-FGP
Ore Domain 1Ore rich in chalcopyrite, in combination with finely disseminated pyrite, occurring in a high-alteration “leached” zoneD1- Leached
Ore Domain 2Ore poor in chalcopyrite, in combination with finely disseminated and “framboidal” pyrite grainsD2-FGP
Ore Domain 2Ore rich in chalcopyrite, in combination with “blocky”, coarse-grained pyriteD2-CGP
Table 2. Number of samples from logged drill holes per ore domain.
Ore DomainD1-CGPD1-FGPD1-LeachedD2-FGPD2-CGP
Samples2421491924
Table 3. Summary of logged drill core specifications.
Samples/SpecificationsD1-CGPD1-FGPD1-LeachedD2-FGPD2-CGP
Rock Type1C1C-2A3A-3B2A-2B1C
Leached formation %27248200
Ore type23332
R.Q.D., %61.340.417.454.470.6
Texture: CGP%1.592.662.102.542.46
Texture: FGP%1.037.580.5813.10.71
Geo_Si%14.716.831.412.412.1
Geo_Co%0.0100.0630.0240.0670.010
Geo_ Pb%0.00840.0440.0240.0410.0049
Table 4. Process water specifications.
Elements of InterestUnit, mg/L
Sulfate as SO4—Turbidimetric2170
Calcium404
Magnesium354
Sodium458
Potassium130
Table 5. Mineral assays of ore domains.
Mineral Groupingwt% Composition
D1-CGPD1-FGPD1-LeachedD2-FGPD2-CGP
Chalcopyrite8.414.567.544.0211.67
Silicates28.0634.8270.4030.0333.64
Calcium carbonates55.4533.321.7227.3939.57
Pyrite4.3022.2311.6934.6011.56
Pyrrhotite0.130.140.120.491.32
Other sulphides0.010.020.240.010.01
Phyllosilicates1.663.313.652.641.56
Cobaltite0.000.070.020.010.00
Galena0.000.020.000.010.00
Iron oxides1.801.083.990.380.14
Deleterious0.020.020.020.010.01
Other0.170.420.610.430.52
Table 6. pH and Eh measurements of each ore domain during the flotation test.
Ore DomainD1-CGPD1-FGPD1-LeachedD2-FGPD2-CGP
pH8.287.924.007.978.17
Eh (mV)295324458328303
Table 7. Probability analysis of geological and flotation data.
Probability %Cpy_LossTF_CpyEnt_CpyPy_RecTF_PyEnt_Py
Rock type96.8%88.1%43.3%82.9%80.9%52.9%
Ore type82.3%62.3%13.8%99.1%98.6%17.6%
RQD100.0%98.1%74.6%73.4%71.8%33.5%
Leached formation94.0%98.6%94.3%14.4%13.1%27.7%
CGP%85.6%18.7%56.2%65.8%66.6%16.5%
FGP%12.7%42.2%64.8%83.8%83.7%15.0%
GEO_Cu17.7%7.4%19.4%93.36%94.0%46.5%
GEO_Fe3.9%35.9%68.2%85.0%84.2%6.4%
GEO_S1.0%31.8%71.0%84.3%83.1%20.6%
GEO_Si97.5%98.3%79.9%33.9%31.4%53.6%
GEO_Pb24.6%3.5%32.9%96.7%96.9%28.7%
GEO_Co52.0%26.7%6.6%99.7%99.7%24.7%
GEO_Al97.2%88.8%45.3%83.9%82.0%50.1%
GEO_Ca92.4%82.8%29.7%67.9%64.7%73.3%
GEO_Mg85.6%73.2%12.9%63.3%59.5%81.3%
GeO_Pyrr91.0%81.8%66.7%90.2%89.9%7.2%
Disclaimer/Publisher’s Note: The statements, opinions and data contained in all publications are solely those of the individual author(s) and contributor(s) and not of MDPI and/or the editor(s). MDPI and/or the editor(s) disclaim responsibility for any injury to people or property resulting from any ideas, methods, instructions or products referred to in the content.

