Author Contributions
Conceptualization, A.C.T., L.M.T. and M.B.d.M.M.; methodology, A.C.T., L.M.T. and M.B.d.M.M.; validation, A.C.T., L.M.T. and M.B.d.M.M..; investigation, A.C.T., L.M.T. and M.B.d.M.M.; writing original draft preparation, A.C.T.; writing, review and editing, A.C.T., L.M.T. and M.B.d.M.M.; visualization, A.C.T., L.M.T. and M.B.d.M.M.; formal analysis, A.C.T., L.M.T. and M.B.d.M.M.; supervision, L.M.T. and M.B.d.M.M. All authors have read and agreed to the published version of the manuscript.
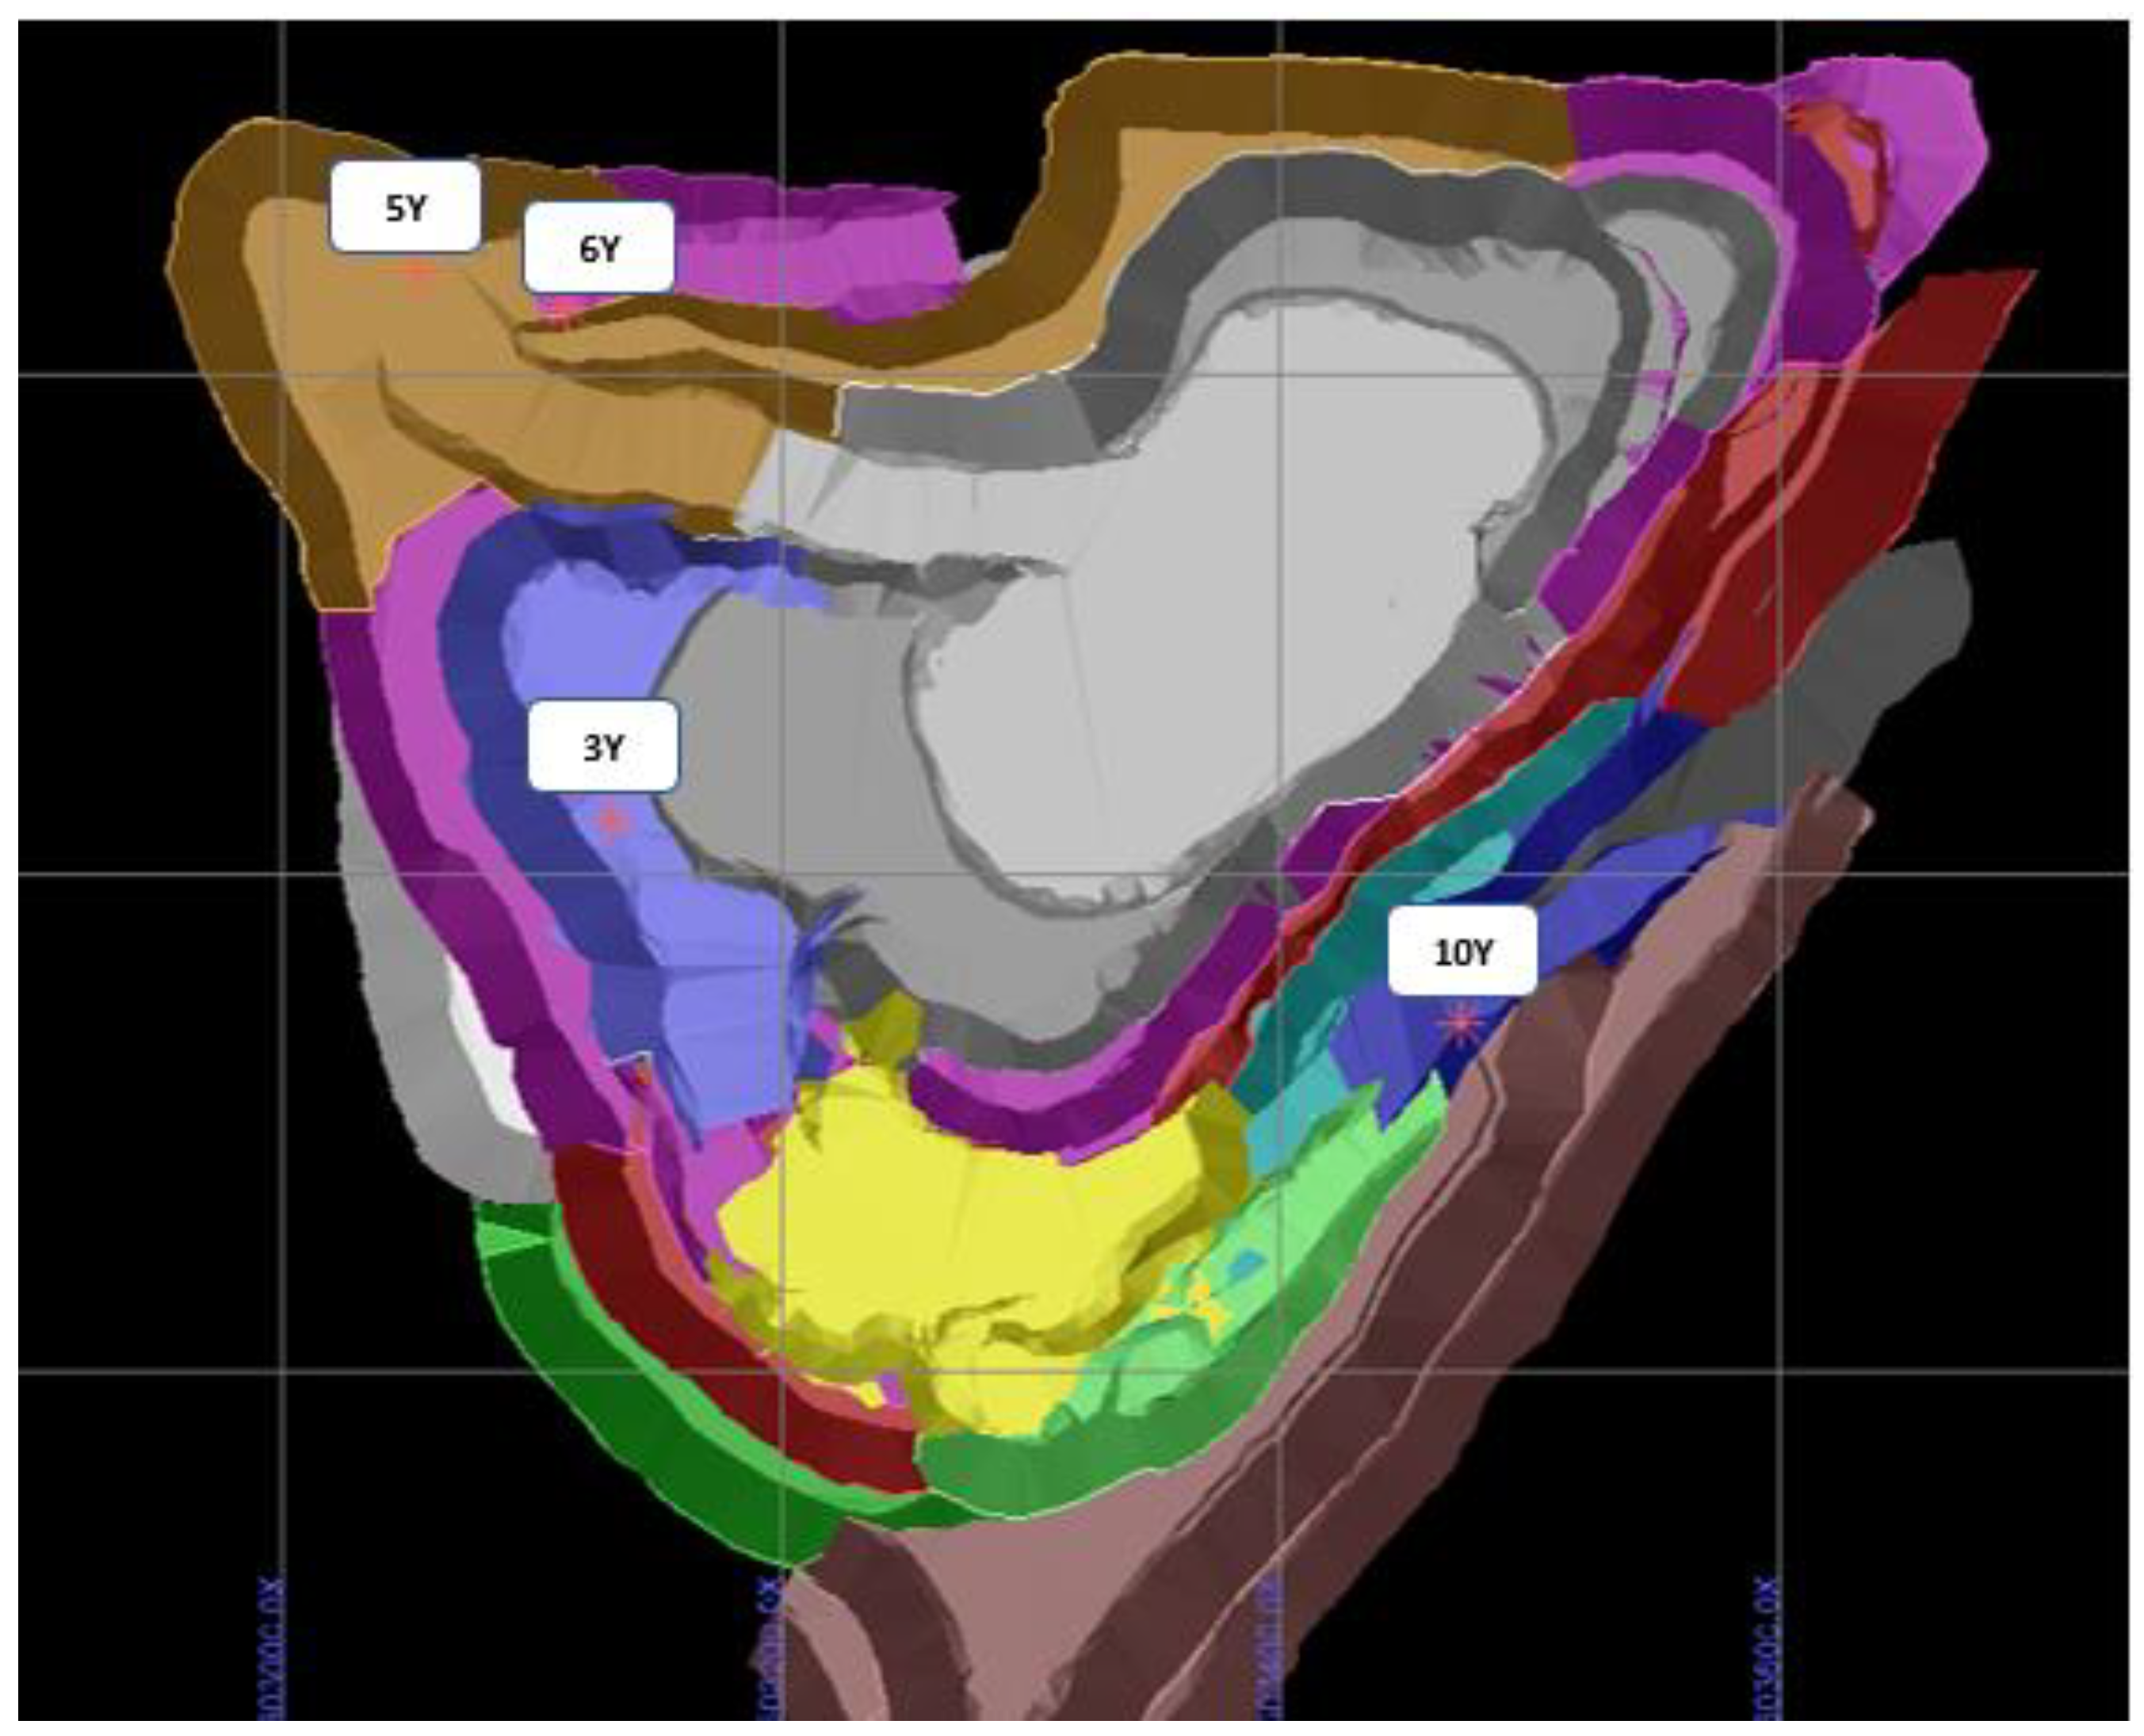
Figure 1.
Top view of the stockpile, grid size of 200 m × 200 m. The areas in dark blue, purple, ochre, and light blue indicate the places where the ore has been stockpiled for 10, 6, 5, and 3 years (Y), respectively. Red symbols identify locations from which samples were collected.
Figure 1.
Top view of the stockpile, grid size of 200 m × 200 m. The areas in dark blue, purple, ochre, and light blue indicate the places where the ore has been stockpiled for 10, 6, 5, and 3 years (Y), respectively. Red symbols identify locations from which samples were collected.
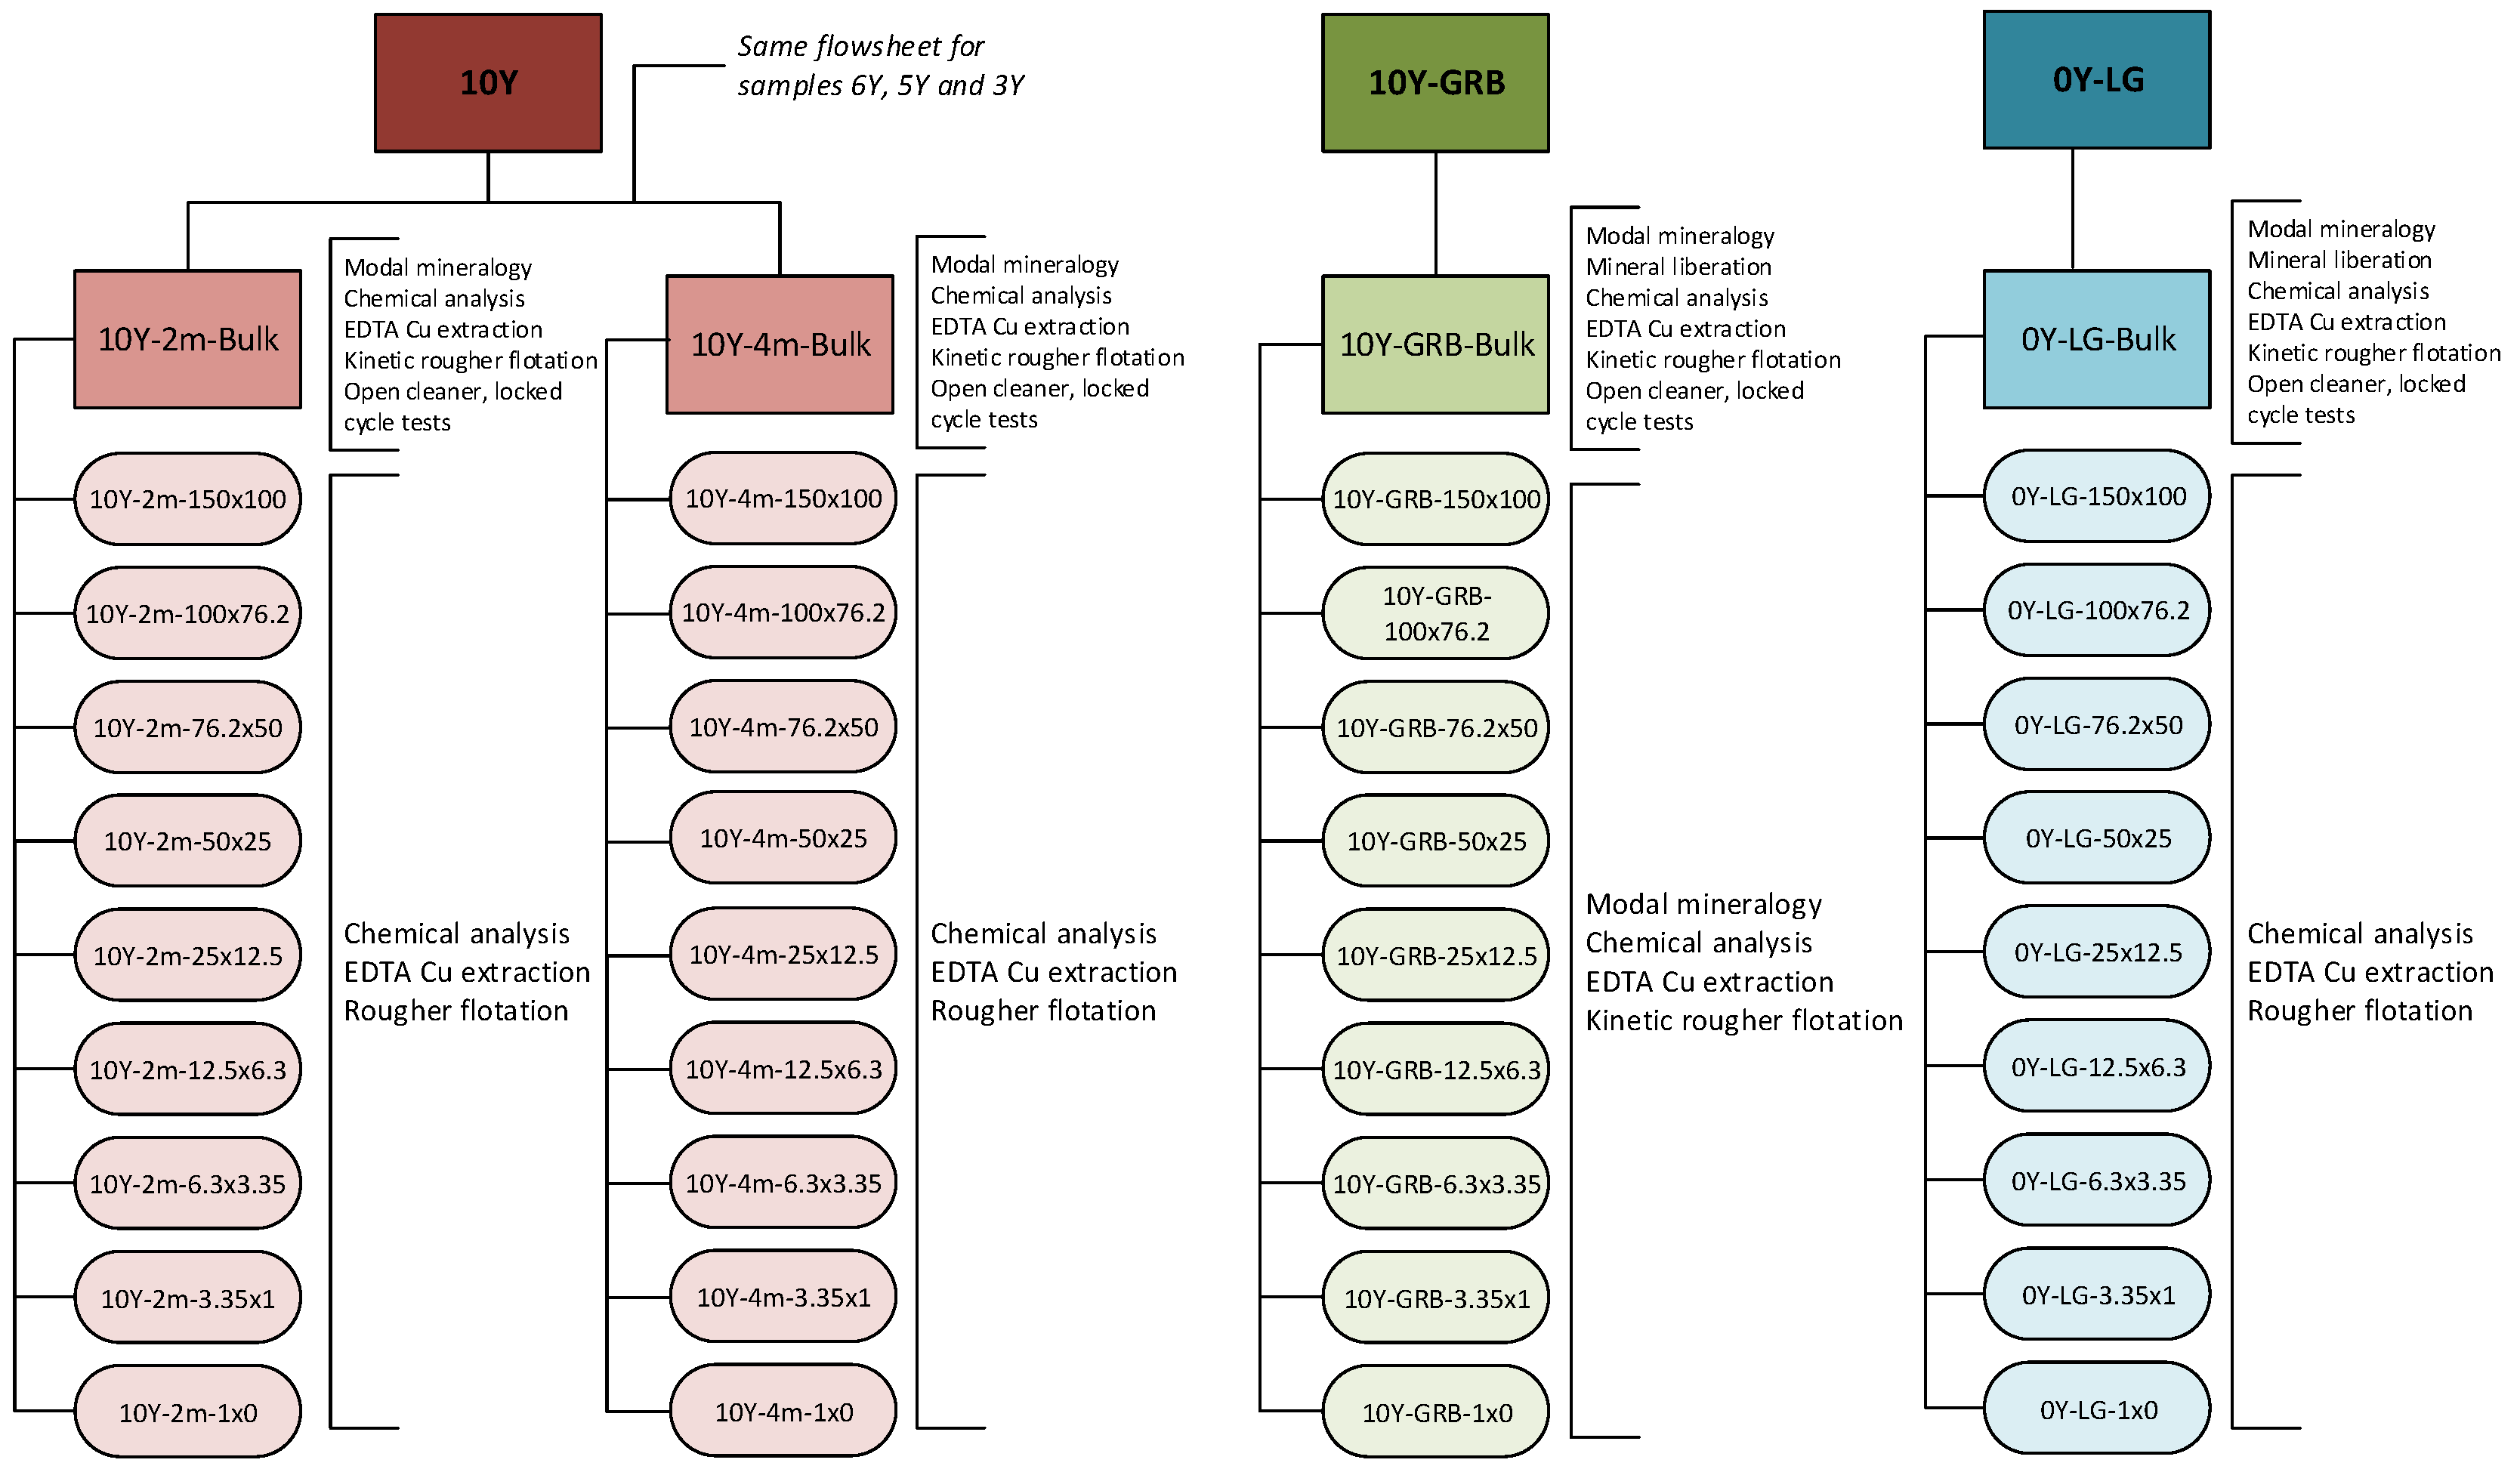
Figure 2.
Sample identification and set of tests performed for each sample.
Figure 2.
Sample identification and set of tests performed for each sample.
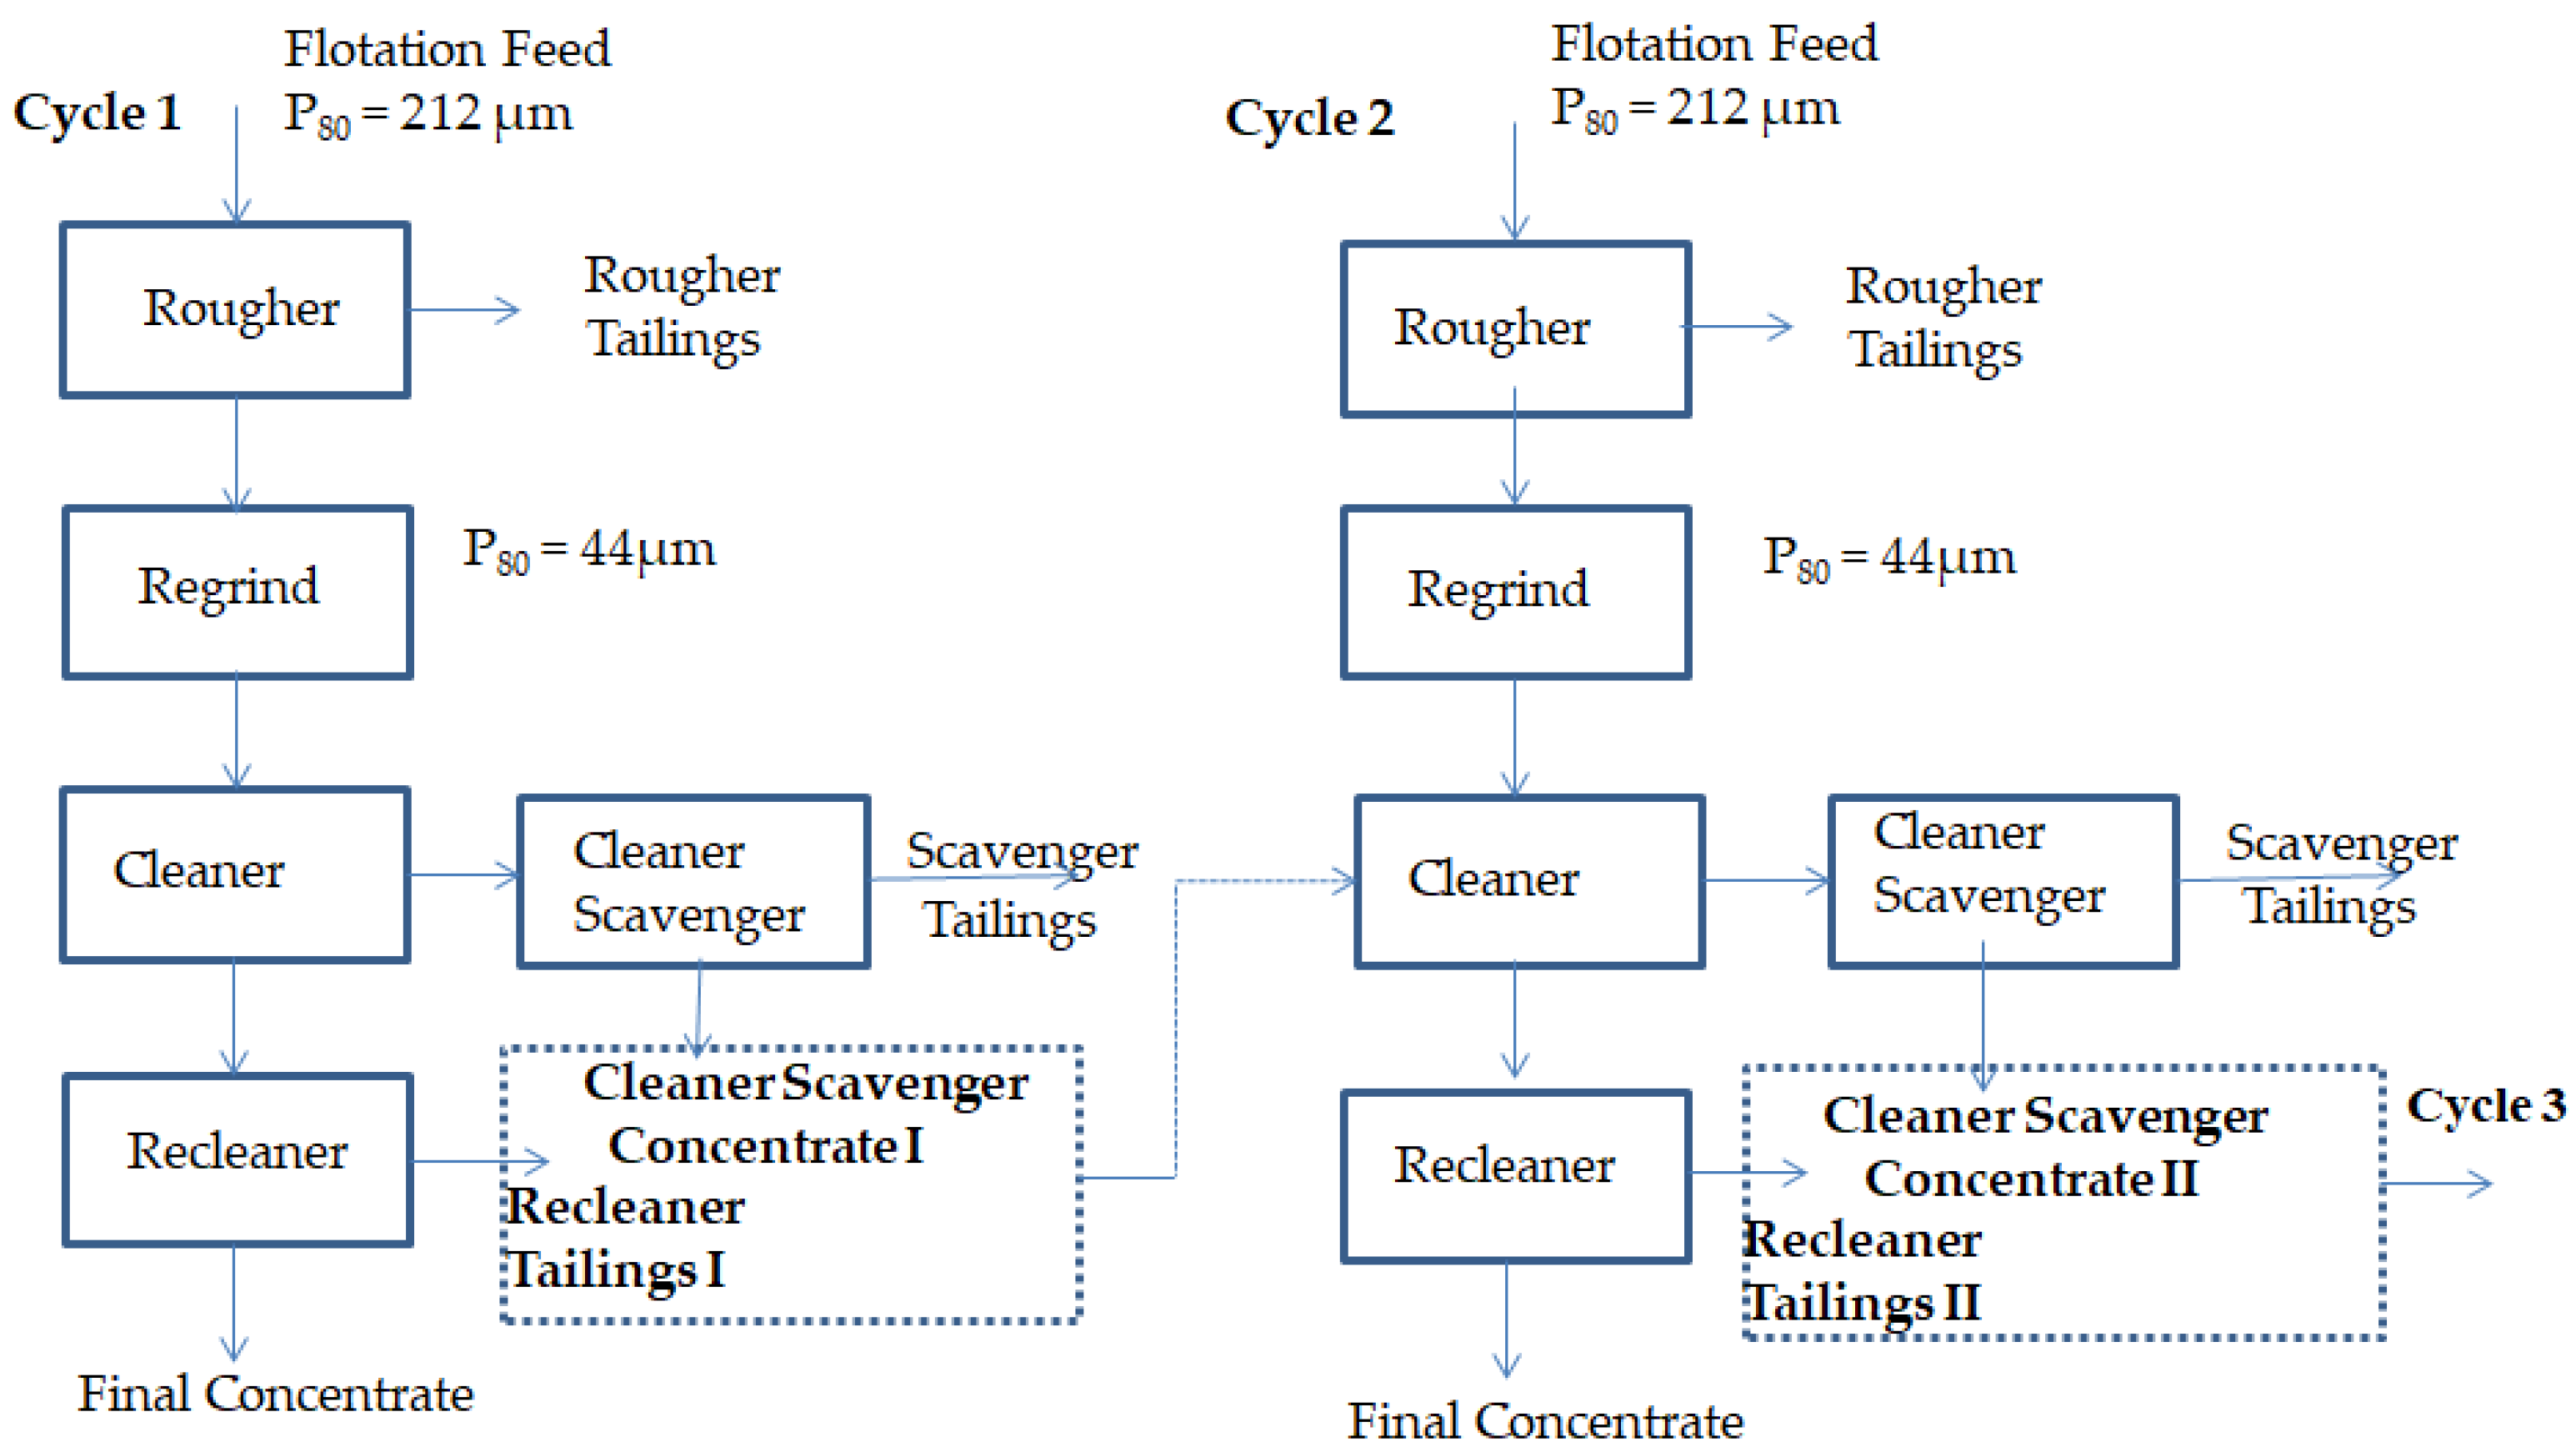
Figure 3.
Representation of the locked-cycle tests.
Figure 3.
Representation of the locked-cycle tests.
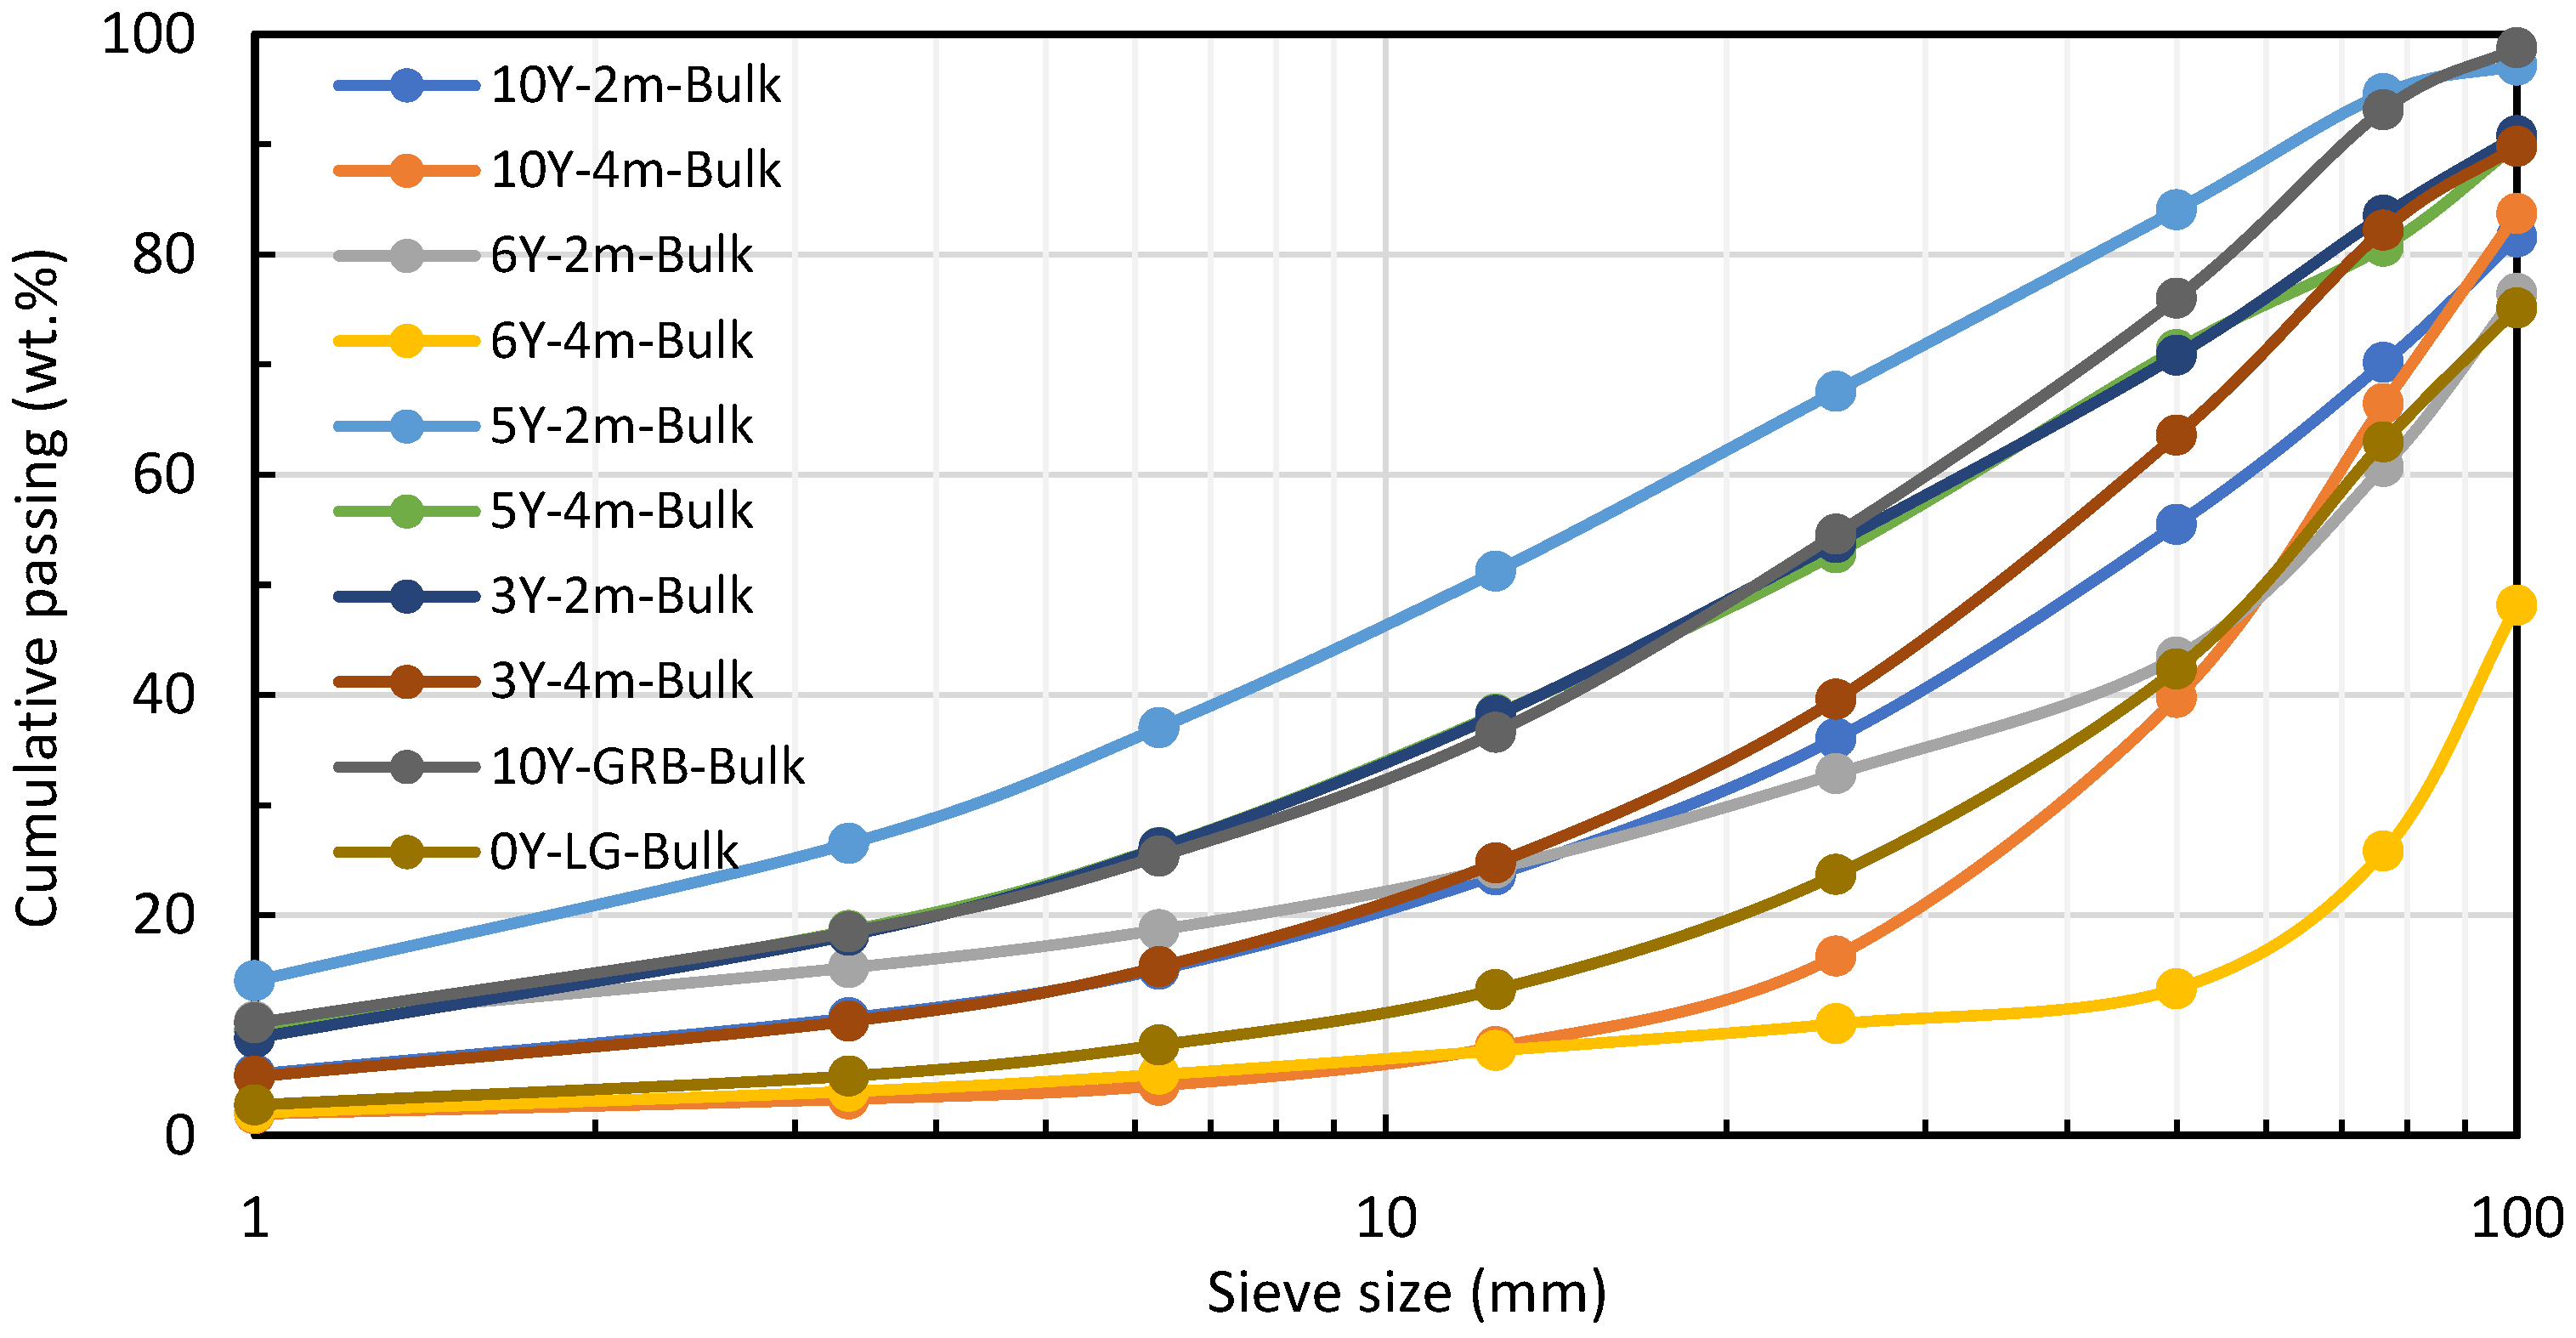
Figure 4.
Cumulative particle size distribution of the bulk samples.
Figure 4.
Cumulative particle size distribution of the bulk samples.
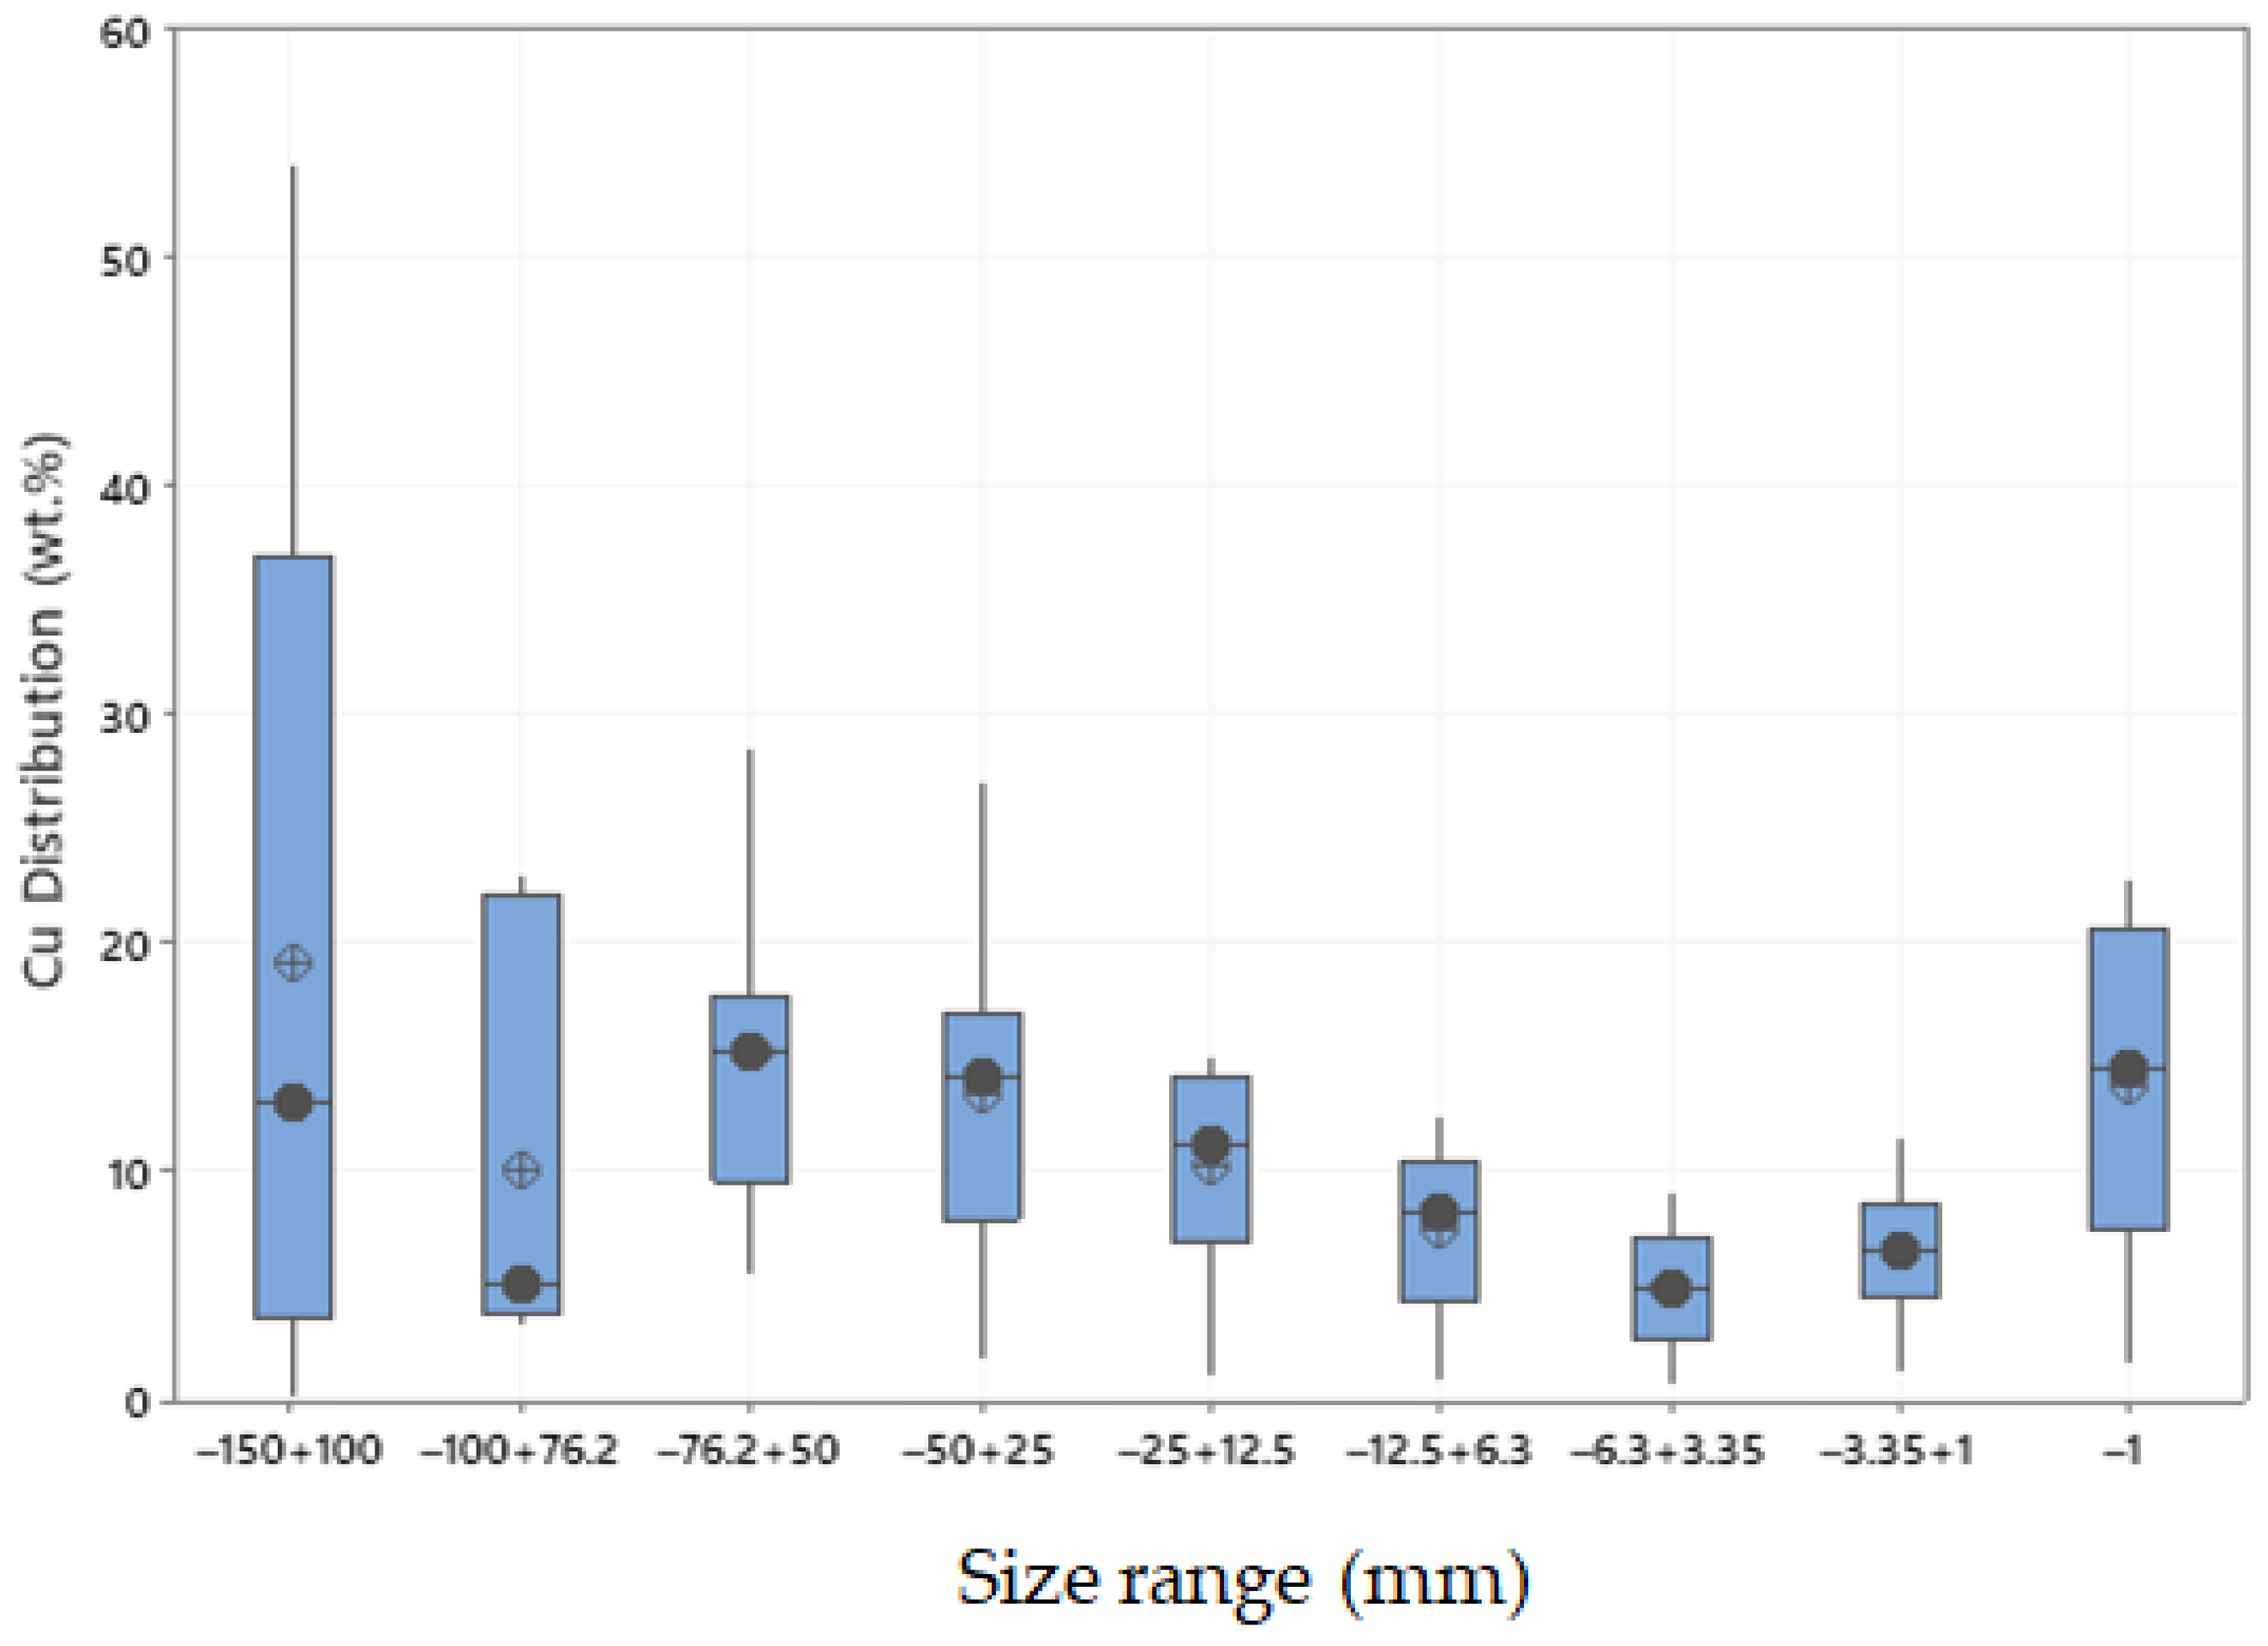
Figure 5.
Box plot showing the variation of the distribution of copper as a function of size range (in mm). Black circles represent the median and void circles the mean.
Figure 5.
Box plot showing the variation of the distribution of copper as a function of size range (in mm). Black circles represent the median and void circles the mean.
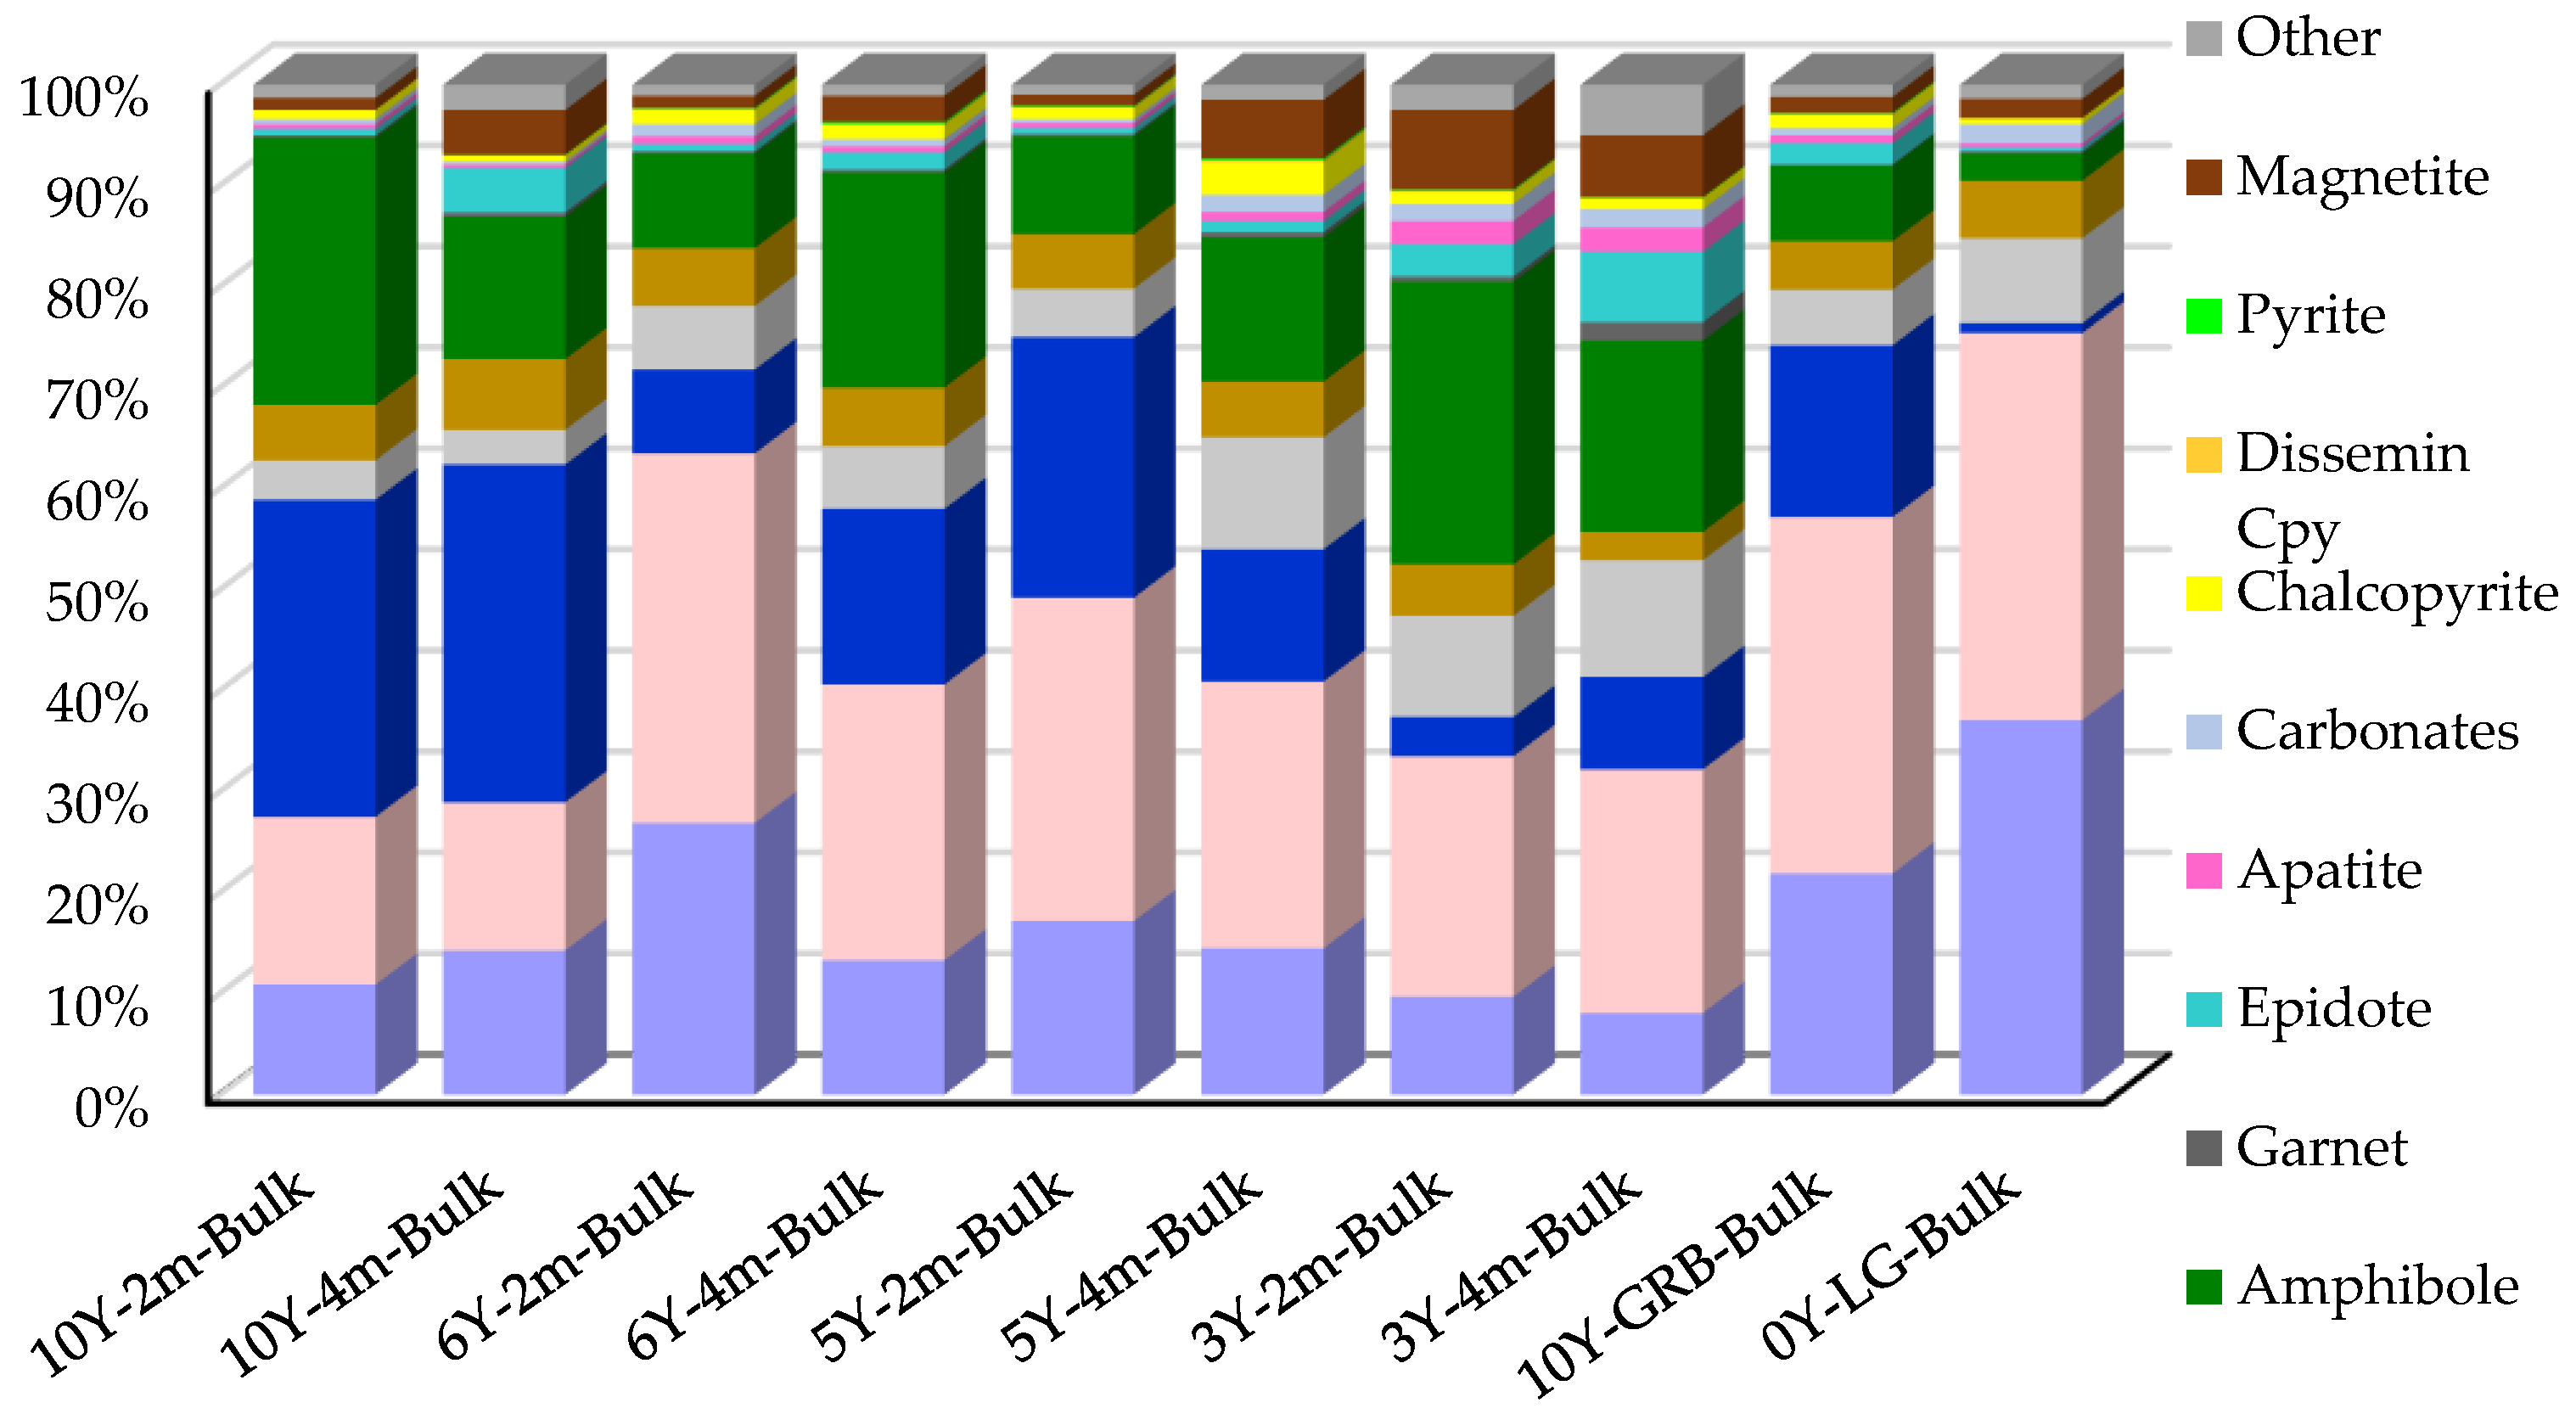
Figure 6.
Mineralogical modal composition (wt.%) of the bulk samples.
Figure 6.
Mineralogical modal composition (wt.%) of the bulk samples.
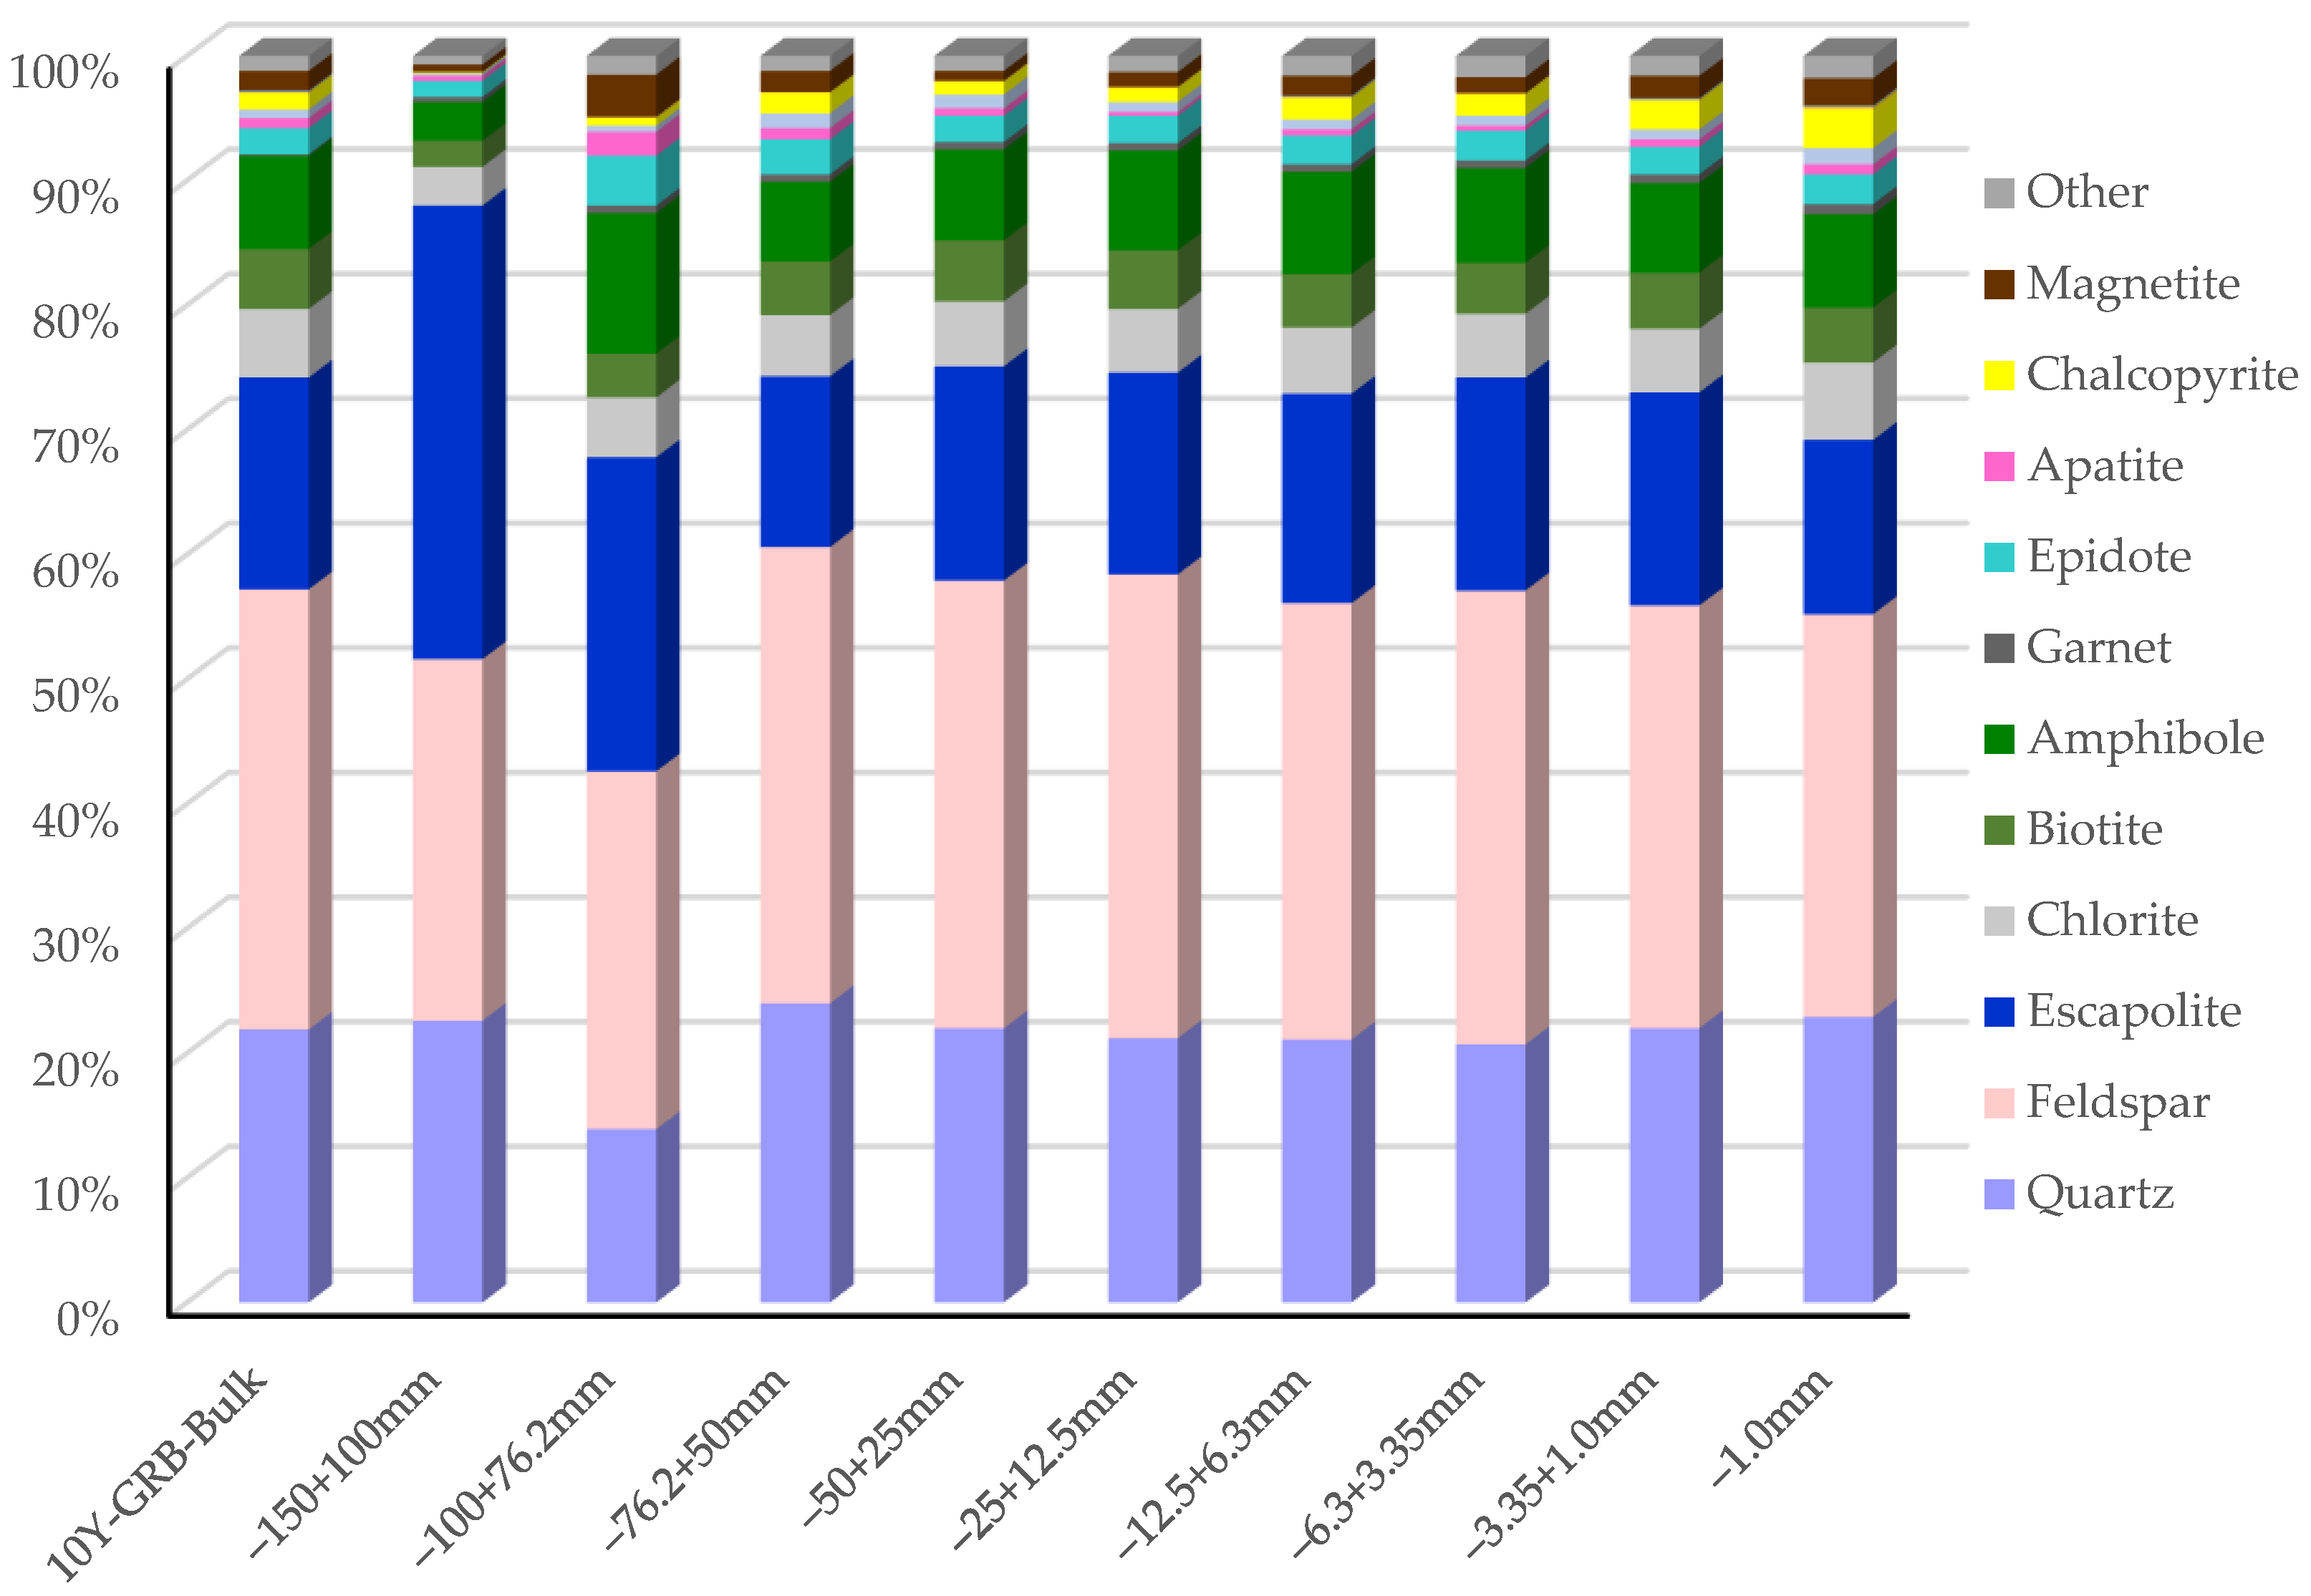
Figure 7.
Mineralogical modal composition (wt.) of size fractions of 10Y-GRB sample and comparison to the bulk sample.
Figure 7.
Mineralogical modal composition (wt.) of size fractions of 10Y-GRB sample and comparison to the bulk sample.
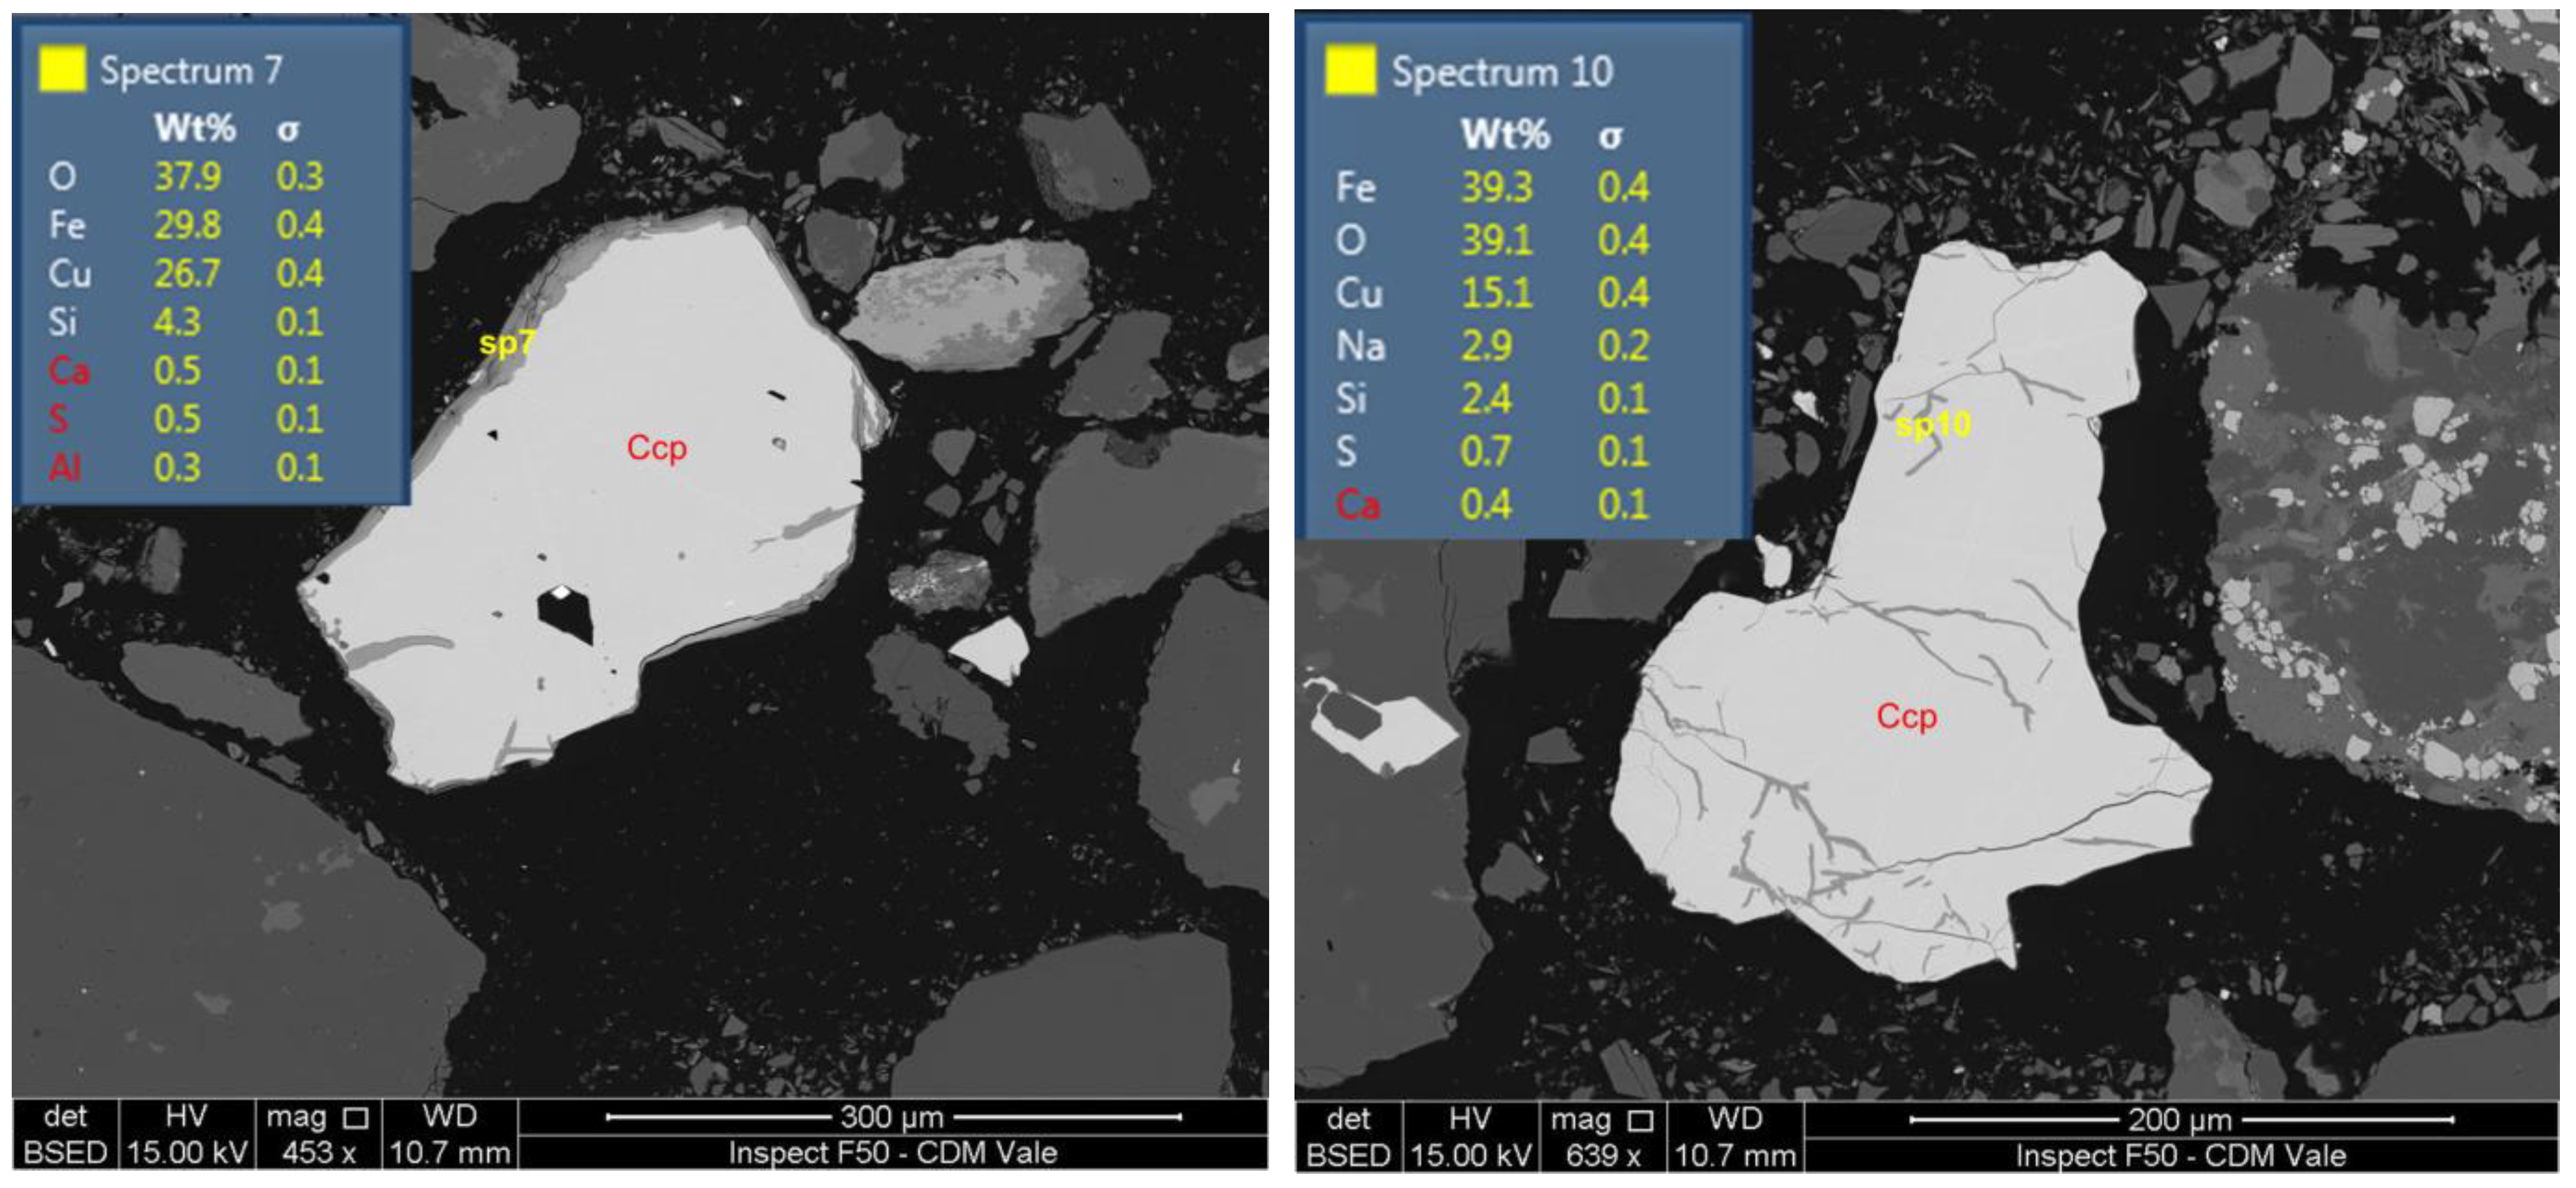
Figure 8.
Backscattered electron images of sample 10Y-GRB-Bulk with EDS analysis, showing the alteration of chalcopyrite (Ccp) to Cu-Fe oxides.
Figure 8.
Backscattered electron images of sample 10Y-GRB-Bulk with EDS analysis, showing the alteration of chalcopyrite (Ccp) to Cu-Fe oxides.
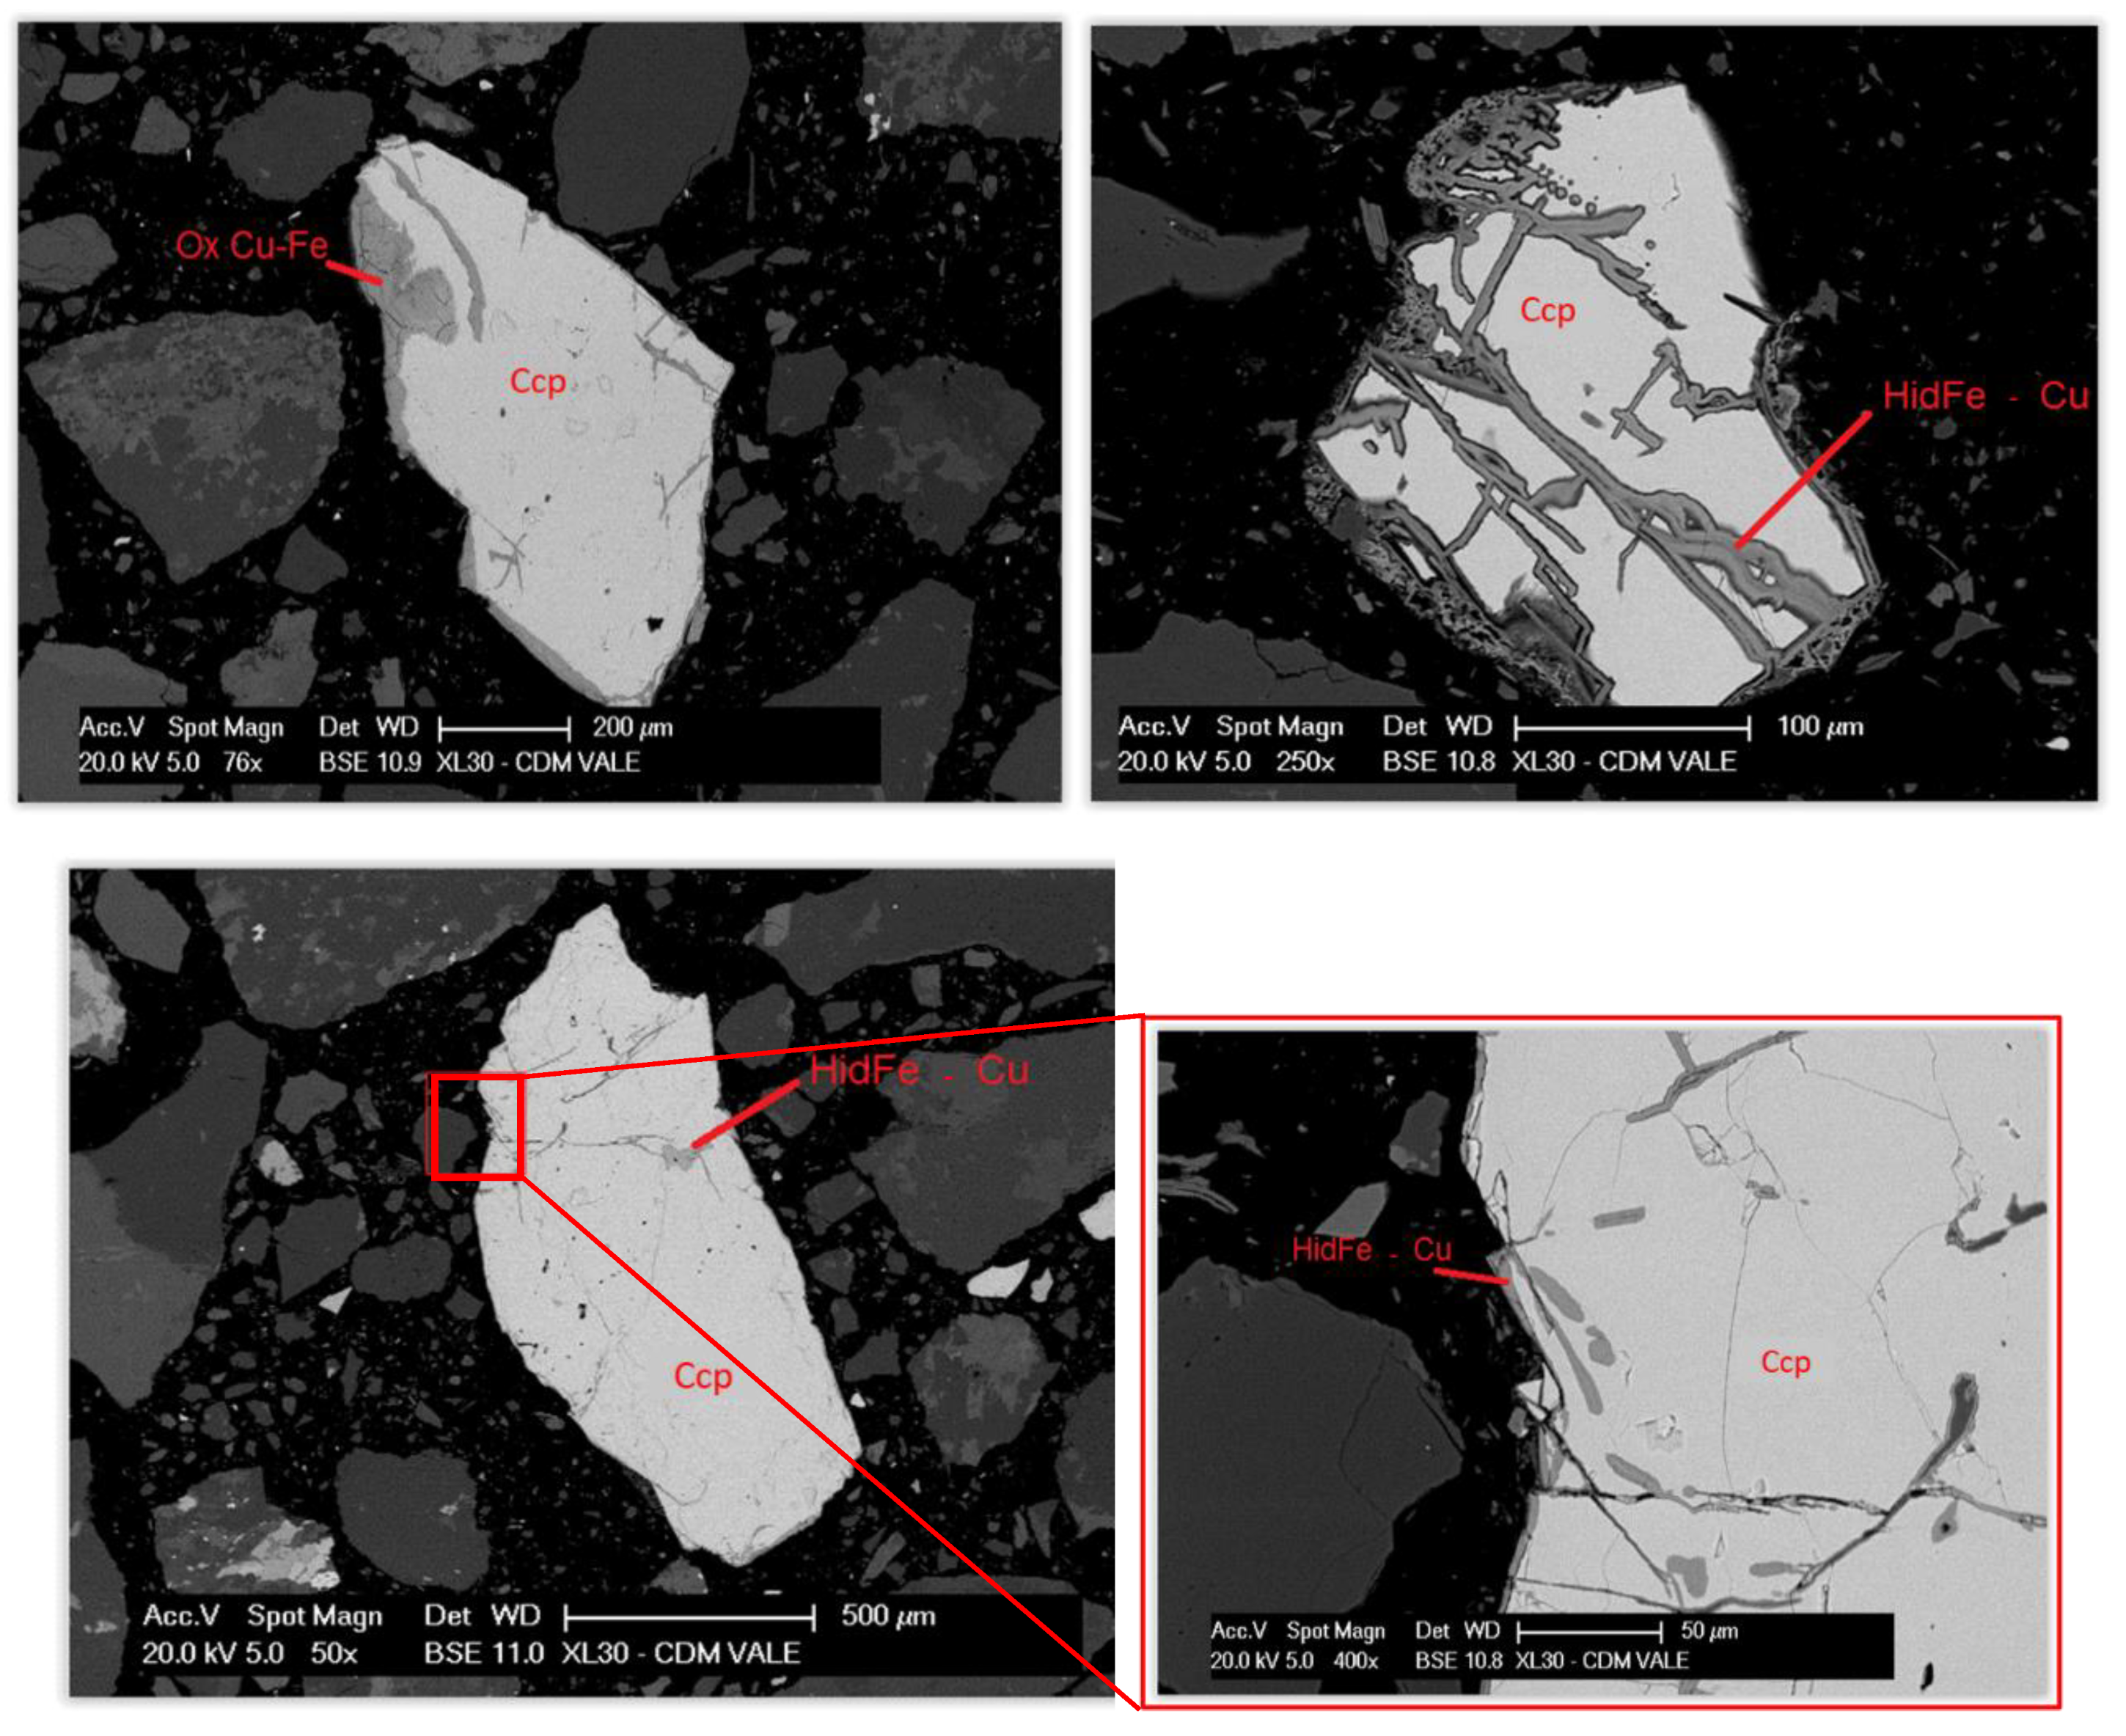
Figure 9.
Backscattered electron images of sample 10Y-GRB-1 × 0, showing chalcopyrite particles that are partially altered to Cu oxides, Cu-Fe oxide, Cu-Fe hydroxides, Cu-Fe oxides.
Figure 9.
Backscattered electron images of sample 10Y-GRB-1 × 0, showing chalcopyrite particles that are partially altered to Cu oxides, Cu-Fe oxide, Cu-Fe hydroxides, Cu-Fe oxides.
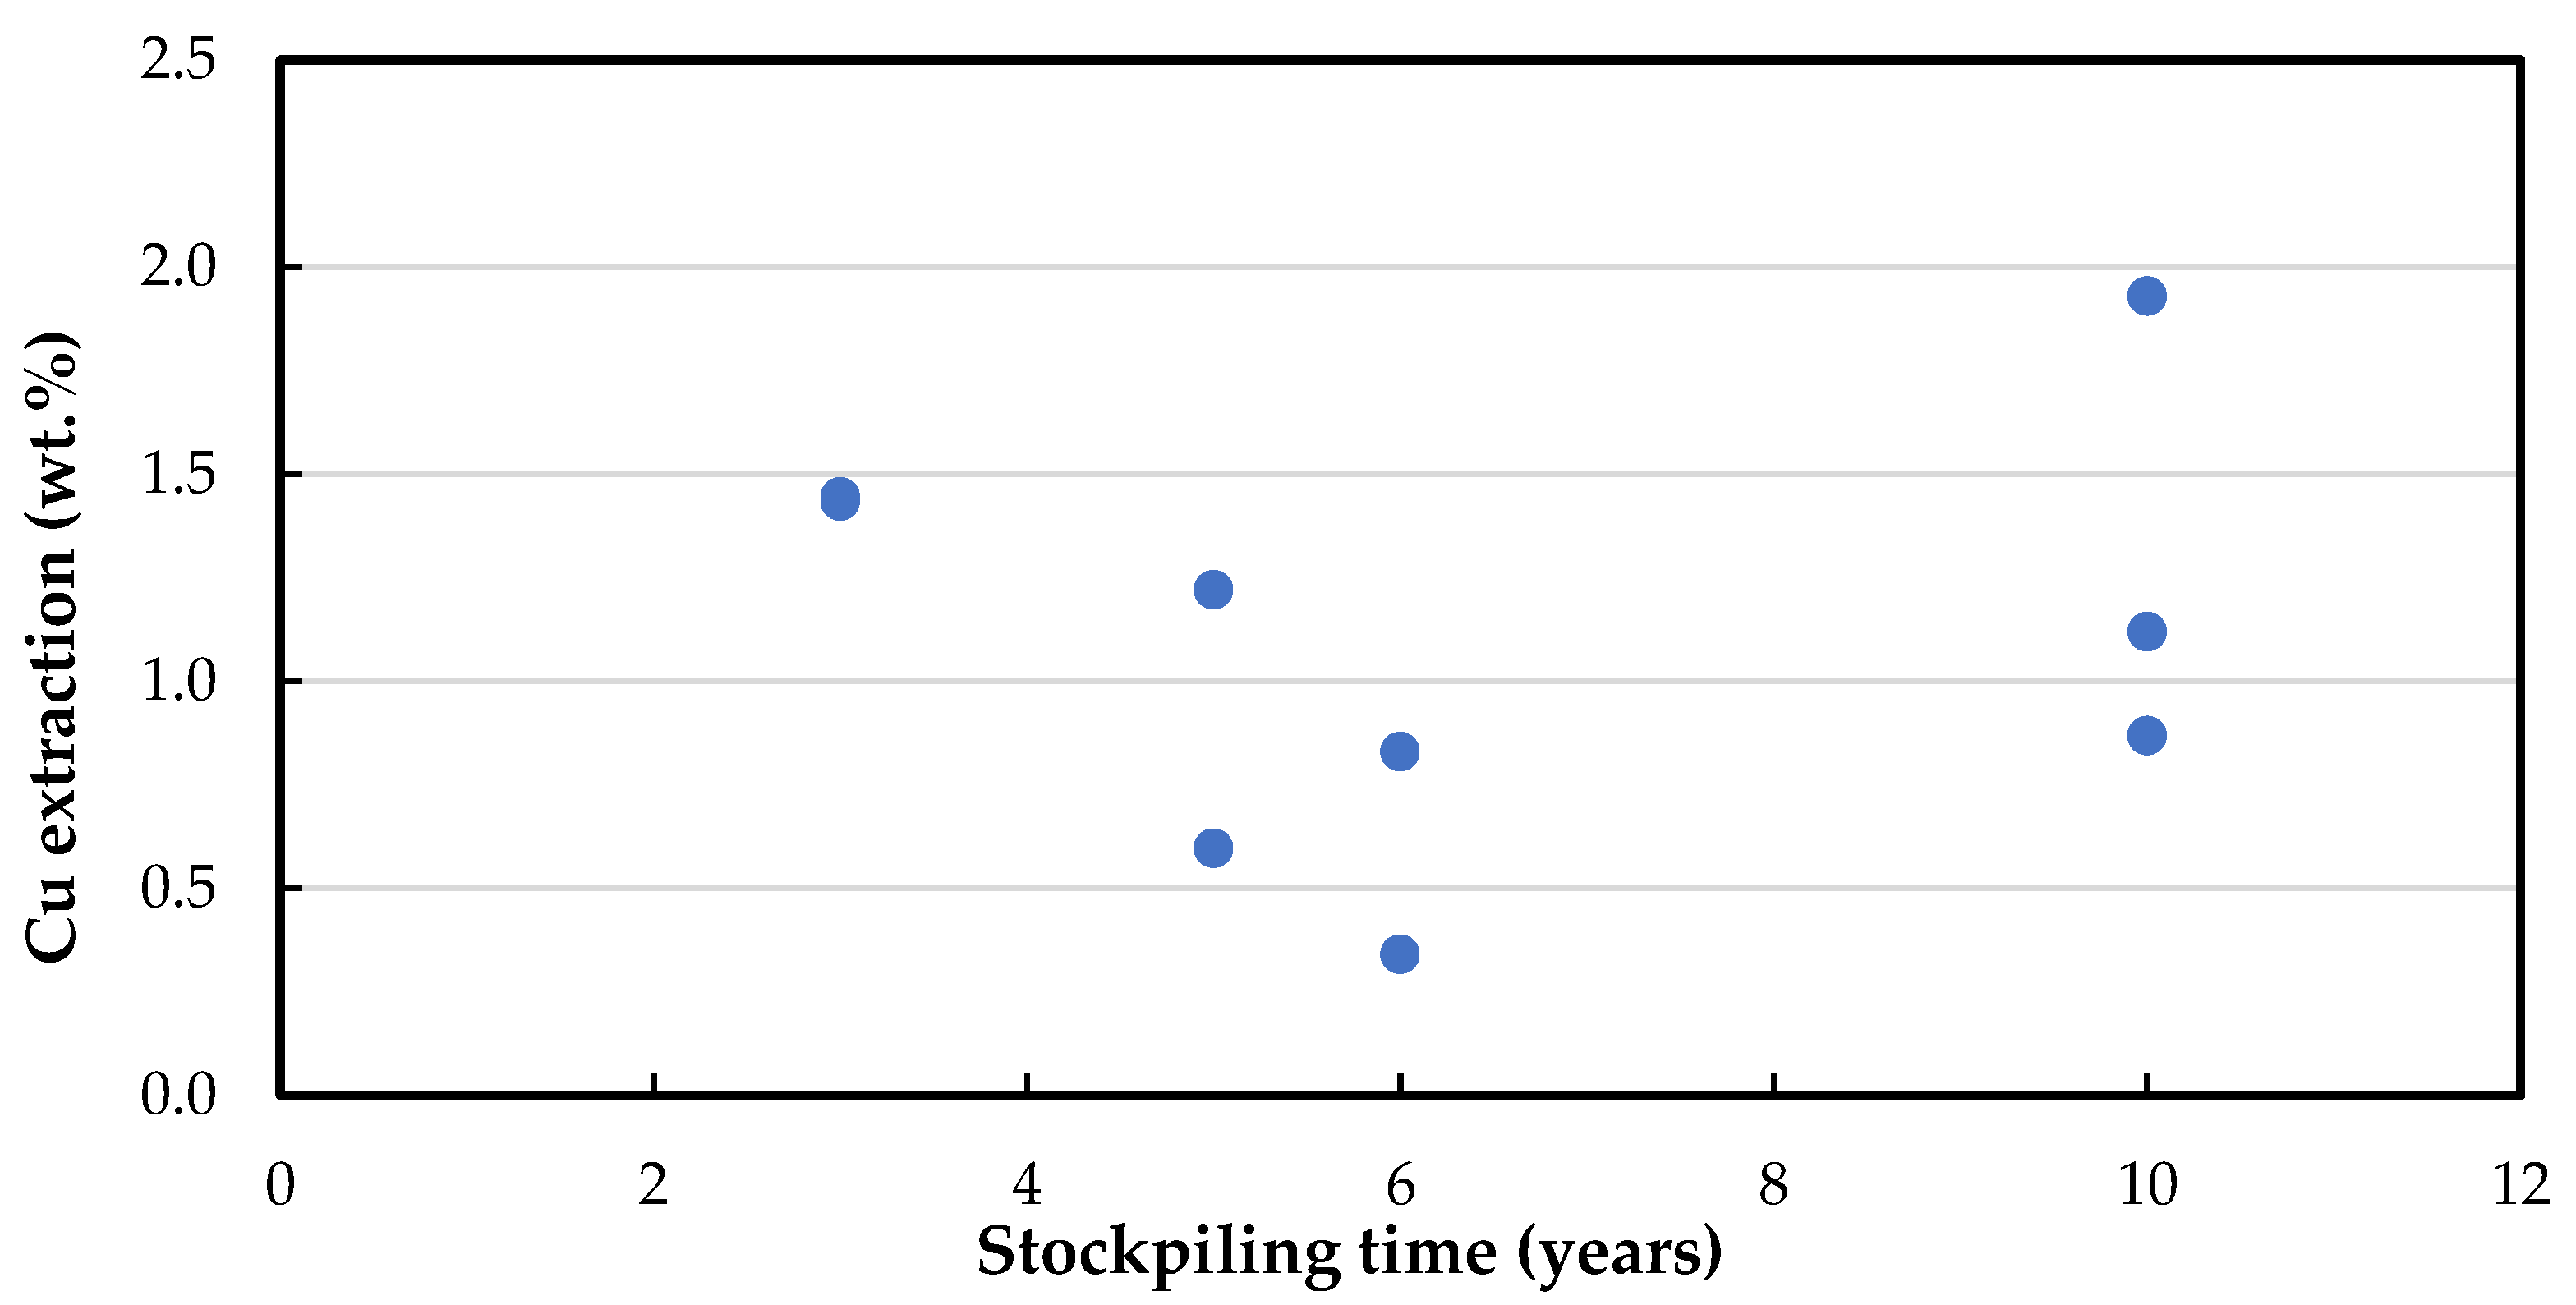
Figure 10.
Scatter plot of Cu extraction versus stockpiling time for the bulk samples from the stockpile.
Figure 10.
Scatter plot of Cu extraction versus stockpiling time for the bulk samples from the stockpile.
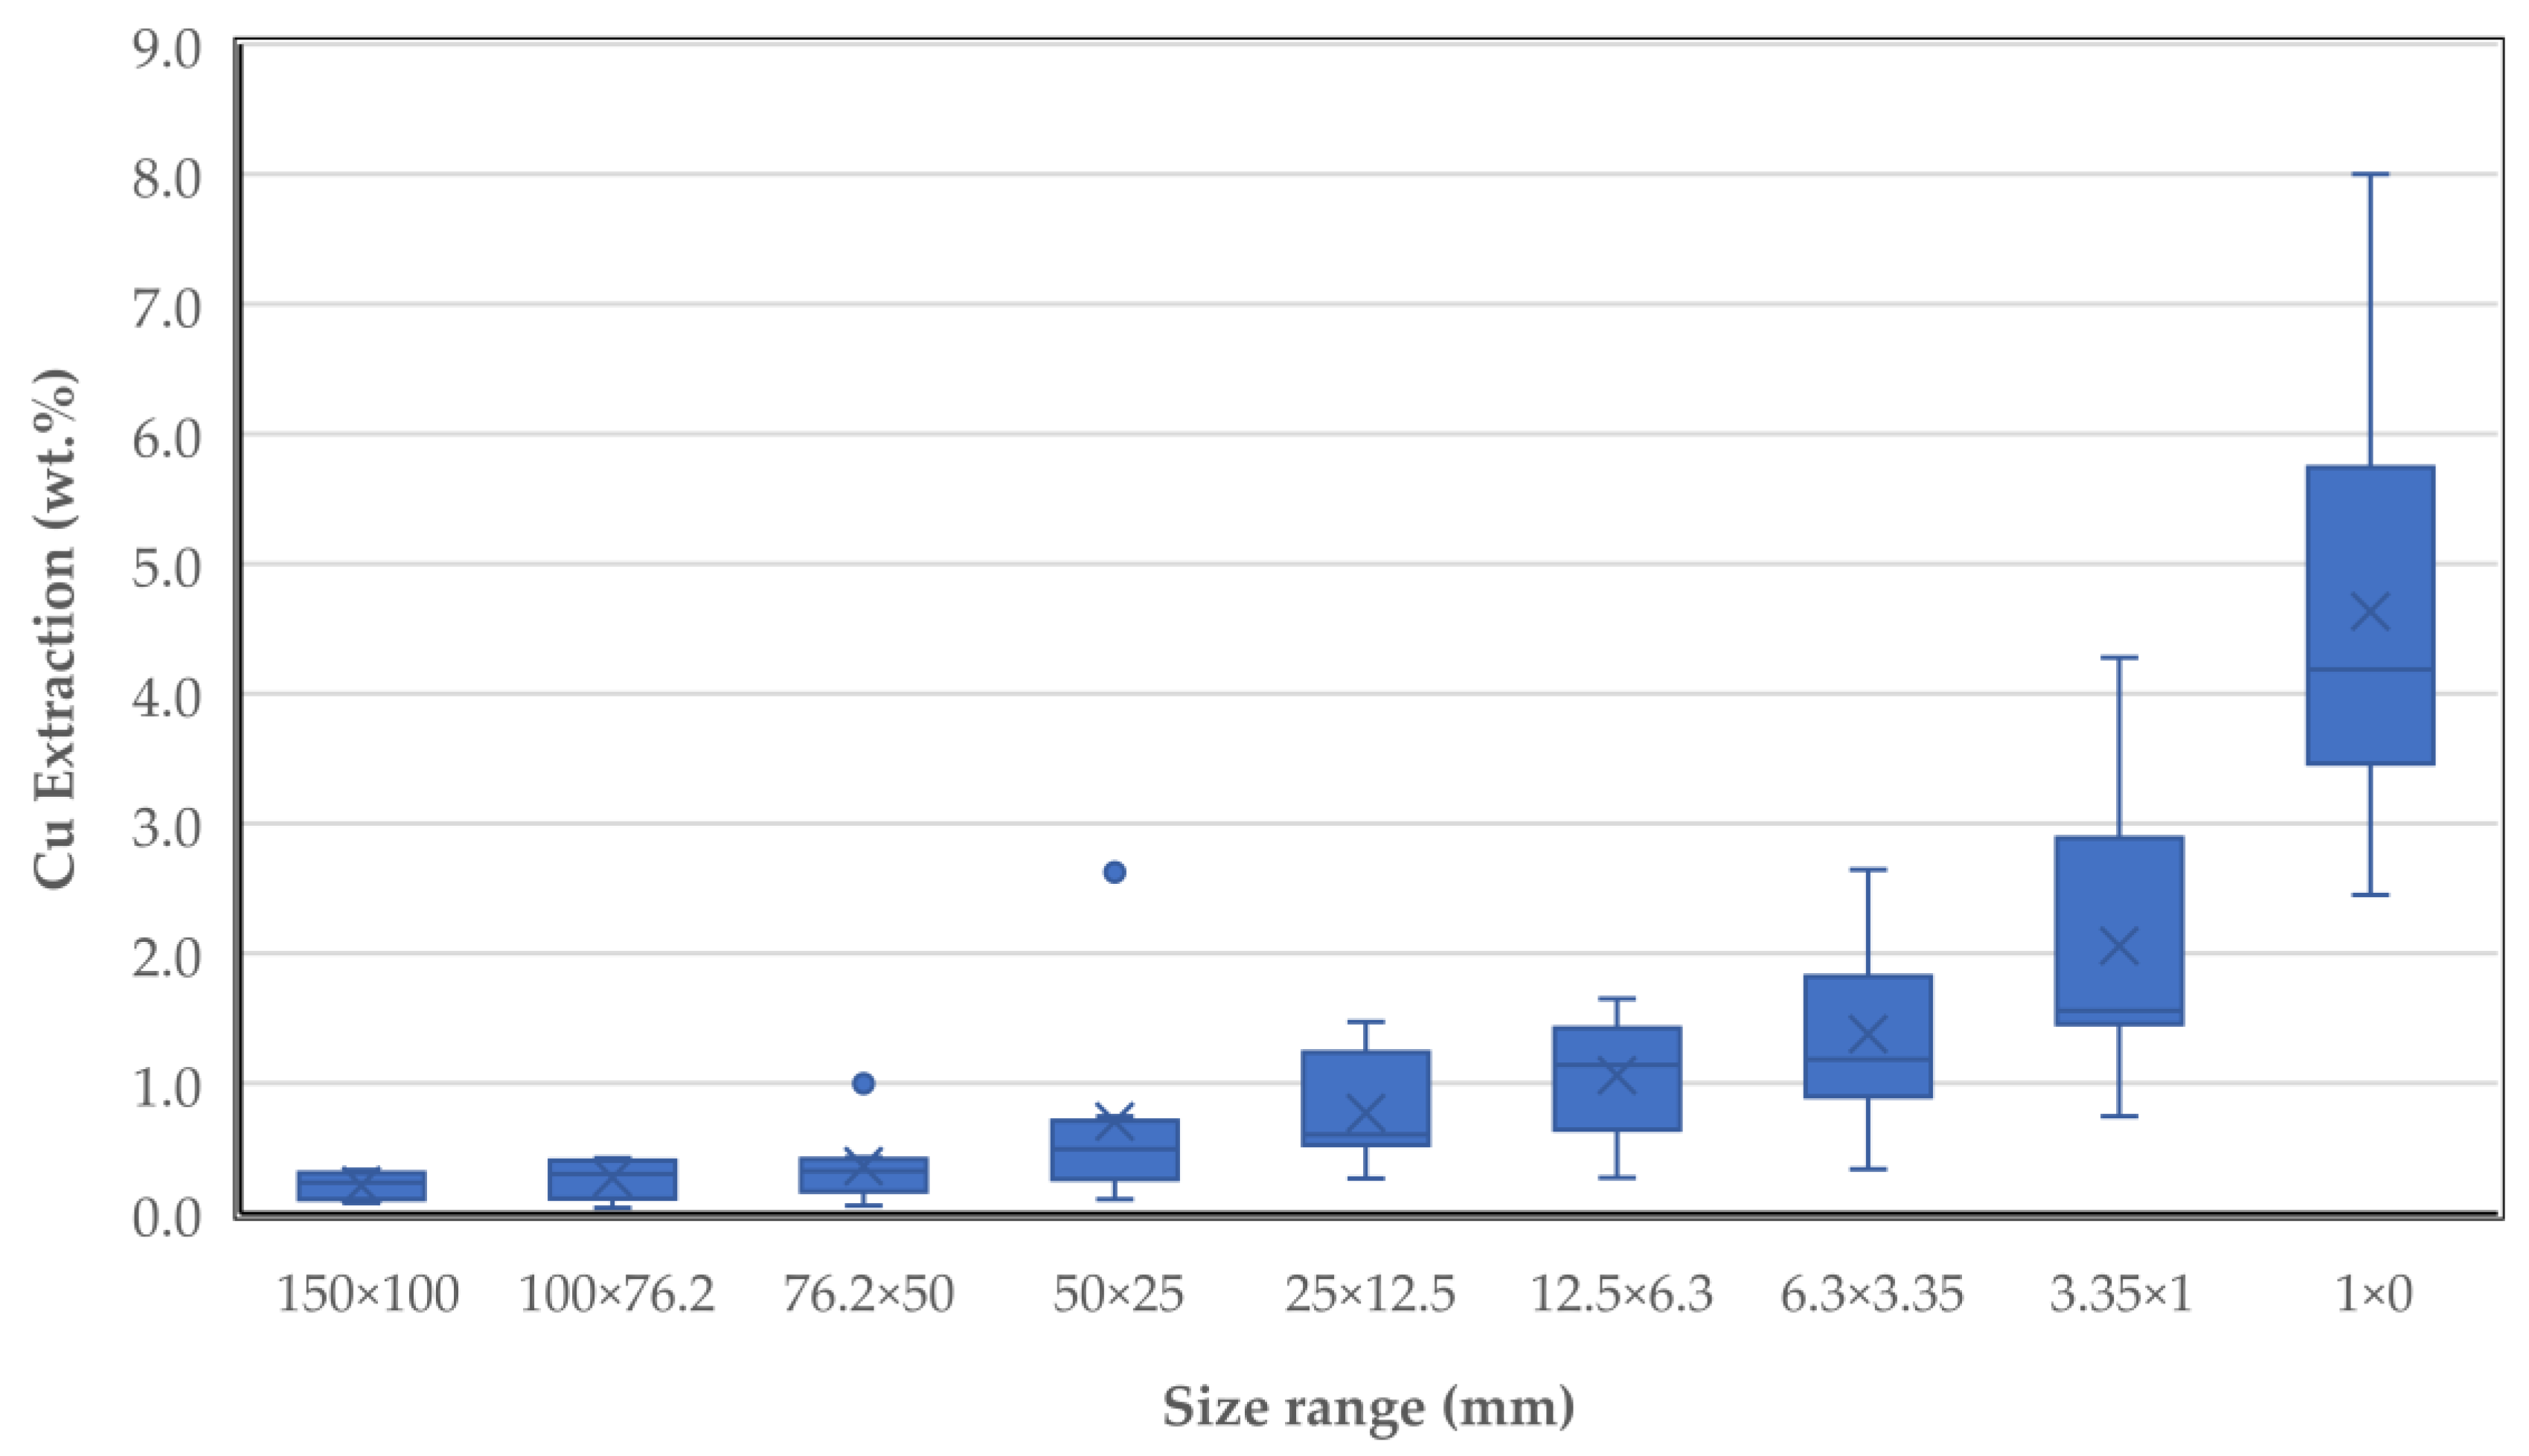
Figure 11.
Box plot of copper extraction by size fraction (in mm) for the bulk samples of the stockpile. Lines extend to 5th and 95th percentiles, whereas X represents the average values.
Figure 11.
Box plot of copper extraction by size fraction (in mm) for the bulk samples of the stockpile. Lines extend to 5th and 95th percentiles, whereas X represents the average values.
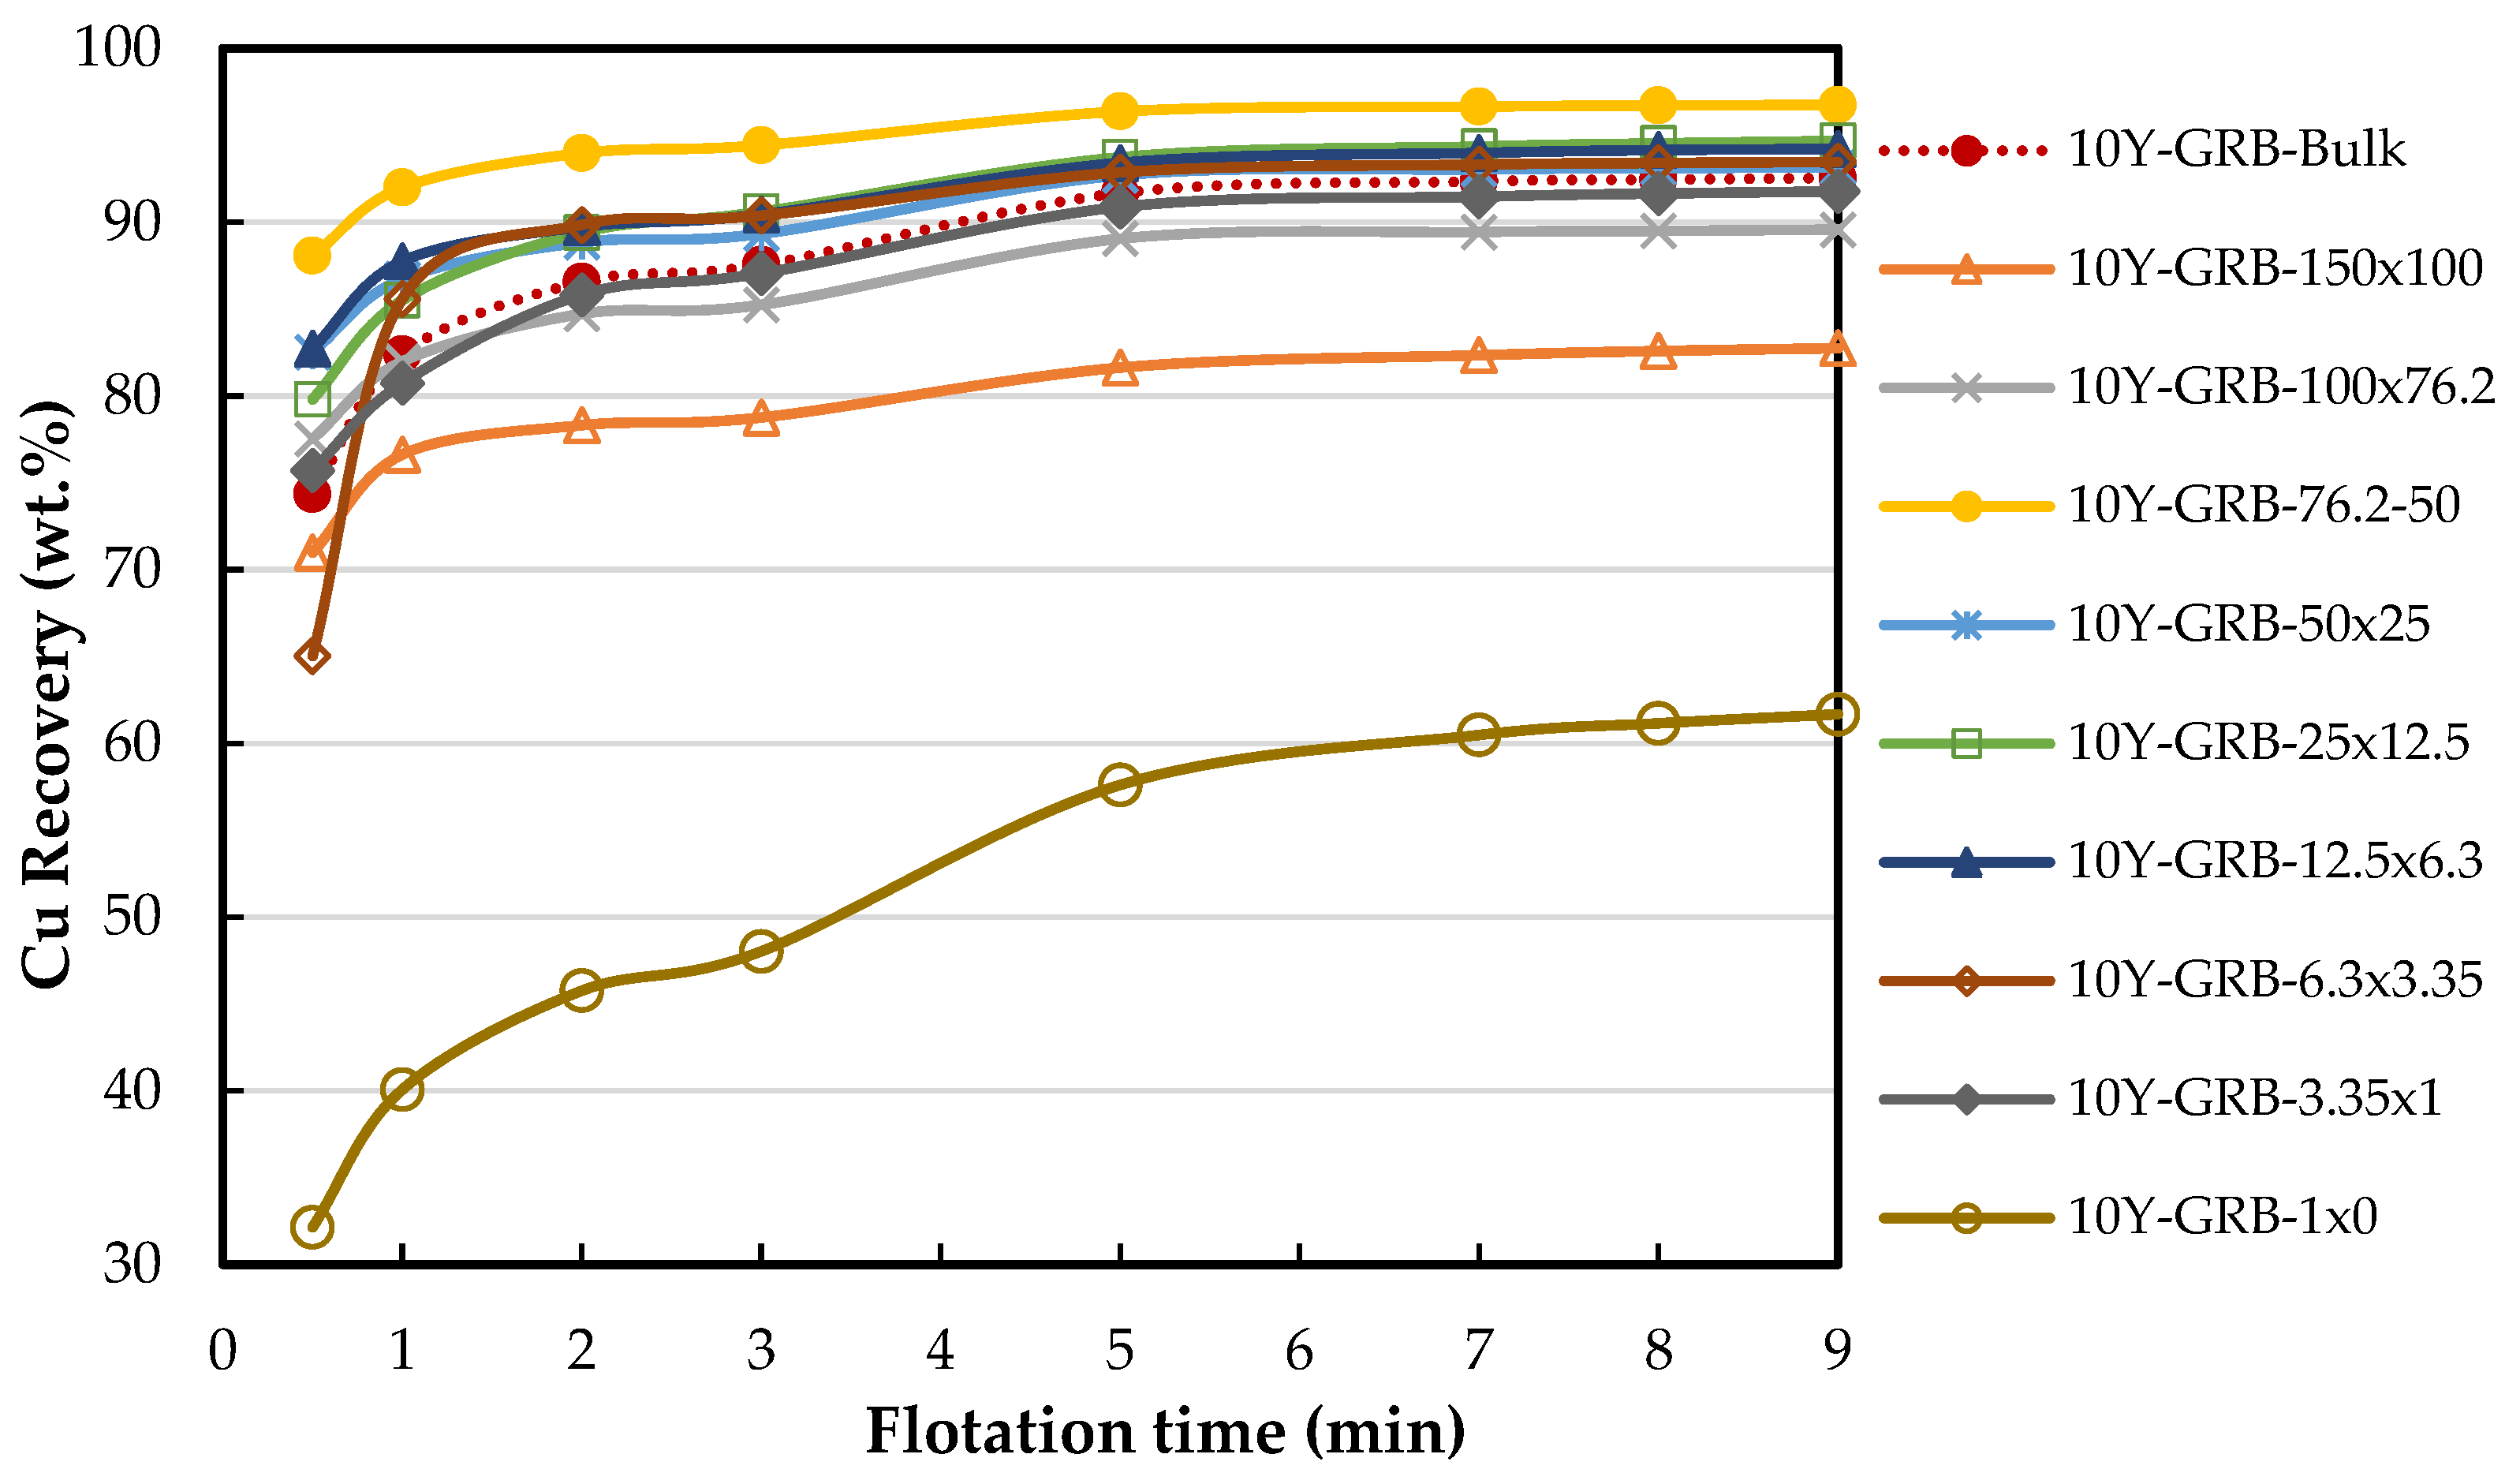
Figure 12.
Kinetic rougher flotation tests for sample 10Y-GRB-Bulk and its size fractions.
Figure 12.
Kinetic rougher flotation tests for sample 10Y-GRB-Bulk and its size fractions.
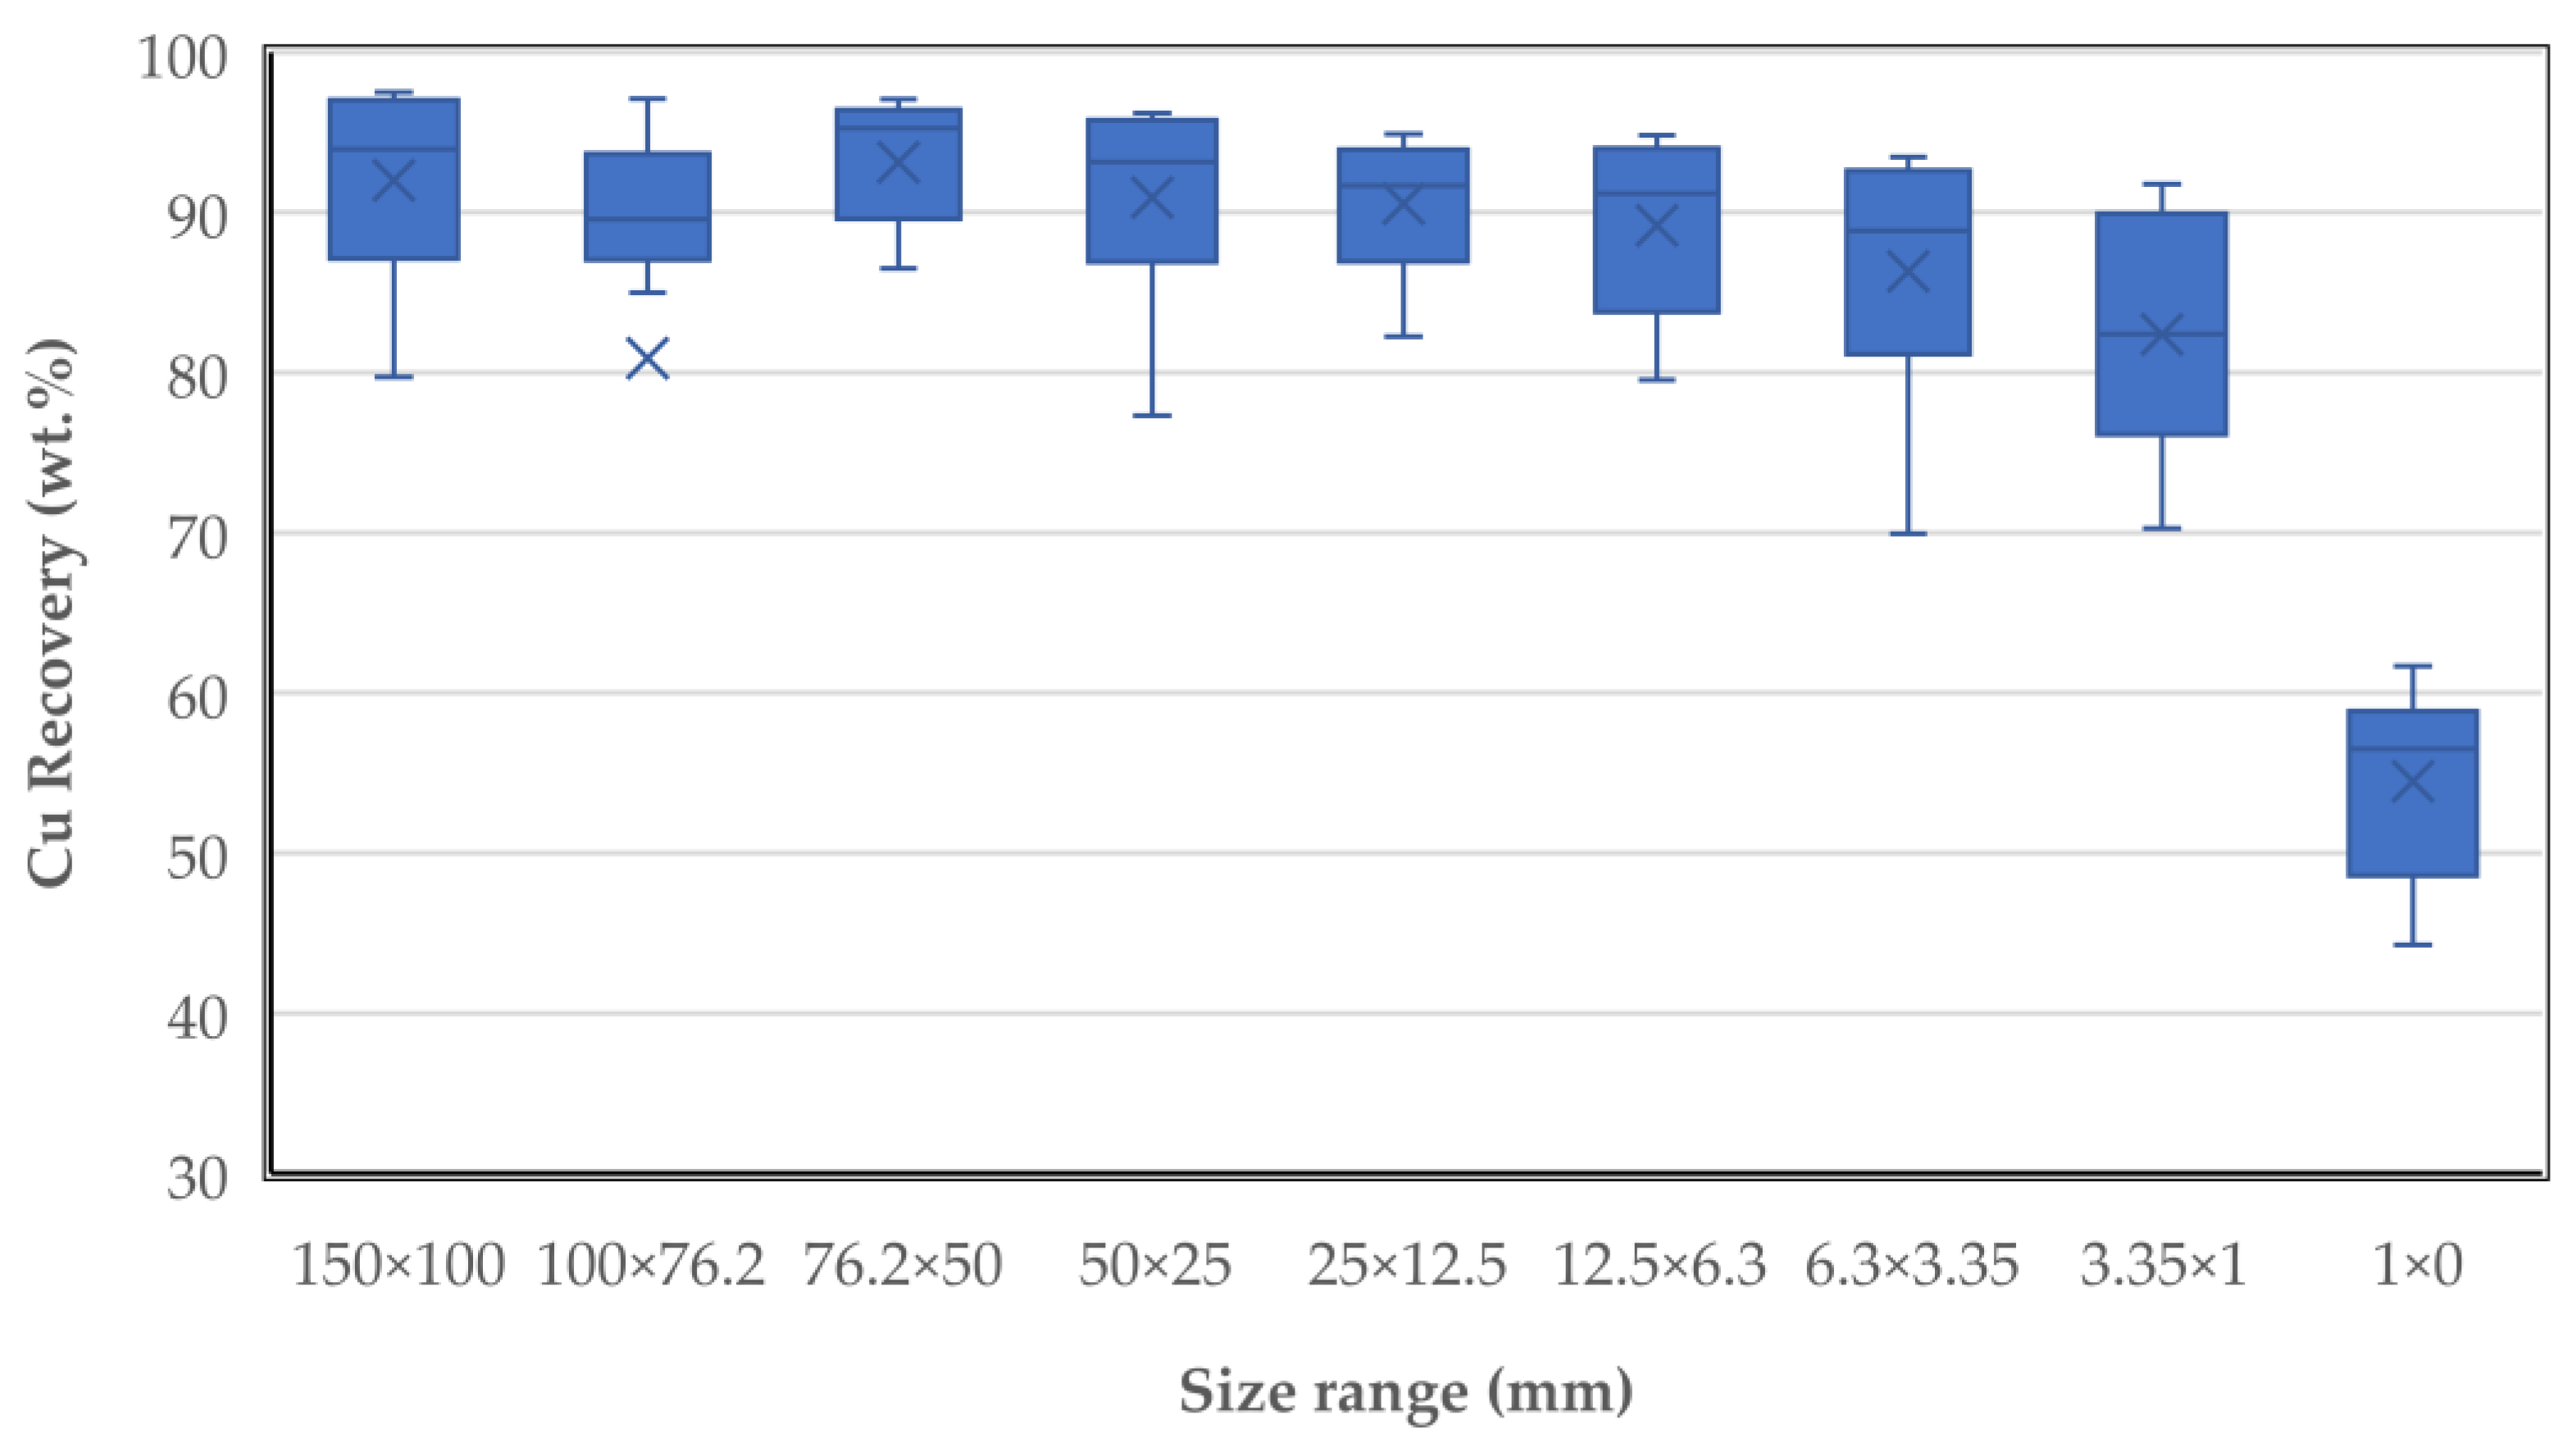
Figure 13.
Box plot of copper recovery in rougher flotation for the different size fractions for all stockpiled samples.
Figure 13.
Box plot of copper recovery in rougher flotation for the different size fractions for all stockpiled samples.
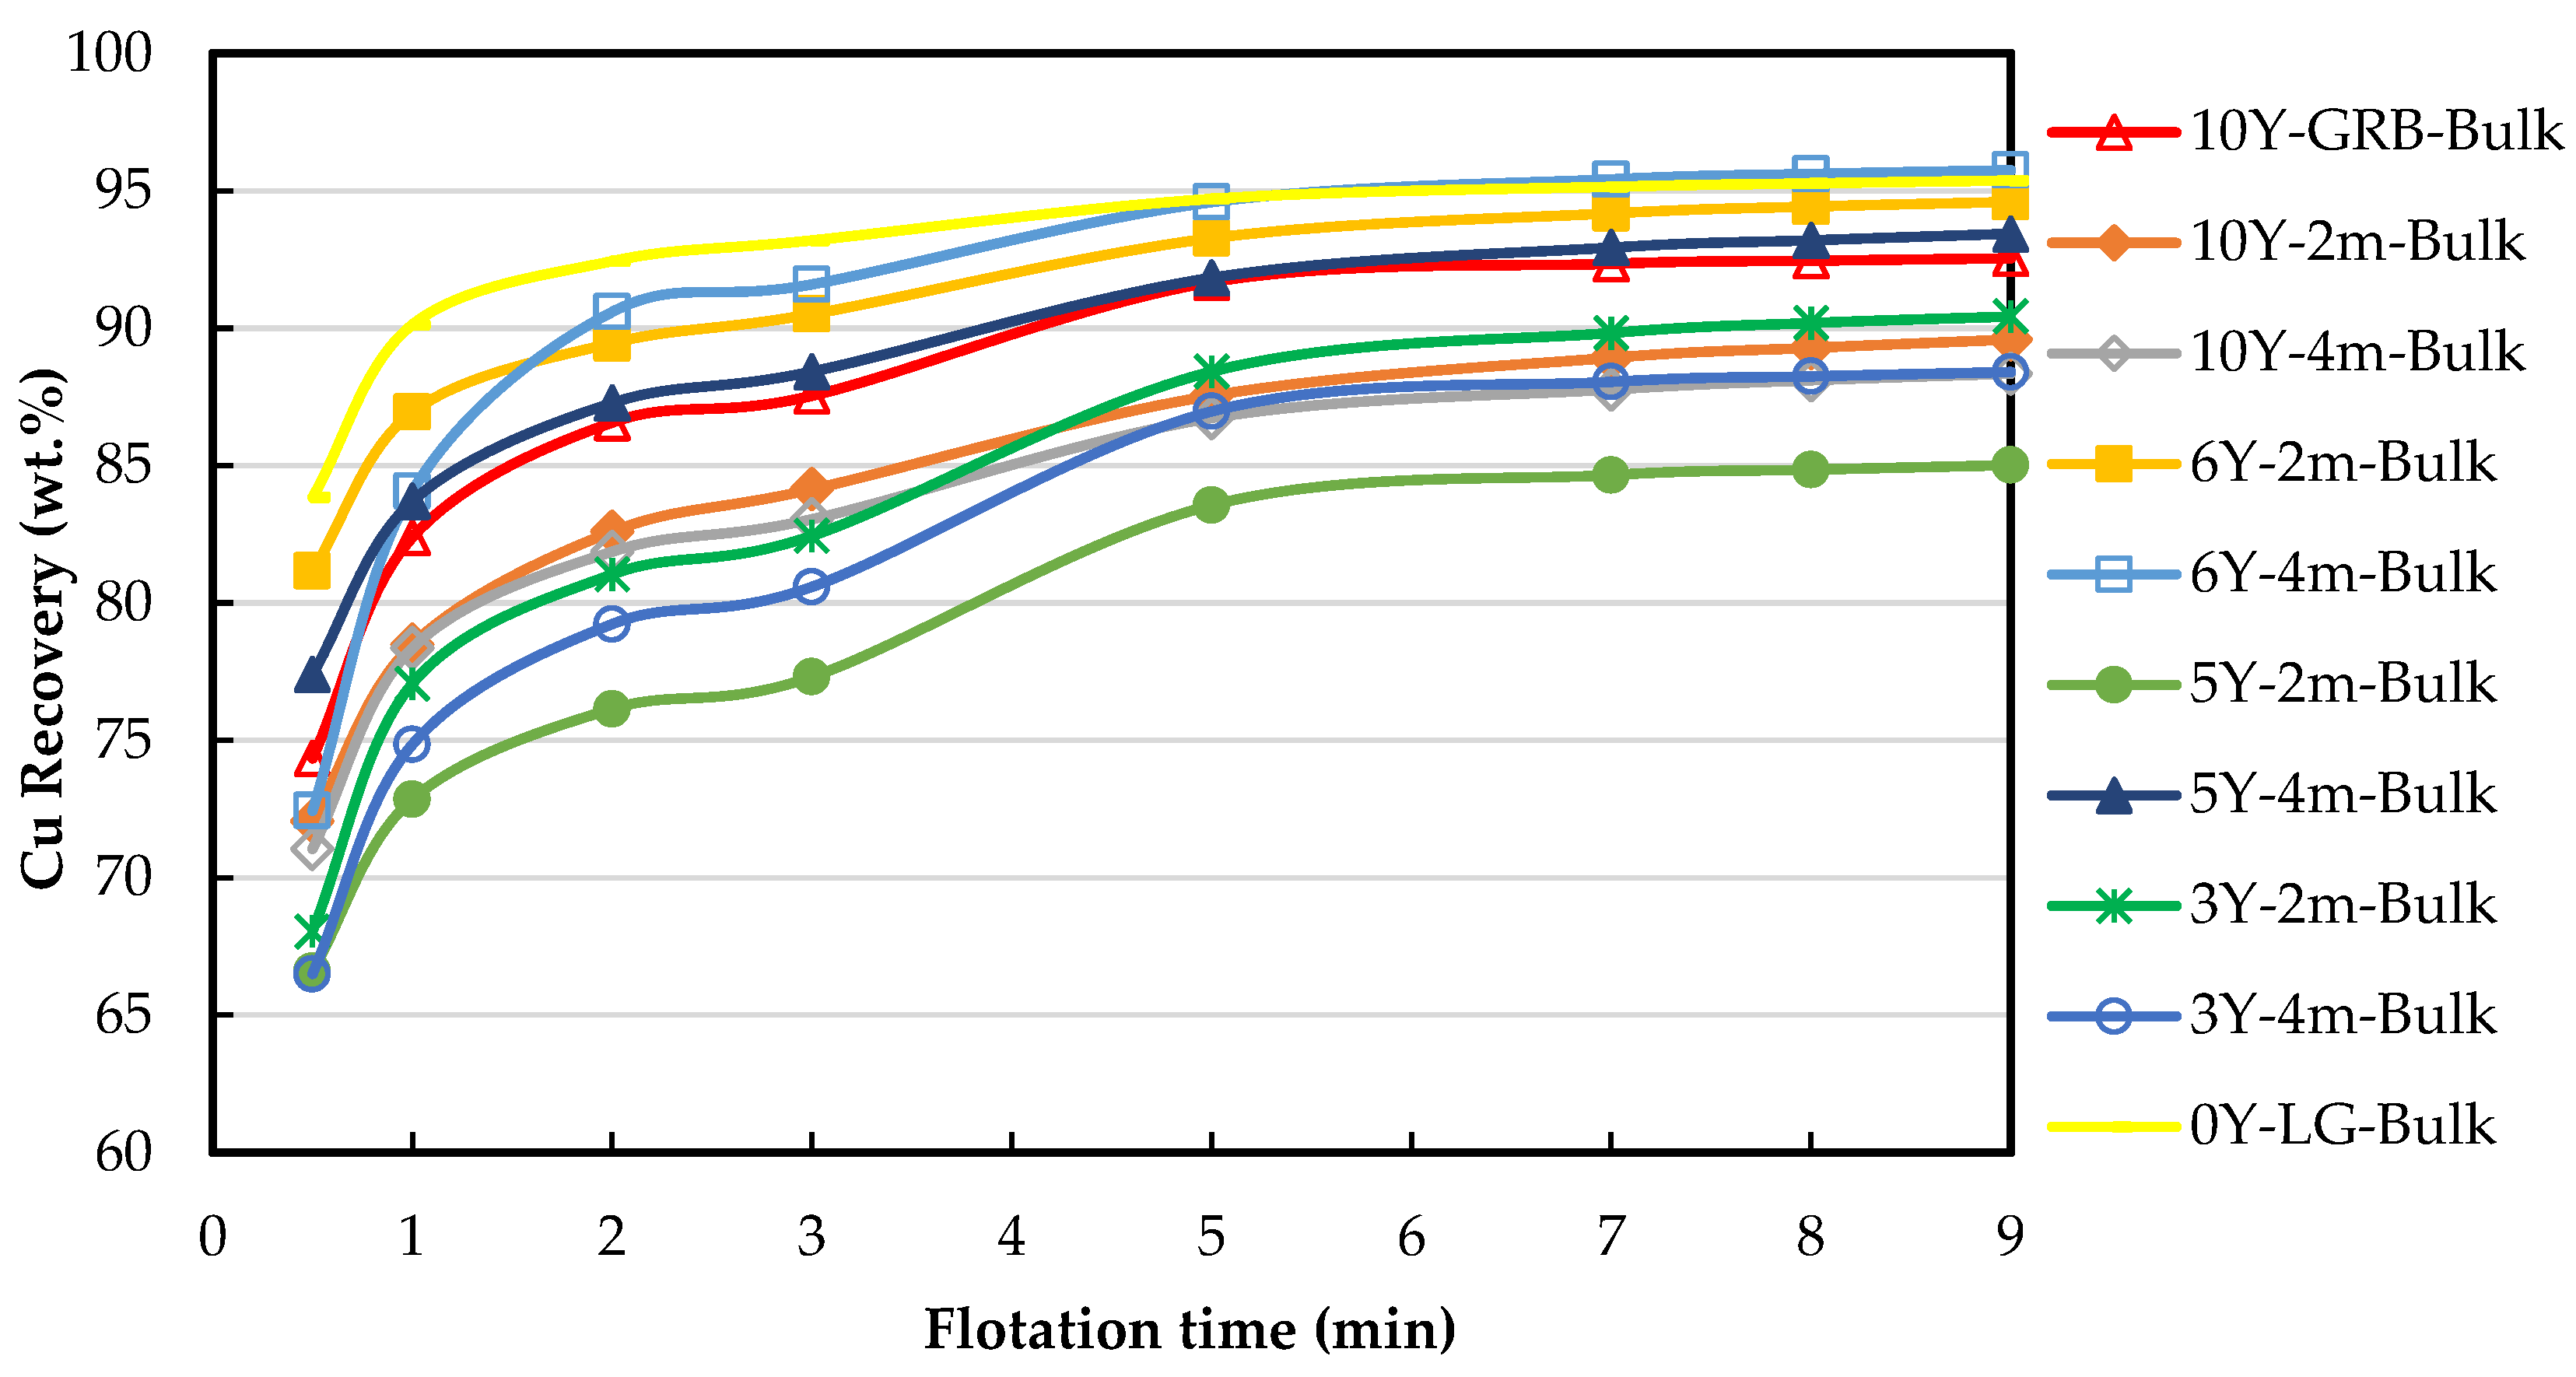
Figure 14.
Kinetic rougher tests for all bulk samples.
Figure 14.
Kinetic rougher tests for all bulk samples.
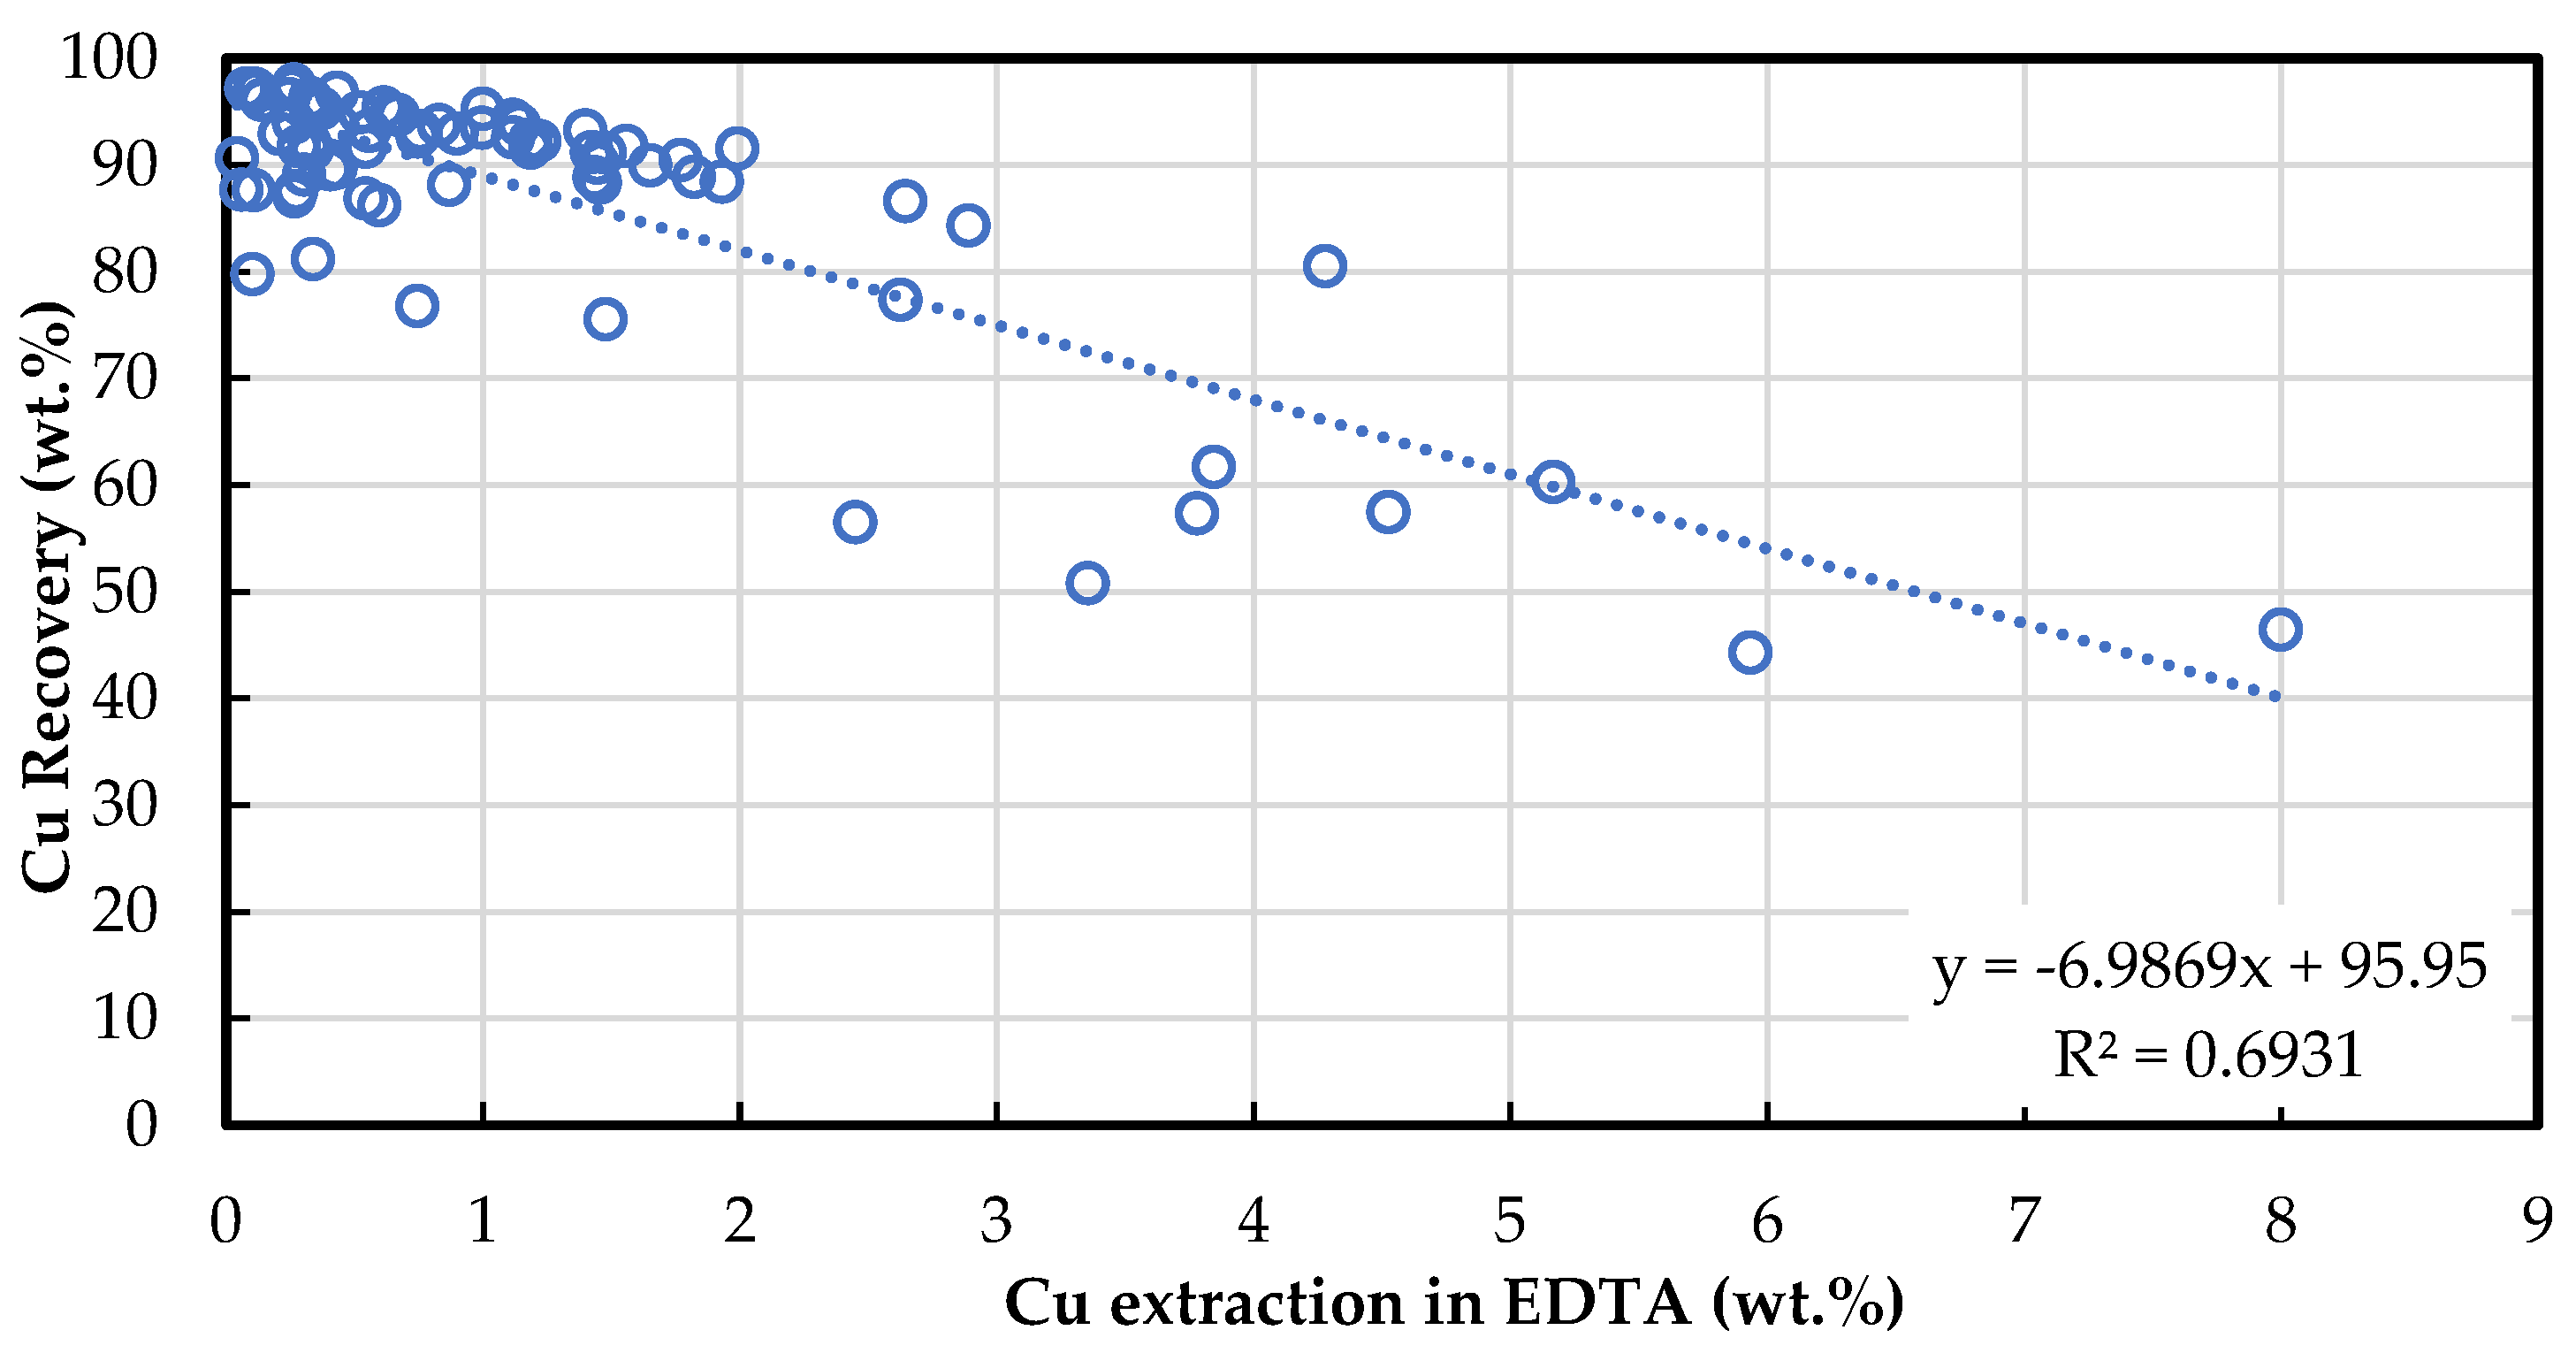
Figure 15.
Copper recovery versus Cu extraction in EDTA for both bulk and size-by-size samples, except for those with copper grades below 0.2%.
Figure 15.
Copper recovery versus Cu extraction in EDTA for both bulk and size-by-size samples, except for those with copper grades below 0.2%.
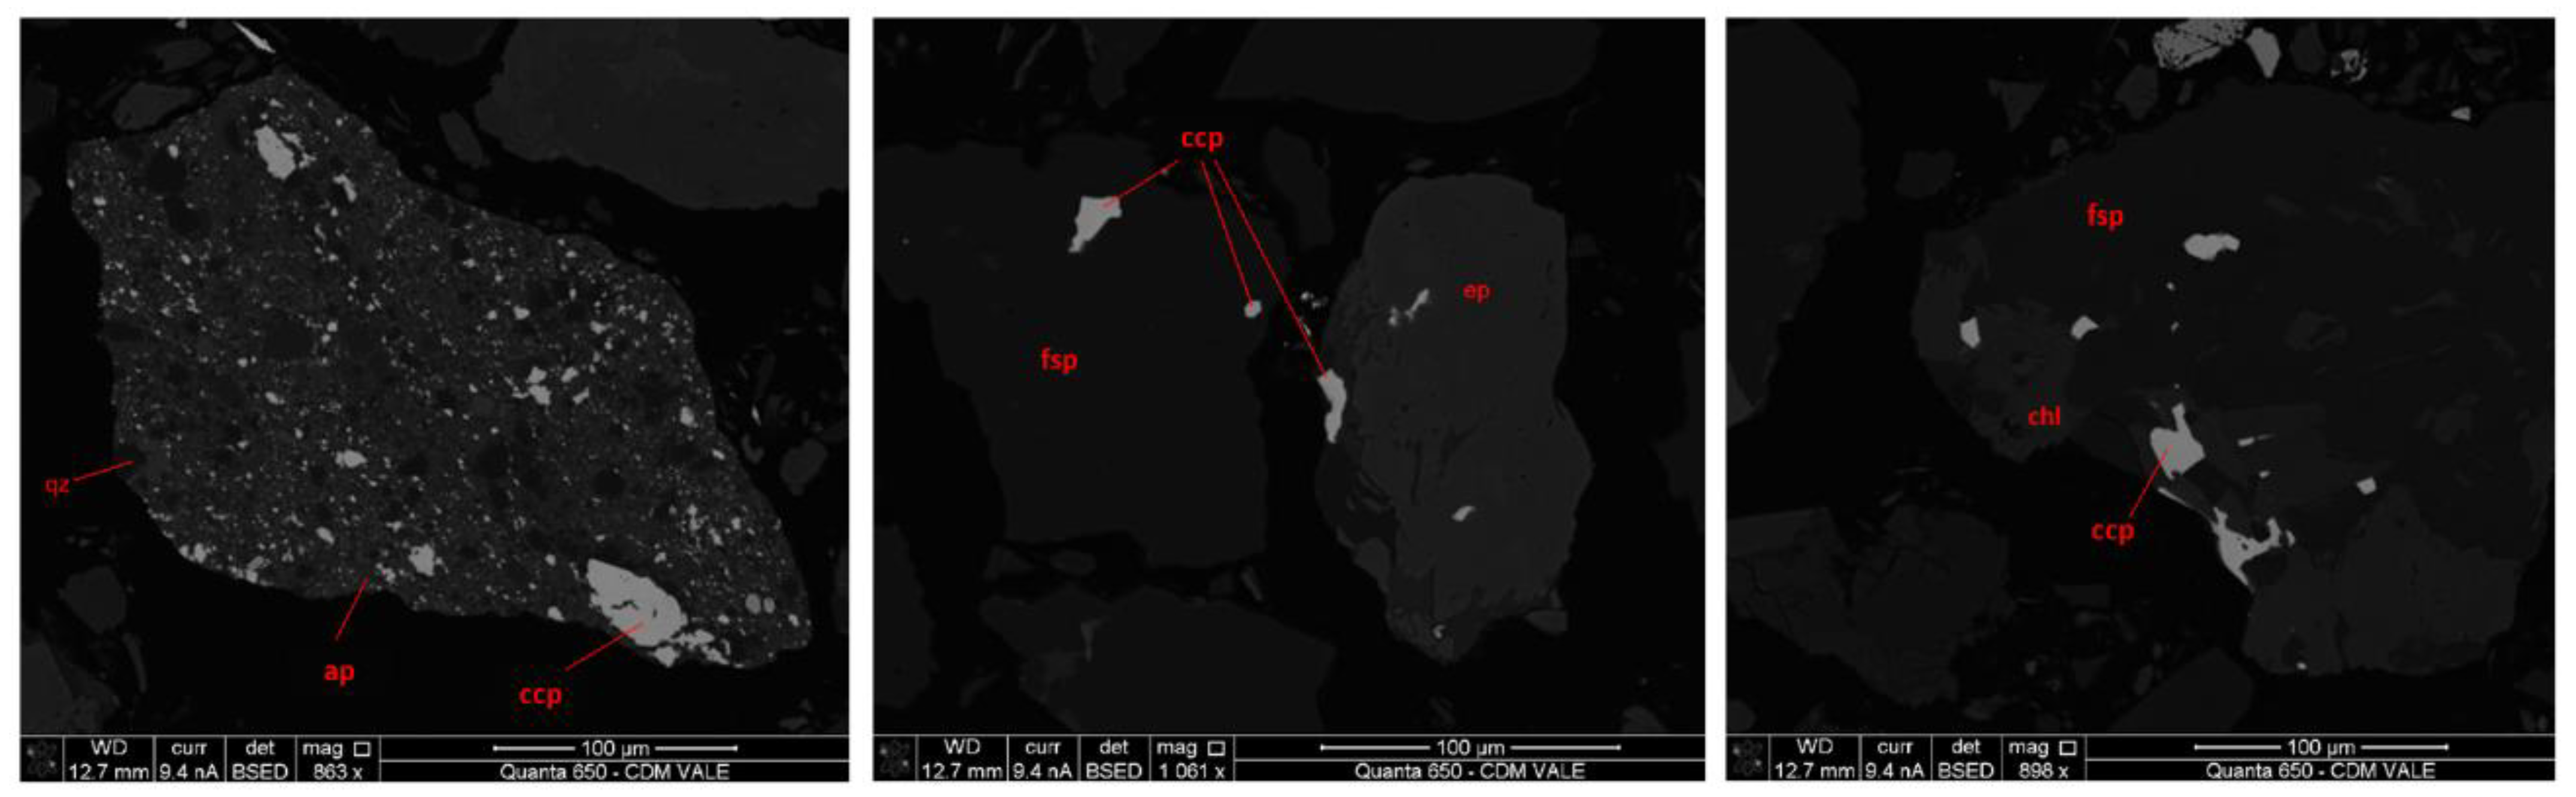
Figure 16.
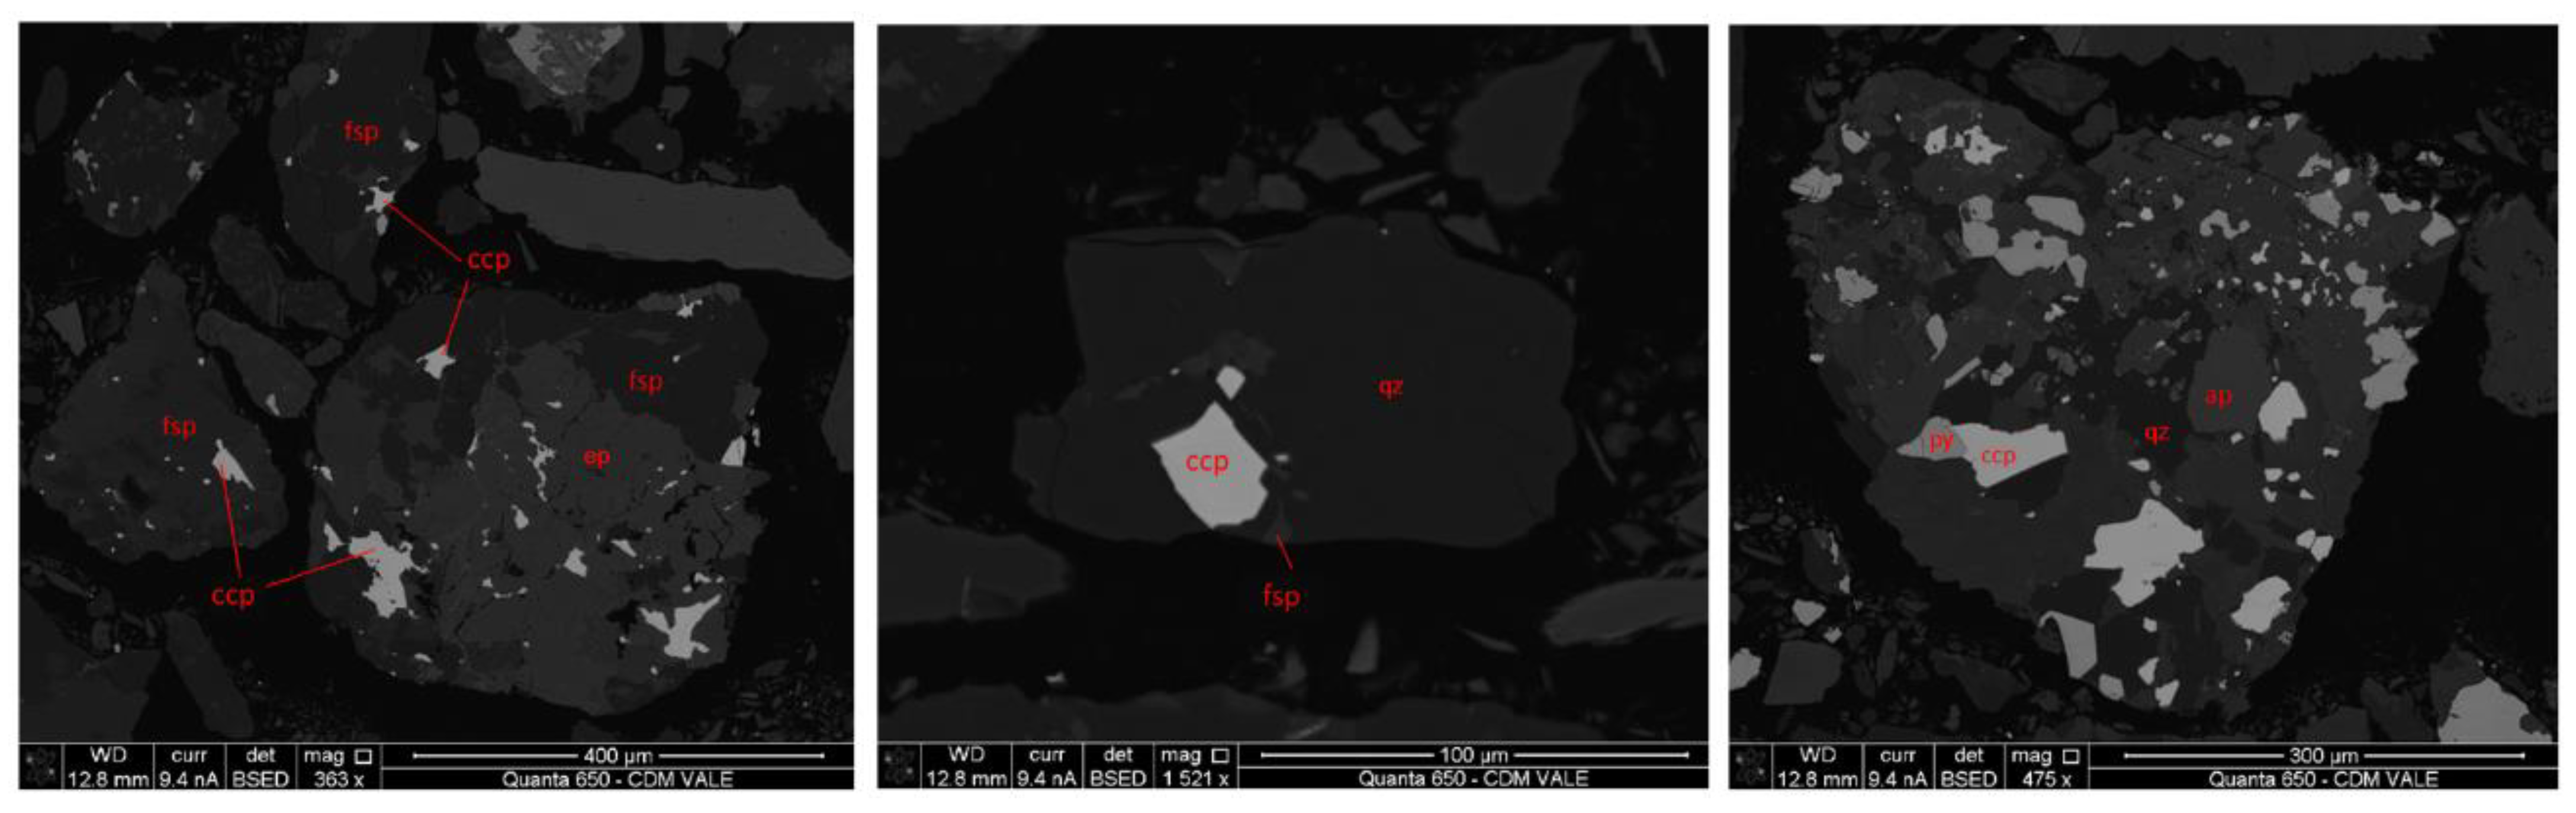
Backscattered electron images of the rougher tailings of sample 5Y-4m-25 × 12.5, showing chalcopyrite (ccp) grains locked in silicates particles (feldspar, fsp; epidote, ep; quartz, qz, apatite, ap). Complete list of acronyms and chemical formulas in
Table S1.
Figure 16.
Backscattered electron images of the rougher tailings of sample 5Y-4m-25 × 12.5, showing chalcopyrite (ccp) grains locked in silicates particles (feldspar, fsp; epidote, ep; quartz, qz, apatite, ap). Complete list of acronyms and chemical formulas in
Table S1.
Figure 17.
Backscattered electron images of the rougher tailings of sample 6y-4m-3.35 × 1, showing chalcopyrite (ccp) grains locked in silicates particles (feldspar, fsp; epidote, ep; quartz, qz, apatite, ap, chlorite, chl). Complete list of acronyms and chemical formulas in
Table S1.
Figure 17.
Backscattered electron images of the rougher tailings of sample 6y-4m-3.35 × 1, showing chalcopyrite (ccp) grains locked in silicates particles (feldspar, fsp; epidote, ep; quartz, qz, apatite, ap, chlorite, chl). Complete list of acronyms and chemical formulas in
Table S1.
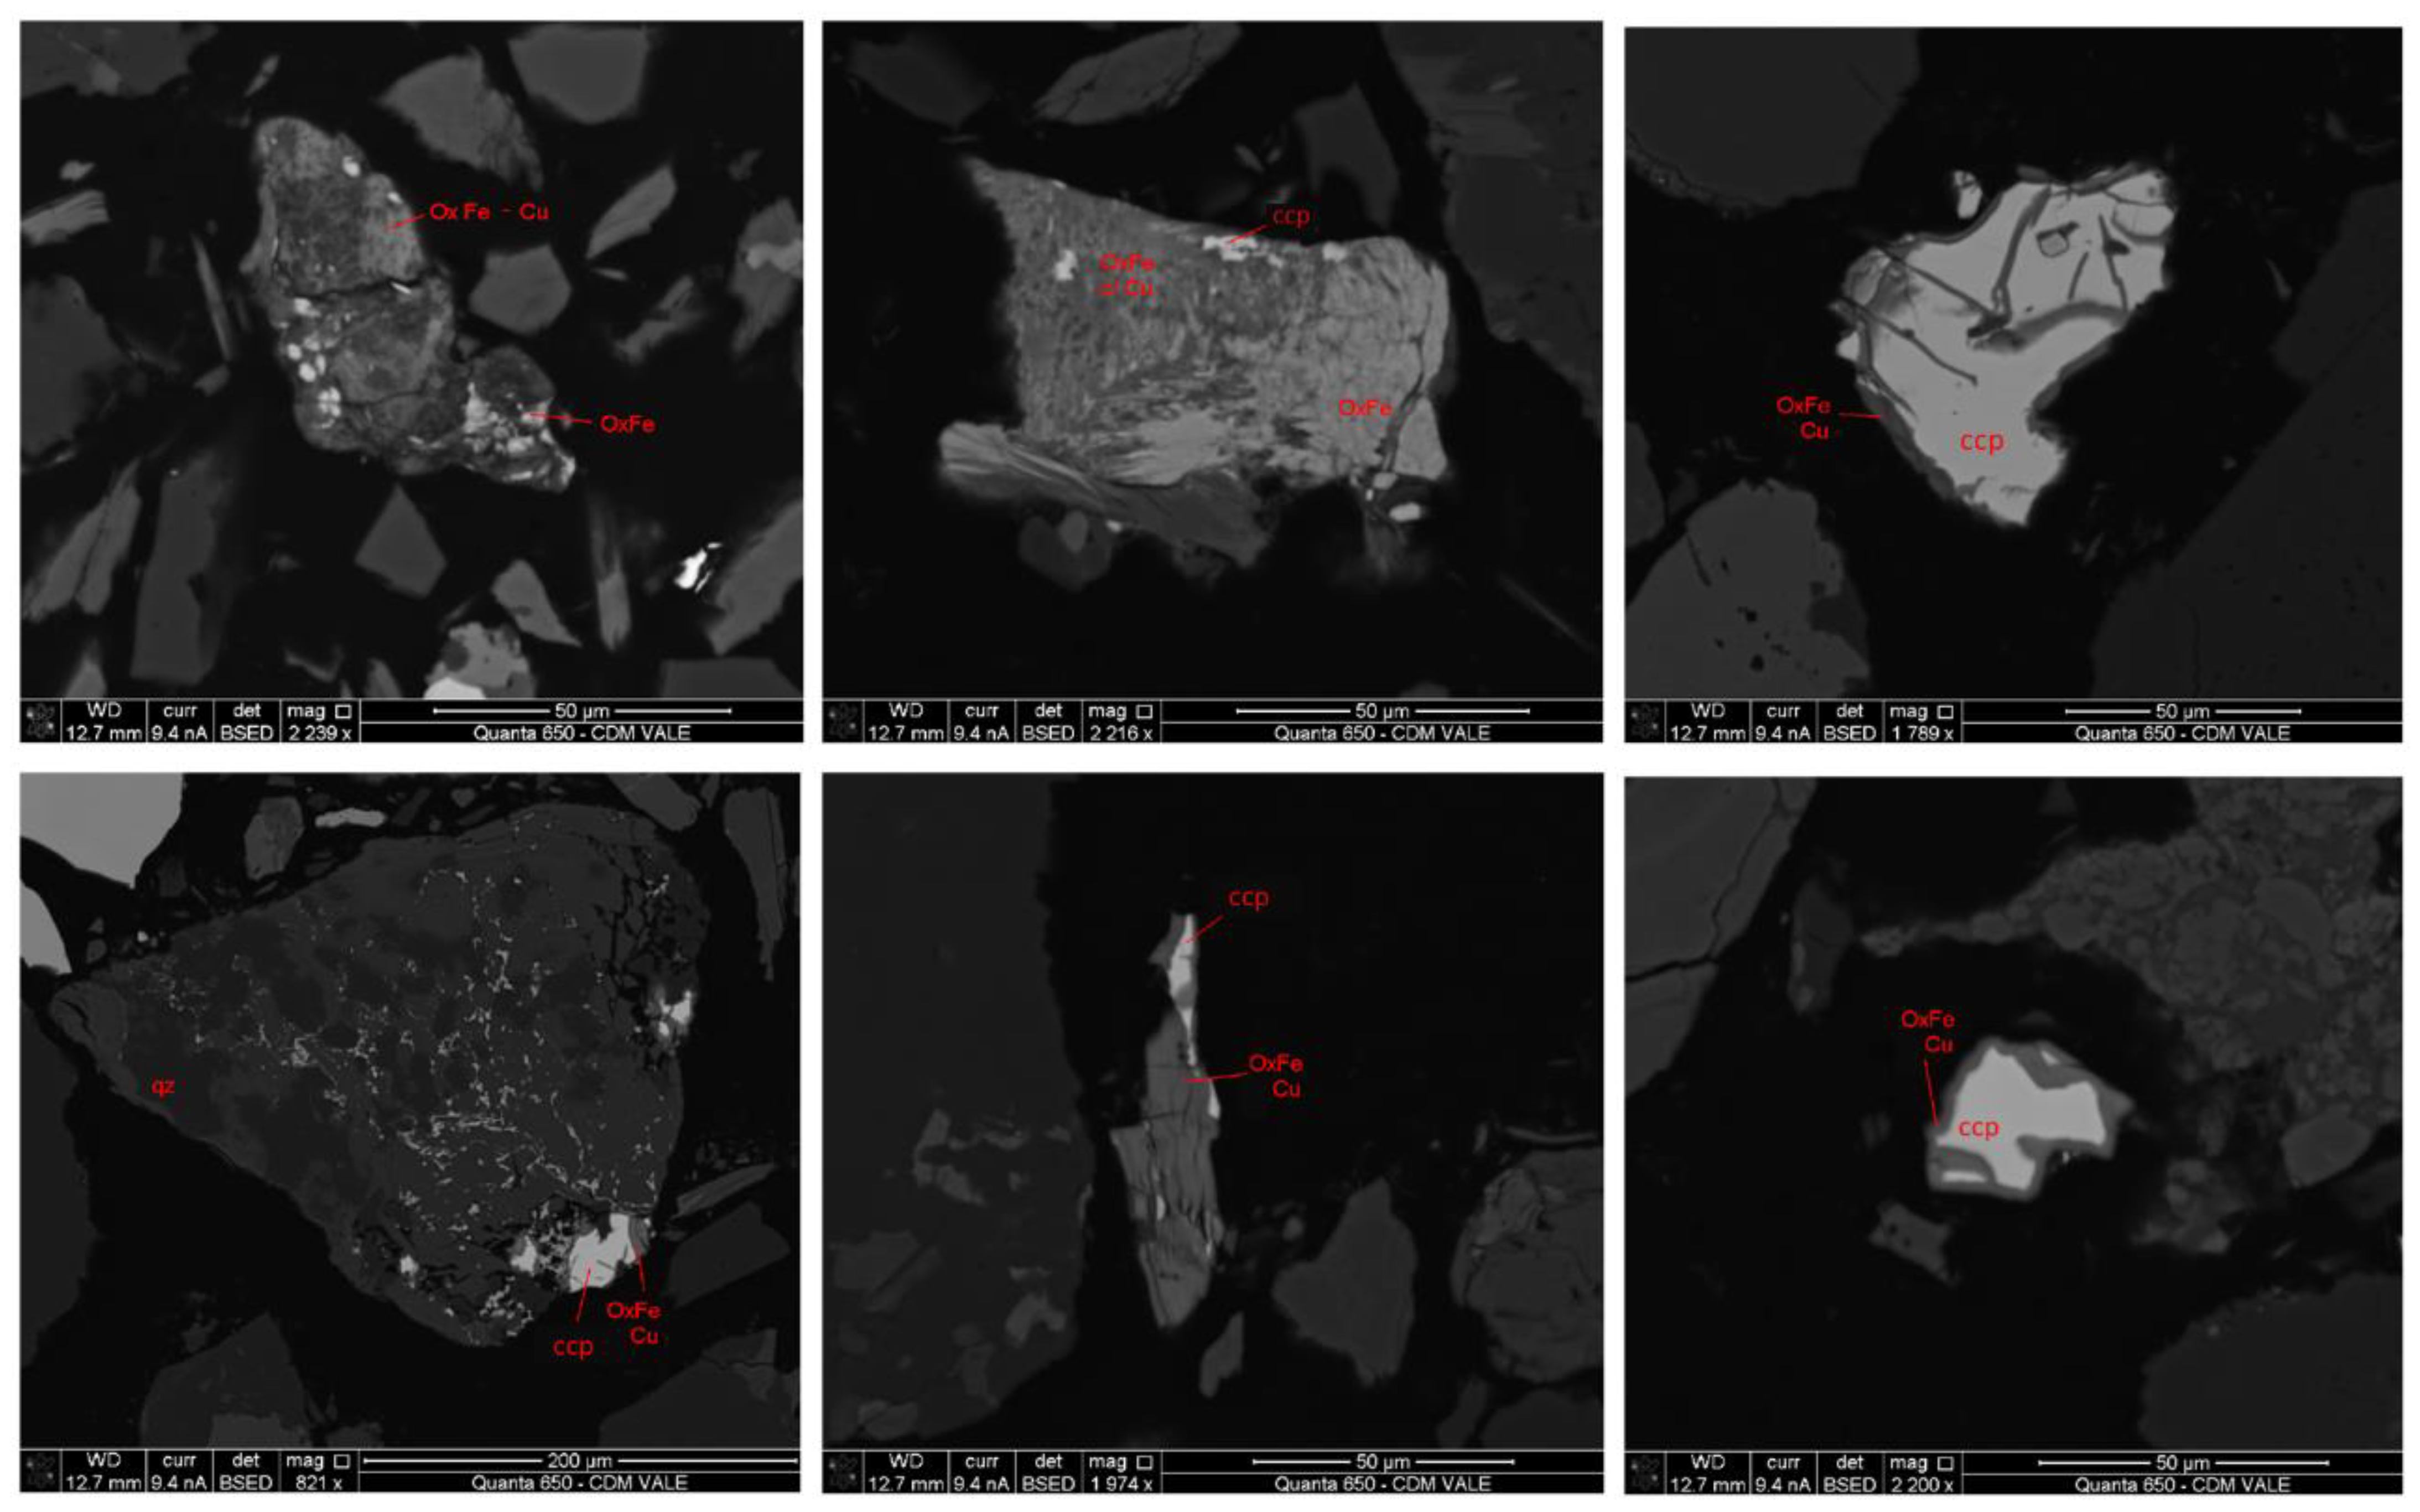
Figure 18.
Backscattered electron images of the rougher tailings of sample 6Y-4m-1 × 0 showing several grains of chalcopyrite (ccp) partially altered to Cu-Fe oxides. Complete list of acronyms and chemical formulas in
Table S1.
Figure 18.
Backscattered electron images of the rougher tailings of sample 6Y-4m-1 × 0 showing several grains of chalcopyrite (ccp) partially altered to Cu-Fe oxides. Complete list of acronyms and chemical formulas in
Table S1.
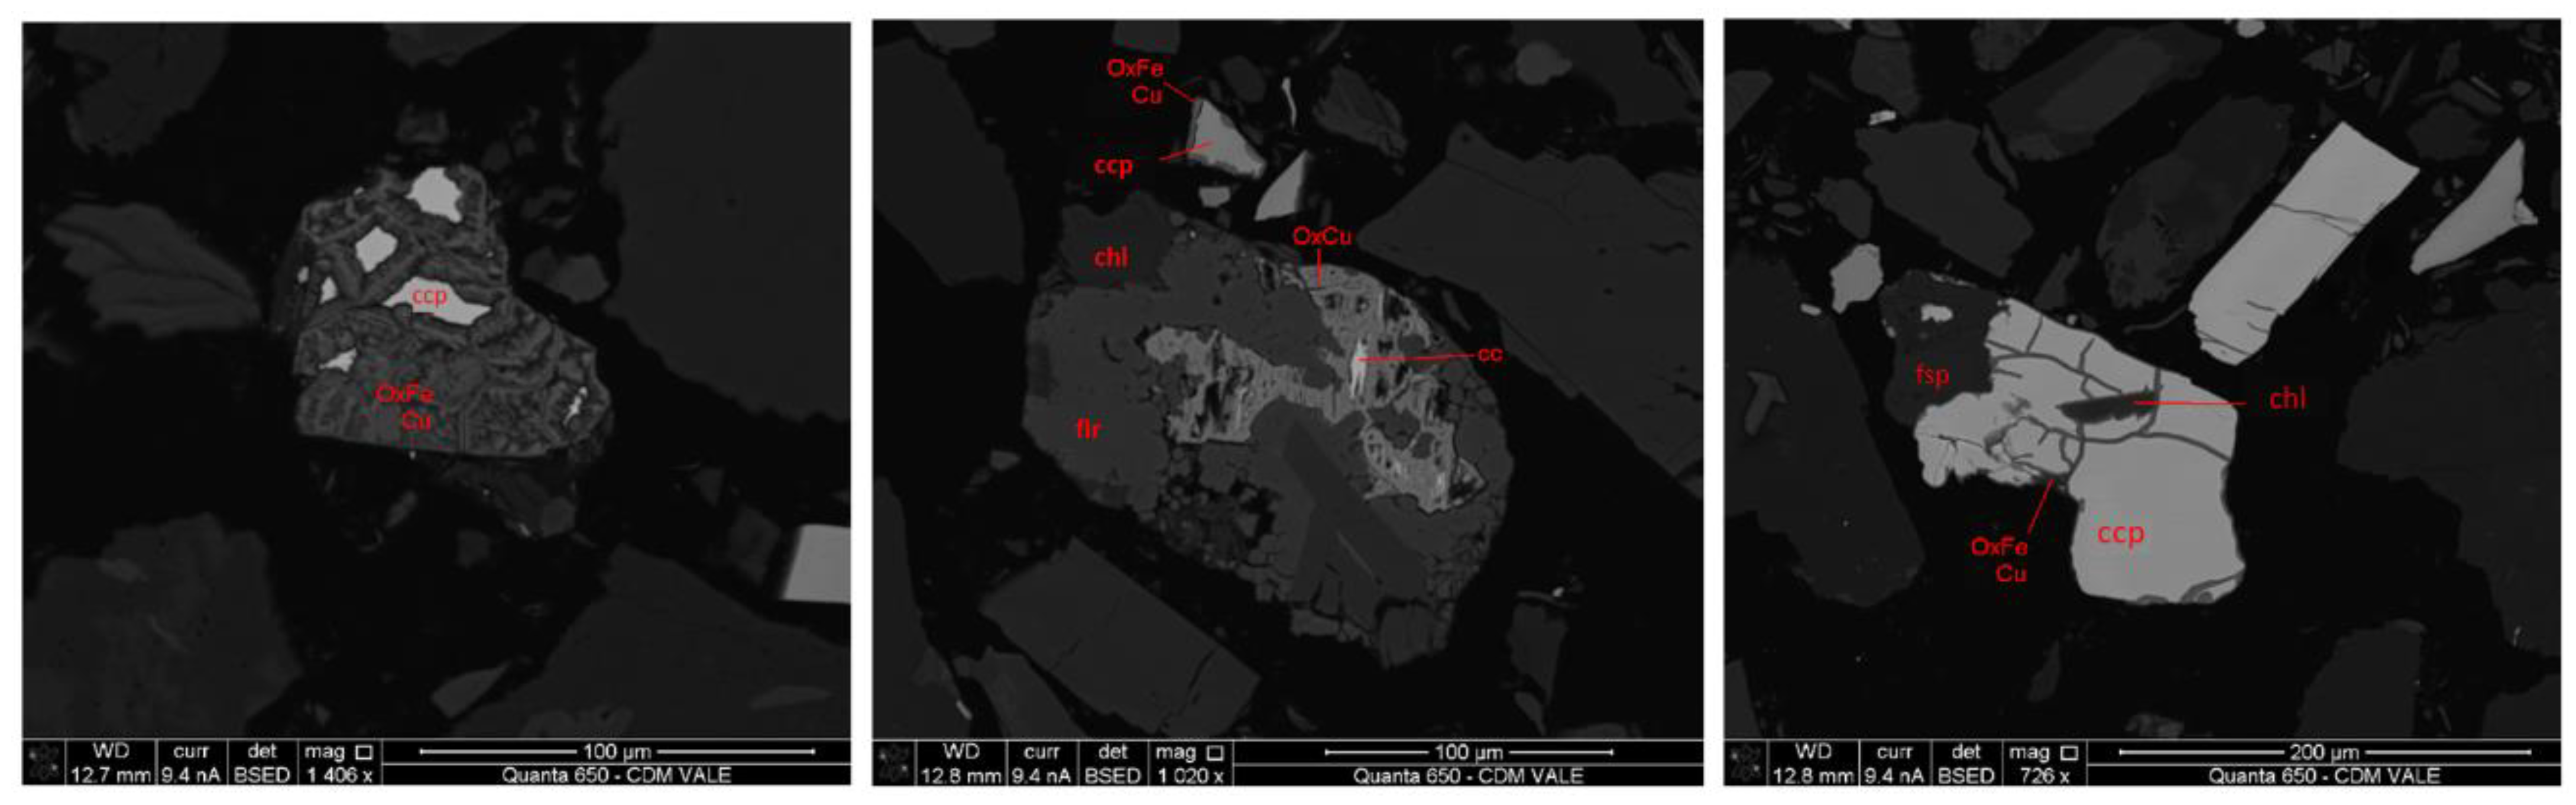
Figure 19.
Backscattered electron images of the rougher tailings of sample 5Y-4m-1 × 0, showing grains of chalcopyrite (ccp) partially altered to Cu-Fe oxides, chalcocite (cc), and those associated with silicate particles (chlorite, chl; fluorite, flr; feldspar, fsp). Complete list of acronyms and chemical formulas in
Table S1.
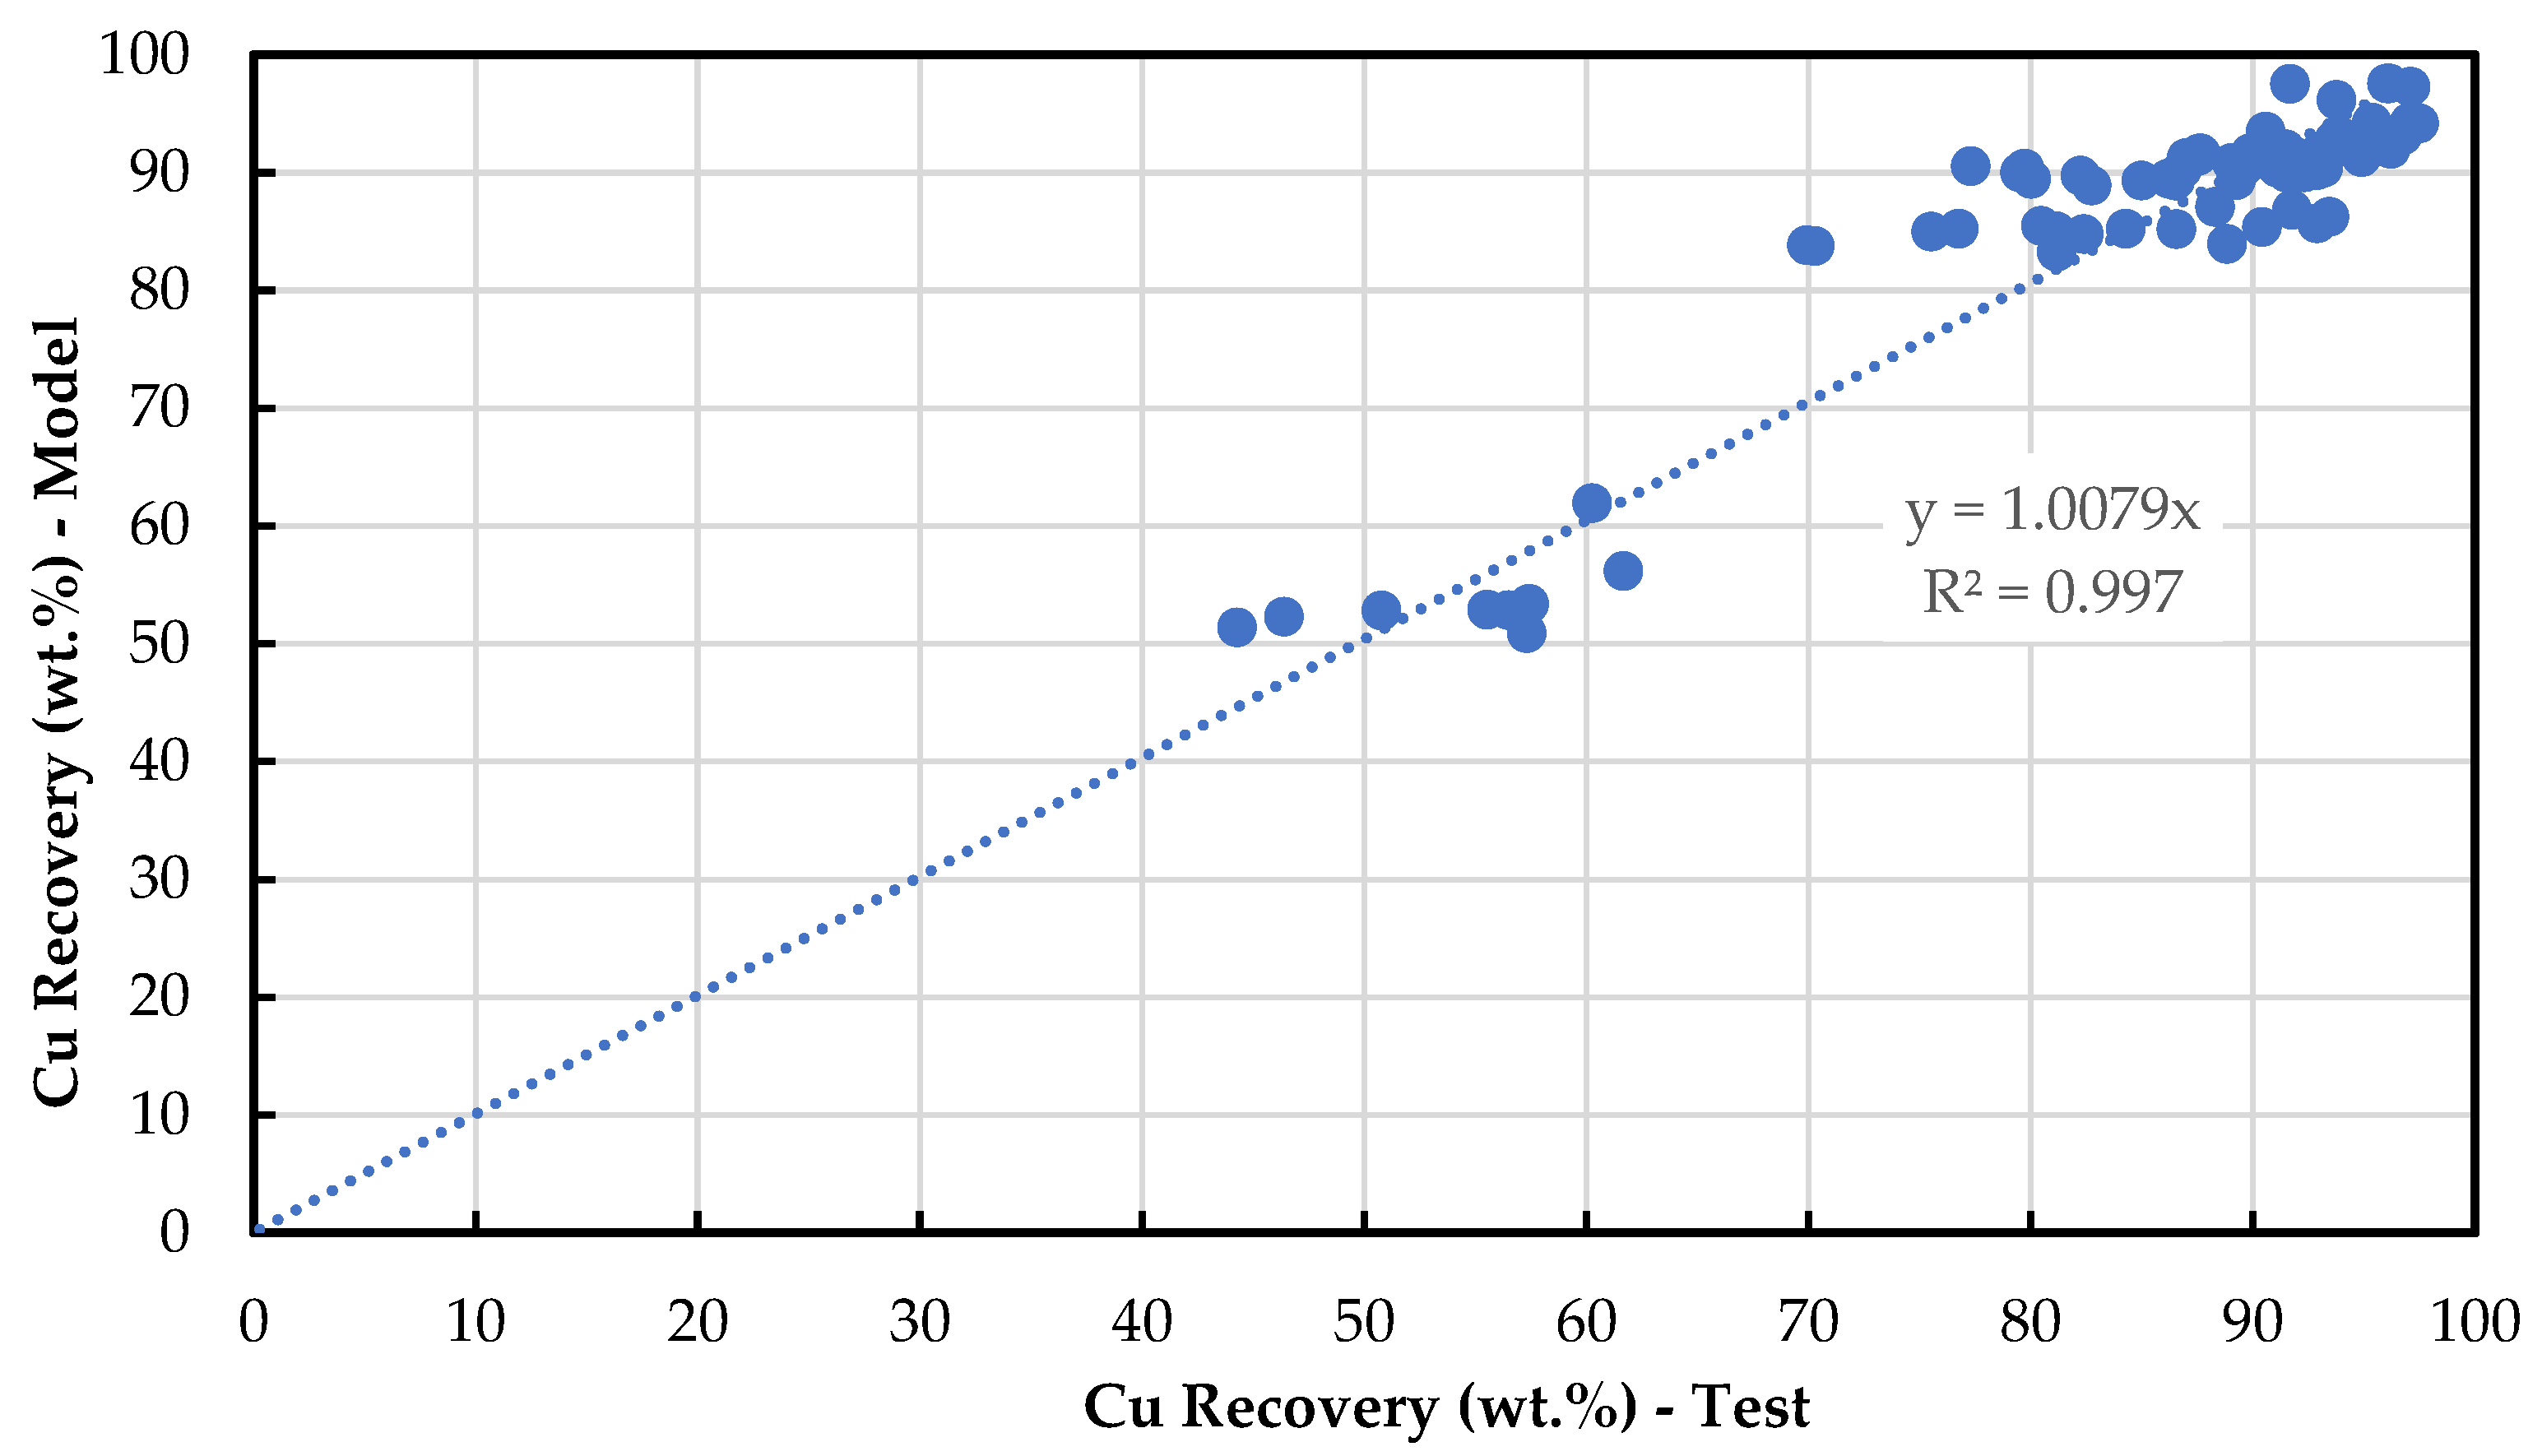
Figure 20.
Copper recovery from the rougher flotation tests versus copper recovery from the model (
Table 9).
Figure 20.
Copper recovery from the rougher flotation tests versus copper recovery from the model (
Table 9).
Figure 21.
Copper recovery of the flotation tests versus predicted copper recovery based on predictions on different size ranges.
Figure 21.
Copper recovery of the flotation tests versus predicted copper recovery based on predictions on different size ranges.
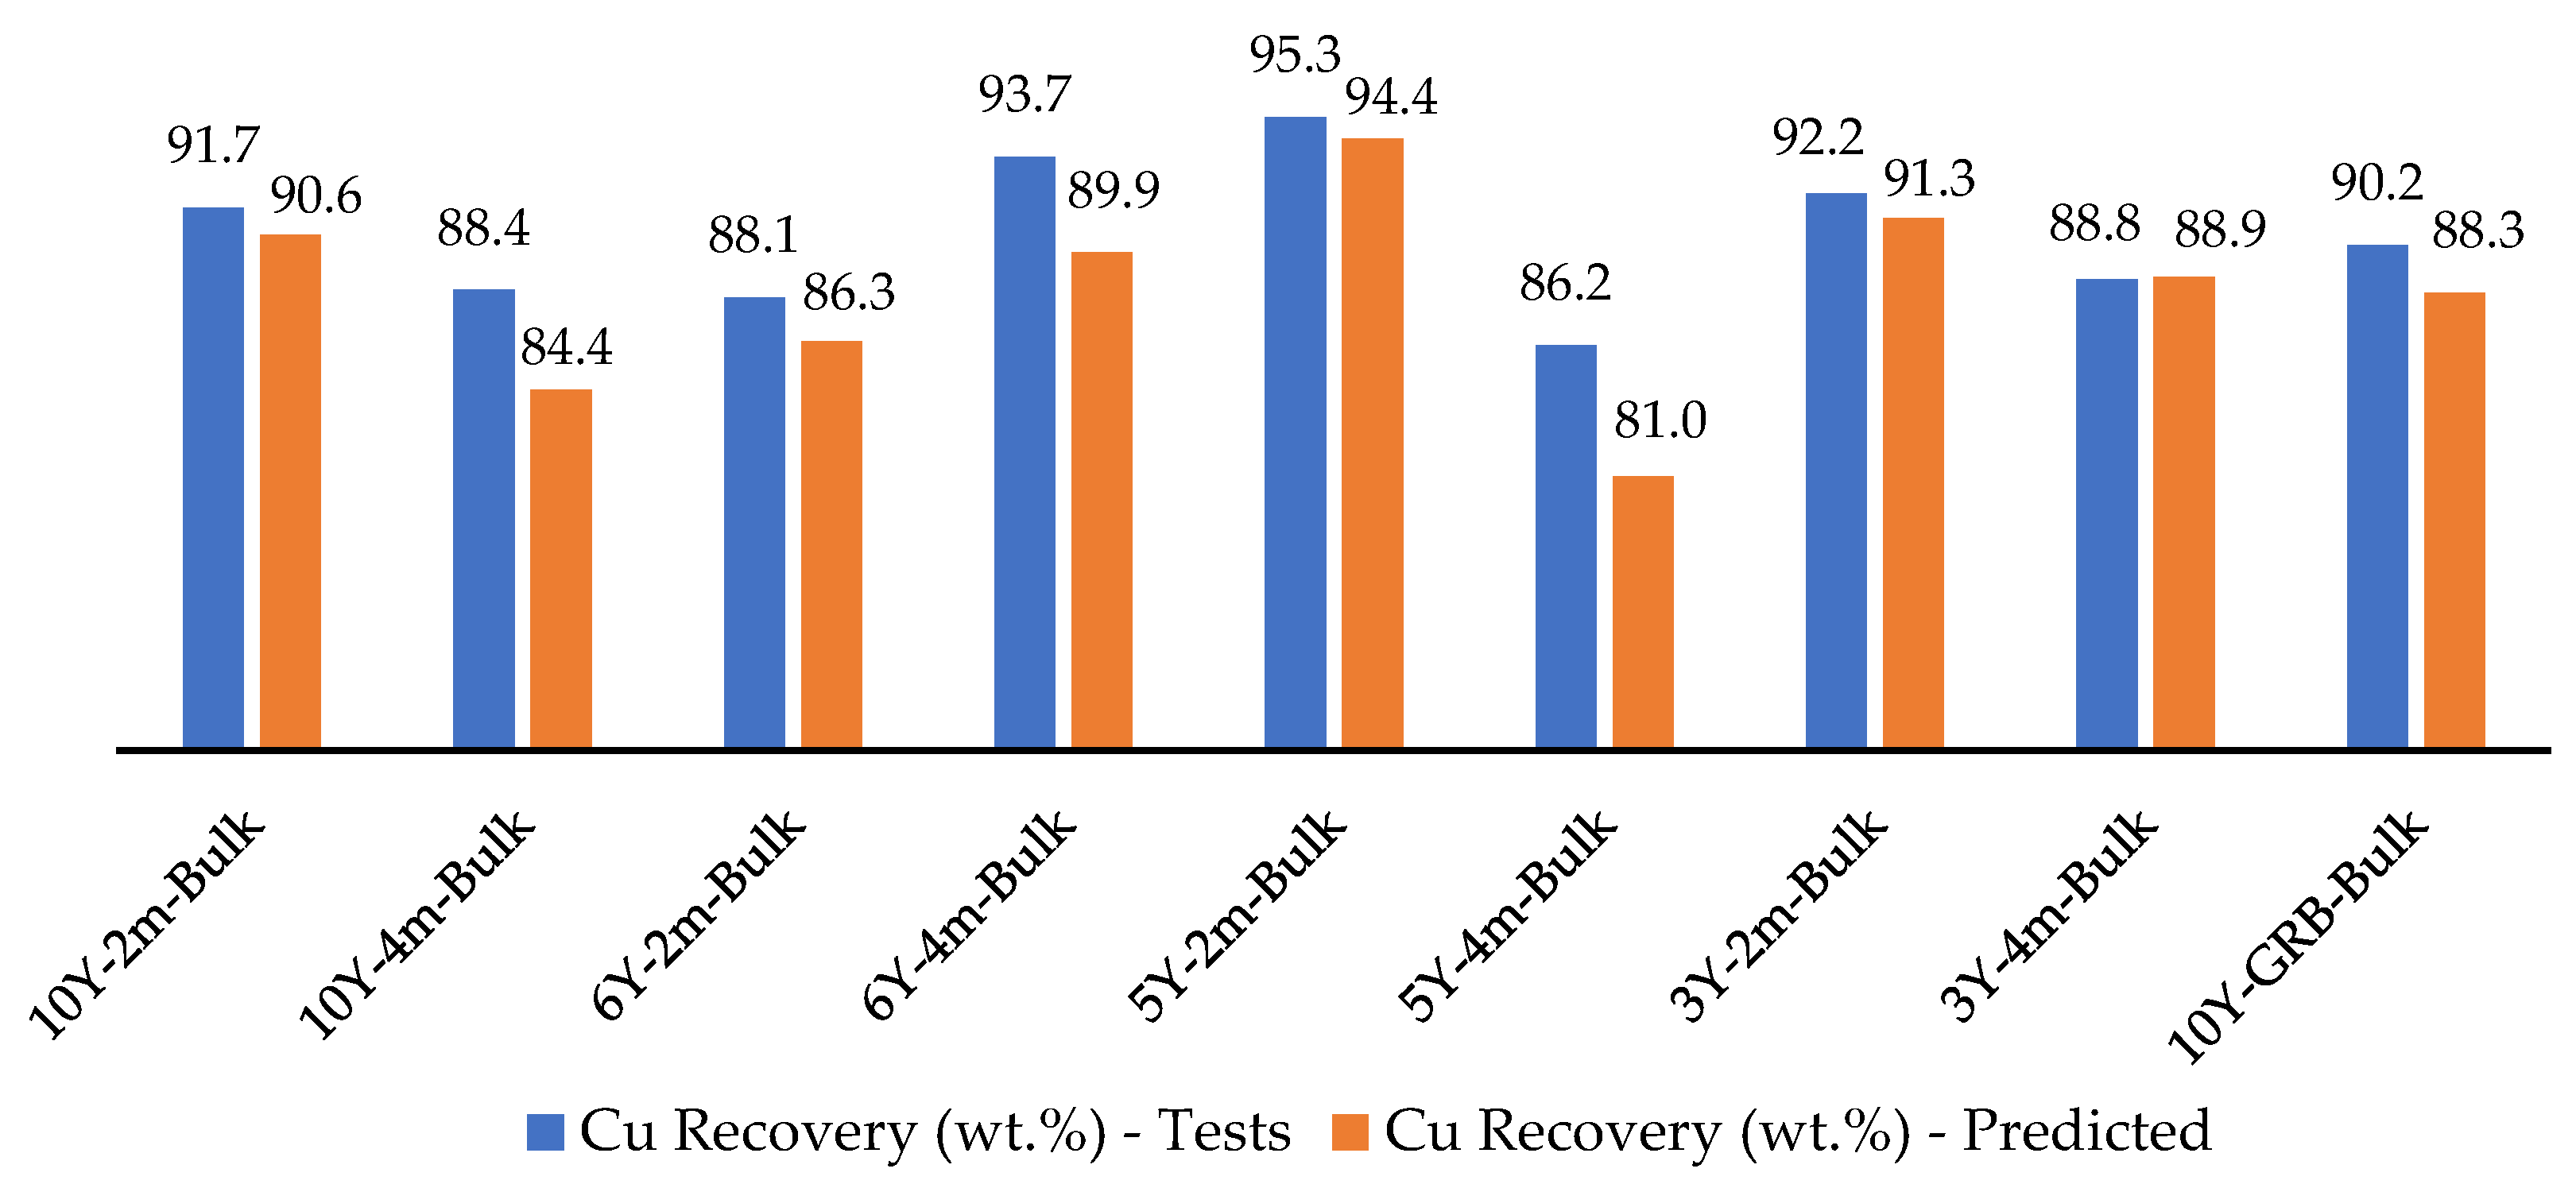
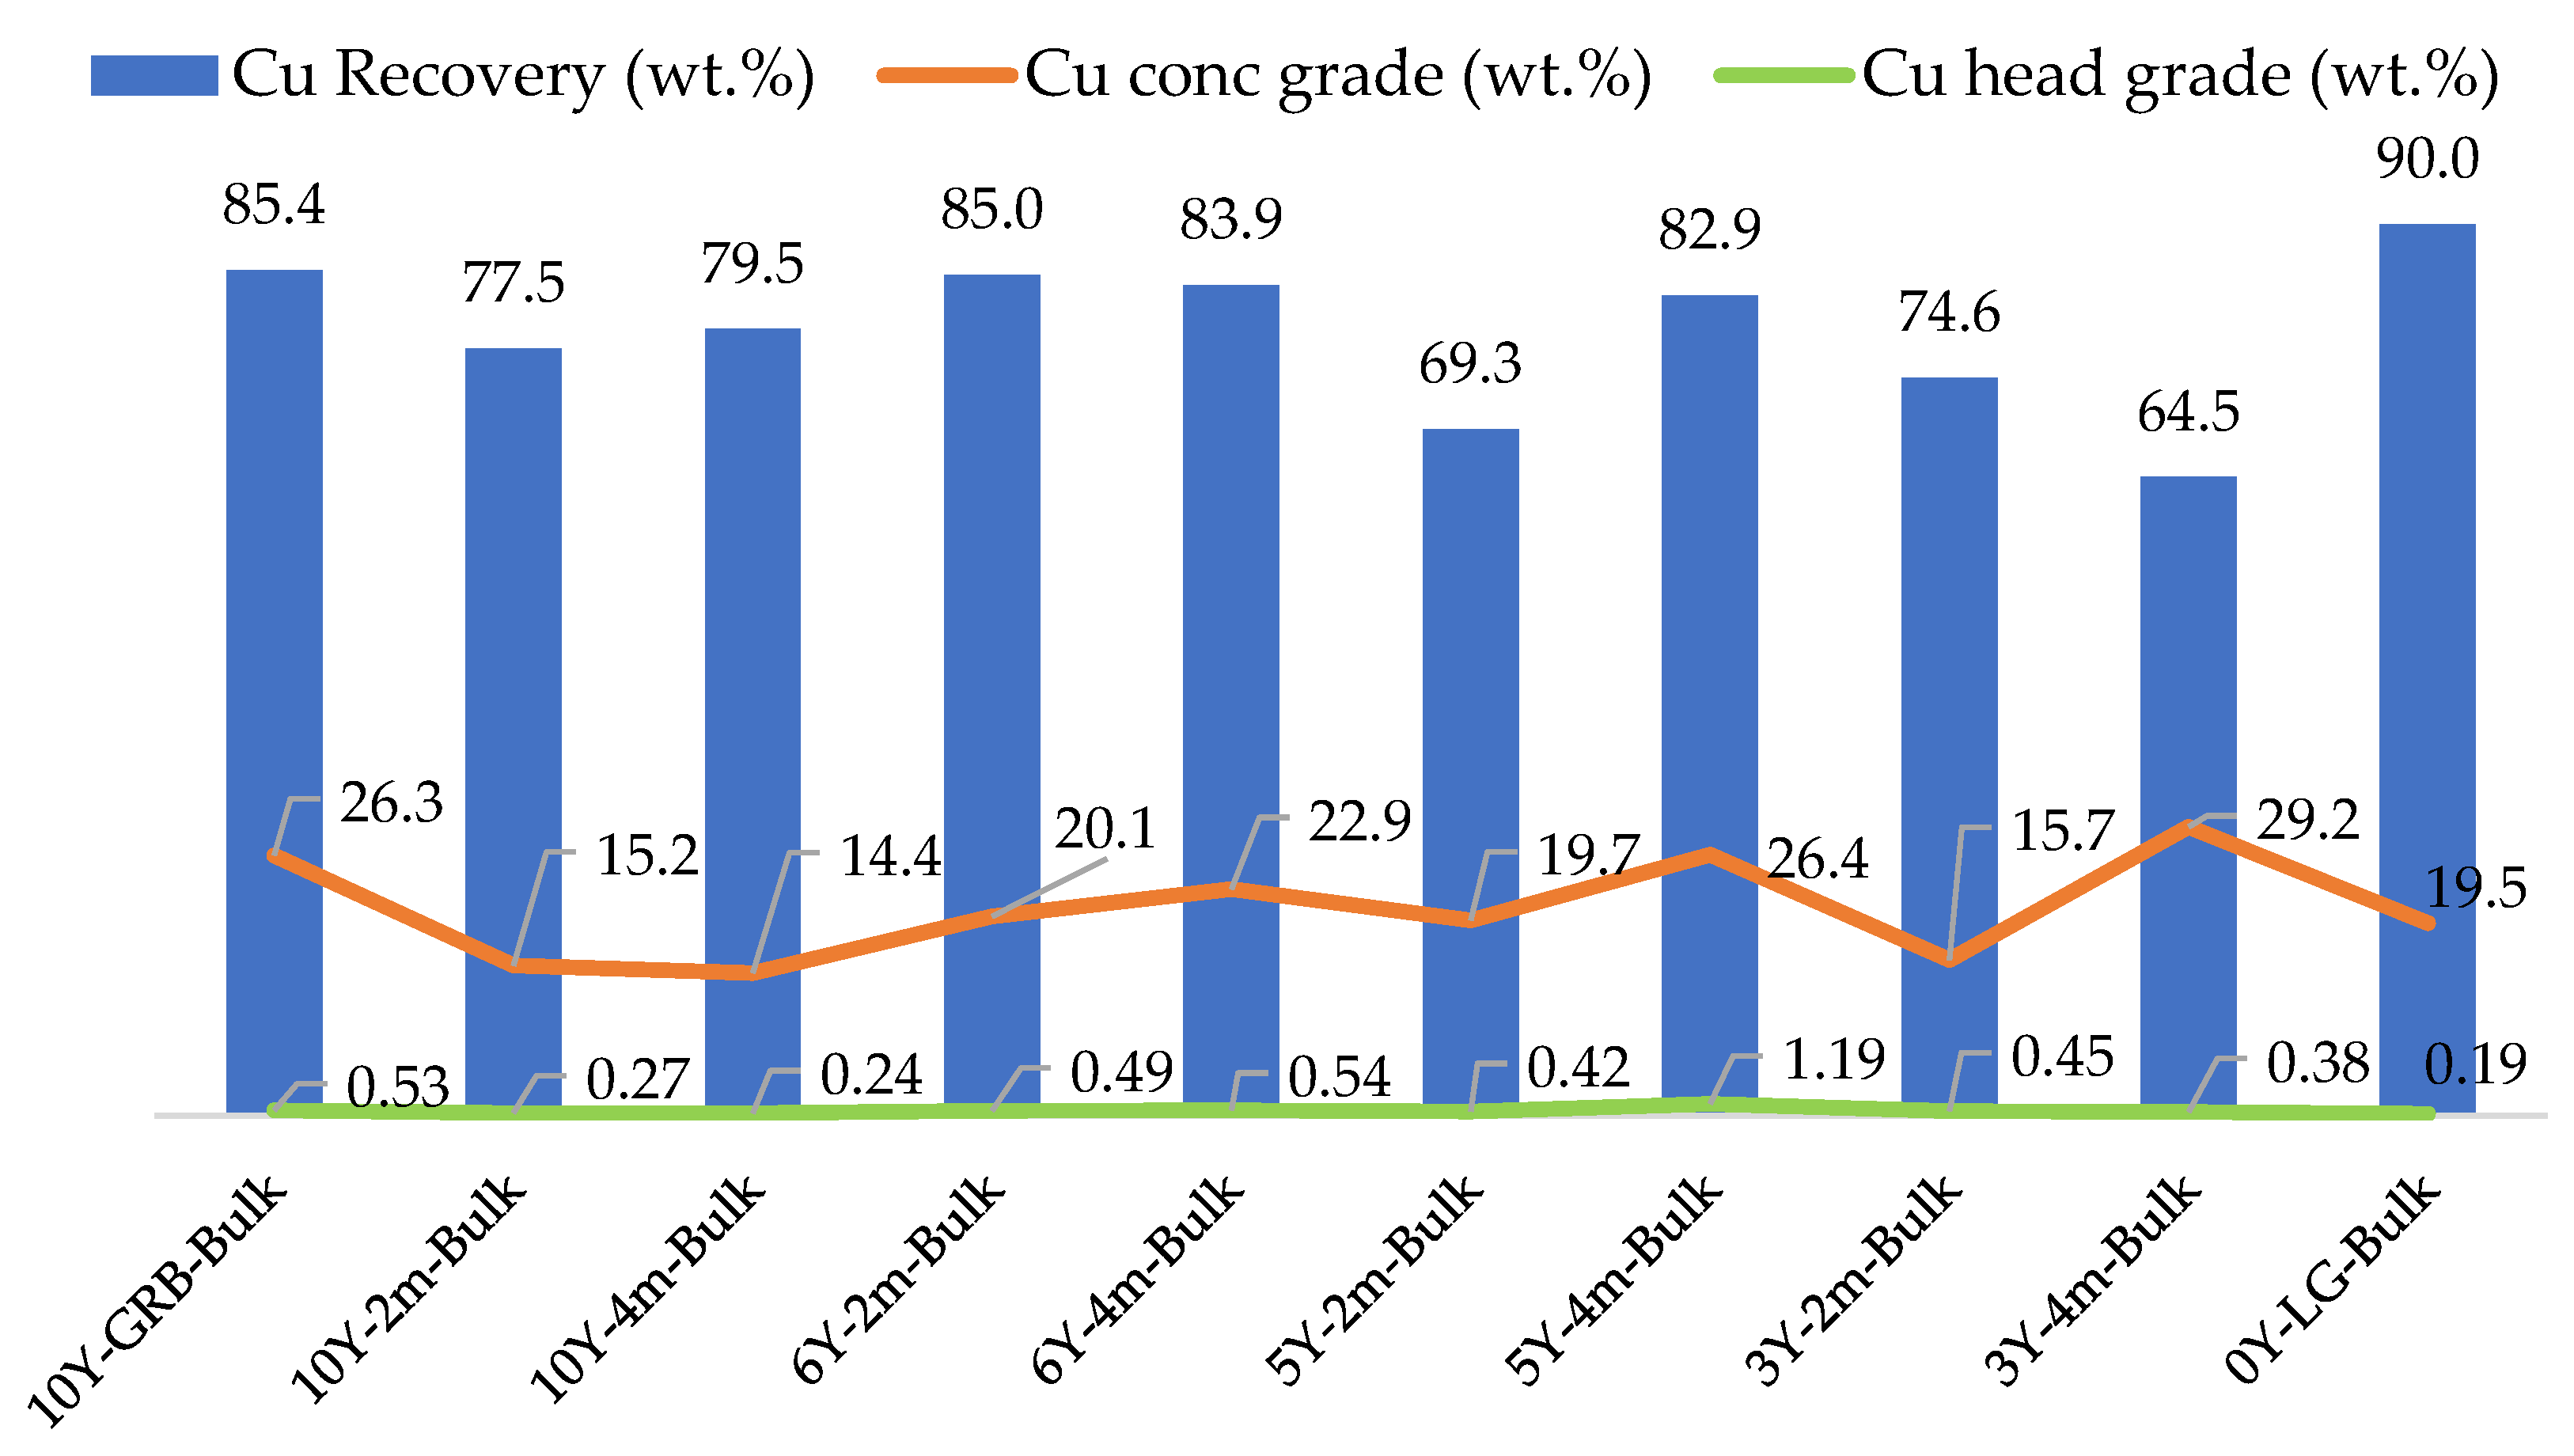
Figure 22.
Results of the locked-cycle tests (
Figure 3) performed in the bulk samples.
Figure 22.
Results of the locked-cycle tests (
Figure 3) performed in the bulk samples.
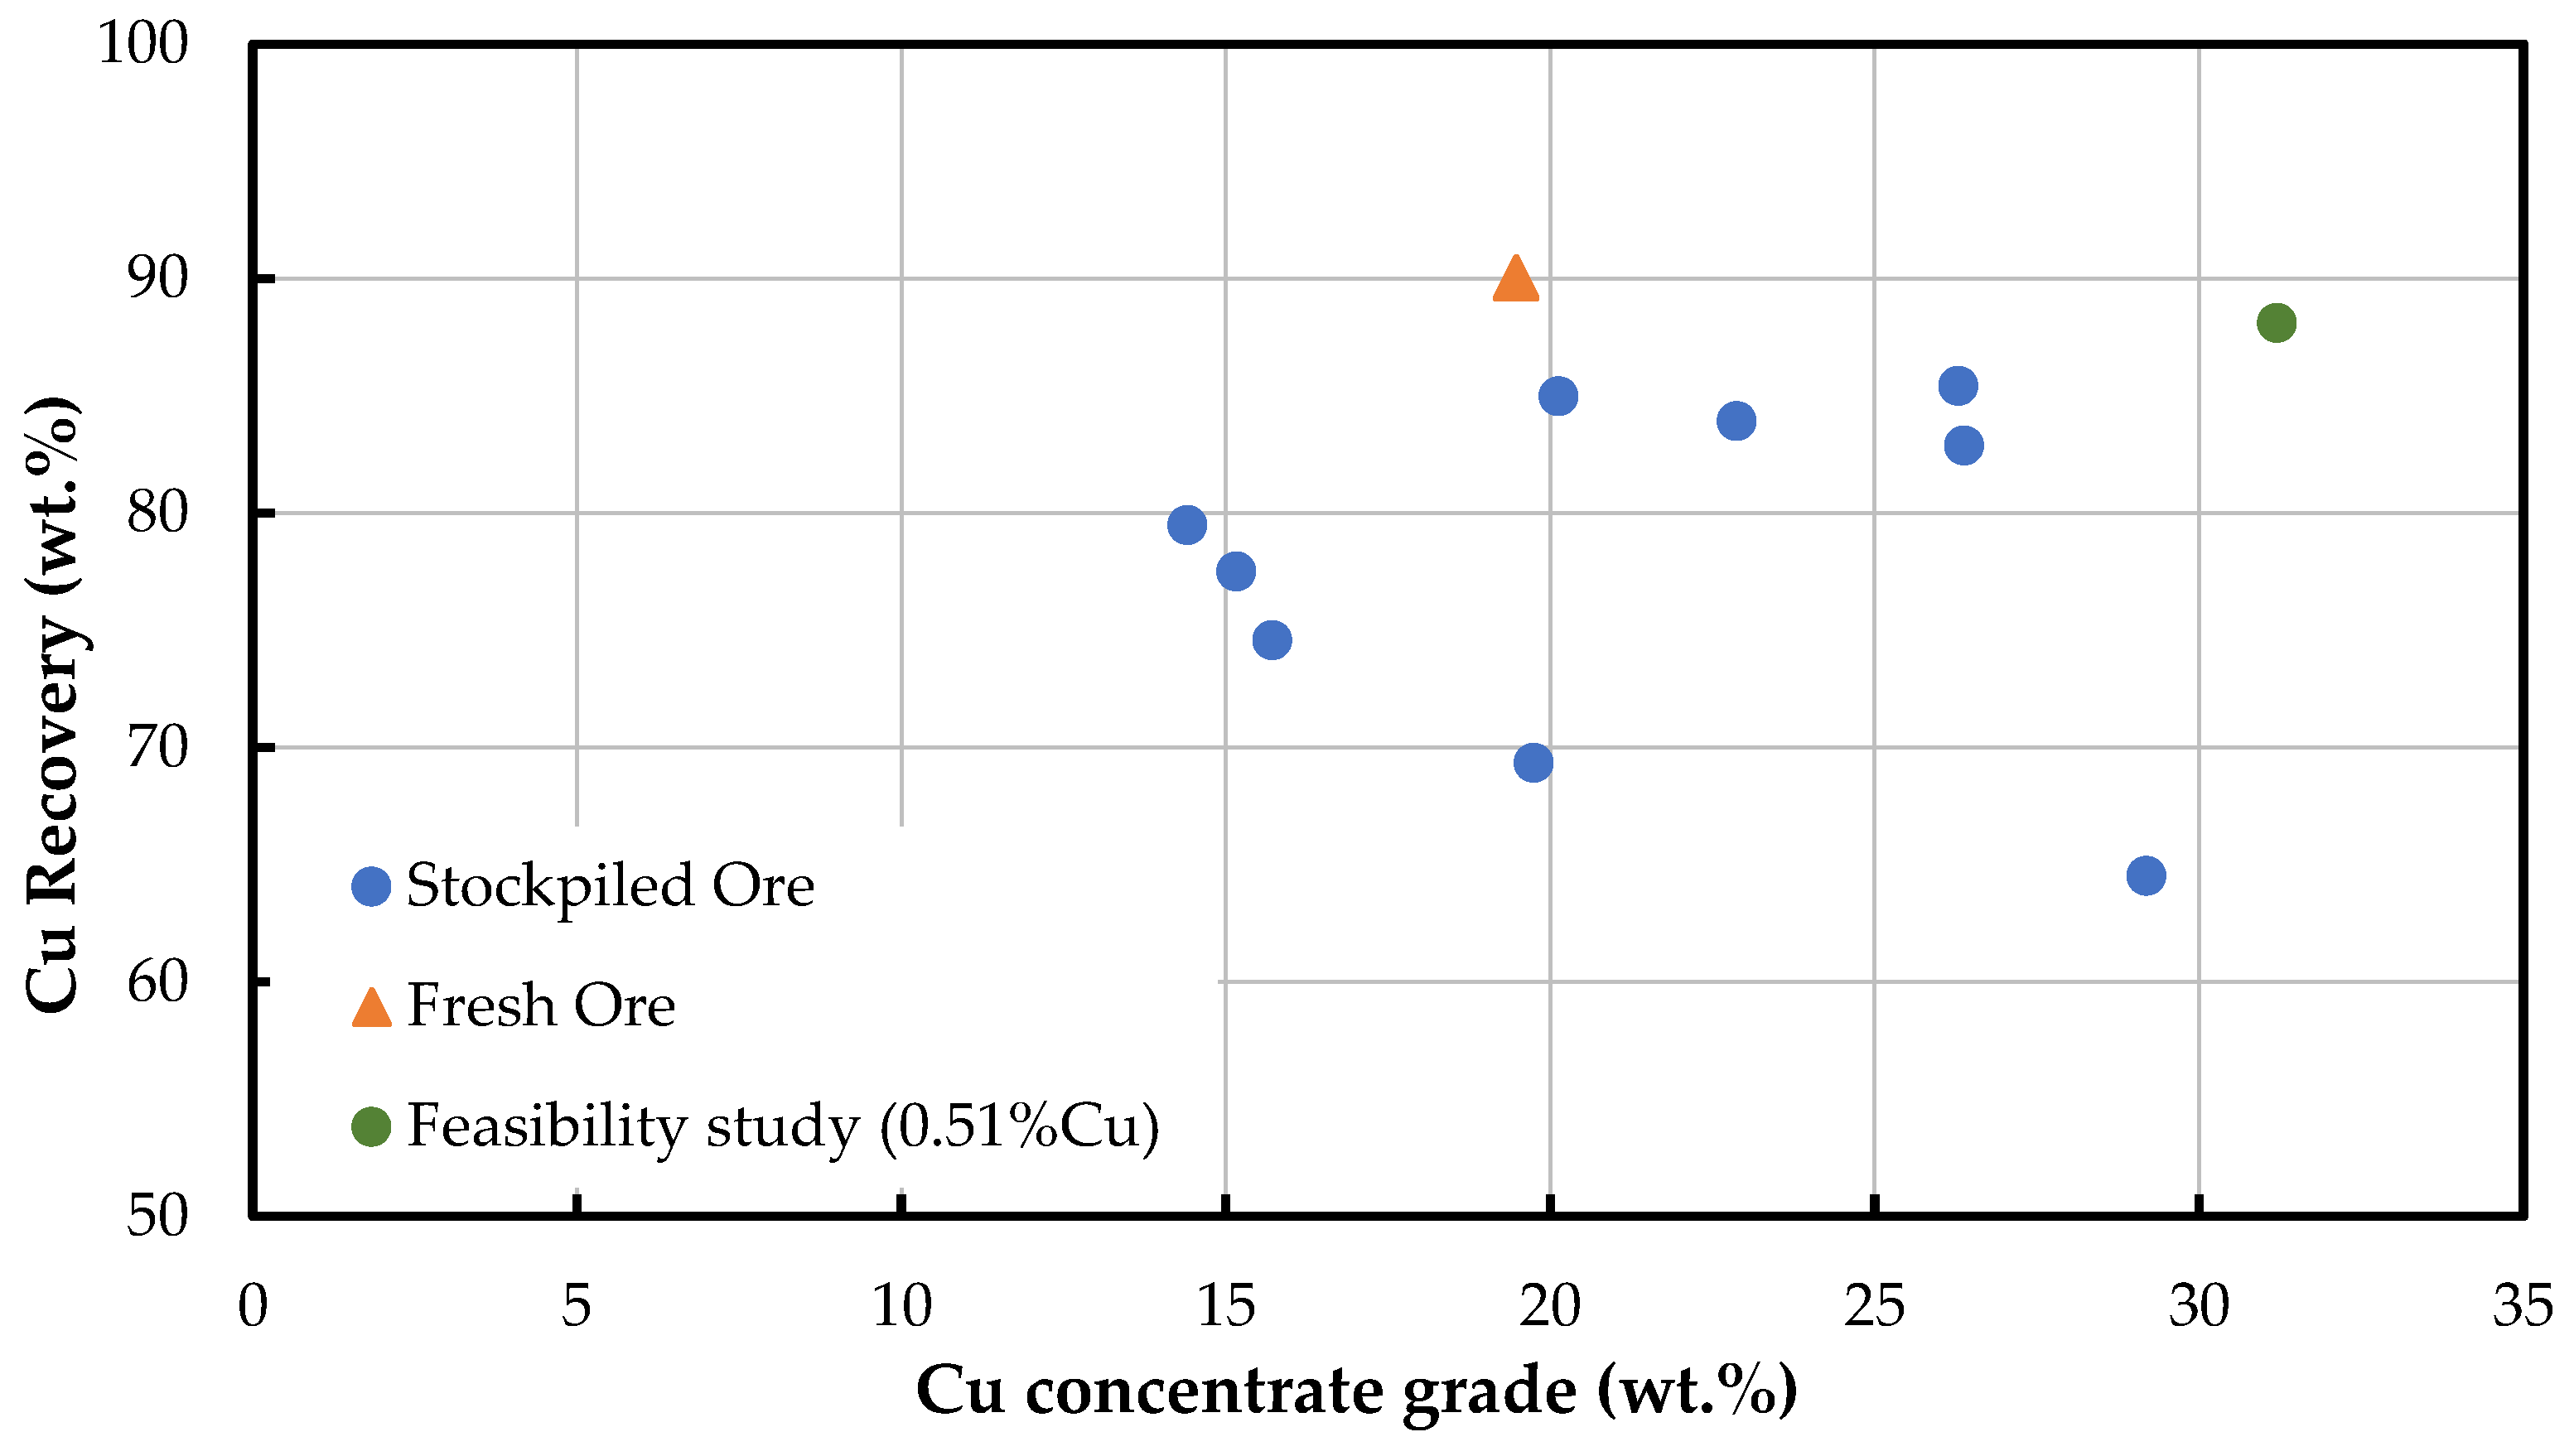
Figure 23.
Copper recovery versus copper concentrate grate from the locked-cycle tests.
Figure 23.
Copper recovery versus copper concentrate grate from the locked-cycle tests.
Table 1.
List of samples, showing the period of stockpiling and the depth from which they were collected in the stockpile.
Table 1.
List of samples, showing the period of stockpiling and the depth from which they were collected in the stockpile.
| Sample Description | Depth | Sample ID |
|---|
| 10 years, low-grade stockpile 2 m depth | 1.9–2.1 (m) | 10Y-2m-Bulk |
| 10 years, low-grade stockpile 4 m depth | 4.0–4.3 (m) | 10Y-4m-Bulk |
| 6 years, low-grade stockpile 2 m depth | 1.4–1.7 (m) | 6Y-2m-Bulk |
| 6 years, low-grade stockpile 4 m depth | 3.8–4.1 (m) | 6Y-4m-Bulk |
| 5 years, low-grade stockpile 2 m depth | 1.9–2.1 (m) | 5Y-2m-Bulk |
| 5 years, low-grade stockpile 4 m depth | 3.7–4.0 (m) | 5Y-4m-Bulk |
| 3 years, low-grade stockpile 2 m depth | 2.0–2.3 (m) | 3Y-2m-Buk |
| 3 years, low-grade stockpile 4 m depth | 3.0–4.2 (m) | 3Y-4m-Bulk |
| 10 years, large volume sample (grab sample) | - | 10Y-GRB-Bulk |
| Low-grade ore from the mine pit (fresh ore) | - | 0Y-LG-Bulk |
Table 2.
Analytical methods used in the chemical analysis of the samples.
Table 2.
Analytical methods used in the chemical analysis of the samples.
| Element | Analytical Methodology |
|---|
| Fe, Si | Calcination carried out in a laboratory muffle furnace at 600 °C, fusion with Na2CO3 and Na2B4O7, reading in ICP-OES, Agilent model 5110 |
| Cu | Total solubilization with aqua regia and reading in ICP-OES |
| S | Direct combustion and reading in Infra-red from LECO model 844 |
Table 3.
Rougher flotation conditions (baseline values, with higher collector dosage in brackets).
Table 3.
Rougher flotation conditions (baseline values, with higher collector dosage in brackets).
| Stage | Time
(min) | pH | Reagent Dosages (g/t) |
|---|
| PAX | DTP | MIBC | PPG |
|---|
| Conditioning 1 | 2 | | 5 (10) | 6 (9) | | |
| Conditioning 2 | 1 | | | | 7 | 7 |
| Rougher A | 3 | 9.5 | | | | |
| Conditioning 3 | 2 | | 3 (6) | | | |
| Conditioning 4 | 1 | | | | 8 | 8 |
| Rougher B | 6 | 9.5 | | | | |
Table 4.
Chemical composition of the bulk samples.
Table 4.
Chemical composition of the bulk samples.
| Sample | Cu (wt.%) | Fe (wt.%) | S (wt.%) | Si (wt.%) | Cu/S |
|---|
| 10Y-2m-Bulk | 0.26 | 5.95 | 0.22 | 26.40 | 1.20 |
| 10Y-4m-Bulk | 0.23 | 7.41 | 0.21 | 26.41 | 1.11 |
| 6Y-2m-Bulk | 0.46 | 4.74 | 0.44 | 30.60 | 1.05 |
| 6Y-4m-Bulk | 0.53 | 7.10 | 0.67 | 26.25 | 0.80 |
| 5Y-2m-Bulk | 0.42 | 4.25 | 0.42 | 29.53 | 1.02 |
| 5Y-4m-Bulk | 1.19 | 10.01 | 1.29 | 24.53 | 0.92 |
| 3Y-2m-Bulk | 0.45 | 13.47 | 0.45 | 21.65 | 1.00 |
| 3Y-4m-Bulk | 0.38 | 12.70 | 0.35 | 21.72 | 1.09 |
| 10Y-GRB-Bulk | 0.53 | 4.71 | 0.52 | 28.32 | 1.03 |
| 0Y-LG-Bulk | 0.18 | 5.72 | 0.20 | 31.59 | 0.94 |
Table 5.
Copper content (wt. %) of the bulk samples by size fraction.
Table 5.
Copper content (wt. %) of the bulk samples by size fraction.
Size
(mm) | 10Y-2m-Bulk | 10Y-4m-Bulk | 6Y-2m-Bulk | 6Y-4m-Bulk | 5Y-2m-Bulk | 5Y-4m-Bulk | 3Y-2m-Bulk | 3Y-4m-Bulk | 10Y-GRB-Bulk | 0Y-LG-Bulk |
|---|
| 150 × 100 | 0.66 | 0.21 | 0.71 | 0.56 | 0.23 | 1.71 | 0.57 | 0.44 | 0.05 | 0.03 |
| 100 × 76.2 | 0.10 | 0.32 | 0.11 | 0.54 | 0.62 | 1.09 | 0.26 | 0.29 | 0.28 | 0.35 |
| 76.2 × 50 | 0.10 | 0.26 | 0.44 | 0.72 | 0.39 | 1.13 | 0.53 | 0.34 | 0.58 | 0.14 |
| 50 × 25 | 0.12 | 0.26 | 0.44 | 0.72 | 0.39 | 1.13 | 0.53 | 0.34 | 0.29 | 0.14 |
| 25 × 12.5 | 0.16 | 0.22 | 0.35 | 0.24 | 0.34 | 1.13 | 0.37 | 0.24 | 0.42 | 0.28 |
| 12.5 × 6.3 | 0.19 | 0.12 | 0.44 | 0.24 | 0.37 | 0.96 | 0.40 | 0.39 | 0.46 | 0.26 |
| 6.3 × 3.35 | 0.22 | 0.15 | 0.45 | 0.23 | 0.36 | 0.99 | 0.41 | 0.39 | 0.52 | 0.34 |
| 3.35 × 1 | 0.33 | 0.21 | 0.62 | 0.36 | 0.39 | 0.98 | 0.39 | 0.42 | 0.59 | 0.51 |
| 1 × 0 | 0.68 | 0.50 | 0.68 | 0.44 | 0.68 | 1.81 | 0.74 | 0.61 | 1.09 | 1.40 |
| Calculated | 0.27 | 0.24 | 0.49 | 0.54 | 0.42 | 1.19 | 0.45 | 0.38 | 0.50 | 0.19 |
| Assayed | 0.26 | 0.23 | 0.46 | 0.53 | 0.42 | 1.19 | 0.45 | 0.38 | 0.53 | 0.18 |
| Diff. (%) | 3.96 | 3.74 | 5.41 | 1.23 | 0.69 | 0.03 | 0.28 | 1.42 | 5.08 | 4.40 |
Table 6.
Liberation of chalcopyrite in selected samples.
Table 6.
Liberation of chalcopyrite in selected samples.
| Sample Identification | Source | Percentage in Class |
|---|
| Liberated | Middling | Locked |
|---|
| 0Y-LG-Bulk | Fresh feed to plant | 72.4 | 8.8 | 18.8 |
| 10Y-GRB-Bulk | Stockpile | 86.7 | 6.1 | 7.2 |
| S1 (0.9%Cu) | Feed to flotation circuit | 93.4 | 1.8 | 4.8 |
Table 7.
Summary of results of the four flotation samples selected for SEM analysis.
Table 7.
Summary of results of the four flotation samples selected for SEM analysis.
| Sample | Feed Cu (wt.%) | Product (wt.%) |
|---|
| Measured | Calculated | Mass Recovery | Cu Conc Grade | Cu Recovery |
|---|
| 5Y-4m-25 × 12.5 | 1.13 | 1.19 | 12.52 | 8.68 | 91.68 |
| 6Y-4m-3.35 × 1 | 0.36 | 0.30 | 7.97 | 2.87 | 75.52 |
| 6Y-4m-1 × 0 | 0.44 | 0.44 | 12.24 | 2.04 | 57.32 |
| 5Y-4m-1 × 0 | 1.81 | 1.86 | 14.59 | 7.69 | 60.27 |
Table 8.
Analysis of the best linear regression subsets.
Table 8.
Analysis of the best linear regression subsets.
| R-Squared | Years | Feed Assays | Depth (m) | Size (mm) |
|---|
| - | Adj | Pred | Cu (%) | S (%) | Fe (%) | Si (%) |
|---|
| 47.5 | 40.8 | 15.4 | x | x | x | x | x | x | x |
| 46.9 | 41.2 | 19.0 | x | x | x | x | x | | x |
| 46.3 | 40.6 | 23.1 | x | x | x | x | x | x | |
| 45.6 | 40.8 | 24.7 | x | x | x | x | x | | |
| 39.1 | 34.8 | 27.1 | x | | | x | x | x | |
| 45.1 | 41.3 | 26.2 | | x | x | x | x | | |
| 35.2 | 31.9 | 25.7 | x | | | x | x | | |
| 35.5 | 32.2 | 16.6 | | x | x | | | | x |
| 27.0 | 24.5 | 19.3 | x | | | | | | x |
| 32.9 | 30.6 | 26.6 | | | | x | x | | |
| 4.3 | 2.7 | 0.0 | | | | | x | | |
| 23.6 | 22.4 | 18.8 | | | | | | | x |
Table 9.
Regression model for copper recovery in the rougher stage for groups of sizes as a function of % Cu in the feed.
Table 9.
Regression model for copper recovery in the rougher stage for groups of sizes as a function of % Cu in the feed.
| Equation # | Size Range (mm) | Equation |
|---|
| (1) | 150 × 6.3 | Cu Recovery (%) = | 88.49 + 8.03 × Cu (%) |
| (2) | 6.3 × 1 | Cu Recovery (%) = | 82.09 + 8.03 × Cu (%) |
| (3) | 1 × 0 | Cu Recovery (%) = | 47.40 + 8.03 × Cu (%) |


