Article

Partial Decision Tree Forest: A Machine Learning Model for the Geosciences

Department of Computer Engineering, Dokuz Eylul University, Izmir 35390, Turkey
*
Author to whom correspondence should be addressed.
Minerals 2023, 13(6), 800; https://doi.org/10.3390/min13060800
Submission received: 20 April 2023 / Revised: 6 June 2023 / Accepted: 10 June 2023 / Published: 12 June 2023

Abstract

:
As a result of the continuous growth in the amount of geological data, machine learning (ML) offers an opportunity to contribute to solving problems in geosciences. However, digital geology applications introduce new challenges for machine learning due to the unique geoscience properties encountered in each problem, requiring novel research in ML. This paper proposes a novel machine learning method, entitled “Partial Decision Tree Forest (PART Forest)”, to overcome these challenges introduced by geoscience problems and offers potential advancements in both machine learning and geoscience disciplines. The effectiveness of the proposed PART Forest method was illustrated in mineral classification. This study aims to build an intelligent ML model that automatically classifies the minerals in terms of their crystal structures (triclinic, monoclinic, orthorhombic, tetragonal, hexagonal, and trigonal) by taking into account their chemical compositions and their physical and optical properties. In the experiments, the proposed PART Forest method demonstrated its superiority over one of the well-known ensemble learning methods, random forest, in terms of accuracy, precision, recall, f-score, and AUC (area under the curve) metrics.

1. Introduction

Geoscience is the study of the Earth by examining the processes that form and shape the Earth’s surface, the natural resources we use, and how water and ecosystems are interconnected. It has a broad scope that includes sciences such as geology, geophysics, geochemistry, paleontology, structural geology, mineralogy, petrology, stratigraphy, sedimentology, hydrogeology, and remote sensing.
Machine learning is applied in a wide range of areas to analyze vast and complex datasets by detecting hidden patterns in data while eliminating the need for explicit instructions and programming. Geoscience is one of these fields in that machine learning was carried out. For example, in [1], a geophysical survey on rock classification was handled by employing support vector machine (SVM), random forest (RF), extreme gradient boosting (XGB), light gradient-boosting machine (LGBM), and deep neural network (DNN). The study in [2] conducted geochemical analysis through the total organic carbon prediction (TOC) using RF, extreme learning machine (ELM), and back propagation neural network (BPNN). Reservoir simulation to explore the CO2 storage capacity in deep saline aquifers was made using artificial neural networks (ANN) in [3]. Land cover change mapping was done by performing ensemble learning methods, RF, and XGB in [4]. Mineral prospectivity was modeled using RF, SVM, ANN, and deep convolutional neural network (CNN) in [5]. Especially neural network models and ensemble learning strategies were applied because of their successful predictive performance. Traditional statistical methods cannot detect the complex and nonlinear relationships inherent in the geoscientific data because they assume linearity while solving problems; however, machine-learning-based models are generally a better alternative for these kinds of problems [6,7,8]. Furthermore, the missing data problem, which is frequently encountered in Earth sciences when the data is difficult to access or collect, may not be handled by statistical methods, as opposed to machine learning methods, which can easily infer them [6,8,9,10]. Moreover, machine learning can significantly reduce the manual tasks done by experts in the field and prevent systematic bias resulting from human errors [11,12]. For these reasons, a machine-learning-based strategy is introduced in this study to address a geoscientific issue.
This work focuses on the problem to identify the crystal structure of a given mineral. Minerals are the building blocks of the Earth’s crust and the other terrestrial planets in such a way that rocks are formed by the combination of minerals, and mountains and continents are formed by the combination of rocks. Minerals have certain distinctive properties. The best way to definitively diagnose a mineral is to look at its chemical composition. They are commonly composed of different chemical bonds (i.e., sodium chloride, and NaCl) or only one element can form a specific mineral, such as in native gold (Au). However, the analysis of chemical compositions is both troublesome and costly for geographers or geologists working in the field. On the other side, minerals also have other introductory features that greatly facilitate the identification of minerals for a geoscientist doing fieldwork. This important property that helps geologists identify a mineral in a rock can be their crystal systems. Minerals are formed in well-arranged, geometrical inner atomic structures, called crystal structures, that can be assumed as unit cells like the ones in our bodies or the smallest reproducible patterns to form crystals of a mineral. The cells are repeated in all directions to form a geometric pattern by considering the lengths of the axes and the angles between the atoms (orientation between the crystal faces) [13]. There are seven crystal systems based on their symmetry: isometric (cubic), trigonal (rhombohedral), hexagonal, tetragonal, orthorhombic, monoclinic, and triclinic. Which crystal structure a mineral should belong to in the experimental study is predicted using the information of both materials’ characteristics and chemical compositions by applying a machine learning classifier.
The main contributions of this study are mentioned as follows:
  • An ensemble-based classifier, Partial Decision Tree (PART) Forest, was introduced to handle a geoscientific problem.
  • Minerals’ crystal structure was predicted from two distinct points of view by considering either only the chemical compositions or only the materials’ characteristics or by making use of both features.
  • The proposed PART Forest method outperformed the standard PART classifier and the RF classifier, which is one of the most applied methods under ensemble learning, on the given dataset.
The remaining parts of this paper are structured as follows. In Section 2, the studies related to the identification of the crystal structures of minerals are discussed. In addition, the reason why the PART method was preferred as the base classifier of the proposed ensemble model in our study, is discussed by presenting the results obtained in past studies carried out successfully in different fields. The methodologies applied in the proposed approach are explained in detail in Section 3. The description of the dataset used in the study is given in Section 4. The experimental results and a general discussion are presented in Section 5. The final comments and future directions are addressed in the conclusions.

2. Related Work

In this section, the studies in the literature will be examined under two topics, which are, the studies on minerals’ crystal structure classification and the studies taking the PART classifier as the main subject.

2.1. Recent Studies Related to Minerals’ Crystal Structure Classification

Several machine learning models were proposed for crystal structure classification in the literature. Jarin et al. [14] implemented machine learning algorithms with the objective of the classification of crystal structures and the prediction of their lattice parameters considering the ABO3 perovskite materials. In the experiments, the basic atom characteristics were taken into consideration. A total of 2225 datasets including 222 experimental datasets and 2003 theoretical datasets were chosen for experiments. The considered crystal structures were cubic, rhombohedral, tetragonal, and orthorhombic, whereas atomic number, valance, ionic radii, electronegativity, and polarizability constituted the feature list. RF, SVM, neural network (NN), and genetic algorithm (GA) supported neural network (GA-NN) were applied for the classification task, while SVR and GA-SVR were used in the determination of the lattice parameters. They reported that the GA-NN model achieved the most accurate classifications with an accuracy of ~88% on average, whereas GA-SVR ideally estimated the lattice parameters with high accuracy (~95%) on average when training and test sets were divided by the 80:20 partition and using five-fold cross-validation on the test set. The same problem was handled in the research of Priyadarshini et al. [15]. Seven machine learning models, including KNN, DT, NB, SVM, MLP, XGB, and LGBM, were applied to the dataset with 675 compounds out of 5329 instances and 15 attributes, including valence, radius, electronegativity, bond length, new tolerance factor, Goldschmidt tolerance factor, lowest distortion, octahedral factor, and electronegativity difference with radius. In terms of accuracy, precision, recall, and F1-score, XGB correctly classifies most of the samples into four categories compared to others by giving the most acceptable results. In another study [16], three types of features based on composition information, namely Materials Agnostic Platform for Informatics and Exploration (Magpie), atom vector, and atom frequency, were used to predict crystal systems and space groups for an inorganic material. RF and MLP models were experimented with and evaluated with the metrics accuracy, precision, recall, F1-score, Matthew’s correlation coefficient (MCC), and exact match ratio using four setups: one-versus all binary classifiers, multiclass classifiers, multilabel classifiers, and polymorphism predictors. It was stated that RF with Magpie features generally obtained the best performance for binary and multiclass predictions of crystal systems and space groups. On the other side, MLP models with atom frequency features and binary relevance with Magpie features were better than others, considering scenarios of structural polymorphism prediction and multilabel prediction, respectively. Corriero et al. [17] developed a machine-learning-based web platform, CrystalMELA, that runs RF, CNN, and extremely randomized trees (ExRT) models for crystal system classification. The system learned from simulated powder X-ray diffraction patterns taken from about 280,000 organic, inorganic, and meta-organic compounds and minerals found in the POW_COD database. They obtained Top-2 accuracy in addition to accuracy, F1-score, precision, and recall metrics. According to the results, CNN outperformed the other models for organic and full datasets by approximately 70% accuracy and over 90% Top-1 accuracy, whereas ExRT was the best predictor for the inorganic dataset. From a different point of view, Li et al. [18] dealt with the prediction of both the crystal system and space group of inorganic materials by inputting the formulas of the crystal materials by introducing a new set of materials composition-based descriptors combined with Magpie descriptors. In addition to the element property statistics of Magpie and additional predictors of Magpie, they added several predictors such as total atom number, maximum/minimum/average atom number, and specific value. An amount of 125,276 inorganic material items were handled by dividing them into seven categories according to their geometric forms and 230 different combinations of symmetrical elements. A total of 10,412 unrepeated formulas that had isomers in the dataset were used. RF, XGB, and deep learning models were implemented in the experiments. Their results showed that the model based on RF using their new descriptor set obtained the best accuracy values between 71.20% and 96.10% in terms of space group classification. Crystal system prediction was also managed successfully compared to recent studies. Aguiar, Gong, and Tasdizen [19] established a deep learning hierarchical-based model to classify crystal structure using either or combined descriptors of material structure (diffraction) and chemistry. CNN model was used to capture the diffraction inputs, whereas a number of dense layers were used to capture the chemistry. Family-level and genera-level ablation results were obtained. Their proposed method predicted the space group information with an accuracy above 85% and outperformed the other models such as SVM, RF, and NB.
The general inference related to the aforementioned studies is that neural network models and ensemble learning models such as RF and XGB are usually implemented to identify the crystal systems because of their predictive power. In this direction, we propose a different ensemble learning strategy that is a candidate to substitute RF in the problems of crystal structure determination by attaining satisfactory results in our study.

2.2. Recent Studies Taking the PART Classifier as the Main Subject

At this time, different types of decision tree algorithms have been proposed under machine learning. Partial Decision Tree (PART) is one of these algorithms. When the previous studies are examined, it is seen that successful results have been obtained by using the PART algorithm in many domains such as transportation [20,21,22], intrusion detection [23,24], text categorization [25,26], etc. In this section, some of these studies are reviewed.
One of the most studied domains using the PART method is transportation. Taamneha et al. [20] compared the classification algorithms, including DT, PART, MLP, and NB, to predict the injury severity of road accidents in Abu Dhabi. A set of rules were generated to recognize the primary factors that determined the accident severity. According to the results, PART, MLP, and DT had a similar performance in predicting the severity of the injury, whereas NB had the least accuracy. Likewise, Krishnaveni and Hemalatha [21] aimed at predicting the severity of injuries caused by traffic accidents. The records of traffic accidents that were provided by the transportation department of the government of Hong Kong were used for this aim. The algorithms including NB, AdaBoostM1, PART, J48, and RF were applied in the experimental part. The test results demonstrated that the RF and PART algorithms outperformed other classification algorithms regarding classification accuracy. Similarly, Pirdavani et al. [22] compared DT, PART, repeated incremental pruning to produce error reduction (RIPPER), and binary logistic regression to predict the probability of crash occurrence on motorways. Experimental results showed that the PART classifier performed the best compared to other models by obtaining the maximum MCC value.
In [23], an intrusion detection system was constructed to identify the internal attacks in an organization. A novel ensemble learning method was proposed by combining three base classifiers and using the average probability rule combination for this aim. Their proposed method performed better than the base learner of the ensemble model in terms of accuracy on the test dataset. Additionally, the PART classifier offered the best predictions on the training dataset. Kareem and Jasim [24] introduced a new method to detect DDoS attacks fast and accurately by utilizing feature selection techniques. Reducing the number of features improved performance in terms of speed and memory. PART was the most optimal method for detecting DDoS attacks with an accuracy of over 99.77%.
Considering the text categorization problems, a research paper [25] examined various rule-mining methods for Arabic text classification. After analyzing the results, it was discovered that the PART algorithm outperformed the other classification algorithms (C4.5, RIPPER, and one rule (OneR)). In addition, it achieved higher precision than C4.5, RIPPER, and OneRule algorithms by 1%, 2%, and 53%, respectively. Furthermore, in [26], a new feature subset selection approach PARTFS was presented for email categorization. This method used the PART algorithm to reduce the feature space in a setting where multiple email categories were classified.
In addition, to detect complex event patterns from streaming data such as sensor, log, or RFID data, Mehdiyev et al. [27] applied various rule-based machine learning approaches including OneR, RIPPER, PART, and non-nested generalized exemplars (NNGE). The PART algorithm achieved the greatest accuracy by correctly classifying 93.14% of the instances, as indicated by the findings.
The reason for choosing the PART algorithm as the base classifier in our study is that, as stated in the mentioned studies, it can achieve successful and satisfactory results. Moreover, it can offer many advantages over other decision tree algorithms stated as follows:
  • Handling noisy data: The PART algorithm is capable of dealing with noisy data by generating rules that account for exceptions. This enables the algorithm to create rules that encompass the majority of the data, while also taking into account any outliers or noise present in the dataset [28].
  • Efficiency: The PART algorithm is computationally efficient since it does not try to locate the globally optimal attribute at each node; instead, it selects the attribute that gives the best accuracy on the current subset of data [28,29].
  • Interpretability: The PART algorithm generates rules that are easy to interpret. The resulting decision tree can be converted into a set of IF–THEN rules that are easy to understand [25].
  • Flexibility: The PART algorithm allows the users to set various parameters to control the generated tree, such as the minimum number of instances required to split a node and the maximum number of rules permitted in the decision tree [28].

3. Materials and Methods

3.1. Proposed Method

The decision tree is a widely recognized method for classification and prediction tasks in the fields of machine learning, data science, statistics, and pattern recognition [30]. The PART algorithm generates partial decision trees from a given dataset in a way that all the attributes are not required to be used in every node of the tree. On the other side, the ensemble model random subspace creates randomly selected feature subsets, providing low-correlated multiple learners. In this study, we propose an ensemble learning approach, namely PART Forest, which is based on a random subspace algorithm by selecting PART as its base learner.
Figure 1 shows the general overview of the knowledge discovery process developed for the geoscientific problem presented in this study by using the proposed PART Forest algorithm. In the first stage, the acquisition of data in the field of geoscience is demonstrated. The problem is mineral prediction by obtaining properties such as various structures and sequences of minerals. In the second stage, the collected data is pre-processed by applying transformation when needed and removing the missing or duplicate data to reach clean data. In the next stage, the proposed method PART Forest is illustrated step by step. Firstly, random subsets are generated from the initial feature space in the training data to the extent that the subspace size allows. After that, partial decision trees are constructed from randomly chosen subspaces. The PART algorithm uses the separate-and-conquer method to generate a set of rules and creates a partial decision tree in each iteration for the current set of instances, and the largest coverage leaf is converted into a rule. Predicted labels are obtained from each partial classifier. After majority voting, the final class label is predicted. In the final stage, performance evaluation metrics are used for assessing the efficiency and robustness of the proposed method.

3.2. Formal Definitions

The main objective of the PART Forest approach is to obtain accurate classifications by leveraging the benefits of ensemble learning. This ensemble model is achieved by combining the random subspace and PART algorithm.
Definition 1.
(random subspace) The random subspace method tries to reduce the correlation between different models in a population by training them on random samples of features rather than the entire feature set.
Definition 2.
(partial decision tree) The PART algorithm builds a partial tree by recursively splitting the data into smaller subsets and generating rules. It is a hybrid algorithm that integrates elements of both rule-based and decision tree-based learning. It is a combination of RIPPER and C4.5 algorithms and has no need for global optimization they need. The strategy employed by the algorithm involves dividing the input space into separate, non-overlapping subsets in a recursive manner and then creating decision rules for each subset.
We supposed that D is a dataset with m instances and n attributes, where an instance can be described by a vector of attribute values: D = {x1, x2, …, xm}, xi = (xi1, xi2, …, xin). We let C be the set of class labels C = {c1, c2, …, ck}, where k is the number of classes. We assumed that T is a decision tree and Ti is a subtree of T corresponding to the subset of data that satisfies the conditions of rule Ri. In addition, I is the number of partial decision trees generated. The proposed approach to PART Forest can be explained as follows:
  • For each tree from i = 1 to I, randomly select a subspace from the feature set F.
  • Generate a new subset dataset Di by selecting the instances along with their corresponding values for the selected features.
  • Choose the attribute a, providing the highest accuracy on this current subset dataset Di (root node).
  • If Di is empty or all the instances in D belong to the same class, create a leaf node with the majority class label in D.
  • Otherwise, recursively build a subtree Ti for the subset Di starting with the smallest entropy.
  • If the subset Di expanded into a leaf, start backtracking.
  • If during backtracking a node is encountered whose children are all not leaves, then the remaining subsets are left unexplored.
  • Once a partial tree Ti has been built, a single rule Ri is extracted.
  • Repeat steps 1–8 for all base models.
  • Aggregate the predictions of the models using majority voting.
In summary, the PART Forest algorithm exploits the advantages of both random subspace and PART algorithms in the following way:
  • The random subspace method reduces the correlation between models by choosing different features.
  • The PART algorithm constructs a decision tree by dividing the data into smaller subsets based on the selected feature and the chosen split. The algorithm also employs a coverage measure to decide when to stop growing the tree, followed by pruning to prevent overfitting and create a more concise tree.
  • The results of partial decision trees are aggregated for prediction.
Moreover, the resulting decision tree is a collection of rules that collectively cover all instances in the dataset, except for a small fraction that can be handled by the default rule. These rules can be transformed into IF–THEN statements that are simple to understand and clarify.

4. Dataset Description

To evaluate the effectiveness of the proposed method, experiments were carried out on a publicly available geoscience dataset, which is the Comprehensive Database of Minerals dataset obtained from the kaggle.com web page [31]. The dataset includes the chemical compositions, crystal structures, and physical and optical properties of 3112 minerals with 137 attributes in total. Minerals are distinguished according to their various chemical and physical properties. Differences in chemical composition and material characteristics help to find the crystal structure of a given mineral that represents the class label. The dataset includes seven crystal structures: triclinic, monoclinic, orthorhombic, tetragonal, hexagonal, trigonal, and cubic. Moreover, attributes can be separated into chemical components and material characteristics. Material characteristics contain crystal structure, Mohs hardness, diaphaneity, specific gravity, optical, refractive index, dispersion, molar mass, molar volume, and calculated density. Chemical components show the formula of each compound converted into a vector, where each column corresponds to an element in the periodic table, and the value corresponds to the element’s atomic number in the mineral’s formula unit. For example, quartz is one of the most common minerals on the Earth and has the formula ‘SiO2’; therefore, the corresponding entry is one for the ‘Silicon’ column and two for the ‘Oxygen’ column, while the inputs for all other elements are zero (0). Therefore, in this dataset, the crystal structure can be predicted from three different groups: for example, by examining material characters containing nine features, by examining the chemical formula of the mineral consisting of 128 features, or by adding all features. For this reason, the minerals dataset is considered as three different data groups in this study.

5. Results and Discussion

In this section, experimental results are presented and discussed. All the experiments were carried out using the Weka machine learning software [32]. In addition to our model (PART Forest), RF and PART were also performed for comparative analysis. In all experiments, the whole dataset was divided into training and test sets by using the split ratio of 80 and 20, respectively. PART and RF models were designed using the same parameters of PART Forest to ensure consistency in the comparisons.
There is no single best parameter found theoretically in the construction of the machine learning models for all problem domains because the optimal values of the hyper-parameters in a machine learning model depend on the characteristics of the data (i.e., the nature of the data (considering convex or non-convex decision boundary), the relationships among the features, the number of instances (too little or high volumes of data), and the outliers in the data, balanced/imbalanced data). For this reason, to find the best combination of the parameters, separate parameter optimization steps were applied. These will also be explained in the subsections.
The goal of the experiments is to predict which crystal structure (triclinic, monoclinic, orthorhombic, tetragonal, hexagonal, or trigonal) a given mineral has. The test cases were examined in three folds: (1) using only the material characteristics, (2) using only the chemical composition information, and (3) using both the material characteristics and the chemical composition information.

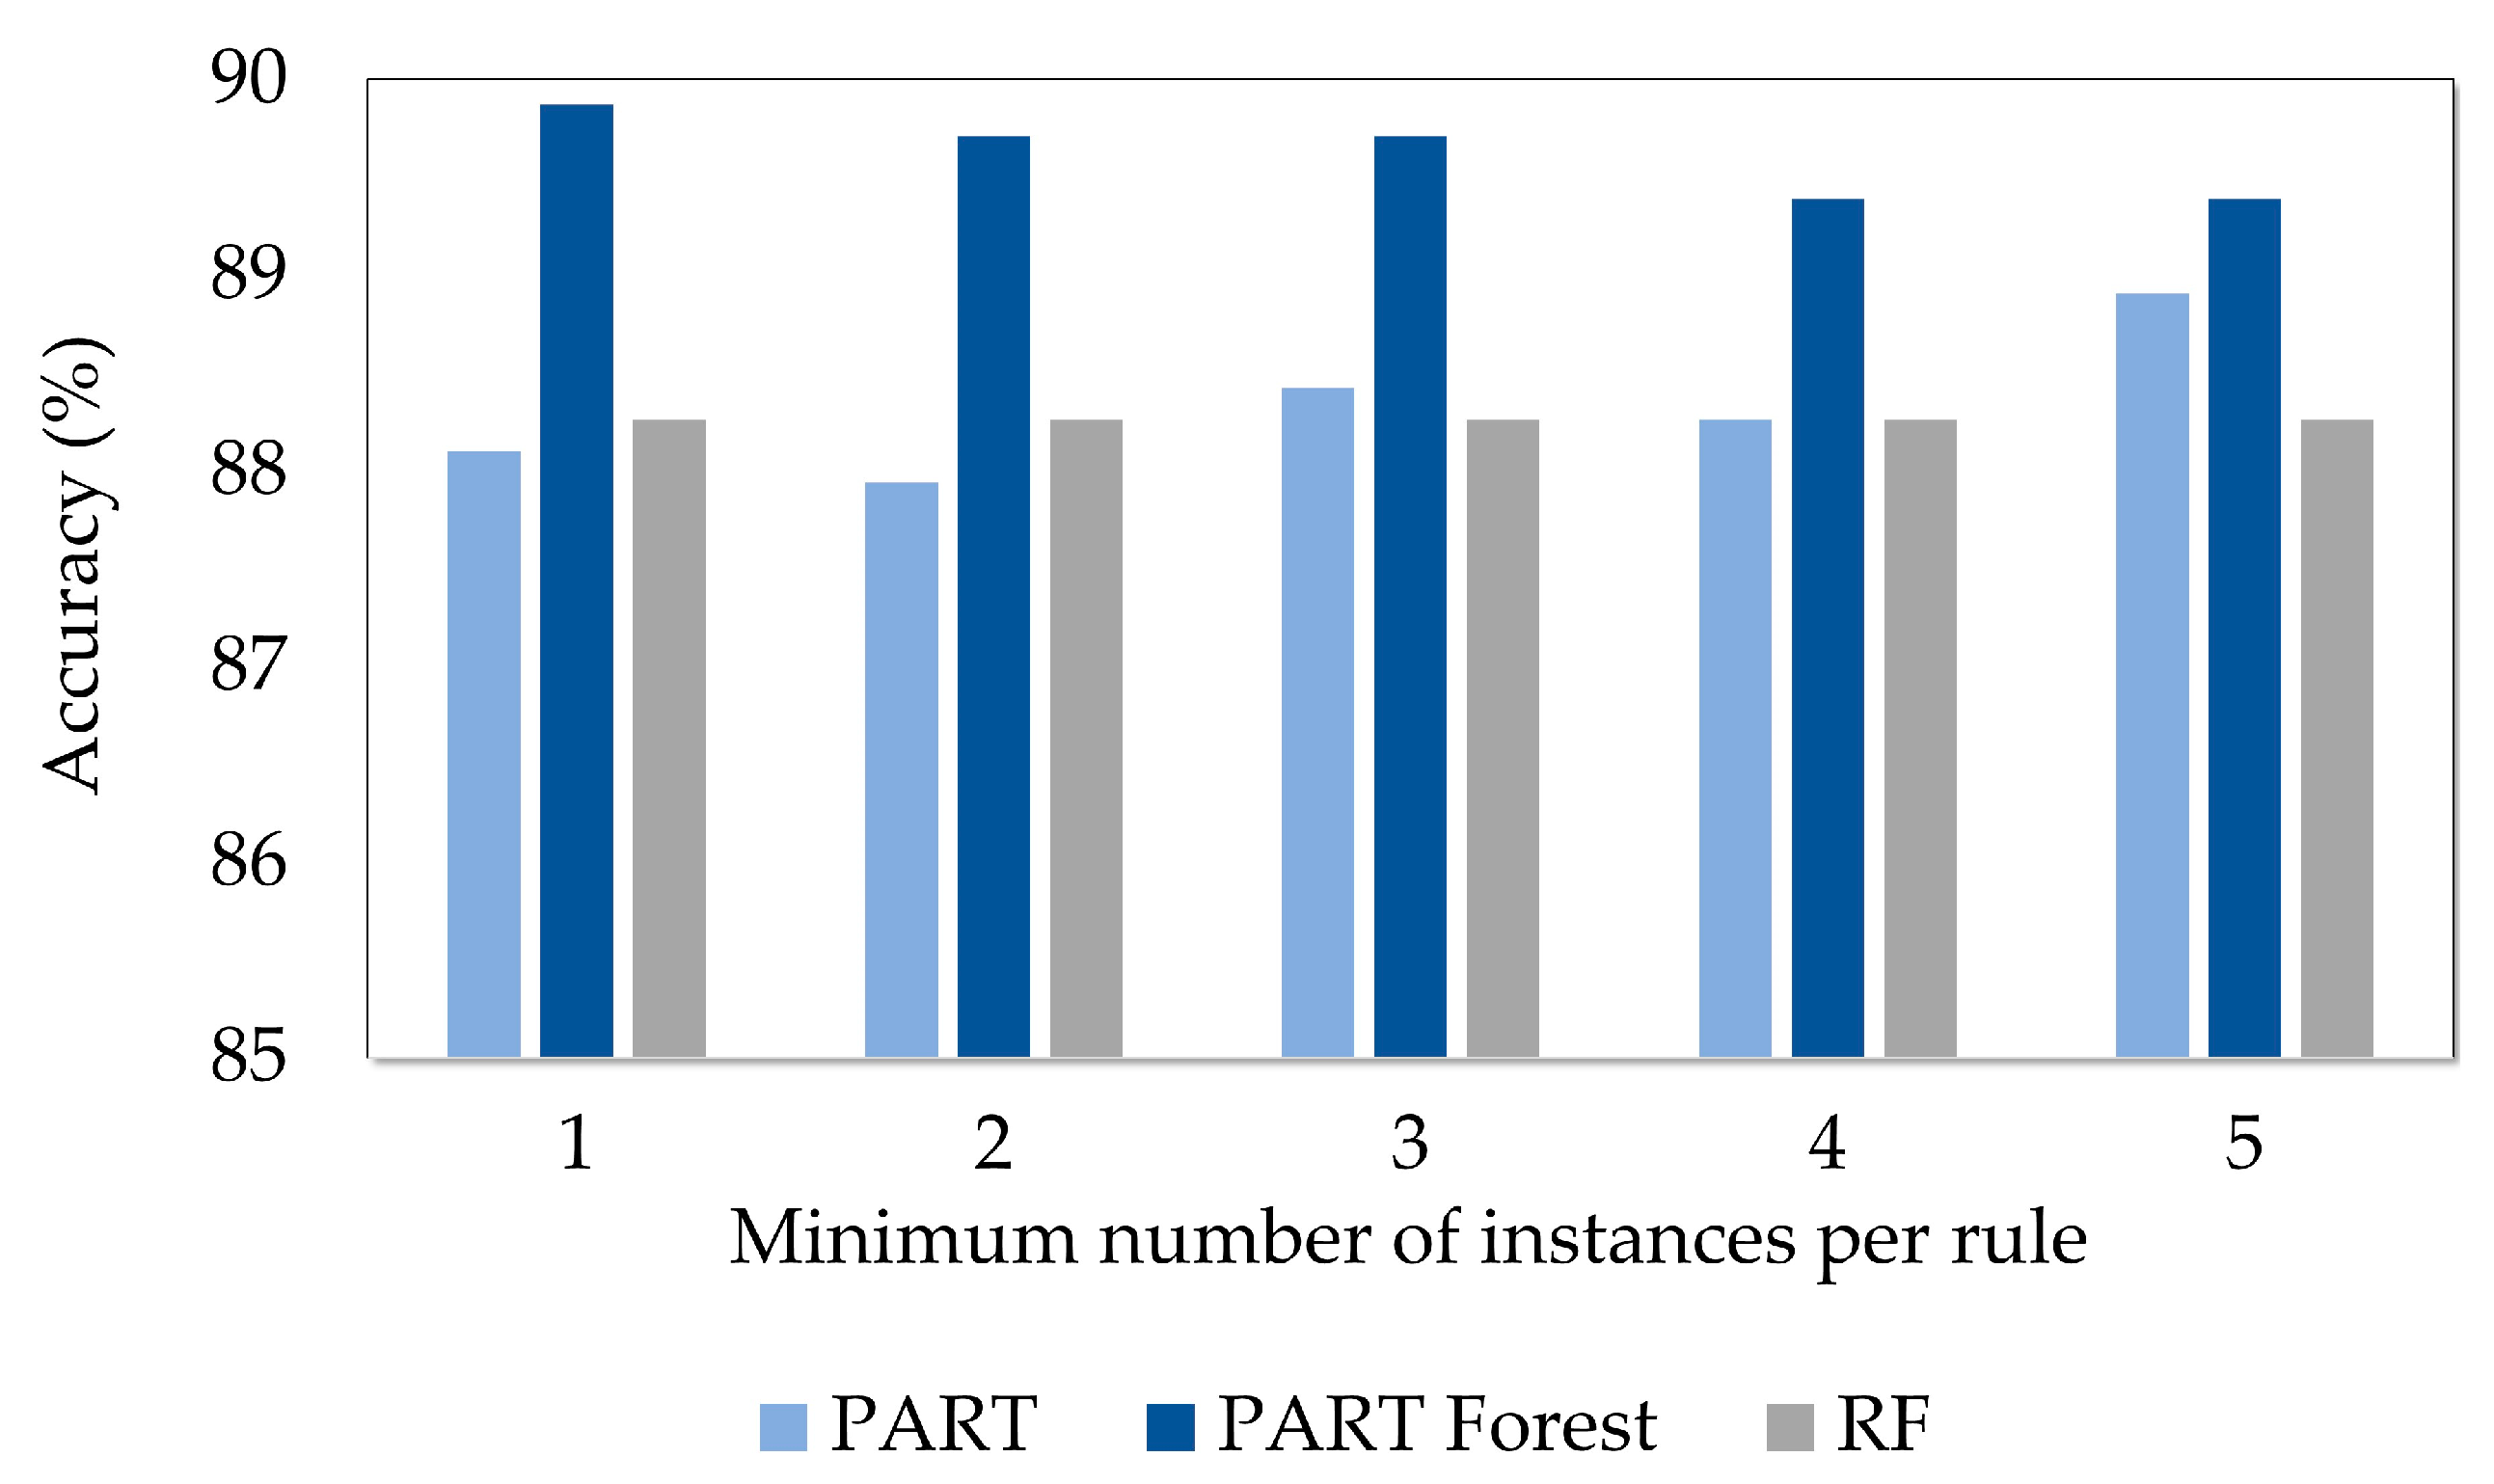
5.1. Experiments Carried Out Using Only the Material Characteristics

Material characteristics were taken into consideration in this setting to identify the crystal structure of a test sample. Parameter optimization is an important step in model construction. One of the most important parameters of the PART Forest model is the subspace size that determines how many features are selected in the construction of each tree. Initially, different feature sets were tested using various subspace size parameters with percentages between 10 to 100. The other parameters were set as 100 for the number of trees, 2 for the minimum number of instances per rule, and 0.25 for the pruning factor. Figure 2 shows the output of the accuracies obtained for different subspace size percentages from 10 to 100. The peak point was seen in the case where 70% of the features were used in the model construction by obtaining an accuracy of 89.71%. While there was an overall increase up to the peak, accuracy dropped significantly from that point on. The reason behind this pattern can be explained by considering the tradeoff between generalization capability and available information. When too few features are included, the misclassification increases due to the elimination of discriminative information. On the other hand, when too many features are available, the models tend to overfit these features, and, therefore, the generalization capability is lost.
PART Forest is modeled using the basic parameters of the PART method, which are the confidence value for pruning (C) and the minimum number of samples per rule (M). According to the experiments, the parameter M was noticed as the value that highly affected the classification accuracy, whereas the parameter C could not change anything. For this reason, another experiment was conducted using different M values from one to five. Both PART and PART Forest methods used the same M value in the comparisons. After identifying the optimal subspace size as 70%, the minimum number of samples per rule was determined by constructing 100 trees and then giving comparisons with PART and RF. RF was generated using the same number of features with PART Forest, while PART was constructed with the same M parameter for consistency. Figure 3 points out the accuracy results. The most accurate classification (89.87%) was done by PART Forest when the minimum number of instances per rule was selected as one. A slight decrease was observed in the accuracy from 89.87% to 89.38% when the instance size was increased from one to five. Because RF does not have the M parameter, its accuracy was fixed in all settings. Both RF and PART methods could not manage as well as our method, achieving at most 88.26% and 88.91% accuracies, respectively.
Another crucial parameter to be chosen carefully is the number of trees (iterations, I) to be generated. Because PART is performed on a single tree, RF and PART Forest models were considered for comparative analysis in this part. Using the optimally found parameters (M as 1 and the subspace size as 70%), the variation in the accuracy in terms of the number of trees was examined in the final step. RF was also applied by executing the same number of iterations. The results are demonstrated in Figure 4. PART Forest was superior to RF in all settings. It achieved at most 90.35% accuracy when 30 trees were constructed, whereas here, RF obtained the worst performance with an accuracy of 88.26%. Even in the best case for RF with an accuracy of 89.07%, where the number of trees was set as 10, RF could not manage to outperform PART Forest, which obtained its least accuracy of 89.23% at this point.

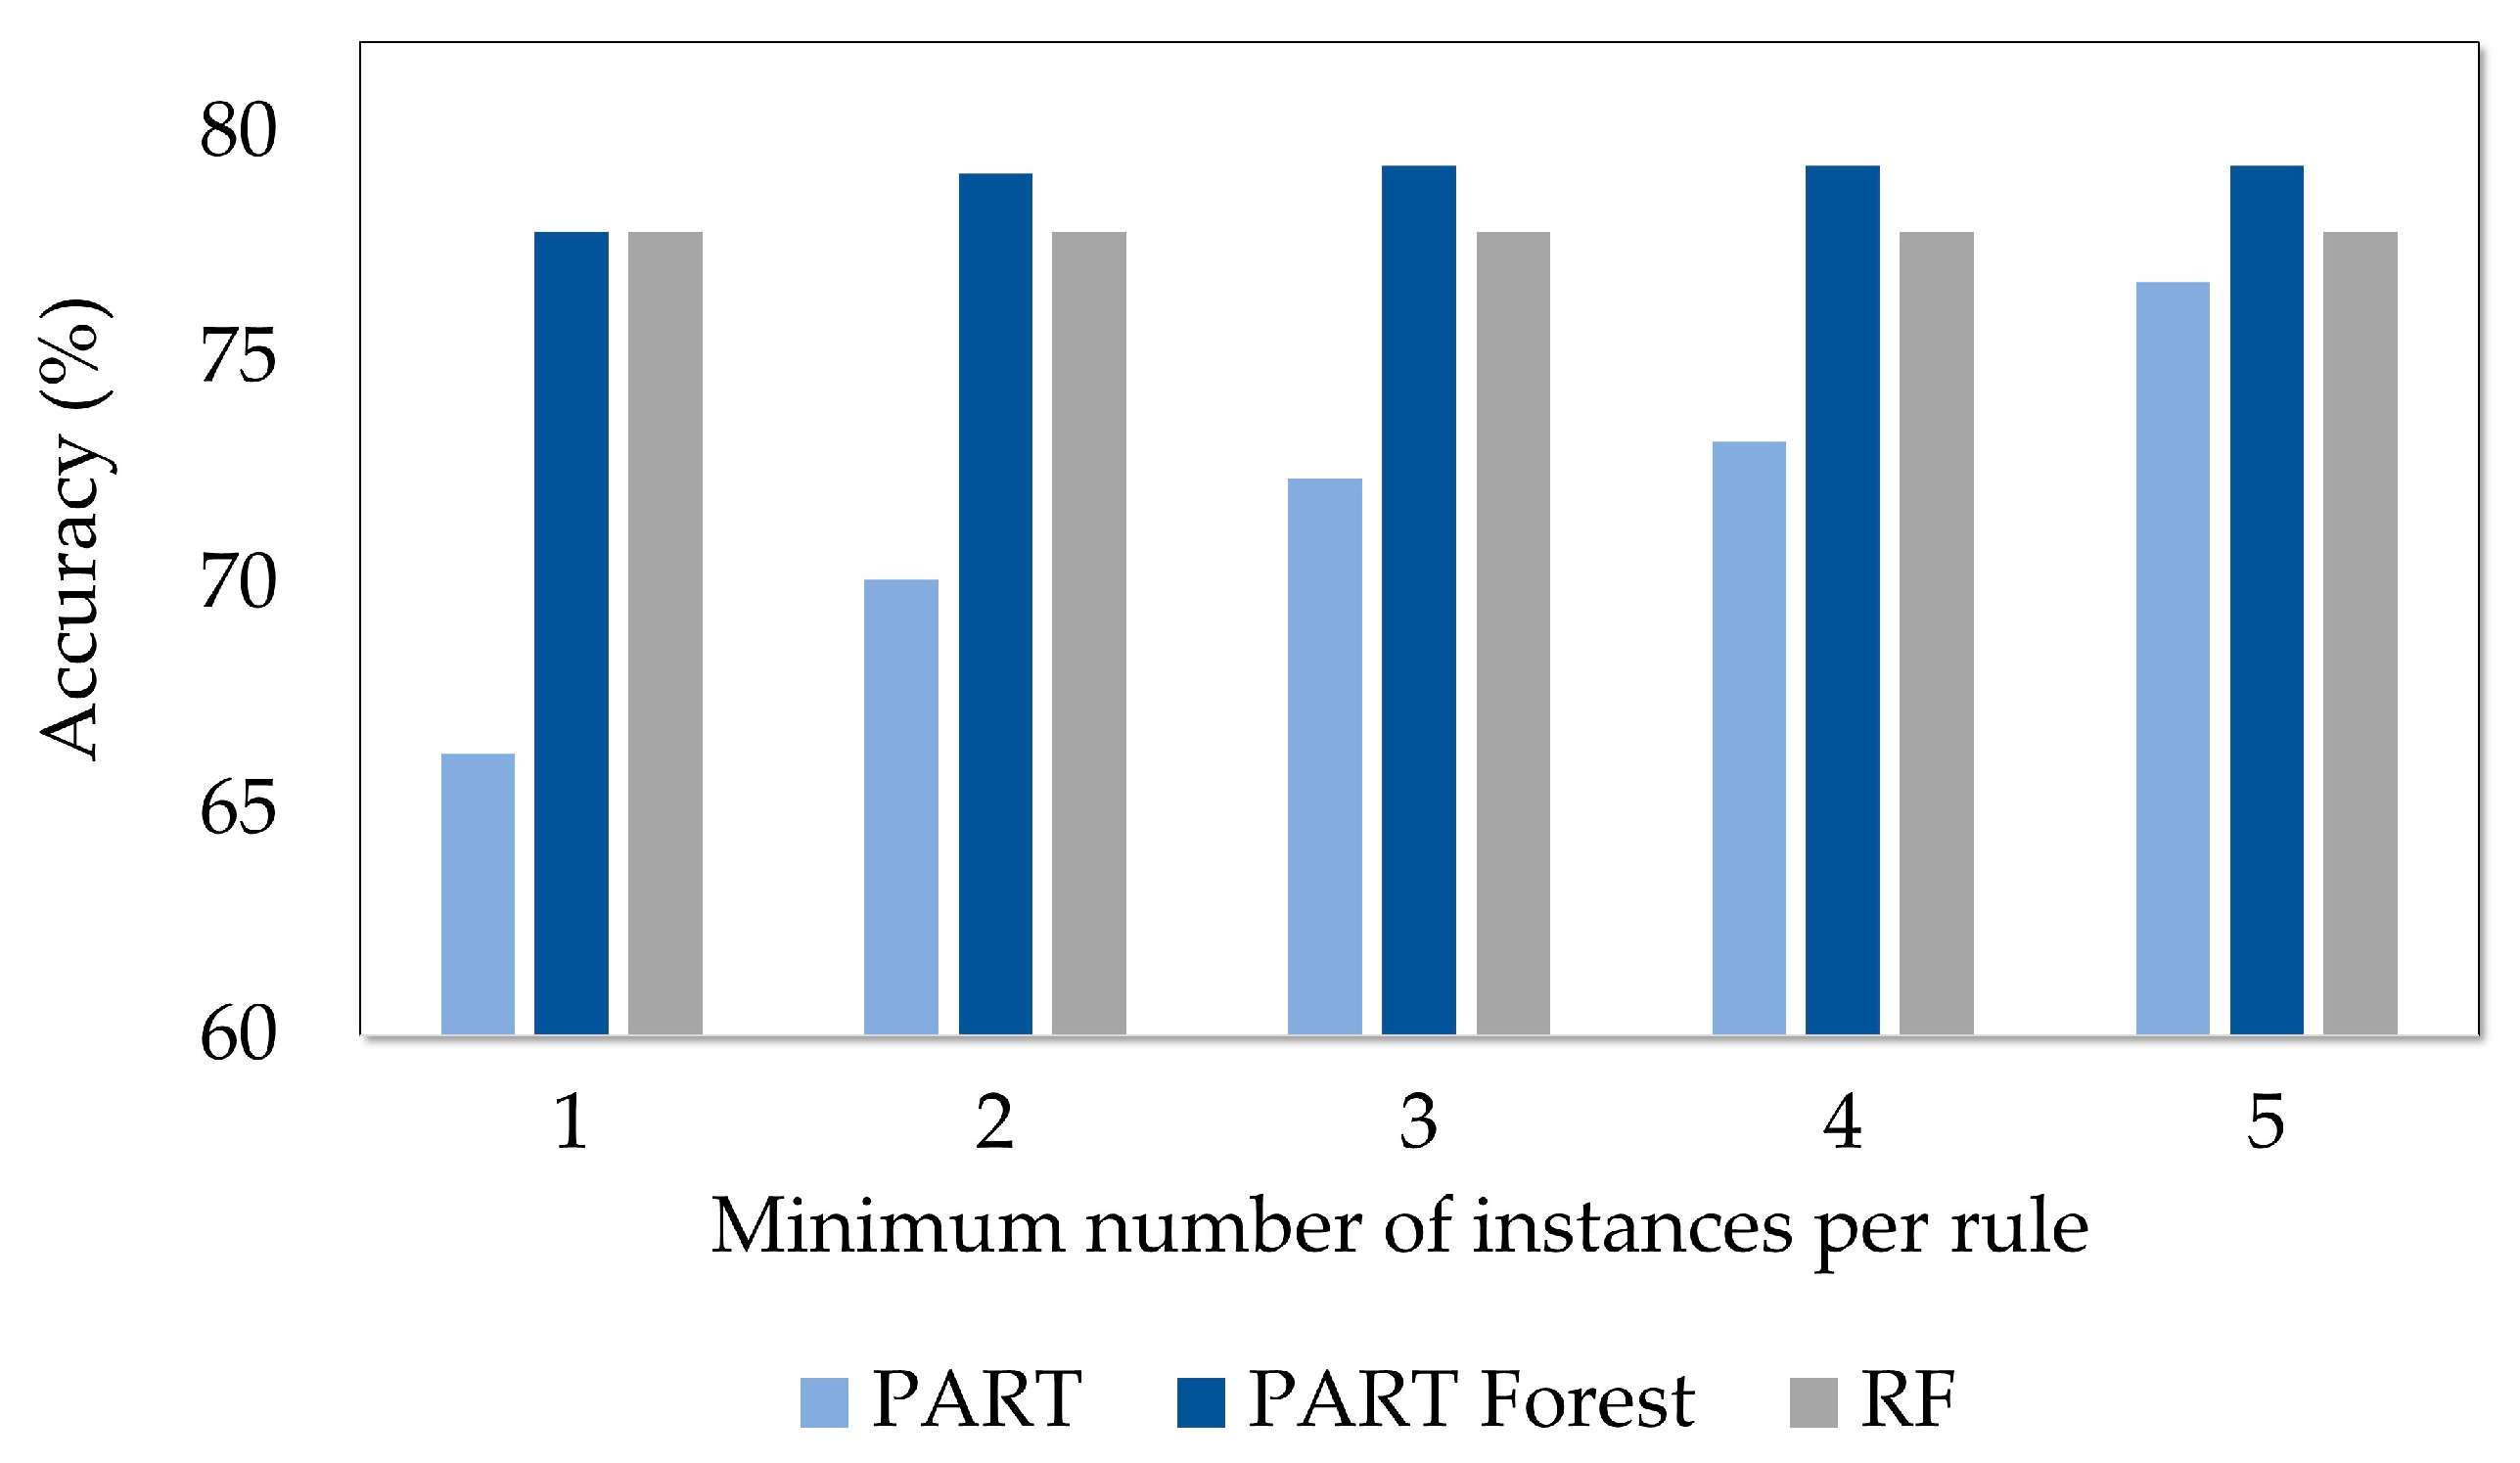
5.2. Experiments Carried Out Using Only the Chemical Composition Information

Chemical composition information constituted the attributes of the dataset in this part. Each feature indicated the amount of the specified atom or molecule. In this way, 128 features out of 137 features were taken into consideration. The same procedure applied in the previous parts was repeated to find the optimum parameters and as a result the best accuracy. Feature subspaces were constructed as shown in Figure 5, and when 60% of them were used with the default values of the other parameters, 79.10% accuracy was succeeded as the best case.
PART, PART Forest, and RF were compared considering the parameter M with values from one to five as given in Figure 6. PART improved its performance while the number of instances per rule increased from 66.24% to 76.69%. RF attained an accuracy of 77.81% when 100 trees were generated by using 60% of the features in each tree. There was no significant change in accuracy for PART Forest, which obtained at most 79.26% accuracy when M was set as either three, four, or five. For the next experiment, M was selected as three. PART Forest achieved more accurate results than the others in general.
The best value of the number of trees for the ensemble learning models was also determined. Figure 7 displays the outputs. With minor differences, PART Forest achieved the best result at 79.26%. The most accurate estimations succeeded with 70 trees with an accuracy of 78.13% for the RF model. Compared to the results (90.35% accuracy in the optimum case) obtained by using only the material characteristics, using only chemical properties could not result in a better prediction (79.26% accuracy) of the crystal structure information.

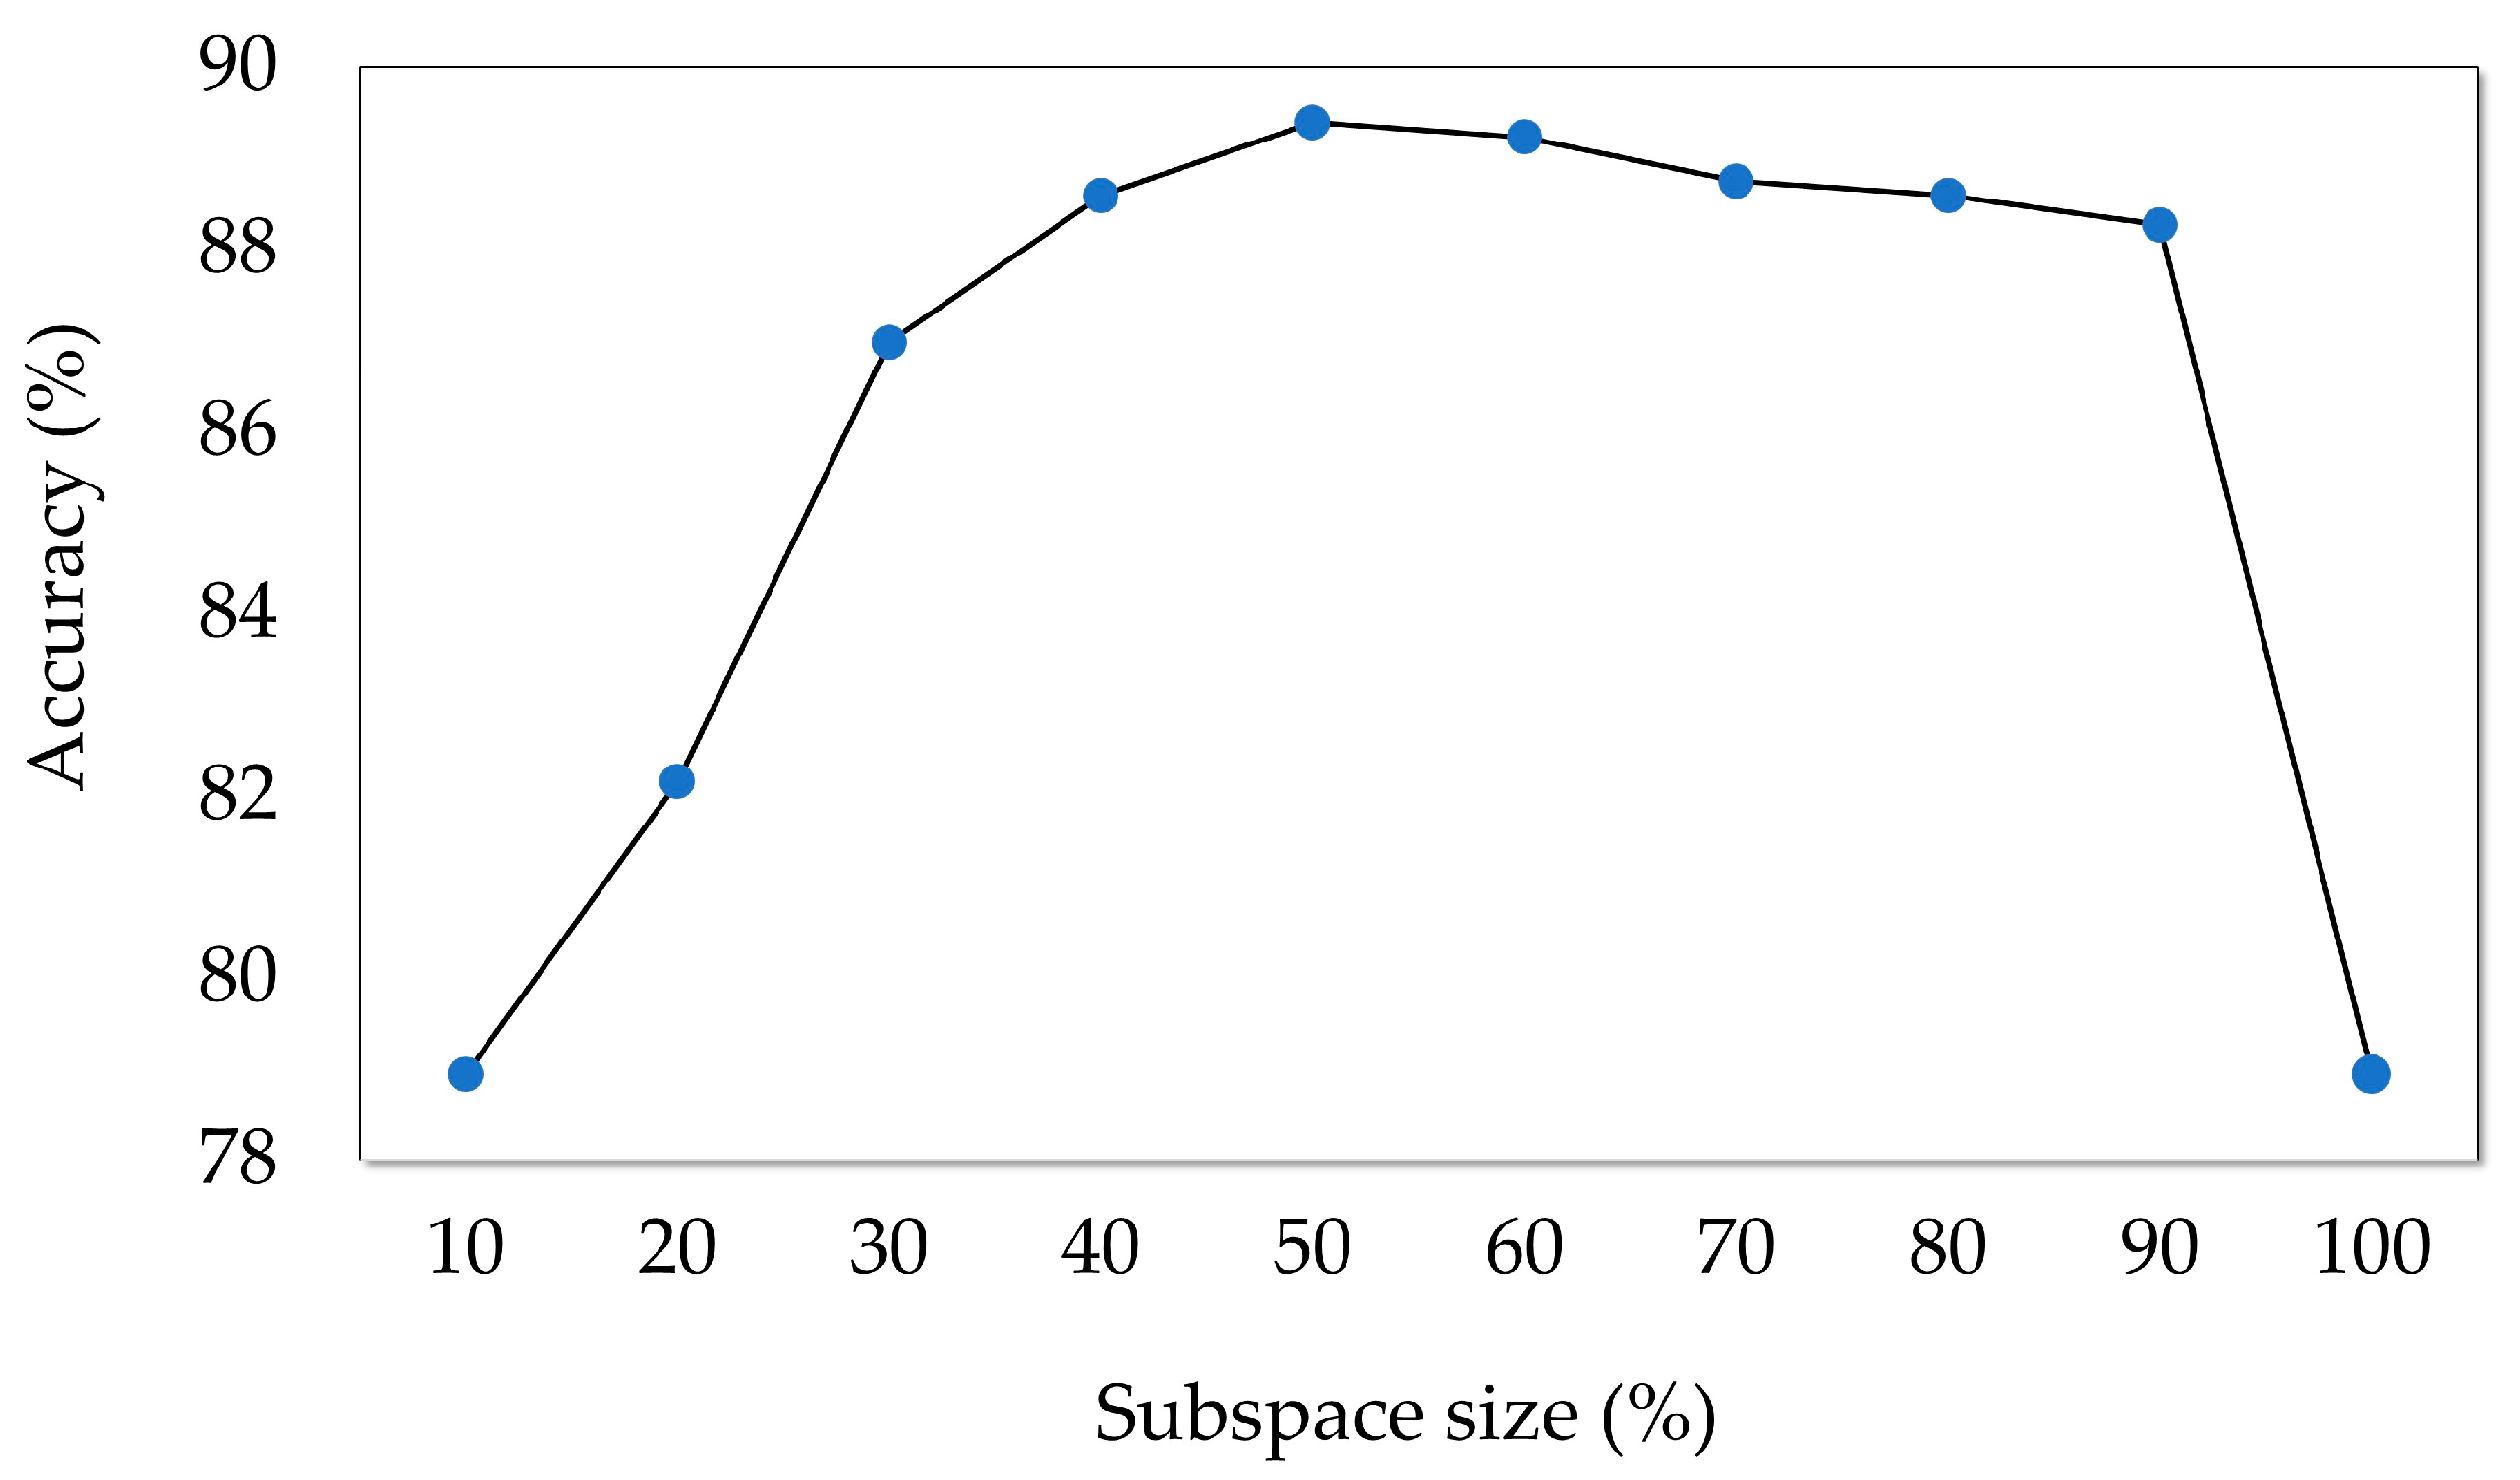
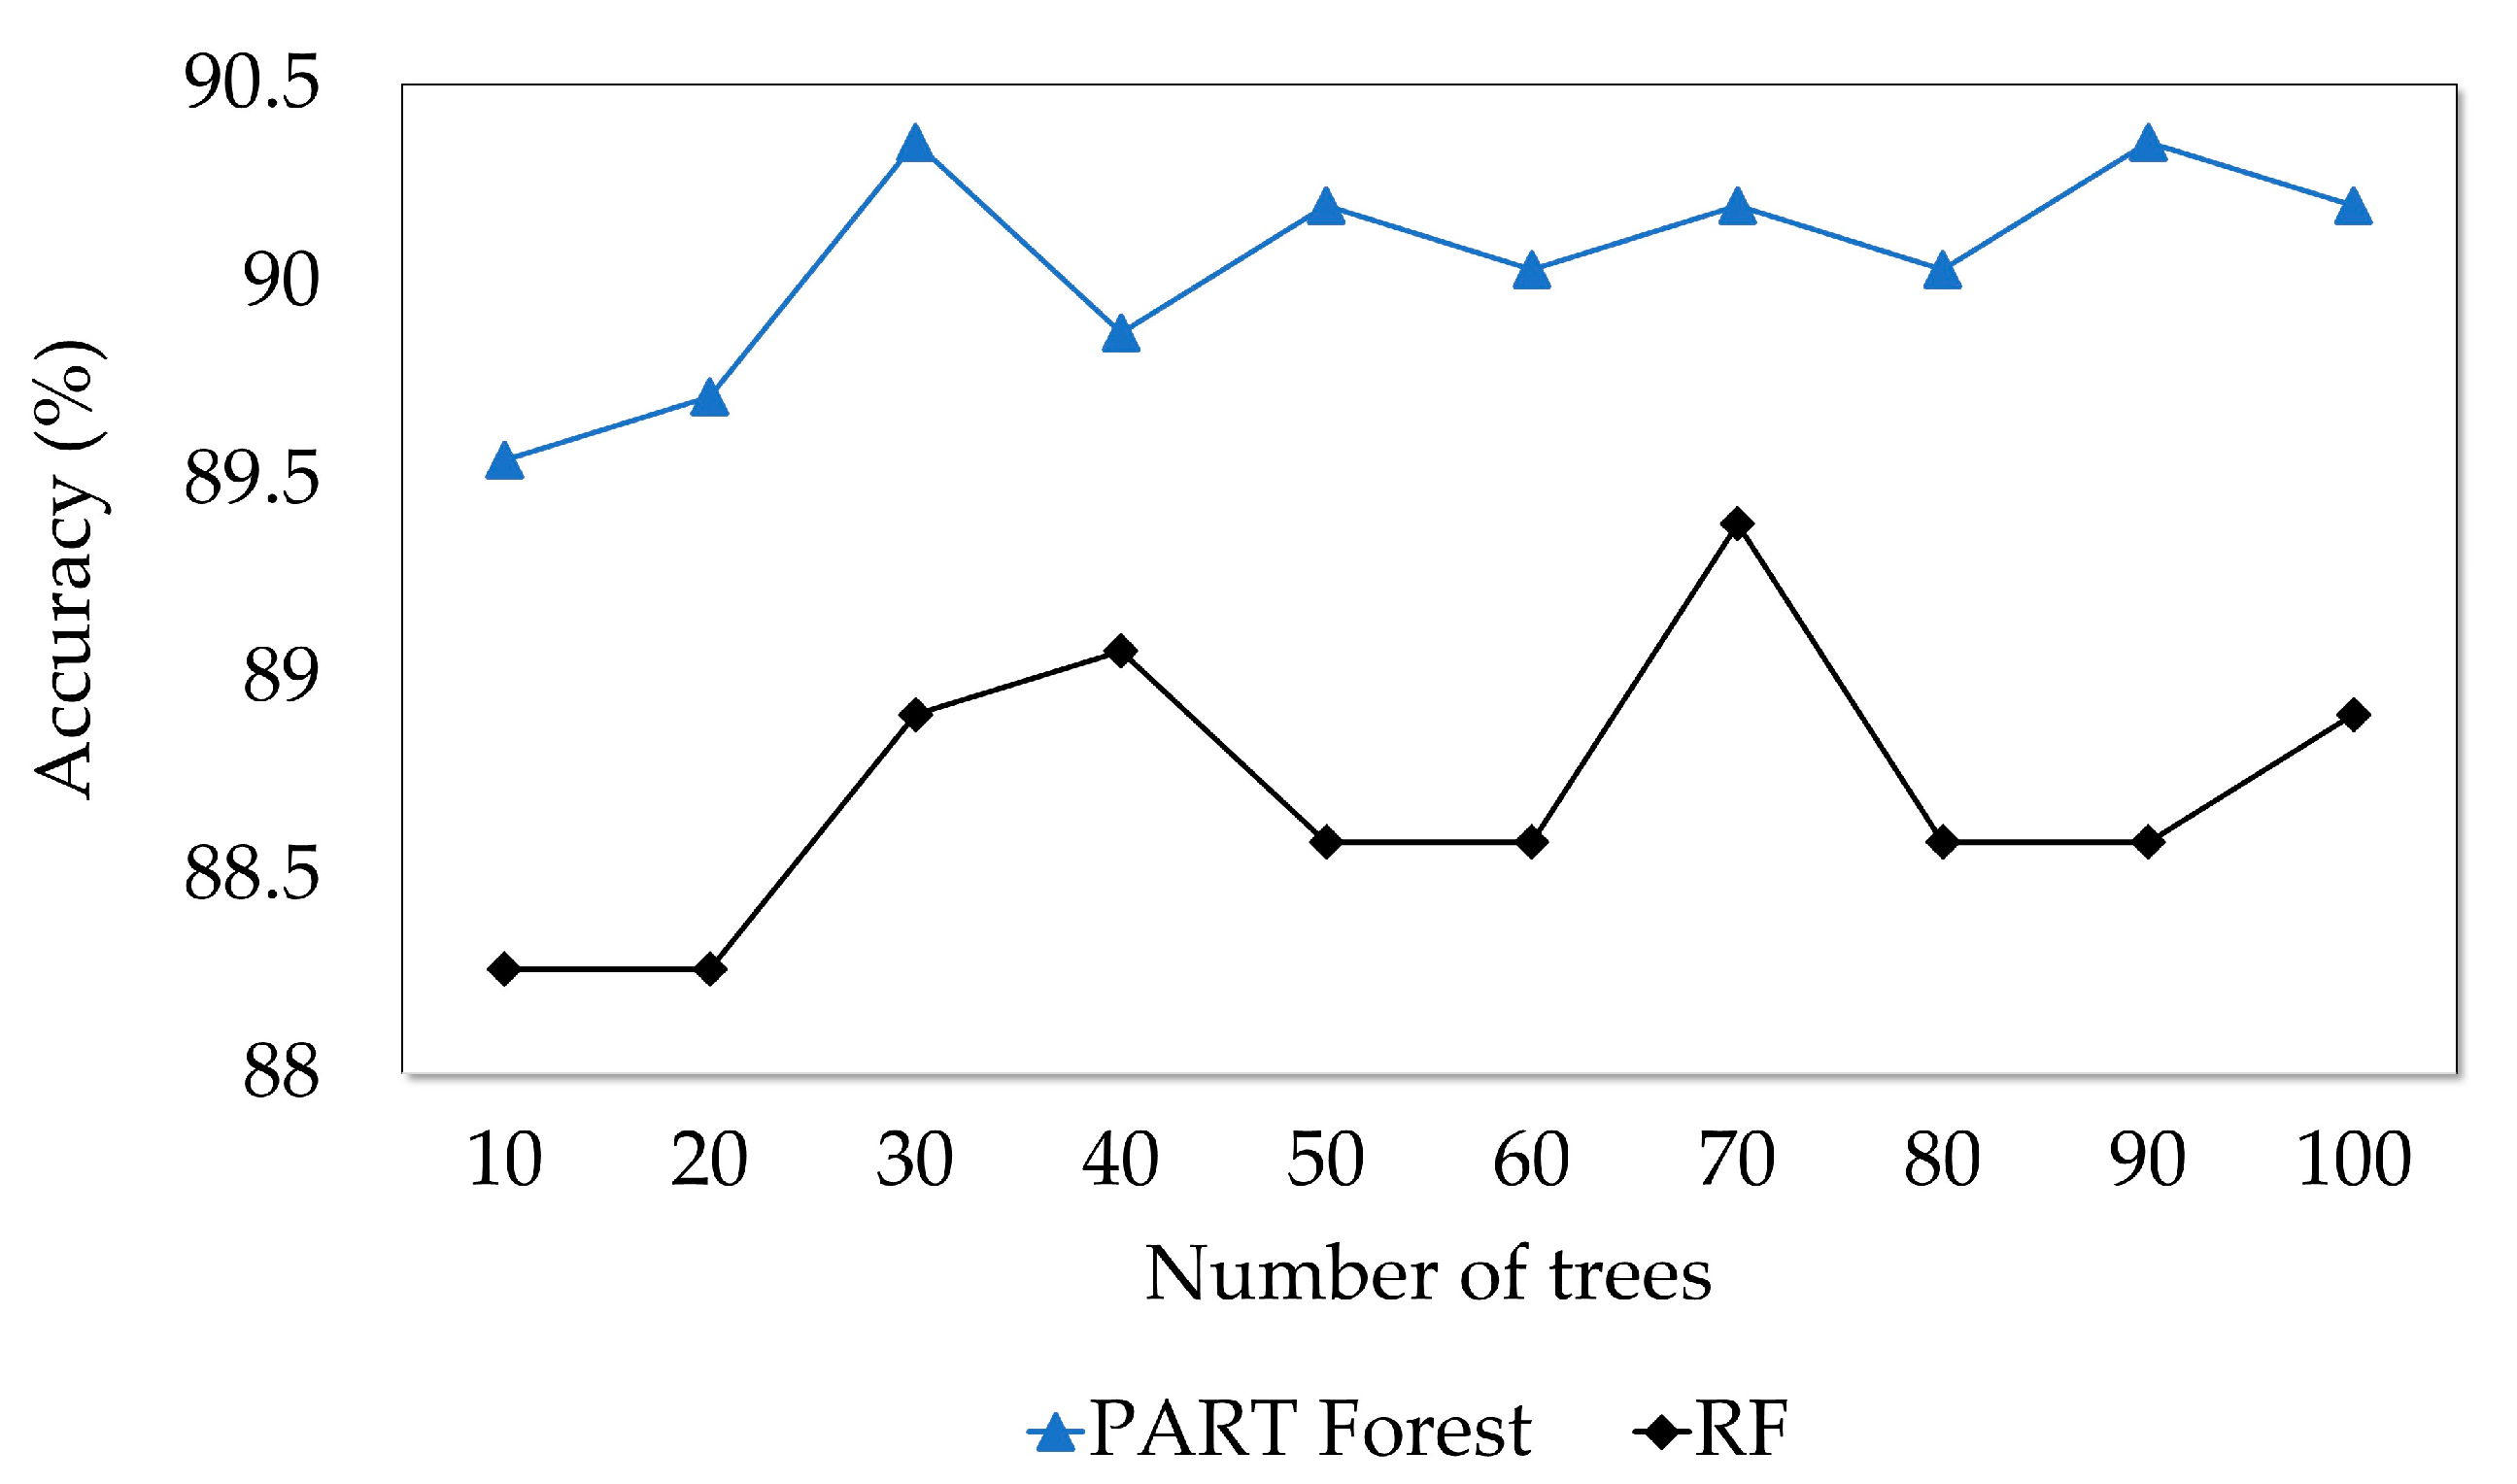
5.3. Experiments Carried Out Using Both the Material Characteristics and the Chemical Composition Information

In the final part, all the features of both the material characteristics and the chemical composition information were gathered together to train the model. The subspace size parameter was optimized using 50% of all attributes as shown in Figure 8. The lowest value of accuracy was obtained as 78.94% in the settings where 10% or a full set of features was used. Figure 9 expressed the experimental results in terms of the parameter M. PART Forest obtained results that first decreased and then increased, albeit with small differences. The most accurate classification was done with an accuracy of 90.19% using M as five. RF obtained 88.91% accuracy when I was 100 and 50% of the features were used. PART attained at most 88.10% accuracy and at least 84.41% accuracy where the value of M was four and one, respectively. PART Forest was the best method in all situations.
The number of trees to be run in the model construction of both RF and PART Forest was optimized in the last part as given in Figure 10; 50% of the features were used for both, and M was set as 5 for the PART Forest model. PART Forest obtained the best performance (90.35% accuracy) using 30 or 90 trees, whereas the lowest performance was 89.55% when I was 10. RF was behind our model in all cases that succeeded at most 89.39% accuracy when I was 70. To make a general inference, material characteristics are seen to dominate the model in this experiment because the results were like the one obtained in Section 5.1. Using all the data rather than just chemical properties, which obtained at most 79.26% accuracy, yields better results (90.35% accuracy).
It is crucial at this point to find the optimum values of all methods in order to evaluate the results in the same denominator and to make a fair comparison. In addition to accuracy, other performance metrics such as precision, recall, f-score, and AUC (area under the curve) were also considered to evaluate the success of the classifiers. The parameter of M (minimum number of instances per rule) was used for the optimization in the PART classifier using the search area of one to five as in the PART Forest classifier. For the RF classifier, the subspace size (using the search space between 10% to 100%) and the number of trees (from 10 to 100 iterations) were the optimized parameters. Three settings (using only material characteristics (MAT_CHAR), using only chemical composition information (CHEM_COMP), and using all data (ALL)) were handled separately. An 80:20 split ratio was used in all cases. Table 1 shows the obtained results. The optimum M parameter of the PART classifier was found as five when either MAT_CHAR data or CHEM_COMP data was used, while it was four when all data was considered. A calculated 20% of the features were used by generating 100 trees in the optimal case of RF when regarding the MAT_CHAR data. In terms of the CHEM_COMP data, the optimum I was 100, and 30% of the features were utilized in the RF method. When all data was used, 90 trees were constructed by selecting 20% of the features in the best case of RF. PART Forest obtained the best performance (such as 90.35% accuracy in the cases of MAT_CHAR and ALL) in all cases not only for the accuracy metric but also the other ones such as precision, recall, f-score, and AUC. The RF classifier obtained the most accurate results (90.03%) when all data was used; however, it could not manage to outperform our proposed method. PART was the worst classifier, which obtained at most 88.91% accuracy. RF and PART Forest performed very closely to each other, especially in the ALL case.

6. Conclusions and Future Work

This paper presents a multidisciplinary study that combines computer science and geoscience in a way that a machine learning model is proposed to handle a geological problem, namely, crystal structure classification. PART Forest, which is constructed using feature subspaces of various PART classifiers, was introduced for this aim. Optimization of the hyperparameters is an important step in machine learning problems since they directly affect the accuracy of classification; therefore, several tests were focused on the determination of the parameters of PART Forest. These parameters are the size of the feature subspaces, the number of instances per rule (M), and the number of trees (I) to be generated in the ensemble model. The experimental study was the classification of a given mineral as one of the crystal structure groups that are triclinic, monoclinic, orthorhombic, tetragonal, hexagonal, trigonal, and cubic. Experimental studies were examined under three topics: classification by using only the material characteristics, classification by using only chemical structure information, and classification by using data from both. The results showed that using either only material characteristics or the whole data ended up with more accurate predictions compared to using only chemical composition information. PART Forest was the best learner among RF and PART methods by achieving an accuracy of 90.35%.
The main findings of this study can be summarized as follows:
  • A geoscientific problem was handled by our method (PART Forest) with satisfactory results above 90% accuracy.
  • The proposed method beat the PART and RF methods in the classification of minerals.
Implementation of our proposed method will speed up the works of geologists and experts in geoscience by presenting realistic predictions and providing preliminary information at the decision stage for a geoscientific problem. The future direction will be the application of the proposed method for other geological problems such as rock classification, mineral prospectivity modeling, and seismic event classification.

Author Contributions

Conceptualization, G.T. and E.O.K.; methodology, D.B.; software, G.T. and E.O.K.; validation, G.T.; formal analysis, E.O.K.; investigation, G.T. and E.O.K.; resources, G.T.; data curation, G.T.; writing—original draft preparation, G.T. and E.O.K.; writing—review and editing, D.B.; visualization, G.T. and E.O.K.; supervision, D.B.; funding acquisition, E.O.K. All authors have read and agreed to the published version of the manuscript.

Funding

This research received no external funding.

Institutional Review Board Statement

Not applicable.

Informed Consent Statement

Not applicable.

Data Availability Statement

The “Comprehensive Database of Minerals” dataset [31] is publicly available in the Kaggle data repository (https://www.kaggle.com/datasets/vinven7/comprehensive-database-of-minerals, accessed on 22 February 2023).

Conflicts of Interest

The authors declare no conflict of interest.

References

  1. Shin, Y.; Shin, S. Rock classification in a vanadiferous titanomagnetite deposit based on supervised machine learning. Minerals 2022, 12, 461. [Google Scholar] [CrossRef]
  2. Han, X.; Hou, D.; Cheng, X.; Li, Y.; Niu, C.; Chen, S. Prediction of TOC in Lishui–Jiaojiang Sag using geochemical analysis, well logs, and machine learning. Energies 2022, 15, 9480. [Google Scholar] [CrossRef]
  3. Alqahtani, A.; He, X.; Yan, B.; Hoteit, H. Uncertainty analysis of CO2 storage in deep saline aquifers using machine learning and Bayesian optimization. Energies 2023, 16, 1684. [Google Scholar] [CrossRef]
  4. Wagle, N.; Acharya, T.D.; Kolluru, V.; Huang, H.; Lee, D.H. Multi-temporal land cover change mapping using Google Earth engine and ensemble learning methods. Appl. Sci. 2020, 10, 8083. [Google Scholar] [CrossRef]
  5. Sun, T.; Li, H.; Wu, K.; Chen, F.; Zhu, Z.; Hu, Z. Data-driven predictive modelling of mineral prospectivity using machine learning and deep learning methods: A case study from southern Jiangxi Province, China. Minerals 2020, 10, 102. [Google Scholar] [CrossRef] [Green Version]
  6. Karpatne, A.; Ebert-Uphoff, I.; Ravela, S.; Babaie, H.A.; Kumar, V. Machine learning for the geosciences: Challenges and opportunities. IEEE Trans. Knowl. Data Eng. 2018, 31, 1544–1554. [Google Scholar] [CrossRef] [Green Version]
  7. De′ath, G.; Fabricius, K.E. Classification and regression trees: A powerful yet simple technique for ecological data analysis. Ecology 2000, 81, 3178–3192. [Google Scholar] [CrossRef]
  8. Thessen, A. Adoption of machine learning techniques in ecology and earth science. One Ecosyst. 2016, 1, e8621. [Google Scholar] [CrossRef] [Green Version]
  9. Singh, M.; Kumar, B.; Chattopadhyay, R.; Amarjyothi, K.; Sutar, A.K.; Roy, S.; Rao, S.A.; Nanjundiah, R.S. Machine learning for Earth System Science (ESS): A survey, status and future directions for South Asia. arXiv 2021, arXiv:2112.12966. [Google Scholar]
  10. Costa, I.S.L.; Tavares, F.M.; de Oliveira, J.K.M. Predictive lithological mapping through machine learning methods: A case study in the Cinzento Lineament, Carajás Province, Brazil. JGSB 2019, 2, 26–36. [Google Scholar] [CrossRef]
  11. Latifovic, R.; Pouliot, D.; Campbell, J. Assessment of convolution neural networks for surficial geology mapping in the South Rae geological region, Northwest Territories, Canada. Remote Sens. 2018, 10, 307. [Google Scholar] [CrossRef] [Green Version]
  12. Culverhouse, P.F.; Williams, R.; Reguera, B.; Herry, V.; González-Gil, S. Do experts make mistakes? A comparison of human and machine indentification of dinoflagellates. Mar. Ecol. Prog. Ser. 2003, 247, 17–25. [Google Scholar] [CrossRef] [Green Version]
  13. Ali, A.; Chiang, Y.W.; Santos, R.M. X-ray diffraction techniques for mineral characterization: A review for engineers of the fundamentals, applications, and research directions. Minerals 2022, 12, 205. [Google Scholar] [CrossRef]
  14. Jarin, S.; Yuan, Y.; Zhang, M.; Hu, M.; Rana, M.; Wang, S.; Knibbe, R. Predicting the crystal structure and lattice parameters of the perovskite materials via different machine learning models based on basic atom properties. Crystals 2022, 12, 1570. [Google Scholar] [CrossRef]
  15. Priyadarshini, R.; Joardar, H.; Bisoy, S.K.; Badapanda, T. Crystal structural prediction of perovskite materials using machine learning: A comparative study. Solid. State Commun. 2023, 361, 115062. [Google Scholar] [CrossRef]
  16. Zhao, Y.; Cui, Y.; Xiong, Z.; Jin, J.; Liu, Z.; Dong, R.; Hu, J. Machine learning-based prediction of crystal systems and space groups from inorganic materials compositions. ACS Omega 2020, 5, 3596–3606. [Google Scholar] [CrossRef] [PubMed]
  17. Corriero, N.; Rizzi, R.; Settembre, G.; Del Buono, N.; Diacono, D. CrystalMELA: A new crystallographic machine learning platform for crystal system determination. J. Appl. Crystallogr. 2023, 56, 409–419. [Google Scholar] [CrossRef]
  18. Li, Y.; Dong, R.; Yang, W.; Hu, J. Composition based crystal materials symmetry prediction using machine learning with enhanced descriptors. Comput. Mater. Sci. 2021, 198, 110686. [Google Scholar] [CrossRef]
  19. Aguiar, J.A.; Gong, M.L.; Tasdizen, T. Crystallographic prediction from diffraction and chemistry data for higher throughput classification using machine learning. Comput. Mater. Sci. 2020, 173, 109409. [Google Scholar] [CrossRef]
  20. Taamneh, M.; Alkheder, S.; Taamneh, S. Data-mining techniques for traffic accident modeling and prediction in the United Arab Emirates. J. Transp. Saf. Secur. 2017, 9, 146–166. [Google Scholar] [CrossRef]
  21. Krishnaveni, S.; Hemalatha, M. A perspective analysis of traffic accident using data mining techniques. Int. J. Comput. Appl. 2011, 23, 40–48. [Google Scholar] [CrossRef]
  22. Pirdavani, A.; De Pauw, E.; Brijs, T.; Daniels, S.; Magis, M.; Bellemans, T.; Wets, G. Application of a rule-based approach in real-time crash risk prediction model development using loop detector data. Traffic Inj. Prev. 2015, 16, 786–791. [Google Scholar] [CrossRef] [PubMed] [Green Version]
  23. Gaikwad, D.P. Intrusion detection system using ensemble of rule learners and first search algorithm as feature selectors. Int. J. Comput. Netw. Inf. Secur. 2021, 13, 26–34. [Google Scholar] [CrossRef]
  24. Kareem, M.I.; Jasim, M.N. DDOS Attack Detection Using Lightweight Partial Decision Tree Algorithm. In Proceedings of the International Conference on Computer Science and Software Engineering (CSASE), Duhok, Iraq, 15–17 March 2022; pp. 362–367. [Google Scholar] [CrossRef]
  25. Al-diabat, M. Arabic text categorization using classification rule mining. Appl. Math. Sci. 2012, 6, 4033–4046. [Google Scholar]
  26. Berger, H.; Merkl, D.; Dittenbach, M. Exploiting Partial Decision Trees for Feature Subset Selection in E-Mail Categorization. In Proceedings of the 2006 ACM Symposium on Applied Computing (SAC), Dijon, France, 23–27 April 2006; pp. 1105–1109. [Google Scholar] [CrossRef]
  27. Mehdiyev, N.; Krumeich, J.; Enke, D.; Werth, D.; Loos, P. Determination of rule patterns in complex event processing using machine learning techniques. Procedia Comput. Sci. 2015, 61, 395–401. [Google Scholar] [CrossRef] [Green Version]
  28. Mazid, M.M.; Ali, A.S.; Tickle, K.S. Input space reduction for rule based classification. WSEAS Trans. Inf. Sci. Appl. 2010, 7, 749–759. [Google Scholar]
  29. Sorker, M.A.W.; Siddika, A.; Titly, T.A.; Mia, M.J.; Bijoy, M.H.I. Online Consumer Alignment using Supervised Machine Learning Technique. In Proceedings of the 13th International Conference on Computing Communication and Networking Technologies (ICCCNT), Kharagpur, India, 3–5 October 2022; pp. 1–7. [Google Scholar] [CrossRef]
  30. Jijo, B.T.; Abdulazeez, A.M. Classification based on decision tree algorithm for machine learning. JASTT 2021, 2, 20–28. [Google Scholar] [CrossRef]
  31. Comprehensive Database of Minerals. Available online: https://www.kaggle.com/datasets/vinven7/comprehensive-database-of-minerals (accessed on 22 February 2023).
  32. Frank, E.; Hall, M.A.; Witten, I.H. The WEKA Workbench. In Online Appendix for Data Mining: Practical Machine Learning Tools and Techniques, Morgan Kaufmann, 4th ed.; Elsevier: San Francisco, CA, USA, 2016; pp. 1–128. [Google Scholar]
Figure 1. The general framework of the proposed system.
Minerals 13 00800 g001
Figure 2. The change in the classification accuracy in terms of the subspace size parameter is given in percentages considering only the material characteristics.
Minerals 13 00800 g002
Figure 3. The change in the accuracy when a different number of instances per rule was used considering only the material characteristics.
Minerals 13 00800 g003
Figure 4. The change in the accuracy when a different number of trees was constructed considering only the material characteristics.
Minerals 13 00800 g004
Figure 5. The change in the classification accuracy in terms of the subspace size parameter is given in percentages considering only the chemical composition information.
Minerals 13 00800 g005
Figure 6. The change in the accuracy when a different number of instances per rule was used considering only the chemical composition information.
Minerals 13 00800 g006
Figure 7. The change in the accuracy when a different number of trees was constructed considering only the chemical composition information.
Minerals 13 00800 g007
Figure 8. The change in the classification accuracy in terms of the subspace size parameter is given in percentages considering both the material characteristics and the chemical composition information.
Minerals 13 00800 g008
Figure 9. The change in the accuracy when a different number of instances per rule was used considering both the material characteristics and the chemical composition information.
Minerals 13 00800 g009
Figure 10. The change in the accuracy when a different number of trees was constructed considering both the material characteristics and the chemical composition information.
Minerals 13 00800 g010
Table 1. Comparison of the applied methods that were constructed with their optimal hyper-parameters on the mineral data.
DataMethodAccuracyPrecisionRecallF-ScoreAUC
MAT_CHARRF89.230.8800.8920.8800.958
PART88.910.8850.8890.8730.938
PART Forest90.350.9030.9040.8890.957
CHEM_COMPRF78.460.6860.7850.6990.633
PART76.690.6760.7670.7060.630
PART Forest79.260.8020.7930.8500.661
ALLRF90.030.8950.9000.8880.952
PART88.100.8700.8810.8730.901
PART Forest90.350.9060.9040.8890.959
Disclaimer/Publisher’s Note: The statements, opinions and data contained in all publications are solely those of the individual author(s) and contributor(s) and not of MDPI and/or the editor(s). MDPI and/or the editor(s) disclaim responsibility for any injury to people or property resulting from any ideas, methods, instructions or products referred to in the content.

