Article

Application and Significance of the Wavelet–Fractal Method on the Data of the Induced Polarization Method in the Graphite Deposits of Datong, China

1
School of Earth Resources, China University of Geoscience, Wuhan 430074, China
2
217 Team of Shanxi Geological Survey Bureau, Datong 037008, China
*
Author to whom correspondence should be addressed.
Minerals 2023, 13(6), 760; https://doi.org/10.3390/min13060760
Submission received: 24 April 2023 / Revised: 29 May 2023 / Accepted: 29 May 2023 / Published: 31 May 2023
(This article belongs to the Special Issue Digital Geosciences and Mineral Exploration)

Abstract

:
Wavelet transformation has been widely used in geophysical and geochemical exploration, and the fractal feature of wavelet coefficients has recently stood out from many wavelet threshold methods. We introduced the wavelet–fractal method to analyze the polarizability and resistivity of graphite deposits. Due to the unique nature of graphite-bearing gneiss, characterized by high polarizability and low resistivity, we concluded that the polarizability background mode is better suited to depict the morphology of the graphite-bearing formation, with the resistivity background mode serving as complementary information for verification. Symlets5 is regarded as the optimal mother wavelet to indicate the characteristics of graphite ore by means of comparison and analysis. The polarizability anomalies showed two different linear forms: the direction of the measuring line and the strike of the ore bodies. According to the data of drill holes on the profile, we inferred that the high values of the anomaly mode can be used to delineate the target area where the graphite is enriched. Combining the application of both modes, we used the wavelet–fractal method for the quantitative prediction and effective selection of a potential area with a high grade. The approach used in this current study can be extended to the prospecting of other graphite deposits or sedimentary–metamorphic deposits containing conductive minerals, where geochemical and geophysical data are available.

1. Introduction

In digital signal processing, the conventional denoising algorithms would lose some useful information when eliminating noise [1]. In order to address this dilemma, Mallat developed the wavelet technique to approach anomaly–background separation in geophysical data processing [2]. The wavelet analysis represents the signal’s characteristics, both in the time domain and the frequency domain, which means that the noise signal and the active signal can have excellent access on a different frequency [3]. At present, wavelet analysis has been widely used in many scientific fields such as biology, imaging, the environment and earth science [4,5,6,7]. In the field of geoscience, geophysical and geochemical data reflect various geological processes and products including targeting and noises in mineral exploration [8]. Wavelet analysis is an advanced data analysis tool, obtaining remarkable results in denoising seismic signals and identifying geothermal targets [9,10], as well as in the magnetic and transient electromagnetic [11,12] fields, gravity and ground-penetrating radar data analysis [13,14], geochemical information recognition [8,15], and so on [16,17]. However, the separation of anomalies from background levels, including noises, is a necessary and significant process. Donoho et al. [18] proposed a procedure named WaveShrink to suppress noise by thresholding the empirical wavelet coefficients, and Coifman et al. [19] developed the translation invariant single wavelet denoising to improve the procedure. Bruce provided formulas to compute the variance and bias for WaveShrink [20]. On this basis, a large number of threshold denoising algorithms have been studied; for example, Tao wrote a new threshold function to take the threshold [21], Cui et al. [22] used a threshold estimator with exponential parameters for selecting the threshold, Kumlu removed clutter by using sub-space [23], and so on [24]. Chen and Cheng confirmed that the cumulative (frequency) number of the wavelet coefficient conforms to a power–law relationship and utilized the Wavelet-Number (W-N) model to quantitatively determine the best threshold value for the separation of geophysical and geochemical anomalies [8]. The W-N model is currently the most widely and recognized method for threshold selection [25,26].
Because the graphite vein has stronger electrical conductivity than the surrounding rocks, the induced polarization method has an obvious effect on graphite deposits. Thus, high polarizability and low resistivity can be used as an important indicator in the exploration of graphite deposits [27]. Polarizability data can show the differences of the electrical conductivity in rocks, such as the difference of the element’s abundance in the soil, which suggests that abnormal information of the polarizability data can be extracted by the wavelet technique. At present, there are rare studies using the wavelet technique to study the polarizability and resistivity; Han’s research determined that wavelet analysis can effectively suppress local interference and smooth the polarizability and resistivity curves. Additionally, wavelet transform can ensure that the shape and spatial distribution of anomalies are clear and reach a high fidelity [28]. Therefore, the W-N method is introduced into the induced polarization (IP) method to analyze the polarization and resistivity in this research, in order to solve the qualitative method which only uses the contour map of polarization and resistivity to identify the ore-causing anomalies.
With the development of wavelet theory, many wavelets have been developed to meet different fields, and all wavelets are defined by various mathematical equations which indicate their specific shape, amplitude, wavelength, and frequency. Wavelet transform was mainly divided into continuous wavelet transform (CWT) and discrete wavelet transform (DWT) [29]. The CWT is suitable for the analysis of stationary data with a large amount of computation, whereas the DWT only analyzes the orthogonal values of exponential series form to transform and reverse the original signal, which greatly reduces the amount of operations, and its orthogonal values have a physical significance [30]. In general, each wavelet has a different form and function. Goyal et al. [31] applied the Poisson wavelet transform to analyze gravity and magnetic data; the results offered a possibility for primary information of sub-basaltic sediment thickness. According to Zhang’s theory and experiment, Bior2.4 has been determined to be the optimal mother wavelet for seismic signal denoising [32]. Pourgholam used Symlets8 to analysis Zn and Pb samples, and the result showed in connection with drilling exploration [25]. Torshizian et al. [26] compared the Daubechies2 and Morlet wavelets and determined that the Morlet is better than the Daubichies2. By comparing the analysis results of different wavelets, some scholars concluded that Daubechies4 has a better processing effect on electrical noise in well logging [33,34]. Therefore, it is important to note that the selection and optimization of a mother wavelet are different based on different target characteristics. Symlets (Sym) is a compact support and symmetric orthogonal wavelet, which reduces the phase distortion during signal analysis and reconstruction [25]. As the scaling of the wavelet increases, more computing time is needed, and more wavelet coefficients with high amplitudes are generated. If the scaling is short and the vanishing moment is low, the signal energy is not powerful; therefore, most applications of wavelets with the vanishing moments are between five and eight [35]. Thus, we selected Sym5–Sym8 to deduce which mother wavelet is better suited to anomaly extraction from the IP method in this research.

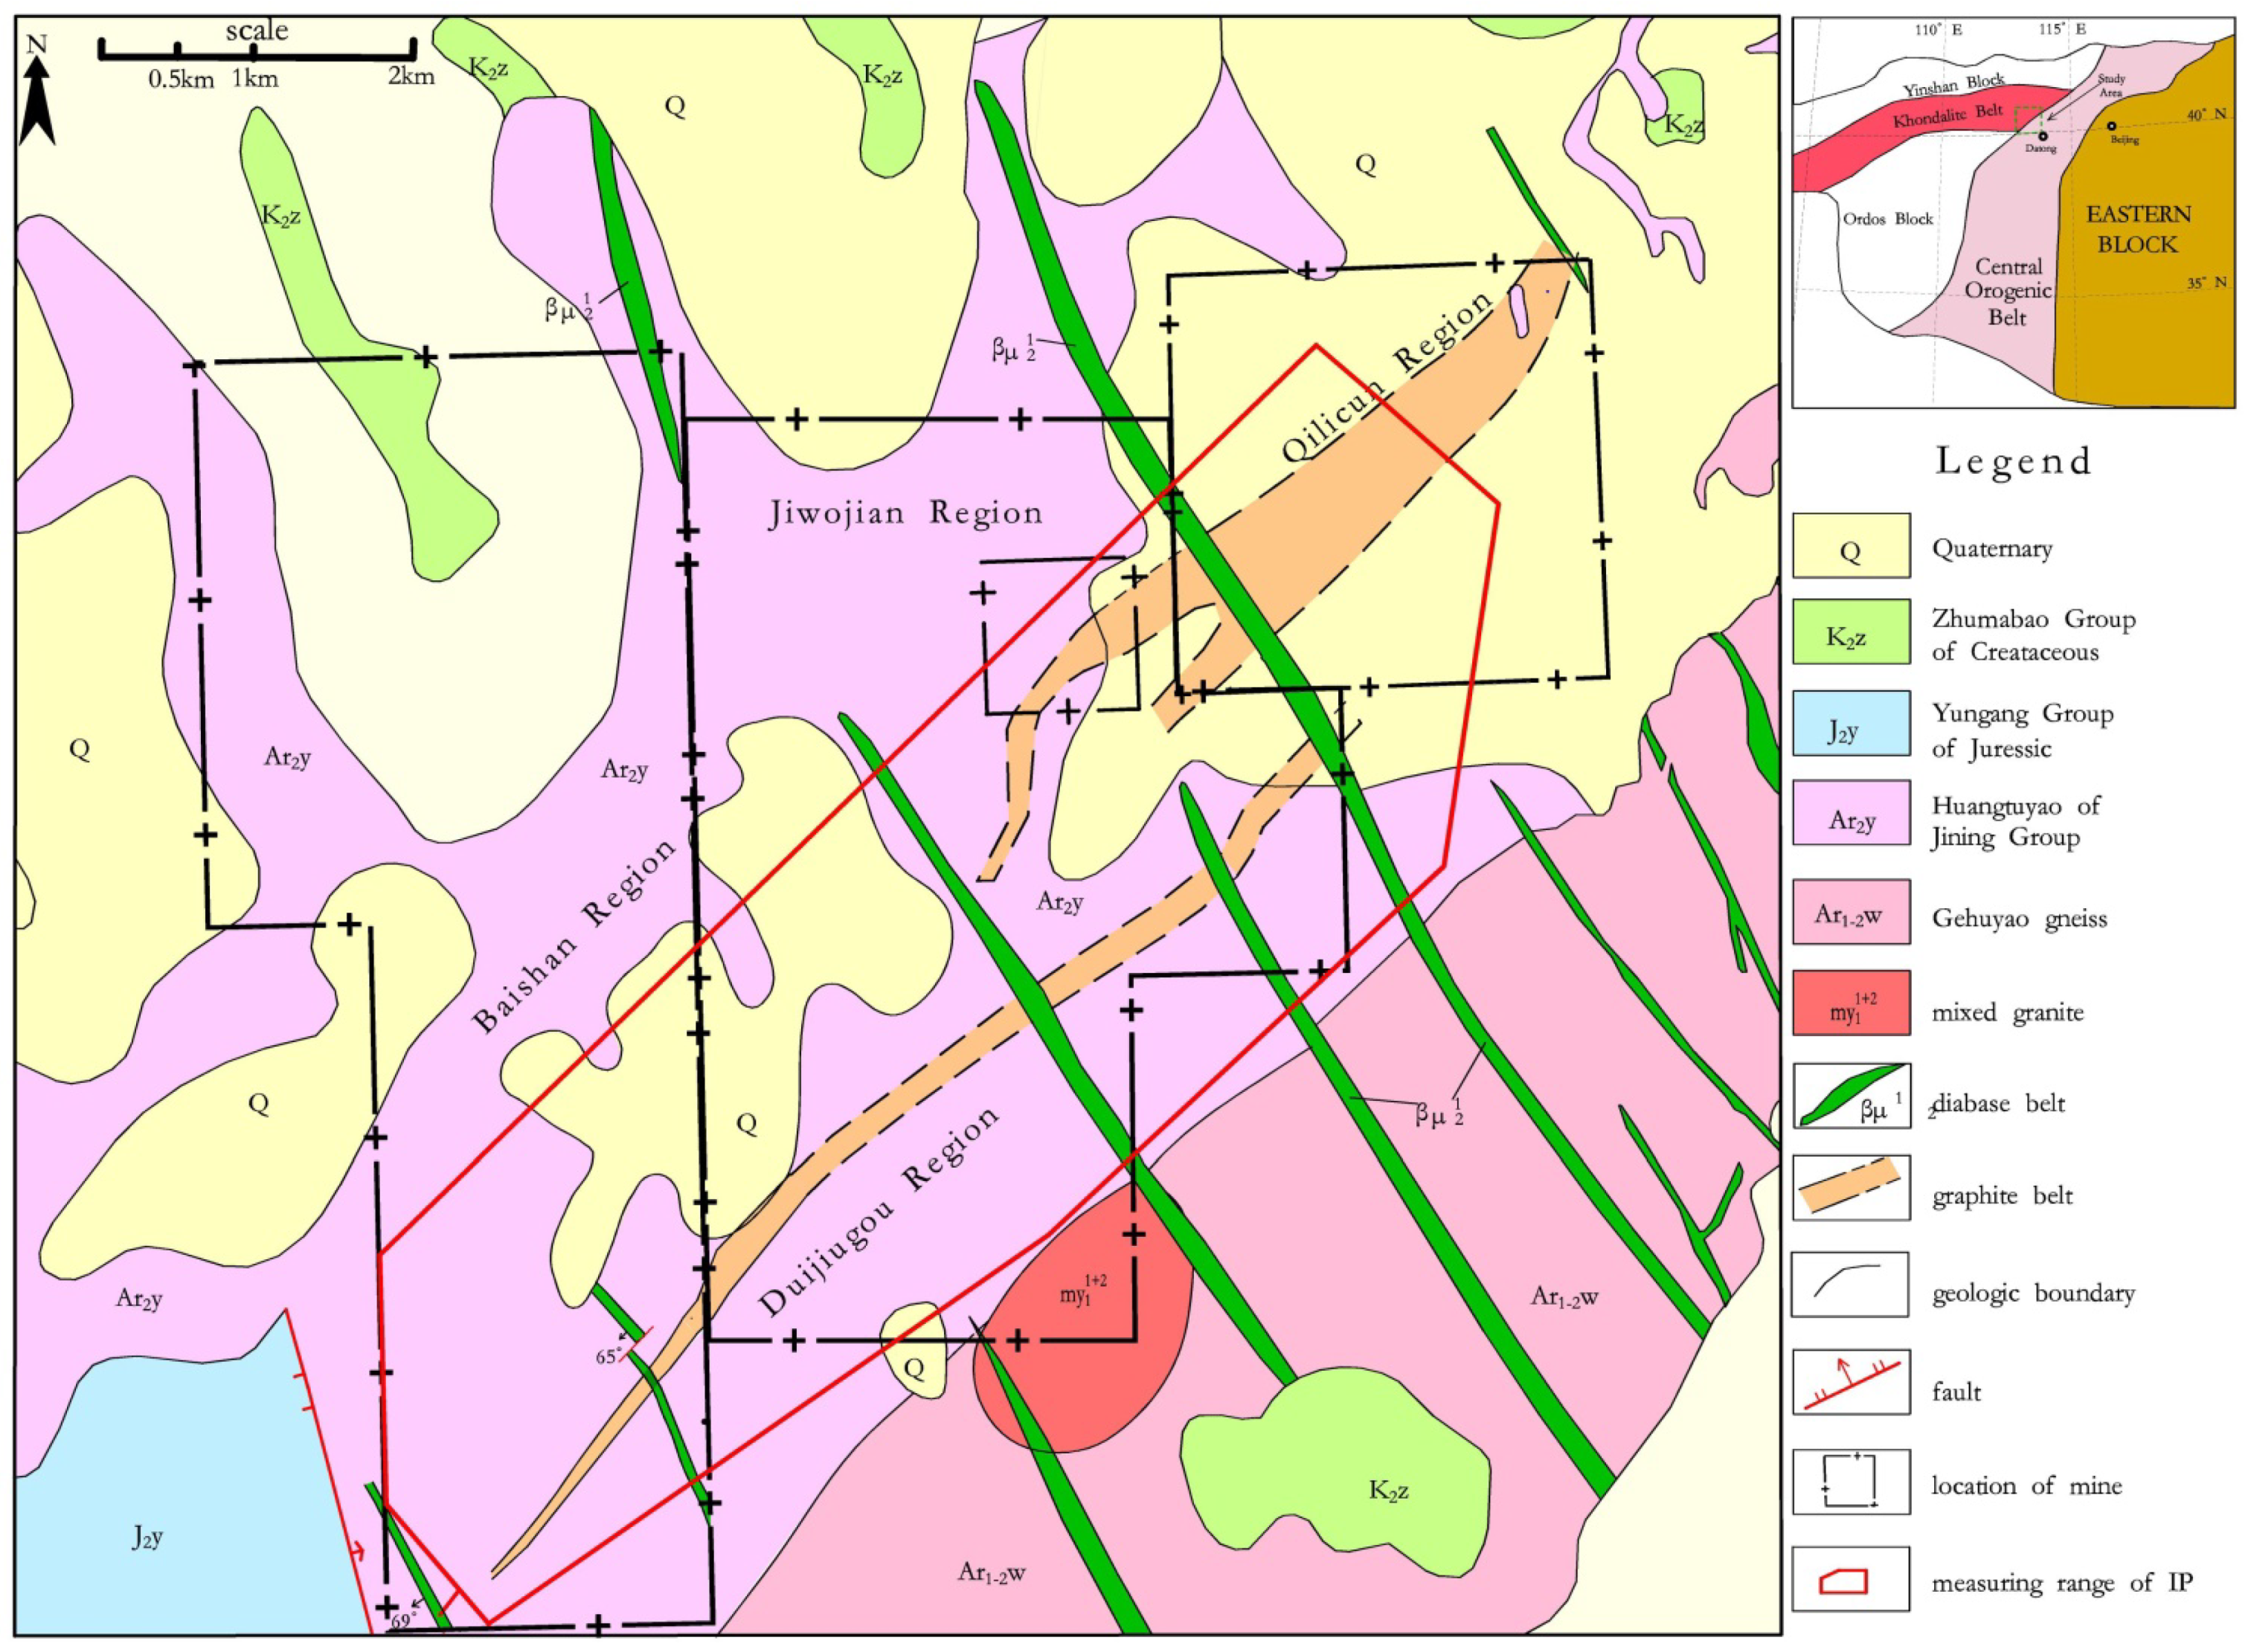
2. Geological Setting

The Xinrong graphite ore belt of Datong is approximately 23km in length, in a NE–SW direction on the margin of the North China Craton (NCC), and the NCC is the largest enriched area of crystalline graphite deposit in China. At present, 52 million tons of crystalline graphite has been identified in the exploration areas of the Xinrong mine belt [36]. In this area, the Middle Archaean Huangtuyao Formation of the Jining Group is the ore-bearing stratum. The Huangtuyao Formation can be divided into two rock types with the content of garnet: graphite-bearing gneiss and garnet-bearing gneiss. When the content of garnet in the rock increases, the graphite content correspondingly decreases, showing a gradual relationship. The mineral composition of the graphite-bearing gneiss mainly includes plagioclase (35%–55%), quartz (5%–35%), biotite (5%–15%), and graphite (1%–7%). The content of quartz varies greatly; when the content of graphite is high, the content of quartz is low [37]. Moreover, the graphite-bearing gneiss contains a lot of zircon, apatite, pyrite, and a very small amount of chlorite, diopside, and epidote. After weathering on the surface, the rocks show uneven kaolinization, sericite and limonite, which present as an earth brown and a light greyish yellow. The graphite-bearing gneiss is a generally monoclinal structure, with an inclination of 272–340° and obliquity of 60–88°. The Cretaceous Zhumabao Formation is scattered throughout the region, and a few Middle Jurassic Yungang Formation outcrops occur in the southern part of the region [38]. This area additionally developed some steep diabase belts from the Luliang stage, which are primarily oriented in the NW direction and contribute to the fracturing of the ore bodies (Figure 1). The main mineral components of diabase include plagioclase and diopside, with particle sizes of 0.5–1.5 mm. Diopside typically exhibits a hornblende reaction edge or has been altered into hornblende and chlorite.

3. Methods

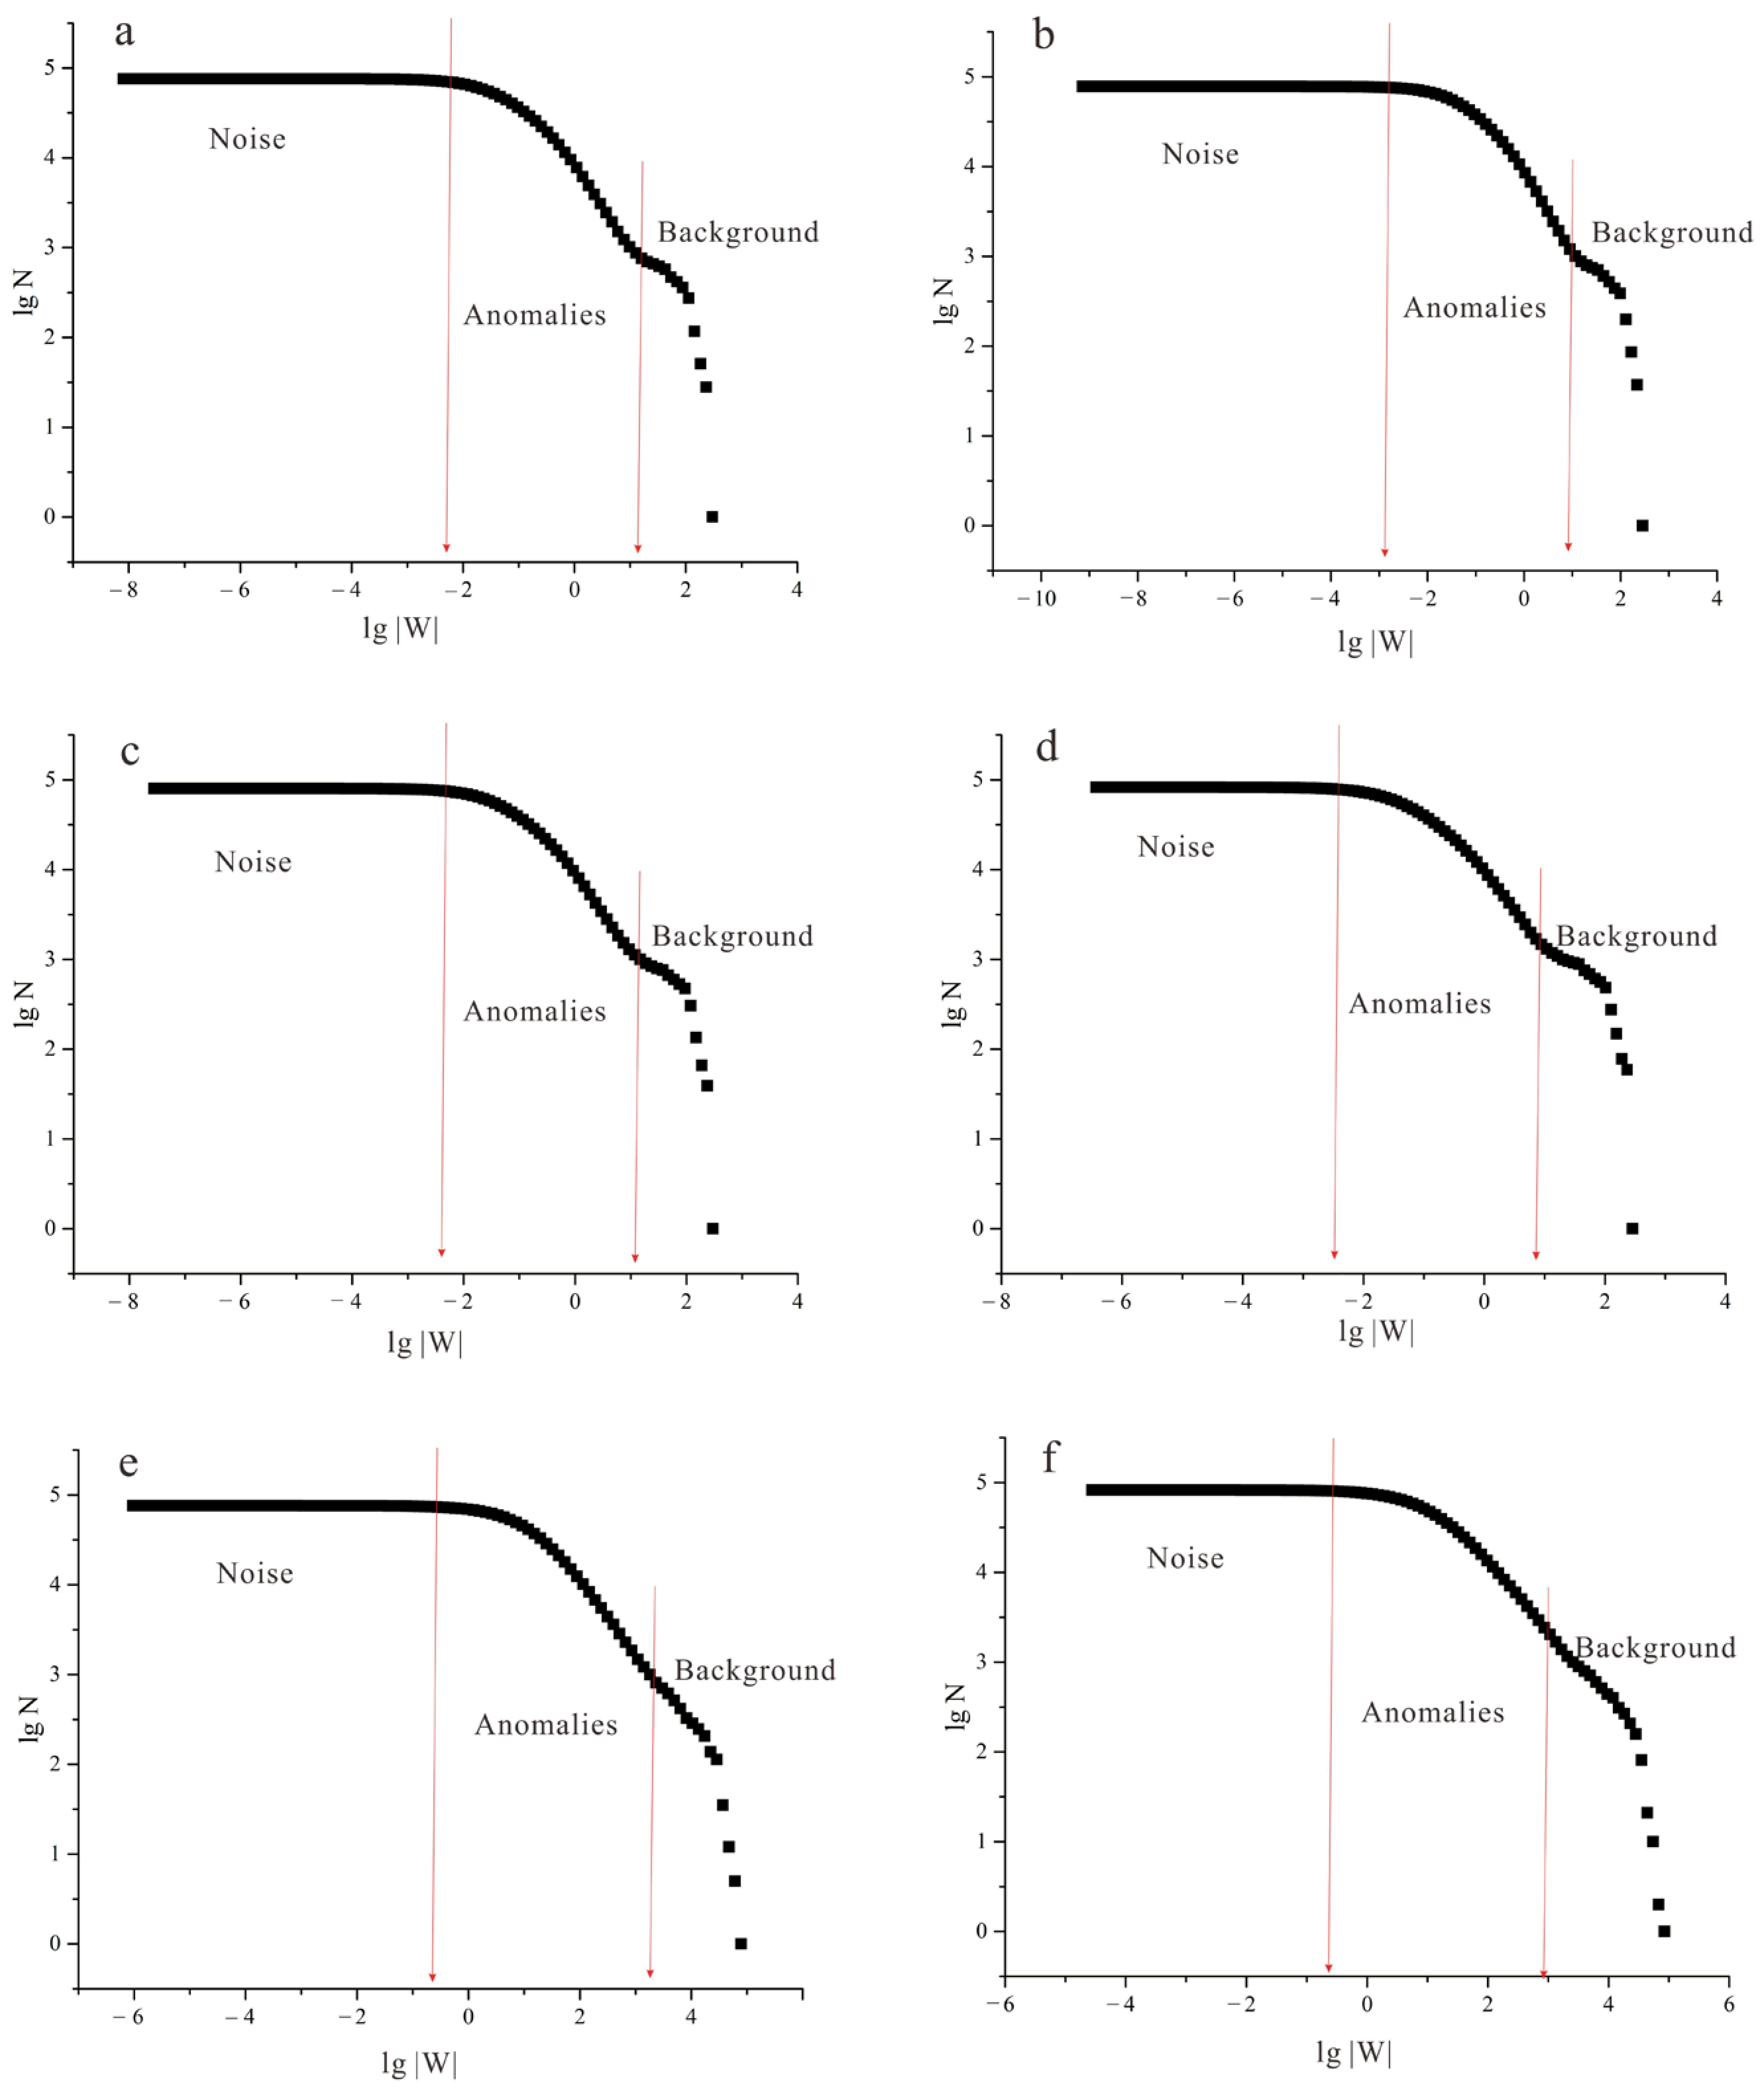
3.1. Wavelet-Number (W-N) Method

Wavelet analysis is a multi-scale method which was developed during the 1980s, and it has powerful locality and compression properties [8]. In general, the routine wavelet transform uses the so-called pyramid algorithm to divide the signal into a scale coefficient and a sequence of wavelet coefficients to show different frequency characteristics [39]. Another type of filtering method is to statistically determine classification thresholds by the sparsity and compressibility of wavelets with the Gaussian Model [40]. Chen and Cheng confirmed the wavelet coefficients matched a power–law distribution and offered the statistical significance, and the heavy-tailed and sharply peaked results of the wavelet coefficients in this distribution outperformed the generalized Gaussian distribution and Gaussian mixture distribution [8]. Further, using the power–law distribution to establish the W-N fractal model, this model has three steps: compute the coefficients of the signal, process the thresholds of these coefficients, and inverse the filtered signal. Wavelet data processing and inversion are performed by Matlab; for the wavelet transform, the wavelet filter bank is used to calculate the wavelet coefficients of the given mother wavelet ψ(t) in the translation and scaling processes. The mother wavelet ψ(x) and the wavelet coefficient w(x) are followed with scaling factor a and shift parameters b [26]:
ψ a , b ( x ) = 1 2 a ψ x k 2 b 2 a
w a , b ( x ) = f ( x )   ψ a , b 1 2 a ψ x k 2 a 2 a d t
The power–law function of the wavelet coefficients is as follows:
N (W) = Cn W−αn
W is the wavelet coefficients, and N(W) is the cumulative number (or area) of wavelet coefficients greater than a threshold value. Cn is a constant, and αn is the exponent associated with the smallest singularity, and n represents the different underlying regimes of self-similarity in the multifractal distribution of wavelet coefficients. The values of n are 1, 2, and 3, indicating anomaly, background, and noise, respectively [8,25,26,27]; each wavelet coefficient distribution appears to follow distinct scaling distributions.

3.2. Induced Polarization (IP) Method

The induction polarization (IP) method is an important geophysical prospecting method that is conducted by obtaining the resistivity magnitude of lithological properties and acquiring polarization information (charge storage) simultaneously, effectively for use in conductive minerals and oil reservoirs [41,42,43,44]. When an electrical current is stably injected through the ground surface, part of that electrical power is stored in the medium. If the current is cut off, the stored energy is dissipated [45]. The progress of voltage dissipation is the phenomenon of IP and shows a typical relaxation with time [46]. The physical cause of the voltage attenuation is related to the existence of clay minerals in the weathered zones and the presence of conductive minerals in the rocks, and the current and the voltage usually show different values in the phase lag [47]. The polarizability is used to measure the difficulty of the electrode reaction in the process of charging and discharging [42]. Electrode polarization is especially significant in the graphite ore, as even low graphite concentrations can produce an IP response due to the significant conductivity contrast between the graphite mineral and the surrounding rocks [48]. Therefore, IP measurement is considered an efficient way of delineating the graphite ores [49]. The IP measurement has two modes: time domain and frequency domain. Time domain-induced polarization (TDIP) uses two potential electrodes (M and N) to measure the voltage between electrodes (A and B) when the current is turned off, and this method is frequently used in field studies [50]. However, frequency domain-induced polarization (FDIP) is mostly applied in the laboratory setting, used to analyze different sites along the profiles where TDIP data were collected [51]. Therefore, we used TDIP to investigate the abnormal nature of graphite ore in this study.
Geophysical signatures are important for mineral prospecting. The physical properties of rocks form the geophysical premise and the basis of anomaly interpretation [52]. A total of 4 types of rock specimens (115 pieces in total) were collected from this area, and their polarizability and resistivity were measured. The results of the physical parameters found are listed in Table 1. Due to scale issues, the location of the samples and the point of TDIP measurement are not shown on the map; only the measurement range is shown in Figure 1. According to the data, the polarization values of all rocks except for graphite gneiss are relatively low; the maximum value is less than 7, and the average value is approximately 2. The polarizability value of graphite gneiss is considerably larger than that of the other rocks, indicating that the graphite anomaly can be perfectly expressed by the polarization. The mean resistivity of graphite gneiss is obviously lower than that of other rocks; it verifies that the graphite gneiss has stronger electrical conductivity than the surrounding rocks.

3.3. Data Processing

3.3.1. IP Data Set

The graphite vein has stronger electrical conductivity than the surrounding rock in this area; the IP method has an obvious effect on graphite deposits; high polarizability and low resistivity can be used as important indicators in the exploration of graphite deposits [27]. We used the IP method to collect a total of 10,000 data points, including the polarizability (ηS) and resistivity (ρS) of the samples, at a grid size of 100 × 20 m. The bearing of the geophysical base line was 315°, and the profiles were orthogonal to the ore bodies. The bidirectional pulse power supply mode of the short conductor was adopted for the TDIP. The current supplied was more than 1A, and the measurement period was 32 s. To improve the working efficiency and increase the exploration depth, electrical prospecting with a gradient array was carried out, and the maximum AB dipole distance was 1600 m, and the receiving dipole distance was 40 m which provided a depth of exploration down to 600 m in this area [53]. A standard interpretation of the measurements was adopted as follows: when ηS ≤ 3%, the total mean square relative of polarizability was less than 0.21; when ηS > 3%, the total mean square relative error of polarizability was less than 7%; and the total mean square relative error of resistivity was less than 12% [54].

3.3.2. Wavelet Analysis
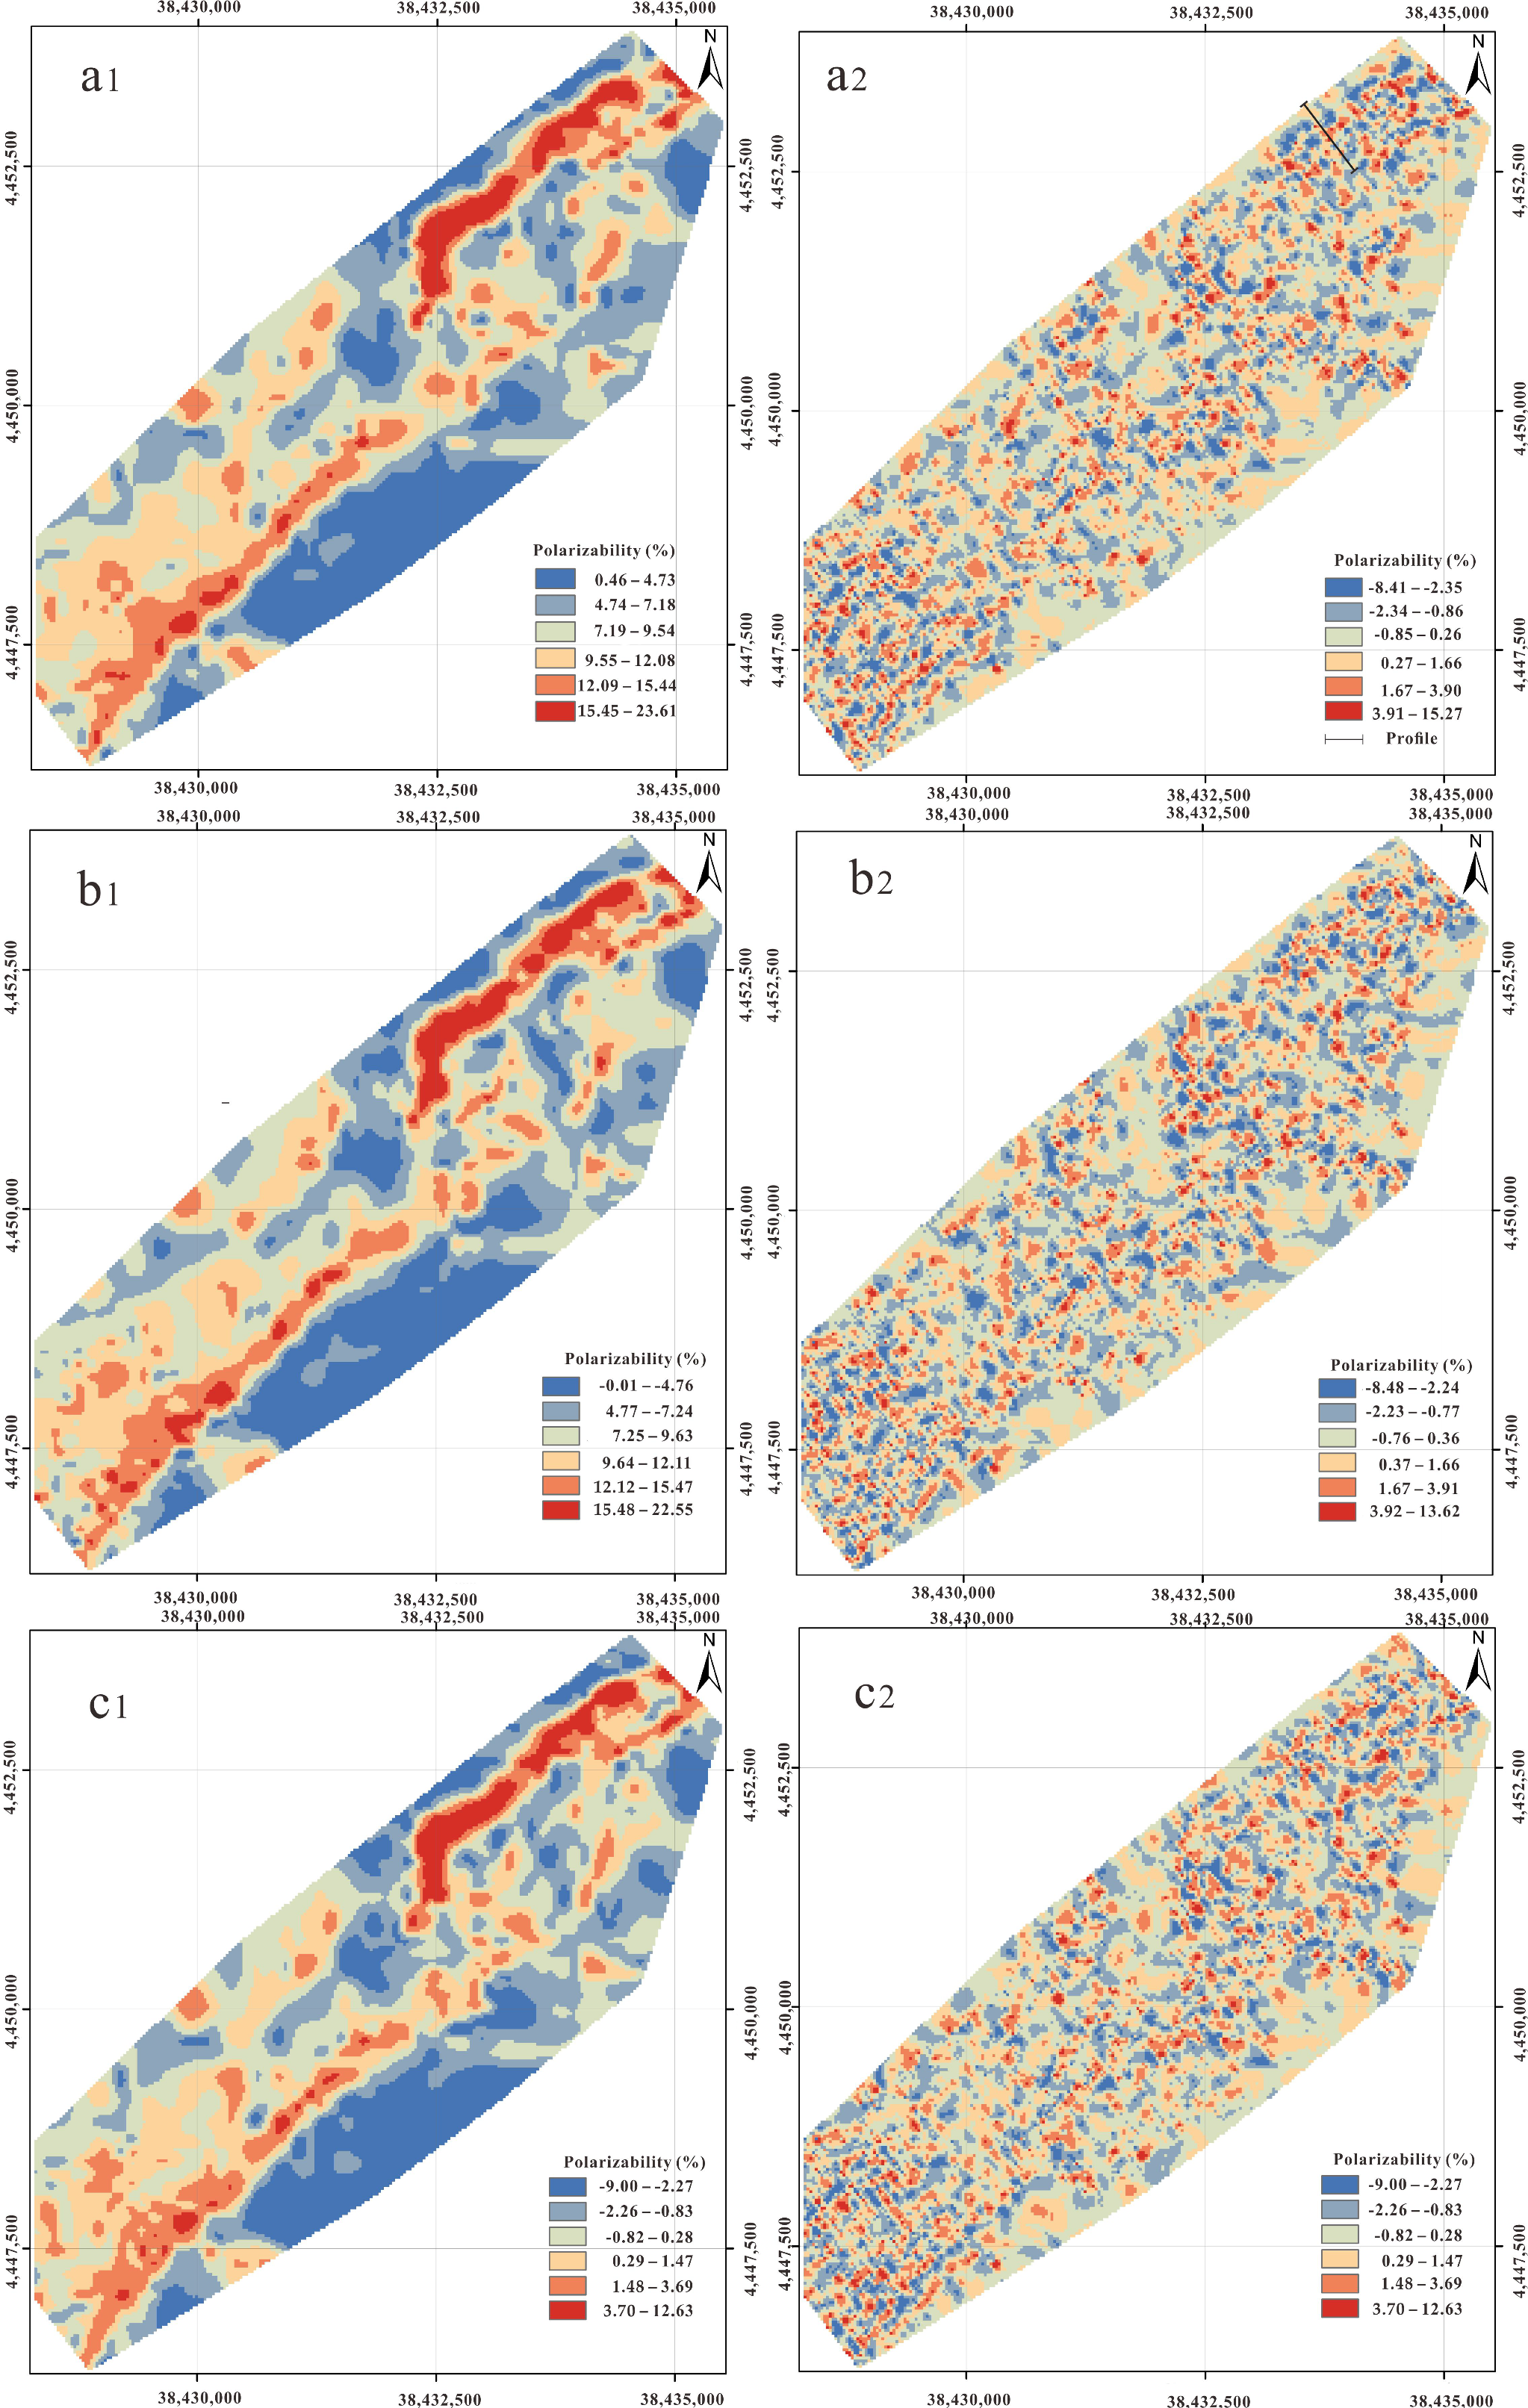
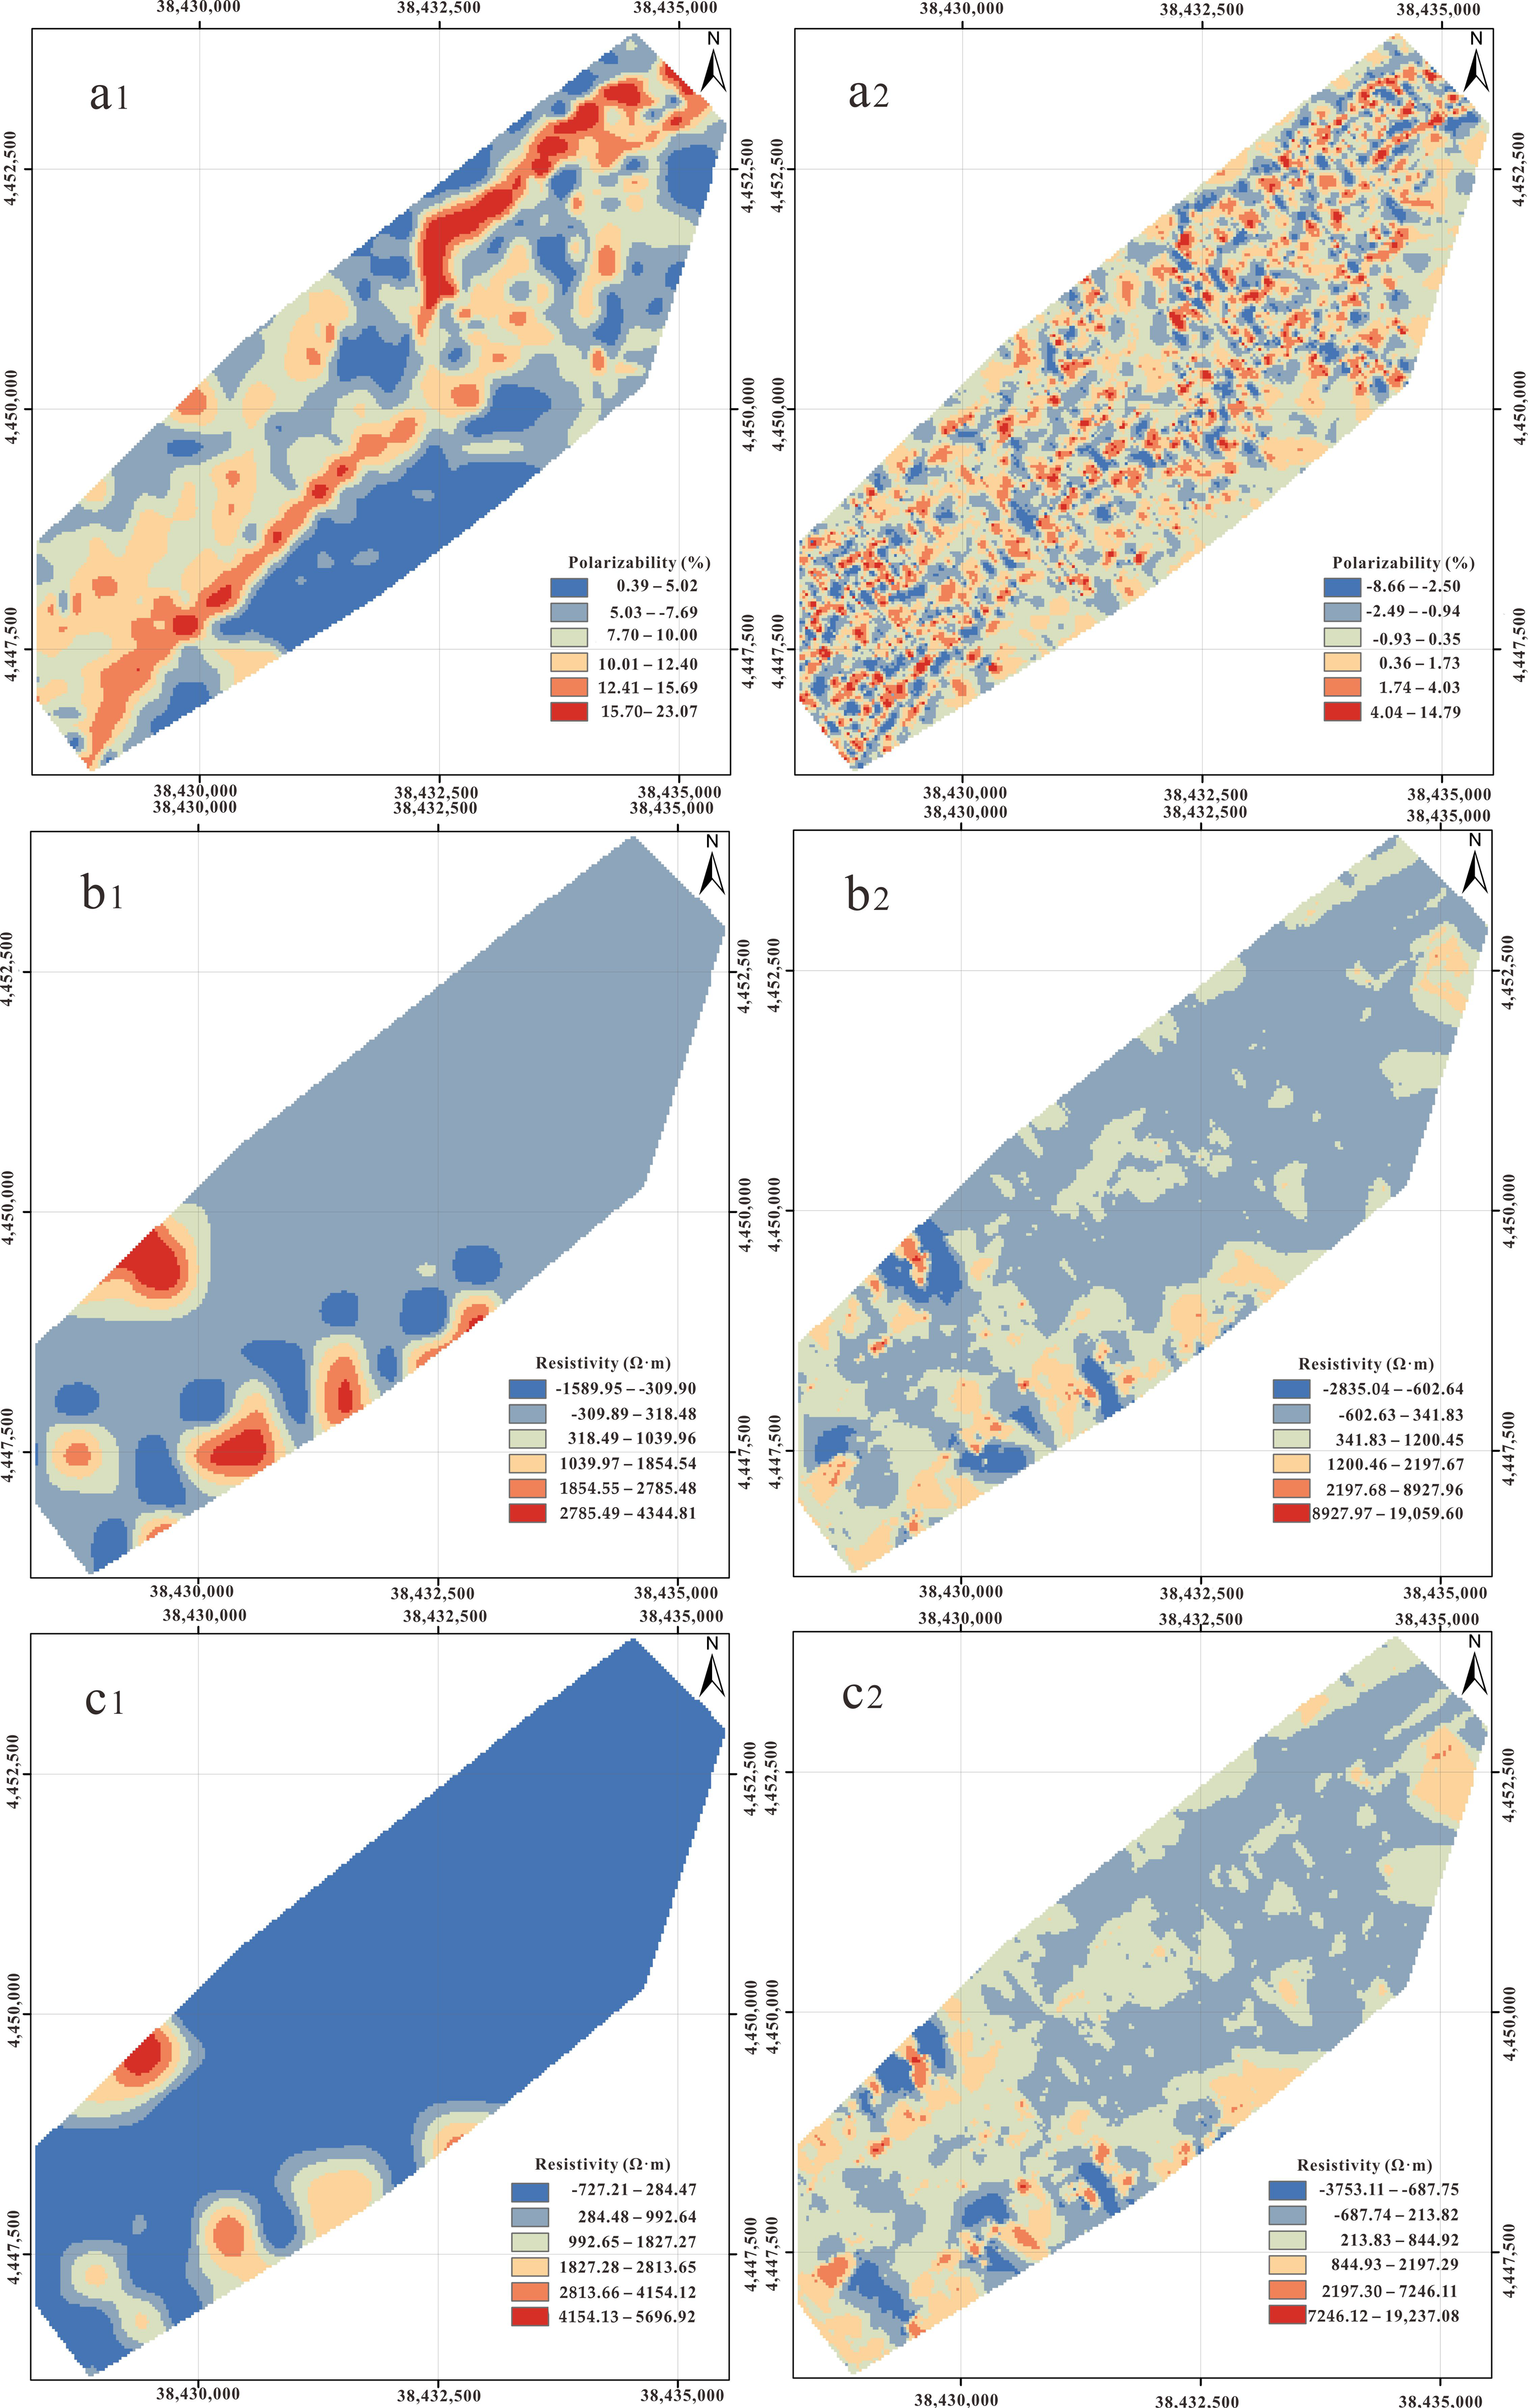
The polarizability and resistivity data measured by the IP method are used as analysis signals for wavelet transform, and the results of wavelet transformation provide information about the frequency pattern and signal structure of the analyzed data. Based on the characteristics of various wavelets and wavelet scales, we chose the Sym wavelet with the vanishing moments of 5–8 as the parent wavelet for the wavelet transform. The coefficients of the signal were counted, and a logarithmic scatter plot was formed on different scales. Based on the different underlying regimes of self-similarity in the multifractal distribution of wavelet coefficients, each wavelet coefficient distribution appears to follow distinct scaling distributions. These distributions separate the wavelet coefficient into anomaly and background, informing the determination of threshold values for inversion. Wavelet data processing and inversion were performed by Matlab.

4. Results

Based on the steps of the W-N method, the polarizability and resistivity of the IP method were transformed by the Sym wavelet, and the vanishing moments are from five to eight. The results of the wavelet coefficients are shown on the W–N lg–lg plot (Figure 2); the anomalies, background and noise are determined according to different fractal scales. From this figure, the polarizability and resistivity have obvious noise after wavelet transforms; however, the anomaly and background differentiation of the polarization are more obvious. Therefore, we mainly study the polarizability characteristics, assisted by the resistivity characteristics. The lg |W| noise values of the polarizability are concentrated between −3 and −2; Sym5 has the largest value, indicating that noise can be better removed. Using the threshold in Figure 2, the components of background and anomalies are inversed to obtain the contour map (Figure 3 and Figure 4).

5. Discussion

5.1. Background Mode

The background mode of the spectrum–area method, which is based on the Fourier transform, can reflect the characteristics of geological units [55]. Wavelet transform inherits and develops the localization of the Fourier transform and provides a ‘time-frequency’ window that can be changed to overcome the shortcomings [2,3,4,5,6,7,8]. This indicates that the background of a wavelet transform can additionally reflect the geologic units. Because the graphite-bearing gneiss in the Xinrong area belongs to the sedimentary–metamorphic rock types [36], the graphite ore bodies are considered a unique stratum which is ideal for testing the background mode of the W-N method. Four Sym wavelets with different vanishing moments are used to compute as the mother wavelets, which are compact support and symmetric orthogonal wavelets. Combined with the background mode of different wavelet transforms and the ore bodies’ distribution on the region’s geology, we conducted the favorable experiment of displaying ore bodies under different Sym transformations of the polarizability by spatial analysis and obtained the overlap ratio of the polarization anomalies and known ore bodies (Table 2). According to those data, except for Sym8, the anomalies range of the other wavelets’ background mode overlapped with ore bodies more than 85%, and the best effect of Sym5 was 87.25%, suggesting that the range of high values on the polarizability background mode of the Sym transform was basically consistent with that of two known main ore bodies. With the increase of vanishing moments, the low outlier shows a trend of increasing, whereas the high outlier shows a trend of decreasing. This result indicates a change in the range and continuity of the predicted ore body. Because the diabase destroys the ore bodies, and its polarization rate is low, according to the comparative analysis of the diabase occurrence and anomaly map, the polarizability background mode of Sym5 can well reflect the graphite-bearing strata. The resistivity background overall shows low quality with several local high anomalies. Although the cause of the resistivity anomaly cannot be determined, the range of the graphite ore bodies represents low quality, providing the evidence to support the speculation of polarization anomalies on graphite ore bodies. However, it can be found from Figure 4 that the resistivity can only be used as an auxiliary means rather than as a primary analysis target. Therefore, the Sym transformations of the polarizability can better display the distribution characteristics of a graphite-bearing stratum to a certain extent; however, Sym5 is the best choice of mother wavelet for the polarizability and resistivity data in this region.
In order to further excavate the information of the Sym transformation, we placed the ore bodies and diabase on the polarizability background mode of Sym5 (Figure 5). Diabase has the characteristics of low polarizability and rubs the ore bodies; this feature is significantly reflected in the polarization background mode. Where there is diabase, the polarizability is low, and the continuity of ore bodies is destroyed. Based on the above researches, we predicted the graphite’s potential area and delineated the metallogenic target. The potential area presents a zonal distribution with high outliers, which may be the extension of the ore bodies in the north, and its western part exhibits a northward trend, possibly disturbed by the presence of the diabase.

5.2. Anomaly Mode

In this research, the resistivity anomalies of wavelet transform have no relevance to ore bodies and will not be discussed here. The polarizability anomalies maps of four wavelet transforms are not significantly different, and the anomalies showed two different linear forms: the majority of anomalous positions are found distributed along the measuring line direction of the IP method, showing local anomalies of different points on the line; other abnormal orientations are distributed along the strike of the ore bodies. In order to determine the meaning of the anomalies in the anomaly mode, we selected a profile for analysis on the anomalies map of the Sym5 transform, where there were two kinds of high anomalies (Figure 2a). The details of Profile No. 3 are shown in Figure 6; we found that the high values in the anomaly mode were consistent with the actual ore bodies. For example, the grades of ore bodies in ZK302 and QZ306 corresponded to the high values of the abnormal mode; the ore bodies’ grades were 4.30 and 3.18, respectively. Additionally, it should be noted that less ore has been found in the other holes between ZK302 and QZ306, the area of which corresponds to the low values of the anomaly mode. The value of the abnormal mode is closely related to the content of graphite in the strata, indicating that the high value corresponds to the high grade of graphite ore bodies. Because there are many geological attributes that can affect the polarizability, we believed that the high values of the anomaly model could reflect the enrichment of graphite in a way; this suggested that high values could be used to delineate a target area where the graphite is enriched. Therefore, the anomaly mode can be used to judge the favorable area for mineralization in the graphite ore. Combined with the above conclusion and the prediction area of the polarizability background, we inferred the position of higher-grade ore bodies as the primary (key) exploration area on Figure 5.

6. Conclusions

In this research, we introduced the wavelet transform method to analyze the polarizability and resistivity data of the IP method and used the multifractal method to determine the threshold of wavelet coefficients. Four Sym wavelets with different vanishing moments were used as the mother wavelets in the computation; we found that the range of high values on the polarizability background mode of all the Sym transforms were basically consistent with that of two known main ore bodies, and the resistivity background mode as auxiliary information verified this conclusion. Combined with the regional geology, Sym5 is considered to be the best choice of mother wavelet for depicting the morphology of the graphite-bearing formation in this region.
The polarizability anomalies of wavelet transform showed two different linear forms: the direction of the measuring line of the IP method and the strike of the ore bodies. The high values of the measuring line showed the local anomalies of different points, whereas the high values of the ore bodies strike indicated the distribution of ore bodies. After analyzing a selected profile where two anomalies were significant, we inferred that the high values of the anomaly mode can reflect the enrichment of graphite and thus be used to delineate a target area enriched with graphite.
By using the polarizability background mode, we could confirm the range of ore-bearing strata and the potential area; by using the polarizability anomaly mode, we could judge the enrichment of graphite. Combining the application of both modes, we demonstrated that the W-N method can quantitatively predict and effectively select a potential area with a high grade for future exploration. The approach used in the current study can be extended to other graphite deposits or sedimentary–metamorphic deposits with conductive minerals in prospecting which have geochemical and geophysical data.

Author Contributions

Y.L. is the major contributor to this paper, including the writing of the manuscript and data processing; Q.X. provided many critical reviews and constructive suggestions; M.Z. assisted with the analysis of the data and revised the manuscript; R.B. assisted with the analysis of the data; J.L. provided the data. All authors have read and agreed to the published version of the manuscript.

Funding

This research was supported by Qinghai Provincial Non-ferrous Metal Geological and Minerals Exploration Bureau (Grant No. 2022jgky02).

Data Availability Statement

The data presented in this study are available on request from the corresponding author.

Conflicts of Interest

The authors declare no conflict interest.

References

  1. Gao, J.; Yuan, D.; Tong, Z. Autonomous pavement distress detection using ground penetrating radar and region-based deep learning. Measurement 2020, 164, 108077. [Google Scholar] [CrossRef]
  2. Mallat, S.G. A theory for multiresolution signal decomposition the wavelet representation. IEEE Trans. Pattern Anal. Mach. Intell. 1989, 11, 674–693. [Google Scholar] [CrossRef]
  3. Shan, W.Y.; Wai, M.Y.; Chi, H.; Billy, H. Performance of ground penetrating radar in root detection and its application in root diameter estimation under controlled conditions. Sci. China Earth Sci. 2016, 59, 145–155. [Google Scholar]
  4. Gish, T.J.; Dulaney, W.P.; Kung, K.J.S. Evaluating use of ground-penetrating radar for identifying subsurface flow pathways. Soil Sci. Soc. Am. J. 2002, 66, 1620–1629. [Google Scholar] [CrossRef]
  5. Tian, C.; Zheng, M.; Zuo, W. Multi-stage image denoising with the wavelet transform. Pattern Recognit. 2023, 134, 109050. [Google Scholar] [CrossRef]
  6. Liang, H.; Zhang, H. Wavelet-domain RTM image enhancement using inversion-based imaging condition. Geophysics 2019, 84, 1–45. [Google Scholar] [CrossRef]
  7. Cheng, X.; Xu, Z.; Yu, S. A wavelet coherence approach to detecting ecosystem services trade-off response to land use change. J. Environ. Manag. 2022, 316, 115160. [Google Scholar] [CrossRef]
  8. Chen, G.X.; Cheng, Q.M. Fractal-based wavelet filter for separating geophysical or geochemical anomalies from background. Math. Geosci. 2018, 50, 249–272. [Google Scholar] [CrossRef]
  9. Kong, X.L.; Chen, H.; Hu, Z.Q. Surface wave attenuation based polarization attributes in time-frequency domain for multicomponent seismic data. Appl. Geophys. 2018, 15, 99–110. [Google Scholar] [CrossRef]
  10. Bauer, K.; Norden, B.; Ivanova, A. Wavelet transform-based seismic facies classification and modelling: Application to a geothermal target horizon in the NE German Basin. Geophys. Prospect. 2019, 68, 466–482. [Google Scholar] [CrossRef]
  11. Herrera, H.; Lopes, D.; Cruz, O. Crustal thermal structure of the brazilian equatorial margin using fourier and continuous wavelet transforms: A comparative analysis based on different magnetic datasets. Surv. Geophys. Int. Rev. J. Geophys. Planet. Sci. 2022, 43, 883–912. [Google Scholar] [CrossRef]
  12. Wu, X.; Xue, G.; Xiao, P.; Li, J.; Liu, L.; Fang, G. The removal of the high-frequency motion-induced noise in helicopter-borne transient electromagnetic data based on wavelet neural networks. Geophysics 2018, 84, 1JF-Z5. [Google Scholar]
  13. Al-Qadi, I.L.; Shan, Z.; Shangguan, P. Railway ballast fouling detection using GPR data: Introducing a combined time–frequency and discrete wavelet techniques. Near Surf. Geophys. 2016, 14, 145–153. [Google Scholar]
  14. Yin, J. Application of local mean decomposition in marine gravity anomaly data processing. In Proceedings of the 2016 5th International Conference on Advanced Materials and Computer Science, Qingdao, China, 26–27 March 2016. [Google Scholar]
  15. Bolzan, M.; Echer, E.; Franco, A. Identification of the planetary magnetosphere boundaries with the wavelet multi-resolution analysis. J. Atmos. Sol. Terr. Phys. 2022, 230, 105842. [Google Scholar] [CrossRef]
  16. Li, X.F.; Liang, W.; Jiao, L.; Yan, J.W.; Zhang, W.B.; Wang, F.J.; Gou, F.; Wang, C.X.; Cheng, X.; Shao, Q.Q. Identification of dominant climate variables on spatiotemporal variation in reference evapotranspiration on the loess plateau, China. Chin. Geogr. Sci. 2022, 32, 620–642. [Google Scholar] [CrossRef]
  17. Bai, J.; Ren, J.; Yang, Y. Object detection in large-scale remote-sensing images based on time-frequency analysis and feature optimization. IEEE Trans. Geosci. Remote Sens. 2022, 60, 1–16. [Google Scholar] [CrossRef]
  18. Donoho, D.L.; Johnstone, I.M. Adapting to unknown smoothness via wavelet shrinkage. J. Am. Stat. Assoc. 1995, 90, 1200–1224. [Google Scholar] [CrossRef]
  19. Coifman, R.R.; Donoho, D.L. Translation-Invariant De-Noising Wavelets and Statistics; Springer: Berlin/Heidelberg, Germany, 1995; pp. 125–150. [Google Scholar]
  20. Bruce, A.G.; Gao, H.Y. WaveShrink: Shrinkage functions and thresholds. Proc. SPIE Int. Soc. Opt. Eng. 1995, 2569, 270–281. [Google Scholar]
  21. Tao, H.Y.; Qin, H.F.; Yu, C.B. Research of signal denoising method based on an improved wavelet threasholding. Piezoel Ectectrics Acoustooptics 2008, 30, 93–95. [Google Scholar]
  22. Cui, G.Z.; Zhang, Z.X.; Yang, L.Z. An improved wavelet threshold denoising algorithm. Mod. Electron. Tech. 2019, 42, 50–53. [Google Scholar]
  23. Kumlu, D.; Erer, I. The multiscale directional neighborhood filter and its application to clutter removal in GPR data. Signal Image Video Process. 2018, 12, 1237–1244. [Google Scholar] [CrossRef]
  24. Zhang, C.; Baan, M. Strong random noise attenuation by shearlet transform and time-frequency peak filtering. Geophysics 2019, 84, 1–49. [Google Scholar]
  25. Pourgholam, M.M.; Afzal, P.; Yasrebi, A.B. Detection of geochemical anomalies using a fractal-wavelet model in ipack area, central Iran. J. Geochem. Explor. J. Assoc. Explor. Geochem. 2021, 220, 220. [Google Scholar] [CrossRef]
  26. Torshizian, H.; Afzal, P.; Rahbar, K. Application of modified wavelet and fractal modeling for detection of geochemical anomaly. Chem. Der Erde Geochem. 2021, 4, 125800. [Google Scholar]
  27. Rakoto, H.A.; Riva, R.; Ralay, R.; Boni, R. Evaluation of flake graphite ore using self-potential (SP), electrical resistivity tomography (ERT) and induced polarization (IP) methods in east coast of Madagascar. J. Appl. Geophys. 2019, 169, 134–141. [Google Scholar]
  28. Han, S.L.; Zhang, S.G.; Liu, J.X.; Hi, H.J.; Zhang, W.S. Integrated interpretation of dual frequency induced polarization measurement based on wavelet analysis and metal factor methods. Trans. Nonferrous Met. Soc. China 2013, 23, 1465–1471. [Google Scholar] [CrossRef]
  29. Afzal, P.; Ahmadi, K.; Rahbar, K. Application of fractal-wavelet analysis for separation of geochemical anomalies. J. Afr. Earth Sci. 2016, 128, 27–36. [Google Scholar] [CrossRef]
  30. Yang, H.J.; He, Z.B.; Wu, X.M. Stratigraphic Interfaces Identification based on the wavelet transform of geophysical logging data. Uranium Geol. 2021, 37, 262–268. [Google Scholar]
  31. Goyal, P.; Tiwari, V.M. Application of the continuous wavelet transform of gravity and magnetic data to estimate sub-basalt sediment thickness. Geophys. Prospect. 2014, 62, 148–157. [Google Scholar]
  32. Zhang, H.; Chen, X.H.; Yang, H.Y. Optimistic wavelet basis selection in seismic signal noise elimination. Oil Geophys. Prospect. 2011, 46, 70–75. [Google Scholar]
  33. Fang, W.J.; Fan, Y.R.; Deng, S.G.; Li, X. Selection of optimum wavelet base of multiscale analysis in well loggong. Coal Geol. Explor. 2006, 34, 71–74, (In Chinese with English abstract). [Google Scholar]
  34. Darowicki, K.; ZieliSki, A. Optmal wavelet choice in electrochemical experiments. Fluct. Noise Lett. 2006, 6, L215–L225. [Google Scholar] [CrossRef]
  35. Xie, H.J.; Li, J.R.; Dong, Y. Influence of wavelet base and threshold parameters on denoising effect of transient electromagnetic signal. J. Xi’an Univ. Sci. Technol. 2020, 40, 682–690. [Google Scholar]
  36. Liang, Y.Q.; Zhao, Y.; Wu, G.C.; Zhang, Y.; Xia, Q.L. Research on geochemistry characteristics and genesis of the graphite deposit in Xinrong district of Datong city, Shanxi province. Acta Geosci. Sin. 2020, 41, 827–834. [Google Scholar]
  37. Liang, Y.Q.; Xia, Q.L.; Zhang, Y.; Zhao, Y. Geochemical characteristics and indication of graphite deposits in Xinrong Region, Shanxi, China. Geochem. Explor. Environ. Anal. 2022, 22, geochem2021-086. [Google Scholar] [CrossRef]
  38. Liang, Y.Q.; Zhang, Y.; Li, Y.; Liu, J.K. Detailed Investigation Report of Graphite Mine in Qilicun-Duijiugou of Xinrong District, Datong, Shanxi; Government of Shanxi Province: Datong, China, 2021; (In Chinese with English abstract).
  39. Mallat, S. A Wavelet Tour of Signal Processing; Academic Press: San Diego, CA, USA, 1999. [Google Scholar]
  40. Liu, J.; Moulin, P. Information-theoretic analysis of interscale and intrascale dependencies between image wavelet coefficients. IEEE Trans. Image Process. 2001, 10, 1647–1658. [Google Scholar]
  41. Pelton, W.H.; Ward, S.H.; Hallof, P.G.; Sill, W.R.; Nelson, P.H. Mineral discrimination and removal of inductive coupling with multifrequency IP. Geophysics 1978, 43, 588–609. [Google Scholar]
  42. Seigel, H.; Nabighian, M.; Parasnis, D.S.; Vozoff, K. The early history of the induced polarization method. Lead. Edge 2007, 3, 312–321. [Google Scholar]
  43. Gianluca, F.; James, R.; Andrew, B.; Andrew, B.; Aurelie, G.; Anders, V.C.; Esben, A. Resolving spectral information from time domain induced polarization data through 2-D inversion. Geophys. J. Int. 2013, 2, 631–646. [Google Scholar]
  44. Well, A.; Slater, L.; Nordsiek, S. On the relationship between induced polarization and surface conductivity: Implications for petrophysical interpretation of electrical measurements. Geophys. J. Soc. Explor. Geophys. 2013, 78, 315–325. [Google Scholar]
  45. Ghorbani, A.; Camerlynck, C.; Florsch, N.; Cosenza, P.; Revil, A. Bayesian inference of the Cole-Cole parameters from time and frequency-domain induced polarization. Geophys. Prospect. 2007, 55, 589–605. [Google Scholar] [CrossRef]
  46. Seigel, H. Mathematical formulation and type curves for induced polarization. Geophysics 1959, 24, 547–565. [Google Scholar] [CrossRef]
  47. Marshall, D.J.; Madden, T.R. Induced polarization: A study of its causes. Geophysics 1959, 24, 790–816. [Google Scholar] [CrossRef]
  48. Gurin, G.; Titov, K.; Ilyin, Y.; Tarasov, A. Induced polarization of disseminated electronically conductive minerals: A semi-empirical model. Geophys. J. Int. 2015, 200, 1555–1565. [Google Scholar] [CrossRef]
  49. Bhattacharya, B.B.; Biswas, D.; Kar, G.; Ghosh, H. Geoelectric exploration for graphite in the Balangir district, Orissa, India. Geoexploration 1984, 22, 129–143. [Google Scholar] [CrossRef]
  50. Okay, G.; Cosenza, P.; Ghorbani, A.; Camerlynck, C.; Cabrera, N.F.; Revil, A. Localization and characterization of cracks in clay-rocks using frequency and time-domain induced polarization. Geophys. Prospect. 2013, 61, 134–152. [Google Scholar] [CrossRef]
  51. Tarasov, A.; Titov, K. Relaxation time distribution from time domain induced polarization measurements. Geophys. J. Int. 2007, 170, 31–43. [Google Scholar] [CrossRef]
  52. Oldenburg, D.W.; Li, Y.G. Inversion of induced polarization data. Geophysics 1994, 59, 1327–1341. [Google Scholar] [CrossRef]
  53. Xin, K.Y.; Liang, Y.Q.; Zhang, Y.; Liu, J.K. Detailed Investigation Report of Graphite Mine in Baishancun of Xinrong District, Datong, Shanxi; Government of Shanxi Province: Datong, China, 2021; (In Chinese with English abstract).
  54. Zhang, Y.; Liang, Y.Q.; Li, Y.; Wu, G.C. General Survey Report of Graphite Mine in Liumudi of Xinrong District, Datong, Shanxi; Government of Shanxi Province: Datong, China, 2019; (In Chinese with English abstract).
  55. Cheng, Q.M. Non-Linear theory and Power-Law models for information integration and mineral resources quantitative assessments. Math. Geosci. 2008, 40, 503–532. [Google Scholar] [CrossRef]
Figure 1. Simplified geological map of the graphite ore belt in Xinrong District, Shanxi.
Minerals 13 00760 g001
Figure 2. (a) polarizability coefficients of Sym5 transform, (b) polarizability coefficients of Sym6 transform, (c) polarizability coefficients of Sym7 transform, (d) polarizability coefficients of Sym8 transform, (e) resistivity coefficients of Sym5 transform, and (f) resistivity coefficients of Sym8 transform.
Minerals 13 00760 g002
Figure 3. (a1) polarizability background of Sym5, (a2) polarizability anomalies of Sym5, (b1) polarizability background of Sym6, (b2) polarizability anomalies of Sym6, (c1) polarizability background of Sym6, and (c2) polarizability anomalies of Sym6.
Minerals 13 00760 g003
Figure 4. (a1) polarizability background of Sym8, (a2) polarizability anomalies of Sym8, (b1) resistivity background of Sym5, (b2) resistivity anomalies of Sym5, (c1) resistivity background of Sym8, and (c2) resistivity anomalies of Sym8.
Minerals 13 00760 g004
Figure 5. Polarizability background of Sym5 and potential prediction.
Minerals 13 00760 g005
Figure 6. Profile 3 in detail.
Minerals 13 00760 g006
Table 1. Physical parameters of Xinrong area.
Name of RockNumber of
Specimens
Induced Polarization (%)Electrical Resistivity(Ω·m)
RangeMeanRangeMean
Mixed granite350.93–4.242.0512.4–884.2546
Garnet gneiss280.68–5.112.245.3–1085186
Graphite gneiss401.10–41.513.343.5–91836.1
Diabase120.49–6.923.6215.5–671.2282.2
Table 2. Space analysis results of ore bodies and the polarizability background mode.
Wavelet
Type
Proportion of Ore Bodies to Abnormal Area (%)Background
Anomalies
LowMiddleHighSum
Sym522.7437.6826.8387.2512.75
Sym622.8936.8226.5686.2713.73
Sym725.5536.2825.1286.9513.05
Sym824.4637.122.8184.3715.63
Disclaimer/Publisher’s Note: The statements, opinions and data contained in all publications are solely those of the individual author(s) and contributor(s) and not of MDPI and/or the editor(s). MDPI and/or the editor(s) disclaim responsibility for any injury to people or property resulting from any ideas, methods, instructions or products referred to in the content.

