Article

Control Model of Organic Shale Enrichment by Terrigenous Weathering in Wufeng Formation–Longmaxi Formation, Southeast Sichuan, China

1
School of Resources and Geosciences, China University of Mining and Technology, Xuzhou 221116, China
2
Key Laboratory of Shale Gas Exploration of Ministry of Natural Resources, Chongqing Institute of Geology and Mineral Resources, Chongqing 401120, China
3
Research Center for Petrogenesis and Mineralization of Granitoid Rocks, China Geological Survey, Wuhan 430205, China
*
Author to whom correspondence should be addressed.
Minerals 2023, 13(6), 761; https://doi.org/10.3390/min13060761
Submission received: 25 April 2023 / Revised: 23 May 2023 / Accepted: 30 May 2023 / Published: 31 May 2023
(This article belongs to the Special Issue Reservoir and Geochemistry Characteristics of Black Shale)

Abstract

:
The relationship between the Late Ordovician–Early Silurian sedimentary system, weathering, paleoclimate, and primary productivity in the Yangzi region is not well understood. In this study, by analyzing the sedimentation cycle and major trace elements of the Youc well 2 in the southeast Sichuan Basin, the coupling relationships of weathering indicators, terrigenous debris input indicators, paleoclimate, redox condition indicators, U-Mo covariance model, Mo/TOC relationship, and paleoproductivity indicators are investigated. The results show that single-well logs delineate four third-order sedimentary sequences (SS1, SS2, SS3, and SS4), two sedimentary subfacies, and four sedimentary microfacies in the Wufeng Formation–Longmaxi Formation. The weathering degree is stronger at the bottom where the climate shifts from warm–wet to cold–dry, and the seawater is in an oxidic–anoxic–oxidic–anoxic environment. While the primary productivity and material source input decreases gradually in the middle and upper part, the climate becomes dry and cold, and the seawater is in an anoxic–oxidic environment. Thus, a rock enrichment model for the organic matter shale of the Wufeng Formation–Longmaxi Formation in southeast Sichuan has been established. This provides more information on the control factors concerning organic matter enrichment and their interactions.

1. Introduction

During the Late Ordovician to Early Silurian, oceanic anoxia, global glaciation, and mass extinction events frequently occurred, accompanied by the deposition of a black shale sequence on a global scale, which has drawn significant attention from the scientific community [1,2]. Black shales in the Wufeng Formation–Longmaxi Formation are the primary shale gas reservoirs in the Sichuan Basin in China and are also the key boundary layers for the first mass extinction during the Late Ordovician to Early Silurian. Extensive research has been conducted worldwide regarding the paleontology, paleoclimate, and redox conditions of the seawater body and has achieved fruitful results. Chen et al. [1] separated the Wufeng Formation–Longmaxi Formation into various biozones and compared them internationally. According to sedimentary and geochemical studies undertaken by Su et al. [2] on the Wangjiawan region of Hubei, there may be a link between the extinction of biological species and changes in the ancient marine environment. Particularly, the Upper Yangtze region transgression since the Wufeng Formation’s sedimentary period and the rising sea level resulted in hypoxic water. The Hirnantian glacial event affected the Guanyinqiao Member (Gyq.M) sedimentary period, lowering sea levels and leading to an oxidizing climate. In the early Longmaxi Formation, a hypoxic water body was created due to the rising sea level. The changes in the redox condition of the water body coincided with the mass extinction event. The Tongzi Honghuayuan shallow water [1,3,4,5,6,7] section exhibits high calcium content, thin spotted dolomite layers, and notable biotic differentiation. Jiang [8] suggested that relative sea level changes, redox conditions, the input of biological debris, and turbidity flow all controlled the enrichment of organic matter. According to Ma et al. [9], basin retention, high ancient productivity, and hypoxic water bodies were the key factors influencing the sedimentation of organic-rich shale. Yan et al. [10] proposed that organic matter enrichment was simultaneously regulated by high ancient productivity, hypoxic water bodies, the low input of terrestrial debris, and sedimentation rate. According to certain scholars, the deposition of the shale unit may have resulted from the interplay of paleoclimate and paleoceanography, which are affected by diverse geological events, including volcanic eruptions, the intrusion of bottom currents, and land-derived input [7]. This also influences the accumulation of organic matter, which is directly proportional to the gas content of shale [11,12]. Therefore, exploring the factors controlling organic matter enrichment in shale is a crucial step in shale gas exploration. Previous studies mainly believed that high productivity is the foundation for organic matter formation and enrichment, while preservation conditions and the input of terrestrial debris serve as the controlling factors for organic matter enrichment [13,14,15,16,17,18]. However, the aforementioned studies primarily centered on the examination of outcrop samples and failed to comprehensively investigate the impact of continental weathering degree on primary productivity, terrestrial debris input, and redox conditions during the Wufeng–Longmaxi period. This study utilizes the logging curve features and elemental geochemical characteristics of the Wufeng Formation–Longmaxi Formation in Youc well 2 to explore the correlation between weathering degree and primary productivity, terrestrial debris input, and redox conditions. Moreover, this study examines the factors that govern organic matter enrichment in the shale of the Wufeng Formation–Longmaxi Formation (Late Ordovician to Early Silurian) in the Sichuan Basin. The goal is to establish a fundamental theoretical basis for the enrichment mechanism of organic matter in shale and the evaluation of high-quality source rocks from the Sichuan basin of the Wufeng Formation–Longmaxi Formation.

2. Geological Background

The Yangtze Block and the Cathaysia Block jointly formed the South China Plate during the Late Ordovician and Early Silurian (Figure 1a) [15]. At the end of the Ordovician period, the Yangtze Plate was covered by an extensive surface Sea (Yangtze Sea), bordering the China Sea to the southeast [17]. From the Late Ordovician to the Early Silurian, the upper Yangtze plate was under compression, and many uplifts began to rise around the Yangtze, such as the central Sichuan uplift in the northwest, the central Guizhou uplift in the south, and the Xuefeng uplift in the southeast [18]. The upper Yangtze plate evolved from an extensive sea area to a restricted sea area during the Middle Ordovician, forming a large area of a sedimentary environment with low energy that was under compensation and anoxic. At the same time, due to the impact of global transgression, several settling centers of organic-rich shale deposits formed in the upper Yangtze region [8,17,18]. The Sichuan Basin was formed by the Xuefeng Orogeny [19], which resulted in a metamorphic crystalline basement [19]. During the Silurian–Devonian, the area evolved into a passive continental margin, and the Kwangsian movement, which occurred in the Late Ordovician, controlled the formation of the Chuanzhong Uplift in the north, the Qianzhong Uplift in the south, and the Xuefeng Uplift in the southeast (Figure 1a) [20]. The area underwent structural deformation during the Yan Shan period, resulting in folds primarily oriented in the northeast–north–northeast direction and three sets of faults oriented NE–SW, nearly S–N, and nearly E–W. The study area is located on the southeastern margin of the Sichuan Basin (Figure 1b), and the region has undergone considerable tectonic fault activity, significant sedimentation, and substantial erosion. In the study area, the geological formations that are exposed comprise a range, including Cambrian, Ordovician, Silurian, Carboniferous, Permian, Triassic, Jurassic, and Quaternary. The structural arrangement of the area varies from trough-shaped folds in southeastern Chongqing to sub-regional folds that run from northwest to southeast [21]. In the Early to Middle Ordovician period, the uplift was caused by the formation of a shallow-sea deposit, which led to a low-energy environment with little oxygen. The Yangtze Platform was affected by global sea transgressions during the Late Ordovician to Early Silurian, which had a significant impact on the sedimentation of the Wufeng Formation–Longmaxi Formation [22]. The study area comprises black carbonaceous shale and black siliceous rock rich in brachiopod fossils from the Upper Ordovician Wufeng Formation, as well as black carbonaceous shale, light black mud shale, and light gray siltstone from the Lower Silurian Wufeng Formation–Longmaxi Formation [23,24]. The Wufeng–Longmaxi shale has been divided into paleontological zones, and global biostratigraphic zones have been compared in detail [8,25].

3. Methodology

The research focused on the shales of the Wufeng Formation–Longmaxi Formation, found in Well Youc-2, situated in the Youyang region of Chongqing City. A total of 17 shale samples were collected, starting from the bottom. CQyc02-1 to CQyc02-2 were black carbonaceous shales of the Wufeng Formation, CQyc02-3 was a mudstone of the Guanyinqiao member, CQyc02-5 to CQyc02-10 were light gray sandy shales of the Longmaxi Formation, and CQyc02-11 to CQyc02-17 were gray mud shales of the Longmaxi Formation (Figure 2). Prior to the analysis, the samples were treated in the laboratory by removing the heavily weathered surface and obtaining a fresh rock sample from the core. The rock samples were then ground to a 200 mesh in an agate mortar before being sent for analysis to relevant units. The specific testing methodology is explained in detail below.

3.1. Organic Carbon Analysis

The Chongqing Mineral Resources Supervision and Testing Center of China’s Ministry of Natural Resources conducted the analysis of total organic carbon (TOC) content using the LECO carbon–sulfur analyzer CS230 manufactured in the United States, which has an analysis accuracy of ±0.5%. The sample underwent grinding using a tungsten carbide grinding body to achieve a particle size of 200 mesh and was washed with deionized water and dried. Subsequently, 100 mg of the sample was placed in a permeable crucible and dried at a high temperature. The permeable crucible was submerged in dilute hydrochloric acid (1:7) for water bath heating at 60 °C for two hours to remove inorganic carbon. The sample was washed with deionized water to eliminate hydrochloric acid, dried once again, and then the organic carbon content was measured (as shown in Table A1).

3.2. Oxide Content Test

The oxide content was analyzed at the Chongqing Mineral Resources Supervision and Testing Center of China’s Ministry of Natural Resources using a Rigaku 100e wavelength-dispersive X-ray fluorescence spectrometer (XRF). The sample selected for analysis was a fresh shale without veins, which was crushed using external force. The sample was ground into a powder with a particle size of 200 mesh using a tungsten carbide grinding body and subjected to a two-stage reduction process to ensure uniform mixing. Approximately 1 g of shale sample was measured and deposited into a sterile ceramic crucible. The weights of the crucible, sample, and the combination of both were determined and recorded to measure sample loss on ignition during calcination. The crucible was subsequently placed inside a muffle furnace, where it was heated to 920 °C for a duration of 3 to 4 h to eliminate organic matter. Once completed, the crucible was taken out and rapidly transferred to a drying dish to cool down to room temperature. The weight of the crucible plus sample and the weight of the crucible were then weighed at room temperature. Approximately 0.5 g of the powdered sample, which had undergone ignition loss, was weighed and combined with anhydrous lithium tetraborate (Li2B4O7) in a ratio of eight to one. This mixture was then thoroughly blended, put into a specially designed platinum crucible, and treated with four drops of NH4Br. The mixture was subjected to TR-1000S automatic fusion furnace at around 1100 °C for approximately 10 min (3 min of static melting, 2 min of swinging without rotation, and 5 min of swinging and rotation) to generate a homogenous glass slide. The experimental data were then obtained and recorded, with a relative standard deviation (RSD) of less than 2%. The results of the analysis can be seen in Appendix A, Table A1.

3.3. Trace Elements Analysis

The analysis of the trace elements was performed at the Chongqing Mineral Resources Supervision and Testing Center of the Ministry of Natural Resources in China. A PE Elan6000 inductively coupled plasma mass spectrometer (ICP-MS) was employed for the testing. A sample of fresh shale without veins was crushed using external force and ground to a 200 mesh with tungsten carbide grinding media, ensuring uniform mixing by being subjected to a two-stage reduction process. A cleaned and dried Teflon melting sample bottle was used to contain 40 mg of the sample. Next, 0.5 mL of HNO3 was added, followed by 1 mL of HF, and the bottle was covered and ultrasonically oscillated for 10–15 min. The sample was then evaporated on a hot plate at 150 °C until nearly dry. Subsequently, another 1 mL of HF was added, covered, and subjected to ultrasonic oscillation for 15 min before being evaporated to near dryness on a hot plate at 150 °C. Following this, 0.5 mL of (1:1) HNO3 and 1.5 mL of HF were added to the sample, covered with heat-shrinkable tubing, and placed in a stainless-steel jacket, which was tightly fastened and heated in an oven at a gradually increasing temperature up to 200 °C, and held for approximately 5 days. After removal from the oven, the sample was opened and evaporated to near dryness again. Subsequently, 2 mL of HNO3 was added to the sample, which was covered with heat-shrinkable tubing, placed in a stainless-steel jacket, tightly fastened, and heated in a 150 °C oven for approximately 5 h. After this, the mixture was opened and evaporated to near dryness once again. Then, another 2 mL of HNO3 was added. If any unsolved samples remained, an appropriate amount of 2–3 mL of 1% HNO3 could be added to the sample and the sample was then covered with heat-shrinkable tubing, placed in a stainless-steel jacket and tightly fastened, and heated in a 150 °C oven for around 5 h to ensure complete dissolution of the sample. The resulting solution was transferred to a PE bottle, and 1 mL of 500 ppb internal standard was added. The solution was diluted with 1% HNO3 to 50 mL for measurement. Throughout the entire sample preparation process, a blank sample, two standard samples, and two parallel samples were prepared using the same method. The analysis error was found to be less than 5%, and the detection limit of the analyzed elements is 10 ppm, as presented in Appendix A, Table A2 and Table A3.

4. Results

4.1. Rock Type and Sedimentary System

The thickness of the Wufeng Formation–Longmaxi Formation in Well Youc-2 in the study area is approximately 78.02 m, of which the Wufeng Formation is 7.61 m thick and the Longmaxi Formation is 70.41 m thick. Based on the lithology and logging characteristics, the Wufeng Formation–Longmaxi Formation is divided into four large sedimentary cycles, corresponding to four third-order sequences, as follows:
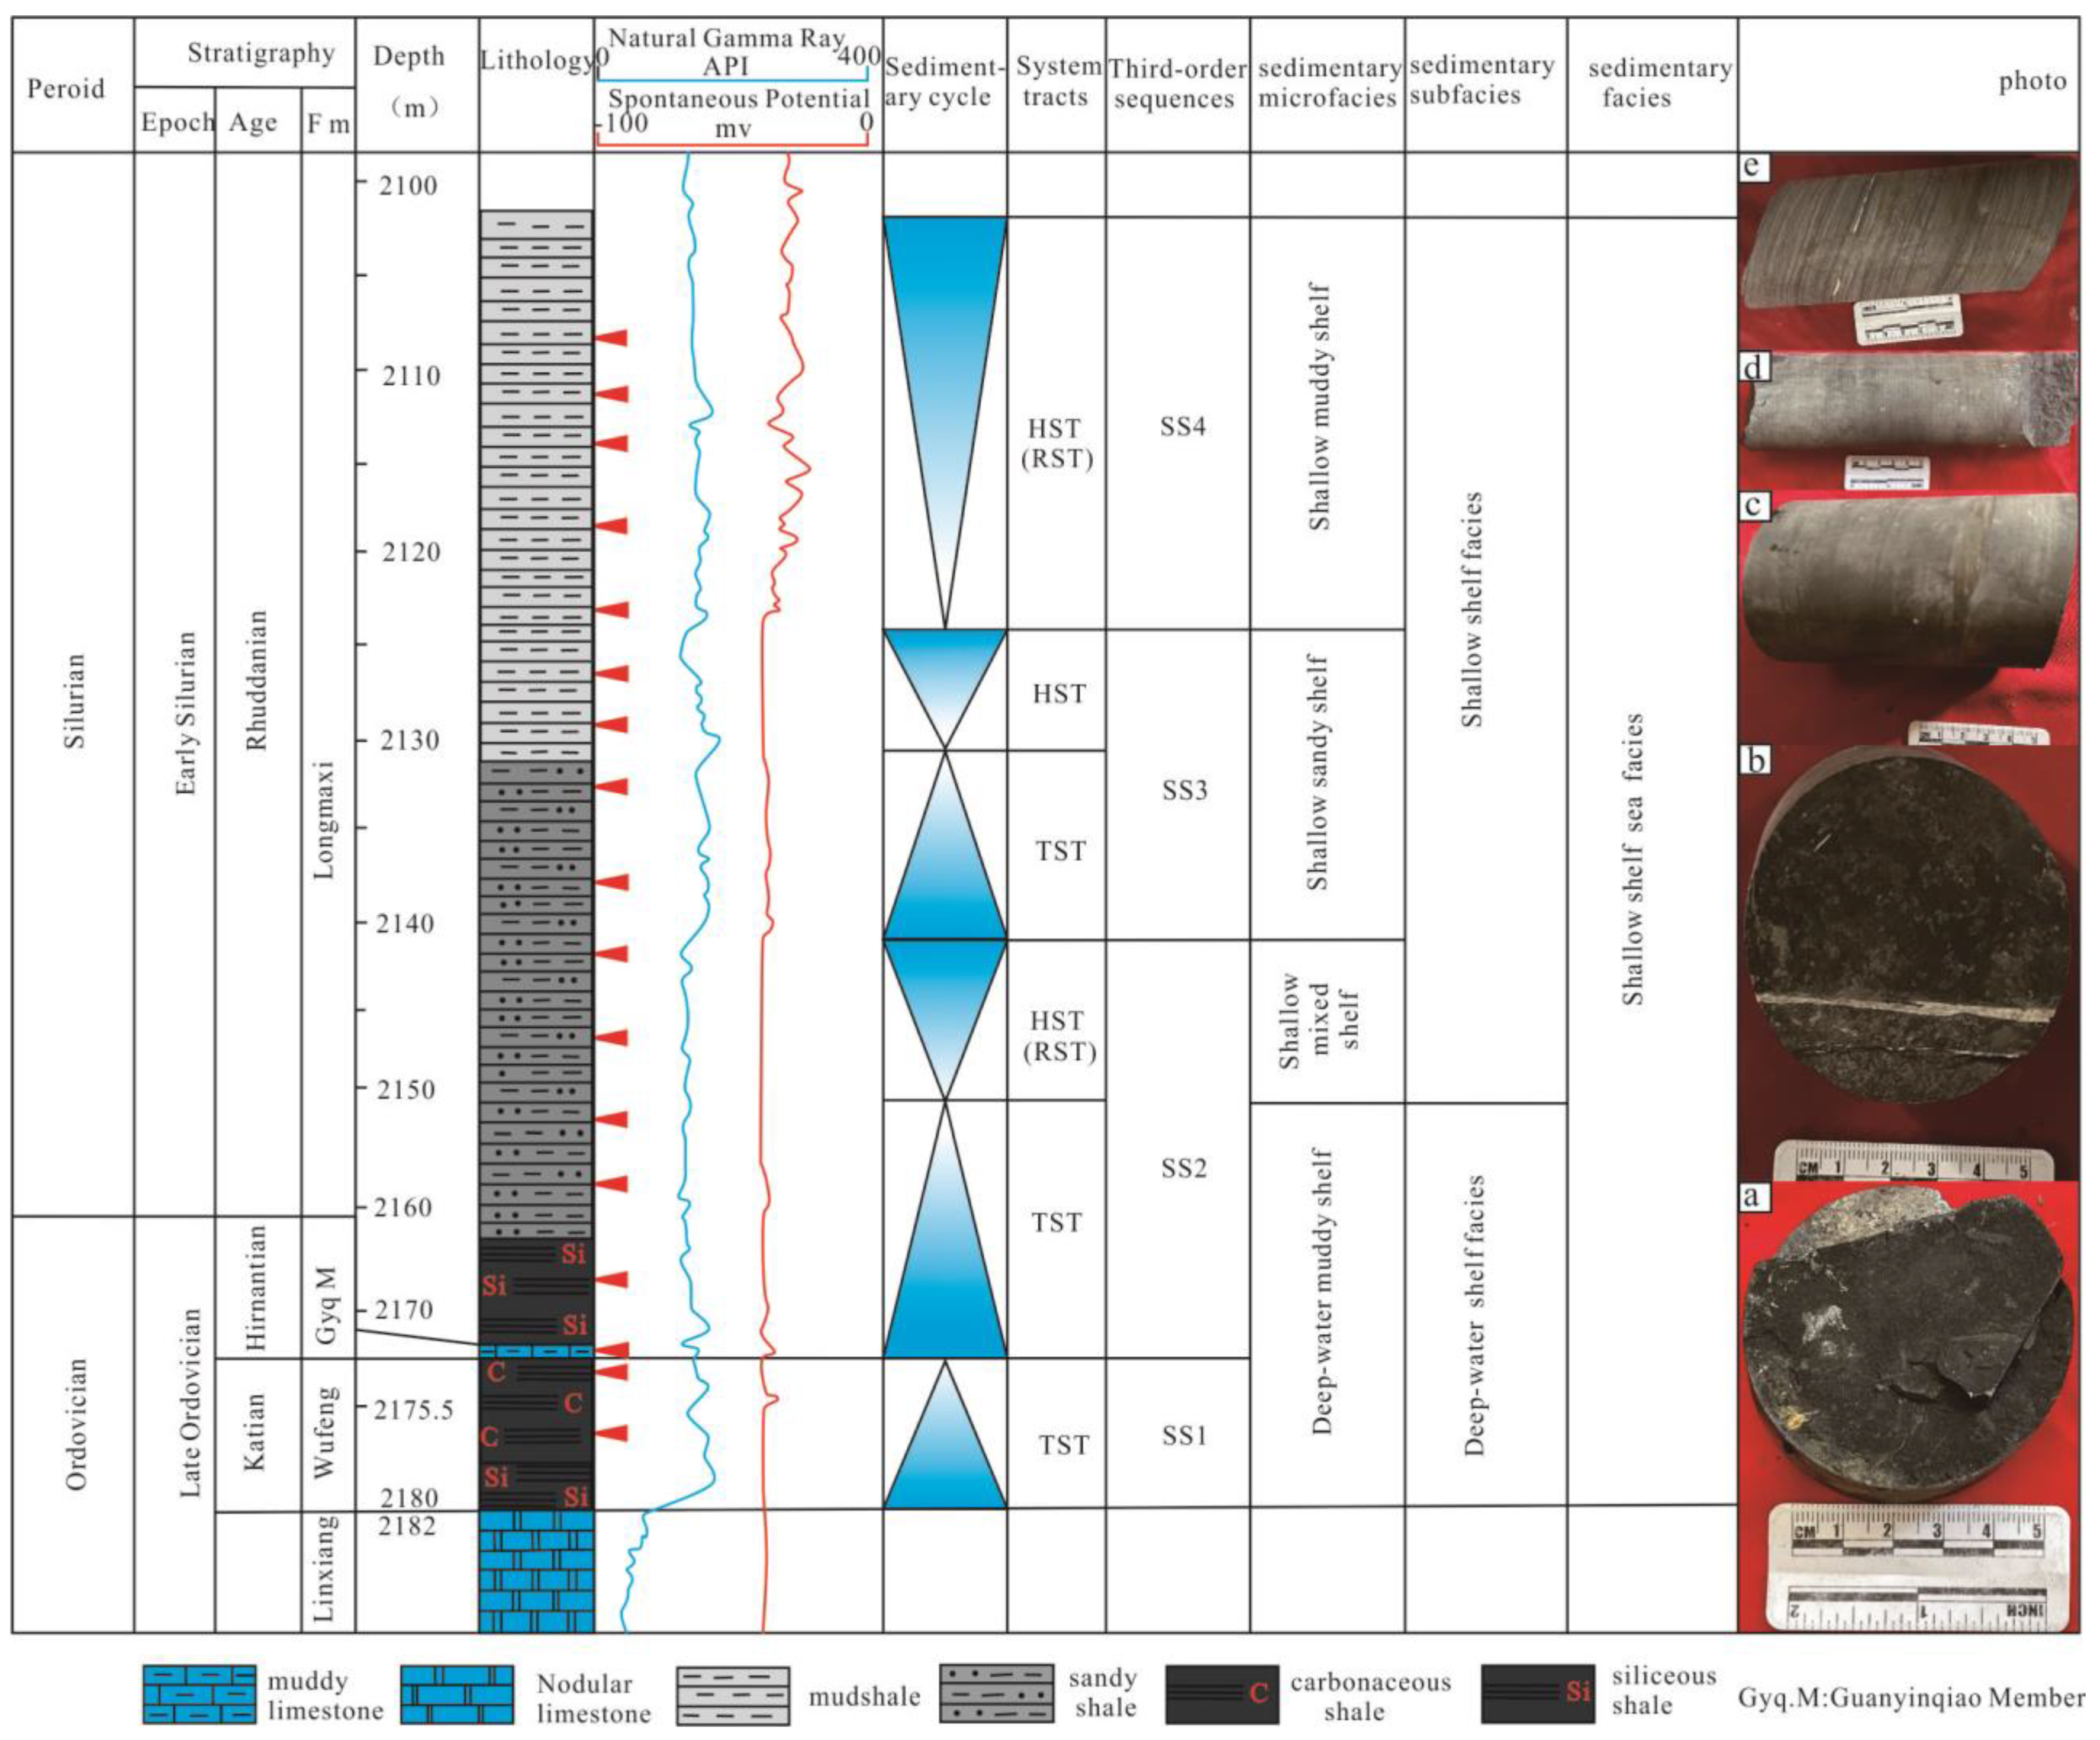
  • SS1 corresponds to the Wufeng Formation, dominated by black carbonaceous shale (Figure 2a), with well-developed bedding and abundant brachiopods, sulfides, and pyrite particles at the bottom of the core [15]. The number of brachiopods decreases upwards, and high carbon content is observed at 2179.7–2179.5 m, with few fossils in the upper part. In the development of the transgressive systems tract (TST) of the marine system, the natural gamma curve shows a large amplitude, with increasing natural gamma values from bottom to top, and a bell-shaped morphology, reflecting a gradual increase in mud content from bottom to top (Figure 2). The natural potential has a relatively small range of variation. Overall, the SS1 transgressive systems tract reflects a process of rising sea level, increasing accommodation space, and increasing mud content upwards.
  • SS2 corresponds to the bottom of the Longmaxi Formation, dominated by black siliceous shale with well-developed bedding and vertical fractures filled with calcite (Figure 2b). Brachiopods and sulfides are visible, the color is lighter than the underlying layer, and sliding surfaces are present. Pyrite and sandy materials increase upwards. Both the TST and highstand systems tract (HST) are relatively symmetrical. The TST has a slightly increasing trend in natural gamma-ray upwards, reflecting a rising sea level, increasing accommodation space, and increasing mud content. The HST mainly consists of deep gray sandy shale, with an upward increase in sand content and grain size (Figure 2). The natural gamma-ray value decreases from bottom to top, reflecting a sedimentary process of falling sea level, increasing accommodation space, and decreasing mud content.
  • SS3 corresponds to the middle part of the Longmaxi Formation, which consists of black siltstone (Figure 2c) and light-colored mudstone (Figure 2d) with horizontal bedding and vertical fissures filled with calcite (approximately 0.3–1.5 m wide and 2.5 m long). The cross-section shows crinoids, and the color is lighter than the previous layer, with visible detachment surfaces. A small amount of pyrite is developed, and the content of fine sand increases upward, mainly distributed in a concentrated manner in laminae. At a depth of 2168 m, there is a conglomeration of calcite, while at 2169.5 m, there are layering fractures, and at 2169.4 m, a calcite vein can be observed, showing signs of flexure with visible scratch marks on the surface (Figure 2). The TST and HST are asymmetric. The TST is mainly composed of black and gray muddy sandstone, with a small variation range in natural gamma-ray and an increasing trend in GR from bottom to top, reflecting an increase in mud content and accommodation space. The natural potential has a very small range of variation. The HST mainly consists of light gray muddy sandstone or sandy mudstone, with a natural gamma-ray of 143.84–223.17 API, indicating an upward increase in sand content and grain size.
  • SS4 corresponds to the upper part of the Longmaxi Formation, mainly composed of light gray mud shale with horizontal bedding (Figure 2e) and visible brachiopods on the section. Layer-parallel calcite veins and vertical fractures filled with calcite are also present. At 2157.25 m, there is a band of pyrite, and the sand content gradually increases upwards (Figure 2). The natural gamma-ray value is relatively stable, and the sand content and grain size are lower than those in the lower layers. The HST is well developed, mainly consisting of gray-green sandy shale or sandstone. The natural gamma-ray curve shows a slight increase upwards, reflecting an increase in mud content and accommodation space and the sea level lowering process.

4.2. Oxidants and TOC Content Characteristics

The data on the content of shale oxidants in the Wufeng Formation–Longmaxi Formation, of the Youc Well 2 are presented in Table A1. The total organic carbon (TOC) content of the Wufeng Formation shale ranges from 1.050% to 3.17%, with an average value of 2.14%; the shale content (TOC) of the Guanyinqiao member is 2.568%, and the Longmaxi Formation shale content (TOC) ranges from 0.181% to 2.980%, with an average value of 1.801%. The main shale oxidants in the Wufeng Formation–Longmaxi Formation are SiO2, Al2O3, K2O, TFe2O3, MgO, CaO and P (Table A1). Ti (0.19–0.48 ppm, avg. 0.34 ppm) and (0.38–0.48 ppm, avg. 0.41 ppm), SiO2 (59.880%–74.7700%, avg. 67.325% ppm) and (53.290%–66.300%, avg. 60.992% ppm), Al2O3 (3.950%–7.780%, avg. 5.865%) and (4.180%–8.730%, avg. 5.598%), K2O (1.750%–4.220% avg. 2.985%) and (2.480%–5.900%, avg. 3.746%), Tfe2O3 (Total Fe2O3) (2.200%–5.030%, avg. 3.615%) and (2.730%–6.380%, avg. 4.621%), MgO (1.180%–2.940%, avg. 2.060%) and (1.570%–3.300%, avg. 2.377%), P2O5 (0.009%–0.010%, avg. 0.010%) and (0.010%–0.018%, avg. 0.014%), CaO (1.890%–2.590%, avg. 2.240%) and (0.570%–5.130%, avg. 3.182%), P (411.000–490.000 ppm, avg. 450.500 ppm) and (454.000–786.000 ppm, avg. 589.786 ppm). Guanyiqiao Member, SiO2 (61.900%), Al2O3 (5.140%), K2O (3.460%), Tfe2O3 (4.190%), MgO (2.500%), CaO (4.050%), and P (566.000 ppm). The content of other minor oxides, such as Na2O, TiO2, and MnO, is relatively low, with average values of less than 1. Overall, the order of oxide content changes in the shale of the Wufeng Formation–Longmaxi Formation in the Well Youc-2 is as follows: SiO2 > Al2O3 > TFe2O3 > CaO > K2O > P2O5.

4.3. Trace Elements Characteristics

Analytical results of the trace elements (including rare earth elements) of the Wufeng Formation, Guanyinqiao Member, and Longmaxi Formation marine shale samples are provided in Table A2. Ti (0.19–0.48 ppm, avg. 0.34 ppm) and (0.38–0.48 ppm, avg. 0.41 ppm), V (182.24–444.00 ppm, avg. 287.00 ppm) and (81.50–320.07 ppm, avg. 148.37 ppm), Cr (45.30–89.00 ppm, avg. 67.15 ppm) and (53.30–132.00 ppm, avg. 80.05 ppm), Co (8.40–15.80 ppm, avg. 12.10 ppm) and (4.40–20.00 ppm, avg. 12.05 ppm), Ni (61.40–87.90 ppm, avg. 74.65 ppm) and (25.40–62.10 ppm, avg. 43.27 ppm), Cu (62.30.00–95.30 ppm, avg. 78.80 ppm) and (20.20–53.00 ppm, avg. 37.51 ppm), Zn (111.00–321.24 ppm, avg. 132.50 ppm) and (52.80–279.00 ppm, avg. 117.81 ppm), Sr (79.40–108.00 ppm, avg. 93.70 ppm) and (93.00–203.00 ppm, avg. 154.14 ppm), Mo (0.77–34.00 ppm, avg. 17.39 ppm) and (2.86–43.70 ppm, avg. 7.20 ppm), Ba (445.00–659.00 ppm, avg. 552.00 ppm) and (421.00–716.00 ppm, avg. 561.14 ppm), U (4.60–12.8, avg. 8.70 ppm) and (4.12–7.99 ppm, avg. 5.53 ppm), B (33.6–55.60 ppm, avg. 44.60 ppm) and (37.20–109.00 ppm, avg. 65.01 ppm) (Table A2). Other Guanyiqiao Member Ti (0.39 ppm), V (163.00 ppm), Cr (80.30 ppm), Co (14.90 ppm), Ni (47.50 ppm), Cu (39.80 ppm), Zn (98.50 ppm), Sr (143.00 ppm), Mo (6.51 ppm), Ba (570.00 ppm), U (5.28 ppm) and B (40.10 ppm) (Table A2). Other elements, including Ti (0.19–0.48 ppm, avg. 0.34 ppm) and (0.38–0.48 ppm, avg. 0.41 ppm), U (4.60–12.80 ppm, avg. 8.70 ppm) and (4.12–7.99 ppm, avg. 5.35 ppm), have mean concentrations less than 10 ppm (Table A2). Features overall high Zn, Sr, Ba and V, low Ti and U. For the Wufeng Formation and Longmaxi Formation marine shale, Cr, Co, Cu and Zn are significantly positively correlated with Al2O3, TFe2O3, MgO, and TiO2 abundances (Table A3), showing that these elements are mainly sourced from mafic and Ti-bearing detritus.
The enrichment factor (EF) has been widely applied to evaluate the enrichment or depletion of trace elements and calculated as XEF = (X/Al)Sample/(X/Al)PAAS [26], where X and Post-Archean Australian Shale (PAAS) represent the element and The North American shale composite (NASC), respectively [27]. EF values of <1 and >1 represent depletion and enrichment, respectively [26]. The trace element EF values in the Wufeng Formation and Longmaxi Formation marine shale are shown in Table A4 and EF results show that Ti (0.19–0.34, avg. 0.48) and (0.38–0.48, avg. 0.40), V (1.21–2.09, avg. 2.96) and (0.54–2.14, avg.0.99), Cr (0.40–0.61, avg. 0.81) and (0.48–1.29, avg. 0.73), Co (0.37–0.53, avg. 0.69) and (0.46–1.13, avg. 0.52), Ni (1.12–1.36, avg. 1.60) and (0.46–1.13, avg. 0.79), Cu (1.25–1.58, avg. 1.91) and (0.40–1.06, avg. 0.73), Zn (1.31–2.54, avg. 3.78) and (0.62–3.28, avg. 1.39), Sr (0.40–0.47, avg. 0.54) and (0.47–1.02, avg. 0.77), Mo (0.57–2.97, avg. 25.37) and (1.39–32.61, avg. 5.37), Ba (0.68–0.85, avg. 1.01) and (0.65–1.10, avg. 0.86), U (1.48–2.81, avg. 4.13) and (1.33–2.58, avg. 1.73), B (1.21–1.59, avg. 1.99) and (1.33–3.89, avg. 2.32) (Figure 3a,b), Guanyinqiao Member, EF results show that Ti (0.39), V (1.09), Cr (0.73), Ni (0.86), Cu (0.80), Zn (1.16), Sr (0.72), Mo (4.86), Ba (0.88), U (1.70), B (1.43), (Table A4, Figure 3c) are all enriched in the Wufeng Formation (Figure 3a) Guanyiqiao Member (Figure 3c) and Longmaxi Formation (Figure 3b) marine shales. The EF values of Mo, U and B enriched in these studied samples (Figure 3), respectively (Table A3). Sr, Ti, V, and Co are all depleted in these studied shales (Figure 3).

4.4. Rare Earth Elements Characteristics

The results concerning the rare earth elements in the Wufeng Formation–Longmaxi Formation shale in the southeastern Sichuan Basin are presented in Table A5. The ΣREE contents of the Wufeng Formation range from 100.52 to 275.01 ppm, with an average value of 187.77 ppm. The LREE contents range from 85.52 to 247.26 ppm, with an average value of 166.39 ppm, while the HREE contents range from 15.00 to 27.75 ppm, with an average value of 21.38 ppm. The LREE/HREE ratios range from 5.70 to 8.91, with an average value of 7.31. The ΣREE contents of the Longmaxi Formation range from 190.17 to 399.42 ppm, with an average value of 236.44 ppm. The LREE contents range from 169.67 to 367.38 ppm, with an average value of 213.59 ppm, while the HREE contents range from 19.34 to 32.54 ppm, with an average value of 22.84 ppm. The LREE/HREE ratios range from 8.21 to 11.29. After normalization to North American shale and chondrite, the North American shale curve shows a smooth trend (Figure 4a), while the chondrite curve shows a right-skewed Eu negative anomaly feature (Figure 4b), indicating that the Wufeng and Longmaxi shale have a common provenance from the upper crust and were not affected by hydrothermal activity.
In summary, the change sequence of oxide content in the Wufeng formation–Longmaxi formation shales is: SiO2 > Al2O3 > TFe2O3 > CaO > K2O > P2O5, and the abundance of Cr, Co, Cu, and Zn is significantly positively correlated to Al2O3, TFe2O3, MgO and TiO2. Wufeng Formation–Longmaxi Formation shales have right-dip Chondrite-normalized rare-earth element patterns with small negative Eu and a flat PAAS-normalized REE diagram. These results indicate that the Wufeng Formation–Longmaxi Formation shales are generated from a basaltic mafic source region in the upper crust, and the diagenesis is influenced by deep hydrothermal fluids.

5. Discussion

The oxide and trace element contents of sedimentary rocks are essential in tracing geological history, such as tectonic background, provenance, ancient salinity and water depth of the sedimentary water body, and redox conditions [16,28,29,30]. Therefore, based on the characteristics of oxide and trace element contents ratio of the Wufeng–Longmaxi shale, this research discusses the relationships between the degree of terrestrial chemical weathering, terrestrial input, ancient salinity, primary productivity, paleoclimate, redox conditions, and organic matter during the formation of black shales in the Late Ordovician to Early Silurian. The shale elemental characteristic ratio is presented in Table A2.

5.1. Input of Terrestrial Debris and Degree of Weathering

The sources of sediment mainly include terrigenous debris, volcanic material, organic matter, and cosmic material, among which terrigenous debris is the most important source. Volcanic ash from volcanic eruptions, weathering products from terrestrial source areas, organic matter from biodegradation and material from cosmic material impacts, etc., accumulate in favorable areas through transport media. Terrestrial debris input has a significant impact on sedimentary environments, so its influence should be considered when analyzing the sedimentary environment. Elements such as Al, Ti, Th, and Zr, which are transported by water and atmosphere and are not easily affected by diagenesis and weathering, are generally used in sedimentology to indicate the input of terrestrial debris [26,28]. Al is mainly preserved in aluminum silicate clay minerals in fine-grained sediments [31,32,33]. Ti, Th, and Zr are usually preserved in clay minerals or heavy minerals [34], so the ratio of TiO2 to Al2O3 is often used to reflect terrestrial debris input in sediments [35]. The La/Yb-ΣREE ratio is an indicator of the source rock [36]. The La/Yb-ΣREE diagram of the shale from the Wufeng Formation–Longmaxi Formation in the study area shows that the source materials come from a mixed source of sedimentary rocks, granite, and alkaline basalt (Figure 5a). The Al2O3/TiO2 ratio is highly correlated with CIA, with an R2 of 0.917 (Figure 5b). Meanwhile, the terrestrial clastic index Al2O3/TiO2 at the bottom of the Wufeng Formation–Longmaxi Formation exhibits qn increasing–decreasing–increasing-decreasing trend, consistent with the weathering index. In the upper part of the Longmaxi Formation, it also shows a trend of decreasing to increasing, consistent with the weathering index, indicating a high degree of weathering, which promotes the input flux of terrestrial debris into the ocean. Conversely, as the degree of weathering decreases, the input flux of terrestrial debris into the ocean also decreases. At the same time, there is a good coupling relationship between the content of organic carbon and the input flux of terrestrial debris.

5.2. Paleoclimate and Chemical Weathering Degree

According to the research of Wedepohl [37], the average mineral percentages by volume in the earth’s crust are as follows: plagioclase feldspar 41%, quartz 21%, and potassium feldspar 21%. As quartz is extremely stable under surface conditions, the weathering of upper crustal material primarily involves the decomposition and transformation of feldspar, resulting in the loss of alkali metal ions such as Na+, K+, and Ca2+ in the surface fluids and, ultimately, the transformation of feldspar into clay minerals dominated by montmorillonite, kaolinite, and illite [38]. Therefore, the mole fraction of Al2O3 in the weathering products increases with the strength of chemical weathering [38,39]. Thus, the Chemical Index of Alteration (CIA), the Corrected CIA (CIAcorr), the Chemical Index of Weathering (CIW), and the Index of Compositional Variability (ICV) are commonly used as important indicators of the intensity of sediment weathering. High CIA values indicate that elements such as Ca, Na, and K have been lost relative to stable elements such as Al and Ti during weathering, reflecting a relatively strong degree of weathering under warm and humid climates. Conversely, low CIA values reflect a relatively weak degree of weathering under cold and dry climates [27]. Fedo et al. [40] suggest that CIA values between 50 and 60 indicate weak weathering, values between 60 and 80 indicate moderate weathering and values between 80 and 100 indicate strong weathering. Cox [41] believes that an ICV value greater than 1 indicates that the detrital rocks contain less clay material, reflecting the initial sedimentation in an active tectonic zone, whereas a value less than 1 indicates that the detrital rocks contain clay material, indicating sedimentary reworking or initial sedimentation under intense weathering. The higher the CIW value, the stronger the weathering intensity in the source area, indicating a paleoclimate in the source area that tended toward warm and humid conditions [38,39]. The ICV values of the Wufeng Formation shale in the study area range from 1.814 to 1.870, with an average of 1.835. The ICV value of the Guanyinqiao mud limestone segment is 2.823. The ICV values of the Longmaxi Formation shale range from 1.634 to 3.422, with an average of 2.522. Therefore, the Wufeng Formation–Longmaxi Formation rocks mark initial sedimentation in an active tectonic zone, avoiding the influence of sedimentary reworking on the CIA and CIW indices. Therefore, the use of the CIA error, CIA, and CIW indices to determine the degree of chemical weathering is reliable. The CIA error values of the Wufeng Formation shale in the study area range from 56.688 to 62.077, with an average of 58.492. The CIA error value of the Guanyinqiao Member mudstone segment is 49.018, and the CIA error values of the Longmaxi Formation shale range from 42.514 to 55.588, with an average of 48.603. The CIA values of the Wufeng Formation shale range from 54.558 to 58.605, with an average of 55.857. The CIA values of the Guanyinqiao mudstone are 45.246, while those of the Longmaxi Formation shale range from 54.894 to 39.610, with an average value of 45.983. The CIW values of the Wufeng Formation shale range from 77.490 to 79.158, with an average value of 78.044. The CIW value of the Guanyinqiao Member mudstone is 65.063, while the CIW values of the Longmaxi Formation shale range from 52.250 to 87.271, with an average value of 66.564. These results indicate that the weathering degree during the Wufeng Formation period was weak to moderate, a relatively dry and cold climate. During the Guanyinqiao period, the weathering degree was reduced to the weakest, consistent with the Hentan glaciation event, indicating a sudden change to a dry and cold climate. Throughout the Longmaxi Formation period, there was a gradual increase in the degree of chemical weathering followed by a trend of decreasing and then increasing (Figure 6). However, overall, weak weathering predominated, indicating that after the Hernantian glaciation, there was a temperature rise during the Rhuddanian period, which was relatively warmer than before, followed by a shift towards a dry and cold climate. The enrichment of organic carbon is positively correlated with climate (Figure 6). When the climate warms, the content of organic carbon increases. Conversely, when the climate becomes drier and colder, the organic carbon content tends to decrease. In a humid and warm climate, the enhancement of weathering promotes the input of terrestrial debris into the ocean, increases the input of nutrient elements in oxygen, improves the productivity of the ocean, and promotes the generation of organic carbon.

5.3. Redox Conditions and Degree of Weathering

5.3.1. V/Cr Ratio

In an oxidizing environment, chromium (Cr) stably exists in seawater in the form of ions (CrO42−), while vanadium (V) exists in seawater as ions (H2VO4−) and is also adsorbed to a small extent by Fe and Mn oxides [42]. As seawater gradually changes from an oxidizing to a hypoxic environment, V is reduced to VO22+ and precipitates with organic matter in sediment, while Cr is reduced to Cr(OH)2+ and forms complexes with humic or fulvic acids that precipitate in sediment [43]. As the environment continues to shift towards a sulfidic condition, V is further reduced to insoluble V2O3 and V(OH)3, which are deposited and enriched in sediment, while Cr is insensitive to sulfidic conditions and is easily deposited along with terrestrial debris or by substituting Mg in minerals [42,44]. Therefore, V/Cr is an important indicator of redox conditions. When V/Cr is less than 2, the environment is oxygenated; when V/Cr is between 2.00 and 4.25, it is suboxic; and when V/Cr is greater than 4.25, it is suboxic to anoxic [45,46]. The V/Cr values of siliceous rocks, coal-bearing shale, and argillaceous limestone from the Wufeng period to the bottom of the Longmaxi period in the study area are 2.05, 9.80, 2.03, and 5.90, respectively, indicating that the water body experiences periodic changes from suboxic to anoxic and back to suboxic environments, and the organic carbon content also exhibits a periodic pattern of decreasing-increasing-decreasing (Figure 7). In the Longmaxi Formation, the V/Cr values of sandy shale and light-colored mud shale are between 1.11 and 2.5, indicating that the water body is mainly hypoxic-oxidizing, and the organic carbon content accordingly decreases and is not well preserved. This suggests that there were large fluctuations in the redox conditions of seawater during the late Wufeng period to the early Longmaxi period, and a stable oxidizing environment prevailed during the middle to late Longmaxi period (Figure 7). The fluctuations in the environment, especially in hypoxic conditions, are most conducive to the preservation of organic matter, whereas a stable oxidizing environment, which maintains oxygenated conditions in the water body, hinders the preservation of organic matter and is not conducive to its enrichment.

5.3.2. Ni/Co Ratio

In oxygenated water bodies (U, V and Mo), Ni exists either in dissolved ion form (Ni2+) or as a carbonate form (NiCO3) adsorbed by organic matter [46]. In a reducing environment (in the presence of H2S), Ni forms insoluble sulfide (NiS), which can be absorbed in solid solution by authigenic pyrite [46]. In a reducing environment, Co is preferentially activated over Ni, leading to an increase in the Ni/Co ratio in sedimentary deposits. Therefore, the Ni/Co ratio is an important parameter for determining the degree of oxidation–reduction in sedimentary environments. It is generally believed that Ni/Co ratios below 5 indicate an oxidative environment, while ratios between 5 and 7 indicate suboxic conditions and ratios above 7 indicate hypoxic to anoxic environments [46,47]. The concentration of U in plankton is generally low, and the enrichment of U and Mo in sediment is usually derived from the elements’ self-enrichment. In oxygenated seawater, Mo exists in the stable and inert form of molybdate ions (MoO42−). The self-enrichment of Mo is limited under oxidative conditions, and the concentration of Mo in modern continental margin sediments is only 1×10⁻⁶–5 ×10⁻⁶ [48,49]. Under hypoxic-sulfidic conditions, when the concentration of hydrogen sulfide reaches a certain level (approximately 50–250 μM), Mo becomes active, leading to the transformation of molybdate ions into thiomolybdate ions [48,50], which easily associate with sulfidic organic matter or iron sulfide to deposit and accumulate [51,52]. Under oxidative conditions, U mainly exists in soluble uranyl carbonate complex form, exhibiting chemical inertness [53]. The self-enrichment of U is relatively limited under oxidative conditions, while under reducing conditions, hexavalent U(VI) is reduced to tetravalent U(IV), forming insoluble uranyl ions (UO2+) or weakly soluble uranyl fluoride complexes [30]. Therefore, the content of V, U, and Ni and the Ni/Co index can be used to determine the oxidation–reduction conditions. During the Wufeng Formation–Longmaxi Formation, period (siliceous rock, carbonaceous shale, and mudstone-limestone section of the Wufeng Formation and siliceous rock section of the Longmaxi Formation), the early Ni/Co ratios of the Well Youc-2 in the study area were 3.89, 10.46, 3.19 and 10.58, indicating fluctuations between oxidative and hypoxic conditions in the water body (Figure 7). The content of organic carbon also shows periodic fluctuations of decreasing-increasing-decreasing, and during the sedimentation of siltstone and mudstone in the Longmaxi period, the Ni/Co ratios were between 2.36 and 6.69, indicating a predominantly hypoxic-oxidative environment (Figure 7), with an increasing trend in oxidation. At the same time, the content of organic carbon decreased (Figure 7). The vertical changes in the content of V, U, and Ni and the Ni/Co ratio were consistent. This suggests that frequent oscillations between oxidizing and anoxic environments are conducive to the enrichment of organic matter, with anoxic conditions being favorable for the preservation of organic matter, while suboxic to oxic conditions lead to the decomposition of the generated organic matter, resulting in a decrease in organic carbon content and unfavorable preservation of organic matter.

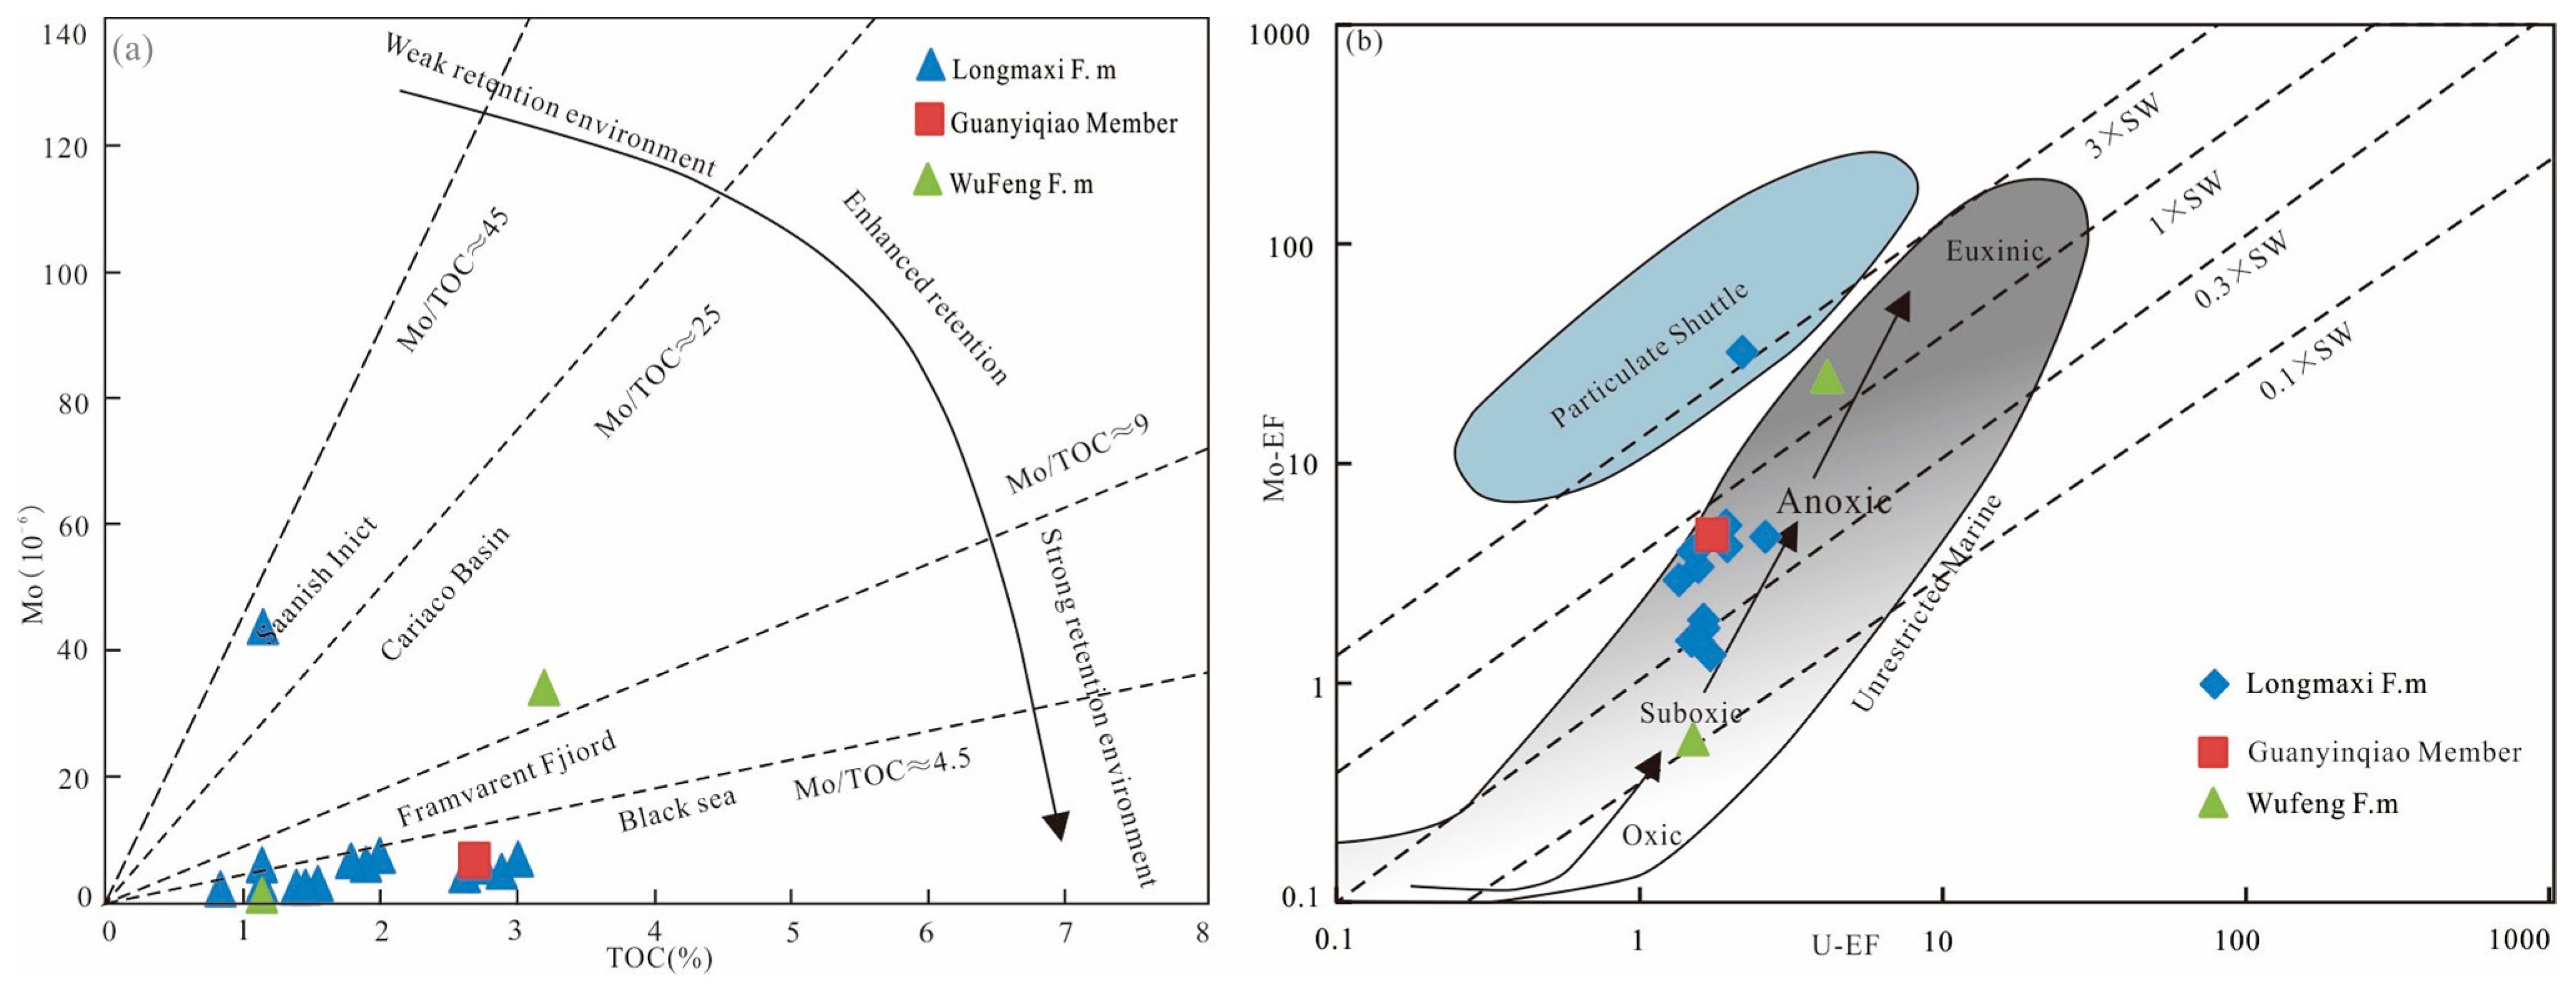
5.3.3. The Degree of Water Retention in Basins

The degree of water retention in sedimentary basins is an important factor affecting sedimentary environments and biogeochemical cycles. It is primarily related to tectonic movement and sea level changes, which in turn affect nutrient exchange in the water and the degree of reduction at the sediment interface. Therefore, it is of great significance for the preservation of organic matter [53]. The mechanism of Mo sensitivity to the depositional environment is described in the previous section and will not be repeated here. Therefore, the Mo/TOC ratio can be used to evaluate the degree of water retention in anaerobic marine basins [54,55].
The Mo/TOC values of the Wufeng Formation range from 0.69 to 10.79, with a mean value of 5.71, exhibiting considerable variation. The Guanyinqiao Member has an average Mo/TOC value of 2.45, while the Longmaxi Formation ranges from 1.49 to 39.02, with a mean value of 5.09. Two samples from the Wufeng Formation fall within the ranges of the Cariaco Basin and Black Sea, indicating significant changes in the water environment, consistent with the current Cariaco Basin and Black Sea water environments. On the other hand, most of the samples from the Guanyinqiao Member and Longmaxi Formation fall within the ranges of the Framvaren and Black Sea, respectively, consistent with the current Framvaren and Black Sea environments. This suggests the water body in the study area changed from weak retention to strong retention during the Longmaxi Formation period. From the Guanyinqiao period to the Longmaxi period, the water body changed to a strong retention state. Overall, there was a transition from weak to strong water retention during the sedimentary period of the Wufeng Formation–Longmaxi Formation. This change may be attributed to frequent changes in sea level during the Ordovician, with an overall decreasing trend. During the late Ahsislhan of the Ordovician to the early Llandoverian, a Wufeng regression event occurred, which led to the disruption of communication between the water body and the paleotethys Sea, resulting in a strong retention environment in the Longmaxi Formation basin [8].
Mo and U are often enriched in sediments under hypoxic–sulfidic conditions, and their co-variation, can be used as a special redox indicator in low-oxygen marine systems [56]. The enrichment factors of Mo and U in the shale of the Well Youc-2 in the Wufeng Formation–Longmaxi Formation were analyzed by plotting, and the samples were distributed between 0.1- and 1-times seawater, with a predominance of suboxic-to-anoxic conditions. The Wufeng Formation samples fell into both oxic and anoxic seawater ranges (Figure 8b), showing significant differences. Jiang [8] proposed that there were two marine regression events in the Ordovician-Silurian early period on the Upper Yangtze platform. The first regression event, named the Linxiang regression event, occurred at the boundary between the Linxiang and Wufeng formations in the early Ahsislhan, when the sea level reached its highest and subsequently fluctuated frequently but showed an overall declining trend until the second regression event, named the Wufeng regression event, occurred at the top of the Wufeng Formation in the late Ahsislhan to early Llandoverian. It was attributed to the development of glaciers caused by the cooling climate, and nodular limestone gradually transformed into argillaceous limestone in this formation globally. The early rapid sea level rise of the Longmaxi Formation inherited the lithofacies paleogeography pattern of the Wufeng Formation. Then, the collision and assembly of the Yangtze block and surrounding blocks intensified, resulting in a sea level drop, slow westward shift of the subsidence center, enhanced marine closure, increased territorial debris input, decreased productivity of surface water plankton, and the gradual evolution of the water environment from an anoxic reducing environment to a weak reducing-oxidizing environment, consistent with the redox indicator, Mo/TOC and the co-variation relationship of UEF-MoEF in this study.
In summary, the data of Youc well 2 show that the weathering degree was high from the Wufeng Formation to the bottom of the Longmaxi Formation, which promoted the flux of terrestrial debris into the ocean, increased the input of nutrient elements, enhanced primary productivity, and facilitated the preservation of organic matter in a reducing environment. In the middle-upper part of the Longmaxi Formation, the degree of weathering relatively decreases compared to the lower part, but the change trend was relatively stable. The water body was dominated by a suboxic–oxic environment, with relatively reduced organic carbon content and a decrease in the input of nutrient elements from terrestrial debris into the ocean, which was not conducive to organic matter preservation.

5.4. Paleoproductivity and Weathering Degree

Primary productivity is the capacity of sedimentary water bodies to produce organic matter. If the primary productivity is high, the water body is rich in organic matter, and if it decreases, the organic matter content of the water body decreases. Organic matter in the water body was mainly produced by various types of living organisms, and its high organic matter content reflects the prosperity of the organisms. P, Mo, Cu, Zn, and other trace elements are the main nutrients that living organisms depend on to survive. The content of these elements controls the aerobic plankton in the ocean, which in turn controls the primary productivity of the ocean [58,59]. P and other elements are easily affected by sedimentary organic matter or authigenic minerals. To eliminate the error generated by directly using P elements as indicators, the P/Ti ratio is often used as an indicator of paleoproductivity [60]. Fine-grained sediments have a weak “grain control effect” on Mo elements. Mo can precipitate and accumulate in sedimentary rocks [60]. The accumulation rate of Mo elements is consistent with that of organic matter. In an anoxic environment, Mo is also one of the main indicators of water body productivity [56]. Cu and Zn are easily absorbed by microorganisms under photosynthesis, and their concentrations in water bodies decrease accordingly [58,61]. The organic particles transported by weathering undergo partial decomposition during their sedimentation in the water, and some of these nutrients are released back into the water and re-enter the cycle, while the remainder settles to the seafloor with the organic matter particles and is further decomposed by bacteria before being released back into the overlying water, with the residual fraction being buried and preserved [62]. Therefore, these nutrients are commonly used as indicators of the primary productivity ability of water bodies. In the bottom of Well Youc-2 of the Wufeng Formation–Longmaxi Formation, the weathering indices CIA, CIW, and CIA-error increase from low to high and back to low (Figure 9), indicating a sequence of weak–strong–weak weathering, with the lowest values occurring in the Guanyinqiao member, which experienced the coldest climate during the global ice age of that period. Correspondingly, the values of the productivity indicators P/Ti, Mo, Zn, and Cu are also the lowest in this section, indicating the lowest primary productivity (Figure 9). In the siliceous rock section at the base of the Longmaxi Formation, the weathering indices CIA, CIW, and CIA-error relatively increase, indicating a warming climate and an increase in primary productivity indicators P/Ti, Mo, Zn, and Cu and thus higher primary productivity (Figure 9). In the grayish-pink sandstone and light-colored mud shale sections of the upper part of the Longmaxi Formation, the weathering indices CIA, CIW, and CIA-error start to increase from low to high, indicating a warming climate, and the corresponding productivity indicators P/Ti, Mo, Zn, and Cu also increase, resulting in an increase in primary productivity (Figure 9). These results suggest that the degree of weathering controls the input of terrestrial debris into the marine water body, which in turn controls the input of nutrients into the ocean, resulting in an increase–decrease–increase–decrease changing pattern of primary productivity in the Wufeng Formation–Longmaxi Formation, shale.

5.5. Organic-Rich Shale Sedimentary Model

The formation of organic-rich shale is a gradual accumulation process of organic matter closely related to the conditions for its production, preservation, and burial. Primary productivity, redox conditions, and territorial debris play a crucial role in the enrichment of organic matter, and three modes have been established: productivity mode, productivity and preservation overlay mode, and preservation mode [63,64,65]. The productivity mode suggests that high primary productivity of surface water is the main condition for organic-rich sedimentation [63,64]; the preservation mode suggests that the enrichment of organic matter is a result of marine/lake anoxic conditions and emphasizes the influence of anoxic depositional environments on organic matter enrichment [64]; and the productivity and preservation overlay mode proposes that the aggregation of organic matter is a result of the combined action of productivity and preservation conditions [66]. Two modes of organic-rich shale sedimentation related to weathering degree were established by studying the Well Youc-2 of Wufeng Formation–Longmaxi Formation’s sedimentary characteristics, sea level changes, La/Yb-ΣREE diagrams, Al2O3/TiO2-CIA correlations, and the relationship between weathering degree and paleoclimate features (CIAerror, CIA, and CIW), redox proxies (V/Cr, V, U, Ni, Ni/Co, TOC-Mo relationship, and UEF-MoEF covariance pattern), and primary productivity indicators (P/Ti, Mo, Zn, and Cu) (Figure 10). The first mode is for the deep-water shelf microfacies of the Wufeng Formation–Longmaxi Formation within the SS1 and SS2 sequence–stratigraphic units of a transgressive system tract during sea level rise. The weathering degree and terrestrial debris show a weak–strong–weak–strong trend, while the climate changes from warm and humid to cold and then back to warm and humid cyclically. Primary productivity varies with a decreasing-increasing-decreasing-increasing trend, and the redox environment changes from suboxic to anoxic, to oxic, and then back to suboxic (Figure 10a). The second mode occurs in the middle-upper part of the Longmaxi Formation (grayish sandy and light-colored muddy shale sections), where the depositional environment is a shallow mixed shelf, shallow sandy shelf, and shallow muddy shelf within the SS3 and SS4 sequence stratigraphic units. The sea level becomes shallower overall with a decrease in terrestrial debris. The weathering degree and terrestrial debris show a weak–strong trend, while the climate changes from dry and cold to warm and humid. Primary productivity varies with a decreasing-increasing trend, and the redox environment changes from suboxic to oxic (Figure 10b). Overall, the Wufeng Formation–Longmaxi Formation’s bottom section is the primary layer for organic-rich shale enrichment, while the middle-upper section, with a shallower water column, reduced weathering degree, decreased terrigenous input, and lower primary productivity, is the disadvantageous layer for organic matter enrichment.

6. Conclusions

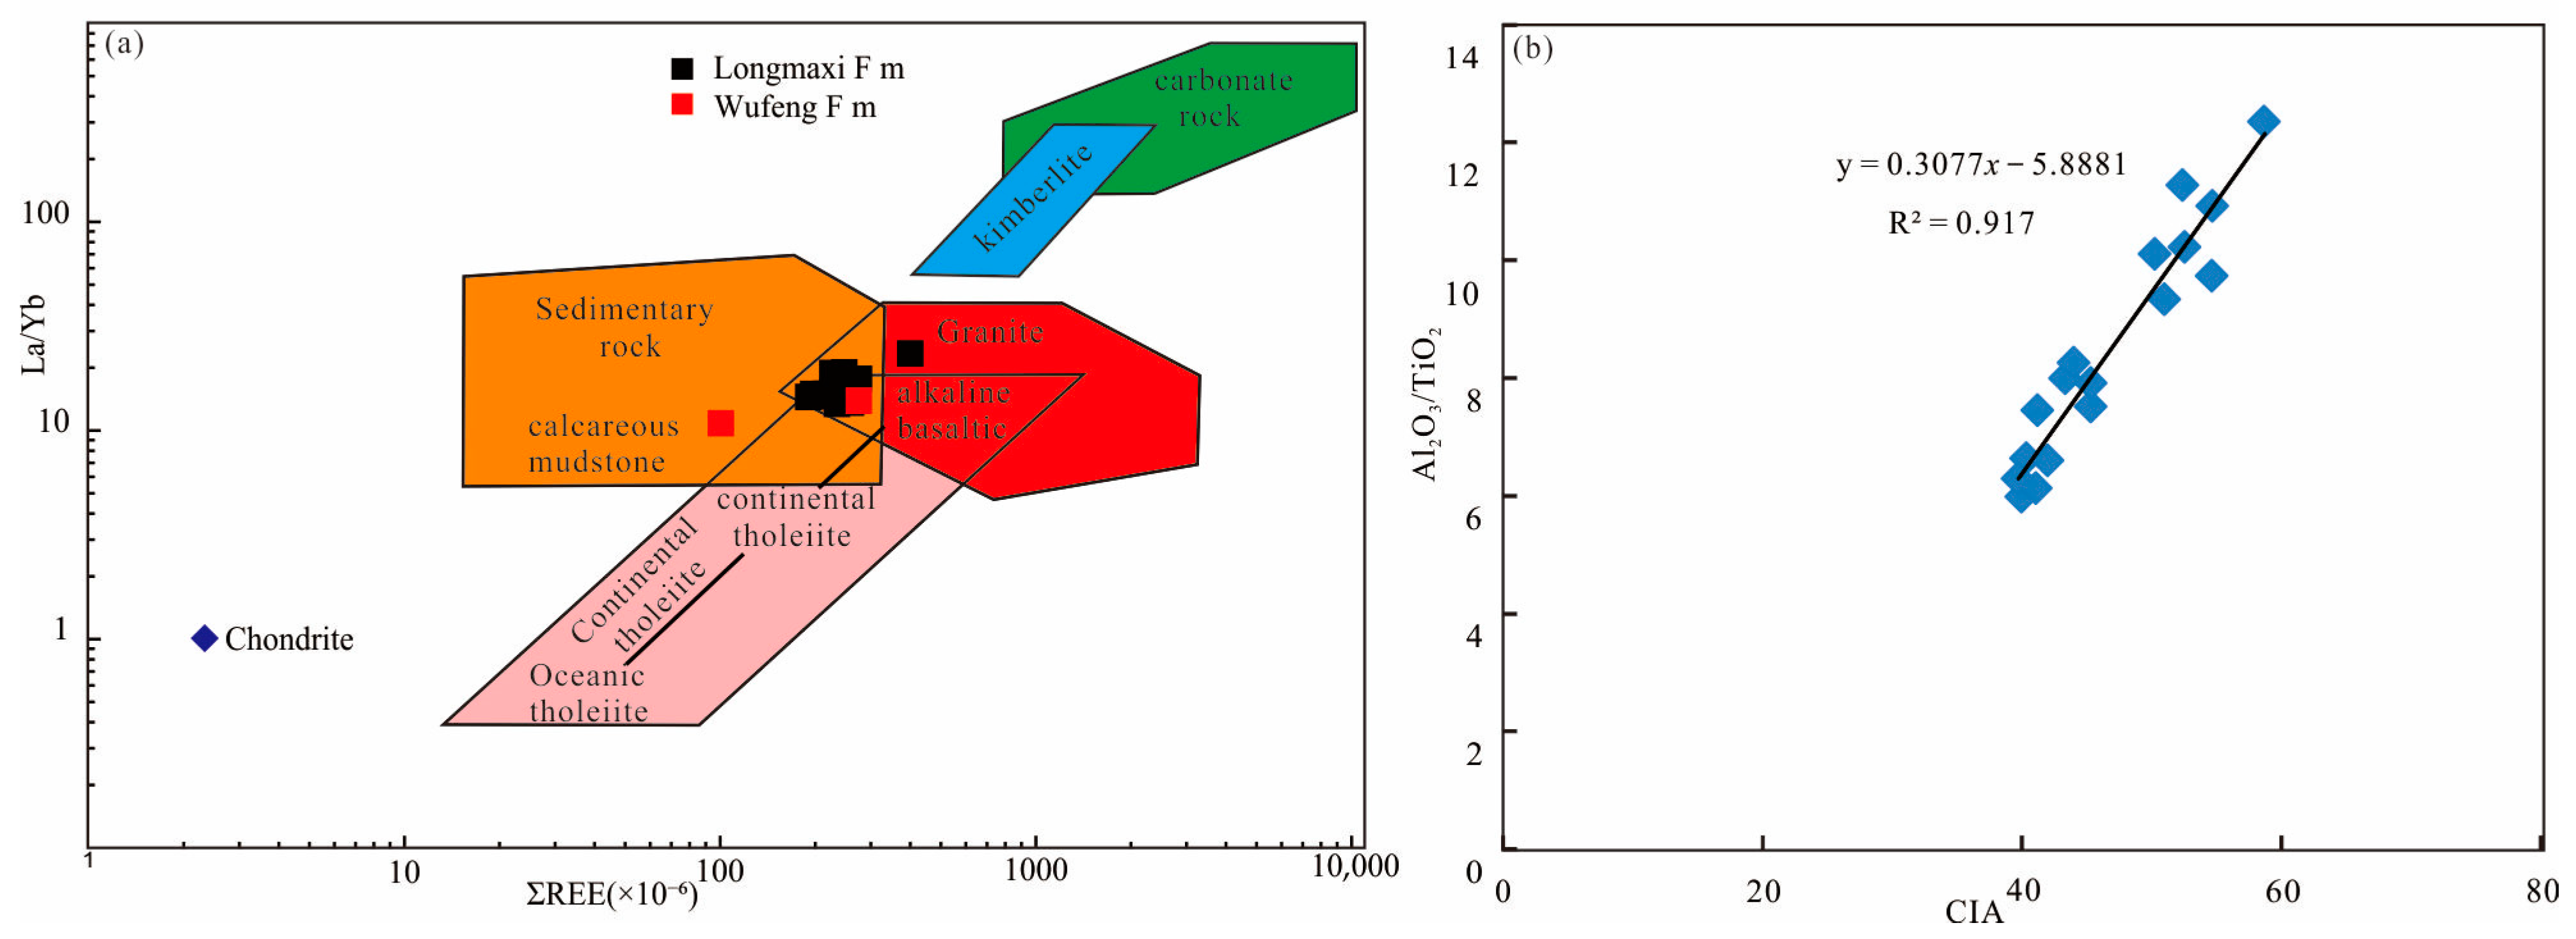
  • Based on lithology and single-well logging curves, the sequence stratigraphy, and depositional systems of the Wufeng Formation–Longmaxi Formation in the southeastern Sichuan Basin were analyzed. Four third-order sequences (SS1, SS2, SS3, and SS4) were identified, with the lower part of the Wufeng Formation–Longmaxi Formation consisting of a transgressive systems tract. In the Guanyinqiao Member, the sedimentation of mudstone is thin, and the highstand system tract cannot be identified by logging, while the upper part of the Longmaxi Formation consists of both transgressive and highstand system tracts. The transgressive systems tract was formed in a deep-water muddy shelf, a shallow-water sandy shelf, and a shallow-water muddy shelf with sufficient sediment supply, while the highstand systems tract mainly formed in a shallow-water mixed shelf and a shallow-water sandy shelf with insufficient sediment supply. Overall, the Longmaxi Formation is a sea retreat from the bottom to the top. Based on sequence stratigraphy analysis, two sedimentary facies and several sedimentary microfacies were identified. Combined with La/Yb-∑REE diagrams and REE distribution curves, it was shown that the matter mainly comes from the sedimentary rocks, granite, and alkaline basalt from the upper crust.
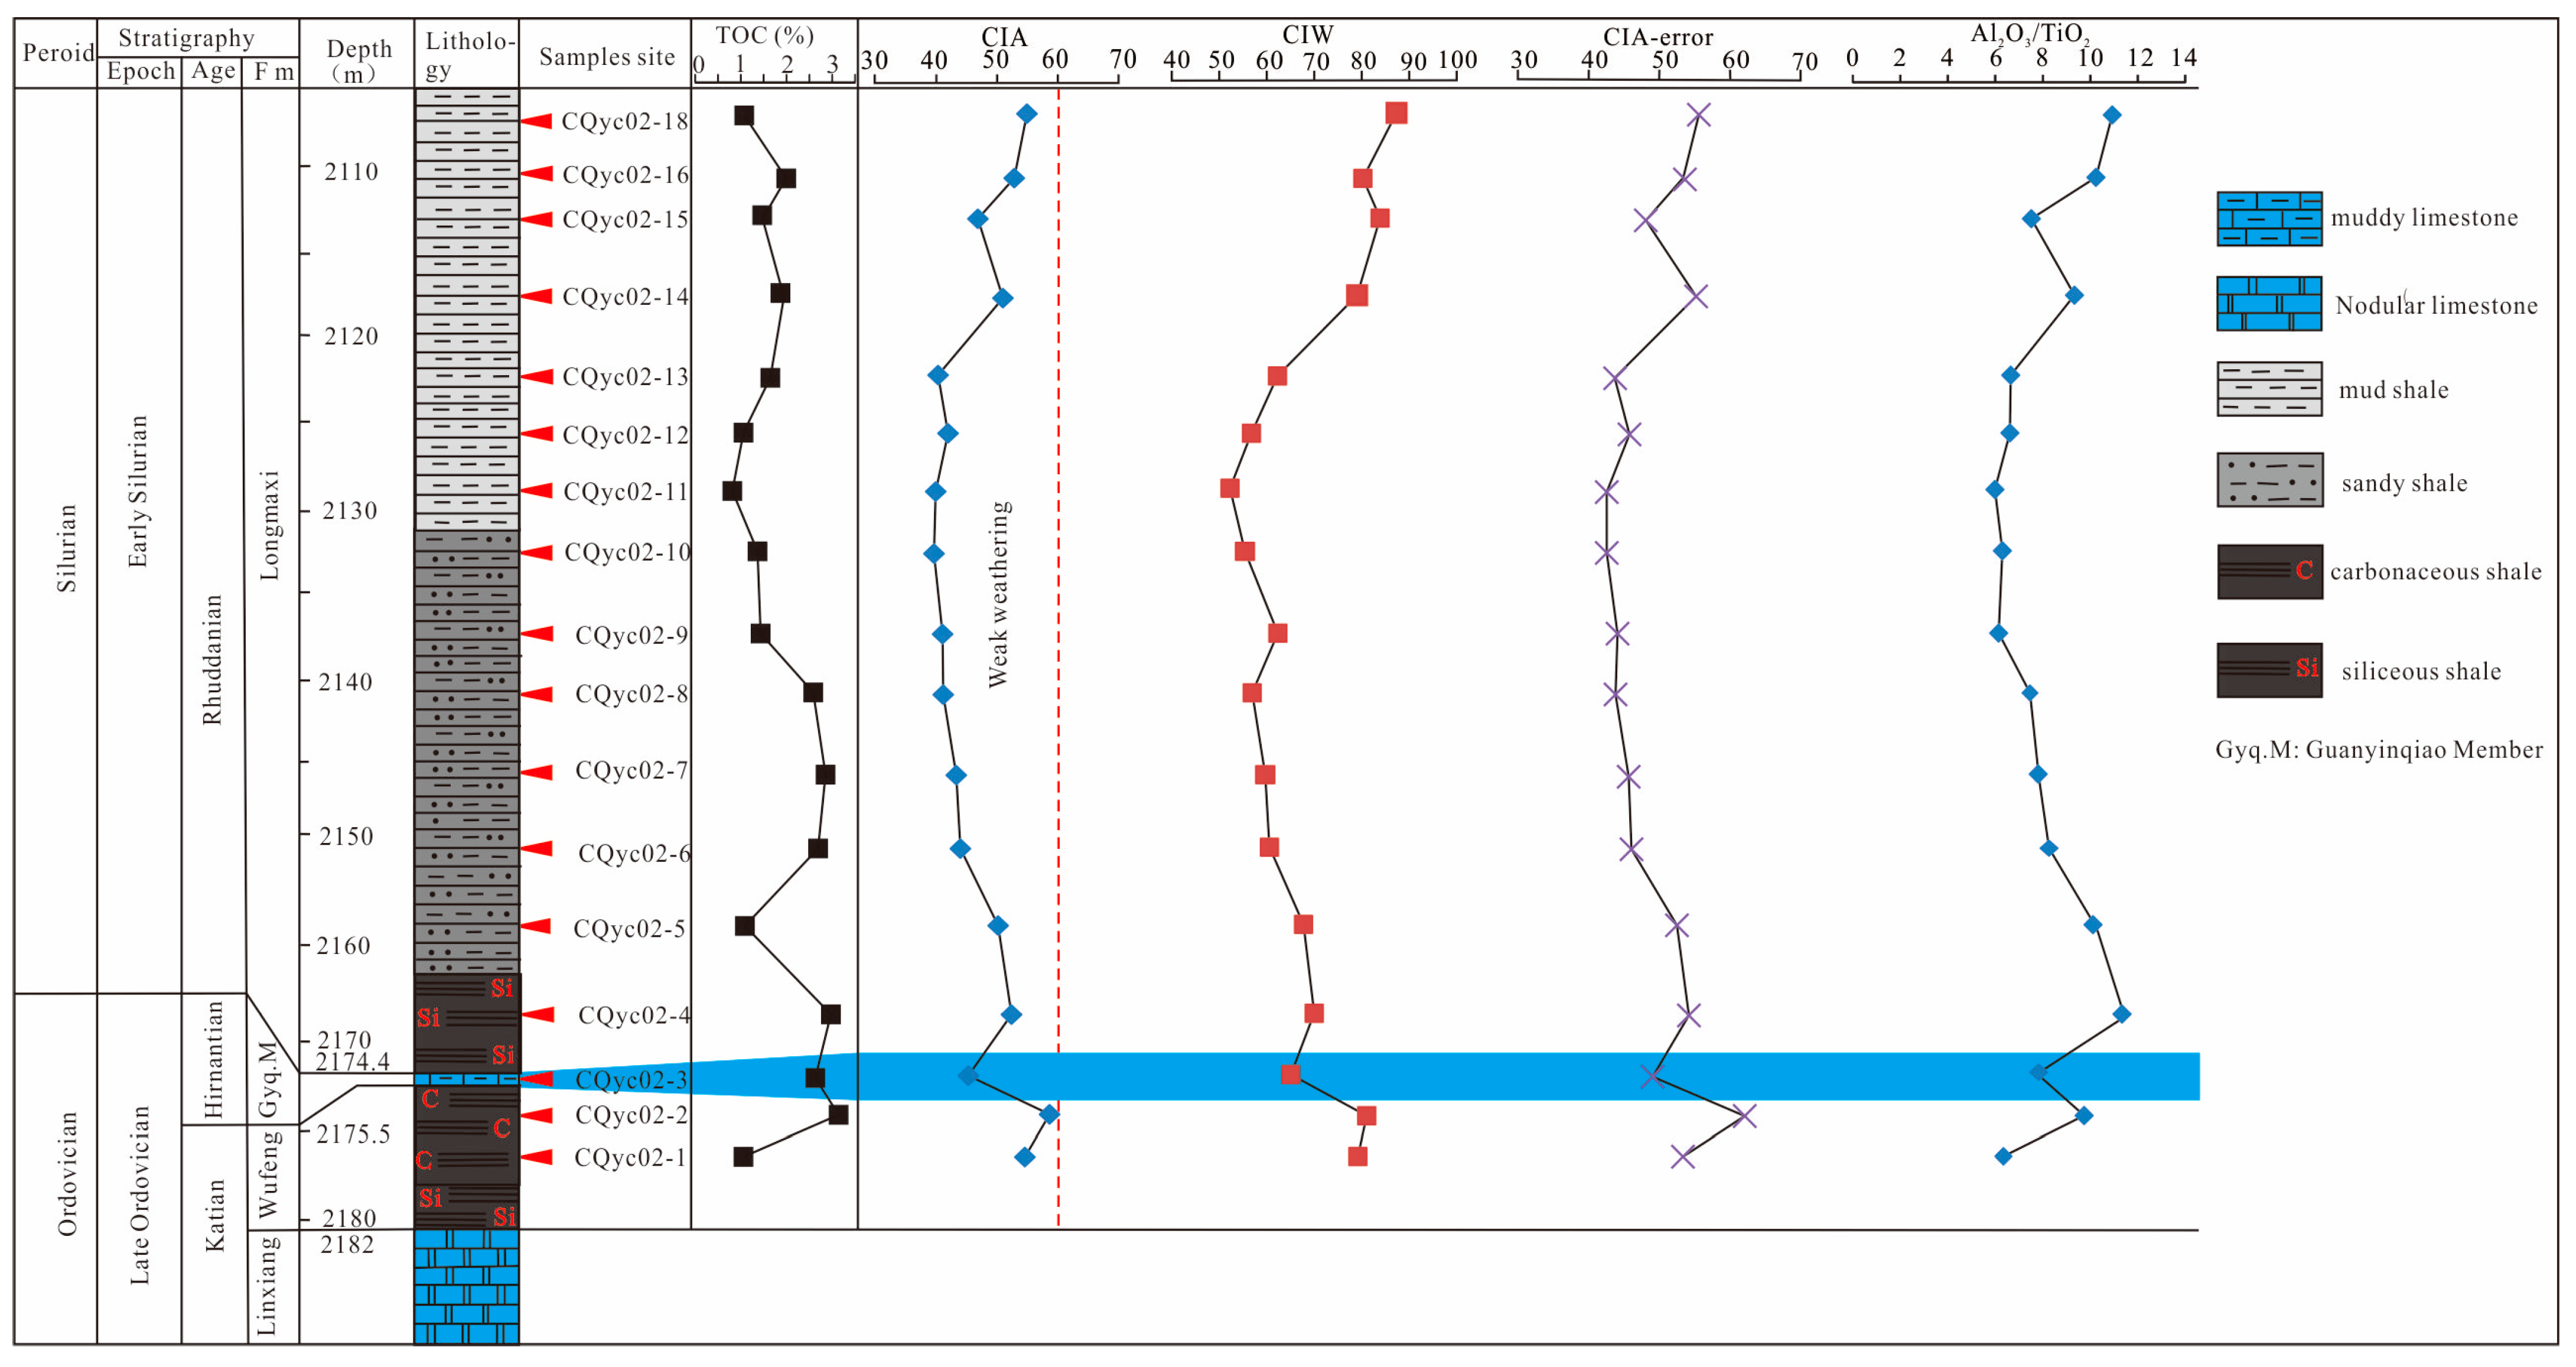
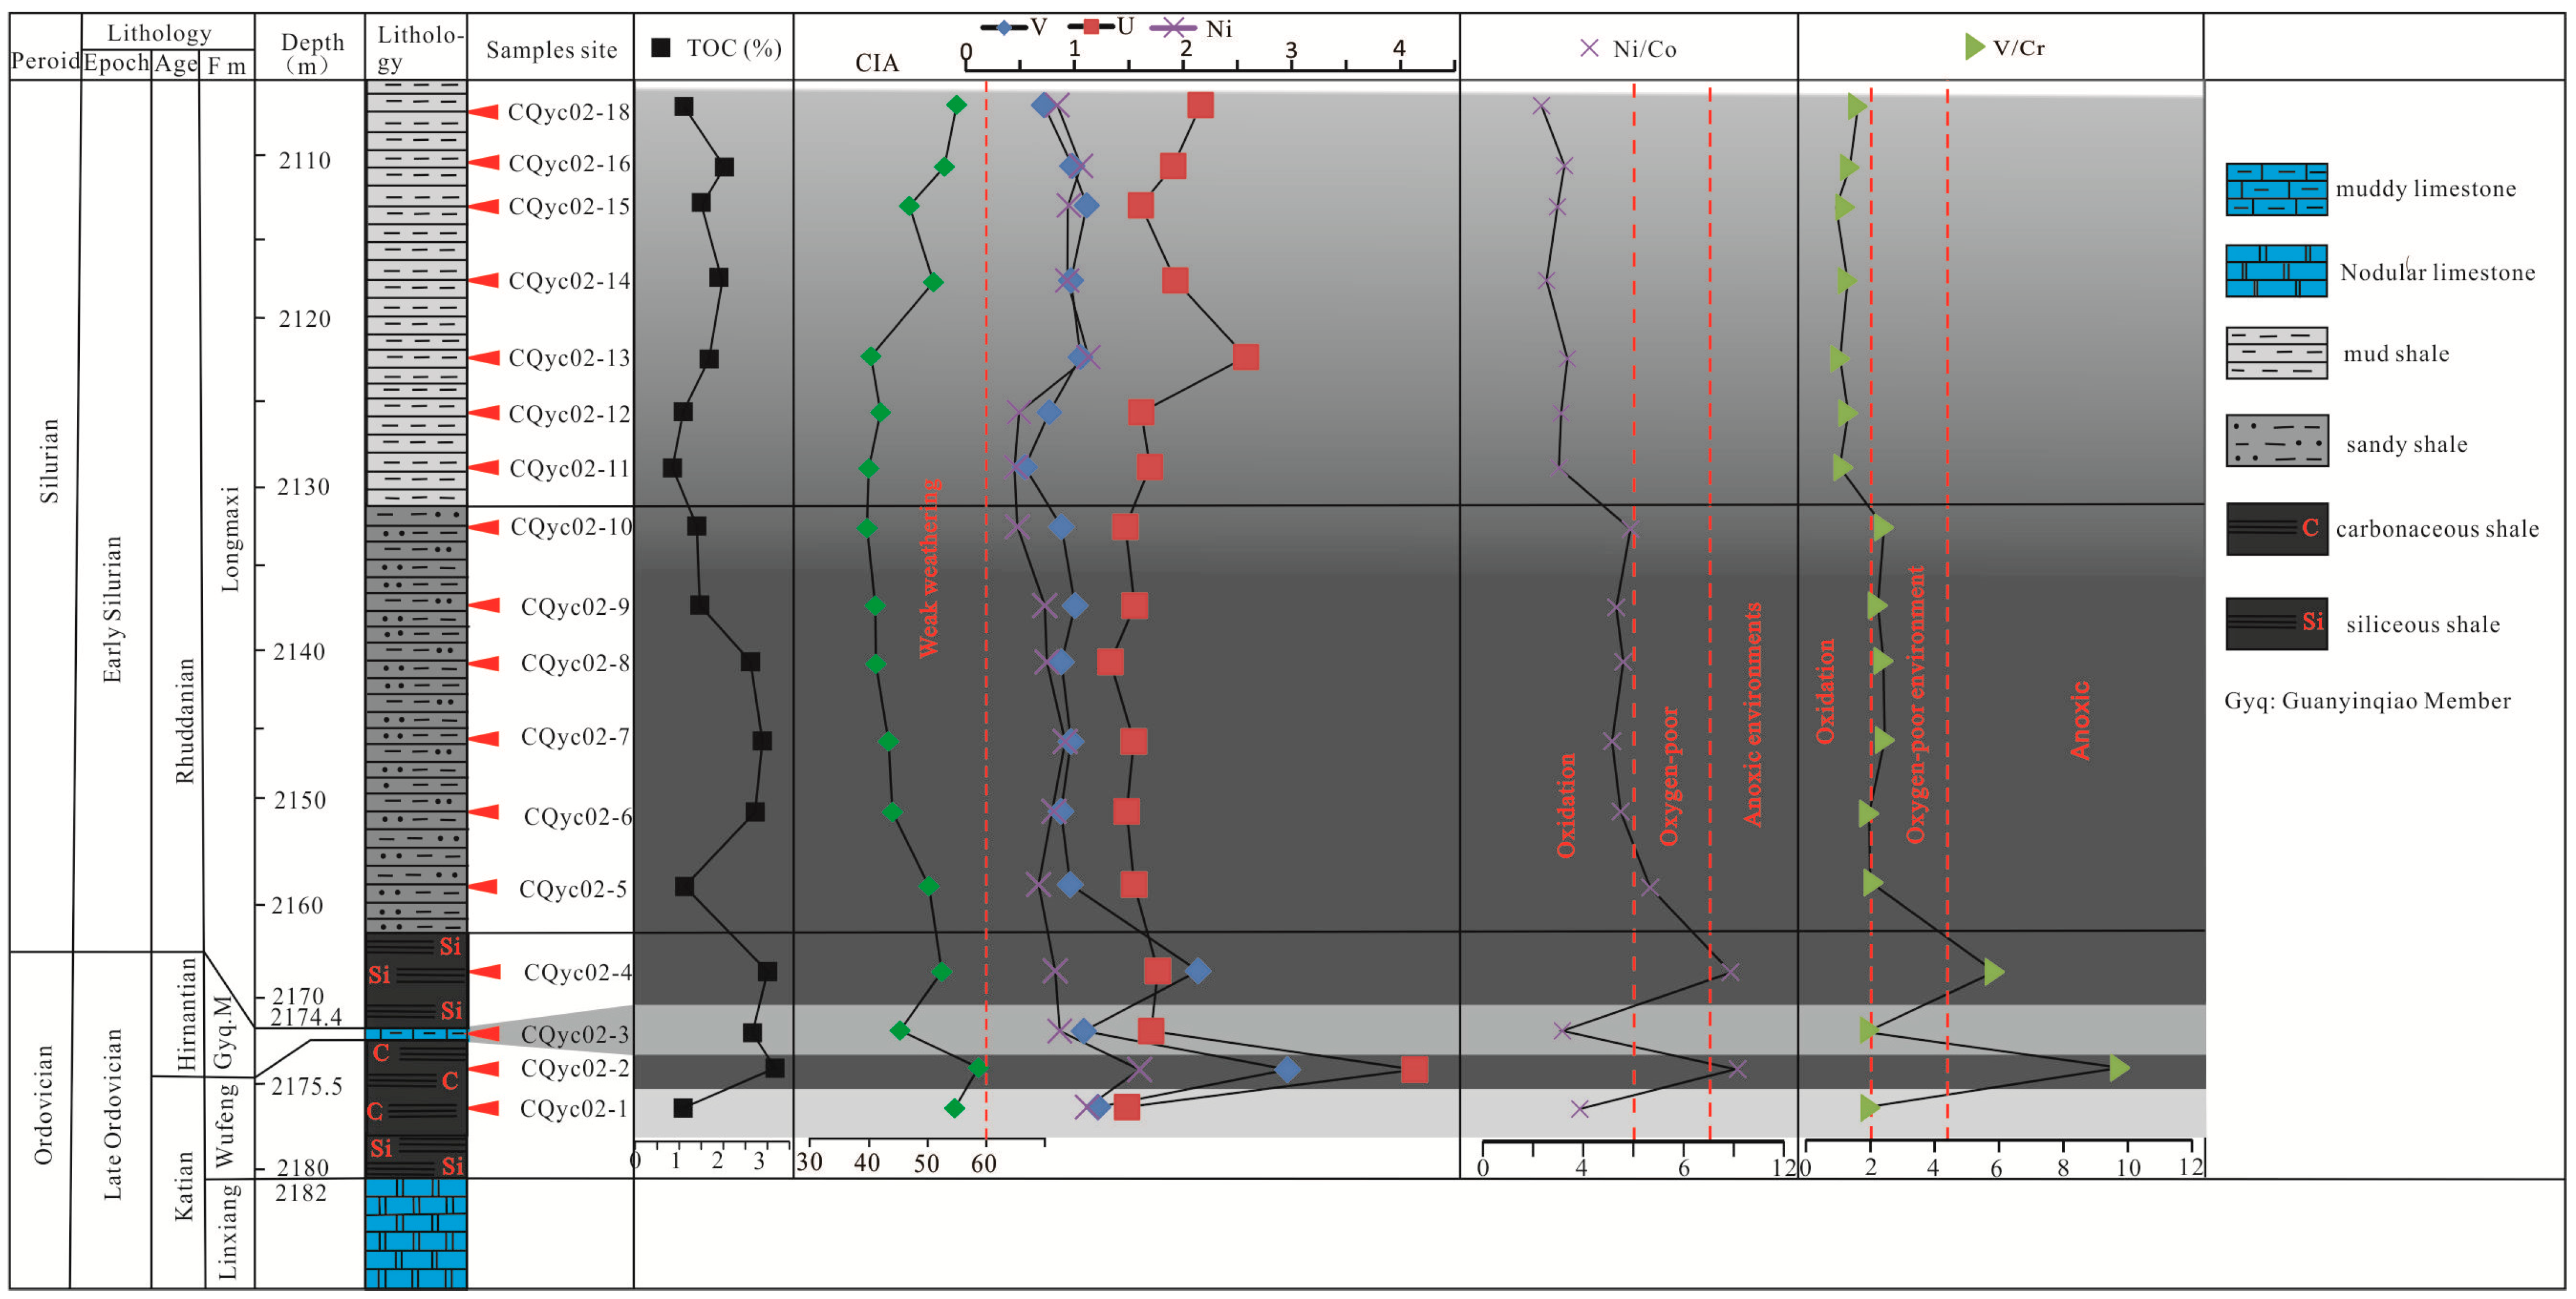
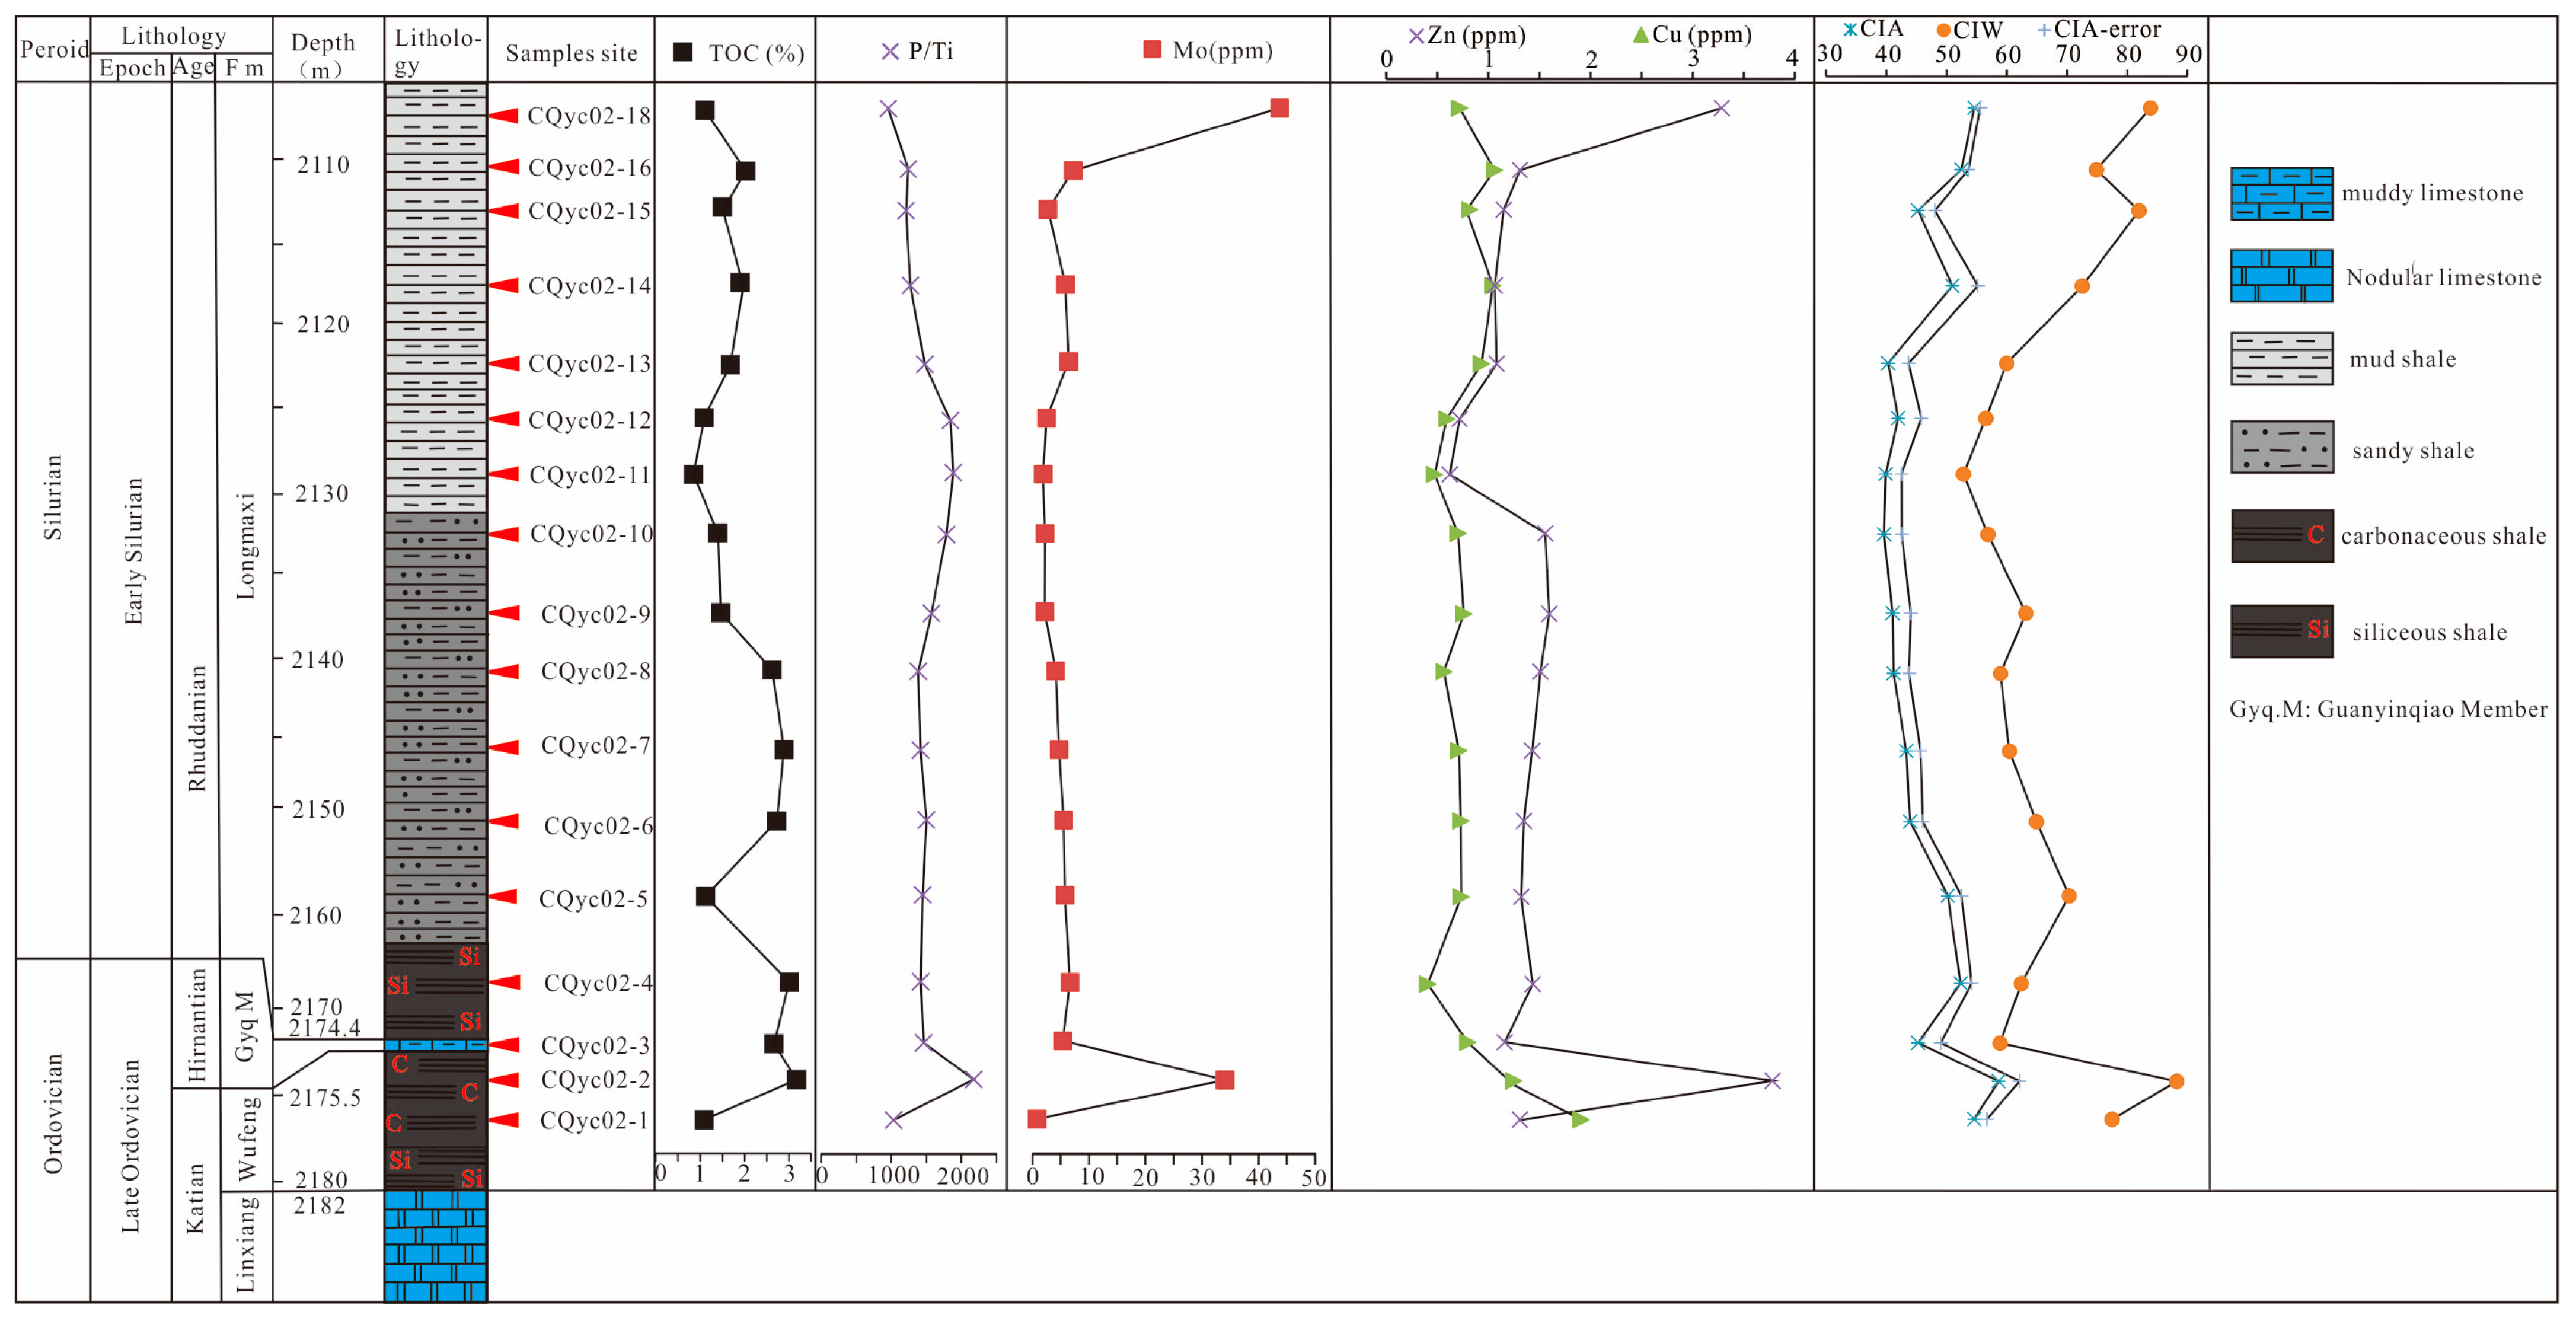
  • The positive correlation between weathering indices (CIA, CIW, CIA-error) and terrigenous input (Al2O3/TiO2-CIA, Al2O3/TiO2), redox indicators (V/Cr, Ni/Co), and primary productivity (P/Ti, Mo, Zn, Cu) indicates that the degree of weathering at the bottom of the Wufeng Formation–Longmaxi Formation, plays a controlling role in primary productivity and redox conditions. Sufficient terrigenous input testifying for higher weathering rates and input promotes the supply of nutrients, leading to a reducing environment that favors the enrichment of organic matter. In contrast, as the water becomes shallower and the degree of weathering decreases in the upper part of the Longmaxi Formation, primary productivity decreases, and the reducing environment shifts to a suboxic–oxic environment, resulting in poor production and preservation of organic matter.
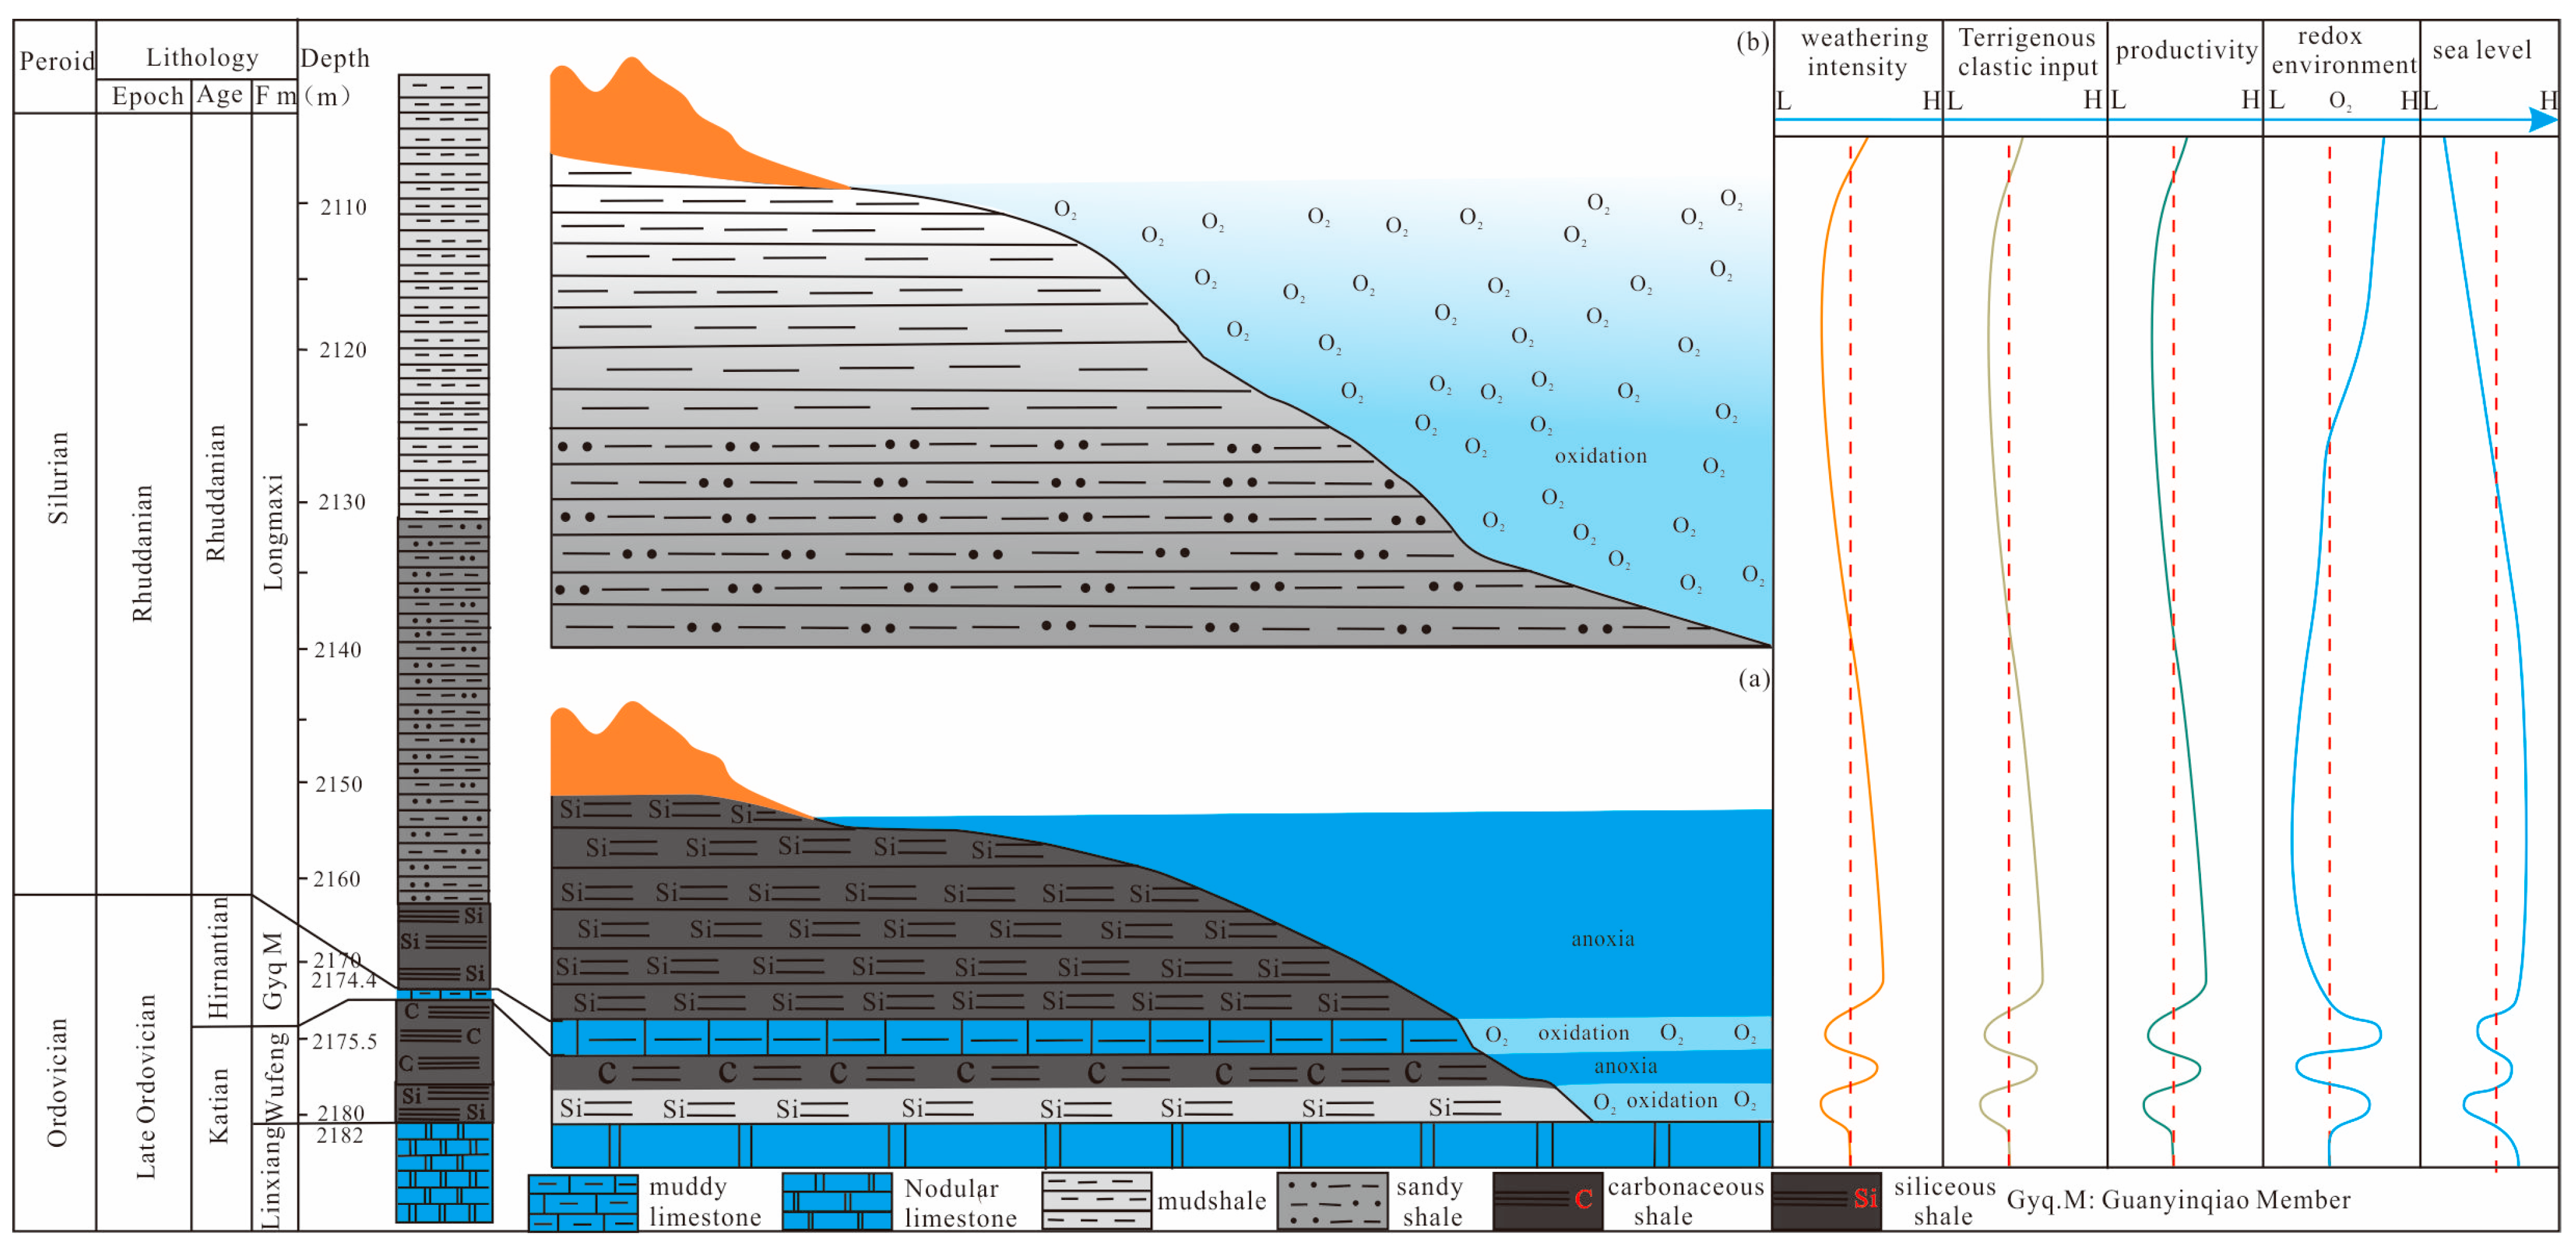
  • By studying the sedimentary facies, primary productivity, redox conditions, weathering degree, climate, and sea level changes in the Wufeng Formation–Longmaxi Formation, in Well Youc-2, two organic-rich accumulation modes were established. One mode was characterized by frequent environmental changes in the bottom of the Wufeng Formation–Longmaxi Formation, where the redox conditions changed from oxic to anoxic and back to oxic, weathering degree and climate changed from humid to arid and back to humid, primary productivity and sea level changed in a pattern of enhancement-rise, weakening-fall, enhancement-rise, and enhancement-rise. This mode created a favorable sediment environment for organic matter enrichment. The other mode was characterized by a suboxic to oxic water environment in the upper part of the Longmaxi Formation (i.e., the dark gray siltstone shale and light gray mud shale units), where a weakening weathering degree and increasing aridity, decreasing primary productivity and sea level, and worsening conditions for organic matter production and preservation lead to a poor environment for organic matter enrichment.

Author Contributions

Conceptualization, Z.Z.; methodology, Z.Z. and Y.L.; software, Y.G.; validation, D.Z. and J.Z.; formal analysis, Z.Z.; investigation, Z.Z.; resources, Z.Z. and Y.G.; data curation, Z.Z.; writing—original draft preparation, Z.Z.; writing—review and editing, Y.G. and Z.Z.; visualization, Z.Z. and C.Z.; supervision, C.Z.; project administration, C.Z.; funding acquisition, Z.Z. All authors have read and agreed to the published version of the manuscript.

Funding

This work was supported by the Project of China Geological Survey (DD20230280), the Jiangsu Natural Science Foundation project (Grant No. SBK2021045820), the Chongqing Natural Science Foundation general Project (Grant No. cstc2021jcyj-msxmX0624), the Graduate Innovation Program of China University of Mining and Technology (Grant No. 2022WLKXJ002), the Postgraduate Research & Practice Innovation Program of Jiangsu Province (Grant No. KYCX22_2600) and Open Fund of the Research Center for Petrogenesis and Mineralization of Granitoid Rocks, China Geological Survey (No. PMGR202102).

Data Availability Statement

All data generated or analyzed during this study are included in this article (Appendix A).

Acknowledgments

We thank Heng-ye Wei for his encouragement and constructive comments on the manuscript. We would also like to thank the anonymous reviewers for their comments which helped to improve the manuscript.

Conflicts of Interest

The authors declare that they have no known competing financial interest or personal relationships that could have influenced the work reported in this paper.

Appendix A

Table A1. Test results and indicators of oxide content of the Wufeng Formation–Longmaxi Formation, shale in Well Youc—2 (%).
SamplesTOC (%)P (ppm)Al2O3FeOFe2O3Na2OMgOSiO2TiO2K2OCaOMnOP2O5TFe2O3Al2O3/TiO2CIACIWICVCIA-Error
CQyc02-171.120454.0008.7303.6902.4900.6803.15053.2900.8005.9000.9400.3800.0106.18010.91354.89487.2711.64355.585
CQyc02-161.970517.0007.0502.1304.0000.9202.86057.3000.6904.5501.2200.8300.0126.13010.21752.82280.1442.13853.604
CQyc02-151.520528.0005.4803.8302.5300.8903.30060.8100.7305.1700.5700.6700.0126.3607.50746.81183.8352.52948.044
CQyc02-141.870542.0006.6203.1303.2500.8803.10057.8200.7104.6203.2100.7400.0126.3809.32450.92378.9982.49455.190
CQyc02-131.760616.0004.6402.4902.8501.4102.59057.9800.7004.0603.5400.7300.0145.3406.62940.27862.1983.42243.698
CQyc02-121.110696.0004.2201.9101.0801.6101.98063.8700.6402.6305.1300.4700.0162.9906.59441.90756.7203.20945.744
CQyc02-110.810786.0004.1801.4001.3301.9101.57066.3000.7002.4804.7400.7900.0182.7305.97139.88552.2503.23442.514
CQyc02-101.360728.0004.2702.2201.3901.7201.84065.7600.6803.0704.1800.7500.0173.6106.27939.61055.3833.19242.541
CQyc02-91.430687.0004.5302.2802.1201.3702.35062.4900.7403.7803.2100.2100.0164.4006.12240.99562.3113.04244.038
CQyc02-82.590522.0004.6902.1001.6801.7802.01063.5400.6303.1504.0500.6800.0123.7807.44441.14056.8482.98143.749
CQyc02-72.860534.0005.1102.0802.1901.7302.11060.6200.6403.2403.7200.3900.0124.2707.98443.26859.6272.74445.627
CQyc02-62.720566.0005.2802.5101.7801.7202.19061.5100.6403.3003.4800.4700.0134.2908.25043.92760.5502.57246.050
CQyc02-51.110546.0006.3602.4501.6101.5202.04062.4500.6303.2803.4300.5300.0134.06010.09550.15867.6602.05052.449
CQyc02-42.980535.0007.2102.9601.2101.5502.19060.1500.6403.4703.1300.6900.0124.17011.26652.32269.9321.78654.134
Average1.801589.7865.5982.5132.1081.4062.37760.9920.6843.7643.1820.5950.0144.6217.90845.98366.5642.52248.603
Minimum0.810454.0004.1801.4001.0800.6801.57053.2900.6302.4800.5700.2100.012.7305.97139.61052.2501.64342.514
Maximum2.980786.0008.7303.6904.0001.9103.30066.3000.8005.9005.1300.8300.0186.38011.26654.89487.2713.42255.585
CQyc02-3GB2.658566.0005.1402.4301.7601.3802.50061.9000.6503.4604.0500.7100.0134.1908.16745.24665.0632.82349.018
CQyc02-23.170411.0003.9500.9301.2700.5201.18074.7700.3201.7501.8900.4900.0092.20012.34458.60579.1581.87862.077
CQyc02-11.050490.0007.7803.2301.8001.1302.94059.8800.8004.2202.5900.6300.0115.0309.72554.55877.4901.81456.688
Average2.140450.5005.8652.0801.5350.8252.06067.3250.5602.9852.2400.5600.013.61511.03455.85778.0441.83558.492
Minimum2.140450.5005.8652.0801.5350.8252.06067.3250.5602.9852.2400.5600.013.61511.03455.85778.0441.83558.492
Maximum1.050411.0003.9500.9301.2700.5201.18059.8800.3201.7501.8900.4900.0092.2009.72554.55877.4901.81456.688
Table A2. Trace element test results (ppm) and characteristic values of Wufeng Formation–Longmaxi Formation, shale in Well Youc-2.
Sample NoTOC(%)TiVCrCoNiCuZnSrMoBaUBV/CrNi/CoMo/TOCP/Ti
CQyc02-171.1200.48108.0064.9019.6046.2035.80279.00122.0043.70716.006.70109.001.662.3639.02945.83
CQyc02-161.9700.42147.00104.0017.8058.3053.00111.00108.007.18619.005.9195.101.413.283.641230.95
CQyc02-151.5200.44167.00132.0017.4052.1040.8097.7093.002.68623.004.9982.501.272.991.761200.00
CQyc02-141.8700.43145.00108.0020.0051.3052.1090.30142.005.79593.005.9795.201.342.573.101260.47
CQyc02-131.7600.42158.00142.0018.3062.1046.5091.80155.006.36572.007.9973.701.113.393.611466.67
CQyc02-121.1100.38115.0084.508.5326.8029.6060.90174.002.46431.005.0054.501.363.142.221831.58
CQyc02-110.8100.4281.5067.508.3225.4023.6052.80189.001.86421.005.2549.401.213.052.301871.43
CQyc02-101.3600.41132.0053.304.4026.0035.00132.14180.002.15497.004.5561.102.485.911.581775.61
CQyc02-91.4300.44151.0066.107.5040.0037.80135.60147.002.13559.004.8166.602.285.331.491561.36
CQyc02-82.5900.38132.0053.707.3041.0028.30128.20170.004.06543.004.1247.902.465.621.571373.68
CQyc02-72.8600.38145.0058.109.7050.2035.50121.40179.004.66566.004.7937.202.505.181.631405.26
CQyc02-62.7200.38131.0065.128.1044.6036.40114.55156.005.46567.004.5845.402.015.512.011489.47
CQyc02-51.1100.38144.0067.205.5036.8036.60112.14203.005.71574.004.8042.002.146.695.141436.84
CQyc02-42.9800.38320.7054.308.3588.3520.20121.82140.006.59575.005.4750.505.9110.582.211407.89
Average1.8010.41148.3780.0512.0543.2936.51117.81154.147.20561.145.3565.011.853.595.091438.50
Minimum1.8010.41148.3780.0512.0543.2936.51117.81154.147.20561.145.3565.011.853.595.091438.50
Maximum0.8100.3881.5053.304.4025.4020.2052.8093.002.13421.004.1237.201.112.361.49945.83
CQyc02-3GB2.6580.39163.0080.3014.9047.5039.8098.50143.006.51570.005.2840.102.033.192.451451.28
CQyc02-23.1700.19444.0045.308.4087.9062.30321.2479.4034.00445.0012.8033.609.8010.4610.732163.16
CQyc02-11.0500.48182.2489.0015.8061.4095.30111.00108.000.77659.004.6055.602.053.890.691020.83
Minimum1.0500.19182.2445.308.4061.4062.30111.0079.400.77445.004.6033.602.053.890.691020.83
Maximum3.1700.48444.0089.0015.8087.9095.30321.24108.0034.00659.0012.8055.609.803.8910.732163.16
Average2.1400.34287.0067.1512.1074.6578.80132.5093.7017.39552.008.7044.604.276.175.711344.78
Table A3. Correlation between shale oxides and trace elements of the Wufeng Formation–Longmaxi Formation, shale in Well Youc-2.
CrCoCuZn
Al2O30.2710.7370.3900.565
MgO0.4860.8620.3040.349
TiO20.2490.5320.0190.075
TFe2O30.4820.9260.2490.362
Table A4. Element enrichment coefficients of the Wufeng Formation–Longmaxi Formation, shale in Well Youc-2.
FmSample NoTiVCrCoNiCuZnSrMoBaUB
Longmaxi FmCQyc02-170.480.720.590.850.840.723.280.6132.611.102.163.89
CQyc02-160.420.980.950.771.061.061.310.545.360.951.913.40
CQyc02-150.441.111.200.760.950.821.150.472.000.961.612.95
CQyc02-140.430.970.980.870.931.041.060.714.320.911.933.40
CQyc02-130.421.051.290.801.130.931.080.784.750.882.582.63
CQyc02-120.380.770.770.370.490.590.720.871.840.661.611.95
CQyc02-110.420.540.610.360.460.470.620.951.390.651.691.76
CQyc02-100.410.880.480.190.470.701.550.901.600.761.472.18
CQyc02-90.441.010.600.330.730.761.600.741.590.861.552.38
CQyc02-80.380.880.490.320.750.571.510.853.030.841.331.71
CQyc02-70.380.970.530.420.910.711.430.903.480.871.551.33
CQyc02-60.380.870.590.350.810.731.350.784.070.871.481.62
CQyc02-50.380.960.610.240.670.731.321.024.260.881.551.50
CQyc02-40.382.140.490.710.820.401.430.704.920.881.761.80
Average0.410.990.730.520.790.731.390.775.370.861.732.32
Minimum0.380.540.480.190.460.400.620.471.390.651.331.33
Maximum0.482.141.290.871.131.063.281.0232.611.102.583.89
Guanyinqiao MemberCQyc02-3GB0.391.090.730.650.860.801.160.724.860.881.701.43
Wufeng F mCQyc02-20.192.960.410.371.601.253.780.4025.370.684.131.20
CQyc02-10.481.210.810.691.121.911.310.540.571.011.481.99
Average0.342.090.610.531.361.582.540.4712.970.852.811.59
Minimum0.191.210.410.371.121.251.310.400.570.681.481.20
Maximum0.482.960.810.691.601.913.780.5425.371.014.131.99
Table A5. Test results of rare Earth Elements in Wufeng-Longmaxi shale of Well Youc-2 (ppm).
Sample NoLaCePrNdSmEuGdTbDyHoErTmYbLuYREELREEHREELREE/HREE
CQyc02-17116.815016.967.613.82.289.961.488.131.624.830.794.990.7438.3399.92367.3832.5411.29
CQyc02-1665.311413.147.98.571.547.251.146.361.273.670.593.690.5831.4274.96250.4124.5510.2
CQyc02-1558.510311.843.27.91.46.651.015.371.063.050.493.080.4925.9247225.821.210.65
CQyc02-145394.110.840.97.211.336.110.934.90.962.750.442.810.4423.2226.68207.3419.3410.72
CQyc02-1354.996.211.242.27.71.366.411.045.591.093.110.53.140.4926.7234.93213.5621.379.99
CQyc02-1255.295.311.142.18.041.37.241.126.131.213.510.583.730.629.8237.16213.0424.128.83
CQyc02-1156.510312.448.59.661.478.011.347.51.484.190.674.150.6535.7259.52231.5327.998.27
CQyc02-1050.192.411.344.68.971.517.491.216.731.333.780.593.730.5732.3234.31208.8825.438.21
CQyc02-956.810312.245.98.521.397.231.16.051.193.370.543.420.5328.7251.24227.8123.439.72
CQyc02-842.975.39.1235.26.91.255.760.945.21.032.950.462.950.4524.9190.41170.6719.748.65
CQyc02-744.477.69.537.37.411.396.191.015.561.083.040.4830.4626.2198.42177.620.828.53
CQyc02-64477.49.3336.37.051.36.10.985.331.042.940.462.90.4525.1195.58175.3820.28.68
CQyc02-542.374.69.0335.27.171.376.1515.441.0530.482.920.4625.8190.17169.6720.58.28
CQyc02-445.581.49.6537.47.31.326.250.995.31.052.980.472.940.4625.5203.01182.5720.448.93
CQyc02-345.780.49.6137.87.451.316.2915.441.083.050.493.130.4926.1203.24182.2720.978.69
CQyc02-22627.75.321.34.420.84.130.683.910.82.30.382.40.421.1100.5285.52155.7
CQyc02-158.811712.5489.341.628.191.327.211.414.050.664.230.6834.2275.01247.2627.758.91
Average 187.77166.3921.387.31

References

  1. Chen, X.; Rong, J.; Mitchell, C.E.M.; David, A.T.H.; Fan, J.X.; Zhan, R.B.; Zhang, Y.D.; Li, R.G.; Wang, Y. Late Ordovician to Earliest Silurian Graptolite and Brachiopod Biozonation from the Yangtze Region, South China, with a global Correlation. Geol. Mag. 2000, 137, 623–650. [Google Scholar]
  2. Su, W.B.; Wang, Y.B.; Gong, S.Y. A New Ordovician-Silurian Boundary Sectionin Guizhou, South China. Geoscience 2006, 20, 409–412. [Google Scholar]
  3. Su, W.B.; Wang, Y.B.; Gong, S.Y. Ordovician-Silurian Wufeng Formation and the base of the Longmaxi Formation Porphyritic and high-resolution composite stratigraphy, South China. Chin. Sci. Ser. D 2002, 32, 207–209. (In Chinese) [Google Scholar]
  4. Yan, D.T.; Chen, D.Z.; Wang, Q.C.; Wang, J.G. Geochemistry of the vicinity of the Ordovician-Silurian Boundary in the Yangzi Region. Chin. Sci. Ser. D 2009, 3, 285–299. (In Chinese) [Google Scholar]
  5. Zhang, C.M.; Zhang, W.S.; Guo, Y.H. The depositional environment of the Longmaxi Formation in Southeast Sichuan-Qianbei and its influence on hydrocarbon source rocks. Geosci. Front. 2012, 19, 137–143. (In Chinese) [Google Scholar]
  6. Wang, Z.W.; Wang, J.; Fu, X.G.; Zhan, W.Z.; Yu, F.; Feng, X.L.; Song, C.Y.; Che, W.B.; Zeng, S.Q. Organic material accumulation of Carnian mudstones in the North Qiangtang Depression, eastern Tethys: Controlled by the paleoclimate, paleoenvironment, and provenance. Mar. Petrol. Geol. 2017, 88, 440–457. [Google Scholar] [CrossRef]
  7. Lu, Y.B.; Ma, Y.Q.; Wang, Y.X.; Lu, Y.C. The Sedimentary Response to the Major Geological Events and Lithofacies Characteristics of Wufeng Formation-Longmaxi Formationin the UpperYangtzeArea. Earth Sci. 2017, 42, 1169–1184. (In Chinese) [Google Scholar]
  8. Jing, Z.G. The Main Controlling Factors and Depotional Model of Organic Matter Accumulation in the Wufeng Formation–Longmaxi Formation in the Sichuan Basin. Master’s Thesis, East China University of Technology, Nanchang, China, 2018. (In Chinese with English Abstract). [Google Scholar]
  9. Ma, Y.Q.; Fan, M.J.; Lu, Y.C.; Guo, X.S.; Hu, H.Y.; Chen, L.; Wang, C.; Liu, X.C. Geochemistry and Sedimentology of the Lower Silurian Longmaxi Mudstone in Southwestern China: Implications for Depositional Controls on Organic Matter Accumulation. Mar. Petrol. Geol. 2016, 75, 291–309. [Google Scholar] [CrossRef]
  10. Yan, C.N.; Jin, Z.J.; Zhao, J.H.; Du, W.; Liu, Q.Y. Influence of Sedimentary Environment on Organic Matter Enrichment in Shale: A Case Study of the Wufeng and Longmaxi Formations of the Sichuan Basin, China. Mar. Petrol. Geol. 2018, 92, 880–894. [Google Scholar] [CrossRef]
  11. Liang, D.G.; Guo, T.L.; Chen, J.P.; Bian, L.Z.; Zhao, Z. Distribution of Four Suits of Regional Marine Source Rocks. Mar. Origin Petrol. Geol. 2008, 13, 1–16. (In Chinese) [Google Scholar]
  12. Jin, Z.J.; Hu, Z.Q.; Gao, B.; Zhao, J.H. Controlling factors on the enrichment and high productivity of shale gas in the Wufeng Formation–Longmaxi Formation, southeastern Sichuan Basin. Earth Sci. Front. 2016, 23, 1–10. (In Chinese) [Google Scholar]
  13. Wang, Q.C.; Yan, D.T.; Li, S.J. Tectonic-Environmental Model of the Lower Silurian High-Quality Hydrocarbon Source Rocks from South China. Acta Geol. Sin. 2008, 82, 289–297. (In Chinese) [Google Scholar]
  14. Wang, S.F.; Dong, D.Z.; Wang, Y.M.; Li, X.J.; Huang, J.L. Geochemical Characteristics the Sedimentation Environment of the Gas-enriched Shale in the Silurian Longmaxi Formation in the Sichuan Basin. Bull. Mineral. Petrol. Geochem. 2015, 6, 17. (In Chinese) [Google Scholar]
  15. Chen, C.; Mu, C.L.; Zhou, K.K.; Liang, W.; Ge, X.Y.; Wang, X.P.; Wang, Q.Y.; Zheng, B.S. The Geochemical Characteristics and factors controlling the organic matter accumulation of the Late Ordovician-Early Silurian black shale in the Upper Yangtze Basin, South China. Mar. Petrol. Geol. 2016, 76, 159–175. [Google Scholar] [CrossRef]
  16. Teng, G.E.; Gao, C.L.; Hu, K.; Pan, W.L.; Zhang, C.J.; Fang, C.M.; Cao, Q.G. High-quality Source Rocks in the Lower Combination in Southeast Upper-Yangtze Area and their Hydrocarbon Generating Potential. Petrol. Geol. Exp. 2006, 28, 359–365. (In Chinese) [Google Scholar]
  17. Zou, C.N.; Dong, D.Z.; Wang, Y.M.; Li, X.J.; Huang, J.L.; Wang, S.F.; Guan, Q.Z.; Zhang, C.C.; Wang, H.Y.; Liu, H.L.; et al. Shale gas in China: Characteristics, challenges and prospects (I). Petrol. Explor. Dev. 2015, 42, 689–701. (In Chinese) [Google Scholar] [CrossRef]
  18. Zhao, J.; Jin, Z.; Jin, Z.; Geng, Y.K.; Wen, X.; Yan, C.N. Applying Sedimentary Geochemical proxies for Paleoenvironment Interpretation of Organic-rich Shale Deposition in the Sichuan Basin, China. Int. J. Coal Geol. 2016, 163, 52–71. [Google Scholar] [CrossRef]
  19. Ran, B.; Liu, S.G.; Jansa, L.; Sun, W.; Yang, D.; Ye, Y.H.; Wang, S.Y.; Luo, C.; Zhang, X.; Zhang, C.J. Origin of the Upper Ordovician—Lower Silurian Cherts of the Yangtze Block, South China, and Their Palaeogeographic Significance. J. Asian Earth Sci. 2015, 108, 1–17. [Google Scholar] [CrossRef]
  20. Luo, Q.Y.; Zhong, N.N.; Dai, N.; Zhang, W. Graptolite-derived organic matter in the Wufeng Formation–Longmaxi Formation (Upper Ordovician–Lower Silurian) of southeastern Chongqing, China: Implications for gas shale evaluation. Int. J. Coal Geol. 2015, 153, 87–98. [Google Scholar] [CrossRef]
  21. Zhai, G. Petroleum Geology of China; Petroleum Industry Press: Beijing, China, 1987. (In Chinese) [Google Scholar]
  22. Mu, C.; Zhou, K.; Liang, W.; Ge, X. Early Paleozoic sedimentary environment of hydrocarbon source rocks in the Middle-Upper Yangtze Region and petroleum and gas exploration. Acta Geol. Sin. 2011, 85, 526–532. (In Chinese) [Google Scholar]
  23. Yan, D.T.; Wang, H.; Fu, Q.L.; Chen, Z.H.; He, J.; Gao, Z. Geochemical characteristics in the Longmaxi Formation (Early Silurian) of South China: Implications for organic matter accumulation. Mar. Pet. Geol. 2015, 65, 290–301. [Google Scholar] [CrossRef]
  24. Shen, J.; Schoepfer, S.D.; Feng, Q.L.; Zhou, L.; Yu, J.X.; Song, H.Y.; Wei, H.Y.; Algeo, T.J. Marine productivity changes during the end–Permian crisis and Early Triassic recovery. Earth Sci. Rev. 2015, 149, 136–162. [Google Scholar] [CrossRef]
  25. Fan, J.X.; Melchin, M.J.; Chen, X.; Wang, D.; Zhang, Y.D.; Chen, Q.; Chi, Z.L.; Chen, F. Biostratigraphy and geography of the Ordovician-Silurian Lungmachi black shales in South China. Sci. China Earth Sci. 2011, 54, 1854–1863. [Google Scholar] [CrossRef]
  26. Tribovillard, N.; Algeo, T.J.; Lyons, T.W.; Riboulleau, A. Trace metals as paleoredox and paleoproductivity proxies: An update. Chem. Geol. 2006, 232, 12–32. [Google Scholar] [CrossRef]
  27. Taylor, S.R.; McLennan, S.M. The Continental Crust: Its Composition and Evolution; Blackwell Scientific: Oxford, UK; London, UK; Edinburgh, UK; Boston, MA, USA; Palo Alto, CA, USA; Melbourne, Australia, 1985; 312p. [Google Scholar]
  28. Lézin, C.; Andreu, B.; Pellenard, P.; Bouchez, J.L.; Emmanuel, L.; Fauré, P.; Landrein, P. Geochemical Disturbance and Paleoenvironmental Changes during the Early Toarcian in NW Europe. Chem. Geol. 2013, 341, 1–15. [Google Scholar] [CrossRef]
  29. Zhang, Z.B.; Zhu, Z.J.; Li, H.; Jiang, W.C.; Wang, W.F.; Xu, Y.; Li, L.R. Provenance and Salt Structures of Gypsum Formations in Pb-Zn Ore-bearing Lanping Basin, Southwest China. J. Cent. South Univ. 2020, 27, 1828–1845. [Google Scholar] [CrossRef]
  30. Qiu, Z.; Wei, H.Y.; Liu, H.L.; Shao, N.; Wang, Y.M.; Zhang, L.F.; Zhang, Q. Accumulation of sediments with extraordinary high Organic matter content: Insight gained through geochemical characterization of indicative elements. Oil Gas Geol. 2021, 42, 931–948. (In Chinese) [Google Scholar]
  31. Tada, R. Lithostratigraphy and Compositional Variation of Neogene hemipelagic Sediments in the Japan Sea. Proc. ODP Sci. Res. 1992, 127, 1229–1260. [Google Scholar]
  32. Murray, R.W. Chemical Criteria to identify the Depositional Environment of Chert: General Principles and Applications. Sediment. Geol. 1994, 90, 213–232. [Google Scholar] [CrossRef]
  33. Calvert, S.E.; Pedersen, T.F. Chapter Fourteen Elemental Proxies for Palaeoclimatic and Palaeoceanographic Variability in Marine Sediments: Interpretation and Application. Dev. Mar. Geol. 2007, 1, 567–644. [Google Scholar]
  34. Rachold, V.H.J.B. Inorganic geochemistry of Albian sediments from the Lower Saxony Basin NW Germany: Palaeoenvironmental Constraints and Orbital Cycles. Palaeogeog. Palaeoclimatol. Palaeoecol. 2001, 174, 121–143. [Google Scholar] [CrossRef]
  35. Young, G.M.; Nesbitt, H.W. Processes controlling the distribution of Ti and Al in weathering profiles, siliciclastic sediments and sedimentary rocks. J. Sediment. Res. 1998, 68, 448–455. [Google Scholar] [CrossRef]
  36. Chen, L.Q. Depositional Evolution of the Yongchong Basin during Late Cretaceous in Jiangxi Province, SE China; Geology Press: Beijing, China, 2018; pp. 1–118. (In Chinese) [Google Scholar]
  37. Wedepohl, K.H. Handbook of Geochemistry; Springer: Berlin/Heidelberg, Germany, 1969; pp. 59–60. [Google Scholar]
  38. Xu, X.T.; Shao, L.Y. Limiting factors in Utilization of Chemical index of alteration of Mudstones to Quantify the degree of Weathering in Provenance. J. Palaeogeog. 2018, 20, 515–522. (In Chinese) [Google Scholar]
  39. Taylor, S.R.; McLennan, S.M. The geochemical evolution of the continental crust. Rev. Geophys. 1995, 33, 241–265. [Google Scholar] [CrossRef]
  40. Fedo, C.M.; Nesbitt, H.W.; Young, G.M. Unraveling the effects of potassium metasomatism in sedimentary rocks and paleosols, with implications for paleoweathering conditions and provenance. Geology 1995, 23, 921–924. [Google Scholar] [CrossRef]
  41. Cox, R.; Lowe, D.R.; Cullers, R.L. The Influence of Sediment Recycling and Basement Composition on Evolution of Mudrock Chemistry in the Southwestern United States. Geochim. Cosmochim. Acta 1995, 59, 2919–2940. [Google Scholar] [CrossRef]
  42. Breit, G.N.; Wanty, R.B. Vanadium accumulation in carbona-ceous rocks: A review of geochemical controls during deposition and diagenesis. Chem. Geol. 1991, 91, 83–97. [Google Scholar] [CrossRef]
  43. Sageman, B.B.; Murphy, A.E.; Werne, J.P.; Straeten, C.A.V.; Hollander, D.J.; Lyons, T.W. A tale of shales: The relative roles of production, decomposition and dilution in the accumulation of organic-rich strata, Middle-Upper Devonian, Appalachian Basin. Chem. Geol. 2003, 195, 229–273. [Google Scholar] [CrossRef]
  44. Rimmer, S.M. Geochemical paleoredox indicators in Devonian Mississippian Black Shales, Central Appalachian Basin (USA). Chem. Geol. 2004, 206, 373–391. [Google Scholar] [CrossRef]
  45. Hatch, J.R.; Leventhal, J.S. Relationship between inferred redox potential of the depositional environment and geochemistry of the Upper Pennsylvanian (Missourian) Stark Shale member of the Dennis Limestone, Wabaunsee County, Kansas, USA. Chem. Geol. 1992, 99, 65–82. [Google Scholar] [CrossRef]
  46. Algeo, T.J.; Maynard, J.B. Trace Element Behavior and Redox Facies in Core Shales of Upper Pennsylvanian Kansas-type cyclothems. Chem. Geol. 2004, 206, 289–318. [Google Scholar] [CrossRef]
  47. Morse, J.W.; Luther, G.W., III. Chemical influences on trace metal-sulfide interactions in anoxic sediments. Geochim. Cosmochim. Acta 1999, 63, 3373–3378. [Google Scholar] [CrossRef]
  48. Zheng, Y.; Anderson, R.F.; Geen, A.; Kuwabara, J. Authigenic molybdenum formation in marine sediments: A link to pore water sulfide in the Santa Barbara Basin. Geochim. Cosmochim. Acta 2000, 64, 4165–4178. [Google Scholar] [CrossRef]
  49. Morford, J.L.; Martin, W.R.; Carney, C.M. Uranium diagenesis in sediments underlying bottom waters with high oxygen content. Geochim. Cosmochim. Acta 2009, 73, 2920–2937. [Google Scholar] [CrossRef]
  50. Helz, G.R.; Miller, C.V.; Charnock, J.M.; Mosselmans, J.L.W.; Pattrick, R.A.D.; Garner, C.D.; Vaughan, D.J. Mechanisms of molybdenum removal from the sea and its concentration in black shales: EXAFS Evidences. Geochim. Cosmochim. Acta 1996, 60, 3631–3642. [Google Scholar] [CrossRef]
  51. Calvert, S.E.; Pedersen, T.F. Geochemistry of recent Oxic and Anoxic marine sediments: Implications for the geological record. Mar. Geol. 1993, 113, 67–88. [Google Scholar] [CrossRef]
  52. Tribovillard, N.; Riboulleau, A.; Lyons, T.; Baudin, F. Enhanced Trapping of Molybdenum by Sulfurized Organic matter of Marine Origin as Recorded by Various Mesozoic formations. Chem. Geol. 2004, 213, 385–401. [Google Scholar] [CrossRef]
  53. Algeo, T.J.; Rowe, H. Paleoceanographic Applications of trace-metal concentration data. Chem. Geol. 2012, 324–325, 6–18. [Google Scholar] [CrossRef]
  54. Algeo, T.J.; Lyons, T.W. Mo–total organic carbon covariation in modern anoxic marine environments: Implications for analysis of paleoredox and paleohydrographic conditions. Paleoceanography 2006, 21, 279–298. [Google Scholar] [CrossRef]
  55. Rowe, H.D.; Loucks, R.G.; Ruppel, S.C.R.; Susan, M.R. Mississippian Barnett Formation, Fort Worth Basin, Texas: Bulk geochemical inferences and Mo–TOC constraints on the severity of hydrographic restriction. Chem. Geol. 2008, 257, 16–25. [Google Scholar] [CrossRef]
  56. Algeo, T.J.; Tribovillard, N. Environmental analysis of paleoceanographic systems based on molybdenum-uranium covariation. Chem. Geol. 2009, 268, 211–225. [Google Scholar] [CrossRef]
  57. Tribovillard, N.; Algeo, T.J.; Baudin, F.; Riboulleau, A. Analysis of marine environmental conditions based onmolybdenum–Uranium covariation-Applications to Mesozoic paleoceanography. Chem. Geol. 2012, 324–325, 46–58. [Google Scholar] [CrossRef]
  58. Chen, L.; Chen, X.; Tan, X.; Hu, X.; Wang, G. Pyrite Characteristics and Its Environmental Significance in Marine Shale: A Case Study from the Upper Ordovician Wufeng–Lower Silurian Longmaxi Formation in the Southeast Sichuan Basin, SW China. Minerals 2022, 12, 830. [Google Scholar] [CrossRef]
  59. Polgári, M.; Hein, J.R.; Tóth, A.L.; Pál-Molnár, E.; Vigh, T.; Bíró, L.; Fintor, K. Microbial action formed Jurassic Mn-carbonate ore deposit in only a few hundred years (Úrkút, Hungary). Geology 2012, 40, 903–906. [Google Scholar] [CrossRef]
  60. Deng, W.; Yang, T.; Fan, S.L.; Liu, Z.R.; Wan, X.H.; Xiao, J.Y.; Cao, T.T. Geochemical characteristics and sedimentary model of shales in Lower member of Zhongjiangou Formation in Wudun Sag, Dunhuang Basin. Coal Geol. Explor. 2022, 50, 114–130. [Google Scholar]
  61. Polgári, M.; Hein, J.R.; Vigh, T.; Szabó-Drubina, M.; Fórizs, I.; Bíró, L.; Müller, A.; Tóth, A.L. Microbial processes and the origin of the Úrkút manganese deposit, Hungary. Ore Geol. Rev. 2012, 47, 87–109. [Google Scholar] [CrossRef]
  62. Algeo, T.J.; Li, C. Redox classification and calibration of redox thresholds in sedimentary systems. Geochim. Cosmochim. Acta 2020, 287, 8–26. [Google Scholar] [CrossRef]
  63. Kuypers, M.M.M.; Pancost, R.D.; Nijenhuis, I.A.; Sinninghe Damsté, J.S. Enhanced productivity led to increased Organic Carbon burial in the euxinic North Atlantic basin during the late Cenomanian Oceanic Anoxic Event. Paleoceanography 2002, 17, 3-1–3-13. [Google Scholar] [CrossRef]
  64. Li, P.; Liu, Q.Y.; Bi, H.; Meng, Q.Q. Analysis of the difference in organic matter preservation in typical lacustrine shale under the influence of volcanism and transgression. Acta Geol. Sin. 2021, 95, 632–642. (In Chinese) [Google Scholar]
  65. Hu, T.; Pang, X.Q.; Jiang, F.J.; Wang, Q.F.; Xu, T.W.; Wu, G.Y.; Yu, J.W. Factors controlling differential enrichment of organic matter in saline lacustrine rift basin: A case study of third member Shahejie Fm in Dongpu depression. Acta Sedimentol. Sin. 2021, 39, 140–152. (In Chinese) [Google Scholar]
  66. Zhang, R.; Jiang, T.; Tian, Y.; Xie, S.C.; Zhou, L.; Li, Q.; Jiao, N.Z. Volcanic ash stimulates growth of marine autotrophic and heterotrophic microorganisms. Geology 2017, 45, 679–682. [Google Scholar] [CrossRef]
Figure 1. (a) Location and paleogeographic map of the study area in South China; (b) geological map of southeastern Chongqing, showing sample sites [15,17,20].
Minerals 13 00761 g001
Figure 2. Sedimentary system domain and sampling location of Wufeng Formation–Longmaxi Formation, in Well Youc-2. (a) Black carbonaceous shale in Wufeng Formation. (b) Black siliceous shale with well-developed bedding and vertical fractures filled with calcite Longmaxi Formation. (c) Black siltstone of Longmaxi Formation. (d) Light-colored mudstone Longmaxi Formation. (e) Light gray mud shale of the Longmaxi Formation, with horizontal bedding.
Minerals 13 00761 g002
Figure 3. Enrichment factor (EF) of trace elements in the Ordovician-Silurian the Wufeng Formation and Longmaxi Formation shale from the Southeast Sichuan Region. (a) Enrichment factor (EF) of trace elements in the Wufeng Formation. (b) Enrichment factor (EF) of trace elements in the Longamxi Formation. (c) Enrichment factor (EF) of trace elements in the Guanyinqiao Member.
Minerals 13 00761 g003
Figure 4. (a) PAAS-normalized of the Ordovician–silurian the Wufeng Formation and Longmaxi Formation marine shales from the southeast Sichuan Region, (b) Chondrite-normalized REE distributions of the Ordovician–Silurian the Wufeng Formation and Longmaxi Formation marine shales from the Southeast Sichuan Region.
Minerals 13 00761 g004
Figure 5. (a) La/Yb-ΣREE diagram, (b) correlation between Al2O3/TiO2 and CIA of Wufeng Formation–Longmaxi Formation, shale in the study area.
Minerals 13 00761 g005
Figure 6. The relationship among Paleoclimate, weathering degree, and terrigenous debris input of Wufeng Formation–Longmaxi Formation, shale in the study area.
Minerals 13 00761 g006
Figure 7. Weathering and Redox Conditions of Wufeng Formation–Longmaxi Formation.
Minerals 13 00761 g007
Figure 8. (a) The relationship between Mo and TOC in the Wufeng Formation-Longmaxi Formation, shale in Well Youc-2 (Base map According to [54,57] modification). (b) The co-variation relationship of UEF-MoEF in the Wufeng Formation–Longmaxi Formation, shale in Well Youc-2 (Base map According to [54,57] modification).
Minerals 13 00761 g008
Figure 9. The relationship between productivity and chemical weathering in the Wufeng Formation–Longmaxi Formation, shale in Well Youc-2.
Minerals 13 00761 g009
Figure 10. Organic matter enrichment mode of the Wufeng Formation–Longmaxi Formation, shale in the study area. (a) Enrichment model of the first section of the Wufeng Formation-Longmaxi Formation. (b) Enrichment model of the second section of the Wufeng Formation-Longmaxi Formation.
Minerals 13 00761 g010
Disclaimer/Publisher’s Note: The statements, opinions and data contained in all publications are solely those of the individual author(s) and contributor(s) and not of MDPI and/or the editor(s). MDPI and/or the editor(s) disclaim responsibility for any injury to people or property resulting from any ideas, methods, instructions or products referred to in the content.

