
The Caudofoveata (Mollusca) Spicule as a Biomineralization Model: Unique Features Revealed by Combined Microscopy Methods
 ,
,  , and
, and 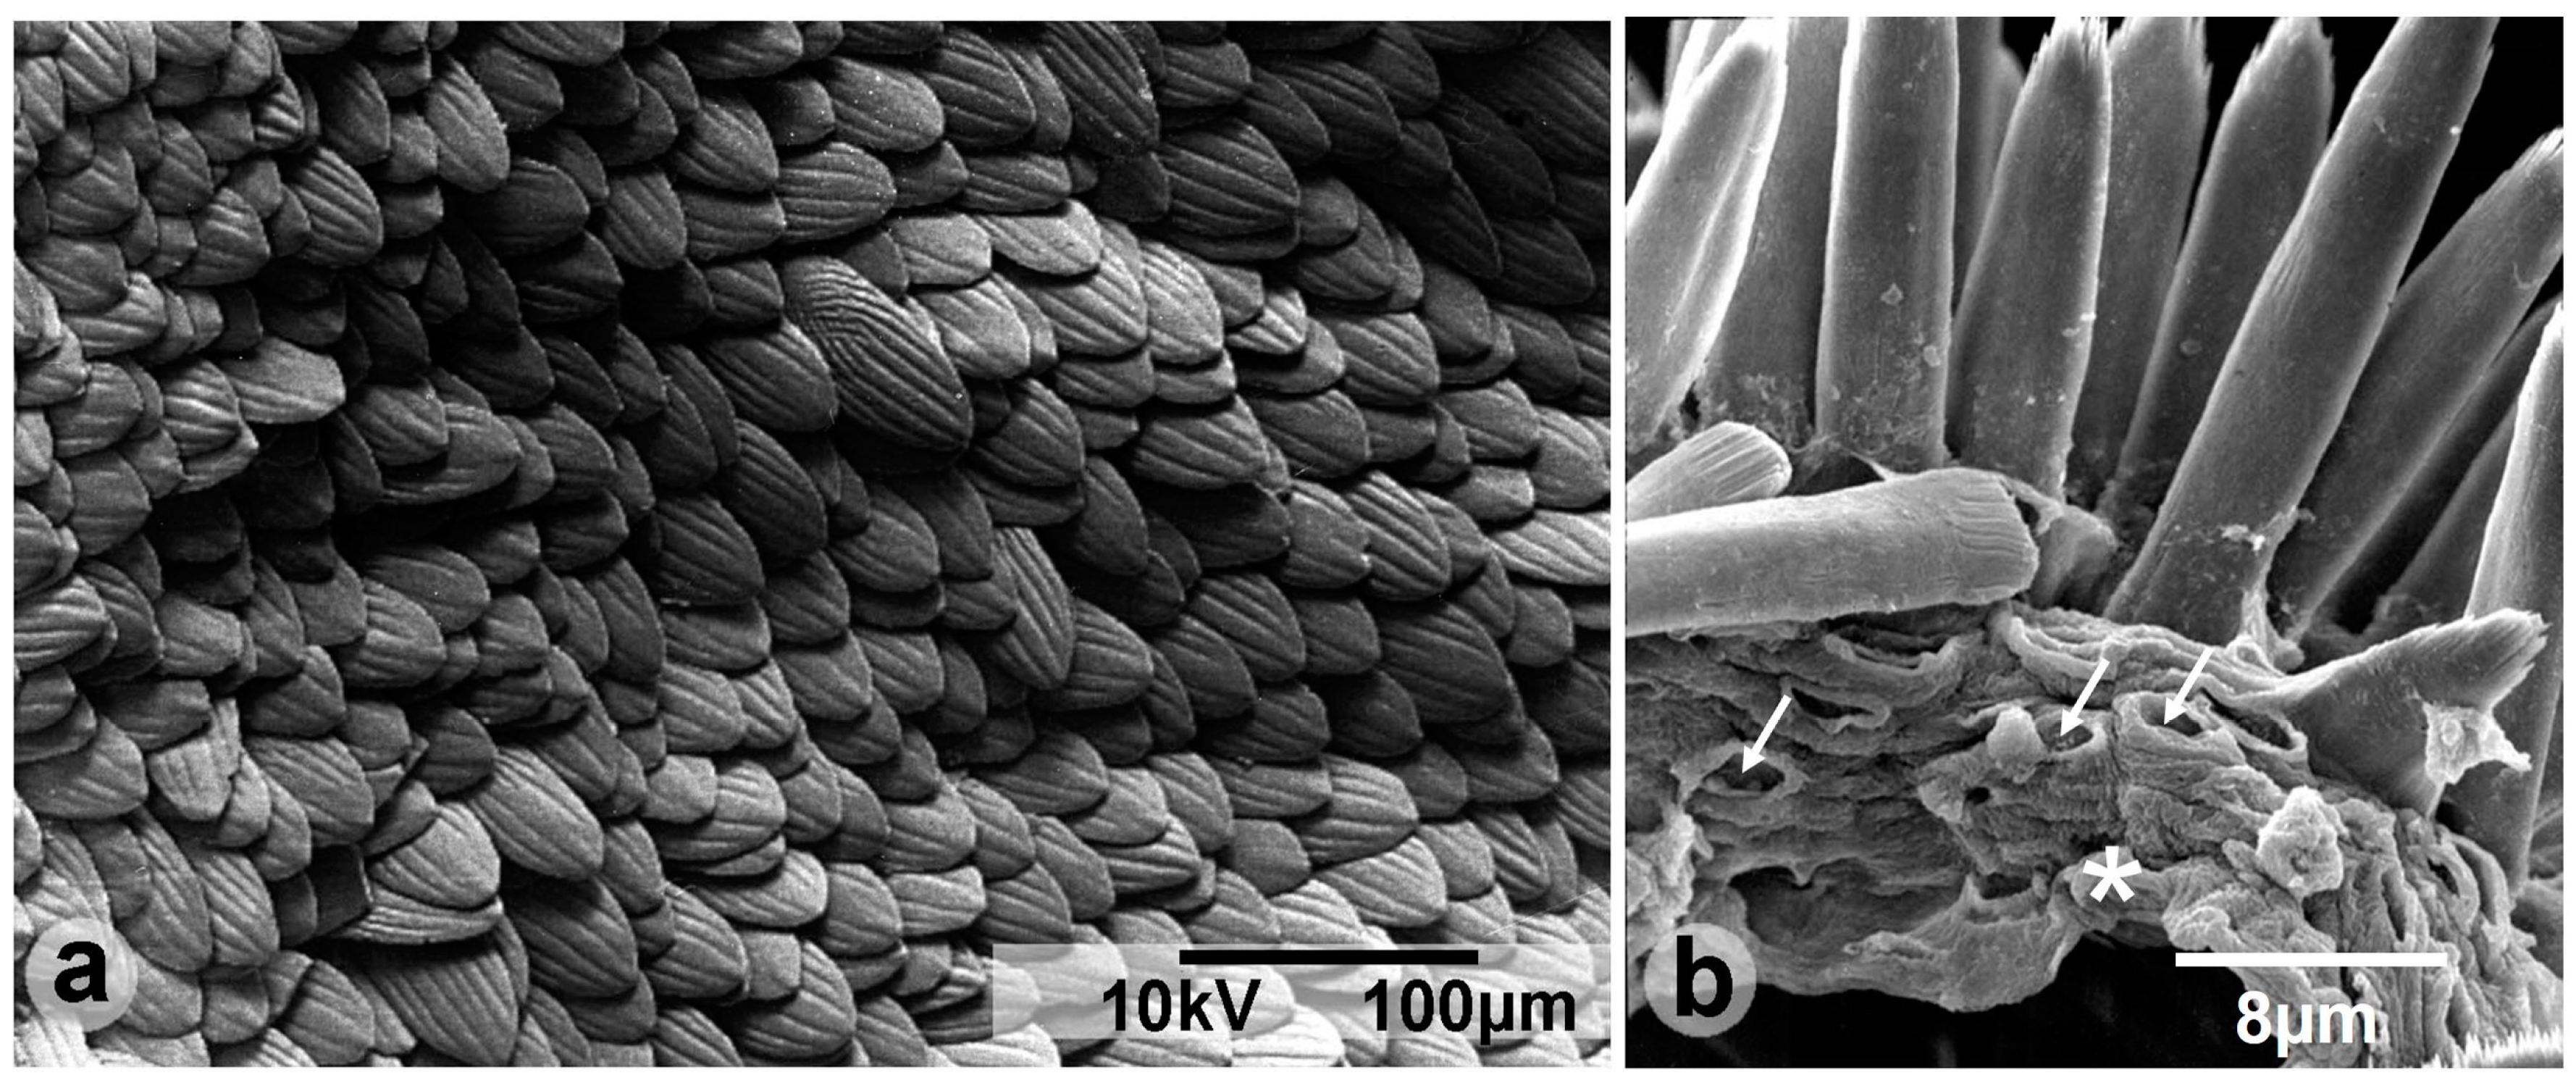
Abstract
:1. Introduction
2. Materials and Methods
2.1. Samples
2.2. Polarized Light Microscopy (PLM) and Nomarski Differential Interference Contrast (DIC)
2.3. Reflected Light Microscopy
2.4. Scanning Electron Microscopy (SEM) and Field Emission Scanning Electron Microscopy (FEG-SEM)
2.5. High-Resolution Transmission Electron Microscopy (HRTEM), Electron Diffraction, Electron Energy Loss Spectroscopy (EELS), and Energy Dispersive X-ray Spectroscopy (EDS)
2.6. Atomic Force Microscopy
3. Results
3.1. Structure
3.2. Micro- and Nanostructures
3.3. Surface Morphology of Spicules by AFM
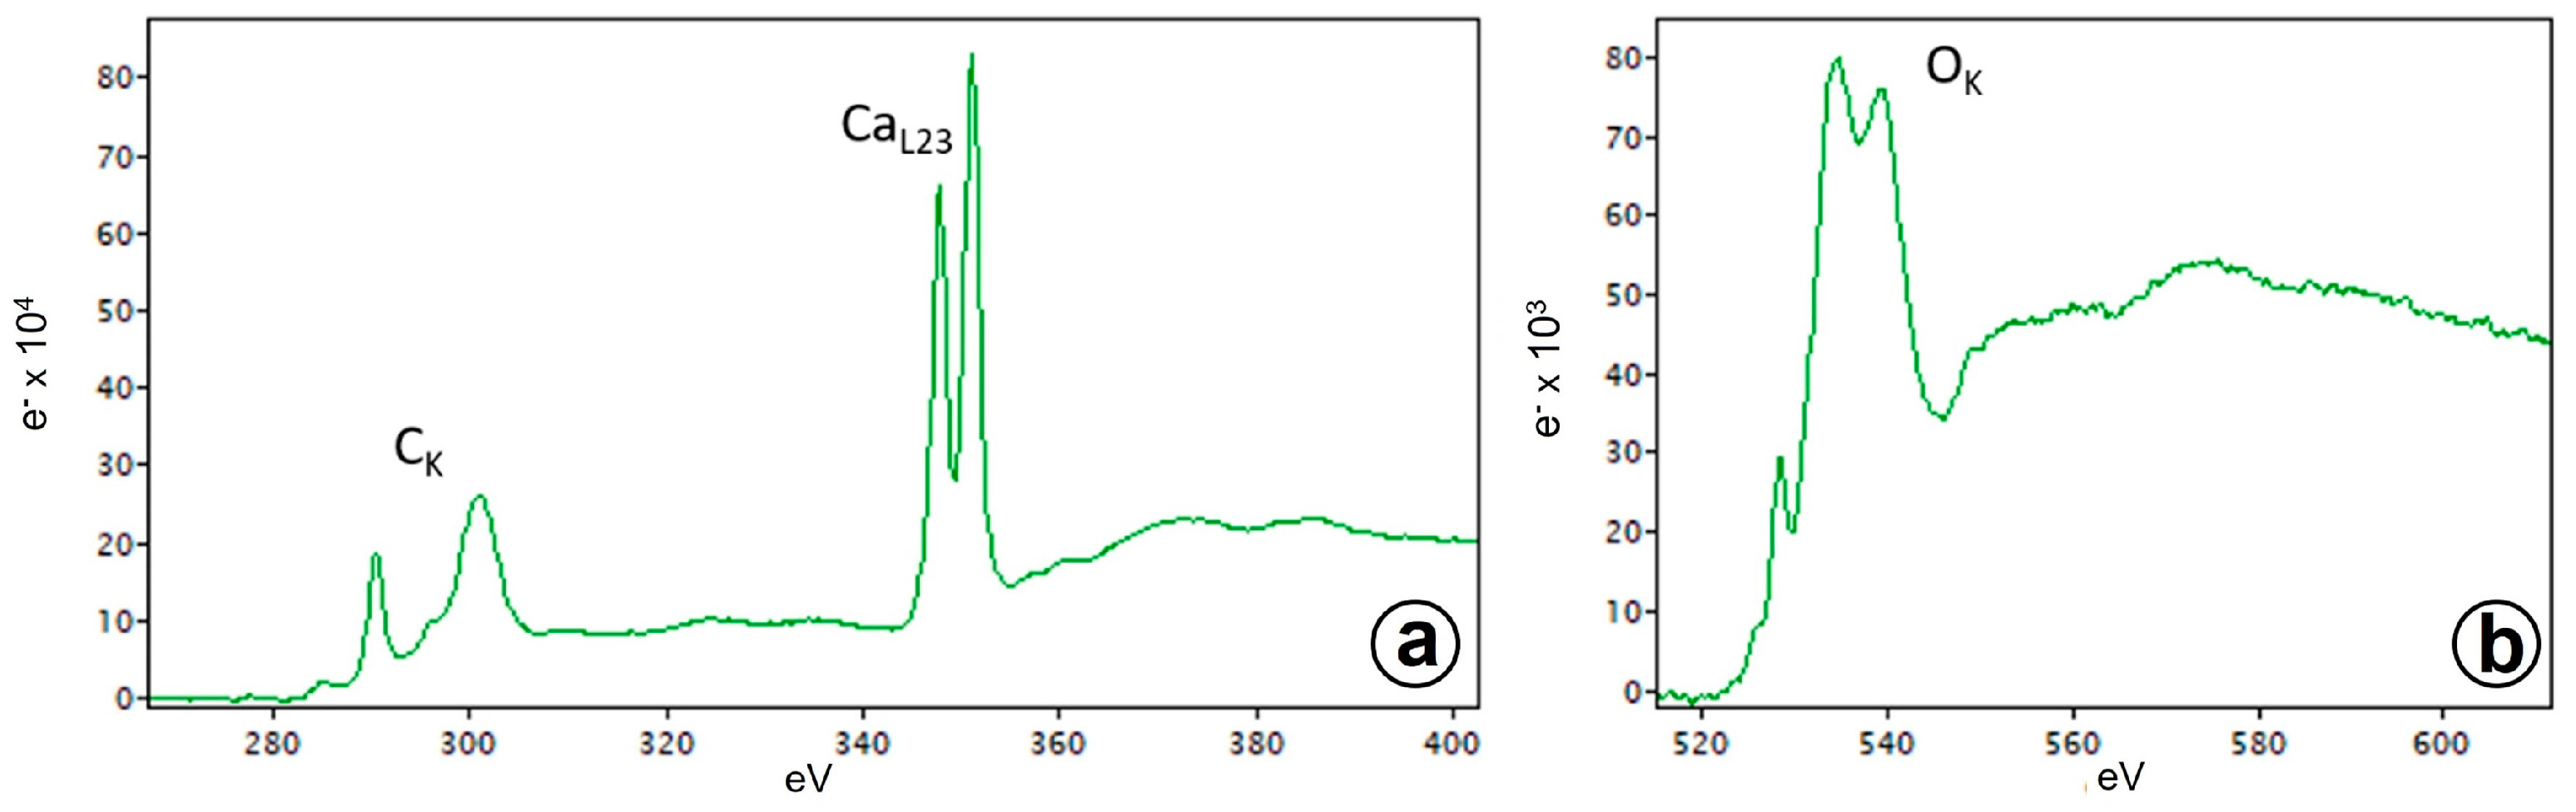
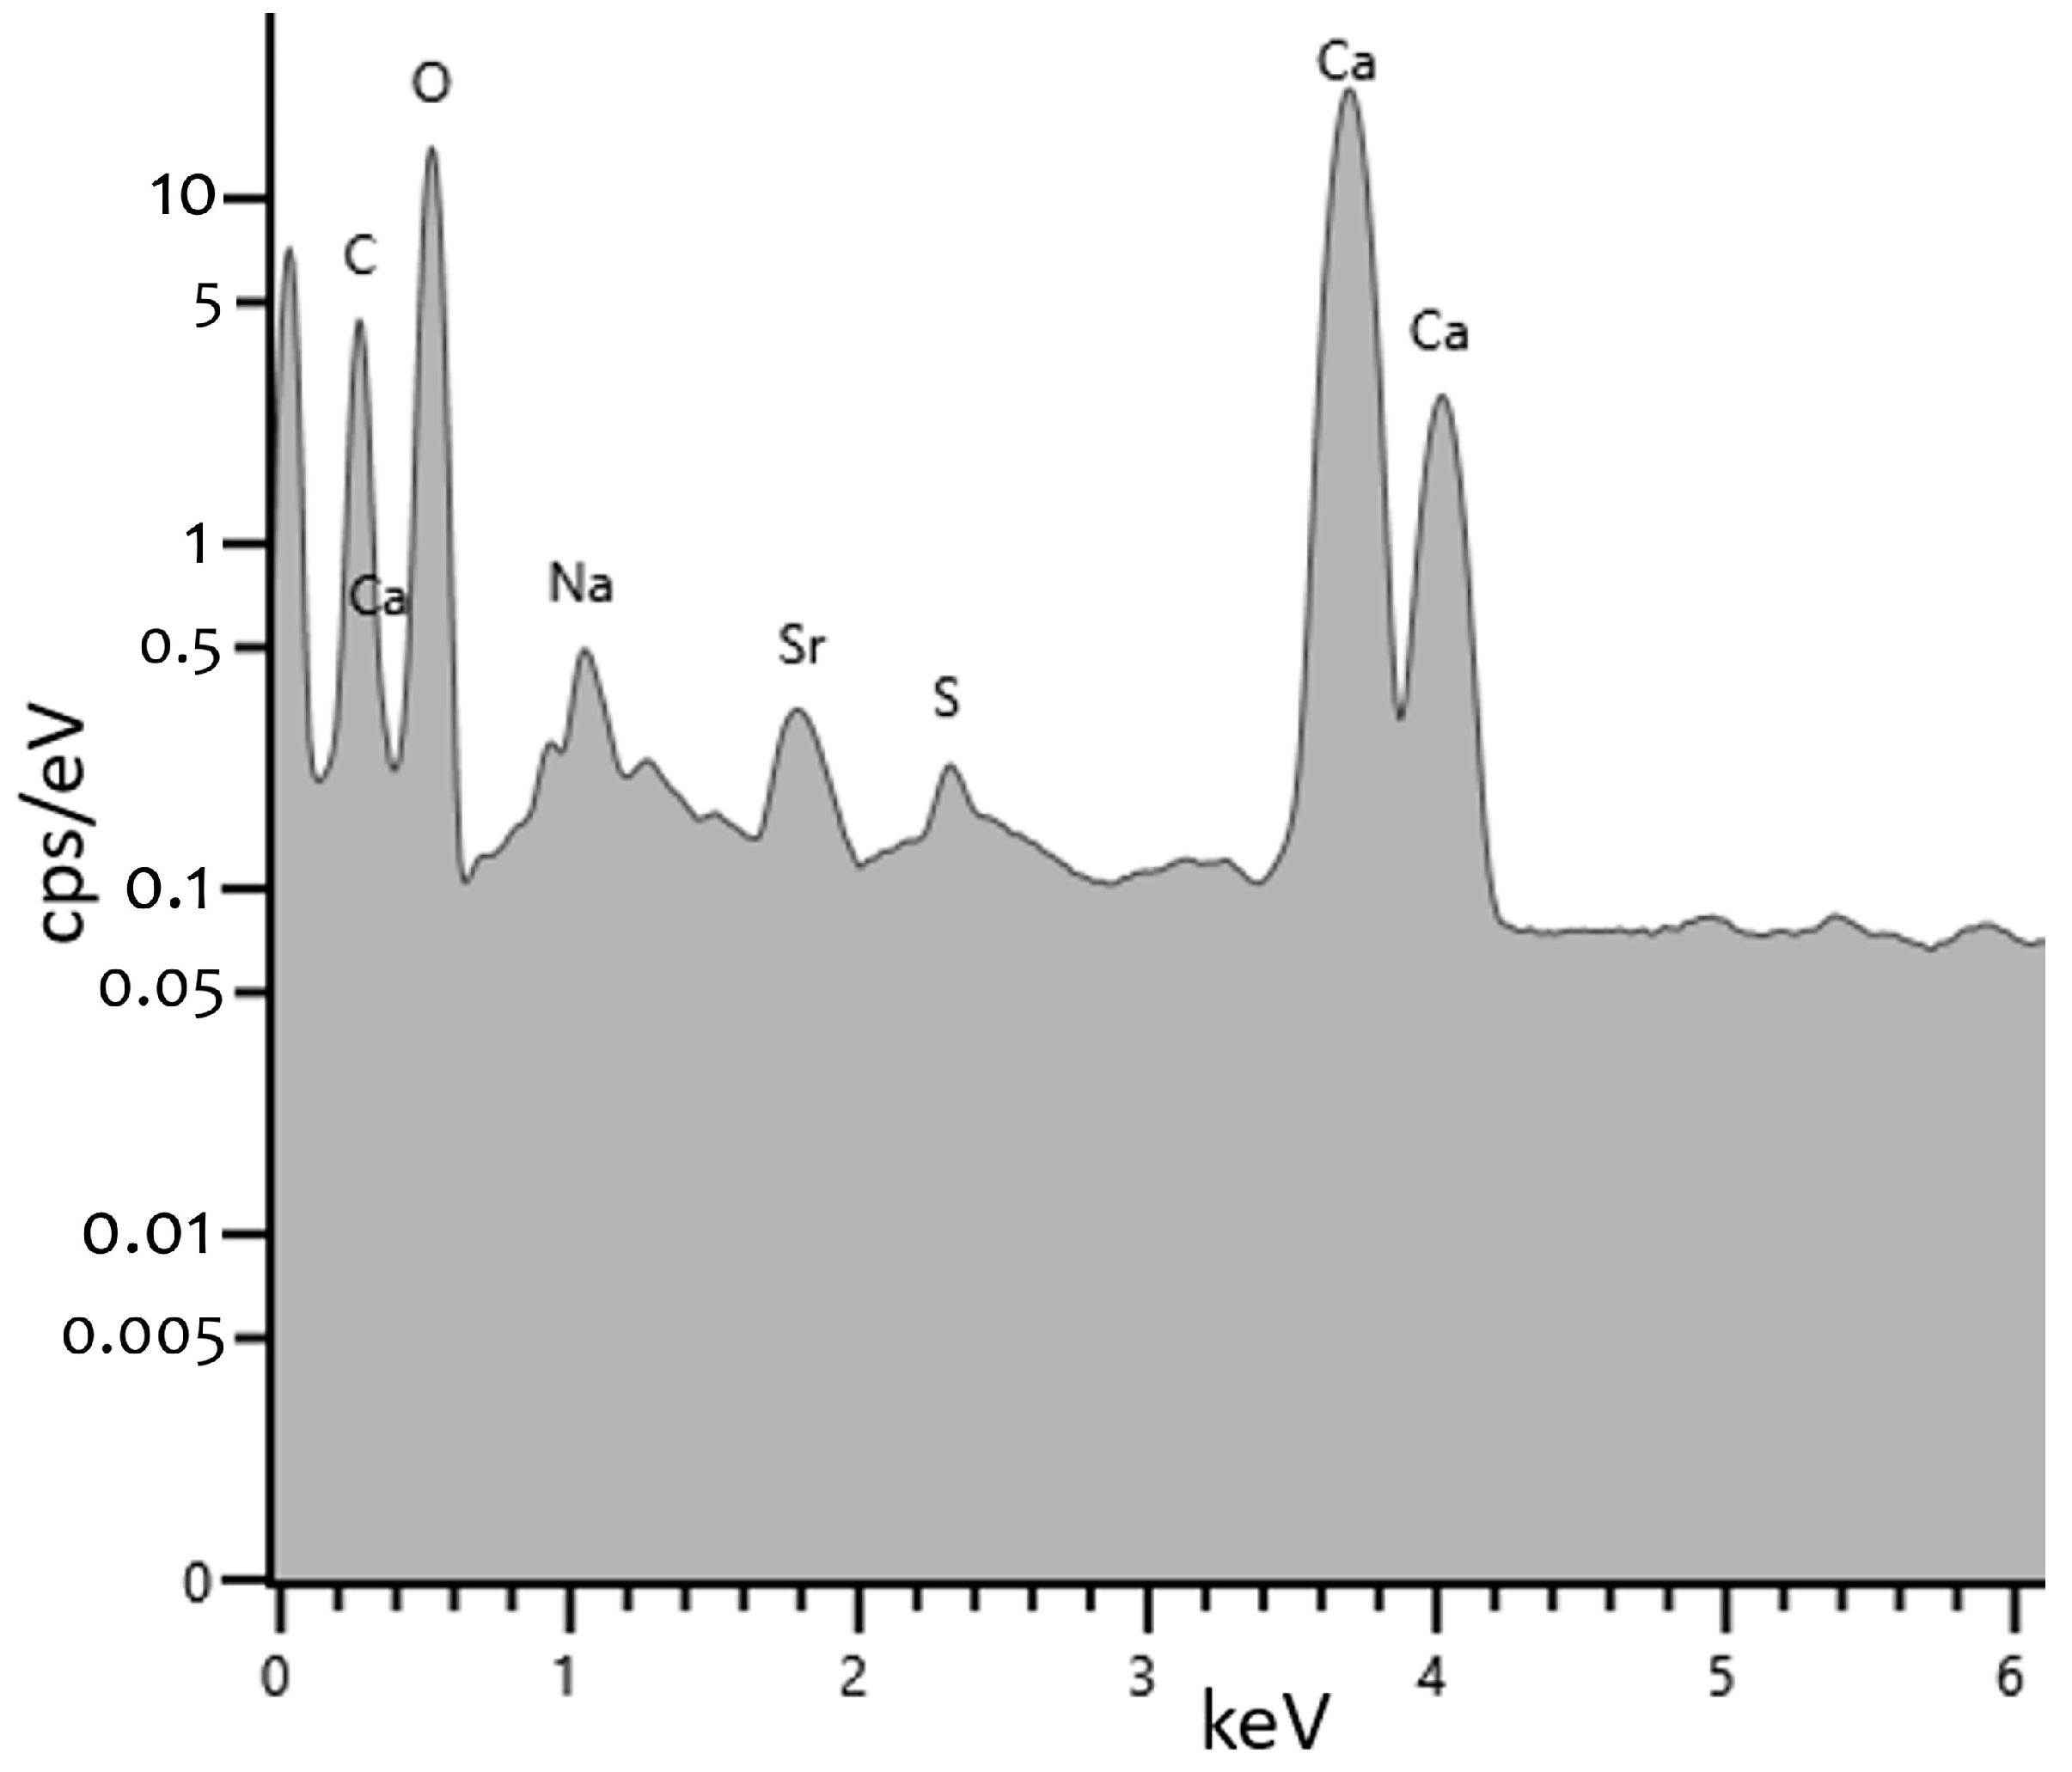
3.4. Electron Energy Loss Spectroscopy (EELS) and Energy Dispersive X-ray Spectroscopy (EDS)
4. Discussion
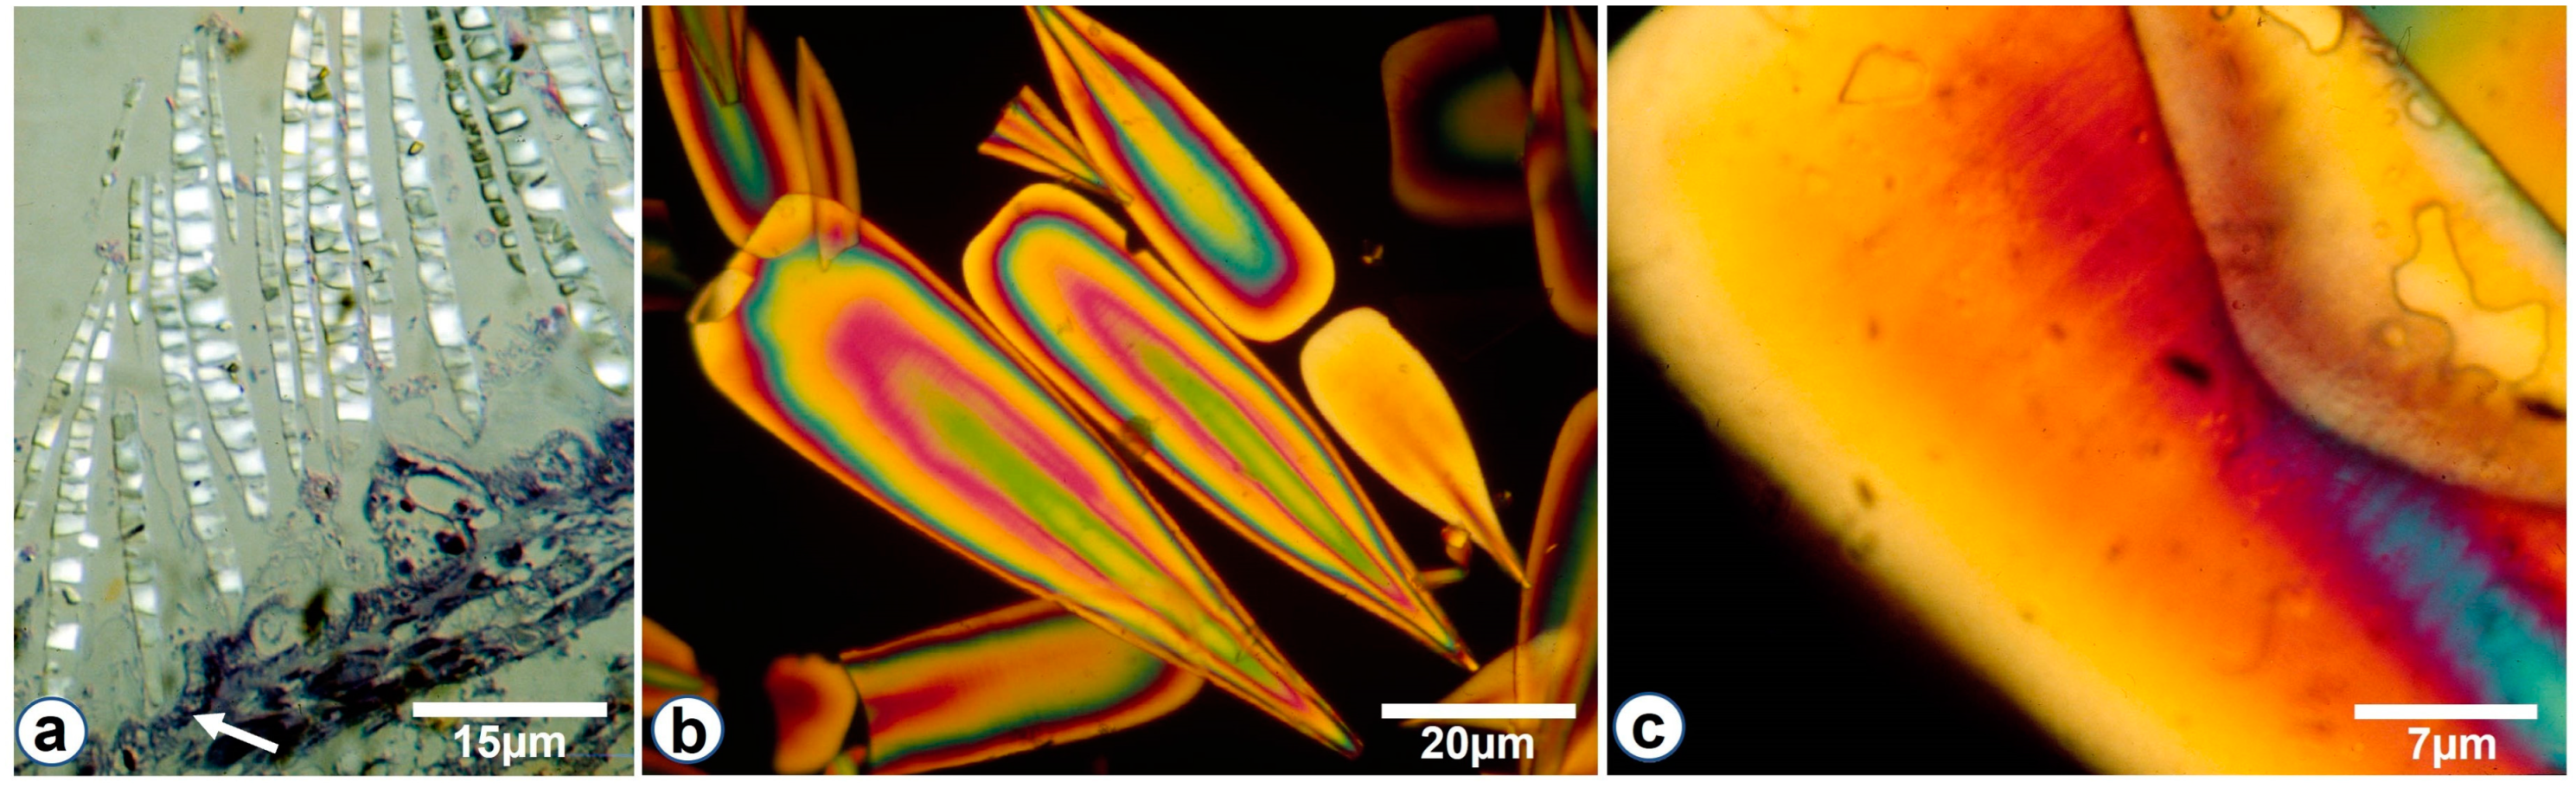
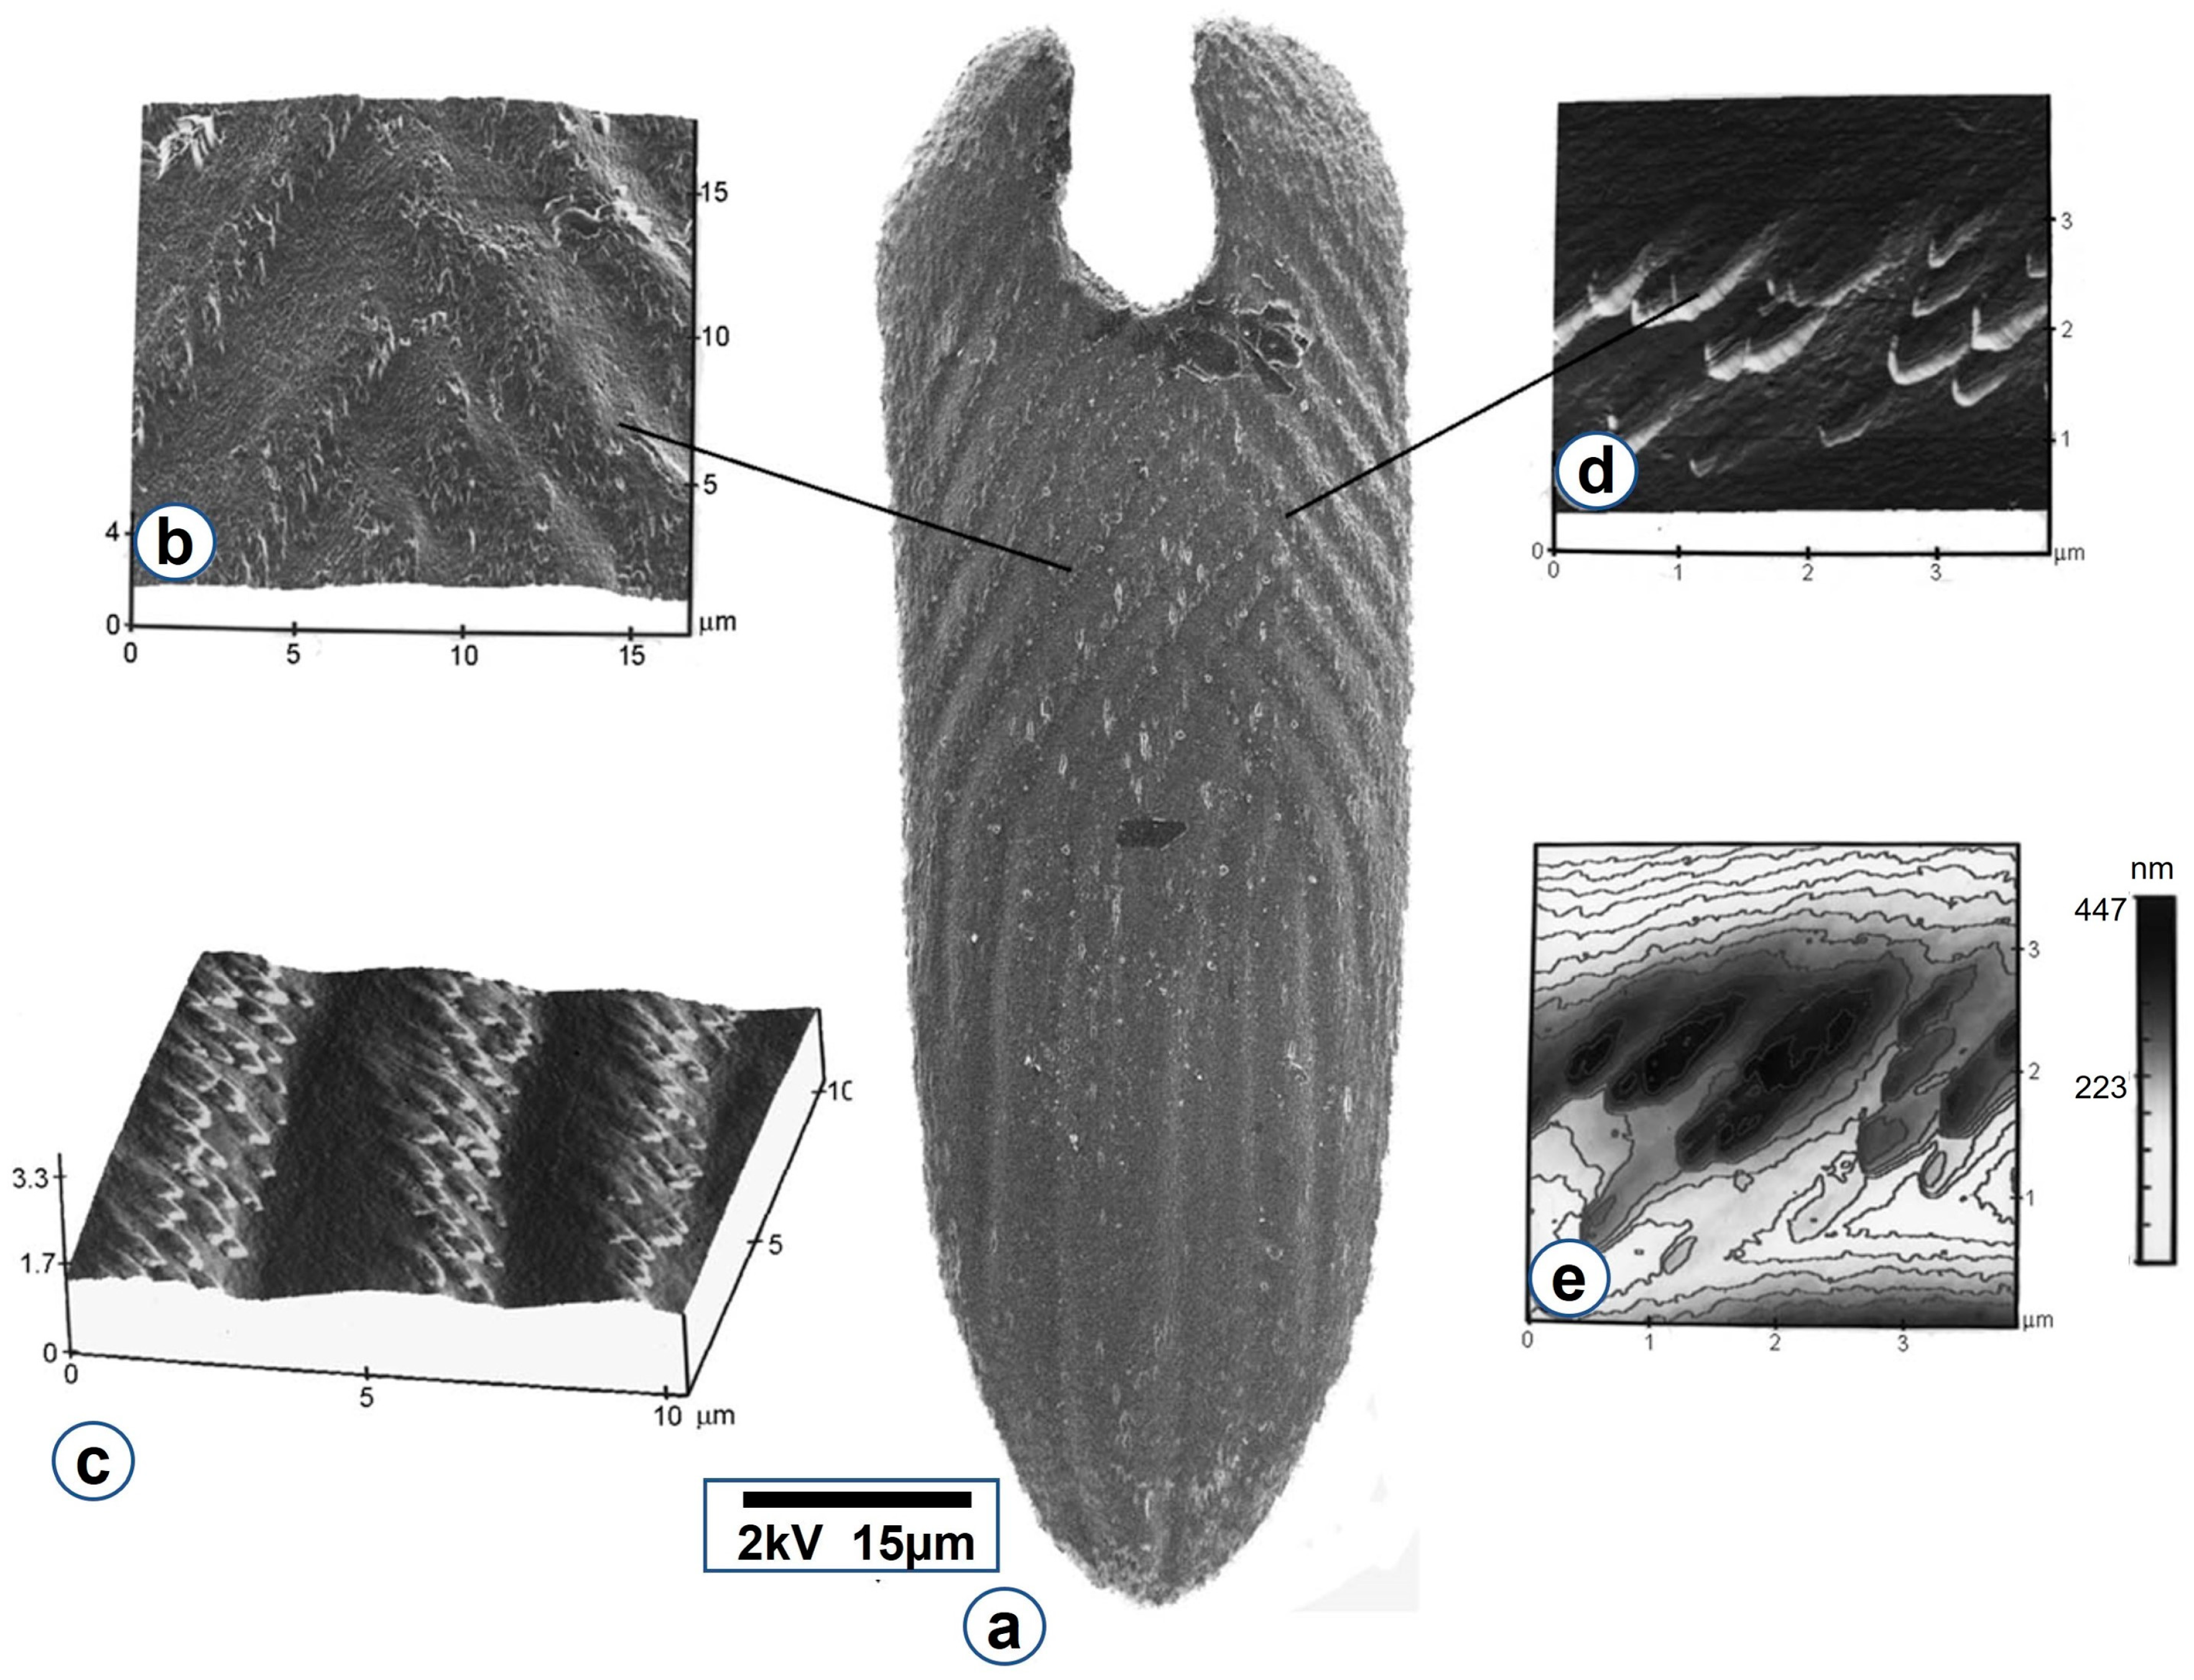
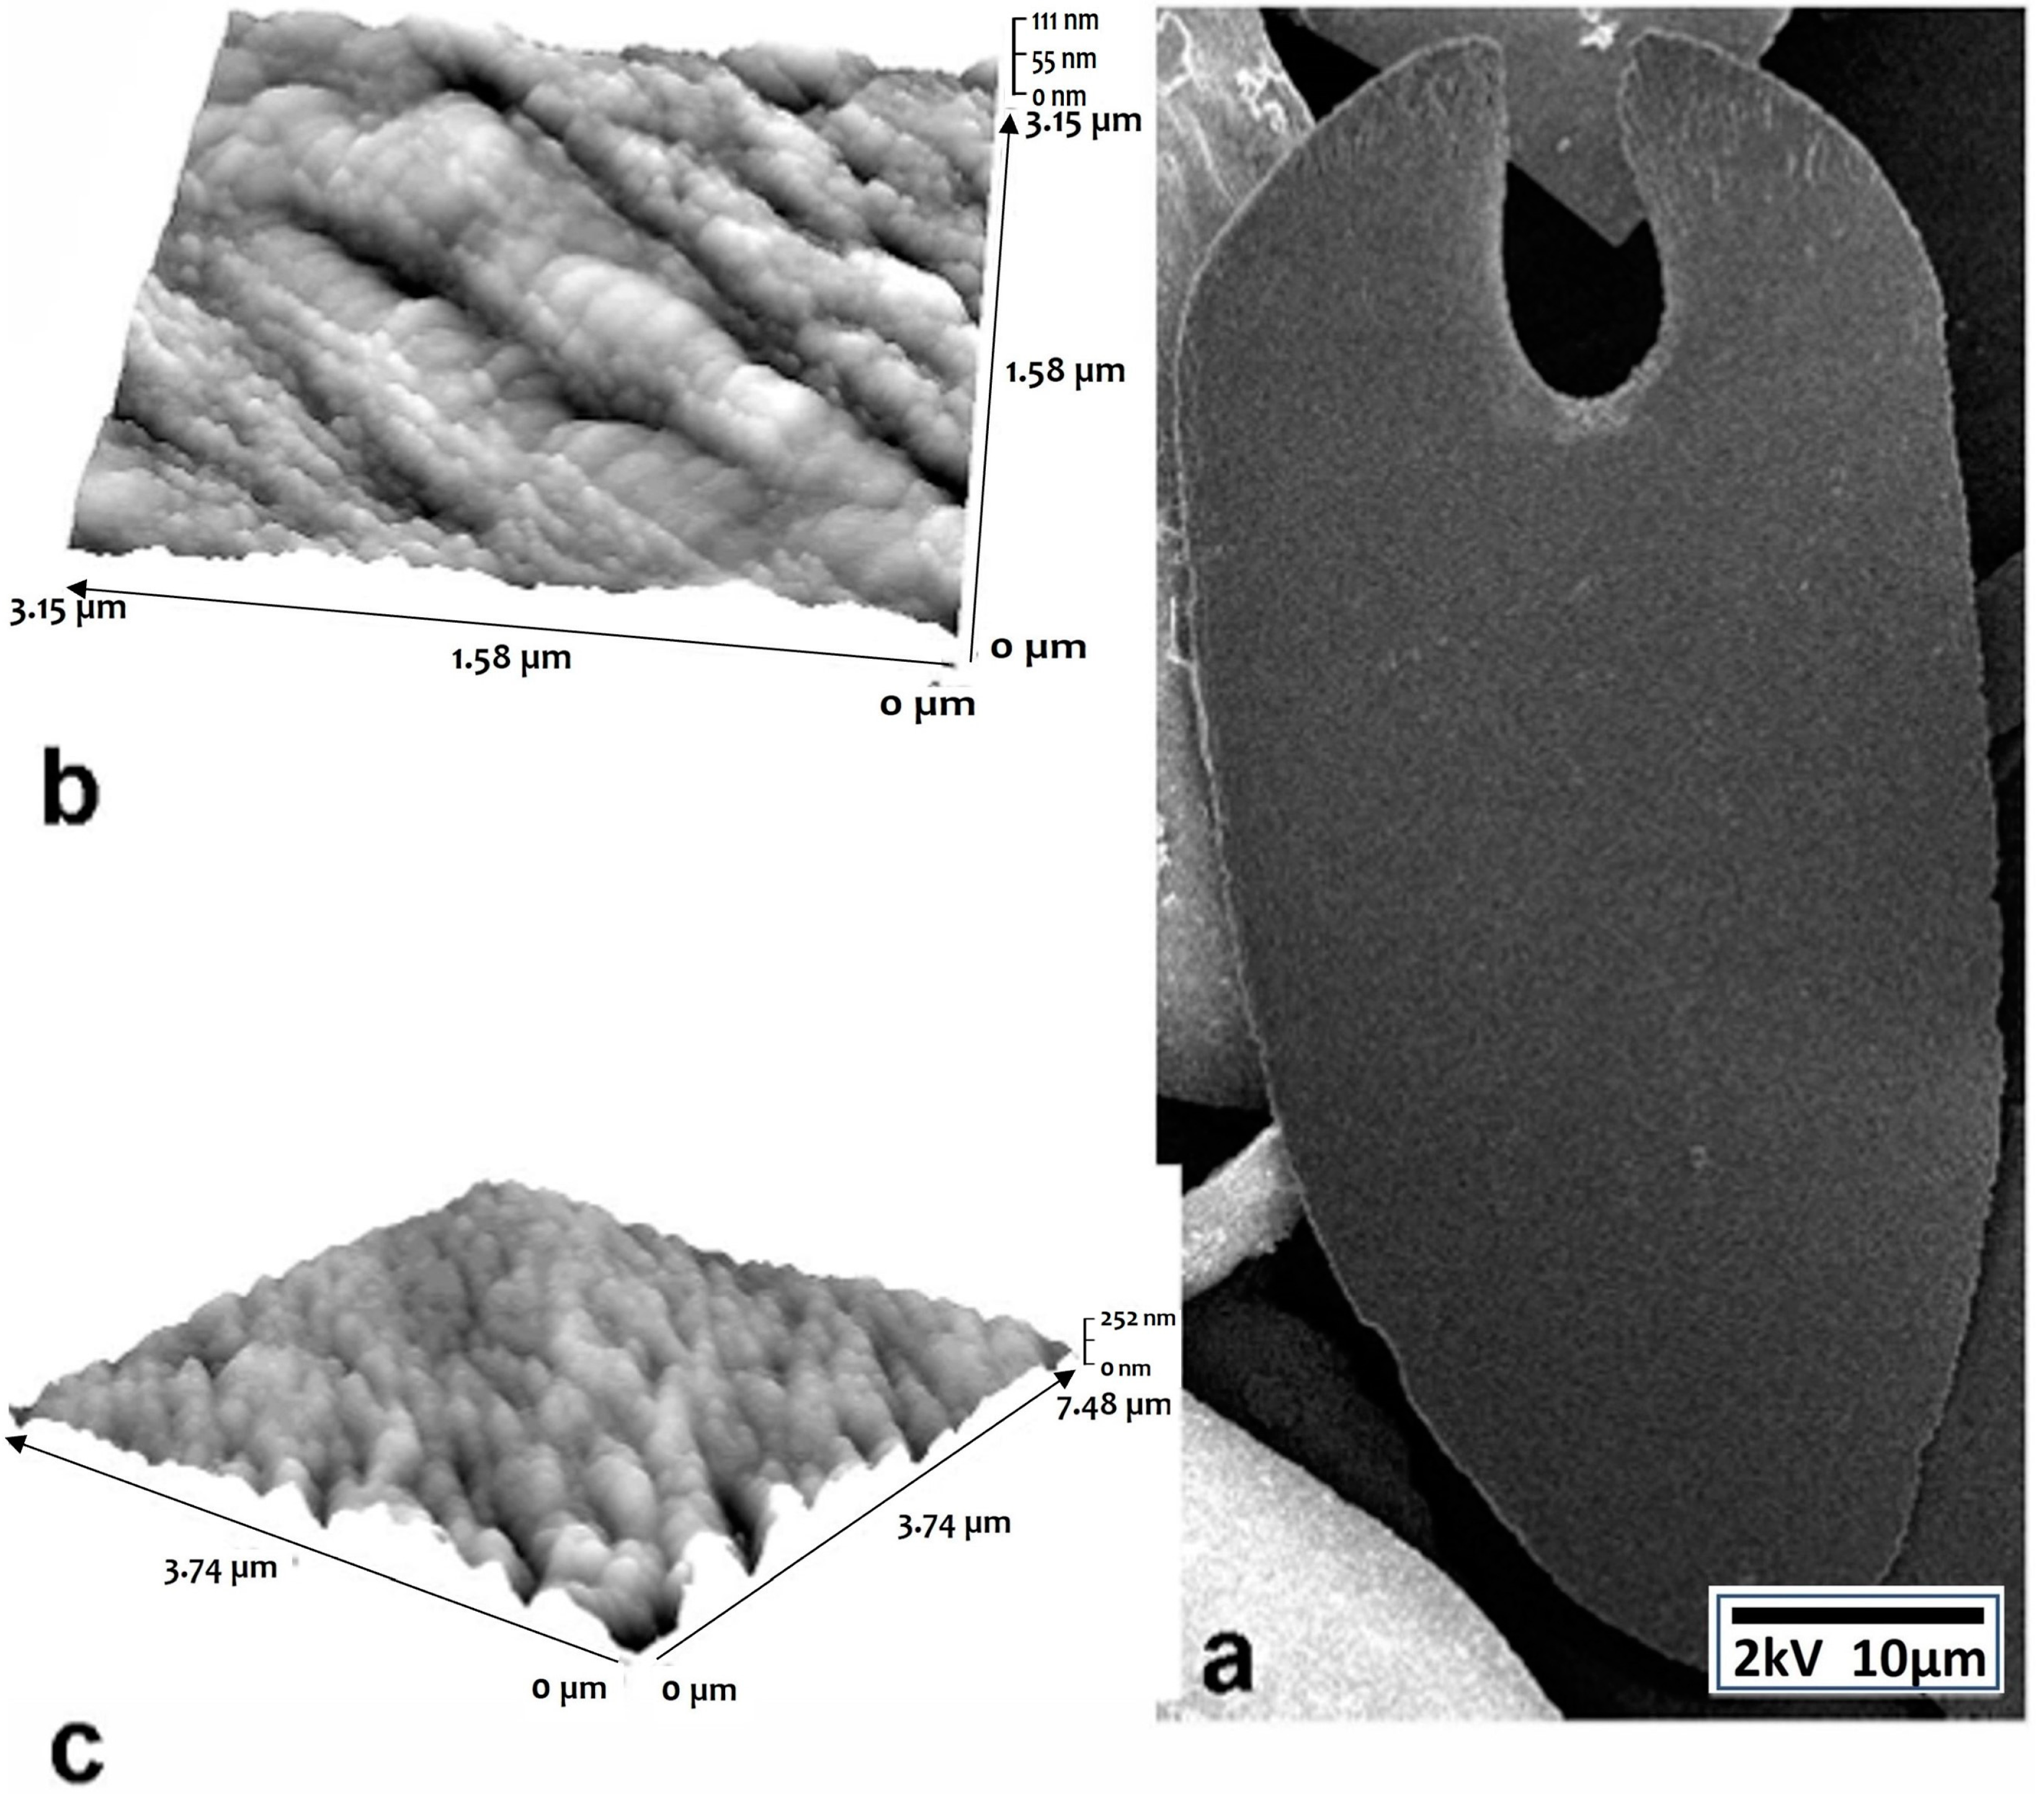
- The macroscopic shape and optical behavior of spicules: they appeared to present a single crystalline structure. We also observed some faint lines oriented perpendicular to the longer axis (usually considered as growth lines), which calls for a deeper analysis.
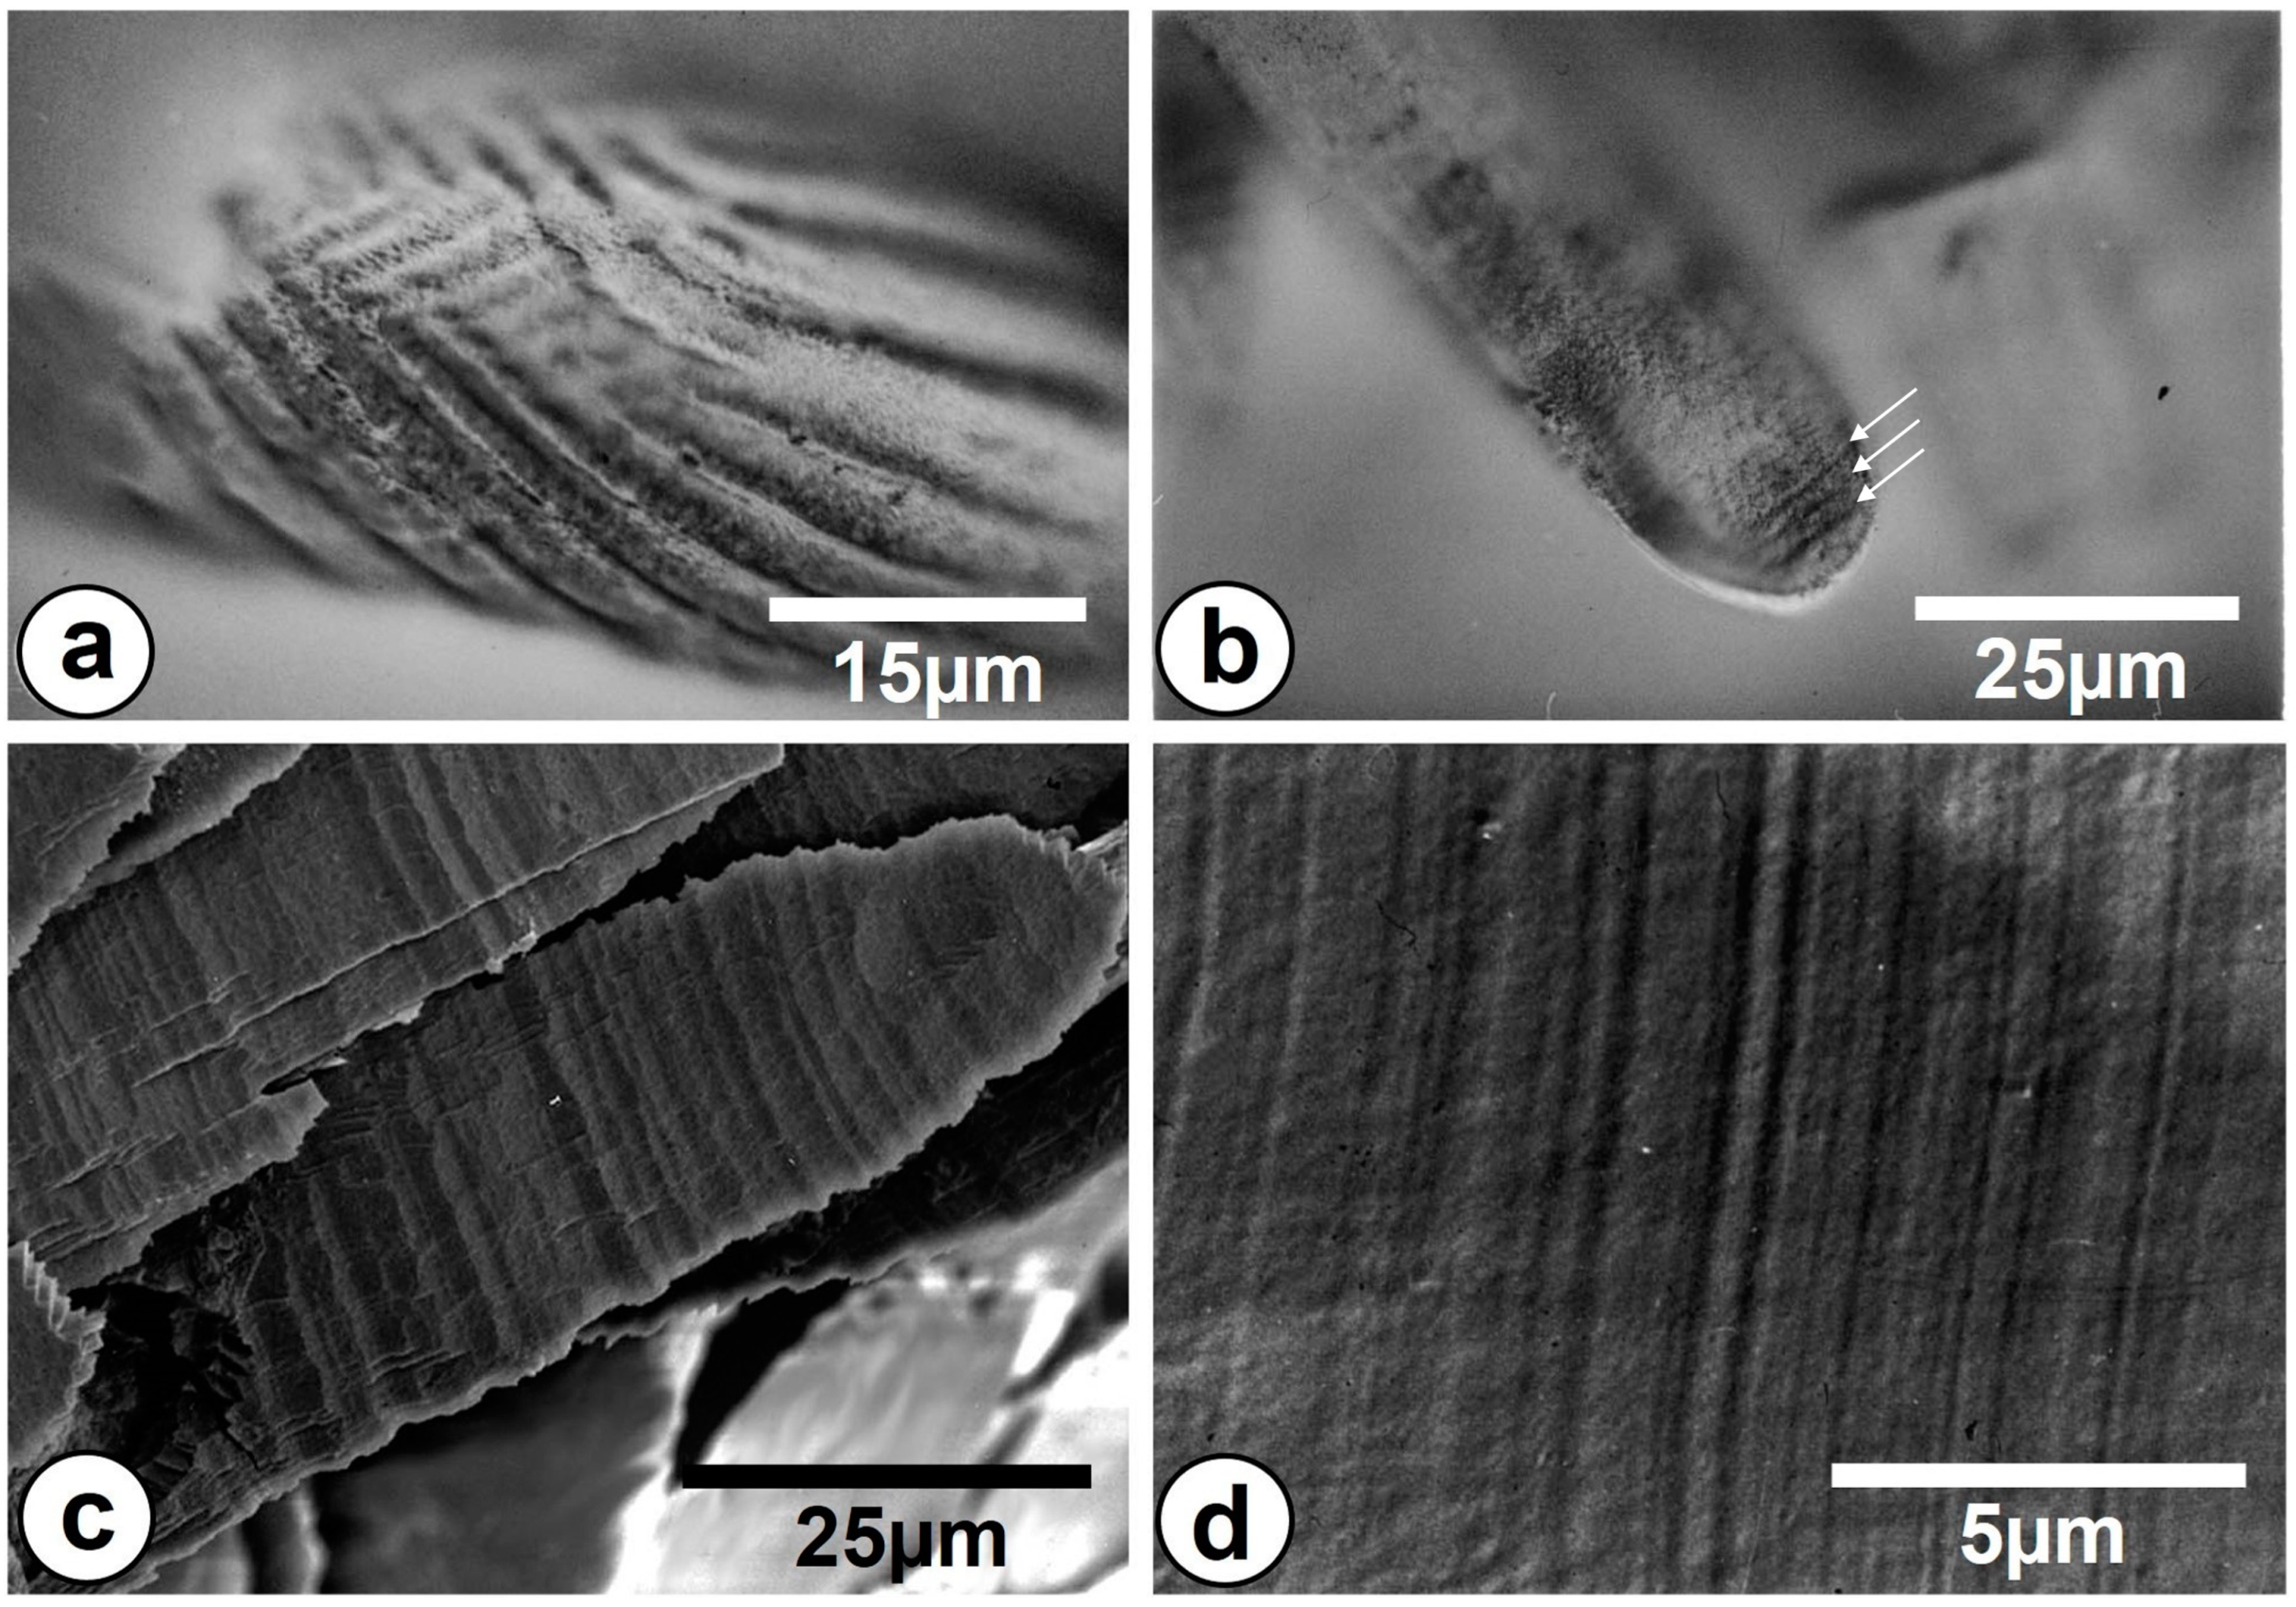
- The wavy pattern of the dorsal face of spicule using reflection light microscopy images at the same length scale.
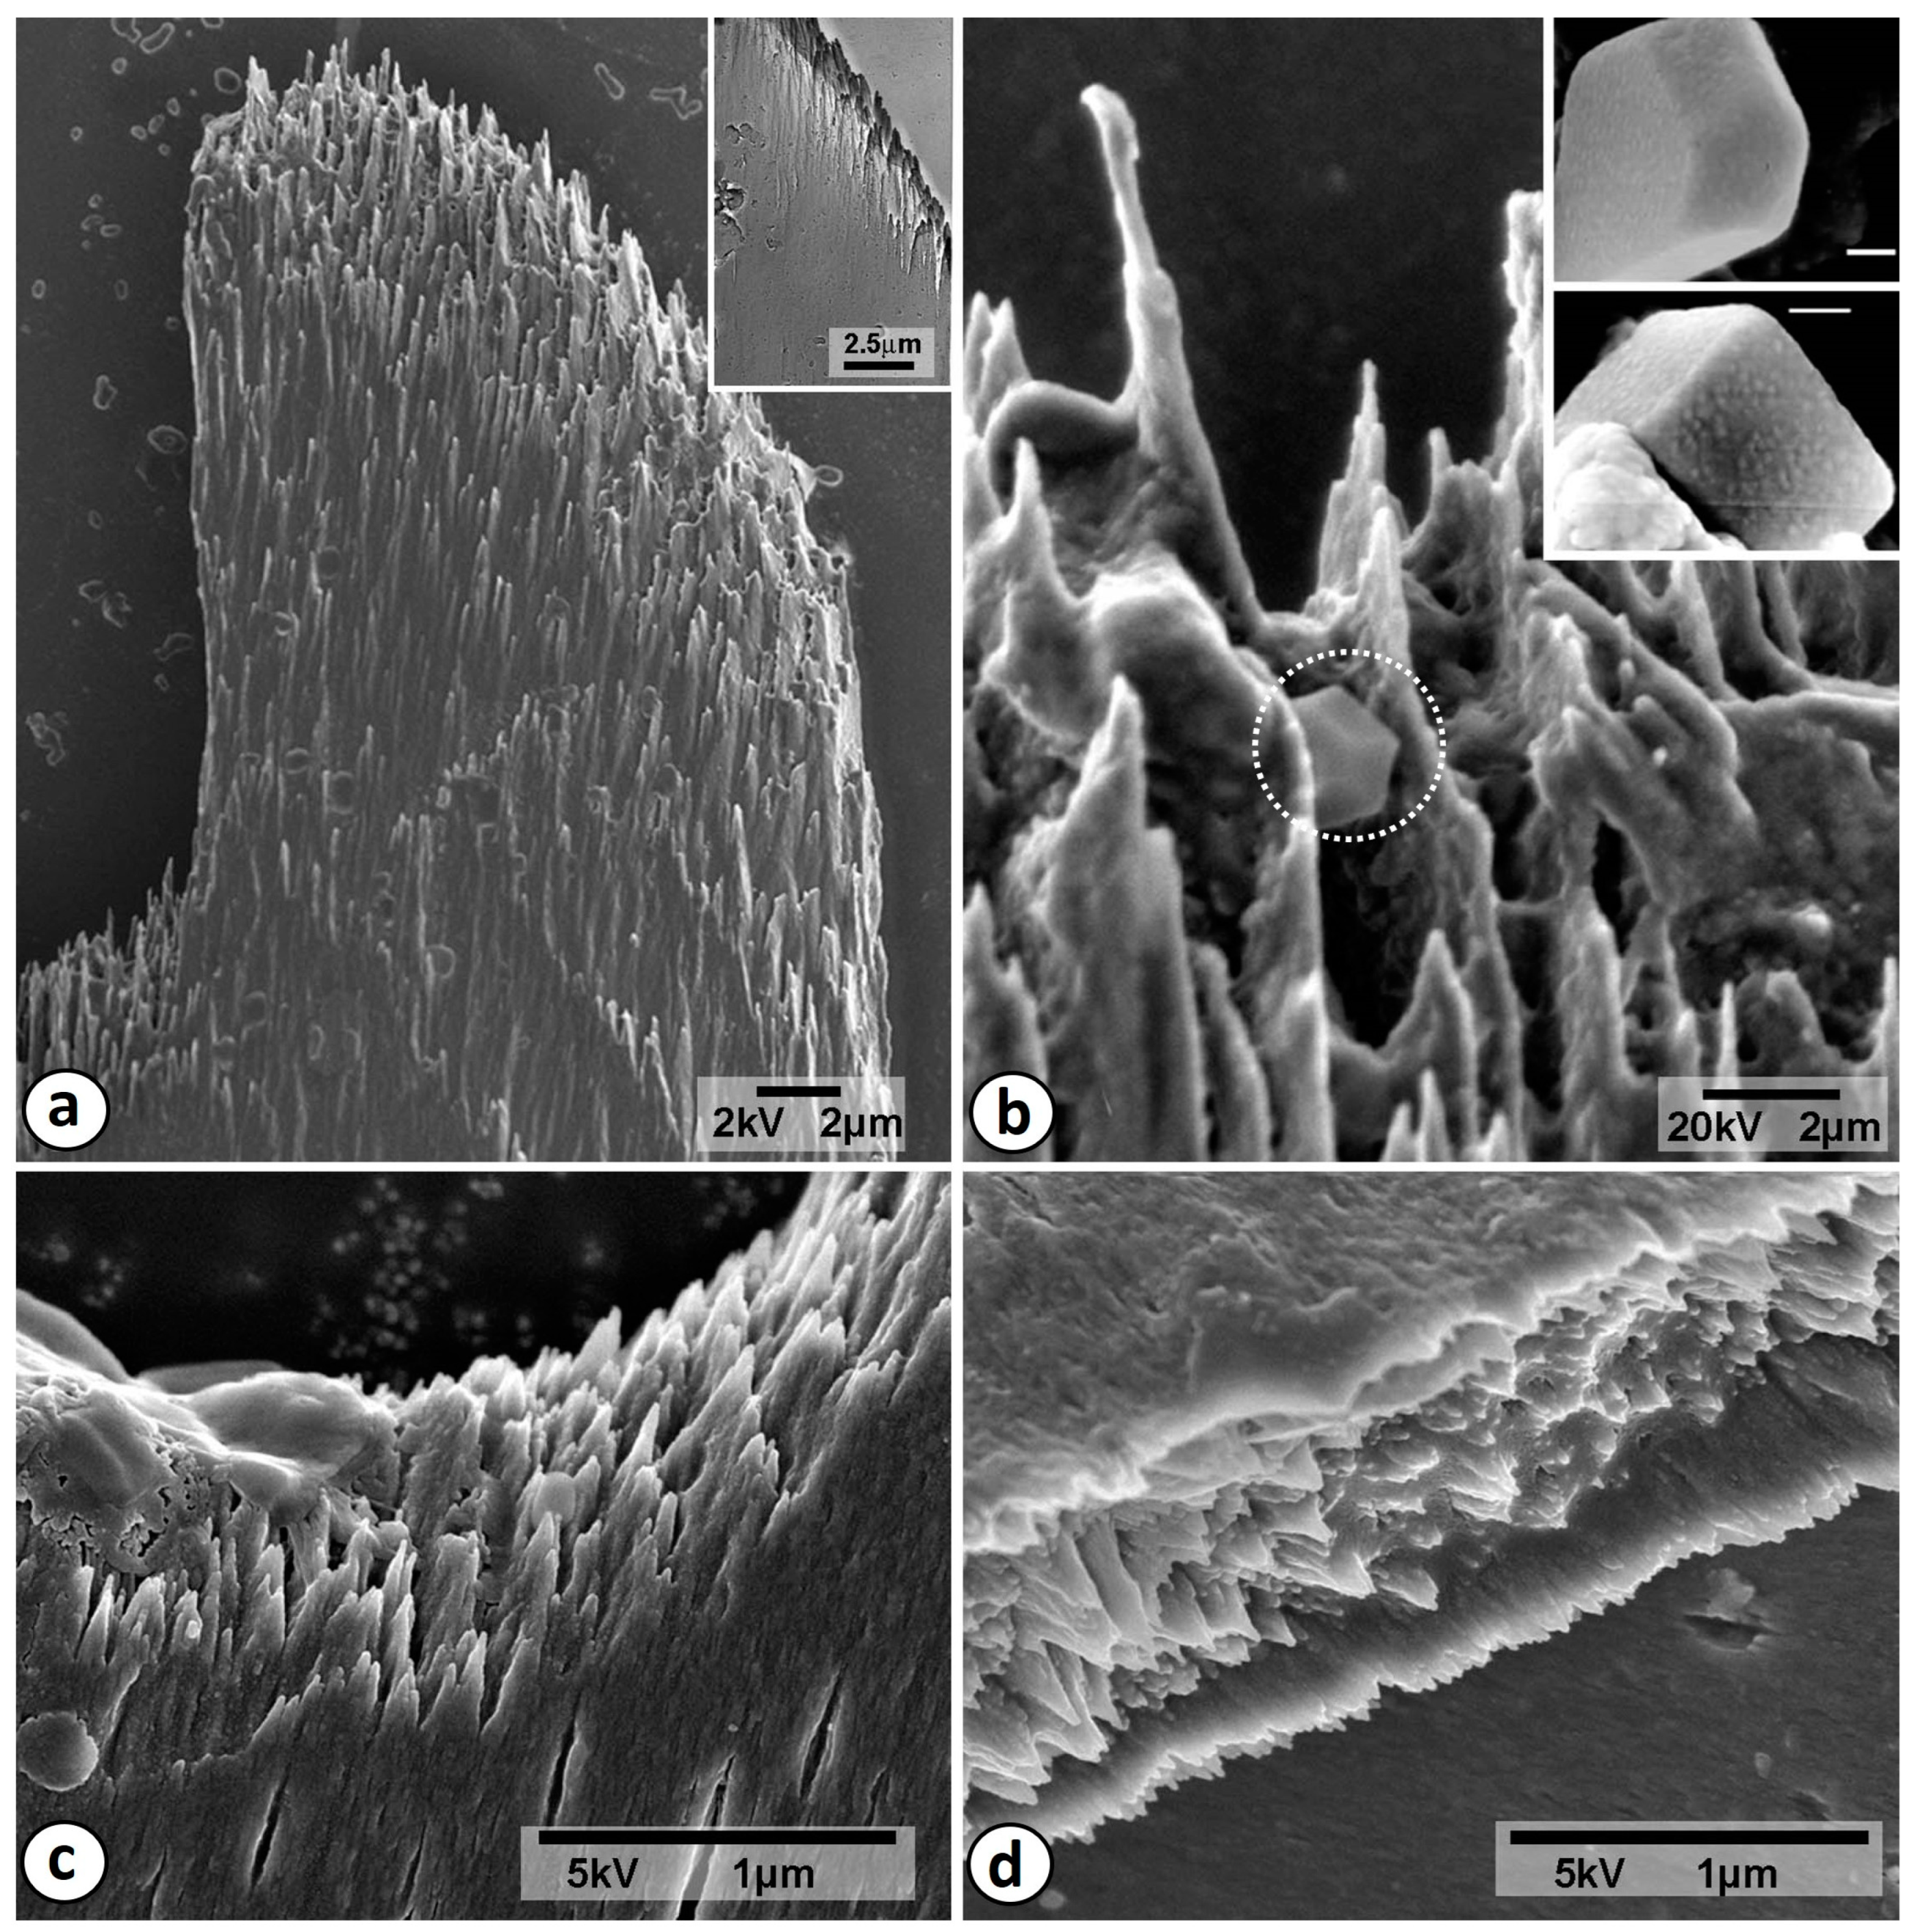
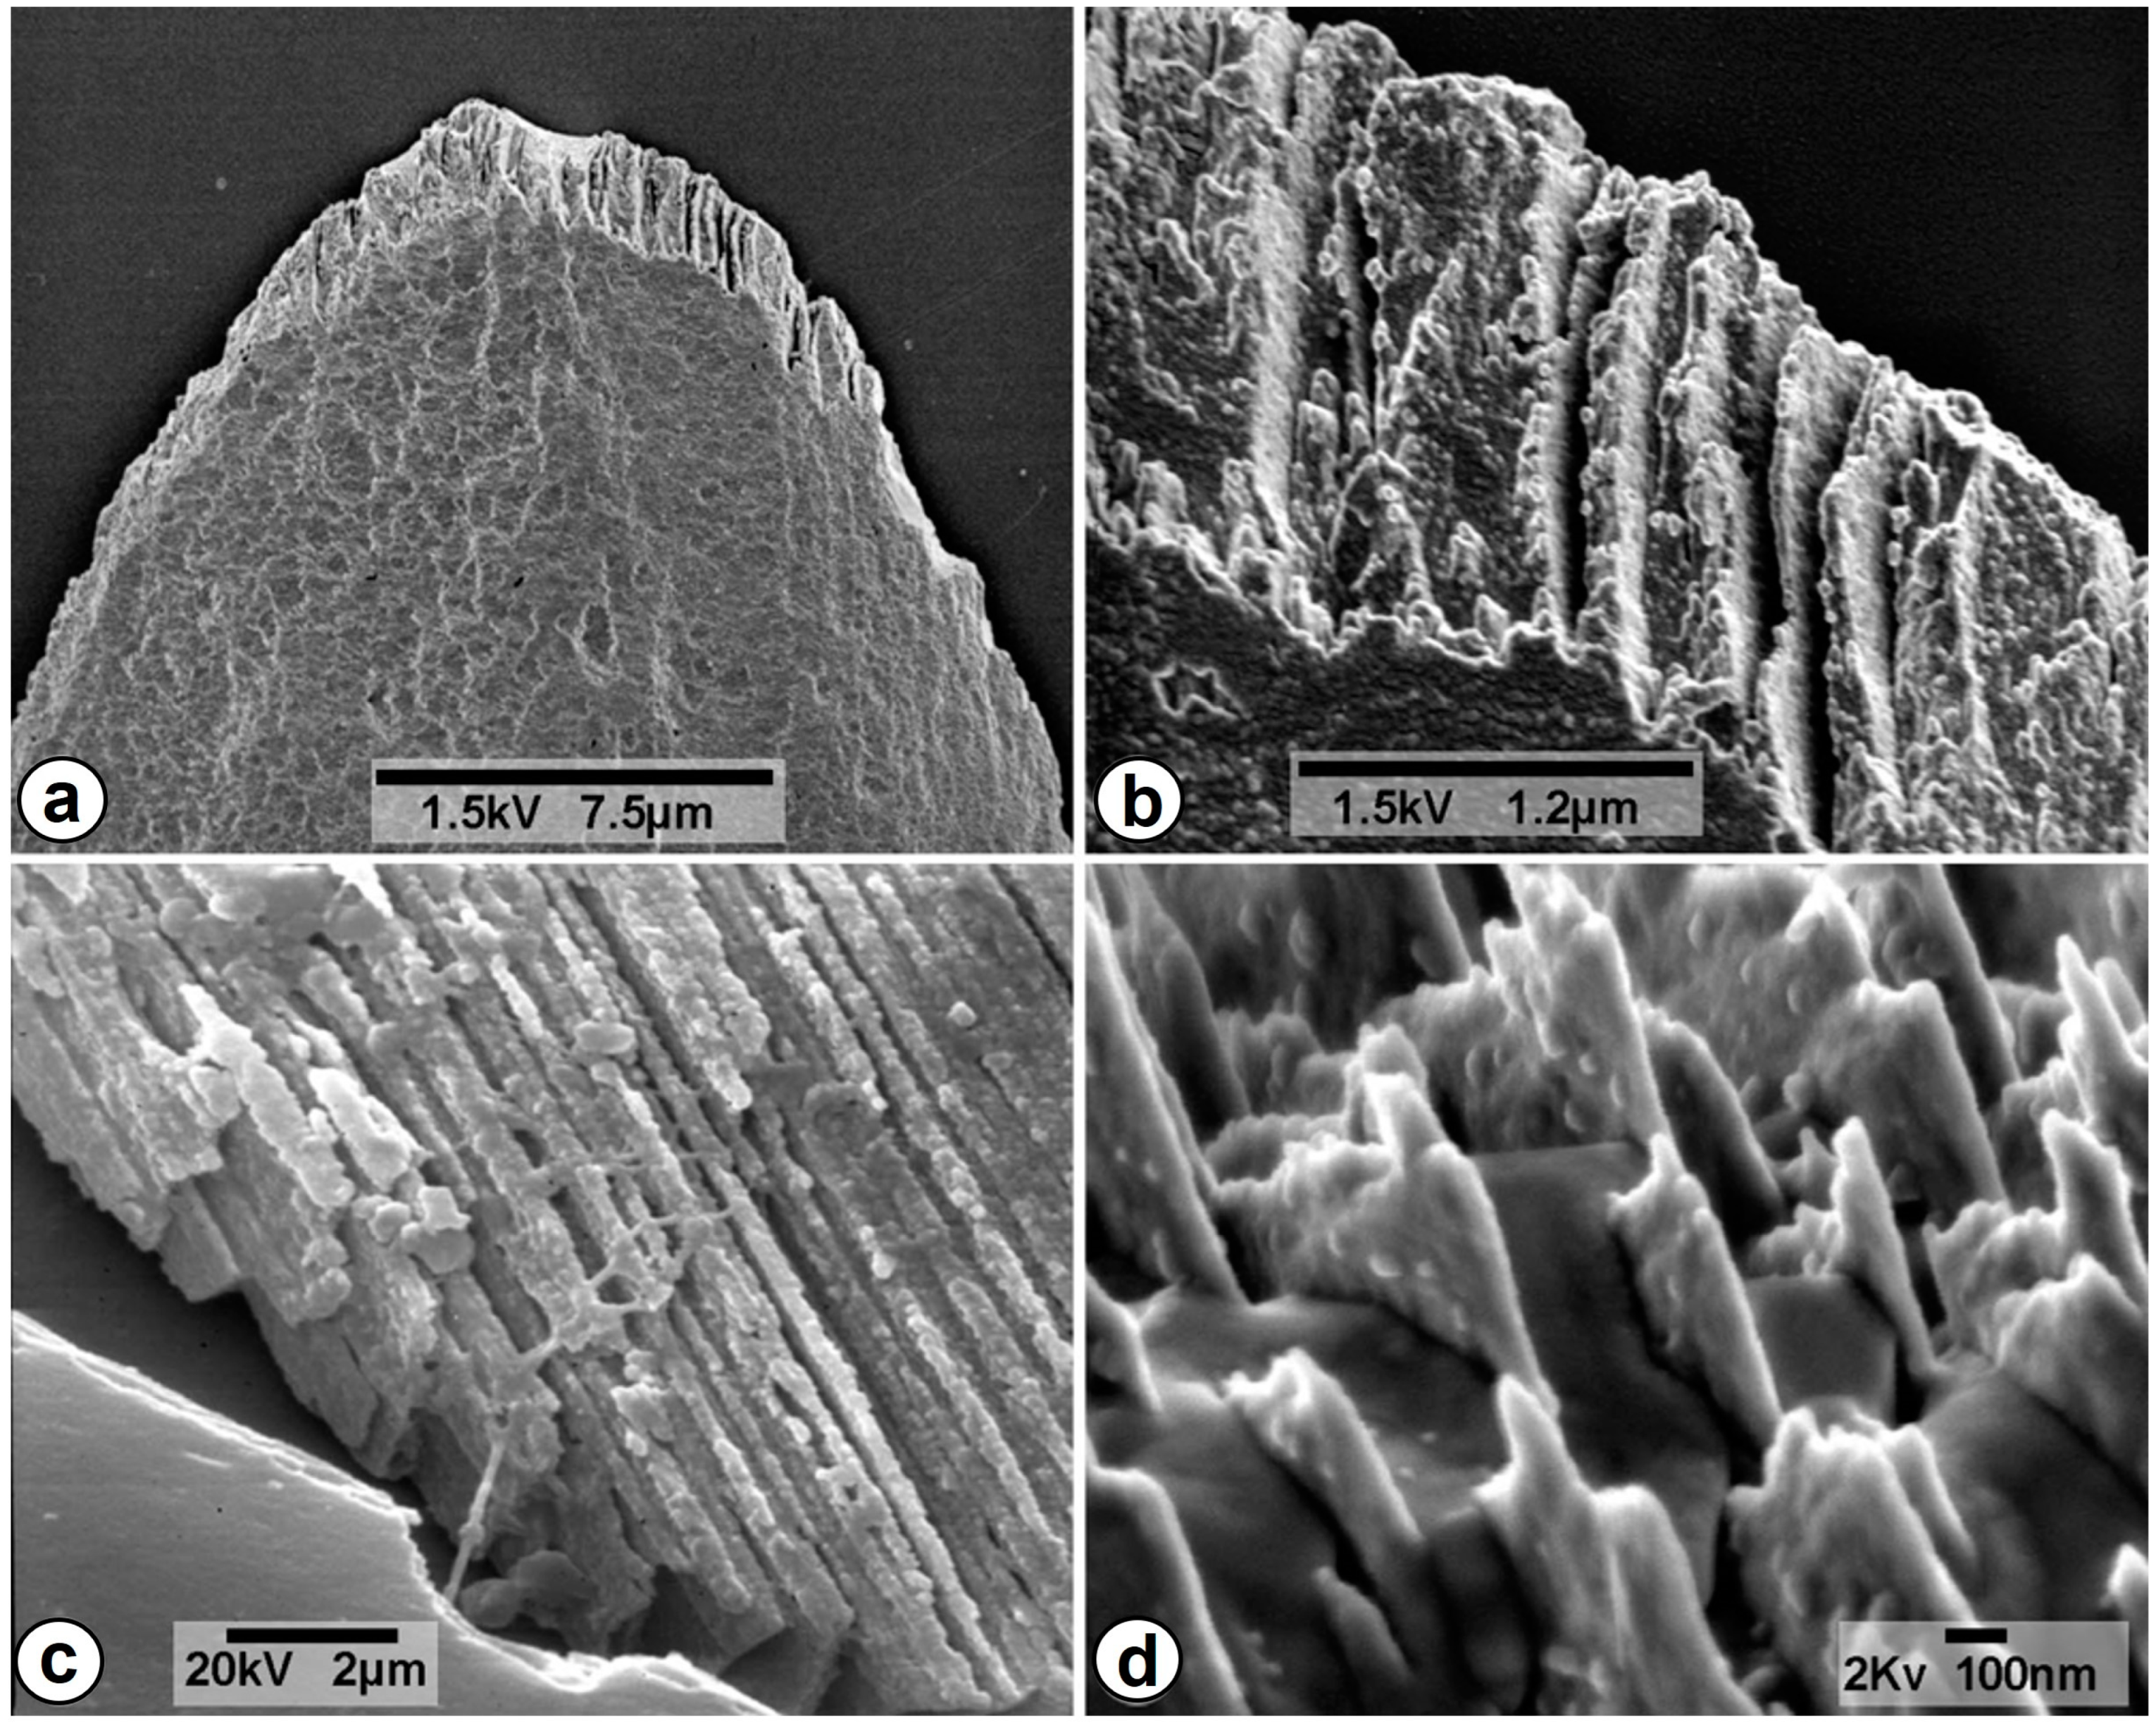
- The micrometer-sized needle-like crystallites composing the ridge of the wavy topography using FIB-SEM with low voltage at a higher magnification.
- The morphology of individual needle-like crystallites using AFM at the submicrometer level. We evidenced their suggested oblique faces exposed at the tip and the association of crystallites with their neighbors.
- The presence of layers of plate-like alternating crystals aligned in parallel and perpendicular to the spicule´s surface, as observed by SEM of acid- and alkali-treated spicules.
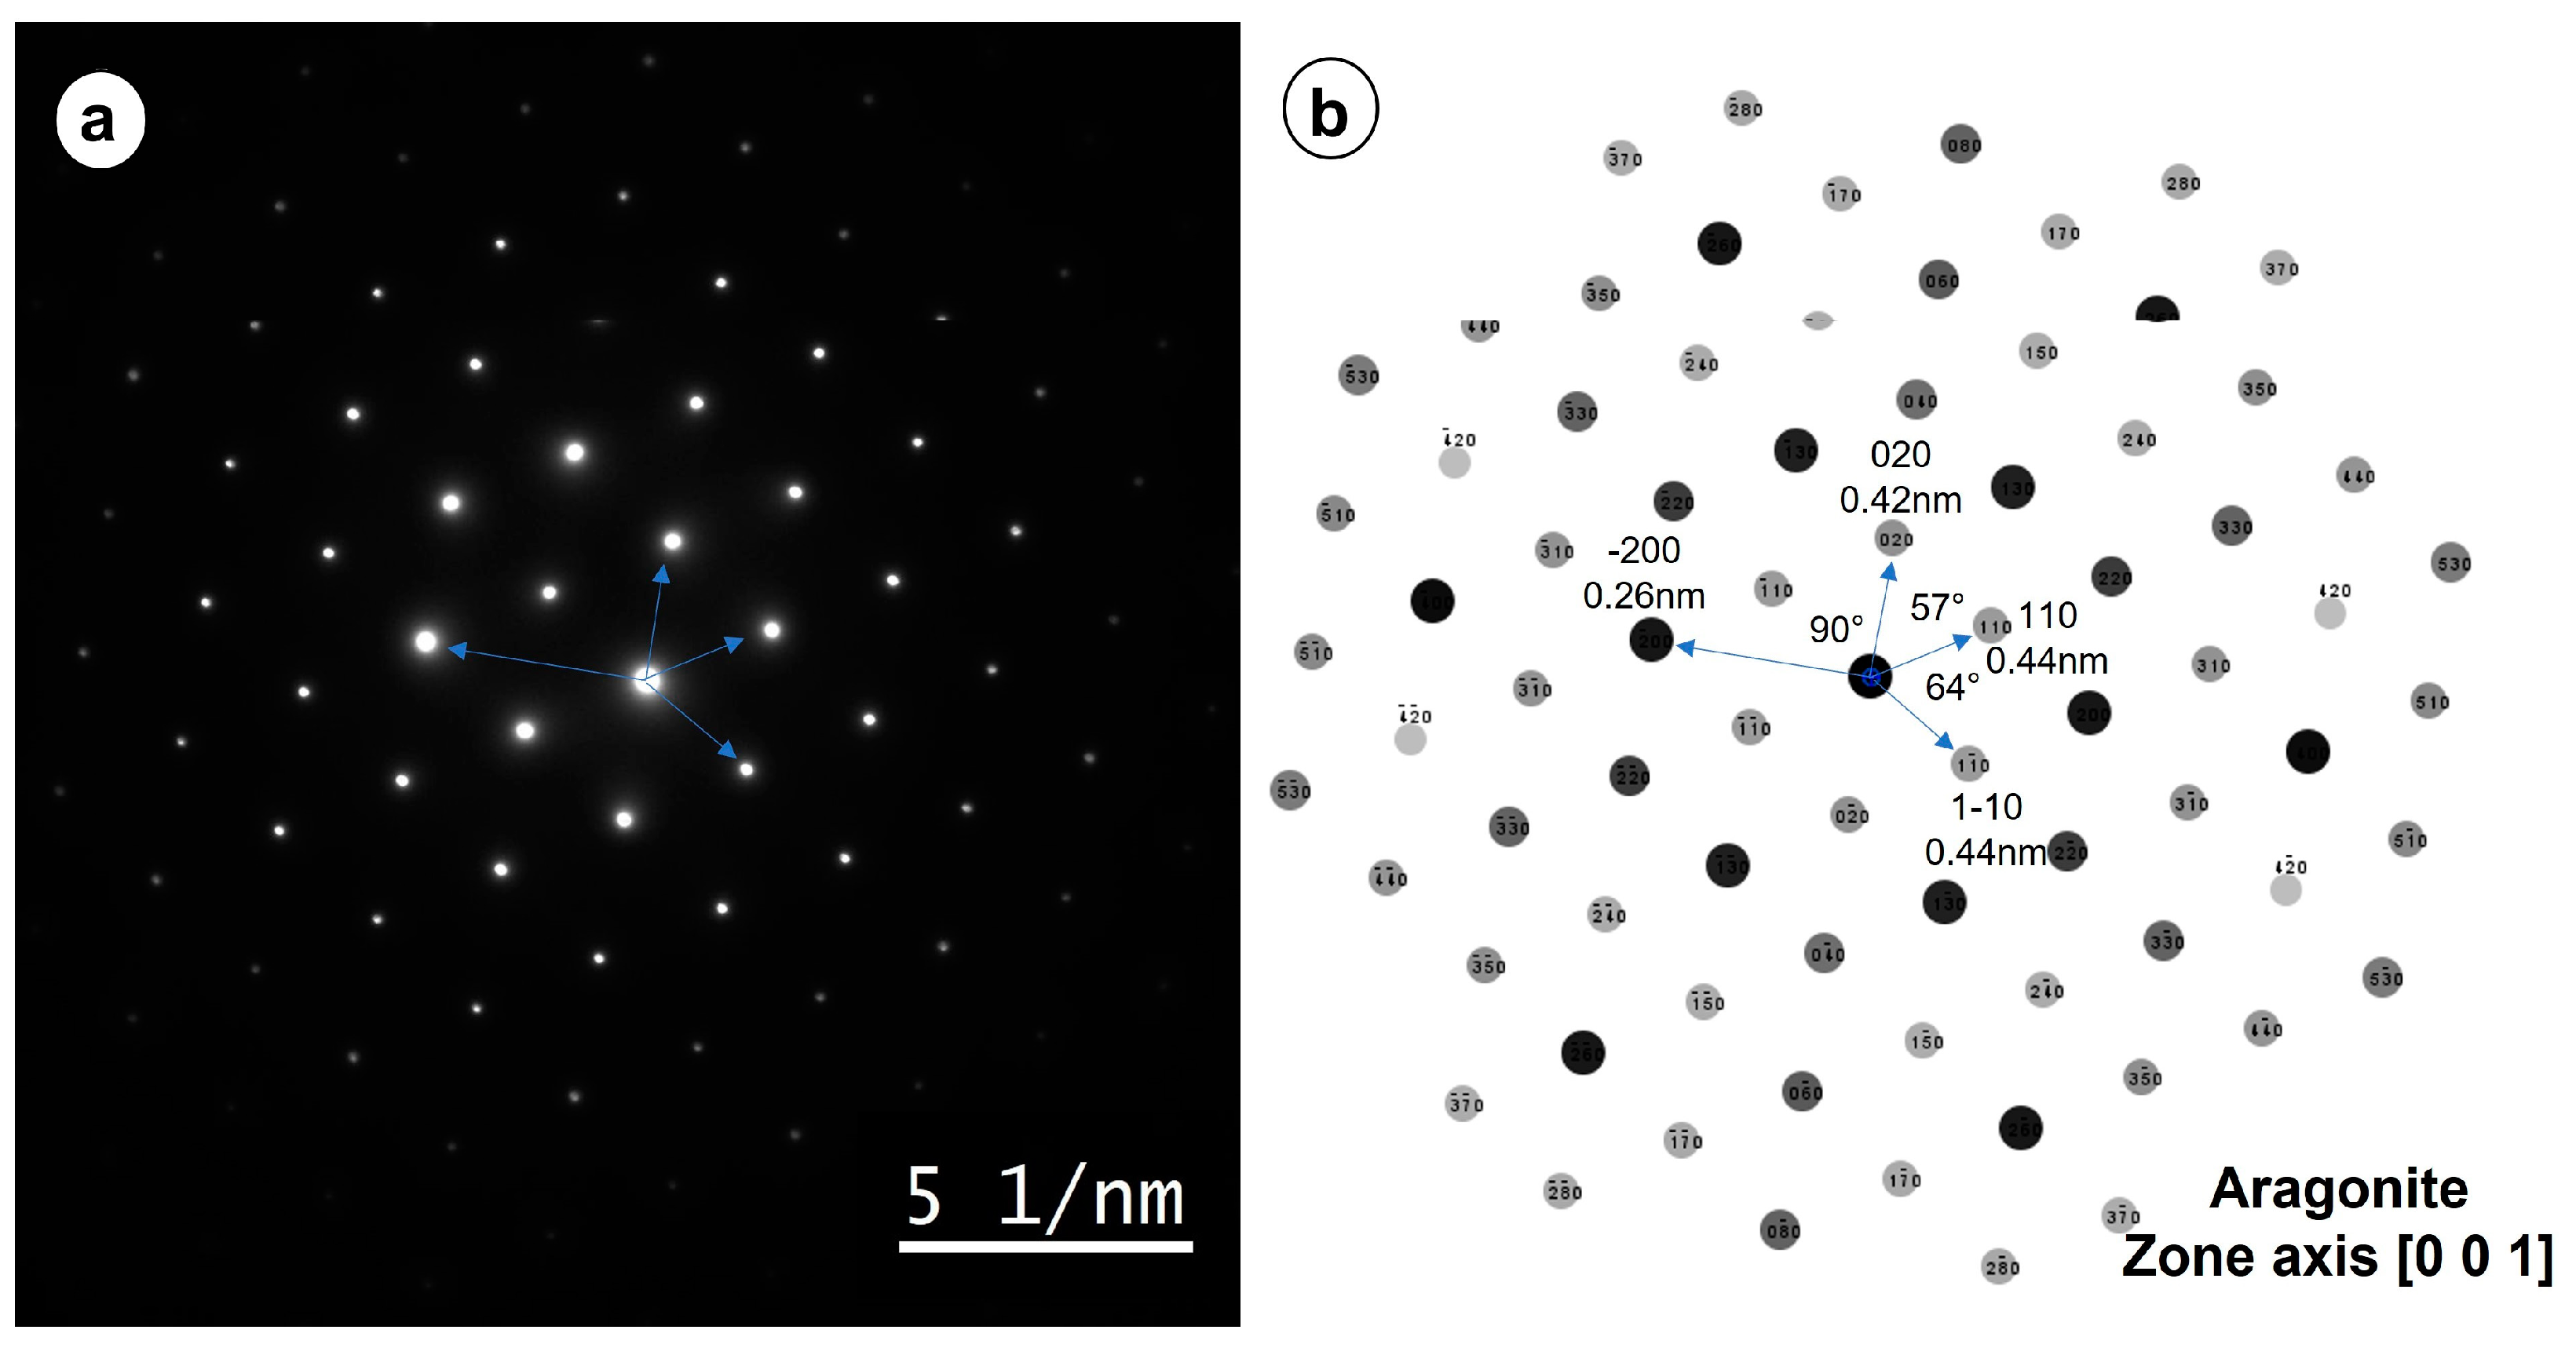
- The spicules as aragonite with the c-axis oriented in the direction of the longer axis using electron diffraction of spicules lamellae oriented perpendicular to their longer axes. To our knowledge, this result is being shown for the first time.
Supplementary Materials
Author Contributions
Funding
Data Availability Statement
Acknowledgments
Conflicts of Interest
References
- Crenshaw, M.A. Biomineralization Mechanisms. In Skeletal Biomineralization:Patterns, Processes, and Evolutionary Trends; Carter, J.G., Ed.; Springer: New York, NY, USA, 1991; p. 302. [Google Scholar]
- Lowenstam, H.A.; Weiner, S. On Biomineralization; Cambridge University Press: New York, NY, USA, 1989. [Google Scholar]
- Bøggild, O.B. The Shell Structure of the Mollusks. Dan. Vidensk. Selsk. Skr. Naturvidensk. Math. Afd. 1930, 9, 231–326. [Google Scholar]
- Kobayashi, I. Internal Microstructure of the Shell of Bivalve Molluscs. Am. Zool. 1969, 9, 663–672. [Google Scholar] [CrossRef]
- Mastropietro, F.; Godard, P.; Burghammer, M.; Chevallard, C.; Daillant, J.; Duboisset, J.; Allain, M.; Guenoun, P.; Nouet, J.; Chamard, V. Revealing Crystalline Domains in a Mollusc Shell Single-Crystalline Prism. Nat. Mater. 2017, 16, 946–952. [Google Scholar] [CrossRef] [PubMed]
- Giles, R.; Manne, S.; Mann, S.; Morse, D.E.; Stucky, G.D.; Hansma, P.K. Inorganic Overgrowth of Aragonite on Molluscan Nacre Examined by Atomic Force Microscopy. Biol. Bull. 1995, 188, 8–15. [Google Scholar] [CrossRef] [PubMed]
- Walker, J.M.; Marzec, B.; Ozaki, N.; Clare, D.; Nudelman, F. Morphological Development of Pleurochrysis Carterae Coccoliths Examined by Cryo-Electron Tomography. J. Struct. Biol. 2020, 210, 107476. [Google Scholar] [CrossRef] [PubMed]
- Dauphin, Y.; Dufour, E. Nanostructures of the Aragonitic Otolith of Cod (Gadus morhua). Micron 2008, 39, 891–896. [Google Scholar] [CrossRef] [PubMed]
- Beedham, G.E.; Trueman, E.R. The Cuticle of the Aplacophora and Its Evolutionary Significance in the Mollusca. J. Zool. 1968, 154, 443–451. [Google Scholar] [CrossRef]
- Haas, W. Evolution of Calcareous Hard Parts in Primitive Molluscs. Malacologia 1981, 21, 403. [Google Scholar]
- Scheltema, A.H.; Tscherkassky, M.; Kuzirian, A.M. Aplacophora. In Microscopic Anatomy of Invertebrates. Mollusca I; Harrison, F.W., Kohn, A.J., Eds.; Wiley-Liss: New York, NY, USA, 1994; pp. 13–54. [Google Scholar]
- Mikkelsen, N.; Todt, C. Diversity of Caudofoveata (Mollusca) Around Iceland and Description of Psilodens Balduri sp. n. Polish Polar Res. 2014, 35, 279–290. [Google Scholar] [CrossRef]
- Señarís, M.P.; García-Álvarez, O.; Urgorri, V. Four New Species of Chaetodermatidae (Mollusca, Caudofoveata) from Bathyal Bottoms of the NW Iberian Peninsula. Helgol. Mar. Res. 2016, 70, 28. [Google Scholar] [CrossRef]
- Dalboni, L.C.; Coelho, C.D.P.C.D.P.; Palombo Pedro, R.R.R.R.; Correia, M.S.M.S.; De Santana, F.R.F.R.; Cardoso, T.N.T.N.; Pinto, S.A.G.S.A.G.; Alvares-Saraiva, A.M.A.M.; Dutra-Correa, M.; Peres, G.B.G.B.; et al. Biological Actions, Electrical Conductance and Silicon-Containing Microparticles of Arsenicum Album Prepared in Plastic and Glass Vials. Homeopathy 2019, 108, 12–23. [Google Scholar] [CrossRef] [PubMed]
- Scheltema, A.H. The Aplacophoran Family Prochaetodermatidae in the North American Basin, Including Chevroderma n.g. and Spathoderma n.g. (Mollusca; Chaetodermomorpha). Biol. Bull. 1985, 169, 484–529. [Google Scholar] [CrossRef] [PubMed]
- Kingsley, R.J.; Froelich, J.; Marks, C.B.; Spicer, L.M.; Todt, C. Formation and Morphology of Epidermal Sclerites from a Deep-Sea Hydrothermal Vent Solenogaster (Helicoradomenia Sp., Solenogastres, Mollusca). Zoomorphology 2013, 132, 1–9. [Google Scholar] [CrossRef]
- Srot, V.; Wegst, U.G.K.; Salzberger, U.; Koch, C.T.; Hahn, K.; Kopold, P.; van Aken, P.A. Microstructure, Chemistry, and Electronic Structure of Natural Hybrid Composites in Abalone Shell. Micron 2013, 48, 54–64. [Google Scholar] [CrossRef]
- Kim, Y.-Y.; Schenk, A.S.; Ihli, J.; Kulak, A.N.; Hetherington, N.B.J.; Tang, C.C.; Schmahl, W.W.; Griesshaber, E.; Hyett, G.; Meldrum, F.C. A Critical Analysis of Calcium Carbonate Mesocrystals. Nat. Commun. 2014, 5, 4341. [Google Scholar] [CrossRef]
- Mann, S. Biomineralization: Principles and Concepts in Bioinorganic Materials Chemistry; Oxford University Press: Oxford, UK, 2001; Volume 17, ISBN 0198508824. [Google Scholar]
- Nudelman, F.; Gotliv, B.A.; Addadi, L.; Weiner, S. Mollusk Shell Formation: Mapping the Distribution of Organic Matrix Components Underlying a Single Aragonitic Tablet in Nacre. J. Struct. Biol. 2006, 153, 176–187. [Google Scholar] [CrossRef]
- Walker, J.M.; Marzec, B.; Lee, R.B.Y.; Vodrazkova, K.; Day, S.J.; Tang, C.C.; Rickaby, R.E.M.; Nudelman, F. Polymorph Selectivity of Coccolith-Associated Polysaccharides from Gephyrocapsa Oceanica on Calcium Carbonate Formation in Vitro. Adv. Funct. Mater. 2019, 29, 1807168. [Google Scholar] [CrossRef]
- Jehannin, M.; Rao, A.; Cölfen, H. New Horizons of Nonclassical Crystallization. J. Am. Chem. Soc. 2019, 141, 10120–10136. [Google Scholar] [CrossRef]
- Rossi, A.L.; Ribeiro, B.; Lemos, M.; Werckmann, J.; Borojevic, R.; Fromont, J.; Klautau, M.; Farina, M. Crystallographic Orientation and Concentric Layers in Spicules of Calcareous Sponges. J. Struct. Biol. 2016, 196, 164–172. [Google Scholar] [CrossRef]
- Treves, K.; Traub, W.; Weiner, S.; Addadi, L. Aragonite Formation in the Chiton (Mollusca) Girdle. Helv. Chim. Acta 2003, 86, 1101–1112. [Google Scholar] [CrossRef]
- Zeng, M.; Kim, Y.-Y.; Anduix-Canto, C.; Frontera, C.; Laundy, D.; Kapur, N.; Christenson, H.K.; Meldrum, F.C. Confinement Generates Single-Crystal Aragonite Rods at Room Temperature. Proc. Natl. Acad. Sci. USA 2018, 115, 7670–7675. [Google Scholar] [CrossRef] [PubMed]
- Fermani, S.; Njegić Džakula, B.; Reggi, M.; Falini, G.; Kralj, D. Effects of Magnesium and Temperature Control on Aragonite Crystal Aggregation and Morphology. CrystEngComm 2017, 19, 2451–2455. [Google Scholar] [CrossRef]
- Sutton, M.D.; Briggs, D.E.; Siveter, D.J.; Siveter, D.J. An Exceptionally Preserved Vermiform Mollusc from the Silurian of England. Nature 2001, 410, 461–463. [Google Scholar] [CrossRef]
- Kocot, K.M. Recent Advances and Unanswered Questions in Deep Molluscan Phylogenetics. Am. Malacol. Bull. 2013, 31, 195–208. [Google Scholar] [CrossRef]
- Telford, M.J.; Budd, G.E. Invertebrate Evolution: Bringing Order to the Molluscan Chaos. Curr. Biol. 2011, 21, R964–R966. [Google Scholar] [CrossRef]
- Scheltema, A.H. Phylogenetic Position of Sipuncula, Mollusca and the Progenetic Aplacophora. In Origin and Evolutionary Radiation of the Mollusca; Taylor, J., Ed.; Oxford London Press: Oxford, UK, 1996. [Google Scholar]
- Smith, S.A.; Wilson, N.G.; Goetz, F.E.; Feehery, C.; Andrade, S.C.S.; Rouse, G.W.; Giribet, G.; Dunn, C.W. Resolving the Evolutionary Relationships of Molluscs with Phylogenomic Tools. Nature 2011, 480, 364–367. [Google Scholar] [CrossRef] [PubMed]
- Haszprunar, G. Is the Aplacophora Monophyletic? A Cladistic Point of View. Am. Malacol. Bull. 2000, 15, 115–130. [Google Scholar]
- Salvini-Plawen, L.V. On the Phylogenetic Significance of the Neurenteric Canal (Chordata). Zoology 1999, 102, 175–183. [Google Scholar]
- Sutton, M.D.; Briggs, D.E.G.; Siveter, D.J.; Siveter, D.J.; Sigwart, J.D. A Silurian Armoured Aplacophoran and Implications for Molluscan Phylogeny. Nature 2012, 490, 94–97. [Google Scholar] [CrossRef]
- Vinther, J.; Parry, L.; Briggs, D.E.G.; Van Roy, P. Ancestral Morphology of Crown-Group Molluscs Revealed by a New Ordovician Stem Aculiferan. Nature 2017, 542, 471–474. [Google Scholar] [CrossRef]
- Kocot, K.M.; Todt, C.; Mikkelsen, N.T.; Halanych, K.M. Phylogenomics of Aplacophora (Mollusca, Aculifera) and a Solenogaster without a Foot. Proc. Biol. Sci. 2019, 286, 20190115. [Google Scholar] [CrossRef] [PubMed]
- Scherholz, M.; Redl, E.; Wollesen, T.; Todt, C.; Wanninger, A. Aplacophoran Mollusks Evolved from Ancestors with Polyplacophoran-like Features. Curr. Biol. 2013, 23, 2130–2134. [Google Scholar] [CrossRef] [PubMed]


Disclaimer/Publisher’s Note: The statements, opinions and data contained in all publications are solely those of the individual author(s) and contributor(s) and not of MDPI and/or the editor(s). MDPI and/or the editor(s) disclaim responsibility for any injury to people or property resulting from any ideas, methods, instructions or products referred to in the content. |
© 2023 by the authors. Licensee MDPI, Basel, Switzerland. This article is an open access article distributed under the terms and conditions of the Creative Commons Attribution (CC BY) license (https://creativecommons.org/licenses/by/4.0/).
Share and Cite
Wendt, C.; Rossi, A.L.; Cypriano, J.; Dilnei de Castro Oliveira, C.; Arrouvel, C.; Werckmann, J.; Farina, M. The Caudofoveata (Mollusca) Spicule as a Biomineralization Model: Unique Features Revealed by Combined Microscopy Methods. Minerals 2023, 13, 750. https://doi.org/10.3390/min13060750
Wendt C, Rossi AL, Cypriano J, Dilnei de Castro Oliveira C, Arrouvel C, Werckmann J, Farina M. The Caudofoveata (Mollusca) Spicule as a Biomineralization Model: Unique Features Revealed by Combined Microscopy Methods. Minerals. 2023; 13(6):750. https://doi.org/10.3390/min13060750
Chicago/Turabian StyleWendt, Camila, André L. Rossi, Jefferson Cypriano, Cleo Dilnei de Castro Oliveira, Corinne Arrouvel, Jacques Werckmann, and Marcos Farina. 2023. "The Caudofoveata (Mollusca) Spicule as a Biomineralization Model: Unique Features Revealed by Combined Microscopy Methods" Minerals 13, no. 6: 750. https://doi.org/10.3390/min13060750