Article

Towards the Chemical Analysis of Diatoms’ Silicon Storage Pools: A Differential Centrifugation-Based Separation Approach

Chair of Bioanalytical Chemistry, Faculty of Chemistry and Food Chemistry, Technische Universität Dresden, 01069 Dresden, Germany
*
Author to whom correspondence should be addressed.
Minerals 2023, 13(5), 653; https://doi.org/10.3390/min13050653
Submission received: 15 March 2023 / Revised: 28 April 2023 / Accepted: 3 May 2023 / Published: 9 May 2023
(This article belongs to the Special Issue Feature Papers in Biomineralization and Biominerals)

Abstract

:
Diatoms are unicellular algae and occur ubiquitously in almost every marine and freshwater habitat on earth. They produce intricately structured cell walls, which mainly consist of amorphous silica. To synthesize their cell walls, diatoms take up monosilicic acid from the environment and store it. These silicon storage pools (SSPs) can exceed the solubility of silicic acid by one to two orders of magnitude, as observed in various diatom species. However, their chemical composition and cellular localization has not yet been elucidated. It is suggested that SSPs may consist of stabilized aggregates such as pre-condensed silica particles or silica-containing vesicles. Isolation protocols for SSPs without significant chemical modification are required to prove such hypotheses. A critical issue is the efficient separation of components of the SSPs from cell wall fragments or artefacts, which may interfere with analytical methods targeting silicon. To this end, a comparative study was performed on exponentially grown cells and extracted, purified cell walls (biosilica) to observe the sedimentation behavior after lysis. Cell cultures were lysed by bead beating and then fractionated by differential centrifugation. The obtained fractions were analyzed for total silicon content (tSi) using molybdenum blue assay (MBA) after alkaline treatment. It was revealed that cell wall fragments are almost absent in fractions above 1000 × g. Compared with biosilica, a significantly higher silicon concentration is found in lysed cell pellets after centrifugation at moderately high forces. The differences correspond to a few percent of total cellular silicon, which are assumed to be part of SSPs. Only relatively low amounts of silica/silicic acid remain in the supernatant at high centrifugal forces. This indicates that SSPs are mainly present in larger aggregates that sediment at lower centrifugal forces. According to Stokes’ law, only silica particles below ca. 25 nm radius would remain in the final supernatant. This leads to the conclusion that SSPs must mainly consist of larger silica particles and/or are associated with larger compartments/aggregates.

1. Introduction

Diatoms are photosynthetic eukaryotic single-celled organisms important for ecology and climate. As a major phytoplankton component, their contribution to global photosynthesis turnover is estimated to be about 20% [1]. Diatoms are capable of growing much faster than terrestrial plants [2], which in turn makes them a potential environment threat in case of massive algal blooms [3]. On the other hand, they may offer future solutions for the food and energy crisis [2,4,5,6]. The broad scientific interest in diatoms is also due to their unique physiology: diatom cell walls (so-called valves, further denoted as diatom biosilica) exhibit fascinating morphological diversity. They consist of amorphous silica with species-specific, often hierarchical, micro- and nanostructures [7]. Diatom biosilica exhibits special materials properties. Sedimented diatom biosilica, so-called diatomaceous earth/diatomite, has already found various applications, e.g., as a filter material, carrier for chemicals including explosives (dynamite) and column material in chromatography [8]. However, diatomite contains various contaminants and consists of broken frustule parts from various species [9,10,11]. Fresh diatom biosilica from axenic cultures is a much better-defined material [9]. It is thus increasingly envisioned for future technological purposes. Potential applications are, for example, sorption, catalysis, and optics [12,13,14,15,16,17,18]. Understanding the physical and chemical basis of silica biomineralization processes in diatoms is thus not only an interesting topic of fundamental research. In the future, it may also facilitate the development of synthesis pathways of sustainable materials for novel silica materials with special properties [19].
Silica biomineralization by diatoms takes place in highly specialized compartments, so-called silicon deposition vesicles (SDVs; see Figure 1) [20,21]. The biosynthesis of silica requires silicic acid uptake from the aqueous environment (cf. Figure 1). In 1954, Lewin first described silicic acid depletion of the growth medium during the cultivation of Navicula pelliculosa and assumed active uptake [22,23]. Further evidence resulted from 31Si radioisotope uptake measurements on Nitzschia alba [24]. Subsequently, the radioisotope 68Ge was used as a silicon tracer due to its longer half-life time compared to the rapidly decaying radioisotopes of silicon [25,26,27,28,29]. Hildebrandt et al. describe three different modes of uptake: internally and externally controlled as well as the so-called “surge uptake”. The latter occurs, e.g., after short periods of silicon deficiency followed by a high extracellular silicic acid concentration [30]. The discovery of the transmembrane silicon transport proteins (SITs) [31,32] provided a mechanistic understanding for the active silicic acid uptake across the cell membrane [30,33,34,35]. However, the complex role of SITs is still a matter of debate and alternative uptake mechanisms such as transmembrane diffusion [36], (macro)pinocytosis [37,38] and endocytosis of externally formed silica oligomers [39] are also considered and discussed [40] (cf. Figure 1).
After uptake, silicon must be accumulated and stored in silicon storage pools (SSPs) due to the low silicic acid concentration in most environments (oceanic average: about 70 µM) [41]. The solubility limit of silica amounts to only about 2 mM at near-neutral pH and 25 °C [42,43]. Silicic acid accumulation and storage by diatoms thus requires a stabilization mechanism to prevent the SSPs from spontaneous and uncontrolled autopolymerization in the cell interior. Early evidence for this idea was the observation that N. pelliculosa begins to deposit biosilica on developing valves even in the complete absence of silicon in the nutrient medium. Studies of the incorporation of the radioisotope 31Si have supported this idea [44]. Various studies confirmed that diatoms are indeed capable of storing the total amount of silicon required for cell division [45,46]. Intracellular concentrations strongly exceeding the solubility limit were often found [36,47] and even 2000 mM intracellular silicon was reported for Ditylum brightwellii [48]. Recent investigations on Thalassiosira pseudonana combining cryo-SEM and EDX measurements revealed intracellular silicon concentrations of about 140 mM [49].
However, the chemical nature and cellular localization of the stabilized silicic acid/silica in SSPs have remained elusive in this field for decades. It is sometimes speculated that silicic acid is stabilized by forming complexes with organic molecules in the cell interior. This is, for example, concluded from NMR studies of 29Si- and 15N-enriched cells of N. pelliculosa. A transient 29Si NMR signal at 131.5 ppm chemical shift was attributed to a hexavalent complex with at least one nitrogen coordinated to silicon [50]. Lysis and fractionation experiments on Cyclotella cryptica revealed that the size of one particular fraction denoted as plasmatic silicic acid strongly correlated with the silicon availability in the medium. Interestingly, this silicon-containing fraction was obtained by repeatedly salting out the supernatant at 5000 × g with ammonium sulfate, suggesting a binding between silica/silicic acid and proteins [51]. In vitro experiments on supersaturated silicic acid solutions revealed a stabilizing effect for a series of synthetic polymers. The stabilizing effect can result from various interactions with different moieties ([52] and references therein). These model studies are inspired by the long-chain polyamines (LCPA), a partially cationic biomolecule found in the biosilica of all diatom species analyzed so far [53,54]. A key role of the LCPAs for biomineralization is very likely, but their relevance for SSPs is yet unknown. Solid-state 29Si NMR studies on frozen, 29Si-enriched cell cultures of T. pseudonana [55] and D. brightwellii [56] have indicated that silicic acid is rapidly transformed into condensed silica species after uptake. This hints towards the presence of silica-containing particles such as SiO2 nanoparticles. Remarkably, silica nanoparticles could be detected microscopically in the isolated SDVs obtained by bead-beating lysis and centrifugation [21]. Such particles may also contain organic molecules for stabilization or may be attached to cellular compartments.
Cytoplasmic vesicles were found to fuse with the SDV during valve formation in Thalassiosira eccentric. It has been suspected that these could be silica transport vesicles (STV) [57], although it is unknown if they indeed contain silicon. In vitro binding experiments with 68Ge on membrane fractions of N. alba revealed increased selective radiotracer binding of the endoplasmic reticulum, the plasmalemma, and to some extent also the Golgi membranes [58]. Pulse labelling experiments with N. alba showed a rapid increase (<1 min) in radiotracer in the cytoplasm. Subsequent lysis and fractionation revealed that 90.2% of the tracer taken up was found in the cell wall fraction after 10 min and only a small fraction (5.2%) remained in the supernatant at 100,000 × g [24] Notably, recent TEM and EDX measurements have revealed silicon-containing cell inclusions in Synedra acus [59].
In summary, it can be stated that the presence of intracellular SSPs in diatoms is well-established. However, their analysis remains to be error-prone since chemical preparation treatment steps may lead to changes of their chemical states and silicic acid leaching from cell walls [44]. Mechanical treatments can result in cell wall fragments [51]. The present paper aims to develop and evaluate an approach based on mechanical cell lysis using bead beating and the subsequent fractionation of the lysed cells through differential centrifugation. Bead beating circumvents the leaching problem of treatments such as the established boiling procedure [29]. The developed procedure is applied not only to freshly harvested cells, but also to pre-extracted biosilica as a reference material to evaluate the presence and amount of cell wall fragments in the different fractions that are potentially produced from bead beating. The latter consists of purified cell walls without cytoplasmic material [60].

2. Materials and Methods

2.1. Cultivation

T. pseudonana strain CCMP 1335 was cultivated in sealed polycarbonate containers (Nalgene) of 20 L volume in artificial seawater (ASW) according to Harrison et al. [61]. For inoculation, 50 mL of a dense cell suspension was added. The temperature of the incubator (RuMed 1301, Rubarth Apparate GmbH, Laatzen, Germany) was set at 20 °C under a 12 h/12 h light/dark regime. The growth medium was slightly agitated without active aeration and pH was kept between 7.8 and 8.4. Cell density and silicic acid concentration were monitored with an automated cell counter (CellDrop FL, DeNovix, Wilmington, DE, USA) and MBA, respectively. After 9–12 days, the late exponential growth phase was reached. The cells were harvested at a density of around 1.5 × 10⁶ mL–1 through centrifugation at 4000× g for 25 min (Heraeus Megafuge 40, swinging bucket rotor TX 750, ThermoScientific, Waltham, MA, USA) before silicic acid depletion of the medium. Cells were washed twice with 4.0% NaCl solution. Equal portions of the cell suspension were transferred to 2.0 mL microtubes and centrifuged, and the pellets were stored at −80 °C.

2.2. Molybdenum Blue Assay (MBA)

For silicon quantification, the well-established molybdenum blue assay (MBA) method was applied. Its high sensitivity allows the detection of nanomolar concentrations [62] and the fast procedure enables a high sample throughput [63,64,65,66]. Interference with different ions and organic molecules is described in various publications. Interference with phosphate, a ubiquitous ion in biological samples, is prevented by oxalic acid addition [67]. The influence of other matrix effects is circumvented by standard addition (For details of the calibration, see Electronic Supporting Information, ESI, Figures S1–S4). High-speed centrifugation prevents light scattering by precipitates or particles. The MBA reactive species are monosilicic and disilicic acid (“soluble silicon”) [67,68,69]. MBA thus measures the concentration of soluble silicon (sSi). Alkaline treatment also dissolves condensed silica, and the total silicon (tSi) of a sample is measured afterwards [63]. Three different methods for alkaline decomposition were tested and compared to ensure the full decomposition of the samples and solubilization of all silica.
The analysis was performed according to Koistinen et al. [63]. Samples contained in 2.0 mL microtubes were adjusted to 1620 µL with ultrapure water if necessary. A total of 60 µL of 81 mM ammonium heptamolybdate in 1.8 M sulfuric acid was added, followed by mixing. After 5 min, 60 µL of 1 M oxalic acid was added, followed by mixing. After at least 1 min, 60 µL of 100 mM ascorbic acid was added, followed by mixing. After at least 30 min, samples were centrifuged at 21,000× g for 5 min prior to measurement. The supernatant was transferred to a cuvette (10 mm, PS, VWR) and molybdenum blue absorption (maximum at 810 nm) was measured on a UV/VIS spectrophotometer (Cary 50 scan, Varian, Palo Alto, CA, USA). The background of a blank cuvette filled with ultrapure water was subtracted from the spectra.

2.3. Preparation of Biosilica

Biosilica was prepared by lysing cells as described by Kröger et al. [60]. A cell pellet of approx. 15 × 109 cells was mixed with 20.0 mL of lysis buffer containing 2.0% (w/v) sodium dodecyl sulfonate (SDS) and 0.1 M ethylenediaminetetraacetic acid (EDTA) at pH 8.0 in a 50 mL centrifuge tube, followed by heating at 95 °C for 10 min. After cooling, the lysate was centrifuged at 2000× g for 15 min (Universal 320R, swinging bucket rotor 1351, Andreas Hettich GmbH & Co. KG, Tuttlingen, Germany). The sample was washed by mixing with ultrapure water and centrifuged as before. After 5–6 cycles, no foam occurred and the supernatant was translucent.

2.4. Bead-Beating Lysis

In total, 1700 µL of a cold lysis buffer and 1.7 g of yttria-stabilized zirconia (YSZ) beads were added to the sample (harvested cell pellet or pre-extracted biosilica) in a 2.0 mL microtube. Lysis buffer contained 150 mM NaCl, 20 mM tris(hydroxymethyl)aminomethan (Tris), 1 mM mercaptoethanol (ME), and 100 µM phenylmethylsulfonyl fluoride (PMSF) at pH 7.5. ME and PMSF were added to the lysis buffer shortly before. The suspension was pulse-treated (15 s/15 s pulse/halt). After 4 min treatment (8 pulses), the lysate was separated from the beads and cooled to 4 °C. In total, 40 µL of the lysate was taken for later analysis of tSi.

2.5. Differential Centrifugation

An initial volume of 1400 µL of the cooled lysate was added to a 2.0 mL microtube. Centrifugation was performed in a pre-cooled centrifuge at 4 °C (Universal 320R, fixed angle rotor 1420-B, Andreas Hettich GmbH & Co. KG, Tuttlingen, Germany). After each centrifugation step, a designated volume of the supernatant was carefully transferred with a pipette into a new microtube for the next step, as summarized in Table 1. The remaining pellets were stored for later analysis of tSi.
At the end of the procedure, a set of aliquots was taken from the last remaining supernatant at 21,000× g and immediately analyzed (with internal standards) through MBA, without alkaline treatment, to measure the amount of sSi. The remaining supernatant was stored for later analysis of tSi. The procedure is also outlined in Figure 2 and Figure 3 (below).

2.6. Sample Preparation and Calibration

Samples (pellet, supernatant, and lysate) were treated in an ultrasound bath for 10 min followed by intense vortexing to ensure homogenization. For the pellets, ultrapure water was added up to the volume used before the specific centrifugation step (“centrifuged volume”; see Table 1). Lysate samples were diluted to 2.0 mL. Supernatants were not diluted. From these stock solutions, aliquots of 40–250 µL were transferred into 2.0 mL microtubes.
Silica standard stock solution (sodium metasilicate, 1000 mg SiO2/L, Bernd Kraft GmbH, Duisburg, Germany) was diluted to working solutions of 100, 200, 300, 400 and 500 µM silicon. For calibration with internal standard, 90 µL of working solution was added to the aliquot prior to alkaline treatment (standard addition). For external calibration, 90 µL of working solution was added to 2.0 mL microtubes for alkaline treatment. Working solutions gave concentrations of 5, 10, 15, 20 and 25 µM silicon in the final volume of 1800 µL at the end of the analytical procedure. Further details are outlined in Section 3.

2.7. Alkaline Treatment

2.7.1. Standard Procedure—Mild Alkaline Treatment

A total of 500 µL of 0.2 M NaOH was added to the sample (aliquot, standard or both) in a 2.0 mL microtube (see Section 2.6). The tube was tightly capped and heated for 15 min at 95 °C in a water bath. After cooling, 500 µL of 0.2 M HCl was added. The volume was then adjusted to 1620 µL by adding ultrapure water [63].

2.7.2. Autoclave-Induced Digestion (AID)

Autoclave-induced digestion (AID) is based on a procedure developed by Elliott and Snyder [64] and was used with the modifications described by Simpson et al. [66]. A tiny hole was drilled in the lid (Ø~1 mm) of the 2.0 mL microtube. In total, 10 µL of octyl alcohol was added to the samples (aliquot or standard), followed by 90 µL of 30% (w/v) H2O2 and 100 µL of 70% (w/v) NaOH. The mixture was shaken gently and treated in an autoclave for 60 min at 121 °C. After cooling, 6 M HCl was added to neutralize the solution. An amount of 10 µL of phenolphthalein solution was added. Thorough neutralization was realized through the stepwise addition of defined volumes of 0.2 M HCl. This allowed us to accurately match the indicative color change. Incomplete neutralization in the final solution reduces color development and MBA results [66]. Ultrapure water was added to obtain a volume of 1620 µL.

2.7.3. Oven-Induced Digestion (OID)

Oven-induced digestion (OID) is based on a procedure developed by Krasker and Breitenbeck [65] and was applied with the modifications described by Simpson et al. [66]. An amount of 10 µL of octyl alcohol was added, followed by 90 µL of 30% (w/v) H2O2, to the sample (aliquot or standard). The microtube was tightly capped and treated in a convection oven for 30 min at 95 °C. In total, 100 µL of 70% (w/v) NaOH was added to the hot sample, which was then thoroughly mixed, capped, and returned to the oven for another 4 h at 95 °C. Neutralization was performed as described for AID. The volume was finally adjusted to 1620 µL by adding ultrapure water.

2.8. Characterization

Samples (harvested cell pellet and pre-extracted biosilica) were freeze-dried prior to FT infrared spectroscopic studies (Nicolet iS5, ThermoScientific). FT-IR spectra were acquired using the attenuated total reflexion (ATR) method using a Specac ATR-unit (Specac, Orpington, UK). Cell dimensions were determined from microscopic images (Biozero BZ 8000, Keyence, Osaka, Japan) using the Fiji software in order to calculate the mean cell volumes.

3. Results

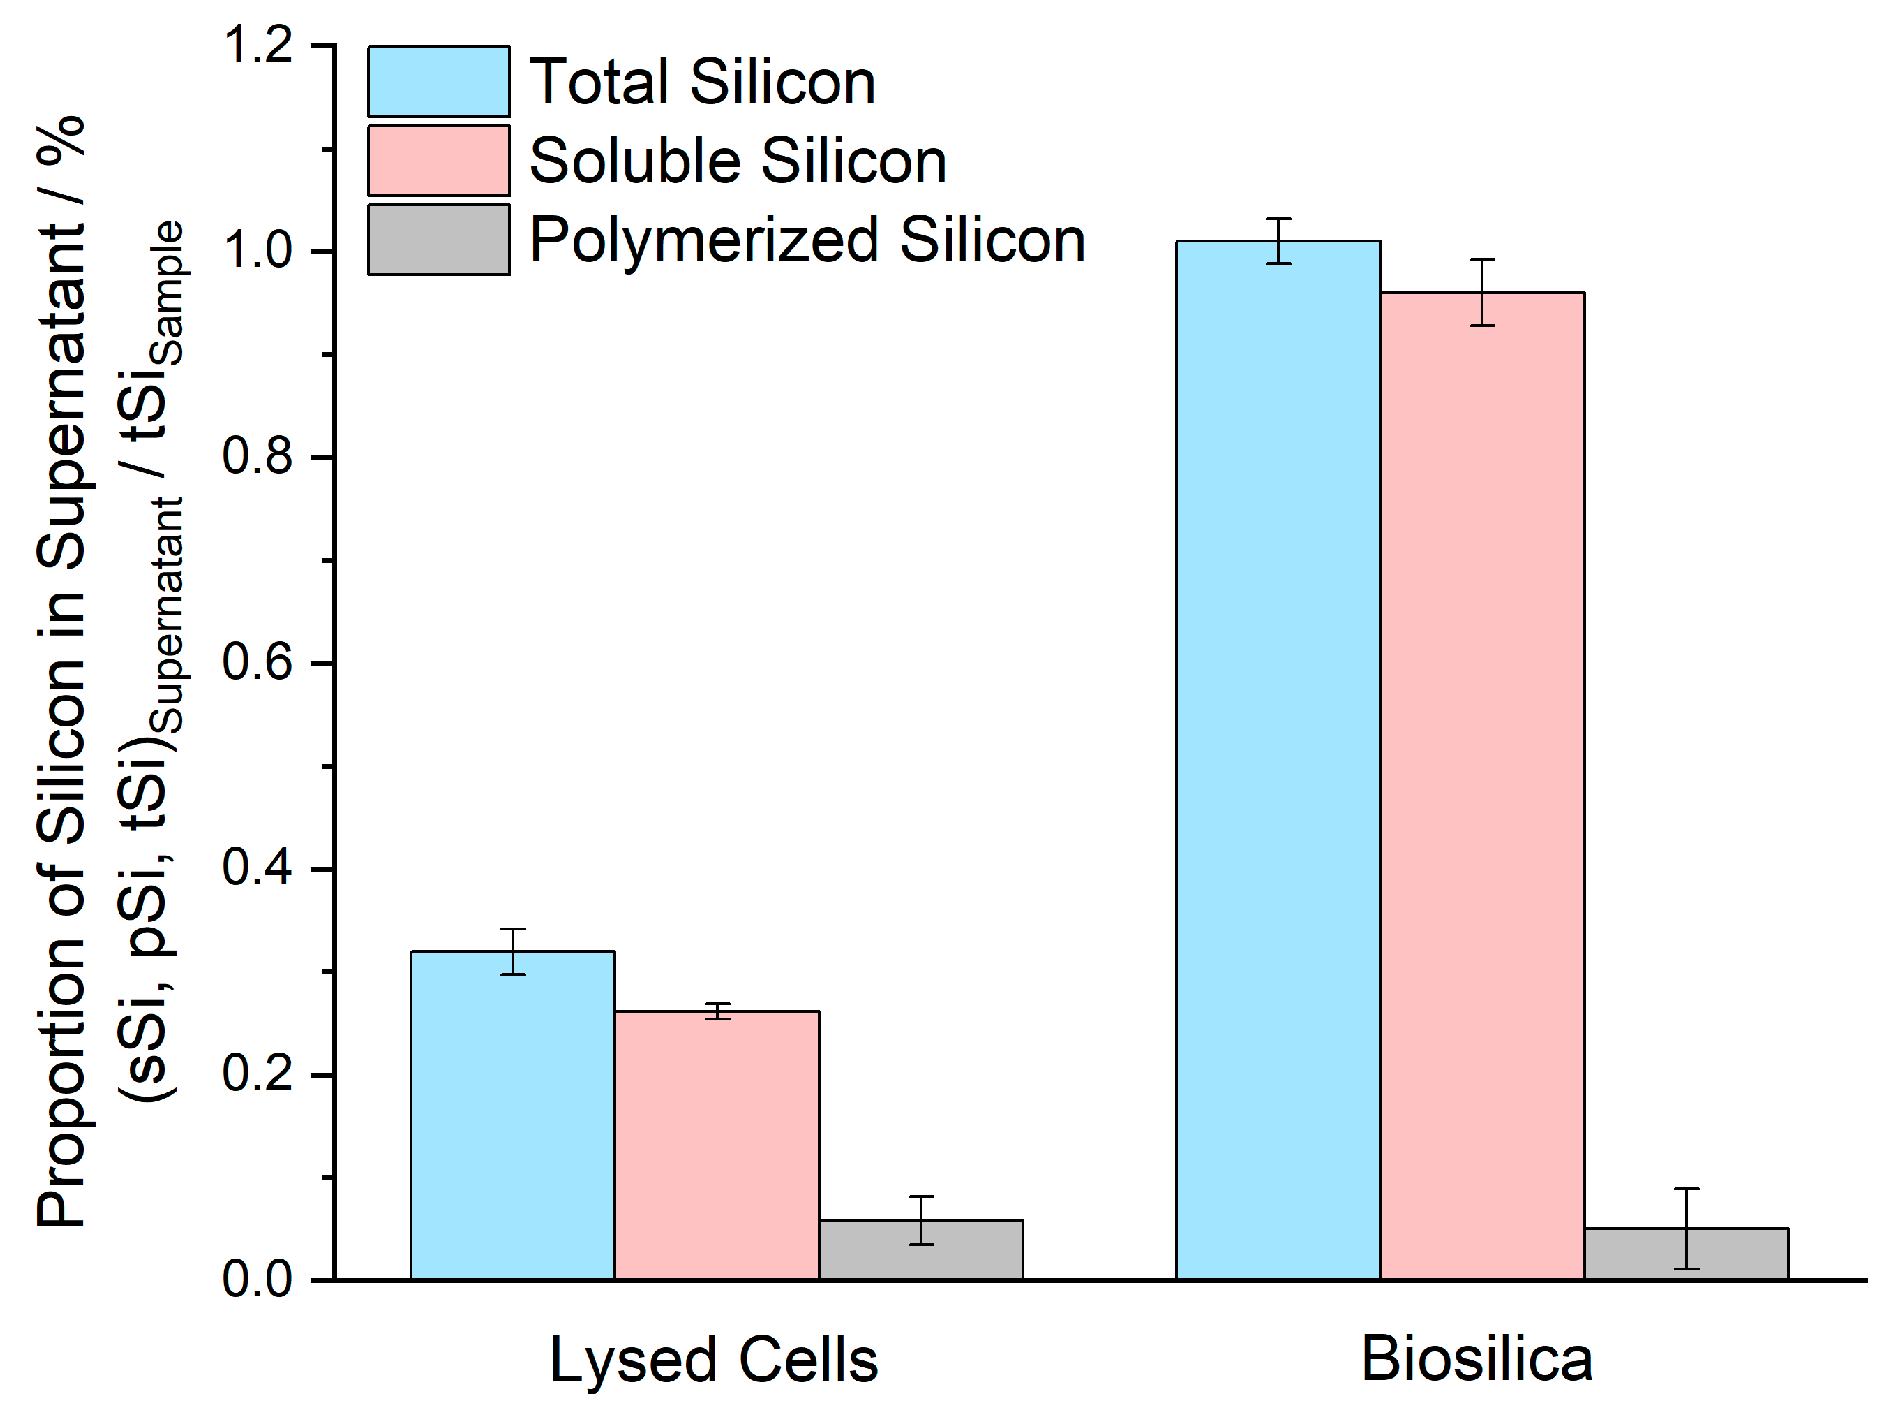
3.1. Cell Lysis, Differential Centrifugation and Silicon Quantification

In order to ensure the SSPs are as intact as possible with regard to chemical state, mechanical cell lysis was used instead of the previously established boiling procedure [29]. This was accomplished by using the bead-beating lysis method [21]. Bead beating also circumvents the leaching problem of the established boiling procedure. The lysed material was subsequently fractionated through differential centrifugation. The entire procedure is schematically described in Figure 2 and Figure 3. It was not only applied to freshly harvested cell material, but also to pre-extracted biosilica as reference material (cf. Figure 2) to evaluate the presence and amount of potentially bead-beating-produced cell wall fragments. This biosilica consists of purified cell walls without cytoplasmic material or loosely silica-attached biomolecules [60].
The quantification of the total amount of silicon in the samples (tSiSample) requires the optimization of digestion because all condensed silica must be transformed into mono- and disilicic acid to make it MBA-reactive. To evaluate the reliability of the chosen mild alkaline treatment, this digestion method was compared with the results of two previously established methods, AID and OID (cf. experimental section). These were used in previous studies to analyze silicon in complex organic matrices such as rice straw or sugar cane leaves [64,65]. Procedures were tested on exponentially grown cultures after cell lysis. Subsequent MBA gives tSi. Two aliquots were assayed and averaged to determine tSiSample. A set of standards in the range of 5–25 mM silicon were identically treated and analyzed for external calibration (cf. ESI; Figures S1–S3). The following mean values of tSiSample were obtained: mild digestion: 22.03 ± 0.08 fmol/cell; AID: 22.37 ± 0.17 fmol/cell; OID: 23.48 ± 0.84 fmol/cell. They are given as total silicon amount per cell. The error represents the difference between the measurements. The results of the three methods agree quite well. It can be concluded that the mild alkaline treatment is appropriate to digest the sample pellets obtained here from diatoms by making all cellular silicon accessible for analysis. This method was thus applied.

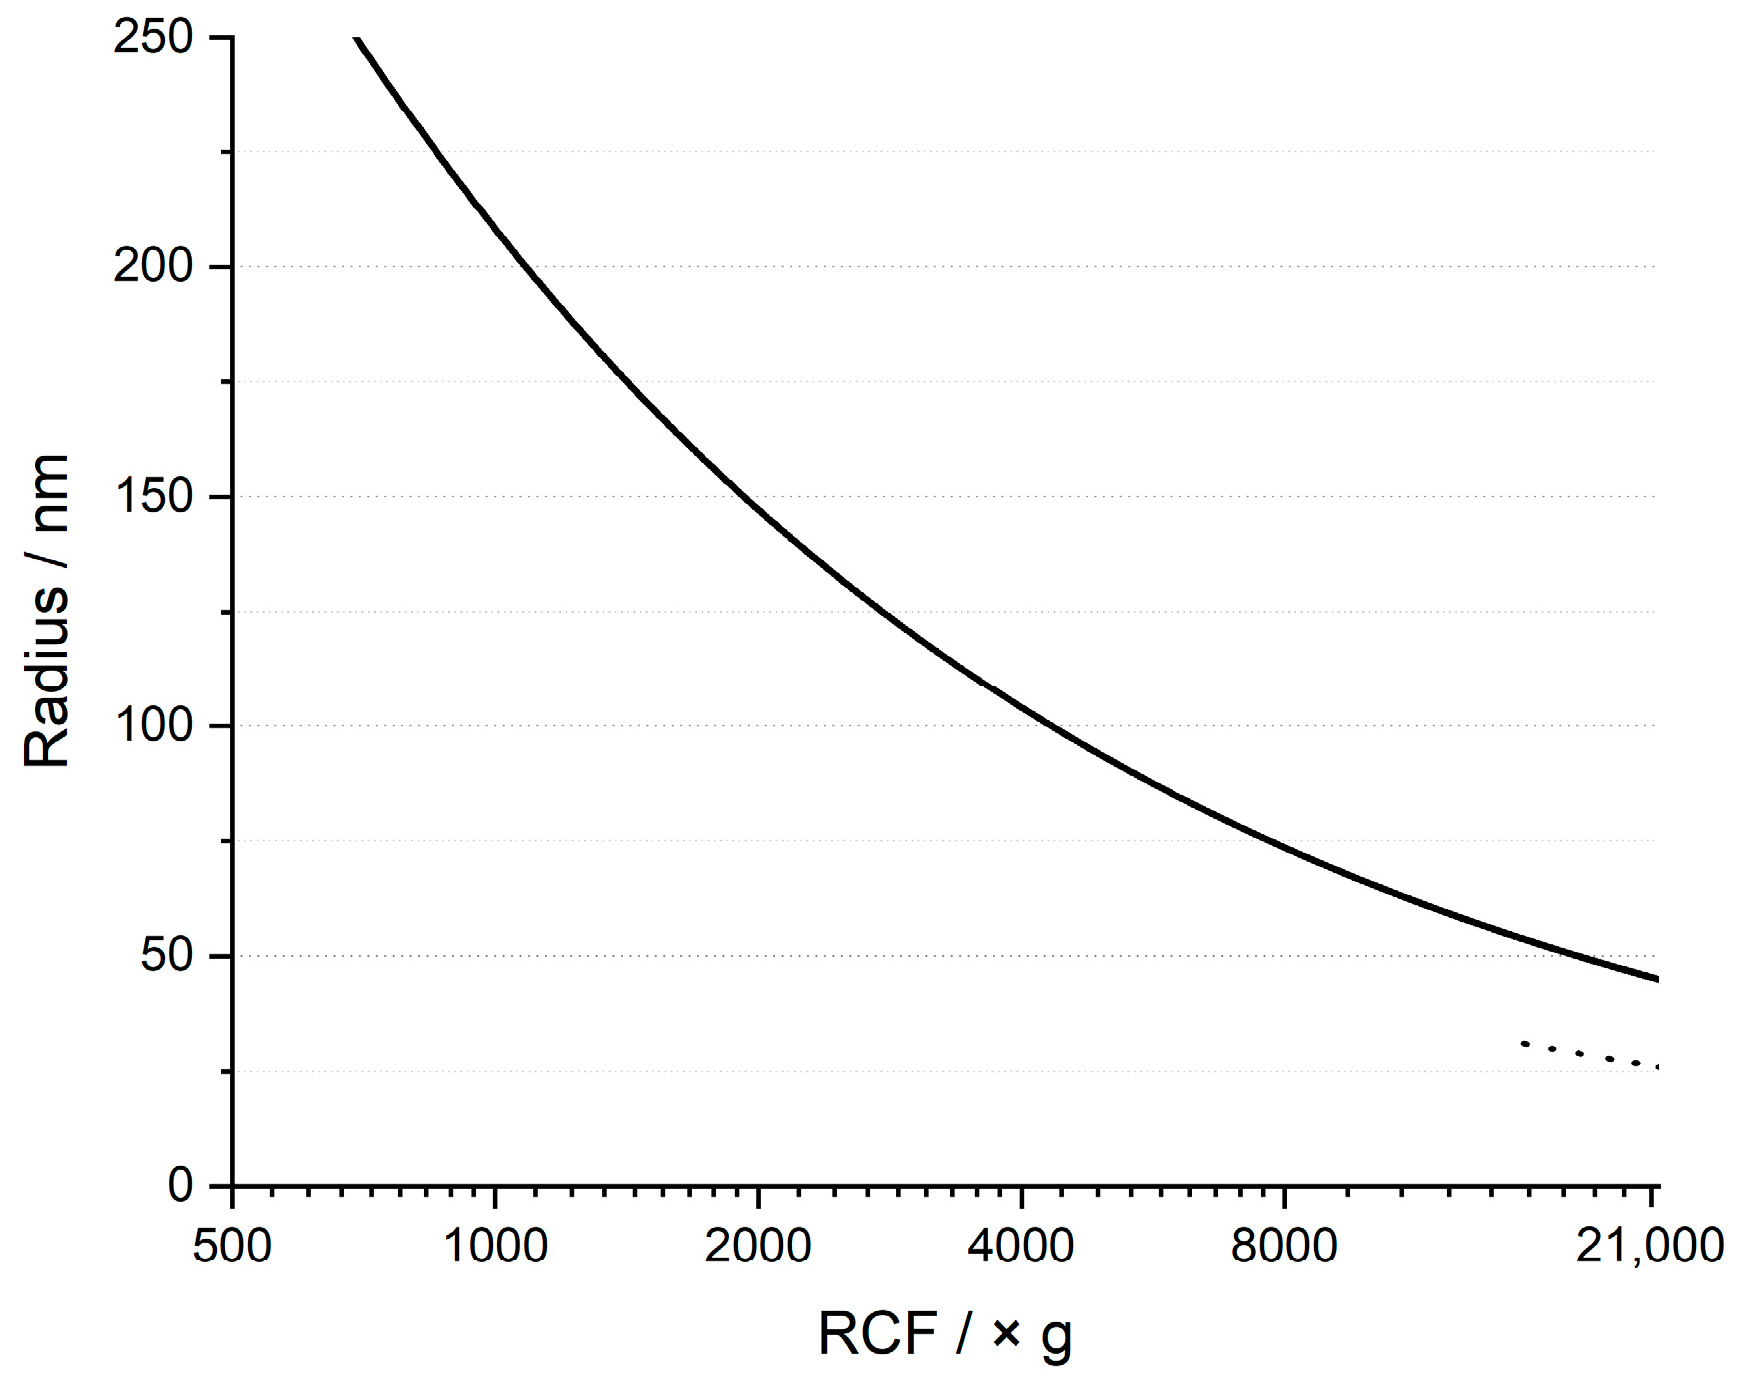
3.2. Sedimentation Behavior of Cells and Biosilica after Bead-Beating Treatment

Cells and pre-extracted biosilica samples underwent bead-beating treatment and were subjected to differential centrifugation. The whole procedure was performed with duplicates of each sample to prove its reproducibility. After the homogenization of the fractions, a set of three aliquots was taken. Internal standard solutions corresponding to concentration of 5 µM and 10 µM were admixed to two of the aliquots (standard addition). tSi was then determined by MBA after alkaline treatment. For details, see the experimental section. Figure 4 displays the ratio of tSiPellet/tSiSample measured for the different fractions as a function of RCF. Note the remarkably good reproducibility of these measurements, indicated by the small error bars.
About 90% of tSiSample for lysed cells and 99% of tSiSample of the biosilica were already sediment during the initial low-speed centrifugation step at 500× g. This shows that biosilica fragments caused by the bead beating are efficiently removed already at 1000× g RCF. We thus started our quantitative comparison of the two samples at 1000× g, where the biosilica was almost completely sedimented. All analyzed fractions for lysed cell material contain a higher amount of silicon than the biosilica fractions, as can be seen in Table 2. To correct for minor biosilica remnants, the difference between the two sedimentation curves was summed up in order to determine the total difference between the silicon content of lysed cells and biosilica, starting with the measurement at 1000× g. This total difference corresponds to ca. 9% of tSiSample of the cells. It should be emphasized that this represents the lower bound for SSPs because very large particles or Si species bound to large compartments may already sediment in the initial centrifugation step at 500× g along with the biosilica (cf. Figure 5 below).
The sedimentation behavior of particles or aggregates approximately follows Stokes´ law. Figure 5 shows the relationship between the maximum radius R of silica particles remaining in solution and the RCF calculated according to Equation (1) using the applied parameters during differential centrifugation. This estimation shows that silica particles must have a radius smaller than ca. 25 nm to remain dissolved in the final supernatant.
R   =     9 2   s   η t   g   p p     p f  
The symbols denote the following quantities: R = particle radius; s = path length; η = dynamic viscosity; t = time; g = gravitational acceleration; pp = density of the particle; and pf = density of the fluid.
The remaining supernatant after centrifugation at 21,000× g was finally assayed for the presence of sSi before alkaline treatment and total silicon content tSi after alkaline treatment. The difference between tSi and sSi corresponds to polymerized silica (pSi) such as oligomers larger than disilicic acid, silica nanoparticles, or supramolecular silica-containing agglomerates such as vesicles.
Figure 6 and Table 3 reveal that a rather small silicon fraction is found in the supernatant of lysed cells, namely about 0.3% of tSiSample.
Remarkably, the silicon concentration remaining in the final biosilica supernatant was more than three times higher than for lysed cells. This can be explained by the fact that biosilica extraction causes the removal of loosely bound biomolecules [60,70]. Extraction treatment is likely to also affect the organic layer covering the cell wall and protecting diatoms from silica dissolution. The affected organic layer makes the silica more accessible for the surrounding solvent and causes an enhanced solubility compared to the mechanically lysed cell material. This idea is supported by the IR spectra shown in Figure 7. As expected, protein-related bands [71] are weaker for extracted biosilica.

4. Discussion

The diatom species T. pseudonana was cultivated and analyzed with respect to the presence and amount of SSPs. Cell cultures were lysed by bead beating and then fractionated by differential centrifugation up to a final RCF of 21,000× g. This gentle procedure circumvents the previously established boiling-based extraction or other chemical treatment steps in order to minimize the leaching of biosilica and/or chemical modification of SSPs. Furthermore, the investigations were performed in a comparative manner by treating exponentially grown cells (lysed cells) and extracted, purified cell walls (biosilica) in parallel in order to correct for possible artifacts caused by the mechanical destruction of the biosilica. The obtained fractions were analyzed for total silicon content using molybdenum blue assay after alkaline treatment. It is shown that the results of this experimental procedure are very reproducible (cf. Table 2).
Biosilica was found to sediment efficiently at 500 × g. Beyond this RCF value, the sedimentation curves for the two samples, namely lysed cells and biosilica, clearly reveal the presence of SSPs because the pellets obtained for lysed cells always contain more silicon than the pre-extracted biosilica. Nevertheless, the silicon-containing components found in lysed cell material also sediment at relatively low RCF values. This observation strongly supports the idea that SSPs are rather large particles or agglomerates. According to the predicted sedimentation curve (cf. Figure 5), such agglomerates should have diameters in the order of one hundred nanometers or more. The association of SSPs with larger vesicles, cell compartments, or even the cell walls would be plausible hypotheses that should be tested in future experiments.
The sedimentation curves (Figure 4 in Section 3.2) allow the estimation of a lower bound for the intracellular SSPs. The differences between the silicon contents found for lysed cells and extracted cell walls (cf. Table 2) can be summed up for the various fractions, resulting in about 10% of the total silicon tSiSample. From tSiSample = 22 fmol per cell determined (Section 3.1), an intracellular SSP representing at least 2 fmol per cell was estimated. A mean cell volume of 85 femtoliter was derived from the microscopically determined cell dimensions assuming a cylindrical cell shape. With this mean cell volume, it follows that the total silicon concentration of T. pseudonana, including the cell wall biosilica, would correspond to a concentration of ca. 260 mM. Consequently, the intracellular SSPs (>10% of tSiSample) correspond to a silicon concentration of at least 26 mM. This is more than one order of magnitude beyond the solubility limit of 2 mM [42,43]. This means that the presence of SSPs is confirmed by the described experiments. However, the measured value is still significantly lower than the 140 ± 51 mM concentration determined previously for exponentially grown cells of the same strain CCMP 1335 [49]. It was thus concluded that significant parts of the SSPs already sediment at low centrifugal force together with the cell wall material, i.e., in the initial centrifugation step at 500× g, which further corroborates the above conclusion that SSPs should be part of large agglomerates or compartments.
The observation of relatively low amounts of molybdate-reactive soluble silicon after the final centrifugation step at 21,000× g excludes the presence of large SSPs in the form of free silicic acid. The soluble silicon detected by MBA in the final supernatant of lysed cells amounts to ca. 0.3% of the total cellular silicon (cf. Table 3 and Figure 6). From the total silicon amount, tSiSample = 22 fmol per cell, and the mean cell volume of 85 femtoliters (see above), a maximum intracellular silicic acid concentration of 0.8 mM was estimated. This concentration is well below the solubility limit of 2 mM at near-neutral pH (25 °C) and thus is chemically reasonable. The intracellular SSPs must consequently consist of originally non-molybdate reactive silicon such as the suggested larger and pre-condensed silica species.
It appears that future analytical work should focus on the components of pellets obtained at low RCF values. Separation may require centrifugation with an increased density of the solution or density gradients. Furthermore, future work should also employ analytical techniques such as mass spectrometry and 29Si NMR spectroscopy in order to characterize the chemical compositions and states of SSPs.

Supplementary Materials

The following supporting information can be downloaded at: https://www.mdpi.com/article/10.3390/min13050653/s1. Figure S1: External calibration curve for mild alkaline treatment; Figure S2: External calibration curve for autoclave-induced digestion (AID); Figure S3: External calibration curve for oven-induced digestion (OID); Figure S4: Molar absorption coefficients for mild alkaline treatment of the different samples obtained by standard addition.

Author Contributions

Conceptualization, E.B. and T.R.; methodology, T.R.; validation, T.B., P.-F.J. and T.R.; investigation, T.B., P.-F.J. and T.R.; writing—original draft preparation, T.R. and E.B.; writing—review and editing, T.R. and E.B.; supervision, T.R. and E.B.; project administration, E.B.; funding acquisition, E.B. All authors have read and agreed to the published version of the manuscript.

Funding

Financial support by the German Research Foundation (Deutsche Forschungsgemeinschaft, DFG, Project No. Br 1278/35-1) is gratefully acknowledged.

Data Availability Statement

The data presented in this study are available on request from the corresponding author.

Acknowledgments

The authors gratefully acknowledge Nils Kröger and Christoph Heintze for supplying axenic diatom cultures, Susanne Machill for helpful discussions and inspiration and Christiane Leudolph for support in the laboratory work.

Conflicts of Interest

The authors declare no conflict of interest.

References

  1. Armbrust, E.V. The life of diatoms in the world’s oceans. Nature 2009, 459, 185–192. [Google Scholar] [CrossRef] [PubMed]
  2. Butler, T.; Kapoore, R.V.; Vaidyanathan, S. Phaeodactylum tricornutum: A diatom cell factory. Trends biotechnol. 2020, 38, 606–622. [Google Scholar] [CrossRef] [PubMed]
  3. Sonak, S.; Patil, K.; Devi, P.; D’Souza, L. Causes, human health impacts and control of harmful algal blooms: A comprehensive review. Environ. Pollut. Prot. 2018, 3, 40–55. [Google Scholar] [CrossRef]
  4. Levitan, O.; Dinamarca, J.; Hochman, G.; Falkowski, P.G. Diatoms: A fossil fuel of the future. Trends biotechnol. 2014, 32, 117–124. [Google Scholar] [CrossRef] [PubMed]
  5. Merz, C.R.; Main, K.L. Microalgae (diatom) production—The aquaculture and biofuel nexus. In Proceedings of the 2014 Oceans—St. John’s, St. John’s, NL, Canada, 14–19 September 2014; pp. 1–10. [Google Scholar] [CrossRef]
  6. Yi, Z.; Xu, M.; Di, X.; Brynjolfsson, S.; Fu, W. Exploring valuable lipids in diatoms. Front. Mar. Sci. 2017, 4, 17. [Google Scholar] [CrossRef]
  7. Round, F.E.; Crawford, R.M.; Mann, D.G. The Diatoms; Cambridge University Press: Cambridge, UK, 1990. [Google Scholar] [CrossRef]
  8. Reka, A.A.; Smirnov, P.V.; Belousov, P.; Durmishi, B.; Abbdesettar, L.; Aggrey, P.; Kabra Malpani, S.; Idrizi, H. Diatomaceous earth: A literature review. J. Nat. Sci. Math. UT 2022, 7, 256–268. [Google Scholar]
  9. Wang, Y.; Cai, J.; Jiang, Y.; Jiang, X.; Zhang, D. Preparation of biosilica structures from frustules of diatoms and their applications: Current state and perspectives. Appl. Microbiol. Biotechnol. 2013, 97, 453–460. [Google Scholar] [CrossRef]
  10. Zhang, D.Y.; Wang, Y.; Zhang, W.Q.; Pan, J.F.; Cai, J. Enlargement of diatom frustules pores by hydrofluoric acid etching at room temperature. J. Mater. Sci. 2013, 46, 5665–5671. [Google Scholar] [CrossRef]
  11. Gurel, A.; Yildiz, A. Diatom communities, lithofacies characteristics and paleo environmental interpretation of Pliocene diatomite deposits in the lhlara–Selime plain (Aksaray, Central Anatolia, Turkey). J. Asian Earth Sci. 2007, 30, 170–180. [Google Scholar] [CrossRef]
  12. Losic, D. Diatom Nanotechnology: Progress and Emerging Applications; The Royal Society of Chemistry: London, UK, 2018. [Google Scholar] [CrossRef]
  13. Losic, D.; Rosengarten, G.; Mitchell, J.G.; Voelcker, N.H. Pore architecture of diatom frustules: Potential nanostructured membranes for molecular and particle separations. J. Nanosci. Nanotechnol. 2006, 6, 982–988. [Google Scholar] [CrossRef]
  14. Grimann, M.; Fuhrmann-Lieker, T. Biological Photonic Crystals. In Organic and Hybrid Photonic Crystals; Comoretto, D., Ed.; Springer: Cham, Switzerland, 2015; pp. 57–74. [Google Scholar] [CrossRef]
  15. Kröger, N.; Brunner, E. Complex-Shaped Microbial Biominerals for Nanotechnology. WIREs Nanomed. Nanobiotechnol. 2014, 6, 615–627. [Google Scholar] [CrossRef] [PubMed]
  16. Tramontano, C.; Chianese, G.; Terracciano, M.; de Stefano, L.; Rea, I. Nanostructured biosilica of diatoms: From water world to biomedical applications. Appl. Sci. 2020, 10, 6811. [Google Scholar] [CrossRef]
  17. Saoud, H.A.A.; Sprynskyy, M.; Pashaei, R.; Kawalec, M.; Pomastowski, P.; Buszewski, B. Diatom biosilica: Source, physical-chemical characterization, modification, and application. J. Sep. Sci. 2022, 45, 3362–3376. [Google Scholar] [CrossRef] [PubMed]
  18. Zobi, F. Diatom Biosilica in Targeted Drug Delivery and Biosensing Applications: Recent Studies. Micro 2022, 2, 342–360. [Google Scholar] [CrossRef]
  19. Perry, C.C.; Keeling-Tucker, T. Biosilicification: The role of the organic matrix in structure control. J. Biol. Inorg. Chem. 2000, 5, 537–550. [Google Scholar] [CrossRef] [PubMed]
  20. Kolbe, F.; Brunner, E. Silicic acid uptake and storage by diatoms. In The Molecular Life of Diatoms, 1st ed.; Falciatore, A., Mock, T., Eds.; Springer: Cham, Switzerland, 2022; p. 349. [Google Scholar] [CrossRef]
  21. Heintze, C.; Formanek, P.; Pohl, D.; Hauptstein, J.; Rellinghaus, B.; Kröger, N. An intimate view into the silica deposition vesicles of diatoms. BMC Mater. 2020, 2, 11. [Google Scholar] [CrossRef]
  22. Lewin, J.C. Silicon metabolism in diatoms. II. Sources of silicon for growth of Navicula pelliculosa. Plant Physiol. 1955, 30, 129–134. [Google Scholar] [CrossRef]
  23. Lewin, J.C. Silicon metabolism in diatoms: III. Respiration and silicon uptake in Navicula pelliculosa. J. Gen. Physiol. 1955, 39, 1–10. [Google Scholar] [CrossRef]
  24. Azam, F.; Hemmingsen, B.B.; Volcani, B.E. Role of silicon in diatom metabolism. V. Silicic acid transport and metabolism in the heterotrophic diatom Nitzschia Alba. Arch. Microbiol. 1974, 97, 103–114. [Google Scholar] [CrossRef]
  25. Azam, F. Silicic-acid uptake in diatoms studied with [68Ge]germanic acid as tracer. Planta 1974, 121, 205–212. [Google Scholar] [CrossRef]
  26. Sullivan, C.W. Diatom mineralization of silicic acid. I. Si(OH)4 transport characteristics in Navicula Pelliculosa. J. Phycol. 1976, 12, 390–396. [Google Scholar] [CrossRef]
  27. Sullivan, C.W. Diatom mineralization of silicic acid. V. Energetic and macromolecular requirements for Si(OH)4 mineralization events during the cell cycle of Navicula Pelliculosa. J. Phycol. 1980, 16, 321–328. [Google Scholar] [CrossRef]
  28. Blank, G.S.; Sullivan, C.W. Diatom mineralization of silicic acid: III. Si(OH)4 binding and light dependent transport in Nitzschia angularis. Arch. Microbiol. 1979, 123, 157–164. [Google Scholar] [CrossRef]
  29. Sullivan, C.W. Diatom mineralization of silicic acid. IV. Kinetics of soluble Si pool formation in exponentially growing and synchronized Navicula Pelliculosa. J. Phycol. 1979, 15, 210–216. [Google Scholar] [CrossRef]
  30. Hildebrand, M. Diatoms, biomineralization processes, and genomics. Chem. Rev. 2008, 108, 4855–4874. [Google Scholar] [CrossRef] [PubMed]
  31. Hildebrand, M.; Volcani, B.E.; Gassmann, W.; Schroeder, J.I. A gene family of silicon transporters. Nature 1997, 385, 688–689. [Google Scholar] [CrossRef]
  32. Hildebrand, M.; Dahlin, K.; Volcani, B.E. Characterization of a silicon transporter gene family in Cylindrotheca fusiformis: Sequences, expression analysis, and identification of homologs in other diatoms. Mol. Gen. Genet. MGG 1998, 260, 480–486. [Google Scholar] [CrossRef]
  33. Thamatrakoln, K.; Hildebrand, M. Analysis of Thalassiosira pseudonana silicon transporters indicates distinct regulatory levels and transport activity through the cell cycle. Eukaryot. Cell 2007, 6, 271–279. [Google Scholar] [CrossRef]
  34. Knight, M.J.; Senior, L.; Nancolas, B.; Ratcliffe, S.; Curnow, P. Direct evidence of the molecular basis for biological silicon transport. Nat. Commun. 2016, 7, 11926. [Google Scholar] [CrossRef]
  35. Thamatrakoln, K.; Hildebrand, M. Approaches for functional characterization of diatom silicic acid transporters. J. Nanosci. Nanotechnol. 2005, 5, 158–166. [Google Scholar] [CrossRef]
  36. Thamatrakoln, K.; Hildebrand, M. Silicon uptake in diatoms revisited: A model for saturable and nonsaturable uptake kinetics and the role of silicon transporters. Plant Physiol. 2008, 146, 1397–1407. [Google Scholar] [CrossRef] [PubMed]
  37. Brasser, H.J.; van der Strate, H.J.; Gieskes, W.W.C.; Krijger, G.C.; Vrieling, E.G.; Wolterbeek, H.T. Compartmental analysis suggests macropinocytosis at the onset of diatom valve formation. Silicon 2012, 4, 39–49. [Google Scholar] [CrossRef]
  38. Vrieling, E.G.; Sun, Q.; Tian, M.; Kooyman, P.J.; Gieskes, W.W.C.; van Santen, R.A.; Sommerdijk, N.A.J.M. Salinity-dependent diatom biosilicification implies an important role of external ionic strength. Proc. Natl. Acad. Sci. USA 2007, 104, 10441–10446. [Google Scholar] [CrossRef] [PubMed]
  39. Annenkov, V.V.; Gordon, R.; Zelinskiy, S.N.; Danilovtseva, E.N. The probable mechanism for silicon capture by diatom algae: Assimilation of polycarbonic acids with diatoms—Is endocytosis a key stage in building of siliceous frustules? J. Phycol. 2020, 56, 1729–1737. [Google Scholar] [CrossRef]
  40. Thamatrakoln, K.; Kustka, A.B. When to say when: Can excessive drinking explain silicon uptake in diatoms? BioEssays 2009, 31, 322–327. [Google Scholar] [CrossRef]
  41. Tréguer, P.; Nelson, D.M.; Van Bennekom, A.J.; DeMaster, D.J.; Leynaert, A.; Quéguiner, B. The silica balance in the world ocean: A reestimate. Science 1995, 268, 375–379. [Google Scholar] [CrossRef]
  42. Iler, R.K. The Chemistry of Silica: Solubility, Polymerization, Colloid and Surface Properties and Biochemistry of Silica; John Wiley & Sons Ltd.: New York, NY, USA, 1979. [Google Scholar] [CrossRef]
  43. Morey, G.W.; Fournier, R.O.; Rowe, J.J. The solubility of amorphous silica at 25 °C. J. Geophys. Res. 1964, 69, 1995–2002. [Google Scholar] [CrossRef]
  44. Coombs, J.; Darley, W.M.; Holm-Hansen, O.; Volcani, B.E. Studies on the biochemistry and fine structure of silica shell formation in diatoms. Chemical composition of Navicula pelliculosa during silicon-starvation synchrony. Plant Physiol. 1967, 42, 1601–1606. [Google Scholar] [CrossRef]
  45. Binder, B.J.; Chisholm, S.W. Changes in the soluble silicon pool size in the marine diatom Thalassiosira weissflogii. Mar. Biol. Lett. 1980, 1, 205–212. [Google Scholar]
  46. Brzezinski, M.A.; Conley, D.J. Silicon deposition during the cell cycle of Thalassiosira weissflogii (Bacillariophyceae) determined using dual rhodamine 123 and propidium iodide staining. J. Phycol. 1994, 30, 45–55. [Google Scholar] [CrossRef]
  47. Martin-Jézéquel, V.; Hildebrand, M.; Brzezinski, M.A. Silicon metabolism in diatoms: Implications for growth. J. Phycol. 2000, 36, 821–840. [Google Scholar] [CrossRef]
  48. Chisholm, S.W.; Azam, F.; Eppley, R.W. Silicic acid incorporation in marine diatoms on light:dark cycles: Use as an assay for phased cell division. Limnol. Oceanogr. 1978, 23, 518–529. [Google Scholar] [CrossRef]
  49. Kumar, S.; Rechav, K.; Kaplan-Ashiri, I.; Gal, A. Imaging and quantifying homeostatic levels of intracellular silicon in diatoms. Sci. Adv. 2020, 6, eaaz7554. [Google Scholar] [CrossRef] [PubMed]
  50. Kinrade, S.D.; Gillson, A.M.; Knight, C.T. Silicon-29 NMR evidence of a transient hexavalent silicon complex in the diatom Navicula pelliculosa. J. Chem. Soc. Dalton Trans. 2002, 3, 307–309. [Google Scholar] [CrossRef]
  51. Werner, D. Die Kieselsäure im Stoffwechsel von Cyclotella cryptica Reimann, Lewin und Guillard. Arch. Mikrobiol. 1966, 55, 278–308. [Google Scholar] [CrossRef]
  52. Spinthaki, A.; Demadis, K.D. Modeling Silicon Pools in Diatoms Using the Chemistry Toolbox. In Diatom Morphogenesis; Wiley Online Library: Hoboken, NJ, USA, 2021; pp. 365–382. [Google Scholar] [CrossRef]
  53. Kröger, N.; Deutzmann, R.; Bergsdorf, C.; Sumper, M. Species-specific polyamines from diatoms control silica morphology. Proc. Natl. Acad. Sci. USA 2000, 97, 14133–14138. [Google Scholar] [CrossRef]
  54. Bridoux, M.C.; Keil, R.G.; Ingalls, A.E. Analysis of natural diatom communities reveals novel insights into the diversity of long chain polyamine (LCPA) structures involved in silica precipitation. Org. Geochem. 2012, 47, 9–21. [Google Scholar] [CrossRef]
  55. Gröger, C.; Sumper, M.; Brunner, E. Silicon uptake and metabolism of the marine diatom Thalassiosira pseudonana: Solid-state 29Si NMR and fluorescence microscopic studies. J. Struct. Biol. 2008, 161, 55–63. [Google Scholar] [CrossRef]
  56. Brunner, E.; Gröger, C.; Lutz, K.; Richthammer, P.; Spinde, K.; Sumper, M. Analytical studies of silica biomineralization: Towards an understanding of silica processing by diatoms. Appl. Microbiol. Biotechnol. 2009, 84, 607–616. [Google Scholar] [CrossRef]
  57. Schmid, A.M.M.; Schulz, D. Wall morphogenesis in diatoms: Deposition of silica by cytoplasmic vesicles. Protoplasma 1979, 100, 267–288. [Google Scholar] [CrossRef]
  58. Sullivan, C.W. Silicification by diatoms. In Ciba Foundation Symposium 121-Silicon Biochemistry: Silicon Biochemistry: Ciba Foundation Symposium 121; Evered, D., O’Connor, M., Eds.; John Wiley & Sons Ltd.: Chichester, UK, 2007; p. 64. [Google Scholar] [CrossRef]
  59. Grachev, M.A.; Bedoshvili, Y.D.; Gerasimov, E.Y.; Zaikovskii, V.I.; Gneusheva, K.V.; Likhoshway, Y.V. Silica-containing inclusions in the cytoplasm of diatom Synedra acus. Dokl. Biochem. Biophys. 2017, 472, 44–48. [Google Scholar] [CrossRef] [PubMed]
  60. Kröger, N.; Bergsdorf, C.; Sumper, M. A new calcium binding glycoprotein family constitutes a major diatom cell wall component. EMBO J. 1994, 13, 4676–4683. [Google Scholar] [CrossRef] [PubMed]
  61. Harrison, P.J.; Waters, R.E.; Taylor, F.J.R. A broad spectrum artificial medium for coastal and open ocean phytoplankton. J. Phycol. 1980, 16, 28–35. [Google Scholar] [CrossRef]
  62. Bunting, W.E. Determination of soluble silica in very low concentrations. Ind. Eng. Chem. Anal. Ed. 1944, 16, 612–615. [Google Scholar] [CrossRef]
  63. Koistinen, J.; Sjöblom, M.; Spilling, K. Determining dissolved and biogenic silica. In Biofuels from Algae; Spilling, K., Ed.; Humana: New York, NY, USA, 2018; pp. 95–101. [Google Scholar] [CrossRef]
  64. Elliott, C.L.; Snyder, G.H. Autoclave-induced digestion for the colorimetric determination of silicon in rice straw. J. Agric. Food Chem. 1991, 39, 1118–1119. [Google Scholar] [CrossRef]
  65. Kraska, J.E.; Breitenbeck, G.A. Simple, robust method for quantifying silicon in plant tissue. Commun. Soil Sci. Plant Anal. 2010, 41, 2075–2085. [Google Scholar] [CrossRef]
  66. Clissold, F.J.; Clark, X.; Savage, T.; Simpson, S.J. A rapid, precise and low-cost method to quantify silicon for the determination of food intake and utilisation for insect herbivores. Austral Entomol. 2018, 57, 220–227. [Google Scholar] [CrossRef]
  67. Coradin, T.; Eglin, D.; Livage, J. The silicomolybdic acid spectrophotometric method and its application to silicate/biopolymer interaction studies. Spectroscopy 2004, 18, 567–576. [Google Scholar] [CrossRef]
  68. Truesdale, V.W.; Smith, C.J. The spectrophotometric characteristics of aqueous solutions of α- and β-molybdosilicic acids. Analyst 1975, 100, 797–805. [Google Scholar] [CrossRef]
  69. Truesdale, V.W.; Smith, P.J.; Smith, C.J. Kinetics of α- and β-molybdosilicic acid formation. Analyst 1979, 104, 897–918. [Google Scholar] [CrossRef]
  70. Hildebrand, M.; Lerch, S.J.; Shrestha, R.P. Understanding diatom cell wall silicification—Moving forward. Front. Mar. Sci. 2018, 5, 125. [Google Scholar] [CrossRef]
  71. Barth, A. Infrared spectroscopy of proteins. Biochim. Biophys. Acta (BBA)-Bioenerg. 2007, 1767, 1073–1101. [Google Scholar] [CrossRef] [PubMed]
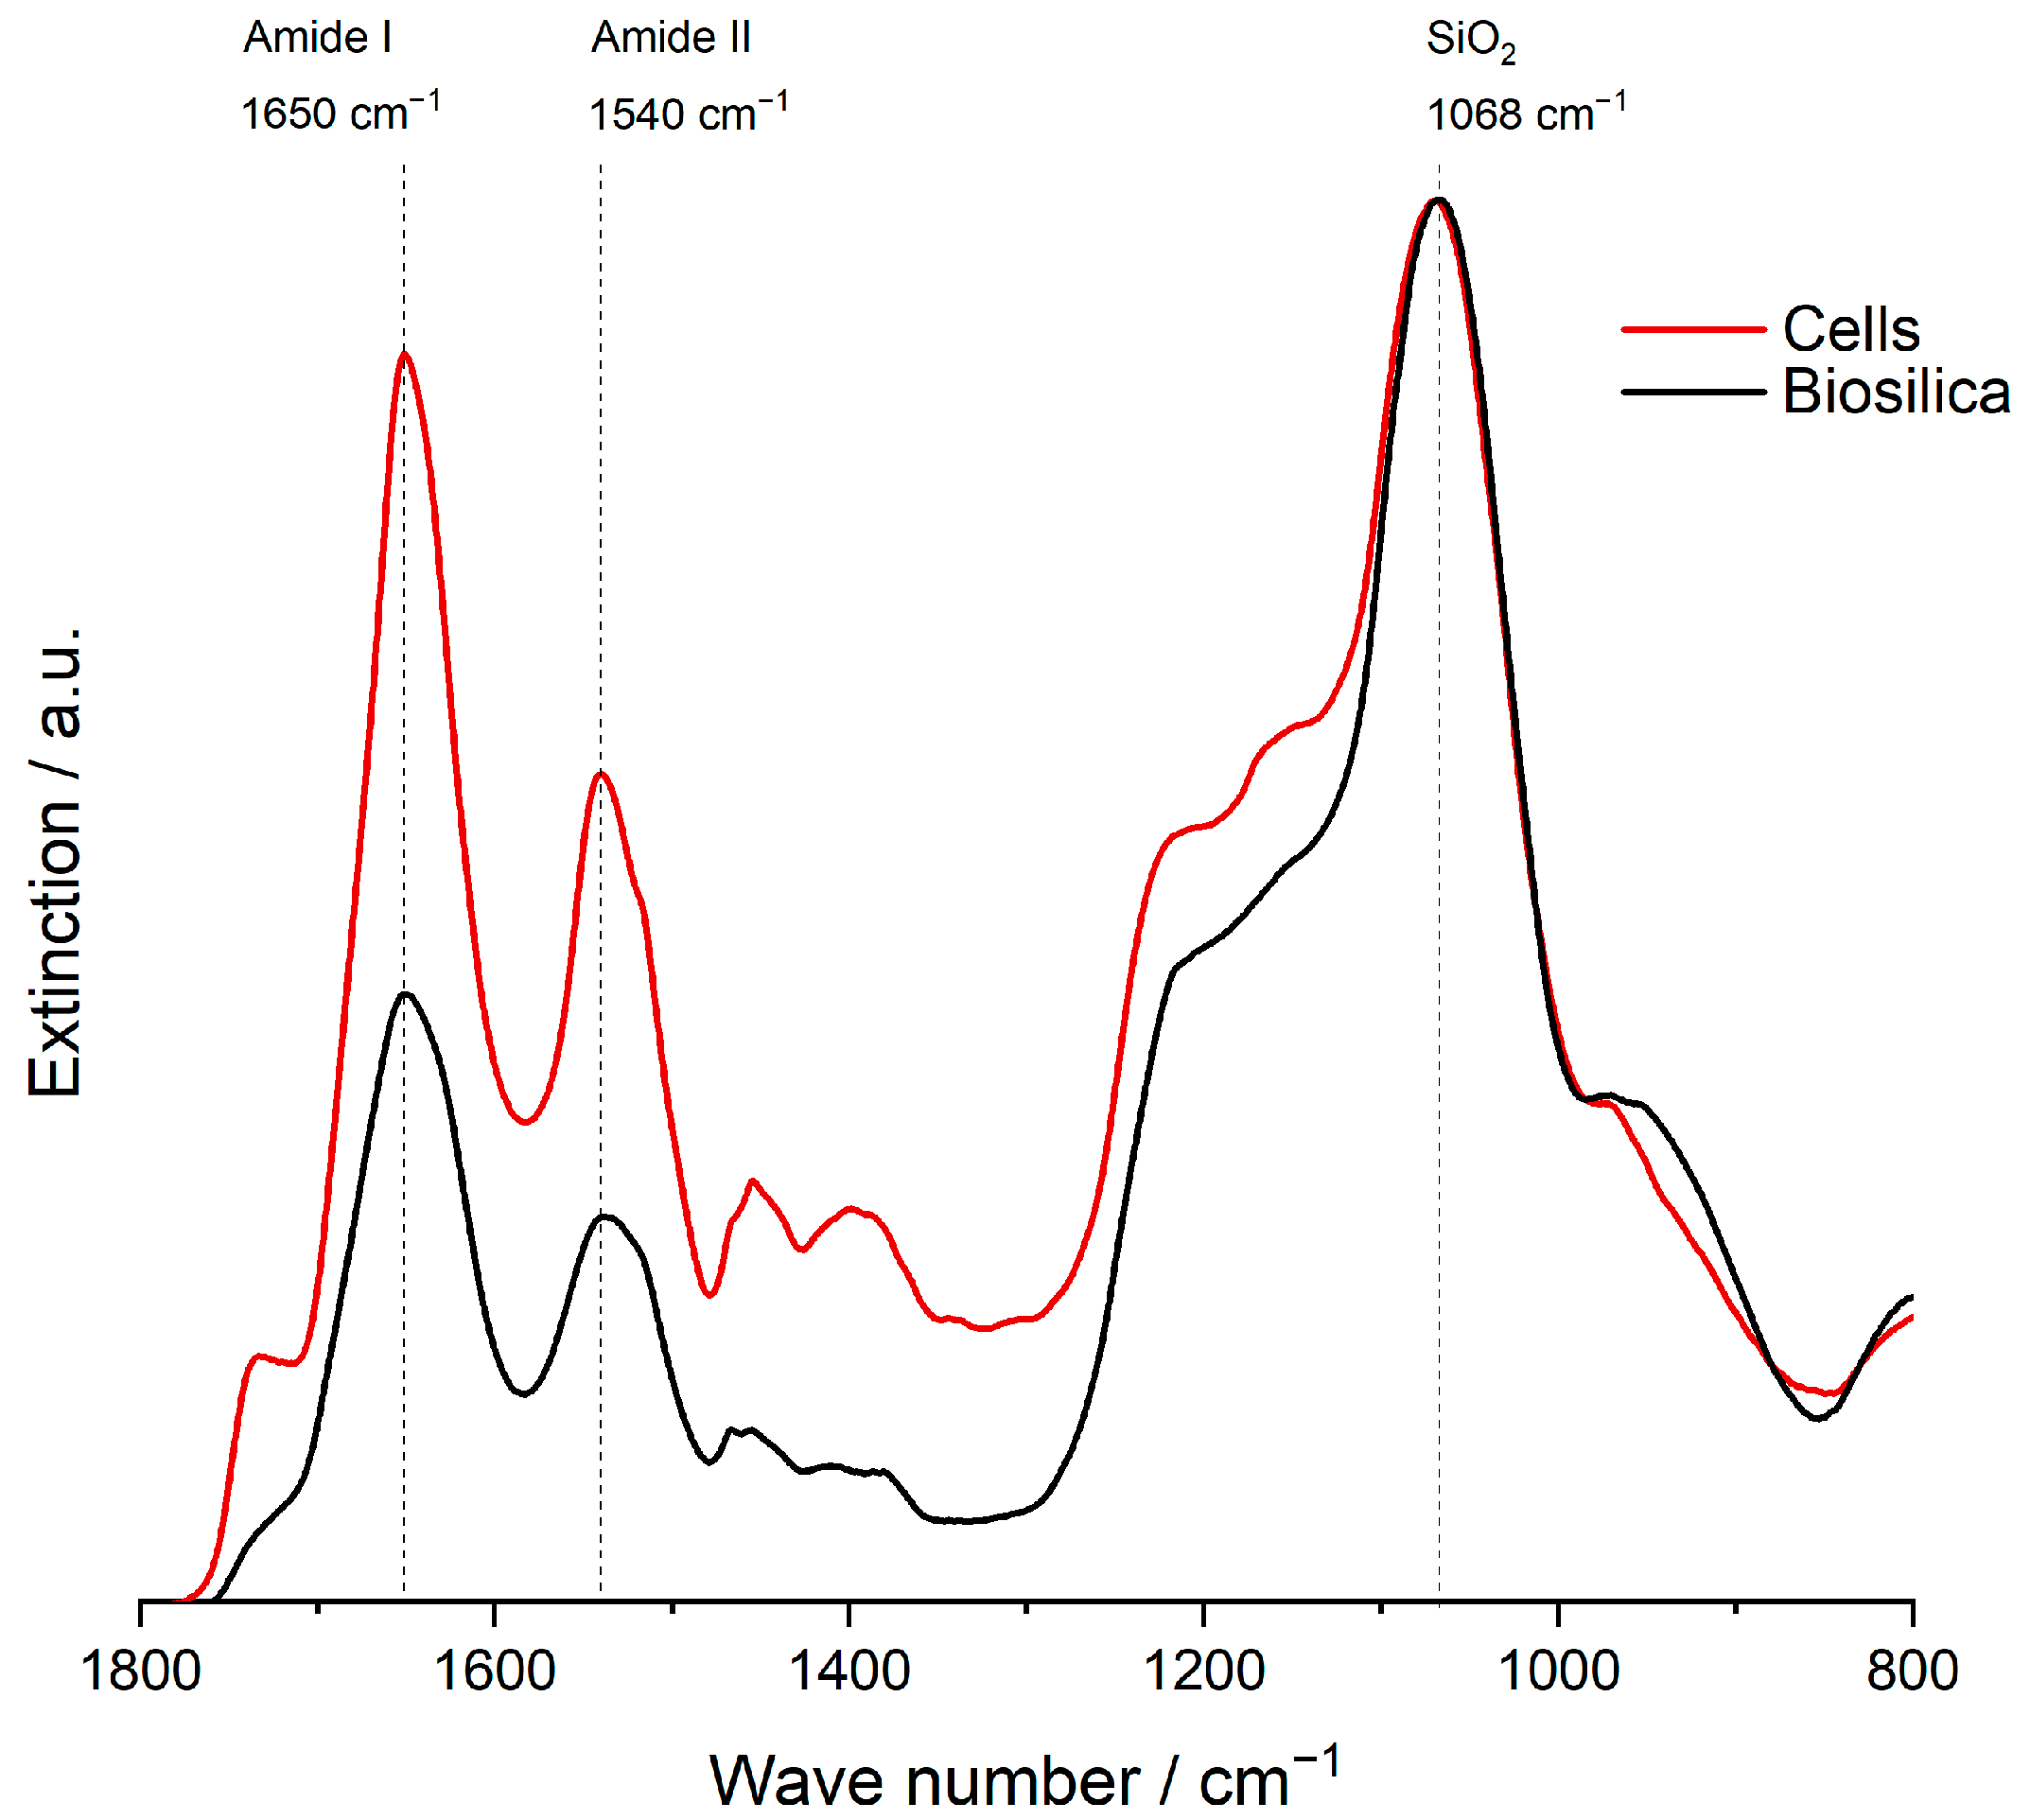
  72. Kammer, M.; Hedrich, R.; Ehrlich, H.; Popp, J.; Brunner, E.; Krafft, C. Spatially resolved determination of the structure and composition of diatom cell walls by Raman and FTIR imaging. Anal. Bioanal. Chem. 2010, 398, 509–517. [Google Scholar] [CrossRef] [PubMed]
Figure 1. Scheme of a dividing diatom cell. Cell wall synthesis takes place in a specialized compartment, the silicon deposition vesicle (SDV). Monosilicic acid is taken up from the sea water via silicic acid transport (SIT) proteins and/or direct penetration/pinocytosis across the outer cell membrane. Intracellular processing of silicon is not yet understood completely. Several diatom species are reported to exhibit rather huge internal silicon storage pools (SSPs). Silicon transport vesicles (STVs) are sometimes hypothesized to explain the transport of silicon into the SDV. Reproduced with permission of the Copyright holder from Kolbe and Brunner [20]. Copyright 2022 Springer.
Minerals 13 00653 g001
Figure 2. Scheme explaining the experimental approach of the present comparative study. Cell disruption by bead beating was followed using fractionation with differential centrifugation. The procedure was performed in parallel with the harvested intact cells and pre-extracted biosilica. Silicon quantification was then applied to both pellet fractions after alkaline treatment. The silicon concentrations found for pre-extracted biosilica are attributable to cell wall fragments produced by bead beating. The difference between the two materials provides information on the amount of silicon attributable to intracellular Si. The MBA of supernatants provides the remaining dissolved silicon concentration.
Minerals 13 00653 g002
Figure 3. Differential centrifugation procedure. Framed samples were analyzed for tSi with MBA after alkaline treatment. The supernatant remaining after the last centrifugation step at 21,000× g was also analyzed for sSi by MBA without alkaline treatment.
Minerals 13 00653 g003
Figure 4. Differential centrifugation of cells lysed by bead beating and pre-extracted biosilica after identical bead-beating treatments. The graph displays the tSiPellet/tSiSample ratio measured in % for the different fractions as a function of RCF in multiples of g. Error bars: Lysis and differential centrifugation was performed twice, so that two samples were obtained for each fraction. All measurements were performed in parallel on these two sample sets. The error bars represent the difference between the two samples A and B (cf. Table 2) obtained for each fraction by standard addition. Plotted data points are the average values.
Minerals 13 00653 g004
Figure 5. Predicted sedimentation curve. Silica particles with a radius above the line were completely sedimented during differential centrifugation according to Stokes´ law. Parameters: Time = 5 min; path length = 1.5 cm; dynamic viscosity at 4 °C = 1.5673 mPa·s; density of the particle = 2.3 g/mL. Dotted line: Time = 15 min.
Minerals 13 00653 g005
Figure 6. Total, soluble, and polymerized silicon in the supernatant after centrifugation at 21,000× g. Error bars: Lysis and differential centrifugation was performed twice, so that two samples were obtained for each fraction. All measurements were performed in parallel on these two sample sets. The error bars represent the range between the two values obtained for each fraction by standard addition.
Minerals 13 00653 g006
Figure 7. ATR-FT-IR spectra of freeze-dried cells and biosilica. Indicative bands are marked by vertical dotted lines. Spectra are normalized to the antisymmetric O-Si-O stretching vibration at 1069 cm−1, representative of silica [72]. Intensities of amide bands at 1650 cm−1 and 1540 cm−1 semi-quantitatively reflect the protein content [71], specifically at the material’s surface because the spectra are measured in reflection mode (ATR).
Minerals 13 00653 g007
Table 1. Routine for differential centrifugation.
RCF
× g
Time
min
Centrifuged Volume
µL
Supernatant
µL
Pellet
µL
500514001200200 a
1000512001100100 b
200051100105050 b
400051050100050 b
80005100095050 b
21,0001595090050 b,c
a not analyzed; b analyzed for total silicon; c analyzed for soluble silicon.
Table 2. Total silicon in the pellet fractions of cells and biosilica. Note that the measurements were repeated (samples A and B).
RCF
× g
tSiPellet/tSiSample
in %, Lysed Cells
tSiPellet/tSiSample
in %, Biosilica
Sample ASample BAverageSample ASample BAverage
10006.635.976.301.150.700.92
20002.291.852.070.220.160.19
40000.940.840.890.100.210.16
80000.390.320.360.060.060.06
21,0000.170.130.150.040.040.04
Sum10.419.119.761.571.171.37
Table 3. Total (tSi), soluble (sSi) and polymerized (pSi) silicon in the supernatant after centrifugation at 21,000× g given in % of the total silicon content of integer cells (tSiSample).
Silicon in
Supernatant
Lysed Cells
% of tSisample
Biosilica
% of tSiSample
Sample ASample BAverageSample ASample BAverage
tSi0.340.300.320.991.031.01
sSi0.270.250.260.930.990.96
pSi a0.070.040.060.060.040.05
a tSi − sSi = polymerized silicon.
Disclaimer/Publisher’s Note: The statements, opinions and data contained in all publications are solely those of the individual author(s) and contributor(s) and not of MDPI and/or the editor(s). MDPI and/or the editor(s) disclaim responsibility for any injury to people or property resulting from any ideas, methods, instructions or products referred to in the content.

