Article

Fluid Evolution and Ore Genesis of the Songjianghe Au Deposit in Eastern Jilin Province, NE China: Constraints from Fluid Inclusions and H-O-S-Pb Isotope Systematics

1
College of Earth Sciences, Jilin University, Changchun 130061, China
2
Geological Survey Institute of Jilin Province, Changchun 130102, China
3
College of Geology and Mining Engineering, Xinjiang University, Urumqi 830047, China
4
Team 603 of Jilin Nonferrous Metal Geological Exploration Bureau, Yanji 133300, China
*
Author to whom correspondence should be addressed.
Minerals 2023, 13(5), 652; https://doi.org/10.3390/min13050652
Submission received: 25 March 2023 / Revised: 10 April 2023 / Accepted: 6 May 2023 / Published: 9 May 2023
(This article belongs to the Special Issue Genesis and Metallogeny of Non-ferrous and Precious Metal Deposits)

Abstract

:
The medium-sized Songjianghe Au deposit is located in the southeastern part of the Jiapigou-Haigou gold belt (JHGB) in central eastern Jilin Province, NE China. The gold mineralization is primarily characterized by disseminated-style ores and hosted in the low-/medium-grade metamorphic rocks of the Seluohe Group. The ore bodies are governed by NNW-striking brittle-ductile structures and spatially correlated with silicic and sericitic alterations. Four alteration/mineralization stages have been distinguished: (I) Quartz-pyrrhotite-pyrite, (II) quartz-polymetallic sulfides, (III) quartz-pyrite, and (IV) quartz-calcite. The fluid inclusion (FI) assemblage in quartz from Stage I comprises C1-type, C2-type, C3-type, and VL-type FIs, with total homogenization temperatures (Th-total) of 292.8 to 405.6 °C and salinities of 2.8 to 9.3 wt% NaCl eqv. Quartz from Stage II (main ore stage) developed C2-, C3-, and VL-type FIs, with a Th-total of 278.5 to 338.9 °C and salinities of 2.8 to 8.1 wt% NaCl eqv. Stage III is characterized by coexisting C3- and VL-type FIs in quartz, with a Th-total of 215.9 to 307.3 °C and salinities of 2.4 to 7.2 wt% NaCl eqv. Only VL-type FIs are observed in Stage IV, with a Th-total of 189.5 to 240.4 °C and salinities of 3.7 to 5.7 wt% NaCl eqv. The Laser Raman spectroscopic results demonstrated minor CH4 in the C-type FIs from Stages I and II. The results suggest that ore fluids may have evolved from a medium-high temperature, low-salinity immiscible CO2-NaCl-H2O ± CH4 system to a low temperature, low-salinity homogeneous NaCl-H2O system. Fluid immiscibility caused by the rapid drop in pressure may have been the main trigger for gold-polymetallic sulfide precipitation. The Songjianghe Au deposit may have been formed under 352–448 °C and 850–1380 bar pressure, based on the isochore intersection for Stage II fluid inclusions. The H-O isotopic compositions (Stage I: δ18Ofluid = 5.6 to 5.8‰, δD = −96.2 to −95.7‰; Stage II: δ18Ofluid = 3.7 to 4.2‰, δD = −98.7 to −89.8‰; Stage III: δ18Ofluid = 1.2 to 1.4‰, δD = −103.5 to −101.2‰) indicate that the hydrothermal fluids are dominated by magmatic water in the early stages (Stages I and II) and mixed with meteoric water since Stage III. The pyrite S-Pb isotope data (δ34S: −2.91 to 3.40‰; 206Pb/204Pb: 16.3270 to 16.4874; 207Pb/204Pb: 15.2258 to 15.3489; 208Pb/204Pb: 36.6088 to 36.7174), combined with Pb isotopic compositions of the intrusive rocks and wall rocks (the Seluohe Group) in the ore district, indicate that the ore-forming materials at Songjianghe are predominantly from a magmatic source and may have been affected by the contamination of the Seluohe Group. In accordance with the features of ore geology, ore-forming fluids and metals, and geodynamic setting, the Songjianghe Au deposit belongs to a mesothermal magmatic hydrothermal vein gold deposit, which formed in the intermittent stage of Paleo-Pacific plate subduction during the Late Jurassic.

1. Introduction

The Jiapigou-Haigou gold belt (JHGB), located in the tectonic transition between the northeastern North China Craton (NCC) margin and the eastern Central Asian Orogenic Belt (CAOB), is a key gold province with an explored gold reserve of >200 metric tonnes (t) in NE China [1,2,3]. The region has undergone prolonged tectonic evolution with the Paleo-Asian Ocean closure and the Paleo-Pacific subduction, forming a series of hydrothermal gold deposits related to CO2-enriched fluids (e.g., Erdaogou, Xiaobeigou, Bajiazi, Xiaxitai, Sandaocha, and Haigou). Extensive studies have been undertaken to unravel the geological setting, metallogenic ages, and mineralization systematics of these gold deposits [4,5,6,7,8,9,10,11]. However, the origin of ore-forming fluids has long been a controversial topic: (1) Predominantly metamorphic water with later meteoric water infusion [6,12]; (2) a mixed source from magmatic water and meteoric water [13,14,15]; and (3) mantle-derived fluids [8,16,17]. Meanwhile, diverging insights also exist on the source of metals: (1) Extracted from metamorphic country rocks [18,19,20] or (2) a mixture of crust and mantle [17,21]. Consequently, in many cases, both the origin of ore fluids and metal source are indistinct or under dispute, which hinders the understanding of the ore-forming process and the mechanism of gold deposition. Considering the aforementioned distinctions, the genetic type of these gold deposits is a subject of continuous discussion and with conflicting conclusions: (1) A greenstone-type gold deposit [12,18,20], (2) a magmatic hydrothermal vein-type gold deposit [4,22,23], or (3) an orogenic gold deposit [6,21,24].
The Songjianghe Au deposit is sited in the southeastern JHGB, hosting a 9 metric tonne (t) gold reserve @ 3.02 g/t. Compared with other major gold deposits, the Songjianghe Au deposit has received less attention. Prior studies on the Songjianghe Au deposit primarily addressed ore geology [25,26], ore fluids [27,28,29], geochronology, and the geodynamic setting [30,31]. These studies proposed that the Songjianghe Au deposit was formed in the intermittent stage that followed the first subduction of the Paleo-Pacific plate during the Late Jurassic (157–156 Ma [31]) and gold precipitation was primarily caused by fluid immiscibility [27,28,29]. Nevertheless, the links between the evolution of ore-forming fluids and gold mineralization have not been convincing. Meanwhile, the sources of ore fluids and ore-forming materials are still obscure, resulting in unclear ore precipitation processes. In addition, the ores in the Songjianghe Au deposit are predominately of the disseminated style [25,26], in contrast to the quartz vein-type ores that describe the majority of gold deposits (e.g., Erdaogou, Xiaobeigou, Bajiazi, and Haigou) in the JHGB [17,20,32,33].
In this study, we give detailed descriptions of the geology and mineralogy, as well as a systematic study of the fluid inclusions and H-O stable isotopes, to provide distinct constraints on the property, origin, and evolution of the ore fluids and the mineralization mechanisms. Additionally, the S-Pb isotopic data are reported to reveal the source of the ore-forming materials. In accordance with the research results generated, together with the previous studies, the genetic type is classified, and a metallogenic model is established for the Songjianghe Au deposit. It is expected that these results can provide new insights into regional metallogeny in the Jiapigou-Haigou gold metallogenic belt.

2. Geological Setting

The Central Asian Orogenic Belt (CAOB), extending over 5500 km from west to east, evolved through complex tectonics of the Neoproterozoic-Middle Triassic Paleo-Asian Ocean closure, the Mesozoic Mongolia-Okhotsk Ocean closure, and the Paleo-Pacific subduction [34,35,36,37,38,39,40,41,42]. The CAOB separates the Siberia Craton in the north from the Tarim-North China Craton in the south (Figure 1a). NE China, the adjacent Russia Far East, and eastern Mongolia are composed primarily of micro-continental masses, including (from NW to SE) the Erguna, Xing’an, Songliao, and Jiamusi–Khanka blocks, and the Sikhote–Alin accretionary complex (Nadanhada terrane), bounded by the Xinlin-Xiguitu, Hegenshan-Heihe, Mudanjiang-Yanji, and Primoria faults, respectively [43,44] (Figure 1b).
The JHGB is located in the tectonic transition between the northeastern NCC margin (locally named the Longgang terrane) and the eastern CAOB (Figure 1b,c). The formation, accretion, and solidification of the continental nucleus, as well as its cracking and subsequent cratonization, are primary tectonic evolution processes during Precambrian [2,49]. The Early Paleozoic witnessed the beginning of the closure of the Paleo-Asian Ocean, which had completely closed before the Middle Triassic [43,50]. The subduction of the Paleo-Pacific plate beneath Eurasia is the most significant tectonic event in the JHGB during the Mesozoic [7,17].
The regional strata comprise Archean medium-/high-grade metamorphic rocks, Proterozoic low-/medium-grade rocks, Paleozoic low metamorphic/sedimentary rocks, Mesozoic volcanic/sedimentary rocks, and Cenozoic sediments (Figure 1c). The Archean metamorphic basement composed of the Longgang and Jiapigou Groups is exposed in the Longgang terrane on the southwestern side of the JHGB (Figure 1c). The Mesoarchean Longgang Group may have experienced medium-/high-grade metamorphism and primarily consists of felsic gneiss, granulite, plagioclase amphibolite, and supracrustal rocks [51]. The Neoarchean Jiapigou Group comprises characteristically biotite plagioclase gneiss, plagioclase amphibolite, hornblende plagioclase gneiss, and minor magnetite quartzite [21,52], which is the main host rock of many gold deposits (e.g., Bajiazi, Xiaxitai, and Sandaocha). The Paleoproterozoic Ji’an Group composed of plagioclase amphibolite, biotite granulite, biotite schist, and marble was formed in the early rifting stage [53]. The Seluohe Group is discontinuously exposed along the Jinyinbie and Fuerhe faults (Figure 1c), which experienced low-/medium-grade metamorphism. As the host rock of the Songjianghe Au deposit, the Seluohe Group has long been considered a Meso-Neoproterozoic metamorphic suite [54,55], yet more recent studies have shown that the Seluohe Group may actually represent a complex of large tectonic slices that primarily comprise metamorphic strata and mylonitized granites of different ages and origins [31,56,57,58]. The Paleozoic strata consist primarily of the Qinglongcun Group and the Hulan Group, which are characterized by low metamorphic volcano-sedimentary rocks. The Late Triassic greenschist facies retrograde metamorphism of the Hulan Group represents a post-collisional extension setting after the closure of the Paleo-Asian Ocean [43,59]. The Mesozoic strata crop out in the northern and southeastern JHGB (Figure 1c), primarily comprising terrestrial sedimentary and intermediate-acid pyroclastic rocks.
The oldest granitoid, a TTG (tonalite-trondhjemite-granodiorite) suite, and a set of potassium-rich granitoids are exposed in the central and northern Longgang terrane, respectively (Figure 1c), which are characterized by sodic to potassic compositional evolution [60]. These two granitoid suites are likely the product of late Neoarchean to early Paleoproterozoic magmatic events under an active continental margin environment [52,61]. The Paleozoic intrusive rocks are exposed along NW-striking faults (Figure 1c), primarily comprising late Hercynian biotite granite and granodiorite, followed by monzogranite and quartz diorite, which were formed in the process of the Paleo-Asian Ocean closure [44,62]. The Mesozoic intrusive rocks are characteristically composed of large batholiths of granodiorite, monzogranite, and quartz diorite. These intrusive rocks were considered to be formed in the tectonic settings of post-collisional extension after the Paleo-Asian Ocean closure and/or the multiple subductions of the Paleo-Pacific plate [14,63,64].
Several fault zones developed in the region, including the NE-striking Dunhua-Mishan and Ji’an-Songjiang faults, as well as the NW-striking Fuerhe, Jinyinbie, and Jiapigou faults (Figure 1c). The Dunhua-Mishan fault is considered to be a branch of the Tancheng-Lujiang fault zone [10,65,66], whilst the NW-striking Jiapigou, Jinyinbie, and Fuerhe faults are the subsidiary structures of the Dunhua-Mishan fault [21,67], which experienced brittle deformation superimposed on brittle-ductile deformation [68]. These subsidiary faults, characterized by dextral shear [17,69], control the distribution of gold deposits in the study area [7,17] (Figure 1c). The ultra-crustal Ji’an-Songjiang fault locally controls the Mesozoic magma activities and the distribution of Early Jurassic and Cretaceous strata [1,70].

3. Deposit Geology

The Songjianghe Au deposit is located in the southeastern part of the Jiapigou-Haigou gold belt (JHGB). The only exposed stratigraphic unit at Songjianghe is the Seluohe Group (NE-dipping with 40–55° dip angle), which is also the ore host (Figure 2a). The Seluohe Group at Songjianghe was formed in the Late Neoarchean, primarily composed of chlorite-epidote-actinolite schist, biotite-plagioclase schist, amphibolite-plagioclase schist, muscovite-biotite schist, granitic gneiss, meta-sandstone, and marble, and experienced stages of multistage metamorphism and deformation. The protoliths of the Seluohe Group may have primarily consisted of intermediate-basic and acidic volcanic and sedimentary rocks [31].
There are three sets of major structures, which are (from old to young) EW-, NNW-, and NE-striking fractures (Figure 2a). The EW-striking (N-dipping with 40–80° dip angle) fractures are cut by the NNW- and NE-striking fractures, exposed on the north side of the ore district. The orebodies are controlled by the NNW-striking fractures (E or NE-dipping at 40 to 50°), which are characterized by the early-stage ductile shearing superimposed by the late-stage brittle-ductile fractures. The NE-striking fractures marked by SE-dipping with a 60–70° dip angle are characteristically transtensional, which crosscut the NNW-striking ore-controlling structures.
The local intrusive rocks consist primarily of plagiogranite and granodiorite (171 ± 5 Ma [71]), K-feldspar granite (169.6~173 Ma [25,30]), and biotite monzogranite (168.2 ± 2 Ma [72]) (Figure 2a). These Middle Jurassic igneous rocks were considered to have formed in the tectonic setting of the island arc or active continental margin under the subduction of the Paleo-Pacific plate [30,71,72].
A total of 10 orebodies have been delineated at Songjianghe, with a gold reserve of 9 t (@ 3.02 g/t). The largest orebody (II-1: 240 m long, 600 m deep, and 0.8–21.6 m thick) is lensoidal and developed along the NNW-striking structures (Figure 2b,c). The ores are primarily characterized by disseminated or veinlet types and minor quartz vein types. The ore textures primarily include anhedral granular, metasomatism, metasomatic relict, and minor euhedral-subhedral granular. Metallic minerals include characteristically pyrite, pyrrhotite, chalcopyrite, galena, sphalerite, and native gold. Gangue minerals primarily include quartz, calcite, mica, chlorite, and epidote.
Based on field observations, ore texture/structure, mineral assemblage, paragenetic sequence, and vein crosscutting relations, four alteration/mineralization stages were recognized (Figure 3). Stage I (quartz-pyrrhotite-pyrite) is characterized by medium-fine-grained milky white quartz with a euhedral-subhedral texture, and euhedral-subhedral fine-medium-grained pyrrhotite and pyrite (Figure 3a,e,f). Stage II (quartz-polymetallic sulfides) is the main Au ore stage, characterized by pyrite, chalcopyrite, galena, sphalerite, native gold, and quartz (Figure 3a–c,g–k). The quartz is usually smoke gray in color with subhedral-anhedral grains. The metal sulfides are mostly anhedral grains, and a few are euhedral-subhedral (Figure 3g–k). Pyrite, the predominant metal sulfide (~90 vol%), can be locally observed in coexistence with native gold, yet most native gold is characteristically hosted in the intergranular spaces and fissures of quartz (Figure 3j,k). Stage III is marked by the coexistence of quartz and pyrite (Figure 3c,l). It is visible that Stage II quartz-polymetallic sulfides were cut by Stage III quartz-pyrite veins (Figure 3c). Stage IV represents the end of hydrothermal activity, characterized by quartz-calcite veins (Figure 3d). The ore and gangue mineral paragenetic sequence is summarized in Figure 4. The Wall rock alteration zoning (from orebody to wallrock) includes sericite-silicic → weak potassic-biotite → epidote-chlorite → carbonate [31].

4. Sampling and Analytical Methods

4.1. Fluid Inclusion Analysis

In order to determine the ore-fluid evolution and physicochemical conditions of mineralization, 20 quartz samples (Stage I to IV) were selected from the II-1 orebody of the 584 m mining level (Figure 2c) to make doubly polished thin sections (~150 μm thick) for fluid inclusion (FI) petrographic and microthermometric analyses. Following the detailed fluid inclusion assemblage (FIA) definition by [73], representative primary FIAs were selected for microthermometric measurements on a Linkam THMS-600 heating–freezing stage (with a −195 to +600 °C temperature range, mounted on a Carl Zeiss Axiolab microscope), at the Key Laboratory of Geological Fluid in Jilin University (China). The equipment was calibrated by the triple point of CO2 (−56.6 °C) and the freezing point of pure water (0.0 °C) to ensure analysis accuracy (±0.1 °C (<0 °C) and ±2 °C (>200 °C)). The heating and cooling rates are 1–5 °C/min, which decreased to 0.1 °C/min when approaching phase transitions. Representative single FI compositions were analyzed on a Renishaw System-1000 Laser Raman Spectrometer (UK) with a 514 nm laser source. The spectral scanning range was set to between 1200 and 4000 cm−1, with a 60 s accumulation time for each scan.

4.2. Isotope Analysis

Nine quartz samples from representative ores (Stage I to III) were selected from the II-1 orebody of the 584 m mining level (Figure 2c) for hydrogen-oxygen isotope analyses to constrain the ore-fluid origin. The ore samples were examined and identified under a microscope to make sure they were representative of various hydrothermal stages. The quartz samples were crushed to 40–60 mesh, and then handpicked under a binocular microscope to obtain >98% purity. Hydrogen-oxygen isotope composition analyses were completed in the laboratory of the Beijing Research Institute of Uranium Geology and Beijing GeoAnalysis Co. Ltd. (Beijing, China). The quartz was reacted with BrF5 in a vacuum at a high temperature to extract oxygen, which was then converted to CO2 gas on a burning Pt-coated carbon rod [74]. The oxygen isotope composition of the obtained CO2 gas was analyzed on a MAT-253EM mass spectrometer. The same samples were heated at 150 °C for 3 h in a vacuum, and then heated to >500 °C in an induction furnace to release the inclusion water, which was converted to H2 by reacting with zinc powder at 800 °C. Finally, the hydrogen isotope composition was analyzed on a MAT-253EM mass spectrometer. The oxygen and hydrogen isotope ratios are presented in standard δ notation (‰) relative to the Standard Mean Ocean Water (SMOW). The analysis accuracy is ±0.2‰ for oxygen isotope and ±2‰ for hydrogen isotope.
Twenty-two pyrite samples (Stage I and II) were selected from the II-1 orebody of the 584 m mining level (Figure 2c) for sulfur isotope analyses, which were conducted at Beijing GeoAnalysis Co., Ltd. Sulfur isotope compositions were determined by conventional combustion and LA-MC-ICP-MS in situ S isotope analysis. SO2 was liberated for S isotope analysis using the conventional extraction technique of [75], and then measured with a Delta V Plus mass spectrometer. Results are reported as δ34S relative to Vienna Canyon Diablo Troilite (V-CDT) with a precision of ±0.2‰. The in situ S isotope was analyzed using an NWR 193 laser ablation system connected to Neptune Plus MC-ICP-MS. The single-spot ablation mode was used with a large spot size (44 μm) and low pulse frequency (2 Hz). Approximately 100 laser pulses were completed in a single analysis [76]. Details of the S isotope analytical methods follow those described by [77,78].
Five pyrite samples (Stage II) were selected from the II-1 orebody of the 584 m mining level (Figure 2c) for lead isotope analyses. In addition, lead isotope analyses of the wallrock, K-feldspar granite, and monzogranite (Figure 2a) were also carried out. All these analyses were conducted at Beijing GeoAnalysis Co., Ltd. Furthermore, 10–50 mg powder samples were washed with acetone and distilled water to remove surface contamination before air drying at 60 °C. The cleaned samples were dissolved in HF + HNO3 at 150 °C for 7 days. The conventional cation exchange technique was used to purify the lead, and then placed in 0.5 mol/L HBr-HCl solution for Pb separation. The lead isotope analyses were conducted on an ISOPROBE-T thermal ionization mass spectrometer (TIMS) with an analysis accuracy of better than 0.005%. In addition, Pb isotope ratios were calibrated by the NBS SRM 981 standard. For details on lead isotope analysis methods, refer to [79].

5. Results

5.1. Fluid Inclusion

5.1.1. Fluid Inclusion Petrography

On the basis of the criteria of [73], primary FIs in isolation or random clusters were selected for the analyses, whereas secondary FIs along micro-fractures or penetrating the crystal boundary were not selected [80]. Based on the FI phase composition at room temperature (25 °C) and the phase transition characteristics during heating or freezing, two types of primary FIs are identified: CO2 (C-type) and liquid-rich two-phase (VL-type) FIs. C-type FIs usually have one to two components, i.e., CO2 ± liquid H2O. Depending on the CO2/H2O ratio, C-type FIs can be divided into three sub-types: CO2-pure (C1-type, entirely CO2), CO2-rich (C2-type, CO2/H2O ratio > 1), and CO2-bearing (C3-type, CO2/H2O ratio < 1).
C1-type FIs are usually composed of two phases (liquid CO2 + vapor CO2) or a single liquid CO2 phase at room temperature (25 °C), and the latter would appear as vapor CO2 when cooled to <10 °C. The volume range of vapor CO2 is 5% to 20% at room temperature (25 °C). These FIs are usually rounded/elliptical with a size of 8–12 μm and primarily distributed in groups (Figure 5(a-4); Table 1).
C2-type FIs usually contain three phases (liquid CO2 + vapor CO2 + liquid H2O). The volume range of the CO2 phase (liquid CO2 + vapor CO2) is over 50% (primarily 70–90%, i.e., CO2/H2O ratio > 1), with the vapor CO2 phase accounting for 85 to 90% (a few 30–35%). These FIs are commonly elliptical with a size of 6–15 μm. Most of these FIs are isolated, while a few are distributed in groups (Figure 5(a-5,b-1,b-2,b-4); Table 1).
C3-type FIs are composed of three phases (liquid CO2 + vapor CO2 + liquid H2O). The volume range of the CO2 phase (liquid CO2 + vapor CO2) is < 50% (primarily 35–40%, i.e., CO2/H2O ratio < 1), with the vapor CO2 phase accounting for 65 to 90% (a few with 35–45%). These FIs are commonly elliptical or irregular-shaped with a size of 5–20 μm. Most of these FIs are isolated, and a few are clustered (Figure 5(a-1–a-3,a-5,b-3,b-4,c-1,c-2); Table 1).
VL-type FIs have two phases (vapor H2O + liquid H2O) at room temperature (25 °C), with vapor H2O accounting for <50 vol.% (primarily 15–30 vol.%, minor 5–10 vol.%). These FIs are commonly elliptical, irregular-, or occasionally negative-crystal-shaped, with a size of 5–22 μm, and most of them occur in clusters, with a few isolated FIs (Figure 5(a-1,a-5,b-1,b-4,c-1,c-3,d-1,d-2); Table 1).

5.1.2. Fluid Inclusion Microthermometry

The FI microthermometric data are presented in Table 1 and illustrated in Figure 6. The FI salinities (expressed as wt.% NaCl eqv) were calculated according to the ice-melting temperature (Tm-ice) of VL-type FIs [81]. For C2- and C3-type FIs, the salinities were calculated based on the CO2-H2O clathrate melting temperatures (Tm-cla) [73].
Stage I: C- (C1-, C2-, and C3-) and VL-type FIs were identified (Figure 5(a-1–a-5)). C-type FIs have similar solid CO2 (Tm-CO2) melting temperatures (−62.2 to 56.9 °C) and homogenization temperatures to the CO2 phase (Th-CO2 = 16.2 to 30.9 °C). The CO2 phase of C1- and C2-type FIs homogenized to the liquid CO2 phase, while the CO2 phase of C3-type FIs homogenized to the liquid or vapor CO2 phase. The C2- and C3-type FIs yielded similar Tm-cla (6.5 to 8.6 °C), with corresponding salinities of 2.8 to 6.6 wt.% NaCl eqv (Figure 6). The total homogenization temperatures (Th-total) of C2- and C3-type type FIs are 305.0 to 405.6 °C (primarily 330–350 °C) during heating (Figure 6). It should be noted that the C2-type FIs are totally homogenized to the liquid CO2 phase, while the C3-type FIs are totally homogenized to the liquid H2O phase. VL-type FIs homogenized to the liquid H2O phase with a Th-total of 292.8 to 368.4 °C (primarily 330 to 350 °C) (Figure 6). Tm-ice of VL-type FIs is −6.1 to −3.9 °C, with calculated salinities of 6.3 to 9.3 wt.% NaCl eqv (Figure 6).
Stage II: FIs are predominantly C2-, C3-, and VL-type (Figure 5(b-1–b-4)). C2- and C3-type FIs have similar Tm-CO2 (−60.1 to −56.9 °C) and Th-CO2 (21.8 to 30.7 °C). The CO2 phase of C2-type FIs homogenized to the liquid CO2 phase, while the CO2 phase of C3-type FIs homogenized to the liquid or vapor CO2 phase. Tm-cla of C2- and C3-type FIs are 7.4 to 8.6, with corresponding salinities of 2.8 to 5.1 wt.% NaCl eqv (Figure 6). C2-type FIs are totally homogenized to the liquid CO2 phase at 301.5 to 337.6 °C, while C3-type FIs are totally homogenized to the liquid H2O phase at 301.9 to 338.6 °C. The Th-total of C2- and C3-type FIs cluster around 310 to 320 °C (Figure 6). VL-type FIs homogenized to the liquid H2O phase at 278.5 to 338.9 °C (primarily 310 to 320 °C) (Figure 6). Tm-ice of VL-type FIs is −5.2 to −3.6 °C, with corresponding salinities of 5.8 to 8.1 wt.% NaCl eqv (Figure 6).
Stage III: C3- and VL-type FIs were identified (Figure 5(c-1–c-3)). C3-type FIs have Tm-CO2 of −59.8 to −56.7 °C and Th-CO2 of 11.8 to 28.0 °C. The CO2 phase of C3-type FIs homogenized to the liquid or vapor CO2 phase. Tm-cla values of C3-type FIs are 7.9 to 8.8 °C, with corresponding salinities of 2.4 to 4.1 wt.% NaCl eqv (Figure 6). C3-type FIs are totally homogenized to the liquid H2O phase at 225.4 to 307.3 °C (primarily 250 to 260 °C) (Figure 6). VL-type FIs homogenized to liquid H2O phase at 215.9 to 297.3 °C (primarily 250 to 260 °C). These FIs have Tm-ice of −4.5 to −2.8 °C, with calculated salinities of 4.6 to 7.2 wt.% NaCl eqv (Figure 6).
Stage IV: Only VL-type FIs were identified (Figure 5(d-1,d-2)). The Tm-ice of these FIs is −3.5 to −2.2 °C, with corresponding salinities of 3.7 to 5.7 wt.% NaCl eqv (Figure 6). They homogenized into the liquid H2O phase at 189.5 to 240.4 °C (primarily 210 to 230 °C) (Figure 6).

5.1.3. Laser Raman Spectroscopy

Representative primary fluid inclusions were selected for Laser Raman analysis. Stage I to II C-type FIs are generally CO2-rich with minor CH4 (Figure 7a–d), whereas only CO2 was detected in Stage III C3-type FIs (Figure 7e). Stage IV VL-type FIs contain only H2O (Figure 7f).

5.2. Hydrogen-Oxygen Isotope Compositions

The H-O isotope data are presented in Table 2 and illustrated in Figure 8. Stage I δDV-SMOW and δ18Oquartz values are −96.2 to −95.7‰ and 11.1 to 11.3‰, respectively. Stage II δDV-SMOW and δ18Oquartz values are −98.7 to −89.8‰ and 10.1 to 10.6‰, respectively, whilst Stage III δDV-SMOW and δ18Oquartz values are −103.5 to −101.2‰ and 9.8 to 9.9‰, respectively. Based on the host mineral-fluid fractionation equations [82] and the FI Th-total of Stages I to III, the calculated δ18Ofluid values are 5.6 to 5.8‰ (Stage I), 3.7 to 4.2‰ (Stage II), and 1.2 to 1.4‰ (Stage III).

5.3. Sulfur-Lead Isotope Compositions

Sulfur isotope compositions of Stages I and II (main-ore stage) pyrites are presented in Table 3 and illustrated in Figure 9. Seven pyrite samples from Stage I show δ34S values varying from −2.91 to 0.42‰ (average = −1.04‰) and fifteen pyrite samples from Stage II have δ34S values varying from −0.96 to 3.40‰ (average = 1.19‰). The samples as a whole yielded a relatively narrow δ34S range (−2.91 to 3.40‰, mean 0.48‰) with a cluster around −1 to 1‰ (Figure 9a).
Lead isotope compositions of stage II pyrite, Middle Jurassic monzogranite and K-feldspar granite, and the Seluohe Group biotite-plagioclase schist are presented in Table 4 and illustrated in Figure 10. The monzogranite (206Pb/204Pb = 17.1720 to 17.3080, 207Pb/204Pb = 15.3720 to 15.4060, 208Pb/204Pb = 37.2280 to 37.3910) and K-feldspar granite (206Pb/204Pb = 17.4630 to 17.5480, 207Pb/204Pb = 15.4080 to 15.4440, 208Pb/204Pb = 37.5280 to 37.6810) have relatively high Pb isotopic ratios, whilst the biotite-plagioclase schist (206Pb/204Pb = 16.4550 to 16.8380, 207Pb/204Pb = 15.2050 to 15.2920, 208Pb/204Pb = 36.5910 to 36.9210) and Stage II pyrite (206Pb/204Pb = 16.3270 to 16.4874, 207Pb/204Pb = 15.2258 to 15.3489, 208Pb/204Pb = 36.6088 to 36.7174) display low Pb isotopic ratios.

6. Discussion

6.1. Property and Origin of the Ore-Forming Fluids

Stage I: There are four types of primary FIs (C1-, C2-, C3-, and VL-type) coexisting in the quartz crystals (Figure 5(a1–a5)). These FIs have similar total homogenization temperatures (Th-total, 292.8 to 405.6 °C; Figure 6a) but diversified salinity (2.8 to 9.3 wt% NaCl eqv; Figure 6b) and different homogenization paths (in Section 5.1.2). The C- (C1-, C2-, and C3-) type FIs exhibit various CO2/H2O ratios (in Section 5.1.1). Moreover, the C-type FIs have similar homogenization temperatures of the CO2 phase (Th-CO2 = 16.2 to 30.9 °C). Thus, there has been considerable evidence that the ore fluids from Stage I were immiscible when the FIs were captured [94,95,96]. The melting temperatures of solid CO2 (Tm-CO2) of C-type FIs (−62.2 to 56.9 °C) are lower than the CO2 triple point (−56.6 °C), implying the presence of a certain amount of CH4 and/or N2. The Laser Raman spectroscopic results demonstrated minor CH4 in the C-type FIs, which is in accordance with the above inference (Figure 7a,b). The Stage I δDV-SMOW and δ18Ofluid values have similar distribution ranges and plot into the magmatic domain (Figure 8). Additionally, the oxygen isotopic data (δ18Ofluid = 5.6 to 5.8‰) are also in accordance with those of magmatic water (5.5‰ to 9.5‰), as proposed by [97]. The hydrogen-oxygen isotopic composition from the early stage at Songjianghe is comparable to other gold deposits (e.g., Erdaogou, Xiaobeigou, Bajiazi, and Haigou) in the JHGB (Figure 8), indicating a potentially similar source of the ore-forming fluids, which are distinctly inconsistent with the metamorphic fluids [8,17,33] (Figure 8). Taken together, Stage I ore fluids belong to a medium-high-temperature, low-salinity immiscible CO2-NaCl-H2O ± CH4 system and are primarily derived from magmatic water.
Stage II: The coexisting C2-, C3-, and VL-type FIs have similar Th-totals (278.5 to 338.9 °C; Figure 6c), yet they have different salinity values (2.8 to 8.1 wt% NaCl eqv; Figure 6d) and homogenization paths (in Section 5.1.2). The C2- and C3-type FIs are characterized by various CO2/H2O ratios (in Section 5.1.1). In addition, the Th-CO2 of C2- and C3-types have similar distribution ranges (21.8 to 30.7 °C). These features suggest that the ore fluids from Stage II are immiscible [94]. Tm-CO2 of C-type (C2- and C3-type) FIs (−60.1 to −56.9 °C) and Laser Raman spectroscopic results (Figure 7c,d) demonstrated minor CH4 in the fluid inclusions. Although δ18Ofluid values have slightly drifted toward meteoric water relative to Stage I, δDV-SMOW values remain almost unchanged (Figure 8). In general, the fluid–rock interaction is a common process at temperatures of 280–380 °C in hydrothermal gold deposits [98]. Meanwhile, in contrast to the quartz vein-type ore, the ore fluids of the altered type are characteristically dominated by magmatic fluids and less admixed meteoric water [99], as supported by the hydrogen-oxygen isotope data of quartz vein-type gold deposits (e.g., Erdaogou, Xiaobeigou, Bajiazi, and Haigou) within the JHGB (Figure 8). Therefore, the slight variation in δ18Ofluid values is interpreted as an exchange of material between the ore fluids and wallrocks, rather than being caused by the input of meteoric water. In combination, Stage II ore fluids belong to a moderate-temperature, low-salinity immiscible CO2-NaCl-H2O ± CH4 system derived from magmatic water.
Stage III: The identified C3- and VL-type FIs commonly occur in groups in the same quartz grain and have a similar Th-total (215.9 to 307.3 °C; Figure 6e), suggesting that they were captured almost simultaneously. These FIs do not constitute an immiscible FIA and cannot represent a fluid-immiscible assemblage. This is because C3-type FIs have the same CO2/H2O ratio (in Section 5.1.1), and the vapor/liquid ratios of VL-type FIs are similar. The δDV-SMOW and δ18Ofluid values fall between the fields of meteoric water and magmatic water (Figure 8), indicating meteoric water incursion. The volatiles (CO2 and CH4) of FIs from Stage I to III decreased apparently, which may have been attributed to decompression, crystallization-induced degassing, and/or meteoric water incursion [100]. Hence, Stage III ore fluids belong to a medium-low-temperature, low-salinity homogeneous CO2-NaCl-H2O system, which was sourced from the mixing of magmatic water and meteoric water.
Stage IV: Only VL-type FIs are identified, which commonly occur in groups in the same quartz grain. These FIs have similar vapor–liquid ratios (5 to 15%), Th-totals (189.5 to 240.4 °C), and salinity values (3.7 to 5.7 wt.% NaCl eqv), which decreased further in comparison to Stage III equivalents (Figure 6g,h). This suggests that the VL-type FIs are almost captured simultaneously and that the ore fluids were transformed into a low-temperature, low-salinity homogeneous NaCl-H2O system accompanied by more meteoric water mixing.

6.2. Fluid Evolution and Gold Mineralization

The characteristics of FIs from Stages I and II demonstrate that fluid immiscibility occurred prior and synchronous to gold mineralization in the Songjianghe Au deposit, and the initial ore-forming fluids were derived from the exsolution of magma. Along with the continuous crystallization and evolution of the magma, the volatile-rich (CO2, CH4, and H2O) magmatic fluids ascended to shallower depths owing to the fracturing and/or hydrofracturing of country rocks [73]. Subsequently, the rapid pressure drop caused by fault failure and fluid drainage triggered the fluid immiscibility and phase separation [101] (Stage I; Figure 11).
In hydrothermal fluids, gold bisulfide complexes (Au(HS)2 and/or Au(HS)0) are the primary ligands for gold migration at a pressure of 200 MPa and temperatures of 200–400 °C [102,103]. Hence, gold bisulfide was the most probable ligand for gold migration in the Songjianghe Au deposit. Additionally, the primitive ore fluids were enriched in CO2, which may be conducive to the transport of gold bisulfide complexes by buffering the pH of the solution [104]. Stage II (main ore stage) FIs document the continuous occurrence of fluid immiscibility (Figure 11). Relative to Stage I, the CO2 component of FIs in Stage II is significantly reduced, and salinity drops (Figure 6a–d and Figure 11), revealing the escape of volatile components due to fluid immiscibility. The release of volatiles can result in a decrease in oxygen fugacity, an increase in pH, and a drop in the pressure of the ore fluids, which destabilized the gold bisulfide complexes and accelerated the gold precipitation [80,105]. Synchronously, the HS generated by the decomposition of gold bisulfide complexes was combined with metal cations to form polymetallic sulfides (e.g., pyrite, chalcopyrite, galena, and sphalerite) and released H+ [106].
Following a large amount of volatile components’ escape and metal precipitation, the hydrothermal fluid entered a relatively open condition and meteoric water began to admix (Stage III; Figure 8 and Figure 11). C3-type FIs have the same proportion of aqueous solution and CO2, and the vapor–liquid ratios of VL-type FIs are similar, revealing that fluid immiscibility essentially ended. As meteoric water was continuously introduced, the ore fluids gradually cooled, diluted, and tended to resemble meteoric water (Figure 11), which signaled the decline and conclusion of the gold mineralization process with the production of calcite and quartz (Stage IV; Figure 4d).

6.3. Fluid Trapping Temperature-Pressure Conditions

In general, it is difficult to accurately estimate the mineralization pressure, unless the mineralization occurred under the exact temperature or immiscible/boiling conditions when the FIs were trapped [94,95,96]. As end-members trapped in immiscible CO2-NaCl-H2O ± CH4 system fluids, the trapping temperature–pressure conditions of C2- and VL-type FIs could approximately represent the mineralization temperature and pressure. For Stage I and II, the Th-total of some VL-type FIs is slightly lower than that of C2-type FIs, which can be interpreted as a result of multiple fluid immiscibilities with fluctuating pressure during mineralization [107,108]. Therefore, we applied the isochore intersection method to constrain the trapping temperature–pressure conditions of C2- and VL-type FIs (with similar Th-totals) for Stages I and II in the same thin sheet. The volume range of the CO2 phase for C2-type FIs is over 50% (primarily 80–90%), and VL-type FIs have two phases (vapor H2O + liquid H2O) with vapor H2O accounting for < 50 vol.% (primarily 20–30 vol.%). The isochores of C2- and VL-type FIs were plotted using MacFlincor software [95]. As shown in Figure 12, the trapping temperature and pressure for Stage I and II are 395–525 °C, 1046–1778 bar, and 352–448 °C, 850–1380 bar, respectively. The Songjianghe Au deposit was likely formed at a higher pressure (850–1380 bar) than other major gold deposits characterized by the quartz vein-type in the JHGB (520 to 1030 bar; e.g., Bajiazi, Xiaxitai, and Sandaocha [2]), suggesting that the gold mineralization characterized by disseminated-style ores may have occurred at a greater mineralization depth with a small-scale and relatively close structural system. Meanwhile, field investigations also show that the ore-controlling structural system of the Songjianghe Au deposit is characterized by narrower brittle-ductile fractures, whilst other major quartz vein-type gold deposits in the JHGB (e.g., Jiapigoubenqu, Erdaogou, Sandaocha, Xiaobeigou, and Banmiaozi [8,17]) are controlled primarily by relatively wider ductile-brittle fractures.

6.4. Source of Ore-Forming Materials

There are four stable isotopes of sulfur in nature, with a relative abundance of 32S 95.02 %, 33S 0.75 %, 34S 4.21 %, and 36S 0.02 % [109]. Geochemical studies generally consider only the most widely distributed and abundant 34S/32S ratio, expressed as δ34S. It is generally accepted that different δ34S values can be derived from three common sulfur sources [110]: (1) Mantle or magmatic source (δ34S = 0 ± 3‰); (2) seawater sulfates (δ34S = approximately + 20‰ but varies greatly); and (3) reduced sulfur from sedimentary rocks (negative δ34S, generally < −15‰). In hydrothermal systems, where H2S is the dominant sulfur species in the fluids or the fluid redox state is below the SO2/H2S boundary, the following relation exists as δ34S (sulfide) = δ34S (fluid) [111]. The sulfur speciation at Songjianghe is dominated by sulfides (especially pyrite, ~90 vol%) with no obvious sulfate development. Thus, the δ34S values of pyrite could represent the δ34S values of the hydrothermal fluid system [112]. There are major differences in sulfur isotopes between the Songjianghe gold deposit and other major gold deposits in the JHGB (Figure 9b): The latter (e.g., the Erdaogou, Xiaobeigou, Bajiazi, Xiaxitai, and Sandaocha deposits; Figure 1c) have relatively wide-range and positive δ34S values (1 to 10‰), which clusters around 1 to 3‰ and 5 to 9‰ [2,87]. The low δ34S values (1 to 3‰) exhibit a magmatic sulfur isotope signature [110]. The high δ34S values (5 to 9‰) imply that the deep-sourced sulfur may have mixed with shallow crustal sulfur during the hydrothermal fluid ascent [17,21,87]. Sulfides from the Haigou gold deposit (southeast of Songjianghe; Figure 1c) have negative δ34S values (−10.9 to −2.3‰ [90]), which may be caused by the following factors: (1) The early mineralization stage may have been oxidizing, causing the fractionation of 34S, as suggested by the extensive development of magnetite and hematite in the early stage [113]; (2) fluid reactions with the low-δ34S wallrocks (−10.9 to −10.5‰ [90]). In this study, Stage II δ34S values (−0.96–3.40‰) are slightly higher than those of Stage I (−2.91–0.42‰), which may be caused by crustal components added during hydrothermal fluid evolution [114]. However, the samples as a whole yielded a relatively narrow δ34S range (−2.91–3.40‰, mean 0.48‰; Figure 9), suggesting a typical magmatic sulfur source (0 ± 3‰ [112]). Compared to other major gold deposits (e.g., the Erdaogou, Xiaobeigou, Bajiazi, Xiaxitai, and Sandaocha deposits) in the JHGB, the Songjianghe Au deposit has a single sulfur source and relatively lower δ34S values. Wang and Yan [115] and Wang et al. [116] proposed that pyrite δ34S values are relatively higher in the gold deposits hosted in large and open structural systems, and lower in those hosted in small-scale and relatively close structural systems. Hence, the Songjianghe Au deposit may have been formed in a small-scale and relatively close structural system, as supported by the trapping temperature–pressure conditions and field investigations.
The relative atomic mass of Pb is large, and the relative mass difference between different Pb isotopes is limited. As a result, Pb not only struggles to experience isotope fractionation when leaching from the ore source layer but also generally has no changes in composition during transfer into the ore-forming hydrothermal fluid and subsequent migration [117]. Therefore, lead isotope compositions of sulfides are widely used to constrain the source of lead [118,119]. The pyrite Pb isotope compositions from Stage II projected primarily toward the field between the mantle and lower crust evolution curve (Figure 10a). Meanwhile, they also exhibit a consistent range between 206Pb/204Pb and 208Pb/204Pb (Figure 10b). These characteristics indicate that the primitive Pb at Songjianghe may have sourced from a low-radiogenic lower crust and mantle lead reservoir. Although the Pb isotope data of monzogranite and K-feldspar granite in the Songjianghe Au deposit also fall between the field between the mantle and lower crust evolution curve, its relatively high-radiogenic member is distinctly different from those of Stage II pyrite (Figure 10a,b). The Pb isotope compositions from the Seluohe Group biotite-plagioclase schist fall close to the lower crust evolution curve (Figure 10a) and are similar to the ore Pb (Figure 10b), therefore the involvement of Pb from wallrock cannot be ruled out. The Pb isotope data from other major gold deposits (e.g., Erdaogou, Xiaxitai, Sandaocha, Sidaocha, Bajiazi, and Haigou) in the JHGB fall mostly between the mantle and lower crust (Figure 10c,d). Additionally, the Pb isotope compositions of these gold deposits show broad correlations, which suggest a two-component mixing of the lower crust and mantle components (Figure 10c,d), inconsistent with the Songjianghe Au deposit. These features indicate that the crustal-source Pb contributes significantly less to the Songjianghe Au deposit than other major gold deposits in JHGB. In conclusion, we propose that the Pb in the Songjianghe Au deposit was primarily derived from a magmatic source (mantle and lower crust) and may have been affected by the Seluohe Group wallrock contamination due to the fluid–rock interaction.

6.5. Ore Genesis

The Songjianghe Au mineralization characterized by disseminated-style ores is predominantly hosted in the metamorphic rocks of the Seluohe Group. The distribution of the ore body, spatially related to the sericitization-silicification zone, is primarily controlled by the NNW-striking structures, which were characterized by the early-stage ductile shearing superimposed by the late-stage brittle-ductile fractures.
Previous studies suggest that the Songjianghe Au deposit shares several characteristics with orogenic gold deposits, such as the mineralization type, composition of metallic minerals, characteristic of structural ore-control, and wallrock alteration [25,27], whereas there are apparent differences between the Songjianghe Au deposit and the typical orogenic gold deposits hosted in Precambrian medium-low grade metamorphic rocks [114]. The ore-forming fluids of orogenic gold deposits are usually derived from the progressive metamorphism process under the conditions of greenschist and amphibolite facies [120], whilst the ore fluids at Songjianghe are dominated by magmatic water with later meteoric water input. Additionally, the metamorphic age (2521–2506 Ma) of the ore-bearing wallrocks (the Seluohe Group) is much older than the mineralization age (157–156 Ma) [31]. In addition, there was no visible orogenic metamorphic event in the study region during the Late Jurassic [121,122].
The JHGB is located in the tectonic transition between the northeastern NCC margin and the eastern CAOB, witnessing the formation and extinction of the Paleo-Asian Ocean and the subduction of the Paleo-Pacific plate beneath Eurasia [17,50]. As mentioned in the geological setting, the greenschist facies retrograde metamorphism of the Hulan Group indicates that the Paleo-Asian Ocean closed before the Late Triassic [43,59]. In the Early-Middle Jurassic, the variation in composition polarity of igneous rocks from the continental margin to the intracontinental region revealed the beginning of subduction of the Paleo-Pacific plate in NE China [121,122,123]. In addition, the widely developed late Early Jurassic to early Middle Jurassic (178–168 Ma) medium-acid intrusions in the JHGB show characteristically geochemical signatures of island arcs or active continental margins, suggesting the occurrence of Paleo-Pacific plate subduction [2,30,49,71]. Abundant gold mineralization events occurred during this period in the JHGB (e.g., Xiaxitai, Sidaocha, Liupiye, and Xiaobeigou [2,4,7]). However, during the Late Middle Jurassic to Early Cretaceous (165–140 Ma), there has been a significant intermittence of magmatic activity in eastern Jilin Province and Songliao Basin, which is interpreted as the Paleo-Pacific plate experiencing an intermittent stage of subduction and/or a strike-slip tectonic regime existing between the continental margin of Northeast Asia and the Paleo-Pacific plate [121,122]. Simultaneously, under the effects of the Paleo-Pacific plate subduction in the Early-Middle Jurassic, the thickened lithospheric mantle from NE China was delaminated due to gravity instability, accompanied by lithospheric thinning [124,125,126] (Figure 13). According to the sericite 40Ar/39Ar dating, the Au mineralization at Songjianghe took place during the Late Jurassic (157–156 Ma [31]). The delamination and lithospheric thinning may have led to asthenosphere upwelling, resulting in the partial melting of the upper mantle and lower crust to generate original magma carrying abundant metals and volatile components [125,126] (Figure 13). With the evolution and exsolution of the magma, the initial ore-forming fluids were generated (Figure 13). As the ore fluids ascended to the shallower zone, the rapid pressure drop triggered the fluid immiscibility and phase separation, which contributes to the decrease in oxygen fugacity, the increase in pH, and the decomposition of gold bisulfide complexes. These processes led to significant gold-polymetallic sulfide precipitation (primarily in Stage II). The H-O isotope compositions suggest that the ore-forming fluids are dominated by magmatic water (Stage I and II) and mixed with meteoric water in the later stage (Stage III). As meteoric water was continuously introduced, the ore fluids gradually cooled, diluted, and tended to resemble meteoric water, which suggested the decline and termination of the gold mineralization process (Stage IV). The S-Pb isotope data indicate that ore-forming materials at Songjianghe are characterized by deep magmatic sources and may be affected by the contamination of Seluohe Group wallrocks due to the fluid–rock interaction. Consequently, the Songjianghe Au deposit belongs to a mesothermal magmatic hydrothermal vein gold deposit, which formed in the intermittent stage of Paleo-Pacific plate subduction during the Late Jurassic.

7. Conclusions

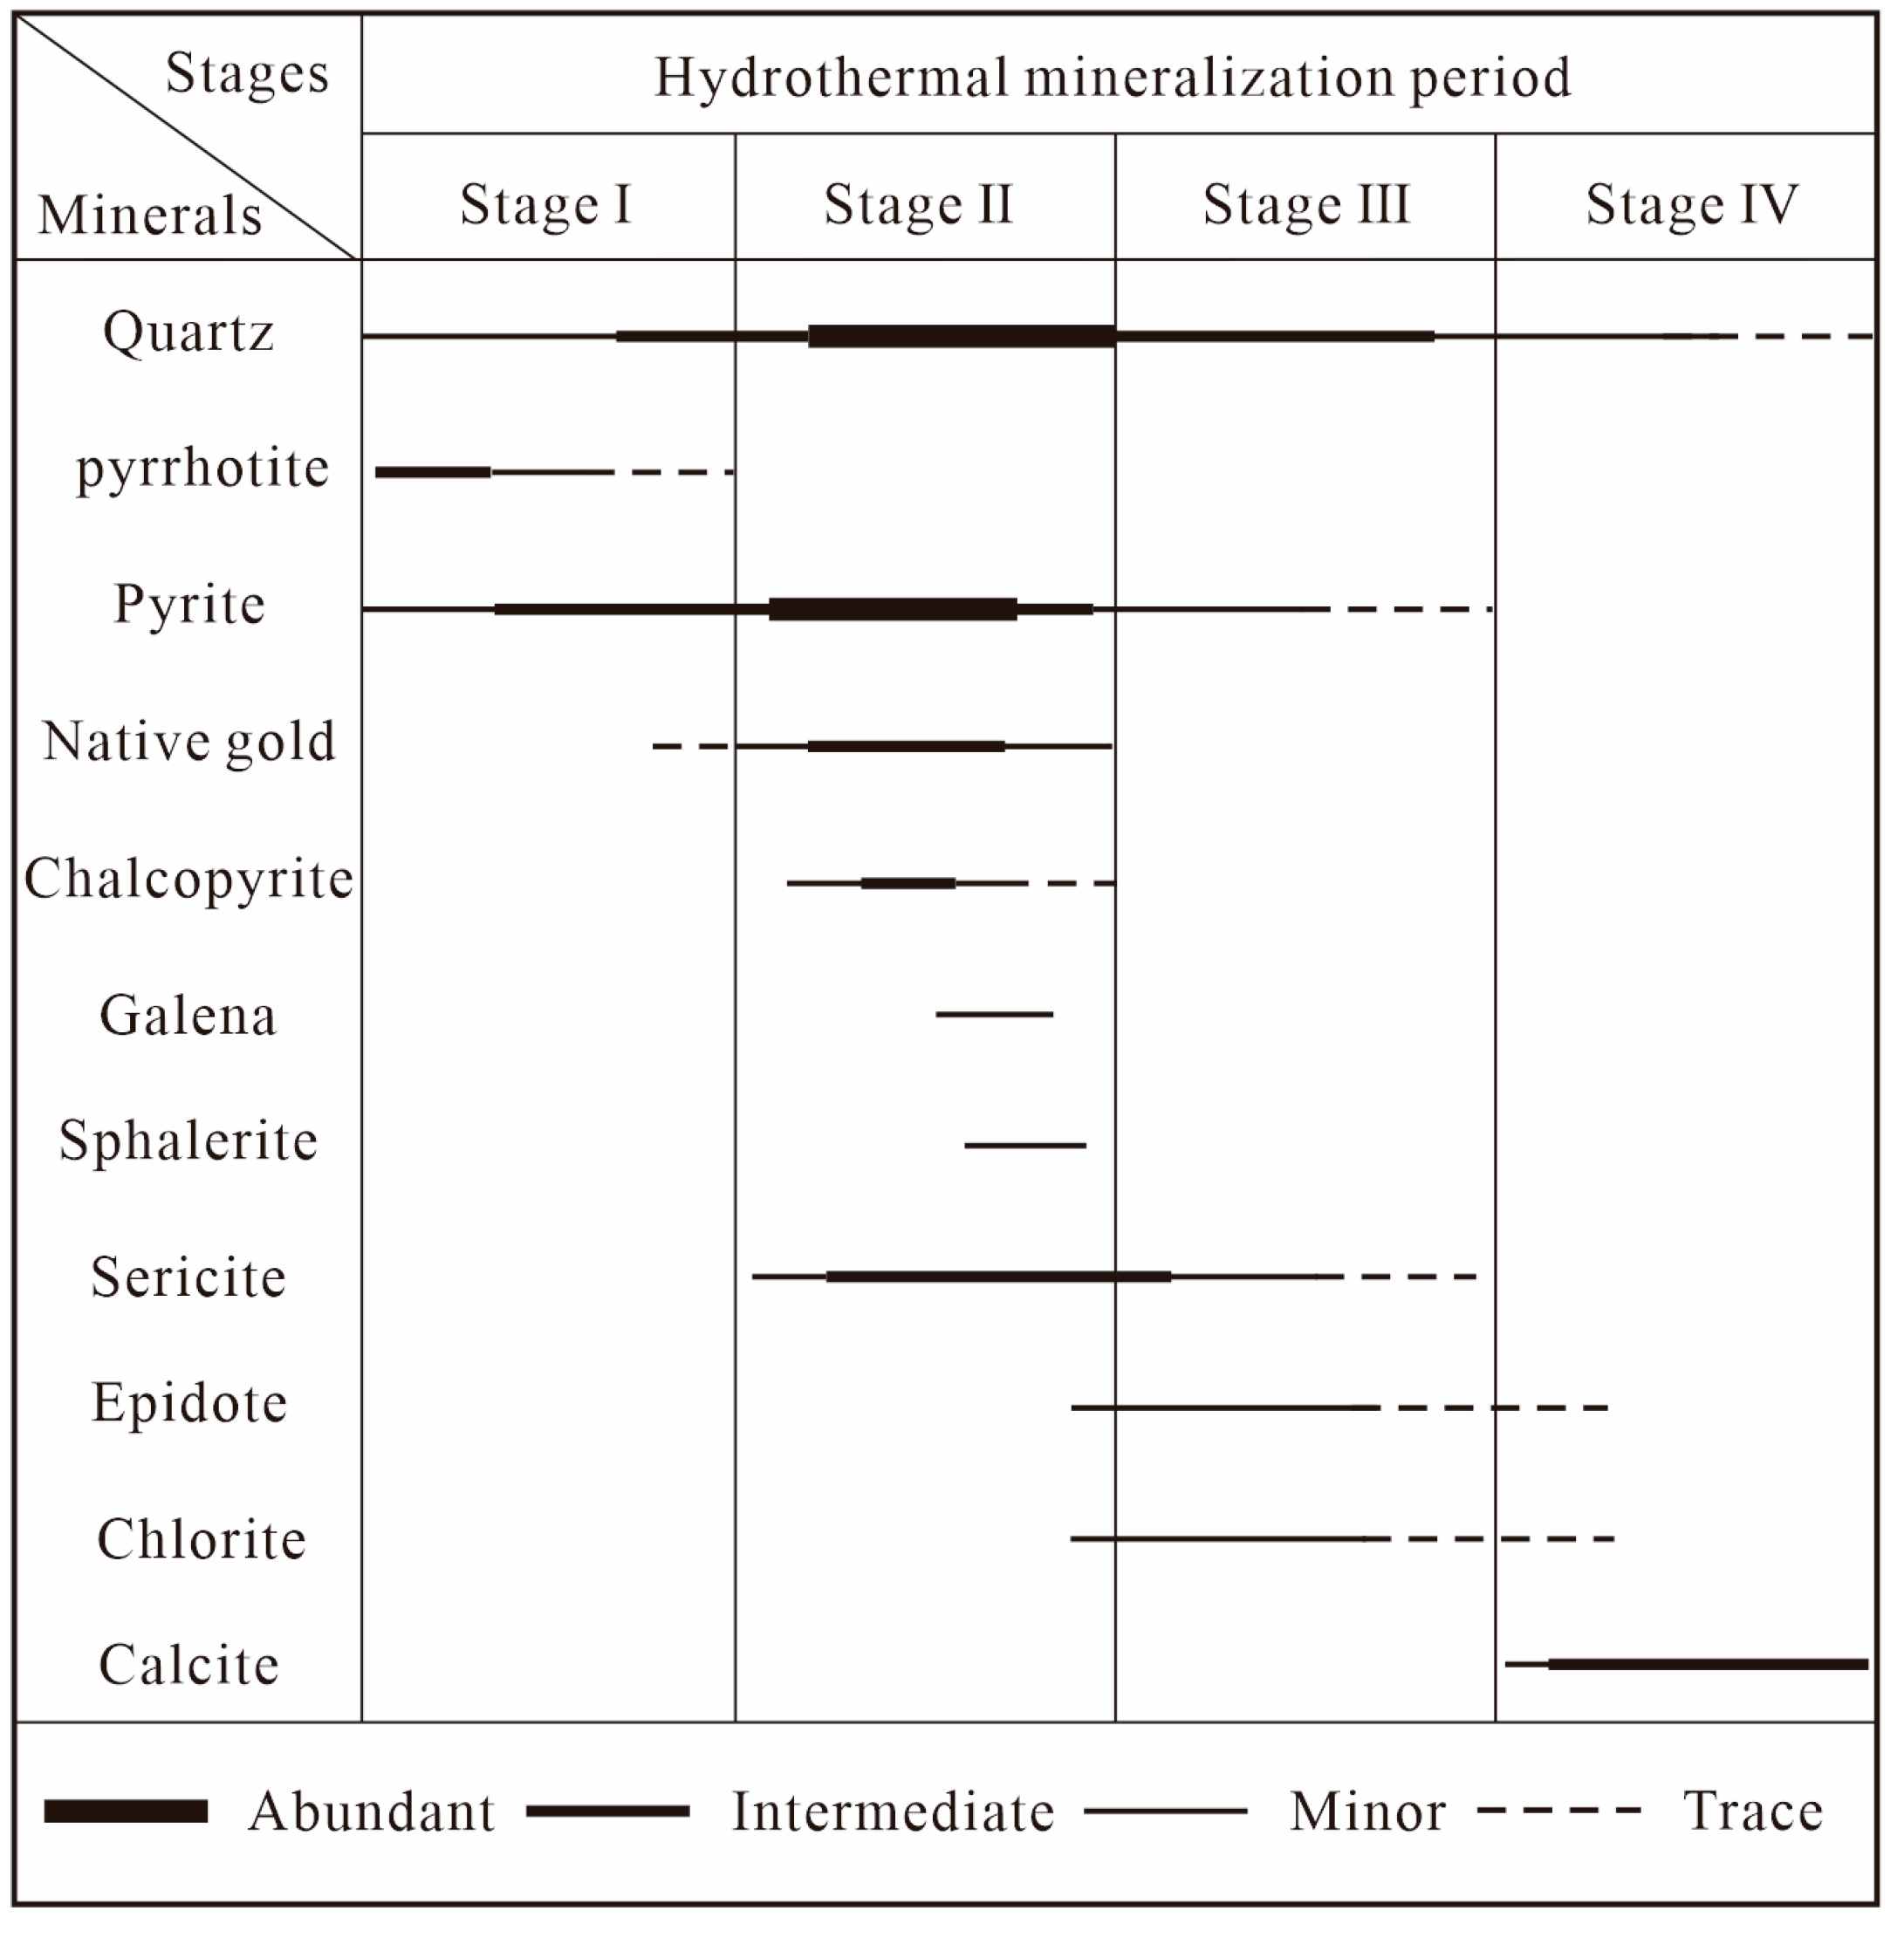
  • The Songjianghe Au deposit is a magmatic hydrothermal gold deposit formed in the intermittent stage of Paleo-Pacific plate subduction during the Late Jurassic. Four alteration/mineralization stages were recognized in this gold deposit: (I) A quartz-pyrrhotite-pyrite stage; (II) a quartz-polymetallic sulfides stage; (III) a quartz-pyrite stage; and (IV) a quartz-calcite-minor pyrite stage.
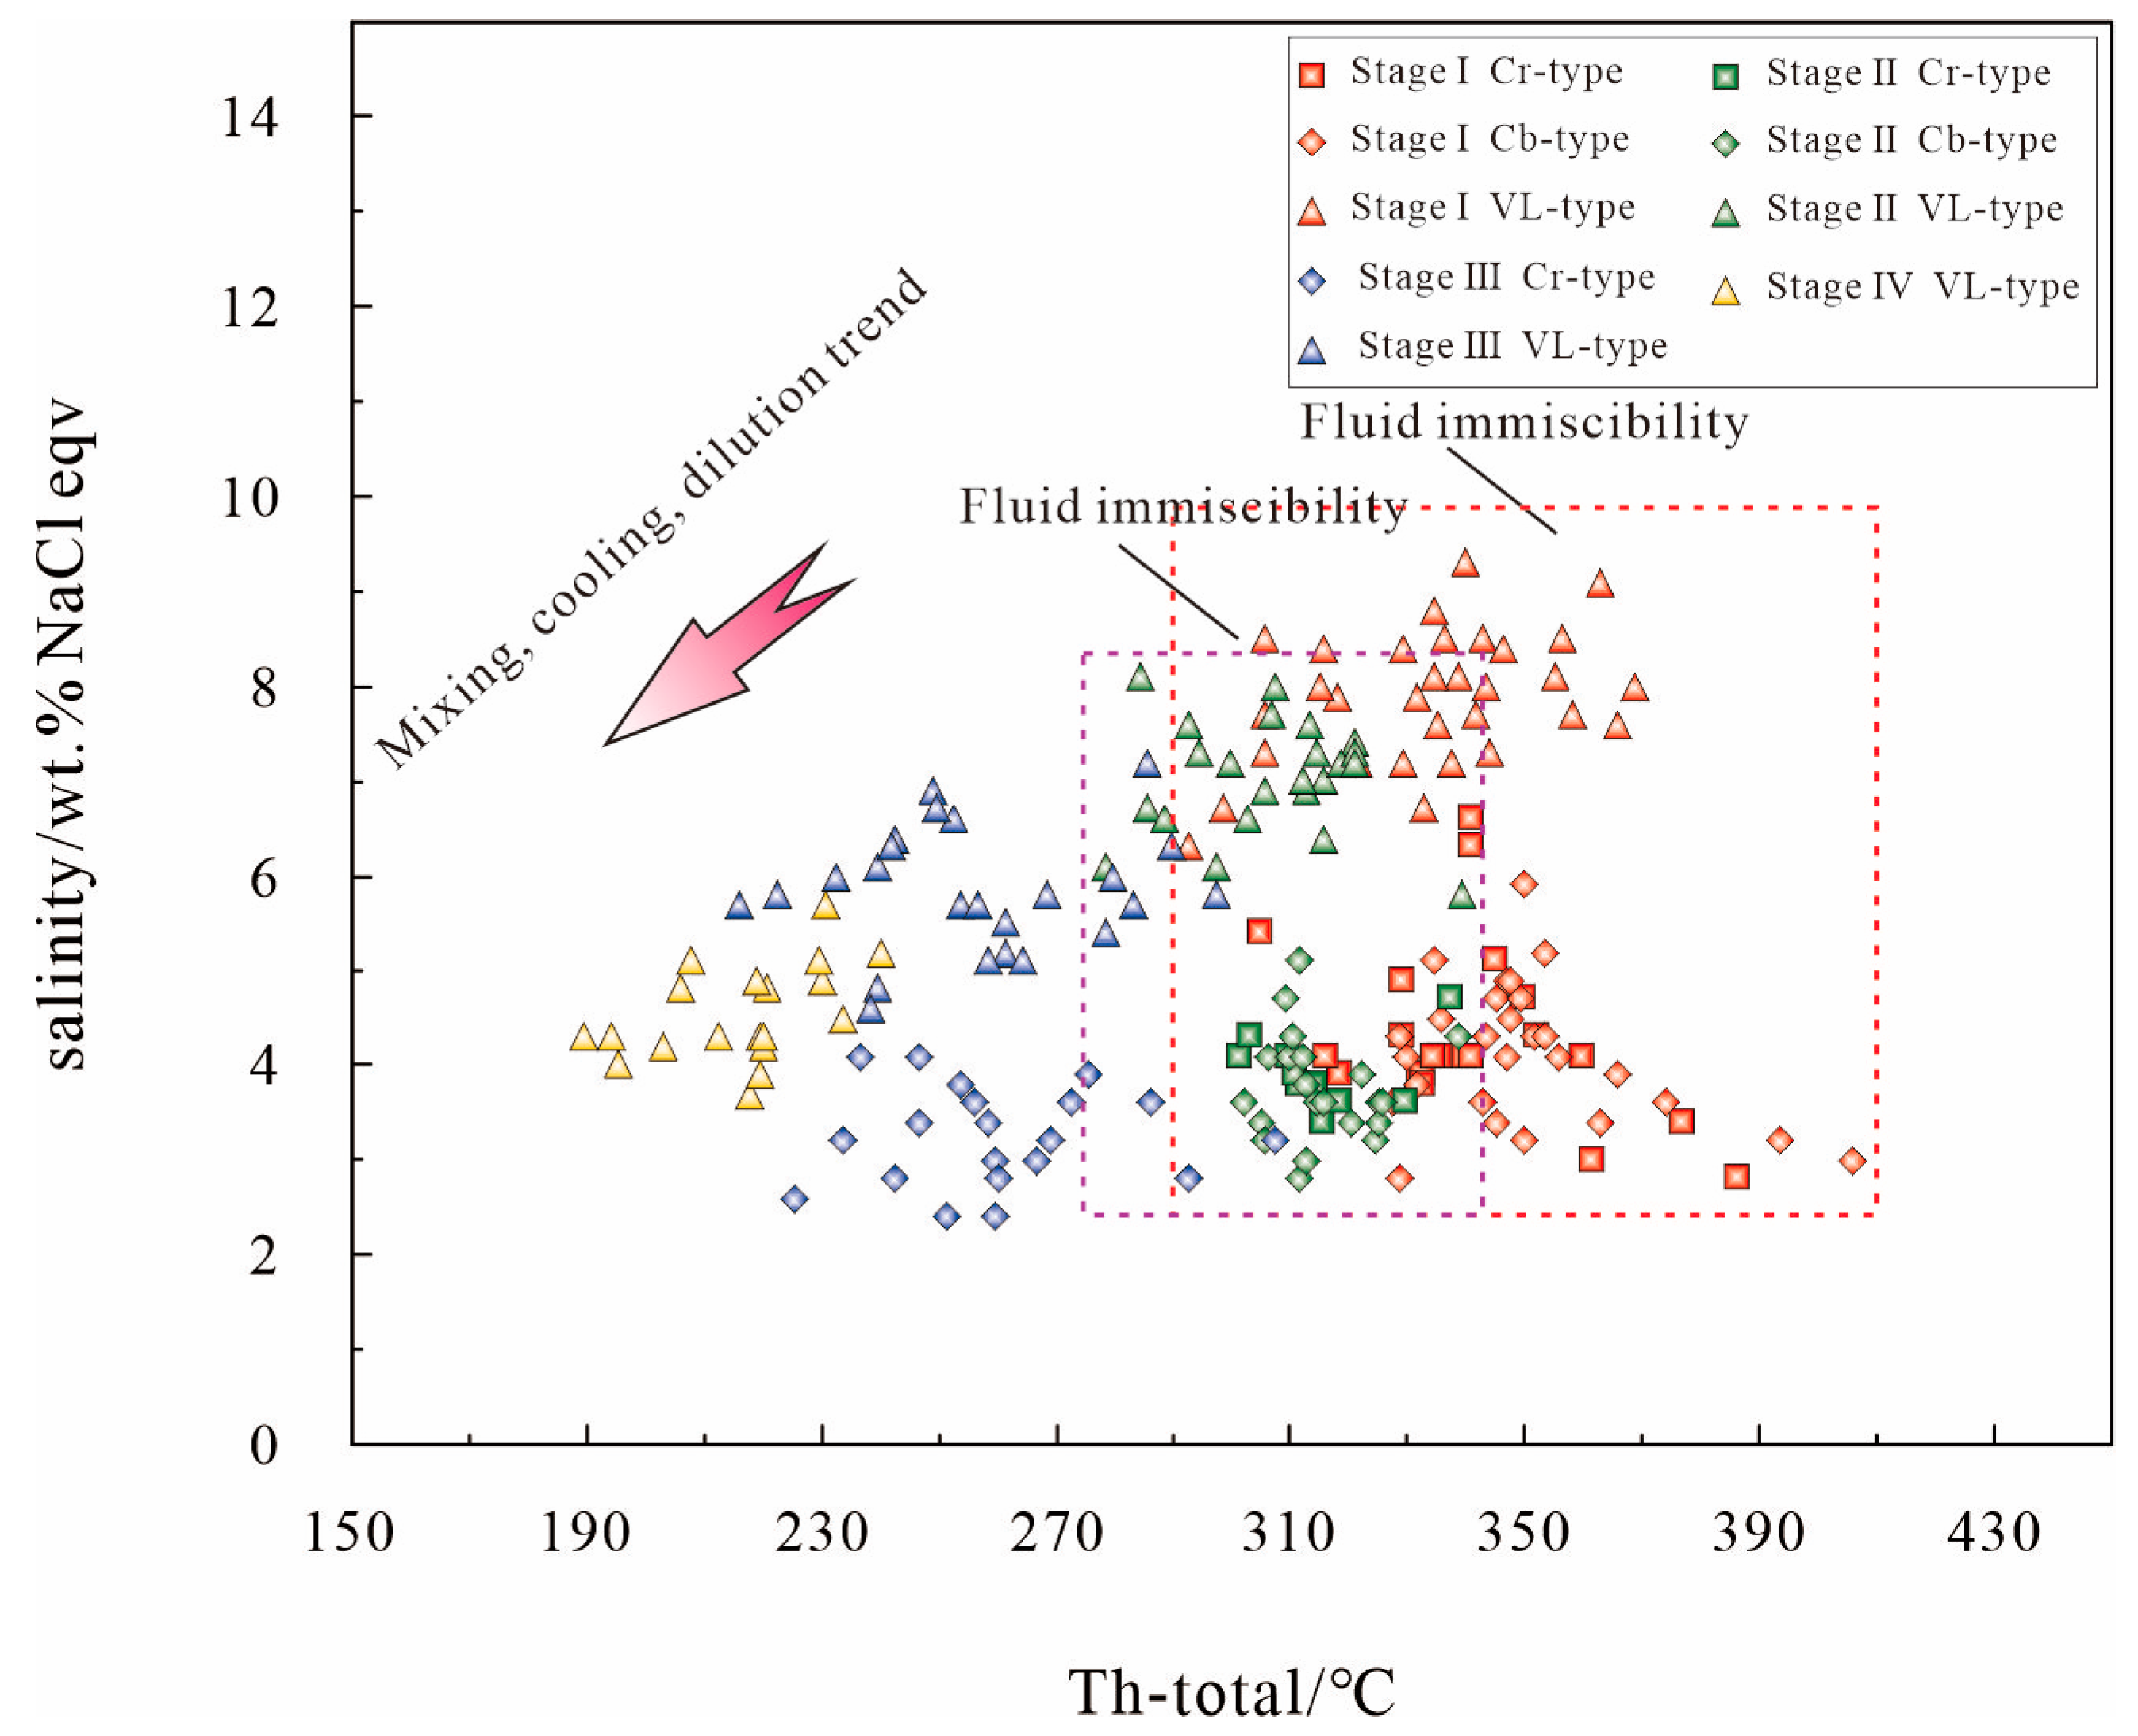
  • The ore-forming fluids have evolved from a medium-high-temperature, low-salinity immiscible CO2-NaCl-H2O ± CH4 system to a low-temperature, low-salinity homogeneous NaCl-H2O system.
  • The H-O isotope data suggest that the ore-forming fluids were dominated by magmatic water (Stage I and II) and intruded by meteoric water since Stage III.
  • Fluid immiscibility caused by the rapid drop in pressure may have been the main trigger for gold-polymetallic sulfide precipitation in the Songjianghe Au deposit.
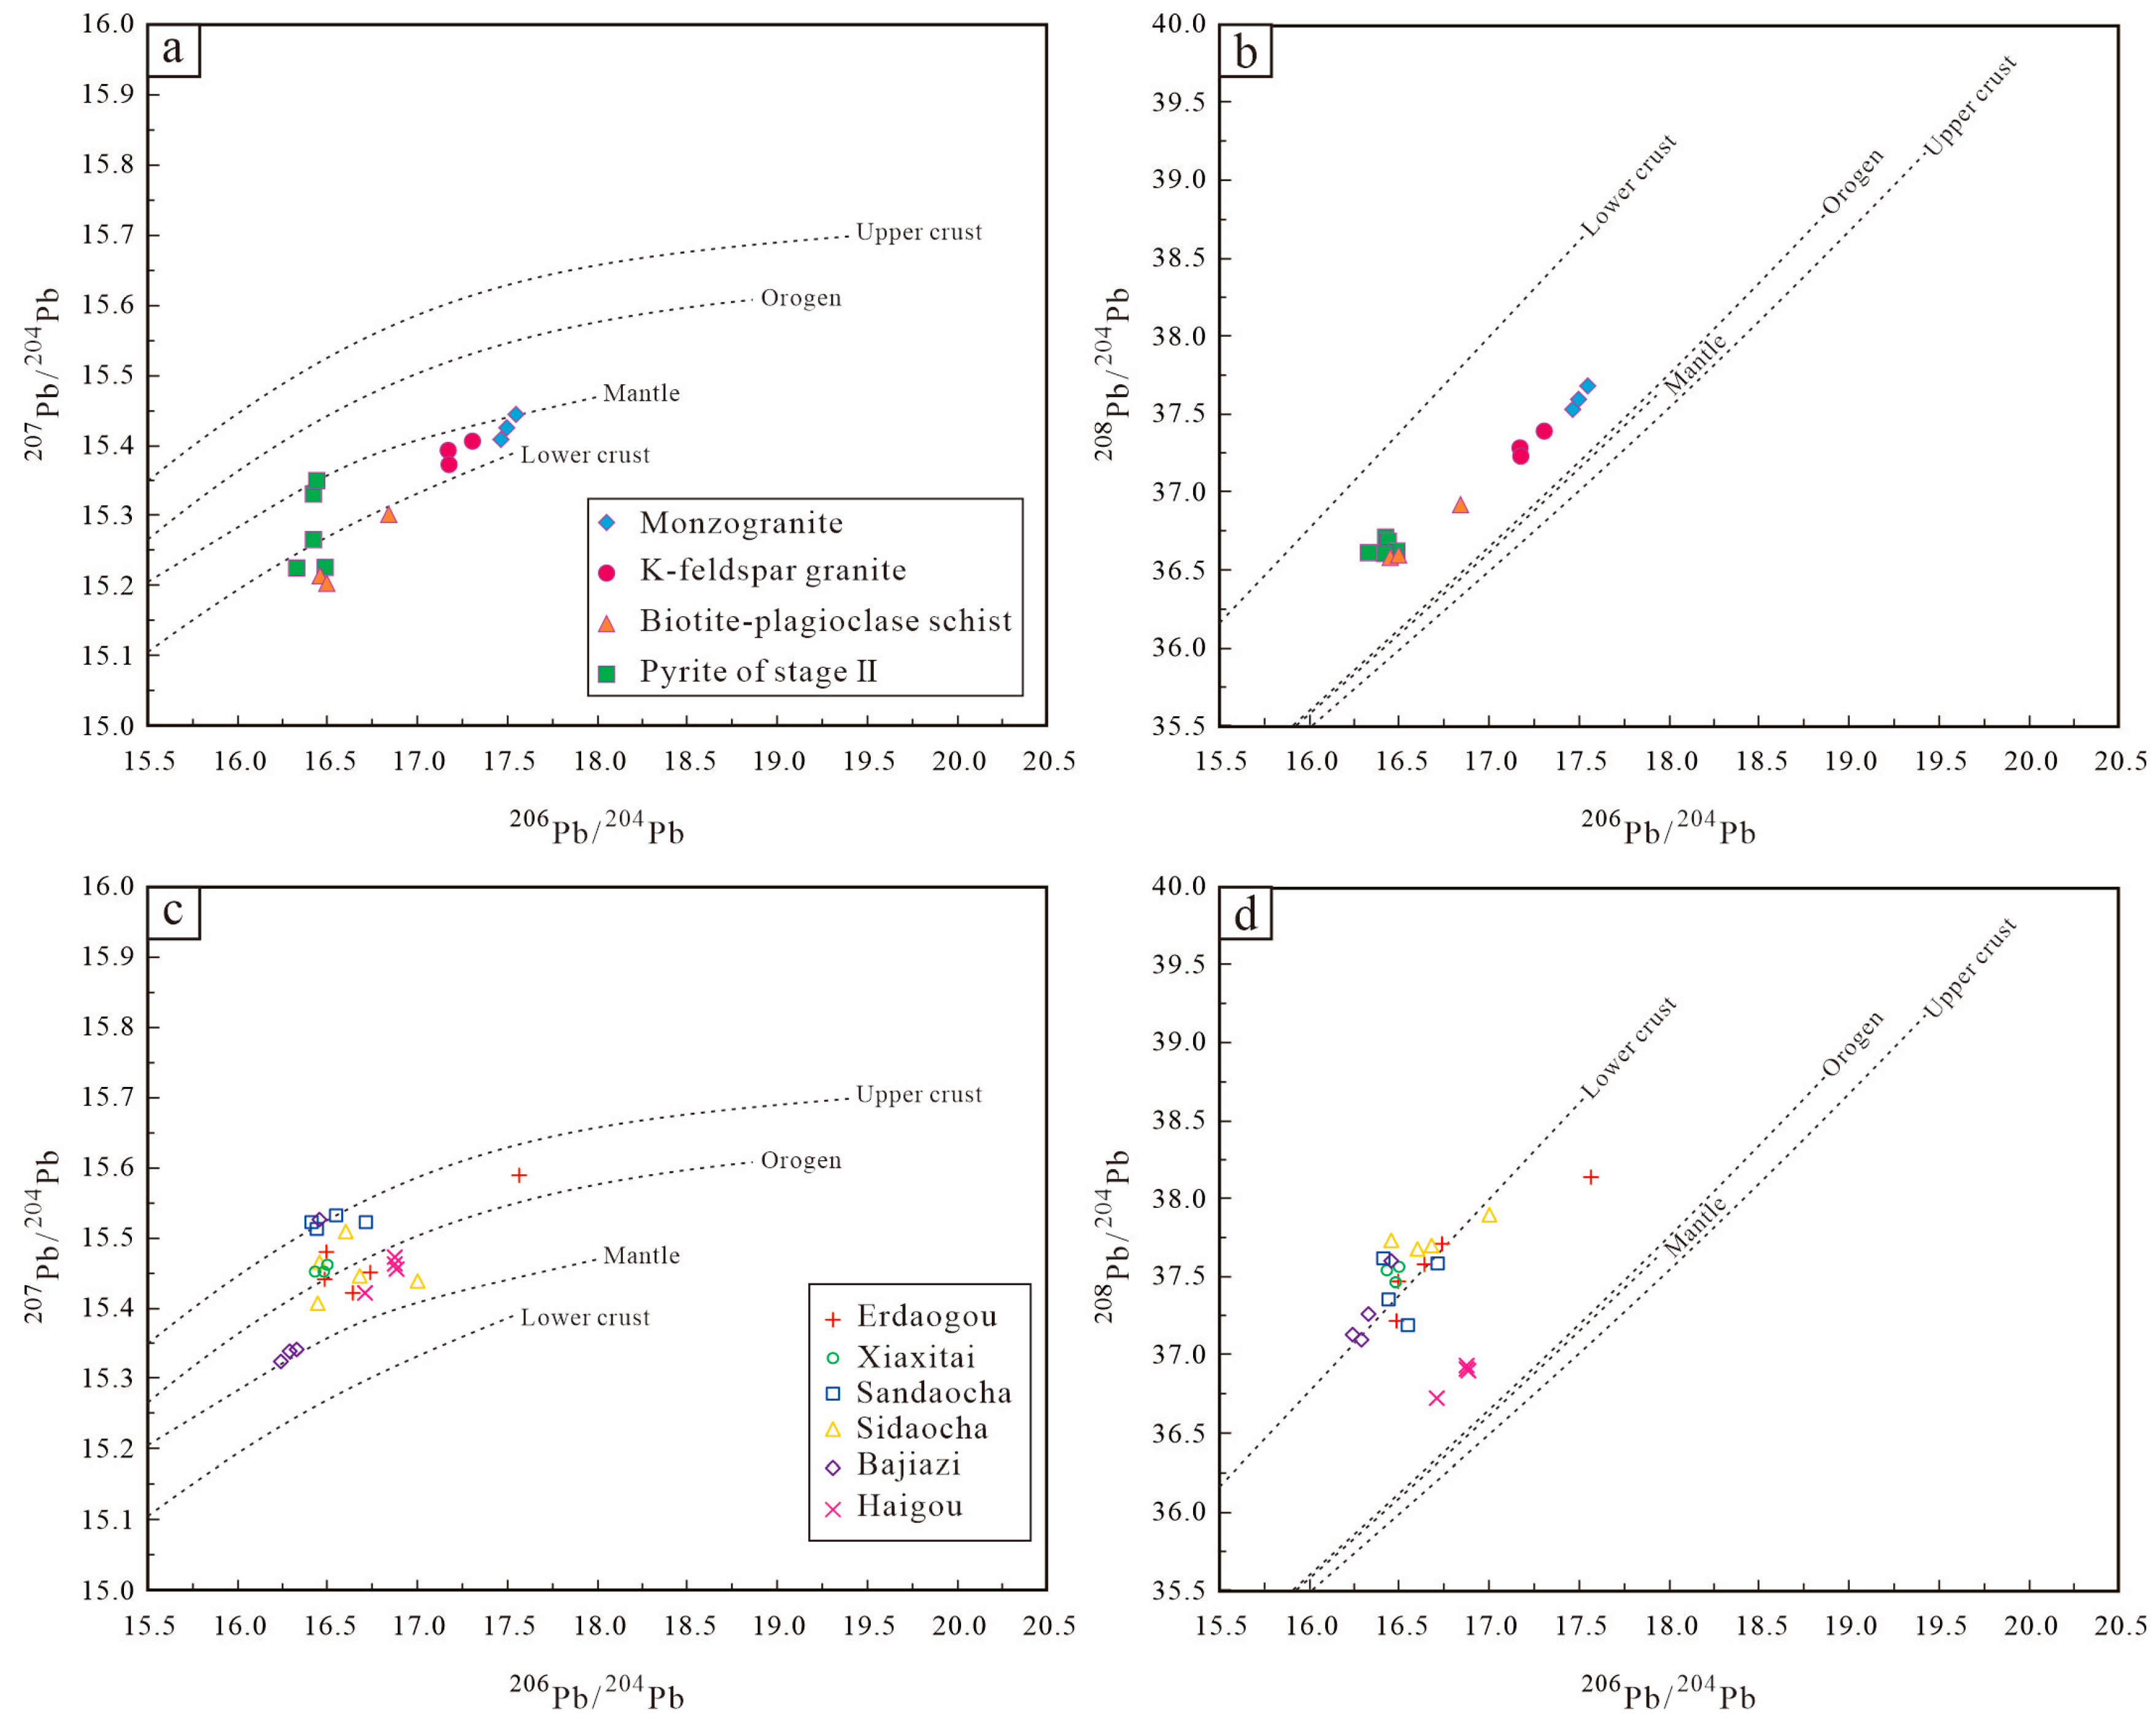
  • The S-Pb isotope data indicate that the ore-forming materials have predominantly derived from a magmatic source and may have been affected by the contamination of the Seluohe Group.

Author Contributions

Conceptualization, Q.Y. and K.W.; investigation, Q.Y., K.W., W.B., C.M. and Y.X.; funding acquisition, K.W.; project administration, K.W. and Q.S.; writing—original draft preparation, Q.Y.; writing—review and editing, Q.Y., K.W., X.Z. and Q.S. All authors have read and agreed to the published version of the manuscript.

Funding

This research was supported by the Opening Foundation of Key Laboratory of Mineral Resources Evaluation in Northeast Asia, Ministry of Land and Resources of China (DBY-ZZ-18-12, DBY-KY-18-08).

Data Availability Statement

The experimental data used to support the conclusions of this study are included within the article.

Acknowledgments

We would like to thank Gang Zhao and Hong Wei from the Songjianghe gold mine for helping with the field sampling. In addition, we wish to thank Shuo Zhao (Chinese Academy of Geological Sciences) for providing valuable advice on the manuscript, and to the anonymous reviewers and editors for their insightful comments.

Conflicts of Interest

The authors declare no conflict of interest.

References

  1. Li, L. Research on Ore-Forming Fluids of Gold Deposits in Jiapigou-Haigou Gold Belt, Jilin Province and Deep-Seated Metallogenic Assessment. Ph.D. Thesis, Jilin University, Changchun, China, 2016. (In Chinese). [Google Scholar]
  2. Zhang, X.T. Research on Geology, Geochemistry and Metallogenesis of the Gold Deposits of the Jiapigou Ore Field in the Continental Margin of Northeast China. Ph.D. Thesis, Jilin University, Changchun, China, 2018. (In Chinese). [Google Scholar]
  3. Liu, S.F.; Wang, Q.F.; Groves, D.I.; Wang, Z.M.; Yang, L.; Wu, Z.L.; Yu, Z.Y.; Huang, P.F.; Deng, J. Adoption of a mineral system model in successful deep exploration at Erdaogou, China’s deepest gold mine, on the northeastern margin of the North China Craton. Ore Geol. Rev. 2021, 131, 104060. [Google Scholar] [CrossRef]
  4. Sun, Z.S.; Feng, Y.M. Main minerogenetic epoch, determine and exploratory direction of Jiapigou gold deposit, Jilin. Acta Geosci. Sin. 1997, 18, 367–372. (In Chinese) [Google Scholar]
  5. Zhang, S.; Zeng, Q.D.; Liu, J.M.; Wang, Z.C.; Gao, J.H. The characteristics and its geological significance of fluid inclusions in Haigou Lode gold deposit, Jilin Province. Acta Petrol. Sin. 2011, 27, 1287–1298. (In Chinese) [Google Scholar]
  6. Yang, L.Y.; Yang, L.Q.; Yuan, W.M.; Zhang, C.; Zhao, K.; Yu, H.J. Origin and evolution of ore fluid for orogenic gold traced by D-O isotopes: A case from the Jiapigou gold belt, China. Acta Petrol. Sin. 2013, 29, 4025–4035. (In Chinese) [Google Scholar]
  7. Deng, J.; Yuan, W.M.; Carranza, E.J.M.; Yang, L.Q.; Wang, C.M.; Yang, L.Y.; Hao, N.N. Geochronology and thermochronometry of the Jiapigou gold belt, northeastern China: New evidence for multiple episodes of mineralization. J. Asian Earth Sci. 2014, 89, 10–27. [Google Scholar] [CrossRef]
  8. Li, L.; Sun, J.G.; Men, L.J.; Chai, P. Origin and evolution of the ore-forming fluids of the Erdaogou and Xiaobeigou gold deposits, Jiapigou gold province, NE China. J. Asian Earth Sci. 2016, 129, 170–190. [Google Scholar] [CrossRef]
  9. Li, L.; Sun, J.; Men, L.; Chai, P. Genesis of the Haigou gold deposit, Jilin Province, NE China: Evidence from fluid inclusions, 40Ar/39Ar geochronology and isotopes. Geol. J. 2017, 52, 992–1008. [Google Scholar] [CrossRef]
  10. Liu, J.; Li, T.G.; Duan, C. Rb-Sr Isochron Dating and Isotopic Geochemistry Characteristics of the Bajiazi Large Gold Deposit, Jilin Province, China. Acta Geol. Sin. 2018, 92, 1432–1446, (In Chinese with English Abstract). [Google Scholar]
  11. Zhai, D.G.; Williams-Jones, A.E.; Liu, J.J.; Selby, D.; Li, C.; Huang, X.W.; Qi, L.; Guo, D.H. Evaluating the Use of the Molybdenite Re-Os Chronometer in Dating Gold Mineralization: Evidence from the Haigou Deposit, Northeastern China. Econ. Geol. 2019, 114, 897–915. [Google Scholar] [CrossRef]
  12. Li, J.J.; Shen, B.F.; Mao, D.B.; Li, S.B.; Zhou, H.F. Metallogenic epochs of the Jiapigou gold deposit, Jilin Province, China. Acta Geol. Sin. 1996, 70, 335–341, (In Chinese with English Abstract). [Google Scholar]
  13. Dai, J.Z.; Wang, K.Y.; Cheng, X.M. Geochemical features of ore-forming fluids in the Jiapigou gold belt, Jilin Province. Acta Petrol. Sin. 2007, 23, 2198–2206, (In Chinese with English Abstract). [Google Scholar]
  14. Huang, Z.X.; Yuan, W.M.; Wang, C.M.; Liu, X.W.; Xu, X.T.; Yang, L.Y. Metallogenic epoch of the Jiapigou gold belt, Jilin Province, China. Constrains from rare earth element, fluid inclusion geochemistry and geochronology. J. Earth Syst. Sci. 2012, 121, 1401–1420. [Google Scholar] [CrossRef]
  15. Feng, Y.Y. A Study on the Genesis of Bajiazi Gold Ore in Jiapigou, Jilin Province. Master’s Thesis, Jilin University, Changchun, China, 2017. (In Chinese). [Google Scholar]
  16. Sun, Z.S.; Feng, B.Z.; Qing, X. The stable isotopic geology and exploration direction of the Jiaopigou gold ore deposit, Jilin Province. J. Chang. Univ. Sci. Technol. 1998, 28, 142–147. (In Chinese) [Google Scholar]
  17. Zeng, Q.D.; Wang, Z.C.; He, H.Y.; Wang, Y.B.; Liu, J.M. Multiple isotope composition (S, Pb, H, O, He, and Ar) and genetic implications for gold deposits in the Jiapigou gold belt, Northeast China. Miner. Depos. 2014, 49, 145–164. [Google Scholar] [CrossRef]
  18. Shen, B.F.; Peng, X.L.; Luo, H.; Mao, D.B. Archean greenstone belts in China. Acta Geol. Sin. 1993, 67, 208–220, (In Chinese with English Abstract). [Google Scholar]
  19. Xu, X.T. On the Magmatic Rocks and Ore-Forming Fluid in the Jiapigou Gold Belt, Jilin Province. Master’s Thesis, China University of Geosciences, Beijing, China, 2010. (In Chinese). [Google Scholar]
  20. Huang, Z.X. Tectonics–Fluids–Mineralization System of Jiapigou Gold Belt in Jilin Province, China. Ph.D. Thesis, China University of Geosciences, Beijing, China, 2012. (In Chinese). [Google Scholar]
  21. Miao, L.C.; Qiu, Y.M.; Fan, W.M.; Zhang, F.Q.; Zhai, M.G. Geology, geochronology, and tectonic setting of the Jiapigou gold deposits, southern Jilin Province, China. Ore Geol. Rev. 2005, 26, 137–165. [Google Scholar] [CrossRef]
  22. Yu, H.J. On the Geology Geochemistry and Genetic Model Study of the Jiapigou Ore Deposit of Jilin Province. Master’s Thesis, China University of Geosciences, Beijing, China, 2009. (In Chinese). [Google Scholar]
  23. Zeng, Q.D.; Wang, Z.C.; Zhang, S.; Wang, Y.B.; Yang, Y.H.; Liu, J.M. The ore-forming epoch of the Jiapigou gold belt, NE China: Evidences from the zircon LA–ICP–MS U–Pb dating of the intrusive rocks. Acta Geol. Sin. 2014, 88, 1029–1030. [Google Scholar] [CrossRef]
  24. Li, B.L.; Chen, G.J.; Song, Z.W. Discussion on minerogenetic epoch of the gold deposit in Jiapigou of Jilin Province. Glob. Geol. 2004, 23, 354–359, (In Chinese with English Abstract). [Google Scholar]
  25. Li, B. Study on Geological Characteristics and Genesis of Songjianghe Gold Deposit, Dunhua City, Jilin Province. Master’s Thesis, Jilin University, Changchun, China, 2015. (In Chinese). [Google Scholar]
  26. Yang, Y. Geological Characteristics and Prospecting Direction of Songjianghe Gold Deposit in Dunhua City, Jilin Province. Master’s Thesis, Jilin University, Changchun, China, 2019. (In Chinese). [Google Scholar]
  27. Jin, H.Y.; Yu, Z.T.; Wu, J.X. Characteristics of fluid inclusions and genesis of Songjianghe gold deposit in Jilin Province. Glob. Geol. 2014, 33, 76–85, (In Chinese with English Abstract). [Google Scholar]
  28. Qin, Z.; Sun, D.Y.; Zhang, J.L.; Li, L.W.; Wang, Z.Y.; Li, X.J. Characteristics of fluid inclusions and metallogenic physicochemical conditions of Songjianghe Gold Deposit in Dunhua, Jilin Province. Gold 2019, 40, 14–18+22, (In Chinese with English Abstract). [Google Scholar]
  29. Liu, Y.M.; Sun, J.G.; Li, X.M.; Song, Q.H.; Wang, Q.H.; Zhang, X.T. Geology, fluid inclusion and genesis of Songjianghe gold deposit in Dunhua City, Jilin Province. Glob. Geol. 2021, 40, 273–287, (In Chinese with English Abstract). [Google Scholar]
  30. Lu, Q.; Sun, J.G.; An, J.H.; Han, J.L.; Chu, X.L. Petrogenesis and Forming Environment of Mesozoic Porphyritic Granite in Songjianghe Region of Dunhua, Jilin Province: Evidences from Element Geochemistry, Hf Isotope and U-Pb. J. Jilin Univ. 2019, 49, 673–689, (In Chinese with English Abstract). [Google Scholar]
  31. Zhang, X.T.; Sun, J.G.; Yu, Z.T.; Song, Q.H. LA-ICP-MS zircon U–Pb and sericite 40Ar/39Ar ages of the Songjianghe gold deposit in southeastern Jilin Province, Northeast China, and their geological significance. Can. J. Earth Sci. 2019, 56, 607–628. [Google Scholar] [CrossRef]
  32. Hou, S.H.; Sang, H.Q. 40Ar/39Ar fast neutron activation dating method for sericite from Liupiye gold deposit, Jilin Province. Miner. Depos. 2004, 23, 502–508, (In Chinese with English Abstract). [Google Scholar]
  33. Zeng, Q.D.; He, H.Y.; Zhu, R.X.; Zhang, S.; Wang, Y.B.; Su, F. Origin of ore-forming fluids of the Haigou gold deposit in the eastern Central Asian Orogenic belt, NE China: Constraints from H-O-He-Ar isotopes. J. Asian Earth Sci. 2017, 144, 384–397. [Google Scholar] [CrossRef]
  34. Şengör, A.M.C.; Natal’in, B.A.; Burtman, V.S. Evolution of the Altaid tectonic collage and Paleozoic crustal growth in Eurasia. Nature 1993, 364, 299–307. [Google Scholar] [CrossRef]
  35. Jahn, B.M.; Wu, F.Y.; Chen, B. Massive granitoid generation in central Asia: Nd isotopic evidence and implication for continental growth in the Phanerozoic. Episodes 2000, 23, 82–92. [Google Scholar] [CrossRef]
  36. Windley, B.F.; Alexeiev, D.; Xiao, W.J.; Kröner, A.; Badarch, G. Tectonic model for accretion of the Central Asian Orogenic Belt. J. Geol. Soc. 2007, 164, 31–47. [Google Scholar] [CrossRef]
  37. Guo, F.; Fan, W.M.; Gao, X.F.; Li, C.W.; Miao, L.C.; Zhao, L.; Li, H.X. Sr–Nd–Pb isotope mapping of Mesozoic igneous rocks in NE China: Constraints on tectonic framework and Phanerozoic crustal growth. Lithos 2010, 120, 563–578. [Google Scholar] [CrossRef]
  38. Kravchinsky, V.A.; Cogn, J.P.; Harbert, W.P.; Kuzmin, M.I. Evolution of the Mongol-Okhotsk Ocean as constrained by new palaeomagnetic data from the Mongol-Okhotsk suture zone, Siberia. Geophys. J. R. Astron. Soc. 2010, 148, 34–57. [Google Scholar] [CrossRef]
  39. Cao, H.H.; Xu, W.L.; Pei, F.P.; Wang, Z.W.; Wang, F.; Wang, Z.J. Zircon U–Pb geochronology and petrogenesis of the Late Paleozoic–Early Mesozoic intrusive rocks in the eastern segment of the northern margin of the North China Block. Lithos 2013, 170–171, 191–207. [Google Scholar] [CrossRef]
  40. Yu, J.J.; Wang, F.; Xu, W.L.; Gao, F.H.; Tang, J. Late Permian tectonic evolution at the southeastern margin of the Songnen–Zhangguangcai range massif, NE China: Constraints from geochronology and geochemistry of granitoids. Gondwana Res. 2013, 24, 635–647. [Google Scholar] [CrossRef]
  41. Wilde, S.A. Final amalgamation of the Central Asian orogenic belt in NE China: Paleo-Asian Ocean closure versus Paleo-Pacific plate subduction—A review of the evidence. Tectonophysics 2015, 662, 345–362. [Google Scholar] [CrossRef]
  42. Zhou, J.B.; Wilde, S.A.; Zhao, G.C.; Han, J. Nature and assembly of microcontinental blocks within the Paleo-Asian Ocean. Earth-Sci. Rev. 2018, 186, 76–93. [Google Scholar] [CrossRef]
  43. Wu, F.Y.; Zhao, G.C.; Sun, D.Y.; Wilde, S.A.; Zhang, G.L. The Hulan Group: Its role in the evolution of the Central Asian Orogenic Belt of NE China. J. Asian Earth Sci. 2007, 30, 542–556. [Google Scholar] [CrossRef]
  44. Wu, F.Y.; Sun, D.Y.; Ge, W.C.; Zhang, Y.B.; Grant, M.L.; Wilde, S.A.; Jahn, B.M. Geochronology of the Phanerozoic granitoids in northeastern China. J. Asian Earth Sci. 2011, 41, 1–30. [Google Scholar] [CrossRef]
  45. Huang, H.; Zhang, Z.C.; Santosh, M.; Zhang, D.Y.; Wang, T. Petrogenesis of the Early Permian volcanic rocks in the Chinese South Tianshan: Implications for crustal growth in the Central Asian Orogenic Belt. Lithos 2015, 228–229, 23–42. [Google Scholar] [CrossRef]
  46. Bo, H.; Zhang, Z.; Santosh, M.; Cheng, Z.; Xie, Q.; Kong, W.; Liu, B.; Qin, J.; Li, B. Petrogenesis of an Early Permian bimodal intermediate-felsic suite in the East Junggar in Central Asian Orogenic Belt and tectonic implications. Geol. J. 2020, 56, 547–571. [Google Scholar] [CrossRef]
  47. Wilde, S.A.; Zhang, X.Z.; Wu, F.Y. Extension of a newly-identified 500 Ma metamorphic terrain in northeast China: Further U–Pb SHRIMP dating of the Mashan Complex, Heilongjiang Province, China. Tectonophysics 2000, 328, 115–130. [Google Scholar] [CrossRef]
  48. Zhou, J.B.; Wilde, S.A. The crustal accretion history and tectonic evolution of the NE China segment of the Central Asian Orogenic Belt. Gondwana Res. 2013, 23, 1365–1377. [Google Scholar] [CrossRef]
  49. Han, J.L. Metallogenesis and Geodynamic Setting of the Typical Gold Deposits in the Liuhe Area of the Huadian City, Jilin Province. Ph.D. Thesis, Jilin University, Changchun, China, 2019. (In Chinese). [Google Scholar]
  50. Zhou, J.B.; Wang, B.; Wilde, S.A.; Zhao, G.C.; Cao, J.L.; Zheng, C.Q.; Zeng, W.S. Geochemistry and U-Pb Zircon Dating of the Toudaoqiao Blueschists in the Great Xing’an Range, Northeast China, and Tectonic Implications. J. Asian Earth Sci. 2015, 97, 197–210. [Google Scholar] [CrossRef]
  51. Zhou, X.D.; Zhu, D.Y.; Sun, Y.J. The Precambrian strata of Jilin Province. Jilin Geol. 2006, 25, 1–10. (In Chinese) [Google Scholar]
  52. Guo, B.R.; Liu, S.W.; Zhang, J.; Wang, W.; Fu, J.H.; Wang, M.J. Neoarchean Andean-type active continental margin in the northeastern North China Craton: Geochemical and geochronological evidence from metavolcanic rocks in the Jiapigou granite-greenstone belt, Southern Jilin Province. Precambr. Res. 2016, 285, 147–169. [Google Scholar] [CrossRef]
  53. Qin, Y.; Chen, D.D.; Liang, Y.H.; Zou, C.M.; Bai, L.A. Geochronology of Ji’an group in Tonghua area, Southern Jilin province. Earth Sci. -J. China Univ. Geosci. 2014, 39, 1587–1599, (In Chinese with English Abstract). [Google Scholar]
  54. Liu, Z.H.; Liu, Y.Q.; Feng, B.Z. The establishment and tectonic evolution of Proterozoic Orogenic Belt in the north margin of North China Plate. J. Chang. Univ. Sci. Technol. 2000, 30, 110–114, (In Chinese with English Abstract). [Google Scholar]
  55. Chen, Y.J.; Peng, Y.J.; Lu, X.P.; Liu, Y.W. Proterozoic tectonic slices along the northern margin of North China plate. J. Jilin Univ. 2002, 32, 134–139, (In Chinese with English Abstract). [Google Scholar]
  56. Li, C.D.; Zhang, F.Q.; Miao, L.C.; Jie, H.Q.; Hua, Y.Q.; Xu, W.Y. Reconsideration of the Seluohe Group in Seluohe area, Jilin Province. J. Jilin Univ. 2007, 37, 841–847. (In Chinese) [Google Scholar]
  57. Li, C.D.; Zhang, F.Q.; Miao, L.C.; Du, Y.L.; Hua, Y.Q.; Xu, W.Y.; Kang, S.M. Zircon SHRIMP U–Pb geochronology of the Zhangsangou Formation complex in the northeastern margin of North China Block, and its geological significance. Acta Geol. Sin. 2009, 83, 642–650. (In Chinese) [Google Scholar]
  58. Zhang, Y.B.; Wu, F.Y.; Wilde, S.A.; Zhai, M.G.; Lu, X.P.; Zhang, H.F. Geochronology and Tectonic Implications of the “Proterozoic” Seluohe Group at the Northern Margin of the North China Craton. Int. Geol. Rev. 2008, 50, 135–153. [Google Scholar] [CrossRef]
  59. Liu, Z.H.; Wang, C.; Song, J.; Gao, X.; Sun, L.N. 40Ar-39Ar dating and its tectonic significance of the Hulan Group at the northern margin of the North China Plate. Acta Petrol. Sin. 2016, 32, 2757–2764. (In Chinese) [Google Scholar]
  60. Guo, B.R.; Liu, S.W.; Santosh, M.; Wang, W. Neoarchean arc magmatism and crustal growth in the north-eastern North China Craton: Evidence from granitoid gneisses in the Southern Jilin Province. Precambrian Res. 2017, 303, 30–53. [Google Scholar] [CrossRef]
  61. Guo, B.R.; Liu, S.W.; Chen, X.; Wang, W.; Guo, R.R.; Yan, M. K–rich granitoid magmatism at the Archean–Proterozoic transition in southern Jilin: Insights into the Neoarchean crustal evolution of the northeastern part of the North China Craton. Gondwana Res. 2018, 58, 87–104. [Google Scholar] [CrossRef]
  62. Liu, Y.S.; Gao, S.; Hu, Z.C.; Gao, C.G.; Zong, K.Q.; Wang, D.B. Continental and oceanic crust recycling-induced melt-peridotite interactions in the Trans-North China Orogen: U-Pb dating, Hf isotopes and trace elements in zircons of mantle xenoliths. J. Petrol. 2010, 51, 537–571. [Google Scholar] [CrossRef]
  63. Zhang, Y.B.; Wu, F.Y.; Li, H.M.; Lu, X.P.; Sun, D.Y.; Zhou, H.Y. Single grain zircon U-Pb ages of the Huangniling granite in Jilin Province. Acta Petrol. Sin. 2002, 18, 475–481. (In Chinese) [Google Scholar]
  64. Liu, S.; Hu, R.Z.; Feng, C.X.; Feng, G.Y.; Yu, X.F.; Li, C.; Jia, D.C.; Qi, Y.Q.; Wang, T. Zircon U–Pb age, Hf isotopic compositions of Dapuchaihe adakites in eastern Jilin Province and their significance. Acta Petrol. Sin. 2009, 25, 3153–3464. (In Chinese) [Google Scholar]
  65. Xu, J.W.; Ma, G.F. Review of ten years (1981–1991) of research on the Tancheng–Lujiang fault zone. Geol. Rev. 1992, 38, 316–323, (In Chinese with English Abstract). [Google Scholar]
  66. Wang, F.; Xu, W.; Ge, W.; Yang, H.; Pei, F.; Wu, W. The offset distance of the Dunhua-Mishan Fault; Constraints from Paleozoic-Mesozoic magmatism within the Songnen-Zhangguangcai Range, Jiamusi, and Khanka massifs. Acta Petrol. Sin. 2016, 32, 1129–1140, (In Chinese with English Abstract). [Google Scholar]
  67. Xie, H.Y.; Shen, Y.C.; Jiao, X.D.; Meng, Q.Y. Discussion some important geological problems of Jiapigou gold belt, Jilin Province. Chin. J. Geol. 2000, 35, 111–120, (In Chinese with English Abstract). [Google Scholar]
  68. Deng, J.; Yang, L.Q.; Gao, B.F.; Sun, Z.S.; Guo, C.Y.; Wang, Q.F.; Wang, J.P. Fluid evolution and metallogenic dynamics during tectonic regime transition: Example from the Jiapigou gold belt in northeast China. Resour. Geol. 2009, 59, 140–152. [Google Scholar] [CrossRef]
  69. Wu, F.Y.; Li, J.W.; Evans, K.; Koenig, A.E.; Li, Z.K.; O’Brien, H.; Lahaye, Y.; Rempel, K.; Hu, S.Y.; Zhang, Z.P.; et al. Ore-forming processes of the Daqiao epizonal orogenic gold deposit, west Qinling orogen, China: Constraints from textures, trace elements, and sulfur isotopes of pyrite and marcasite, and raman spectroscopy of carbonaceous material. Econ. Geol. 2018, 113, 1093–1132. [Google Scholar] [CrossRef]
  70. Qiu, C. Metallogenic Epoch and Geodynamic Background of the Haigou Gold Deposit, Jilin Province. Master’s Thesis, Jilin University, Changchun, China, 2017. (In Chinese). [Google Scholar]
  71. Zhang, Y.B.; Wu, F.Y.; Wilde, S.A.; Zhai, M.G.; Lu, X.P.; Sun, D.Y. Zircon U–Pb ages and tectonic implications of ‘Early Paleozoic’ granitoids at Yanbian, Jilin Province, northeast China. Isl. Arc 2004, 13, 484–505. [Google Scholar] [CrossRef]
  72. Wang, G.Z.; Li, B.L.; Peng, B.; Ning, C.Q.; Yang, W.L. Songjianghe biotite monzonitic granite zircon U–Pb geochronology and geochemical significance. Glob. Geol. 2016, 19, 133–143. [Google Scholar]
  73. Roedder, E. Fluid Inclusions: An Introduction to Studies of All Types of Fluid Inclusions, Gas, Liquid, or Melt, Trapped in Materials from Earth and Space, and Their Application to the Understanding of Geologic Processes; Mineralogical Society of America: Chantilly, VA, USA, 1984; Volume 12, pp. 11–304. [Google Scholar]
  74. Clayton, R.N.; Mayeda, T.K. The use of bromine pentafluoride in the extraction of oxygen from oxides and silicates for isotopic analysis. Geochim. Cosmochim. Acta 1963, 27, 43–52. [Google Scholar] [CrossRef]
  75. Robinson, B.W.; Kusakabe, M. Quantitative preparation of sulfur dioxide, for 34S/32S analyses, from sulfides by combustion with cuprous oxide. Anal. Chem. 1975, 47, 1179–1181. [Google Scholar] [CrossRef]
  76. Wu, S.S.; Zhang, X.B.; Zhang, Y.; Huang, G.H.; Zhang, T.Z.; Lai, C.K. In-situ trace element and S isotope compositions of sulfides from the Tonggou Cu deposit, Eastern Tianshan Orogen: Implication for ore-forming process. Ore Geol. Rev. 2022, 149, 105085. [Google Scholar] [CrossRef]
  77. Chen, L.; Chen, K.; Bao, Z.; Liang, P.; Sun, T.; Yuan, H. Preparation of standards for in situ sulfur isotope measurement in sulfides using femtosecond laser ablation MC-ICP-MS. J. Anal. At. Spectrom. 2017, 32, 107–116. [Google Scholar] [CrossRef]
  78. Fan, H.R.; Li, X.H.; Zuo, Y.B.; Chen, L.; Liu, S.; Hu, F.F.; Feng, K. In-situ LA-(MC)-ICPMS and (Nano) SIMS trace elements and sulfur isotope analyses on sulfides and application to confine metallogenic process of ore deposit. Acta Petrol. Sin. 2018, 34, 3479–3496. (In Chinese) [Google Scholar]
  79. Sun, Q.F.; Wang, K.Y.; Wang, Y.C.; Cai, W.Y.; Ma, X.L. Superimposing mineralization in the Zhengguang Au-Zn deposit, NE China: Evidence from pyrite Re-Os geochronology, fluid inclusion, and H-O-S-Pb isotopes. Ore Geol. Rev. 2021, 137, 104307. [Google Scholar] [CrossRef]
  80. Lu, H.Z.; Fan, H.R.; Ni, P.; Ou, G.X.; Shen, K.; Zhang, W.H. Fluid Inclusion; Science Press: Beijing, China, 2004; pp. 193–200. (In Chinese) [Google Scholar]
  81. Hall, D.L.; Sterner, S.M.; Bodnar, R.J. Freezing point depression of NaCl–KCl–H2O solution. Econ. Geol. 1988, 83, 197–202. [Google Scholar] [CrossRef]
  82. Clayton, R.N.; O’Neil, J.R.; Mayeda, T.K. Oxygen isotope exchange between quartz and water. J. Geophys. Res. 1972, 77, 3057–3067. [Google Scholar] [CrossRef]
  83. Taylor, H.P. The application of oxygen and hydrogen isotope studies to problems of hydrothermal alteration and ore deposition. Econ. Geol. 1974, 69, 843–883. [Google Scholar] [CrossRef]
  84. Craig, H.; Lupton, J.E. Lupton primordial neon, helium and hydrogen in oceanic basalts. Earth Planet. Sci. Lett. 1976, 31, 369–385. [Google Scholar] [CrossRef]
  85. Zhang, L.G. Geological Appliance for the Stable Isotope; Shanxi Science and Technology Publishing House: Xi’an, China, 1985; pp. 54–61. (In Chinese) [Google Scholar]
  86. Hedenquist, J.W.; Lowenstern, J.B. The role of magmas in the formation of hydrothermal ore deposits. Nature 1994, 370, 519–527. [Google Scholar] [CrossRef]
  87. Wutiepu, W. Multi-Information Metallogenic Prediction of Gold Deposits in Jiapigou Metallogenic Belt, Jilin Province. Ph.D. Thesis, Jilin University, Changchun, China, 2019. (In Chinese). [Google Scholar]
  88. Li, S.R.; Santosh, M. Metallogeny and craton destruction: Records from the North China Craton. Ore Geol. Rev. 2014, 56, 376–414. [Google Scholar] [CrossRef]
  89. Gao, S. Properties and Mineralizing Significance of CO2-Rich Fluid in Haigou Gold Deposit, Jilin Province. Master’s Thesis, Jilin University, Changchun, China, 2016. (In Chinese). [Google Scholar]
  90. Chen, Y.L.; Li, H.; Zheng, C.Y.; Maoayipu, N.; Khan, R. Genesis and ore prospecting model of Haigou gold deposit in Jilin Province: Evidence from LA-ICP-MS trace element and sulfur isotopic analysis of pyrite. J. Cent. South Univ. 2021, 52, 2990–3002. (In Chinese) [Google Scholar]
  91. Zartman, R.E.; Doe, B.R. Plumbotectonics-the model. Tectonophysics 1981, 75, 135–162. [Google Scholar] [CrossRef]
  92. Liu, Y.Q. Isotope geochemistry and metallogenic regularity of the Haigou gold deposit in Jilin Province. Miner. Depos. 1991, 10, 131–142. (In Chinese) [Google Scholar]
  93. Yang, L.Y. The Geochemistry and Genesis of Jiapigou Gold Deposit in Jilin Province. Master’s Thesis, China University of Geosciences, Beijing, China, 2011. (In Chinese). [Google Scholar]
  94. Roedder, E.; Bodnar, R.J. Geologic pressure determinations from fluid inclusion studies. Annu. Rev. Earth Planet. Sci. 1980, 8, 263–301. [Google Scholar] [CrossRef]
  95. Brown, P.E.; Hagemann, S.G. MacFlincor and its application to fluid in Archean lode-gold deposits. Geochim. Cosmochim. Acta 1995, 59, 3943–3952. [Google Scholar] [CrossRef]
  96. Bouzari, F.; Clark, A.H. Prograde evolution and geothermal affinities of a major porphyry copper deposit: The Cerro Colorado hypogene protore, I region, northern Chile. Econ. Geol. 2006, 101, 95–134. [Google Scholar] [CrossRef]
  97. Ohmoto, H. Stable isotope geochemistry of ore deposits. Rev. Mineral. Geochem. 1986, 16, 491–559. [Google Scholar]
  98. Heinrich, C.A. The physical and chemical evolution of low-salinity magmatic fluids at the porphyry to epithermal transition: A thermodynamic study. Miner. Depos. 2005, 39, 864–889. [Google Scholar] [CrossRef]
  99. Mao, J.W.; Wang, Y.T.; Li, H.M.; Pirajno, F.; Zhang, C.Q.; Wang, R.T. The relationship of mantle-derived fluids to gold metallogenesis in the Jiaodong Peninsula: Evidence from D-O-C-S isotope systematics. Ore Geol. Rev. 2008, 33, 361–381. [Google Scholar] [CrossRef]
  100. Lowenstern, J.B. Carbon dioxide in magmas and implications for hydrothermal systems. Miner. Depos. 2001, 36, 490–502. [Google Scholar] [CrossRef]
  101. Sibson, R.H.; Robert, F.; Poulsen, H. High angle reverse faults fluid pressure cycling and mesothermal gold quartz deposits. Geology 1988, 16, 551–555. [Google Scholar] [CrossRef]
  102. Gammons, C.H.; Williams-Jones, A.E.; Yu, Y. New data on the stability of gold (I) chloride complexes at 300 °C. Mineral. Mag. 1994, 58, 309–310. [Google Scholar] [CrossRef]
  103. Benning, L.G.; Seward, T.M. Hydrosulfide complexing of Au (I) in hydrothermal solutions from 150 to 400 °C and 500–1500 bar. Geochim. Cosmochim. Acta 1996, 60, 1849–1871. [Google Scholar] [CrossRef]
  104. Phillips, G.N.; Evans, K.A. Role of CO2 in the formation of gold deposits. Nature 2004, 429, 860–863. [Google Scholar] [CrossRef]
  105. Guha, J.; Lu, H.Z.; Dube, B.; Robert, F.; Gagnon, M. Fluid characteristics of vein and altered wall rock in Archean mesothermal gold deposits. Econ. Geol. 1991, 86, 667–684. [Google Scholar] [CrossRef]
  106. Reed, M.H.; Spycher, N.F. Boiling, cooling, and oxidation in epithermal system: A numerical modeling approach. Rev. Econ. Geol. 1985, 1, 249–272. [Google Scholar]
  107. Robert, F.; Kelly, W.C. Ore-forming fluids in Archean gold-bearing quartz veins at the Sigma Mine, Abitibi greenstone belt, Quebec, Canada. Econ. Geol. 1987, 82, 1464–1482. [Google Scholar] [CrossRef]
  108. Tbrahim, M.S.; Kyser, T.K. Fluid inclusion and isotope systematics of the high-T Proterozoic Star Lake Lode gold deposit, Northern Soskatchewan, Canada. Econ. Geol. 1991, 86, 1468–1490. [Google Scholar] [CrossRef]
  109. Macnamara, J.; Thode, H.G. Comparison of the isotopic constitution of terrestrial and meteoritic sulfur. Phys. Rev. 1950, 78, 307–308. [Google Scholar] [CrossRef]
  110. Chaussidon, M.; Lorand, J.P. Sulphur isotope composition of orogenic spinel lherzolite massifs from Ariege (North-Eastern Pyrenees, France): An ion microprobe study. Geochim. Cosmochim. Acta 1990, 54, 2835–2846. [Google Scholar] [CrossRef]
  111. Kelley, W.C.; Rye, R.O. Geologic, fluid inclusion, and stable isotope studies of the Tin-Tungsten deposits of Panasqueira, Portugal. Econ. Geol. 1979, 74, 1721–1819. [Google Scholar] [CrossRef]
  112. Ohmoto, H.; Rye, R.O. Isotopes of sulfur and carbon. In Geochemistry of Hydrothermal Ore Deposits; Barnes, H.L., Ed.; Wiley: New York, NY, USA, 1979; pp. 509–567. [Google Scholar]
  113. Wang, Z.C.; Liu, J.M.; Liu, H.T.; Zeng, Q.D.; Zhang, S.; Wang, Y.B. Complexity and uncertainty of tracing fluid sources by means of H-O, C, S, N isotope systems: A case study of orogenic lode gold deposits. Acta Petrol. Mineral. 2010, 29, 577–590. (In Chinese) [Google Scholar]
  114. Goldfarb, R.J.; Groves, D.I.; Gardoll, S. Orogenic gold and geologic time: A synthesis. Ore Geol. Rev. 2001, 18, 1–75. [Google Scholar] [CrossRef]
  115. Wang, T.J.; Yan, F. Ore fluid evolution and ore prediction of magmatic hydrothermal gold deposits in Jiaodong area. J. Geol. Explor. 2002, 17, 169–174. (In Chinese) [Google Scholar]
  116. Wang, Y.W.; Zhu, F.S.; Gong, R.T. Tectonic isotope geochemistry: Further study on sulphur isotope of Jiaodong gold concentration area. Gold 2002, 23, 1–16. (In Chinese) [Google Scholar]
  117. Wu, K.X.; Hu, R.Z.; Bi, X.W.; Peng, J.T.; Tang, Q.L. Ore lead isotopes as a tracer for ore-forming material sources: A review. Geol. Geochem. 2002, 30, 73–81. (In Chinese) [Google Scholar]
  118. Goldfarb, R.J.; Ayuso, R.; Miller, M.L.; Ebert, S.W.; Marsh, E.E.; Petsel, S.A.; Miller, L.D.; Bradley, D.C.; Johnson, C.; McClelland, W. The Late Cretaceous Donlin Creek gold deposit, Southwestern Alaska: Controls on epizonal ore formation. Econ. Geol. 2004, 99, 643–671. [Google Scholar] [CrossRef]
  119. Mortensen, J.K.; Hall, B.V.; Bissig, T.; Friedman, R.M.; Danielson, T.; Oliver, J.; Rhys, D.A.; Ross, K.V.; Gabites, J.E. Age and paleotectonic setting of volcanogenic massive sulfide deposits in the Guerrero Terrane of Central Mexico: Constraints from U–Pb age and Pb isotope studies. Econ. Geol. 2008, 103, 117–140. [Google Scholar] [CrossRef]
  120. Wen, B.J.; Fan, H.R.; Hu, F.F.; Liu, X.; Yang, K.F.; Sun, Z.F.; Sun, Z.F. Fluid evolution and ore genesis of the giant Sanshandao gold deposit, Jiaodong gold province, China: Constrains from geology, fluid inclusions and H-O-S-He-Ar isotopic compositions. J. Geochem. Explor. 2016, 171, 96–112. [Google Scholar] [CrossRef]
  121. Xu, W.L.; Wang, F.; Pei, F.P.; Meng, E.; Tang, J.; Xu, M.J.; Wang, W. Mesozoic tectonic regimes and regional ore-forming background in NE China: Constraints from spatial and temporal variations of Mesozoic volcanic rock associations. Acta Petrol. Sin. 2013, 29, 339–353. (In Chinese) [Google Scholar]
  122. Tang, J.; Xu, W.L.; Wang, F.; Ge, W.C. Subduction History of the Paleo-Pacific Slab beneath Eurasian Continent: Mesozoic-Paleogene Magmatic Records in Northeast Asia. Sci. China Earth Sci. 2018, 61, 527–559. [Google Scholar] [CrossRef]
  123. Wang, F.; Xu, Y.G.; Xu, W.L.; Yang, L.; Wu, W.; Sun, C.Y. Early Jurassic calc-alkaline magmatism in northeast China: Magmatic response to subduction of the Paleo-Pacific Plate beneath the Eurasian continent. J. Asian Earth Sci. 2017, 143, 249–268. [Google Scholar] [CrossRef]
  124. Wu, F.Y.; Sun, D.Y. The Mesozoic magmatism and lithospheric thinning in eastern China. J. Chang. Univ. Sci. Technol. 1999, 29, 313–318. (In Chinese) [Google Scholar]
  125. Wu, F.Y.; Sun, D.Y.; Zhang, G.L.; Ren, X.W. Deep geodynamics of Yanshan movement. Geol. J. China Univ. 2000, 6, 379–388. (In Chinese) [Google Scholar]
  126. Wu, F.Y.; Ge, W.C.; Sun, D.Y.; Guo, C.L. Discussions on the lithospheric thinning in eastern China. Earth Sci. Front. 2003, 10, 51–60. (In Chinese) [Google Scholar]
Figure 1. (a) Tectonic map of the Central Asian Orogenic Belt, showing the location of NE China (modified after [45,46]). (b) Tectonic sub-divisions of NE China and its adjacent regions, showing the location of the Jiapigou-Haigou gold belt (modified after [47,48]). F1: Solonker-Xar Moron-Changchun zone; F2: Yanji Fault; F3: Mudanjiang Fault; F4: Hegenshan-Heihe Fault; F5: Xinlin-Xiguitu Fault; F6: Yilan-Yitong Fault; F7: Dunhua-Mishan Fault; F8: Primoria Fault. (c) Simplified regional geological map of the Jiapigou-Haigou gold belt, showing the locations of representative gold deposits (modified after [9,31]), including (number in the figure) 1. Songjianghe; 2. Haigou; 3. Liupiye; 4. Bajiazi; 5. Xiaxitai; 6. Erdaogou; 7. Miaoling; 8. Sidaocha; 9. Sandaocha; 10. Daxiangou; 11. Xiaobeigou; 12. Renaogou; 13. Caiqiangzi; 14. Banmiaozi.
Minerals 13 00652 g001
Figure 2. (a) Simplified geological map of the Songjianghe Au deposit, showing the Pb isotope sample locations in the pluton and wallrocks; (b) geologic profile along Exploration Line 0, showing No. II-1 orebody; (c) geological plan of mining level (584 m), showing the sampling locations for ores of the various mineralization stages.
Minerals 13 00652 g002
Figure 3. Photographs and photomicrographs of the Songjianghe Au ores at various stages: (a) Stage I quartz-pyrrhotite-pyrite cut by Stage II quartz-polymetallic sulfides vein. (b) Stage II quartz-polymetallic sulfide veins. (c) Stage II quartz-polymetallic sulfides were cut by Stage III quartz-pyrite vein. (d) Stage IV quartz-calcite vein. (e,f) Stage I euhedral-subhedral pyrite and pyrrhotite in quartz. (gi) Stage II pyrite-chalcopyrite-galena-sphalerite assemblage. (j,k) Stage II native gold in coexistence with pyrite and in intergranular spaces and fissures of quartz. (l) Stage III quartz and pyrite. Abbreviations: Cal—calcite; Ccp—chalcopyrite; Gl—native gold; Gn—galena; Po—pyrrhotite; Py—pyrite; Qz—quartz; Sp—sphalerite.
Minerals 13 00652 g003
Figure 4. Mineral paragenetic sequence of the Songjianghe Au deposit.
Minerals 13 00652 g004
Figure 5. Photomicrographs of representative primary fluid inclusion assemblages from the Songjianghe Au deposit. (a-1a-5) C1-, C2-, C3-, and VL-type FIA in Stage I quartz; (b-1b-4) C2-, C3-, and VL-type FIA in Stage II quartz; (c-1c-3) C3- and VL-type FIA in Stage III quartz; (d-1,d-2) VL-type FIs in Stage IV quartz. Abbreviations: L = liquid, V = vapor.
Minerals 13 00652 g005
Figure 6. Histogram of fluid inclusion total homogenization temperature (Th-total) and salinity of the different hydrothermal stages at Songjianghe.
Minerals 13 00652 g006
Figure 7. Laser Raman spectra for representative fluid inclusions (FIs) from the different hydrothermal stages at Songjianghe: (a,b) C1-type and C2-type FIs in Stage I quartz. (c,d) C3-type and C2-type FIs in Stage II quartz. (e) C3-type FIs in Stage III quartz. (f) VL-type FIs in Stage IV quartz.
Minerals 13 00652 g007
Figure 8. δDV-SMOW vs. δ18Ofluid diagram for the different-stage hydrothermal fluids at Songjianghe (base map after [83]). The field of mantle juvenile water is from [84]. The field of Au, Cu (Mo) series of magmatic water is from [85]. The volcanic vapor and felsic magma fields are from [86]. The published data of δDV-SMOW and δ18Ofluid compositions for the Erdaogou, Xiaobeigou, Bajiazi, and Haigou gold deposits in the JHGB are from [6,8,10,17,20,33,87].
Minerals 13 00652 g008
Figure 9. (a) δ34S histogram from main-ore Stage II pyrite for the Songjianghe Au deposit; (b) δ34S ranges for major Au deposits in the Jiapigou-Haigou gold belt (modified after [2,8,10,17,20,88,89,90].
Minerals 13 00652 g009
Figure 10. (a,b) Lead isotope compositions of the monzogranite, K-feldspar granite, Seluohe Group biotite-plagioclase schist, and the main ore-stage pyrite at Songjianghe. The average growth lines for the mantle, orogen, upper crust, and lower crust are from [91]. (c,d) The published data of Lead isotope compositions for the Erdaogou, Xiaxitai, Sandaocha, Sidaocha, Bajiazi, and Haigou gold deposits in the JHGB are from [20,89,92,93].
Minerals 13 00652 g010
Figure 11. Total homogenization temperature (Th-total) vs. salinity plot for ore-stage fluid inclusions assemblages (FIAs) from the Songjianghe Au deposit.
Minerals 13 00652 g011
Figure 12. Trapping temperature–pressure diagram for Stage II C2-type and VL-type fluid inclusions from the Songjianghe Au deposit.
Minerals 13 00652 g012
Figure 13. Schematic ore genetic model for the Songjianghe Au deposit.
Minerals 13 00652 g013
Table 1. Microthermometric data of fluid inclusion assemblages from different mineralization stages.
Mineralization
Stages
Host
Minerals
Types (Number)Size
(μm)
Tm-CO2
(°C)
Tm-Cla
(°C)
Th-CO2
(°C)
Tm-Ice
(°C)
Th-Total
(°C)
Salinity
(wt.% NaCl eqv)
Stage IquartzC1-type (10)8–12−60.8 to −60.0 17.6 to 30.0
C2-type (22)6–15−61.0 to −56.96.5 to 8.617.5 to 30.2 305.0 to 386.42.8 to 6.6
C3-type (27)6–20−62.2 to −59.56.9 to 8.516.2 to 30.9 327.6 to 405.63.0 to 5.9
VL-type (31)5–20 −6.1 to −3.9292.8 to 368.46.3 to 9.3
Stage IIquartzC2-type (10)8–12−60.1 to −57.57.6 to 8.325.4 to 30.5 301.5 to 337.63.4 to 4.7
C3-type (21)5–15−60.0 to −56.97.4 to 8.621.8 to 30.7 301.9 to 338.62.8 to 5.1
VL-type (23)6–22 −5.2 to −3.6278.5 to 338.95.8 to 8.1
Stage IIIquartzC3-type (20)5–15−57.7 to −56.77.9 to 8.811.8 to 28.0 225.4 to 307.32.4 to 4.1
VL-type (24)5–15 −4.5 to −2.8215.9 to 297.34.6 to 7.2
Stage IVquartzVL-type (19)5–15 −3.5 to −2.2189.5 to 240.43.7 to 5.7
Note: Tm-CO2 = melting temperatures of solid CO2; Tm-cla = melting temperatures of CO2-H2O clathrate; Th-CO2 = homogenization temperatures of the CO2 phase; Tm-ice = temperatures of ice melting; Th-total = total homogenization temperatures.
Table 2. Hydrogen and oxygen isotope data of fluid inclusions in quartz from different mineralization stages.
Sample No.Mineralization StagesMineralδDV-SMOW (‰)δ18Oquartz
(‰)
T (°C)δ18Ofluid
(‰)
SJH-HO-1Stage Iquartz−95.711.13415.6
SJH-HO-2 quartz−96.211.33415.8
SJH-HO-3Stage IIquartz−98.710.63124.2
SJH-HO-4 quartz−95.510.53124.1
SJH-HO-5 quartz−93.9 10.1 3123.7
SJH-HO-6 quartz−89.8 10.6 3124.2
SJH-HO-7Stage IIIquartz−101.29.92581.4
SJH-HO-8 quartz−103.59.82581.2
SJH-HO-9 quartz−102.1 9.9 2581.4
Note: δ18Ofluid = δ18OV-SMOW − 3.38 × 10⁶/(T + 273)2 + 3.40 [82], T = average total homogenization temperatures (Th-total) of fluid inclusions.
Table 3. Sulfur isotope compositions of the Songjianghe Au deposit.
Sample No.Mineralization StagesMineralδ34SV-CDT (‰)
SJH-S-1Stage Ipyrite−2.91
SJH-S-2Stage I−1.87
SJH-S-3Stage I−1.33
SJH-S-4Stage I−1.65
SJH-S-5Stage I0.42
SJH-S-6Stage I−0.15
SJH-S-7Stage I0.22
SJH-S-8Stage II1.39
SJH-S-9Stage II−0.84
SJH-S-10Stage II0.76
SJH-S-11Stage II−0.96
SJH-S-12Stage II3.40
SJH-S-13Stage II−0.33
SJH-S-14Stage II3.08
SJH-S-15Stage II1.55
SJH-S-16Stage II0.92
SJH-S-17Stage II2.42
SJH-S-18Stage II2.38
SJH-S-19Stage II2.76
SJH-S-20Stage II1.04
SJH-S-21Stage II−0.60
SJH-S-22Stage II0.90
Table 4. Lead isotope compositions of ores and wallrocks from the Songjianghe Au deposit.
Sample No.Sample DescriptionTest Object208Pb/204Pb207Pb/204Pb206Pb/204Pb
SJH-Pb-1monzogranitewhole rock37.282015.393017.1720
SJH-Pb-2monzogranitewhole rock37.228015.372017.1760
SJH-Pb-3monzogranitewhole rock37.391015.406017.3080
SJH-Pb-4K-feldspar granitewhole rock37.528015.408017.4630
SJH-Pb-5K-feldspar granitewhole rock37.598015.425017.4970
SJH-Pb-6K-feldspar granitewhole rock37.681015.444017.5480
SJH-Pb-7biotite-plagioclase schistwhole rock36.921015.292016.8380
SJH-Pb-8biotite-plagioclase schistwhole rock36.591015.214016.4550
SJH-Pb-9biotite-plagioclase schistwhole rock36.600015.205016.4980
SJH-Pb-10Stage IIpyrite36.626515.225816.4874
SJH-Pb-11Stage IIpyrite36.608815.265516.4205
SJH-Pb-12Stage IIpyrite36.615315.225016.3270
SJH-Pb-13Stage IIpyrite36.687815.348916.4388
SJH-Pb-14Stage IIpyrite36.717415.330016.4230
Disclaimer/Publisher’s Note: The statements, opinions and data contained in all publications are solely those of the individual author(s) and contributor(s) and not of MDPI and/or the editor(s). MDPI and/or the editor(s) disclaim responsibility for any injury to people or property resulting from any ideas, methods, instructions or products referred to in the content.

