Communication

Residence Time Distribution Measurements and Modeling in an Industrial-Scale Siemens Flotation Cell

1
Department of Chemical and Environmental Engineering, Universidad Técnica Federico Santa María, Valparaíso 2390123, Chile
2
Automation and Supervision Centre for Mining Industry, Universidad Técnica Federico Santa María, Valparaíso 2390123, Chile
3
Maelgwyn Mineral Services Ltd., Ty Maelgwyn, 1A Gower Road, Cathays, Cardiff CF24 4PA, UK
4
Department of Geoscience and Petroleum, Faculty of Engineering, Norwegian University of Science and Technology, 7031 Trondheim, Norway
5
Trazado Nuclear e Ingeniería, Santiago 7760016, Chile
6
Minera Los Pelambres, Antofagasta Minerals, Salamanca 1950410, Chile
*
Authors to whom correspondence should be addressed.
Minerals 2023, 13(5), 678; https://doi.org/10.3390/min13050678
Submission received: 14 April 2023 / Revised: 4 May 2023 / Accepted: 15 May 2023 / Published: 16 May 2023
(This article belongs to the Special Issue Recent Advances in Flotation Process)

Abstract

:
This short communication presents residence time distribution (RTD) measurements and modeling in a 16 m3 Siemens flotation cell, as the first RTD characterization in an industrial-scale pneumatic cell. The Siemens cell was installed as a pre-rougher machine in a Cu-Mo selective plant. This plant recovered molybdenite as an enriched product, depressing copper-bearing minerals. Irradiated non-floatable solid and Br82 in water solution were employed as solid and liquid tracers, respectively. The tracers were instantly injected into the Siemens cell, and the inlet and outlet concentrations were directly measured by external non-invasive detectors. From the flotation literature, three model structures for the RTDs were evaluated, including perfect mixing, one large perfect mixer and one small perfect mixer in series (LSTS), and N perfectly mixed reactors in series. A transport delay was incorporated for all models. The LSTS representation was more consistent with the experimental data, showing that the Siemens cell RTDs presented significant deviations with respect to perfect mixing and plug-flow regimes. From the industrial measurements, mean residence times of 4.1–5.2 min were estimated.

1. Introduction

Polymineralization and the complexity of ores, along with the reduction in cut-off grades, have forced the mineral processing industries towards using fine and ultrafine grinding/re-regrinding stages to obtain adequate degrees of liberation [1]. Mechanical cells and columns have led to poor separation efficiencies in such particle size ranges, mainly associated with low collision efficiencies and particle surface oxidation [2,3,4,5]. Therefore, pneumatic flotation cells have been under continuous evaluation as alternative machines due to their favourable metallurgical responses in the fine fractions and their lower capital and operating costs. Intensified flotation machines (also called reactor–separator cells) such as ImhoflotTM, JamesonTM, ConcordeTM, RefluxTM, AllflotTM, and Pneuflot cells have proved their potential to replace a few mechanical cells and columns at similar or better metallurgical performances [4,6,7,8]. The main advantages of these flotation cells are their capacity for an intense interaction between gas and particles, and their short flotation time that prevents particle surface oxidation. The latter is critical in the cleaning and re-cleaning stages, especially for the separation of sulphide minerals. To date, there is limited industrial information regarding the hydrodynamics of these machines, specifically in terms of the mixing regimes and residence times.
Measuring and modeling residence time distributions in chemical operating units were initially developed in the 1950s and were later well-described by Levenspiel [9]. Gao et al. [10] critically reviewed RTD applications in unit operations, and several industrial case studies were presented by Yianatos et al. [11,12]. RTD characterizations of industrial flotation equipment are essential for process modeling, simulation, and optimization. From RTD measurements and mass balances throughout a flotation stage, kinetic characterizations can be estimated. Additionally, RTD measurements allow for the detection of dead zones in a flotation unit. The number of additional cells required to increase throughput in an existing concentration circuit can also be estimated from RTD characterizations. Tracer distributions can mimic the dispersion regime for solid/gas within a flotation machine. In this regard, Harbort et al. [13] estimated the residence times required for mechanical and Jameson cells to reach equivalent metallurgical performance in the cleaner and scavenger circuits at Philex Mining Corporation. These residence times resulted in 30 min and 2.9 min, respectively, showing that faster flotation kinetics were achievable in a Jameson cell. Huynh et al. [14] compared residence times in a Jameson cell with respect to a flotation column, obtaining total residence times of 2–3 min in the separation tank for the former, and more than 15 min for the latter. Although some comparisons have been given in the literature for the mean residence times (MRTs), no experimental data have been provided to support industrial results in non-conventional pneumatic machines. More recently, Guner et al. [15] investigated the residence time distribution in laboratory-scale ImhoflotTM V-03 and RefluxTM flotation cells (RFC-100), using KCl as a tracer for two-phase systems (water–air). These results showed that the RFC approached a plug-flow regime, whereas the ImhoflotTM V-Cell approached a perfect mixer.
This short communication presents RTD measurements in a Siemens flotation cell. This machine was installed in the selective plant of Minera Los Pelambres, Chile, which recovered molybdenite from Cu minerals and some gangue. The process feed was subjected to grinding and regrinding, and then, the flotation performance was limited by the capacity to recover fine and ultrafine particles. The RTD characterization in the Siemens cell was conducted to better understand the mixing pattern. To the authors’ knowledge, this is the first RTD characterization of pneumatic machines, different to flotation columns, at an industrial scale.

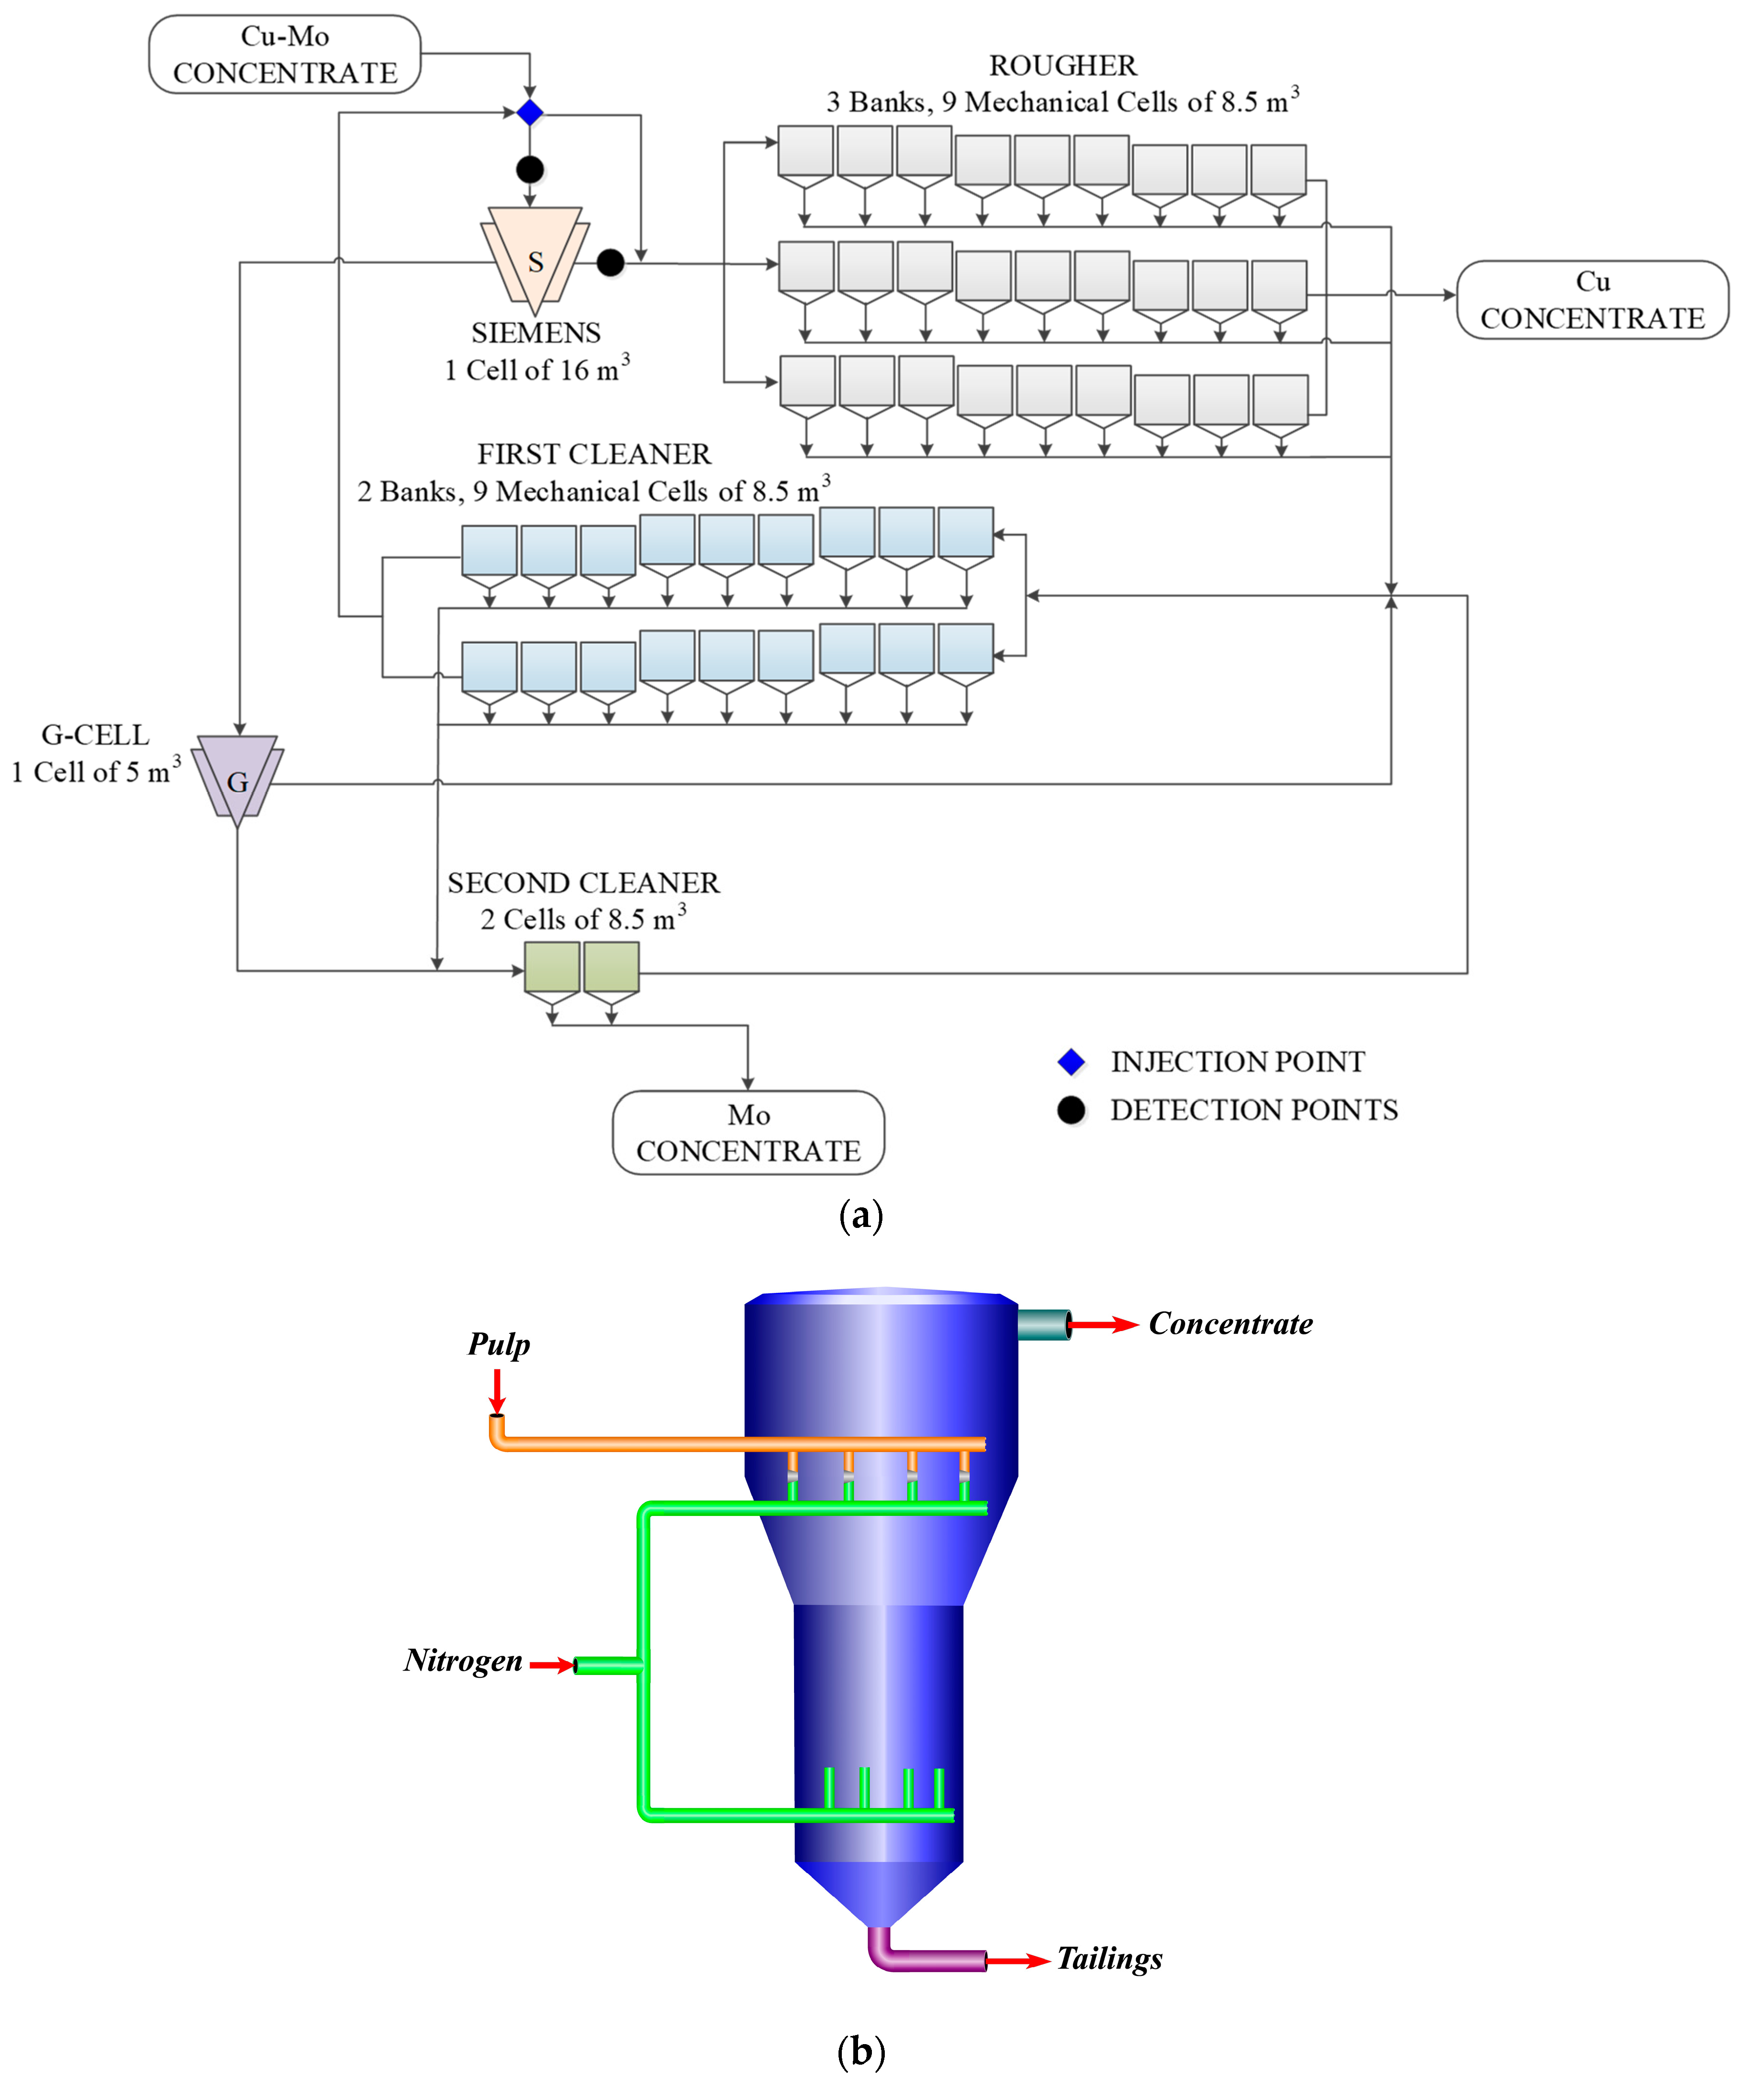
2. Materials and Methods

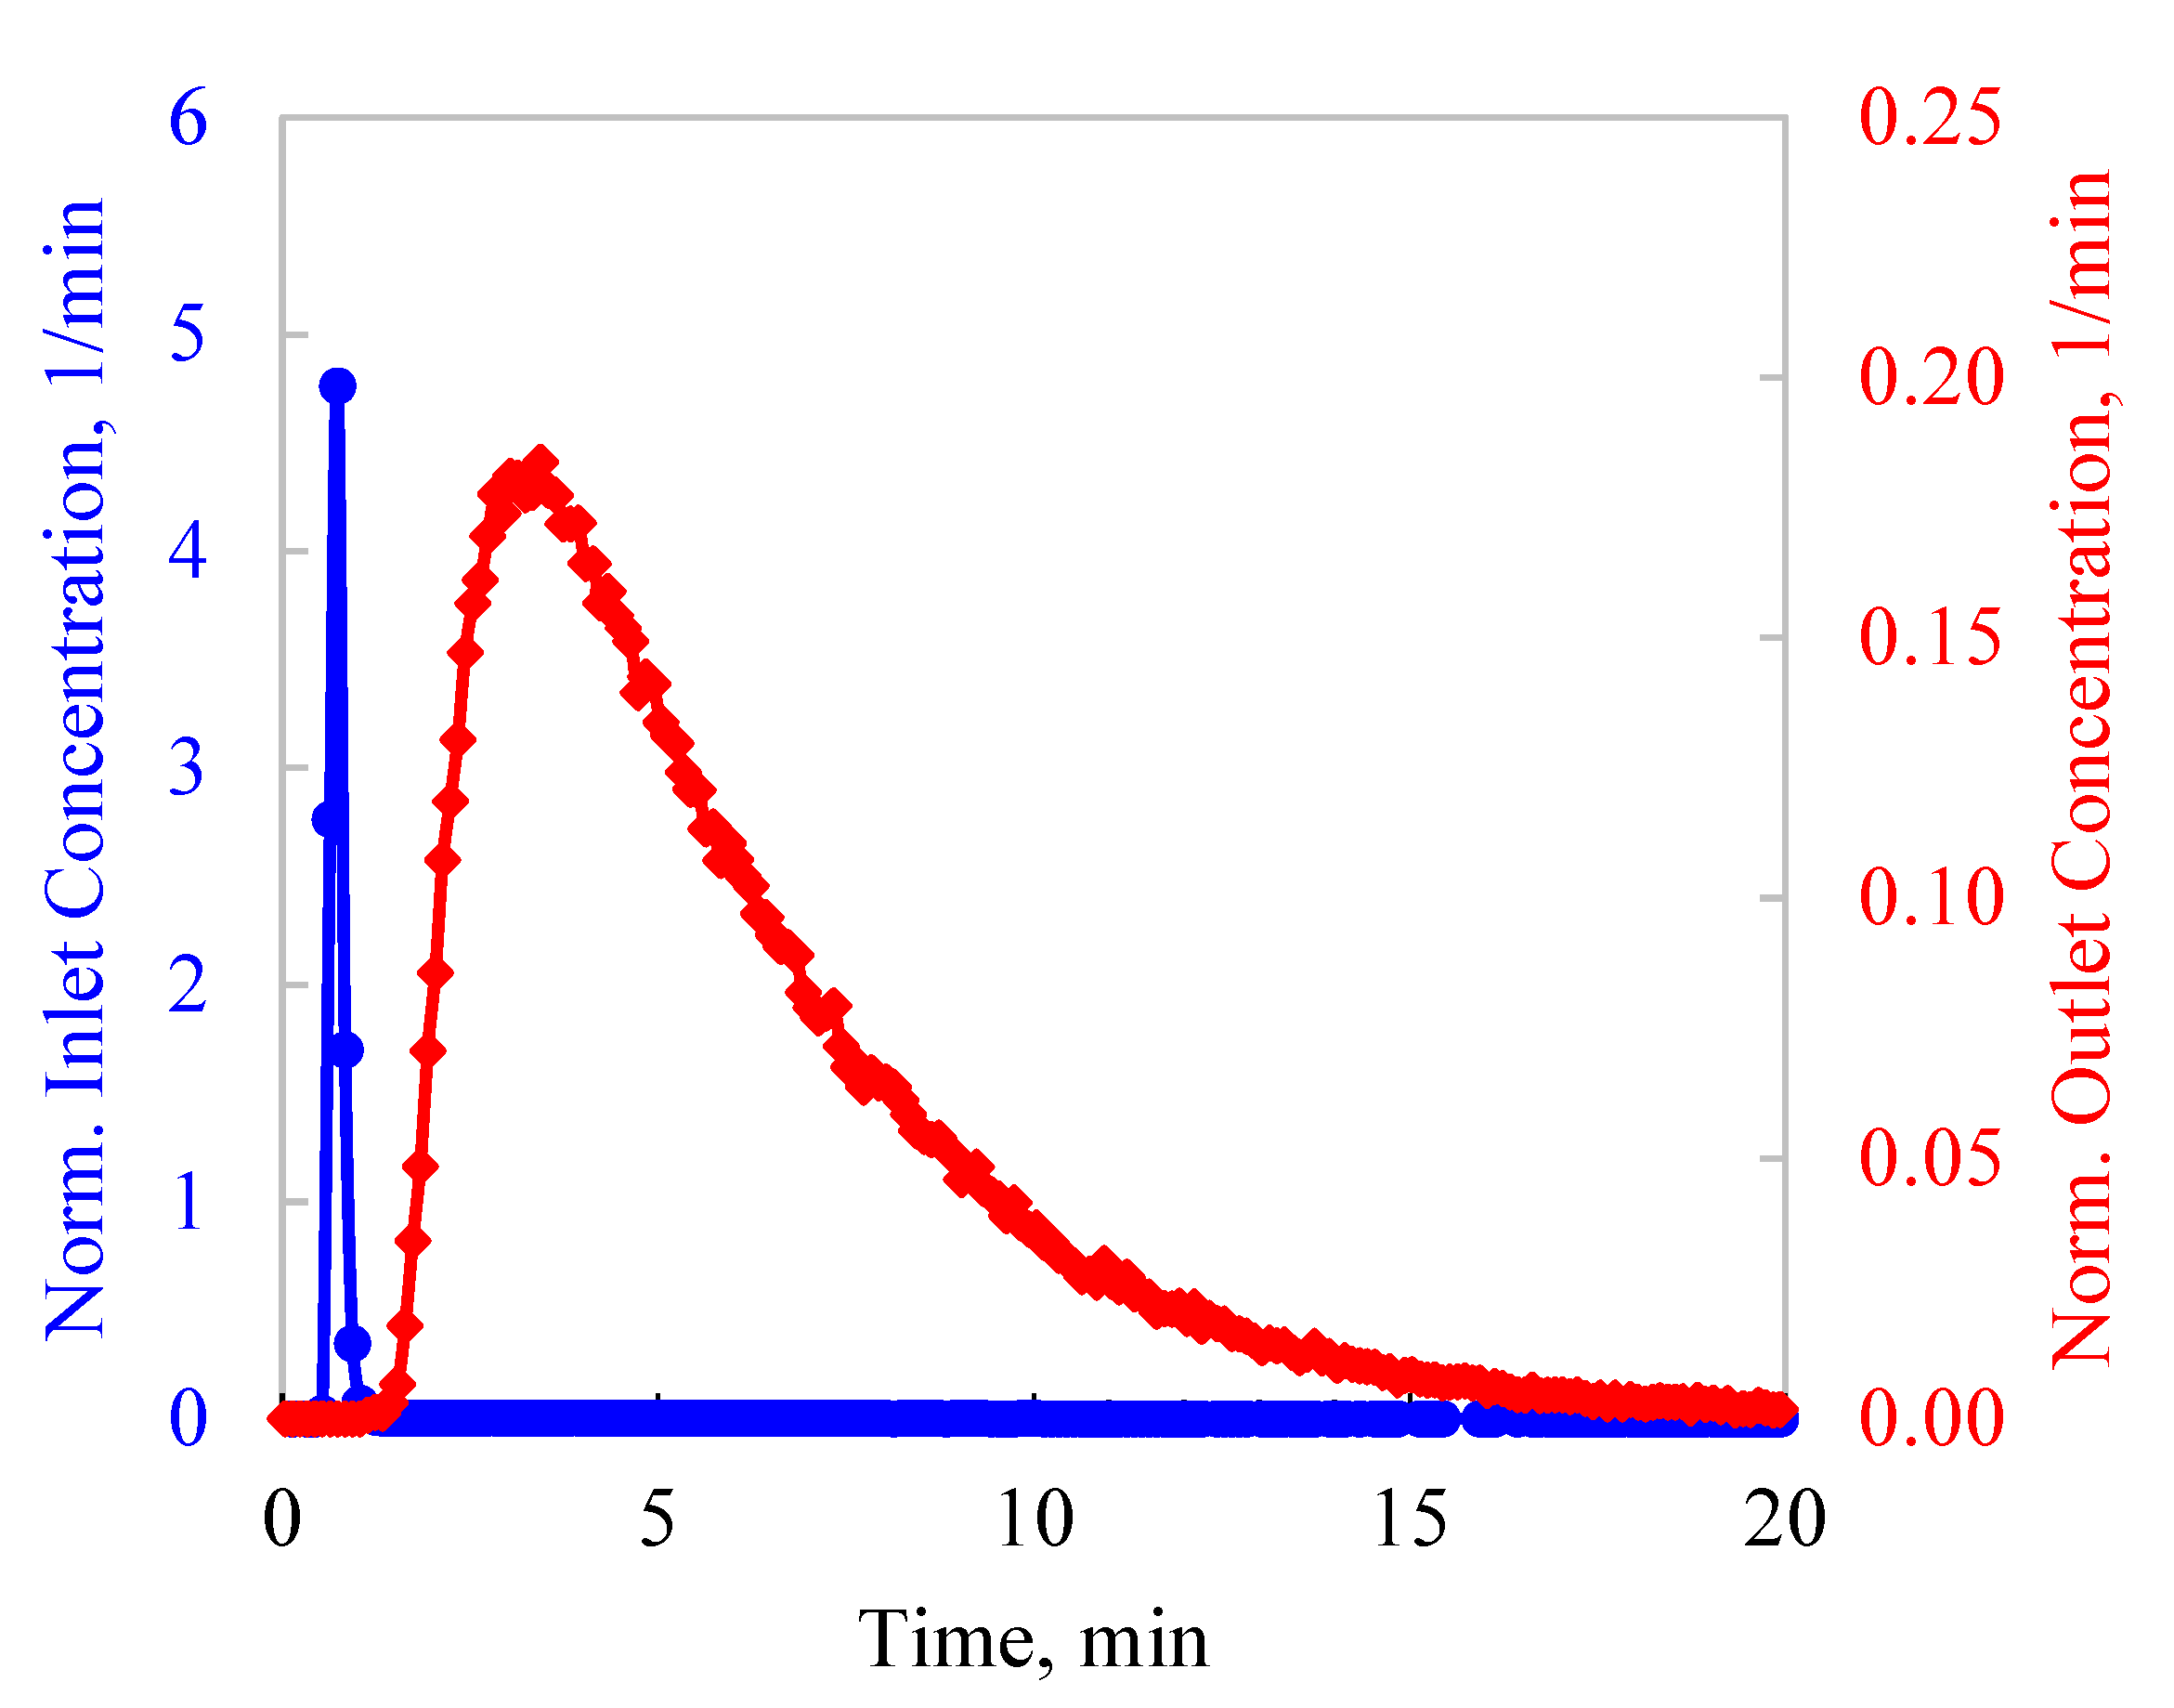
Experimental Procedure and Data Analysis
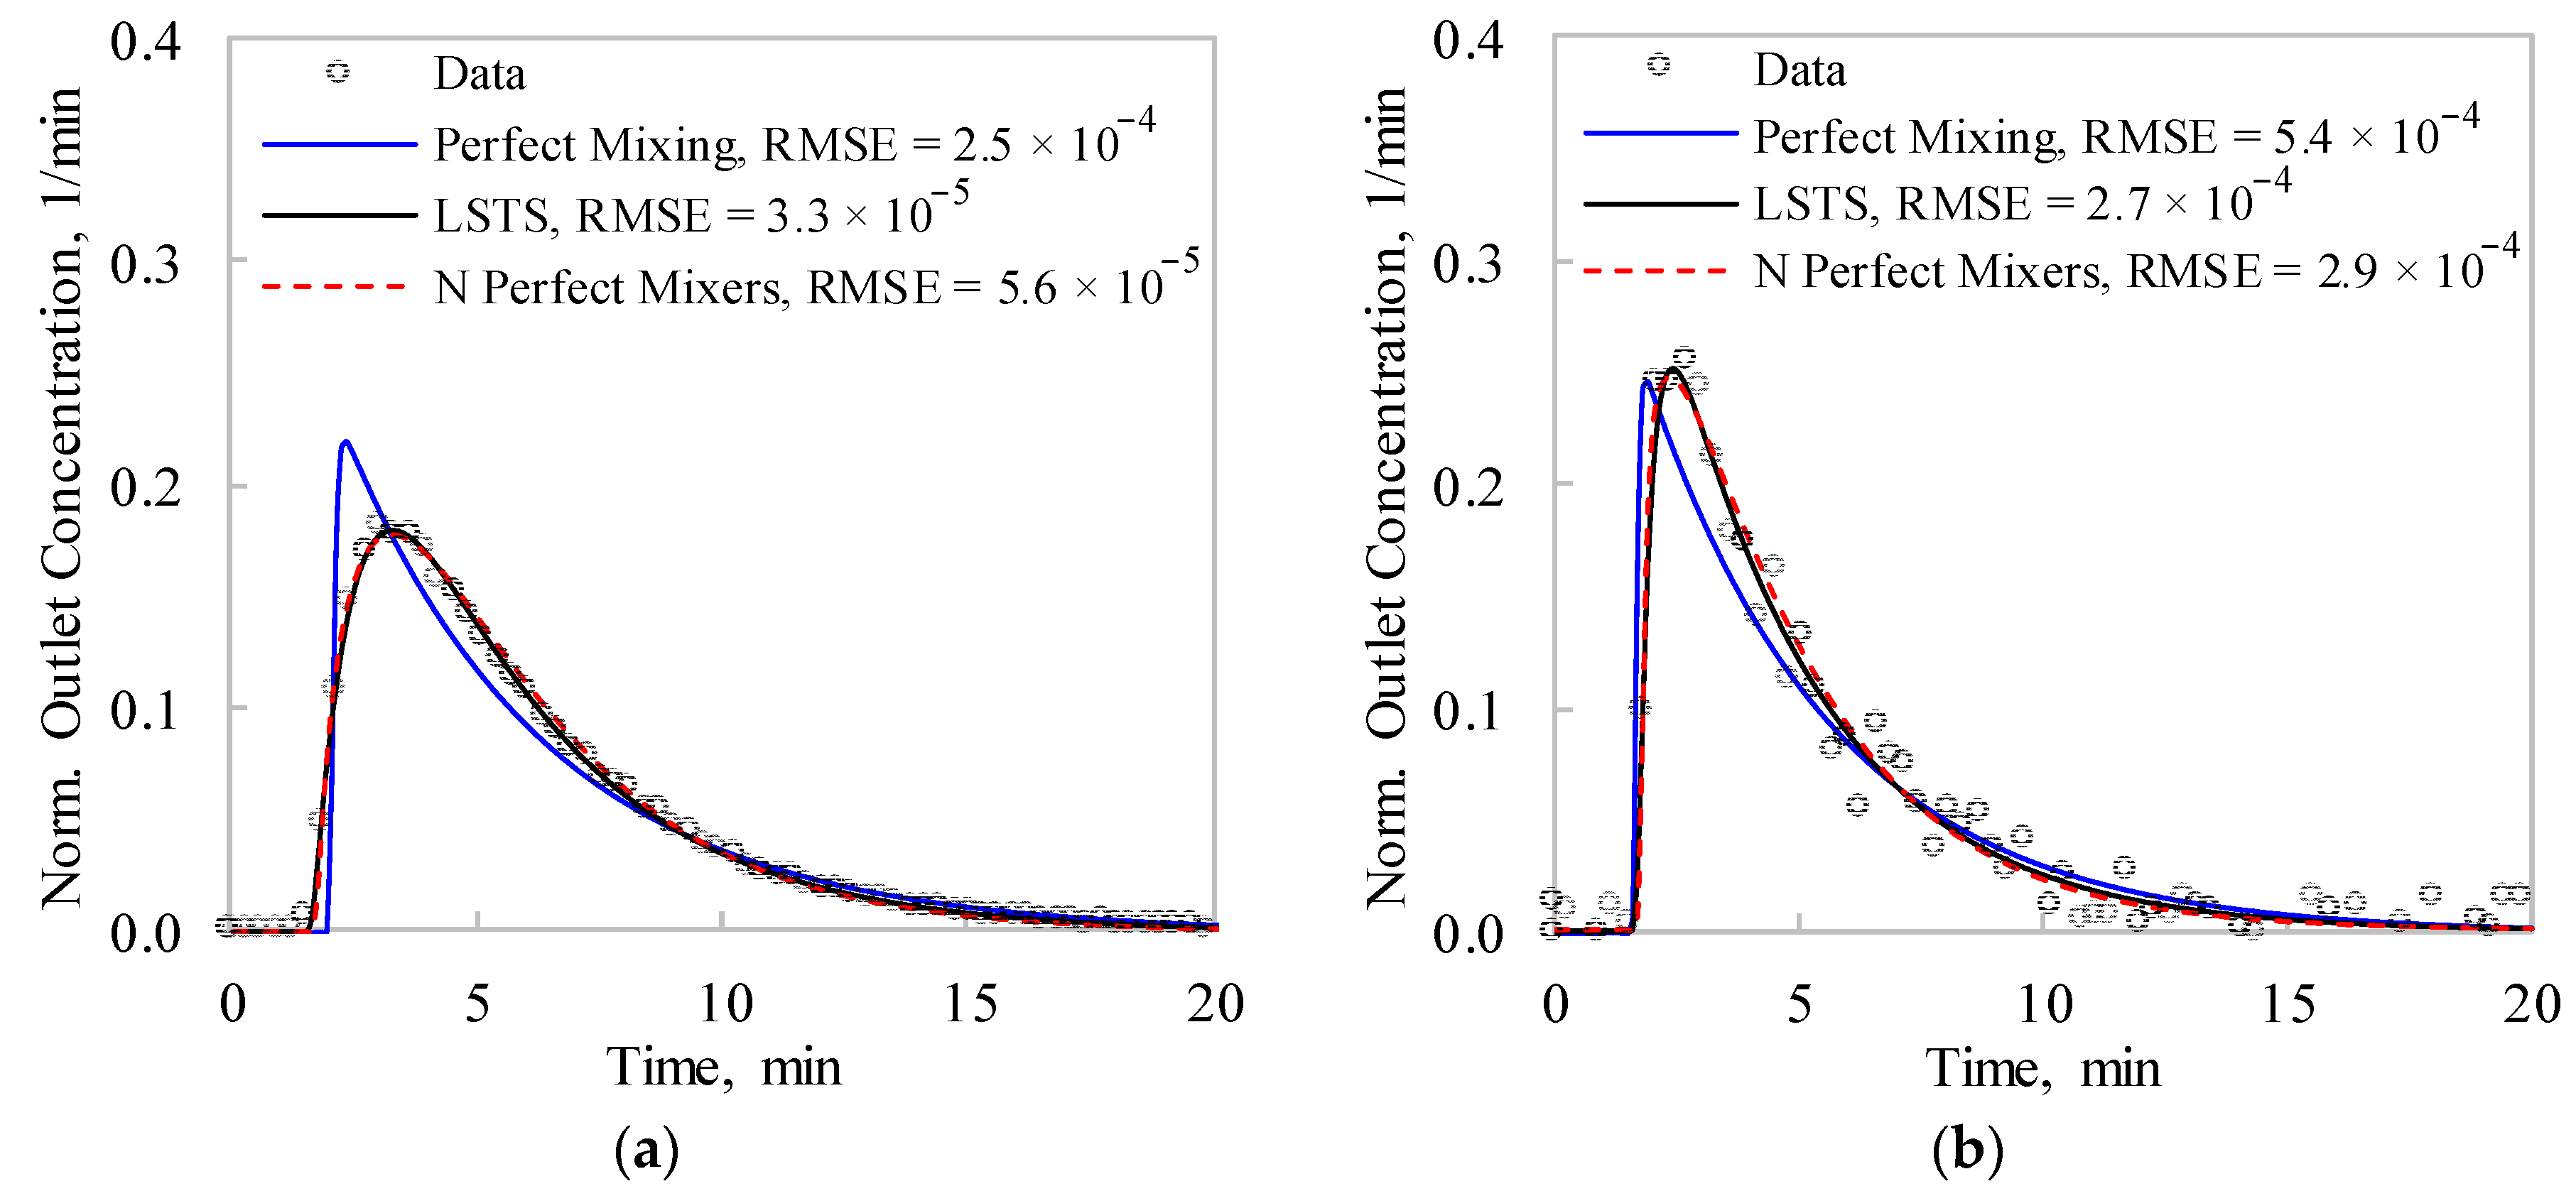
RTD measurements were conducted in the selective flotation plant of Minera Los Pelambres. This plant processed a bulk concentrate from a Cu-Mo collective plant. This collective plant recovered Cu minerals (mostly chalcopyrite (CuFeS2), digenite (Cu31S16) and bornite (Cu5FeS4)) along with molybdenite (MoS2), whereas the selective plant recovered molybdenite into the concentrate, depressing copper-bearing minerals to the tailings. Figure 1a shows a schematic view of the selective plant. A 16 m3 Siemens cell was used as a pre-rougher stage, which was fed by a fraction of the stream composed of the bulk concentrate from the collective plant plus the first-cleaner tailings. A second fraction of this stream along with the pre-rougher tailings was processed in a conventional rougher circuit using mechanical cells (three banks consisting of nine 8.5 m3 cells in series). The concentrate of the Siemens pre-rougher stage was processed in an ImhoflotTM G-Cell (5 m3), which was operated to selectively recover molybdenite-rich particles. The pneumatic machines (Siemens + G-Cell) were specially installed to improve the recovery of fine molybdenite, reducing the overall load in the rougher and cleaner circuits and increasing the plant flexibility. Figure 1b shows a diagram of a Siemens flotation cell. A fraction of the gas (nitrogen) along with the pulp was tangentially fed through 4 equidistant points near the top of the machine. This feed design favours intense contact between the particles and bubbles and a short distance to the froth phase. A second fraction of the gas is injected at the bottom through 4 spargers, as typically conducted in column flotation [16]. It is worth mentioning that there is no agitator nor moving parts in this pneumatic cell, differing from conventional mechanical cells. It is anticipated for this type of pneumatic flotation cell to possess high gas hold-up and sheer rates with a relatively small bubble size [2].
Radioactive tracer tests were carried out in the Siemens flotation cell. Figure 1 presents the injection and detection points. A small amount of liquid or pulp tracer (approximately 100 mL) was injected into the feed distributor that split the composed feed into the pre-rougher and rougher feeds. The inlet and outlet tracer activities were measured on-stream using the scintillating crystals of NaI(Tl) of “1 × 1.5” (Saphymo, Montigny-le-Bretonneux, France). Three tests were conducted, according to the tracer availability, two injecting a liquid tracer and one injecting a solid tracer. These experiments were run at different solid feed flow rates (raw feed + recycle): 240, 265, and 280 tph. Br82 in water solution was used as a liquid tracer, whereas irradiated non-floatable solid was used as a solid tracer. Br82 was obtained from irradiated KBr. The non-floatable solid tracer was sampled from the plant tailings and activated at the 5 MW nuclear reactor of the Chilean Commission of Nuclear Energy, in Santiago, Chile. Activated bromine ions have proven to be suitable for use as a liquid tracer, as they follow the water streams with no adsorption onto negatively charged minerals [17]. The use of activated samples from the plant tailings guaranteed the same behavior as the non-floatable solid in the flotation cell. The mean tracer lifetimes were approximately 36 h and 15 h for the liquid and solid tracers, respectively. The samples were homogeneously irradiated in 4π using a neutronic flux of up to 5 × 10¹³ n/cm2 s for approximately 20 h. The activities were estimated to obtain adequate signal-to-noise ratios, considering typical local backgrounds (10–20 counts per second). To generate a pulse signal in the inlet streams, a pneumatic system was developed to guarantee an almost instantaneous injection. The detectors were located on the pipelines at the inlet and outlet streams of the Siemens cell, which were collimated to reduce interferences from other radioactive sources. The signal-to-noise ratios for the inlet and outlet concentrations were mainly affected by the overall radioactive decay occurring between sample activation and the industrial tests. The solid tracer was non-floatable gangue, sampled from the final tails of the plant and its recovery should be mainly related to non-selective separation (e.g., entrainment). The liquid tracer may have also been reported into the concentrate by non-selective phenomena. Mass balances were conducted in parallel with the RTD measurements under normal operating conditions. The mass recovery in the Siemens cell resulted in less than 3.2% in all cases. As less than 80% of this mass recovery was related to Cu minerals, the non-floatable material reported in the concentrate was considered negligible with respect to that rejected into the tailings. As the solid percentage did not change significantly from the feed to the cell products, water recovery was also assumed to be negligible.
From the inlet (x) and outlet (y) concentration measurements, the residence time distributions were estimated by deconvolution. Given an RTD model structure (h) and its discretization, the RTD parameters were estimated from the least-squares estimation of Equation (1). This optimization problem minimizes the squared reconstruction errors for the outlet concentrations and addresses deviations of the inlet signal from ideal impulses. Further explanations in terms of optimization are given elsewhere [18].
min y x h T y x h
Within Equation (1) x, y, and h are normalized representations for the inlet and outlet signals, and the RTD, respectively, ⊗ denotes convolution and T indicates transposition. The optimization problem of Equation (1) was implemented in Matlab, using the Optimization Toolbox (The MathWorks, R2021b v9.2, Natick, MA, USA).
From the flotation literature, three model structures were evaluated for the RTDs: (i) perfect mixing, (ii) one large perfect mixer and one small perfect mixer in series (LSTS), and (iii) N perfectly mixed reactors in series. In all cases, a transport delay τD was incorporated to better represent the experimental data. Thus, all RTDs were 0 for t < τD. The typical assumption τD = 0 led to poor model fitting in all cases, independent of the model structure. The transport delay was an additional parameter also estimated by non-linear regression and was specific to each experiment and model structure. The Heaviside step function allowed the transport delay to be implemented in Matlab. Table 1 summarizes the respective RTD models and equation numbers. The RTD models of Table 1 have proven to be applicable to conventional mechanical cells and flotation columns [11,12].

3. Results

Figure 2 illustrates the normalized inlet and outlet tracer concentrations in the Siemens cell when feeding the plant at 240 tph. The y-axis was normalized to obtain a unit area. The liquid tracer was employed in this test. The inlet signal (in blue) was approximated as an impulse with respect to the outlet concentration (in red), except for the transport delay between the injection and the feed detector. This feature shows the effectiveness of the tracer injection to approach the inlet concentration signal to a unit impulse. The outlet tracer signals were mound-shaped in all cases with some delays regarding the tracer injection. It should be noted that the tracer activity was adequately set to obtain high signal-to-noise ratios in the industrial tests, as shown for the outlet concentration. This ratio was lower for the solid tracer because of its shorter mean lifetime.
Figure 3 shows the model fitting presented as the outlet signal reconstruction for the liquid tracer test (Figure 3a) and for the solid tracer experiment (Figure 3b). These conditions correspond to feed flow rates of 240 tph and 280 tph, respectively, from which MRTs of 5.2 min and 4.1 min were obtained. As expected, increasing the throughput from 240 tph to 280 tph led to a reduction in the MRT from 5.2 min to 4.1 min. At a feed flow rate of 265 tph, the mean residence time was estimated at 4.6 min from the RTD measurements. The root mean squared errors (RMSEs) are also shown in Figure 3, showing that the LSTS model led to the best model fitting. RTDs significantly deviated from perfect mixing in all cases, which implies that a multi-stage mixing regime better represents this Siemens cell. Although the LSTS model led to lower RMSEs than the N perfect mixers in series model, both RTD representations presented adequate model fitting, with non-critical differences between each other. In addition, the number of equivalent cells in series from Equation (4) ranged from 1.2 to 1.6. This result implies that the mixing regime in the Siemens cell can be represented by mound-shaped distributions caused by more than 1 and less than 2 stages in series.
In the LSTS model of Equation (3), the transport delay resulted in 23 ± 3.7% of the total residence time, whereas τL resulted in 67 ± 2.6% of the total residence time. The residence time of the small perfect mixer presented higher relative variability, ranging from 6% to 17% of the total residence time.
Hassanzadeh et al. [3] and Gunner et al. [15] measured and modeled RTDs in V-03 ImhoflotTM and RFC-100 RefluxTM lab-scale flotation cells as other types of pneumatic machines. They showed regimes approaching perfect mixing and plug-flow patterns for these cells, respectively, differing from the LSTS model presented here. Therefore, specific patterns are expected for each pneumatic cell, which implies that misassumptions on the machine RTDs may lead to biases in the metallurgical characterizations.
The RTD estimations in the Siemens flotation cell showed that the mixing regime can be adequately represented by two perfect mixers of different sizes in series, including a transport delay (i.e., Equation (3)). These two mixers may be attributed to a first mixing stage associated with the intense tangential feed and a second mixing stage extended from the bottom of the cell to the feed inlet. The LSTS regime has also been observed in industrial mechanical cells and flotation columns, as reported in the literature. From this result, differences in the flotation performance of the Siemens cell with respect to conventional machines are not attributable to the residence time distribution. Thus, the typical assumption of a plug-flow pattern in pneumatic flotation machines is not applicable to the studied Siemens cell. Since the determination of recoveries as a function of time requires adequate RTD estimations, biases in the kinetic models are expected. Recovery predictions assuming a plug-flow regime will overestimate mineral recoveries compared to the LSTS model. Further studies are being conducted to obtain a kinetic model for the industrial Siemens cell incorporating the LSTS model.
Robust RTD data from large-scale flotation machines have been limited due to restrictions associated with access to industrial installations, availability of trained personnel, and difficulties to obtain steady-state conditions. These limitations are even stricter when using non-invasive radiotracers. The number of intensified flotation cells installed around the world, compared to conventional machines, along with the aforementioned restrictions have led to no industrial RTD data reported for these types of machines. Therefore, the information reported here is valuable to better understand the mixing regime in the Siemens cell, despite no replicates being available. From the authors’ databases reported elsewhere [11,12], RTDs and mean residence times are not expected to change significantly under controlled feed flow rates and solid percentages. From the initial demonstrations of RTDs in an intensified Siemens cell, further industrial data are required to fully understand and generalize the mixing patterns of large-scale pneumatic flotation cells.

4. Conclusions

RTD modeling is considered the first step to industrially estimate flotation rates in a Siemens flotation cell. A general kinetic model is being developed to predict metallurgical performances and estimate mineral losses. Kinetic studies in continuous operation require RTD estimations to determine theoretical recoveries. RTD measurements and modeling were thus reported in this paper.
Hydrodynamic characterization of a Siemens flotation cell (16 m3) was industrially performed. The RTDs of liquid and solids were measured by radioactive tracers. Significant differences with respect to perfect mixing and plug flow regimes were observed. The large and small tank-in-series model, including a transport delay, was found to effectively describe the RTD in the Siemens cell, with mean residence times ranging from 4.1 to 5.2 min, depending on the feed flow rates. The modeling results implied that mixing can be represented by a mounded distribution caused by two stages in series with different volumes. This mixing was related to a first stage caused by the intense tangential feed and a second stage caused by the pulp transport from the flotation feed to the cell bottom. The results, as initial demonstrations of RTD measurements in an intensified Siemens cell, indicated that the mixing regime did not follow the plug-flow dispersion pattern, which has mostly been assumed for pneumatic flotation cells. Overestimations of the mineral recoveries are expected in the Siemens cell when a plug-flow regime is assumed instead of the LSTS model. Further RTD observations in large-scale intensified machines are recommended for future developments.

Author Contributions

Conceptualization, L.V. and J.Y.; methodology, L.V., J.Y., F.D. and F.H.; software, L.V.; validation, L.V., J.Y., F.D., F.H. and A.H.; formal analysis, L.V., J.Y. and A.H.; investigation, L.V., J.Y., F.D., F.H. and A.H.; resources, L.V. and A.H.; data curation, L.V., J.Y., F.D. and F.H.; writing—original draft preparation, L.V., J.Y. and A.H.; writing—review and editing, L.V., J.Y. and A.H.; visualization, L.V. and J.Y.; supervision, L.V.; project administration, L.V. and J.Y.; funding acquisition, L.V. and J.Y. All authors have read and agreed to the published version of the manuscript.

Funding

Funding for process modeling and control research was provided by ANID, Project Fondecyt 1201335.

Data Availability Statement

Experimental and modeling data will be provided in case of request.

Conflicts of Interest

There is no conflict of interest.

References

  1. Hassanzadeh, A. A survey on troubleshooting of closed-circuit grinding system. Can. Metall. Q. 2018, 57, 328–340. [Google Scholar] [CrossRef]
  2. Hassanzadeh, A.; Safari, M.; Hoang, D.H.; Khoshdast, H.; Albijanic, B.; Kowalczuk, P.B. Technological assessments on recent developments in fine and coarse particle flotation systems. Miner. Eng. 2022, 180, 107509. [Google Scholar] [CrossRef]
  3. Hassanzadeh, A.; Safari, M.; Khoshdast, H.; Güner, M.K.; Hoang, D.H.; Sambrook, T.; Kowalczuk, P.B. Introducing key advantages of intensified flotation cells over conventionally used mechanical and column cells. Physicochem. Probl. Miner. Process 2022, 58, 155101. [Google Scholar] [CrossRef]
  4. Lima, N.P.; Peres, A.E.C.; Gonçalves, T.A.R. Comparative evaluation between mechanical and pneumatic cells for quartz flotation in the iron ore industry. REM-Internal. Eng. J. 2018, 71, 437–442. [Google Scholar] [CrossRef]
  5. Safari, M.; Hoseinian, F.S.; Deglon, D.; Leal Filho, L.S.; Souza Pinto, T.C. Investigation of the reverse flotation of iron ore in three different flotation cells: Mechanical, oscillating grid and pneumatic. Miner. Eng. 2020, 150, 106283. [Google Scholar] [CrossRef]
  6. Dickinson, J.; Dabrowski, B.; Lelinski, D.; Christodoulou, L.; Galvin, K. Pilot Trial of a New High Rate Flotation Machine; Procemin-Geomet: Santiago, Chile, 2019. [Google Scholar]
  7. Harbort, G.J.; Jackson, B.R.; Manlapig, E.V. Recent advances in Jameson flotation cell technology. Miner. Eng. 1994, 7, 319–332. [Google Scholar] [CrossRef]
  8. Young, M.; Barnes, K.; Anderson, G.; Pease, J.; Zinc, X. Jameson Cell: The “comeback”in base metals applications using improved design and flow sheets. In Proceedings of the 38th Annual Meeting of the Canadian Mineral Processors, Ottawa, QC, Canada, 17–19 January 2006; pp. 311–322. [Google Scholar]
  9. Levenspiel, O. Chemical Reaction Engineering, 2nd ed.; Wiley: New York, NY, USA, 1972. [Google Scholar]
  10. Gao, Y.; Muzzio, F.J.; Ierapetritou, M.G. A review of the Residence Time Distribution (RTD) applications in solid unit operations. Powder Technol. 2012, 228, 416–423. [Google Scholar] [CrossRef]
  11. Yianatos, J.; Vinnett, L.; Panire, I.; Alvarez-Silva, M.; Díaz, F. Residence time distribution measurements and modelling in industrial flotation columns. Miner Eng. 2017, 110, 139–144. [Google Scholar] [CrossRef]
  12. Yianatos, J.; Bergh, L.; Vinnett, L.; Panire, I.; Díaz, F. Modelling of residence time distribution of liquid and solid in mechanical flotation cells. Miner Eng. 2017, 78, 69–73. [Google Scholar] [CrossRef]
  13. Harbort, G.; Murphy, A.; Budod, A. Jameson cell developments at Philex Mining Corporation. In Proceedings of the 6th Mill Operators Conference, Madang, Papua New Guinea, 6–8 October 1997; pp. 105–114. [Google Scholar]
  14. Huynh, L.; Araya, R.; Seaman, D.; Harbort, G.; Munro, P. Improved cleaner circuit design for better performance using the Jameson cell. In Proceedings of the 12th AUSIMM Mill Operator’s Conference, Townsville, QLD, Australia, 1–3 September 2014; pp. 1–3. [Google Scholar]
  15. Güner, M.K.; Hassanzadeh, A.; Vinnett, L.; Yianatos, J.; Kowalczuk, P.B. Residence time distribution measurements and modeling of lab-scale Imhoflot™ and REFLUX™ pneumatic flotation cells. In Proceedings of the 17th International Mineral Processing Symposium, Istanbul, Turkey, 15–17 December 2022; pp. 393–401. [Google Scholar]
  16. Blendinger, S.; Fleck, R.; Franke, G.; Grossmann, L.; Hartmann, W. Flotation Device Comprising a Fluid Distribution Element for Generating a Flow that Is Directed at the Foam Collecting Unit. U.S. Patent Application No. 14/005,204, 2 January 2014. [Google Scholar]
  17. Flury, M.; Papritz, A. Bromide in the natural environment: Occurrence and toxicity. J. Environ. Qual. 1993, 22, 747–758. [Google Scholar] [CrossRef]
  18. Vinnett, L.; Contreras, F.; Díaz, F.; Pino-Muñoz, C.; Ledezma, T. Estimating Residence Time Distributions in Industrial Closed-Circuit Ball Mills. Minerals 2022, 12, 1574. [Google Scholar] [CrossRef]
Figure 1. (a) Schematic of the selective plant of Minera Los Pelambres, highlighting the injection and detection points in the radioactive tracer tests. (b) Diagram of a Siemens flotation cell.
Minerals 13 00678 g001
Figure 2. Example of normalized inlet and outlet tracer concentrations in the Siemens flotation cell.
Minerals 13 00678 g002
Figure 3. Model fitting represented as outlet signal reconstructions in the Siemens flotation cell. (a) Liquid tracer, 240 tph, and (b) Solid tracer, 280 tph.
Minerals 13 00678 g003
Table 1. RTD models and equation numbers.
ModelFormulaEquation Number
Perfect Mixing (*) 1 τ P M exp t τ D τ P M (2)
LSTS (**) 1 τ S τ L exp t τ D τ S exp t τ D τ L (3)
N Perfect Mixers inSeries (***) t τ D N 1 Γ N τ N P M N exp t τ D τ N P M (4)
(*) τPM corresponds to the mean residence time of the perfect mixing in Equation (2). (**) τS and τL correspond to the mean residence times of the small and large tanks in Equation (3), respectively. (***) Within Equation (4), τNPM corresponds to the mean residence time of one perfect mixer, N is the number of equivalent perfect mixers in series and Γ(N) denotes the Gamma function.
Disclaimer/Publisher’s Note: The statements, opinions and data contained in all publications are solely those of the individual author(s) and contributor(s) and not of MDPI and/or the editor(s). MDPI and/or the editor(s) disclaim responsibility for any injury to people or property resulting from any ideas, methods, instructions or products referred to in the content.

