Article

Kinetic Response of Industrial Flotation Banks: Effect of Particle Size and Mineralogy

1
Department of Chemical and Environmental Engineering, Universidad Técnica Federico Santa María, Valparaíso 2390123, Chile
2
Doña Inés de Collahuasi Mining Company, Santiago 7510689, Chile
*
Author to whom correspondence should be addressed.
Minerals 2023, 13(5), 621; https://doi.org/10.3390/min13050621
Submission received: 6 April 2023 / Revised: 24 April 2023 / Accepted: 26 April 2023 / Published: 29 April 2023
(This article belongs to the Special Issue Recent Advances in Flotation Process)

Abstract

:
One of the main problems in current flotation plants and new projects is the significant decrease in feed grades and changes in the mineral composition, which has an important effect on the mineral liberation and associations. Additionally, flotation plants usually operate with a feed throughput higher than the original design, which has a significant impact on the feed particle size. All these conditions affect the metallurgical performance, and they must be evaluated and addressed by improving the control strategies for the optimization of banks. For this purpose, the flotation of valuable minerals along the circuits requires better understanding, considering the compromise between performance and selectivity in flotation circuits. This paper presents a characterization of the different minerals recovered along industrial flotation circuits. Plant sampling campaigns, performed in a copper industrial concentrator in Chile, provided the data for the study. Two rougher flotation banks consisting of cells of 130 m3 and 300 m3, were evaluated. All the samples from the industrial surveys were analysed by screening and mineralogy, and the mineral recovery along the circuits was evaluated per particle size class, liberation class, type of associations, and others. Additionally, operating data on froth depth profiles complemented the evaluation of the mineral composition of concentrate streams along the circuit. The results allowed for identifying and quantifying the main factors that affect the copper recovery and concentrate grade along the flotation banks. We found that minerals with liberation lower than 50% have a significant impact on the recovery. On the other hand, the decrease in the Cu grade in concentrates along the flotation circuits is mainly due to the relative increase of middling minerals (less liberated), non-valuable floatable minerals, such as free pyrite, and gangue entrainment. The characterization of the gangue entrainment flowrate along the flotation banks showed a strong relationship with froth depth, which becomes more critical towards the last cells of the banks.

1. Introduction

At present, industrial flotation processes face several challenges, such as the treatment of minerals that are more complex, lower feed grades, and larger particle sizes that result in lower liberation. This finally decreases the recovery of fine and coarser particles, which also decreases the concentrate grades.
Another critical issue is water constraints because the use of continental water has been gradually limited or eliminated. The water constraints relate to the increase in the global water demand and environmental changes due to global warming. For this reason, the alternative use of seawater, as either seawater or desalted water, is now a common practice in several plants around the world. The metallurgical performance of plants depends on the water quality (ionic strength) and will vary for each type of mineral and conditioning.
The impact of ionic strength on minerals’ flotation is well known, and it shows that industrial flotation requires a certain ionic strength for optimal performance. The industrial flotation operations at a large scale typically operate with recycled water, which is combined with fresh water or makeup water to feed the flotation process. Recycled water normally contains a certain number of ions, which depends on the feed fresh water and the type of ore that can be partially dissolved during the flotation process, and finally reaches an equilibrium for each operation. Le at al. [1] illustrate this point in their study on water quality changes due to the effect of dissolved solids and water recirculation.
Li et al. [2] studied the effect of some ions in batch flotation and showed that for copper sulphide flotation, chlorides, such as NaCl, KCl, and CaCl2, have a positive influence on the adsorption of SBX on the chalcopyrite surface, increasing the mineral recovery, while MgCl2 and CaCl2 decreased the recovery. Le at al. [1] reported that the presence of Na+, Cl, and Ca2+ showed a tendency to inhibit the bubble coalescence, in addition to the frother effect.
In terms of reagents addition, Hassanzadeh [3] showed that a proper distribution of reagents along the bank increases the final copper grade and recovery due to the excess of reagent consumption in fine particles, which limited the surface coverage and recovery of coarse particles. This practice applies in some industrial concentrator plants.
Other studies based on the “touch of froth” methodology have shown that the grade of the minerals collected by true flotation, or bubble–particle aggregate formation, along industrial flotation banks does not change significantly with operating conditions that affect physical separation, such as the gas rate and froth depth [4,5]. Thus, the evolution of the type and grade of collected minerals along a flotation bank will depend mainly on the feed mineralogy and reagents conditioning, while manipulated variables will affect the mass pull and entrainment, and thus, the final concentrate grade and recovery.
Regarding flotation circuits optimization, Jowett and Sutherland [6] stated that the potential usefulness of optimizing criteria was prevented because of the lack of case data that could be used for a numerical simulation and optimization of a complex circuit. The authors claim that a detailed evaluation of the mineralogical matrix of streams within the circuit would be required, but the available techniques were either too laborious or technically too difficult to obtain the necessary data. By that time, some researchers, e.g., Miller et al. [7], reported instruments were under development based on QEM*SEM image analysis to solve the data acquisition problem. Currently, image analysis has reached a good reliable level, and different commercial instruments are available for analysis, which has allowed for obtaining periodic mineralogical information for the main streams in many plants around the world [8].
To improve the flotation metallurgical performance in plant circuits, more robust data and enhanced control strategies are required. Chemical and mineralogical data are fundamental for improving the knowledge of the minerals collected and their transport into the concentrate along the flotation banks, which will allow the selection of the optimal profiles of manipulated variables and reagent dosages to improve the recovery of fine and coarser particles.
There are many studies on flotation kinetics, but most refer to laboratory testing data or plant modelling and/or simulation, as shown in recent wide reviews [9,10]. On the other hand, the literature reporting data on industrial plant flotation kinetics is scarce. Some older literature has provided data on flotation kinetics from industrial plants, for example, Kalapudas [11]. Recently, Kupka et al. [12] reported a case study of an industrial rougher bank for Scheelite flotation. The industrial data were obtained by sampling the rougher concentrate in three groups of cells (1–4, 5–8, and 9–12). The results allowed for estimating the recovery of Scheelite—in terms of liberation, particle size, and shape factors—along the flotation bank with an automated process mineralogy data analysis.
In this way, planning future flotation operation requires a careful analysis of future minerals, considering their physical and mineralogical characteristics, as well as the type of water makeup that will be available [13]. On the other hand, the actual flotation process characterization—in terms of kinetics and mineralogical analysis, including size and liberation classes—will contribute to the process knowledge to improve the industrial flotation models and to predict future operations under different mineral associations and water quality.
In this work, overall sampling campaigns were performed at Compañía Minera Doña Inés de Collahuasi, Chile, to advance the process knowledge in terms of the mineralogy and operating conditions in order to face future challenges of the plant, including minerals that are more complex, increased plant capacity, and changes in water quality.

2. Methodology

Sampling surveys were carried out in two rougher flotation banks at an industrial concentrator in Chile. The surveys included chemical and mineralogical (Qemscan®) analyses in the streams (feed, concentrates, and tails), followed by mass balancing to characterize the mineral behaviour cell-to-cell along the banks. Thus, the recovery per mineral species, particle size, and liberation class, as well as the concentrates composition and gangue entrainment characterization, were analysed along the banks.

2.1. Sampling Surveys at an Industrial Concentrator

Three overall sampling campaigns were carried out at Compañía Minera Doña Inés de Collahuasi (CMDIC) concentrator, located on the high plateau of the Atacama Desert, Chile, at 4.400 masl. This concentrator consists of a rougher stage with 9 flotation rows in parallel: 5 rows with 9 cells of 130 m3 each and 4 rows with 6 cells of 300 m3 each. The rougher concentrate is processed in a regrinding stage, whose product is sent to a first cleaner stage consisting of 5 parallel rows: 3 rows with 3 cells of 160 m3 and 2 rows with 4 and 3 cells of 130 m3 each. The first cleaner concentrate is sent to a second cleaner composed of 10 flotation columns. The first cleaner tail is sent to a scavenger stage, which has 5 parallel rows: 3 rows with 6 cells of 160 m3 each and 2 rows with 4 and 5 cells of 130 m3 each. The scavenger concentrate is sent back to the regrinding stage, while the scavenger tail is combined with the rougher tail to form the final tail. The second cleaner tail is sent to another stage, consisting of two Jameson cells. The Jameson cells’ tail is sent back to the first cleaner. The Jameson cells concentrate and the second cleaner concentrate are combined and correspond to the final Cu-Mo concentrate.
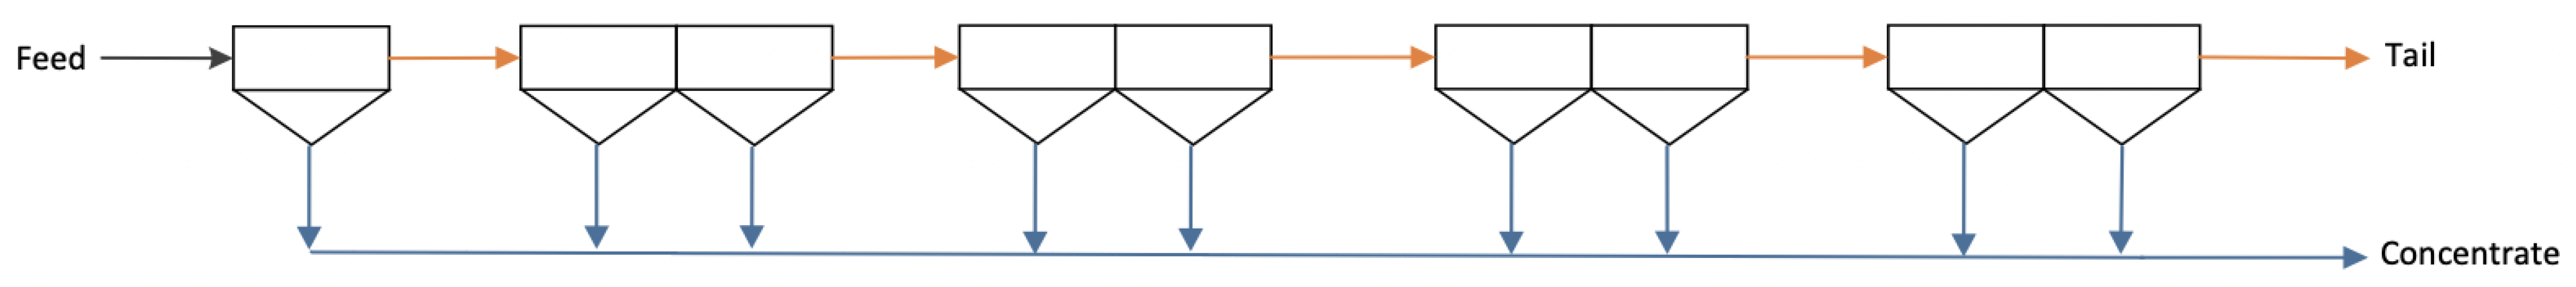
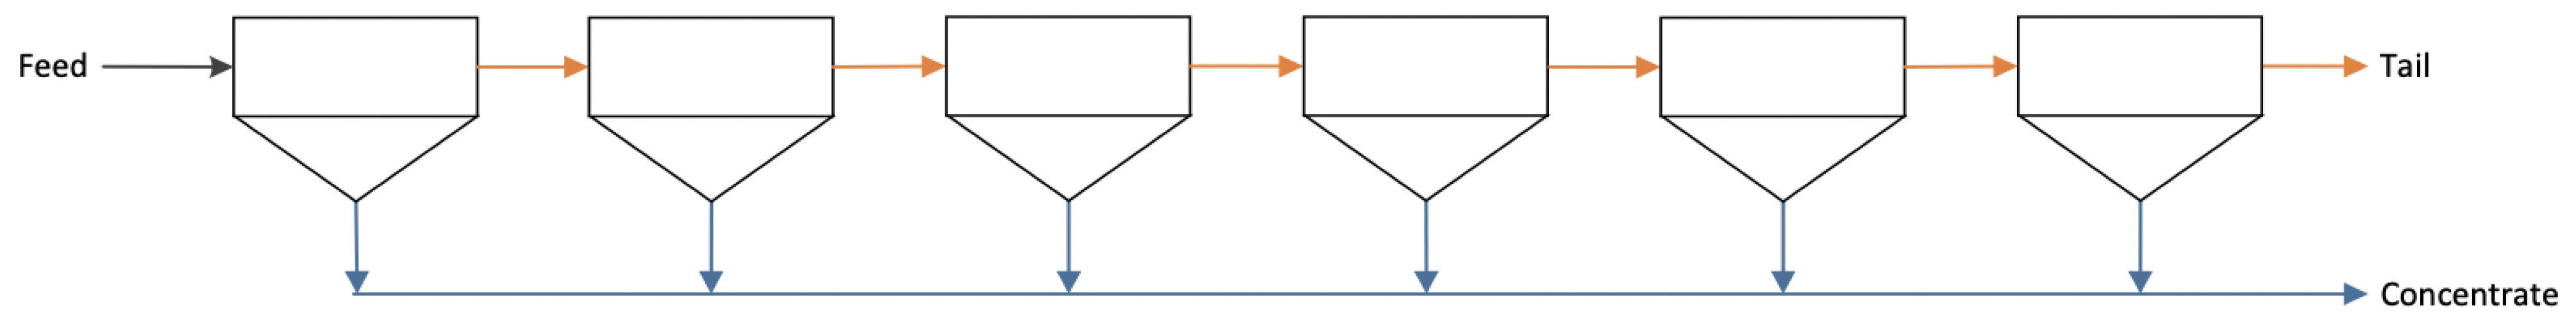
The study reported in this work was focused on the rougher stage of the CMDIC concentrator. Overall, 2 flotation banks were analysed: a rougher bank with 9 self-aerated cells of 130 m3 (Figure 1) and another with 6 self-aerated cells of 300 m3 (Figure 2). Note that each flotation bank is fed from different grinding lines; therefore, the two feed streams do not have the same characteristics. However, the pH adjustment and the reagent types and dosages were the same for both banks, making them comparable to each other in this regard. In addition, since these are self-aerated cells, the superficial gas velocity is in a narrow range (1–1.2 cm/s below the pulp–froth interface) and is similar for all cells along the banks.
The surveys included the sampling of the feed, concentrates, and tails streams of each cell in both flotation banks. The feed samples were collected with automatic cutters, while the concentrate and tails samples were manually cut from the overflow lip, with open cutters, and inside each cell (near the tail outlet), with submergible cutters. The sampling surveys were carried out for about 3 h in each bank, and the products of several sampling rounds were combined to gather enough mass for chemical and mineralogical analyses.

2.2. Feed Characterization from Chemical and Mineralogical Analyses

All samples collected from the sampling surveys were submitted to chemical and mineralogical analyses (Qemscan®). The samples were classified per particle size class by screening and then submitted to chemical analysis. This allowed for obtaining the particle size distributions and the element grades per particle size class, in addition to the bulk grades. Table 1, Table 2, Table 3 and Table 4 show the characterization of the feed samples from Banks A and B.
Table 1 shows the feed characteristics for Banks A (nine 130 m3 cells) and B (six 300 m3 cells) observed during the sampling surveys. These data represent the average of each variable during the sampling time. It can be observed that Bank A has a lower tonnage, lower Cu and Mo grades, and a coarser particle size (P80, %−20 µm and %+212 µm). The solid content is similar in both feed streams, about 30%.
Table 2 shows the mass distribution of minerals in the feed streams of Banks A and B. Bank B has a higher content of Cu sulphides and pyrite, which is consistent with the higher Cu and Fe grades showed in Table 1, respectively. Additionally, Bank B also has a higher content of clays.
The total Cu sulphides presented in Table 2 are composed of different minerals, which are detailed in Table 3. Both feed streams have a similar Cu sulphide distribution and are mainly composed of chalcopyrite.
Table 4 shows the mass distribution of Cu sulphides per liberation class for Banks A and B. The total mass of Cu sulphides is divided into 5 liberation classes: free (>95% lib.), liberated (>80% lib.), middling (>50% lib.), sub-middling (>20% lib.), and locked (<20% lib.). The data show that the Cu sulphides mass is contained mainly in the free liberation class for both streams. In general, a similar liberation distribution in the feed is observed for both banks.

2.3. Mass Balancing

The results from chemical and mineralogical analyses of the streams along the banks were reconciled for mass balancing, using in-house software based on the minimization of grades differences and variance estimated as proportional to the mean grade of each stream [
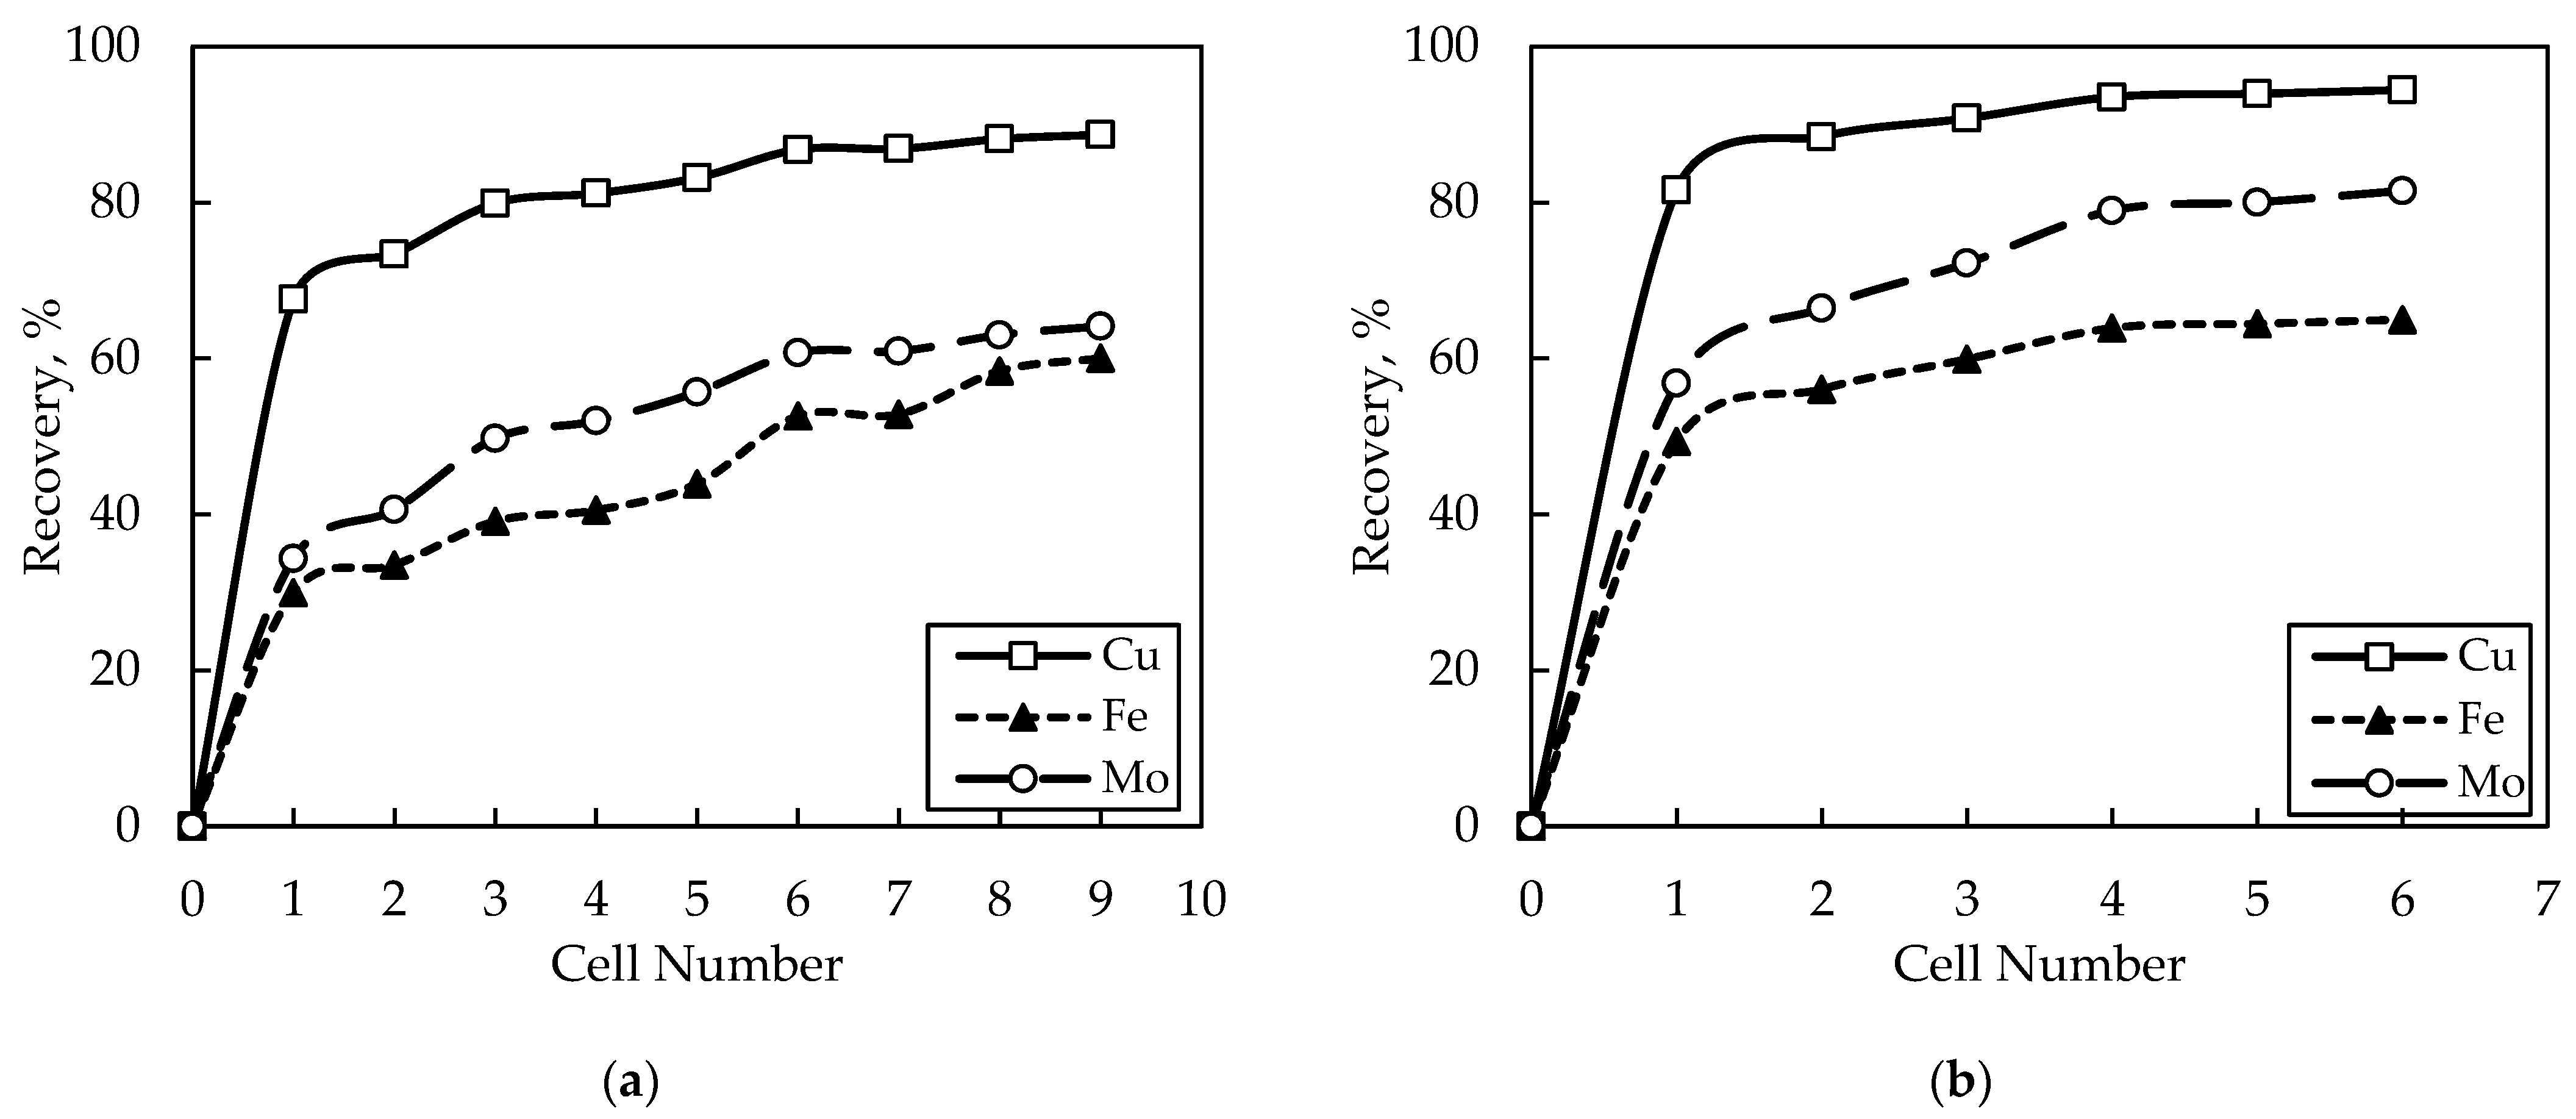
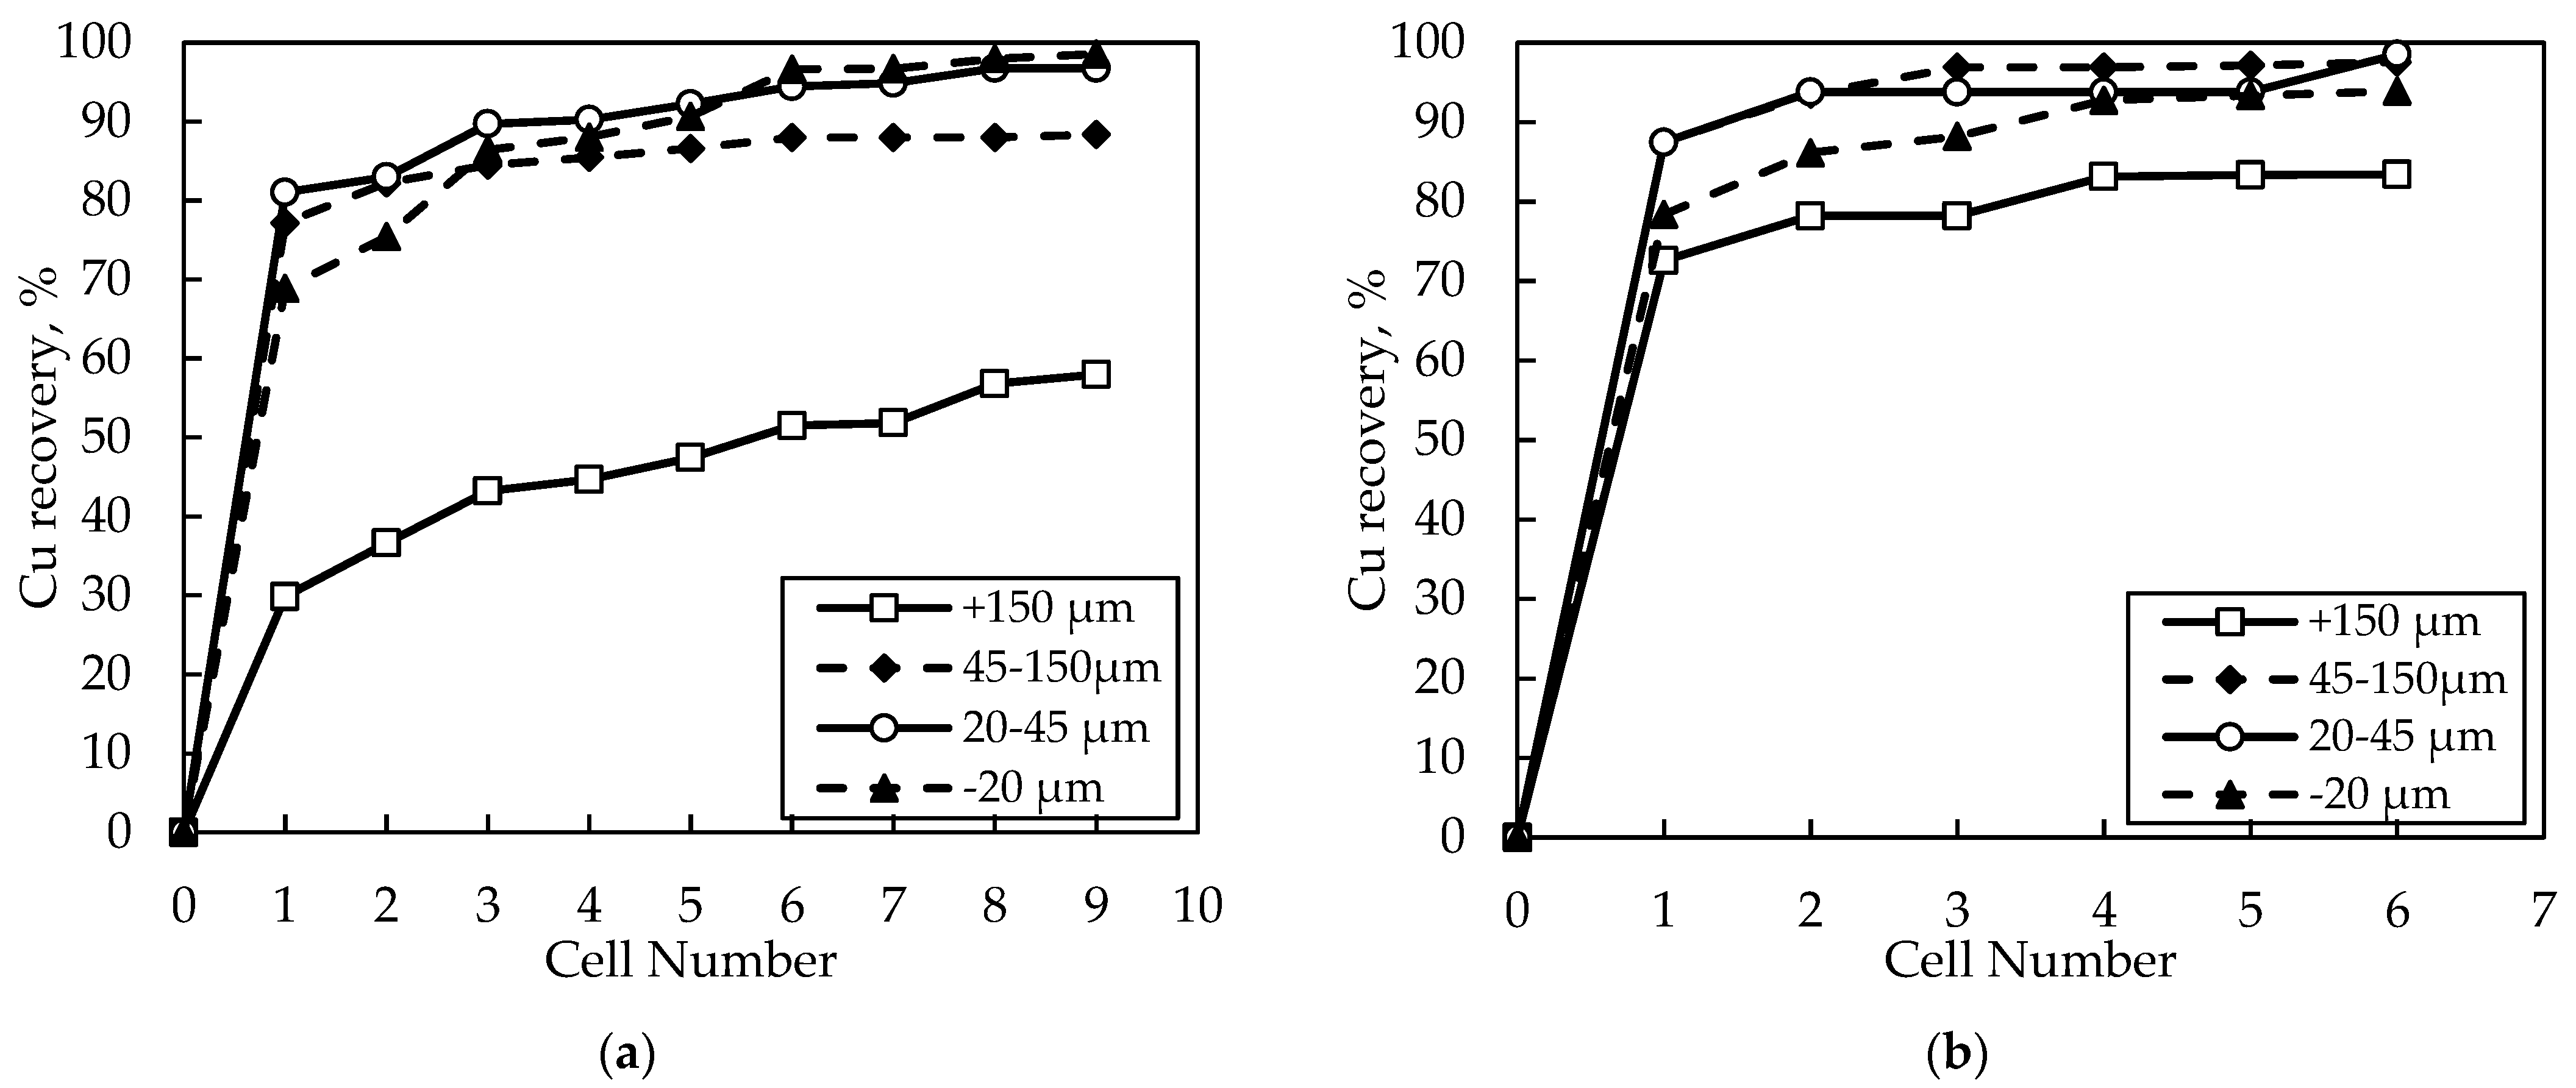
14]. First, bulk grades were reconciled to obtain the recovery profiles for Cu, Mo, and Fe. Then, the Cu grades per particle size class were mass balanced, considering 4 classes: −20 µm, 20–45 µm, 45–150 µm, and +150 µm. Thus, we built four Cu recovery profiles, in which the weighted recovery for each particle size corresponded to the previously reconciled bulk Cu recovery.
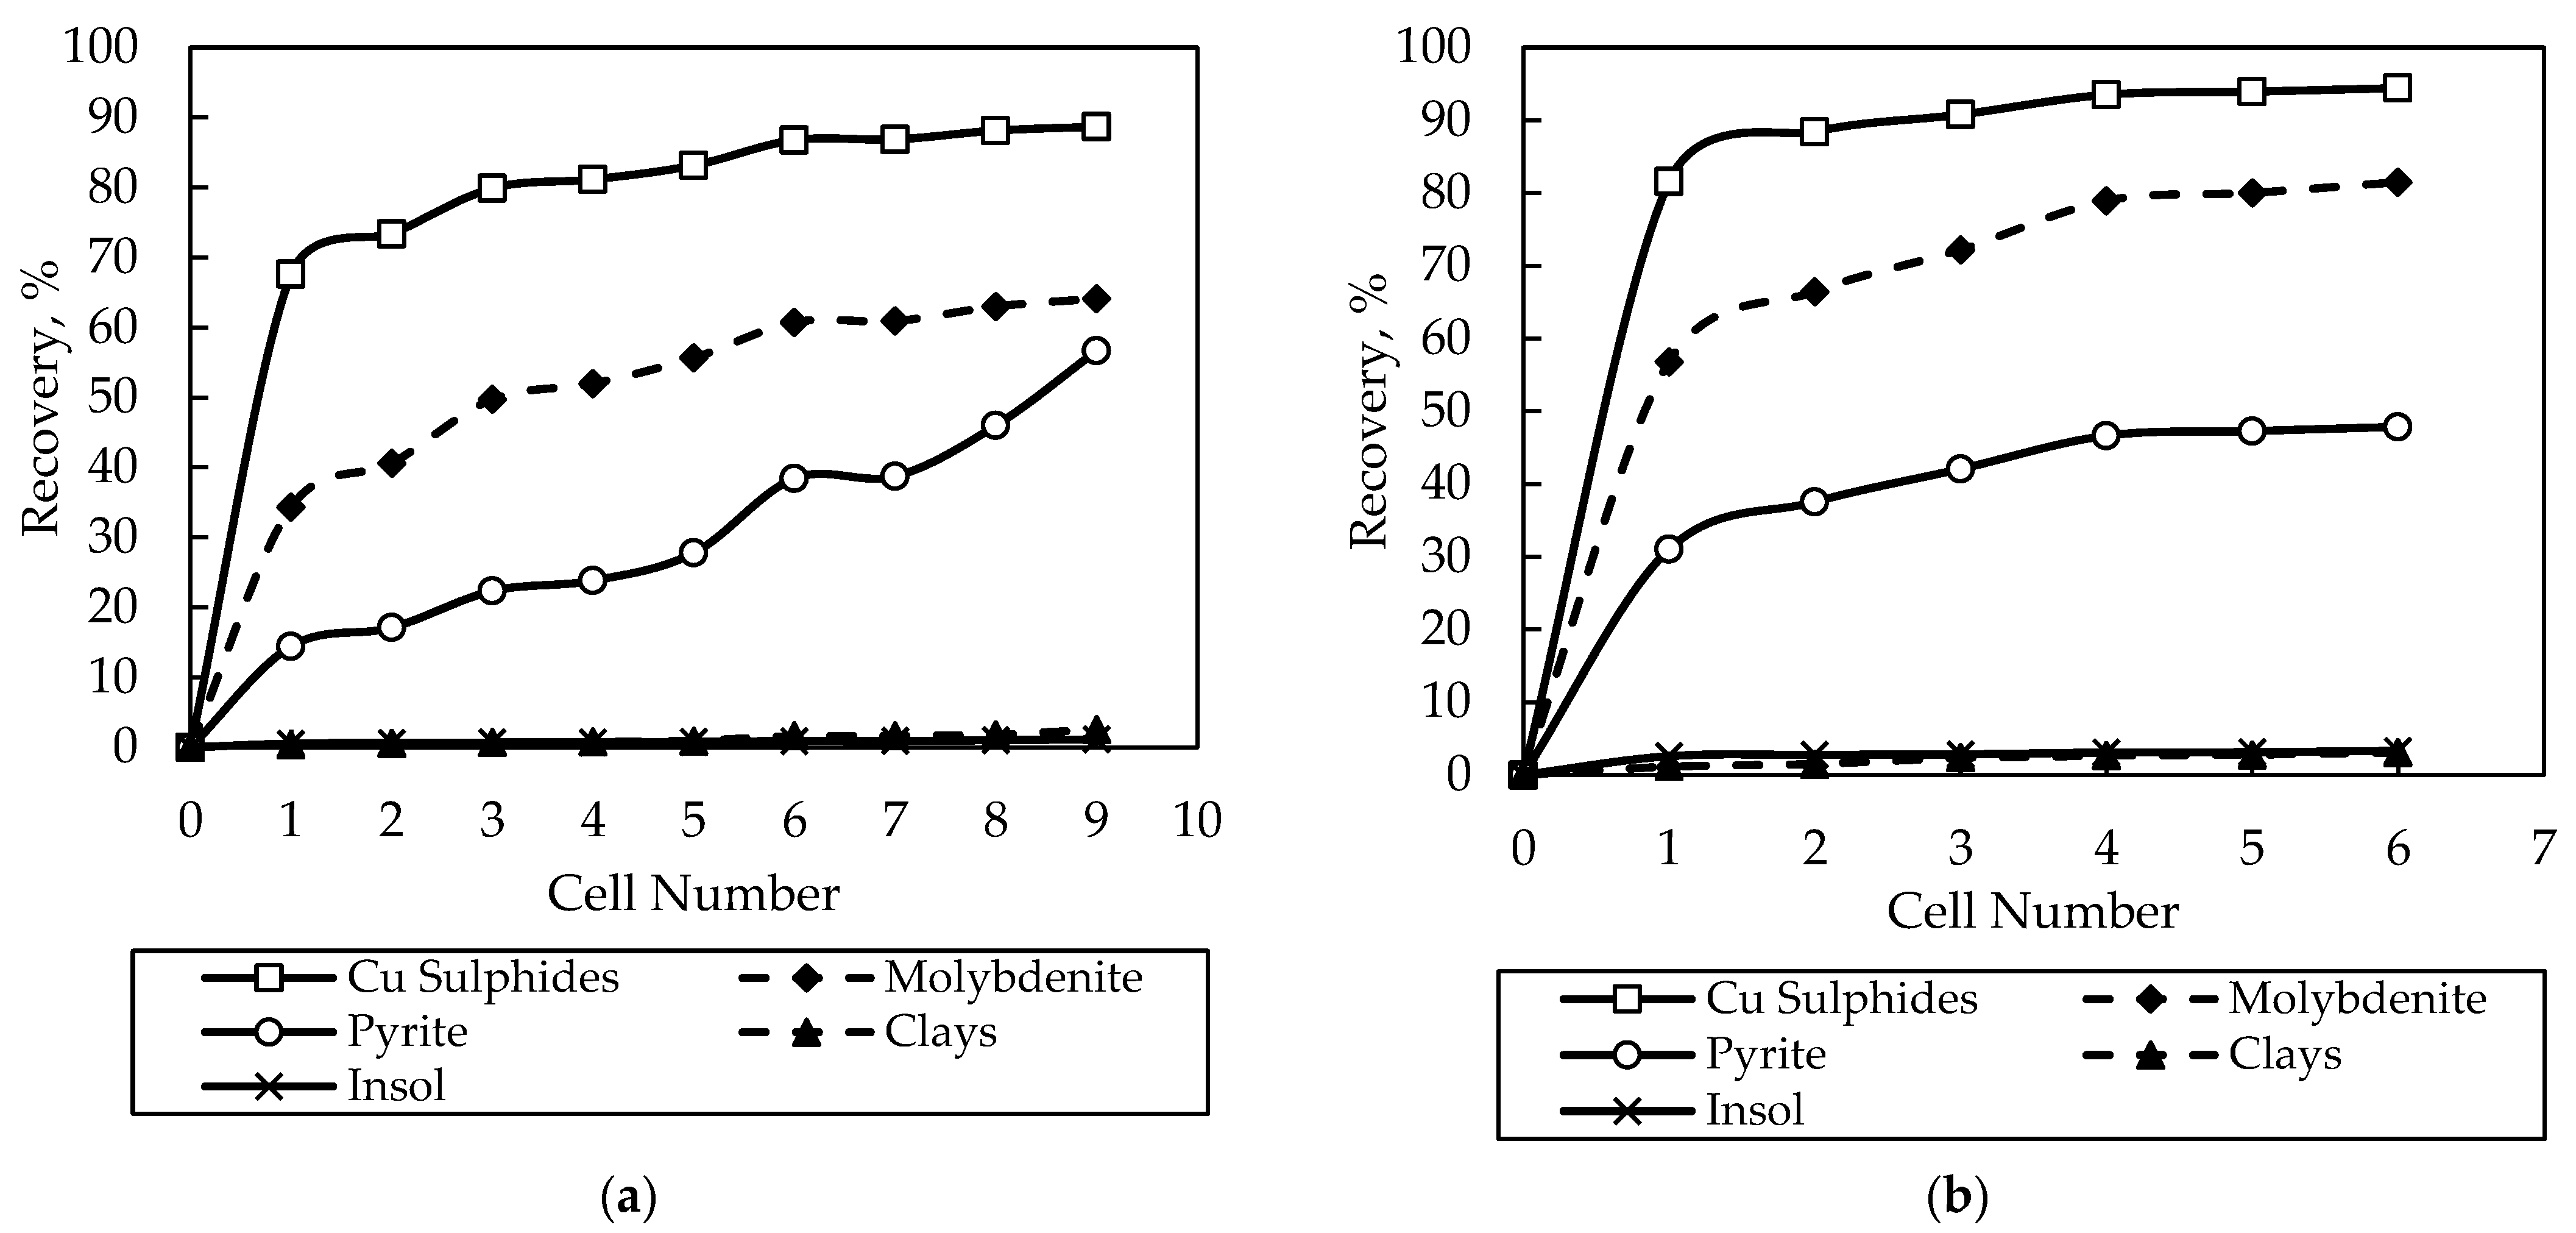
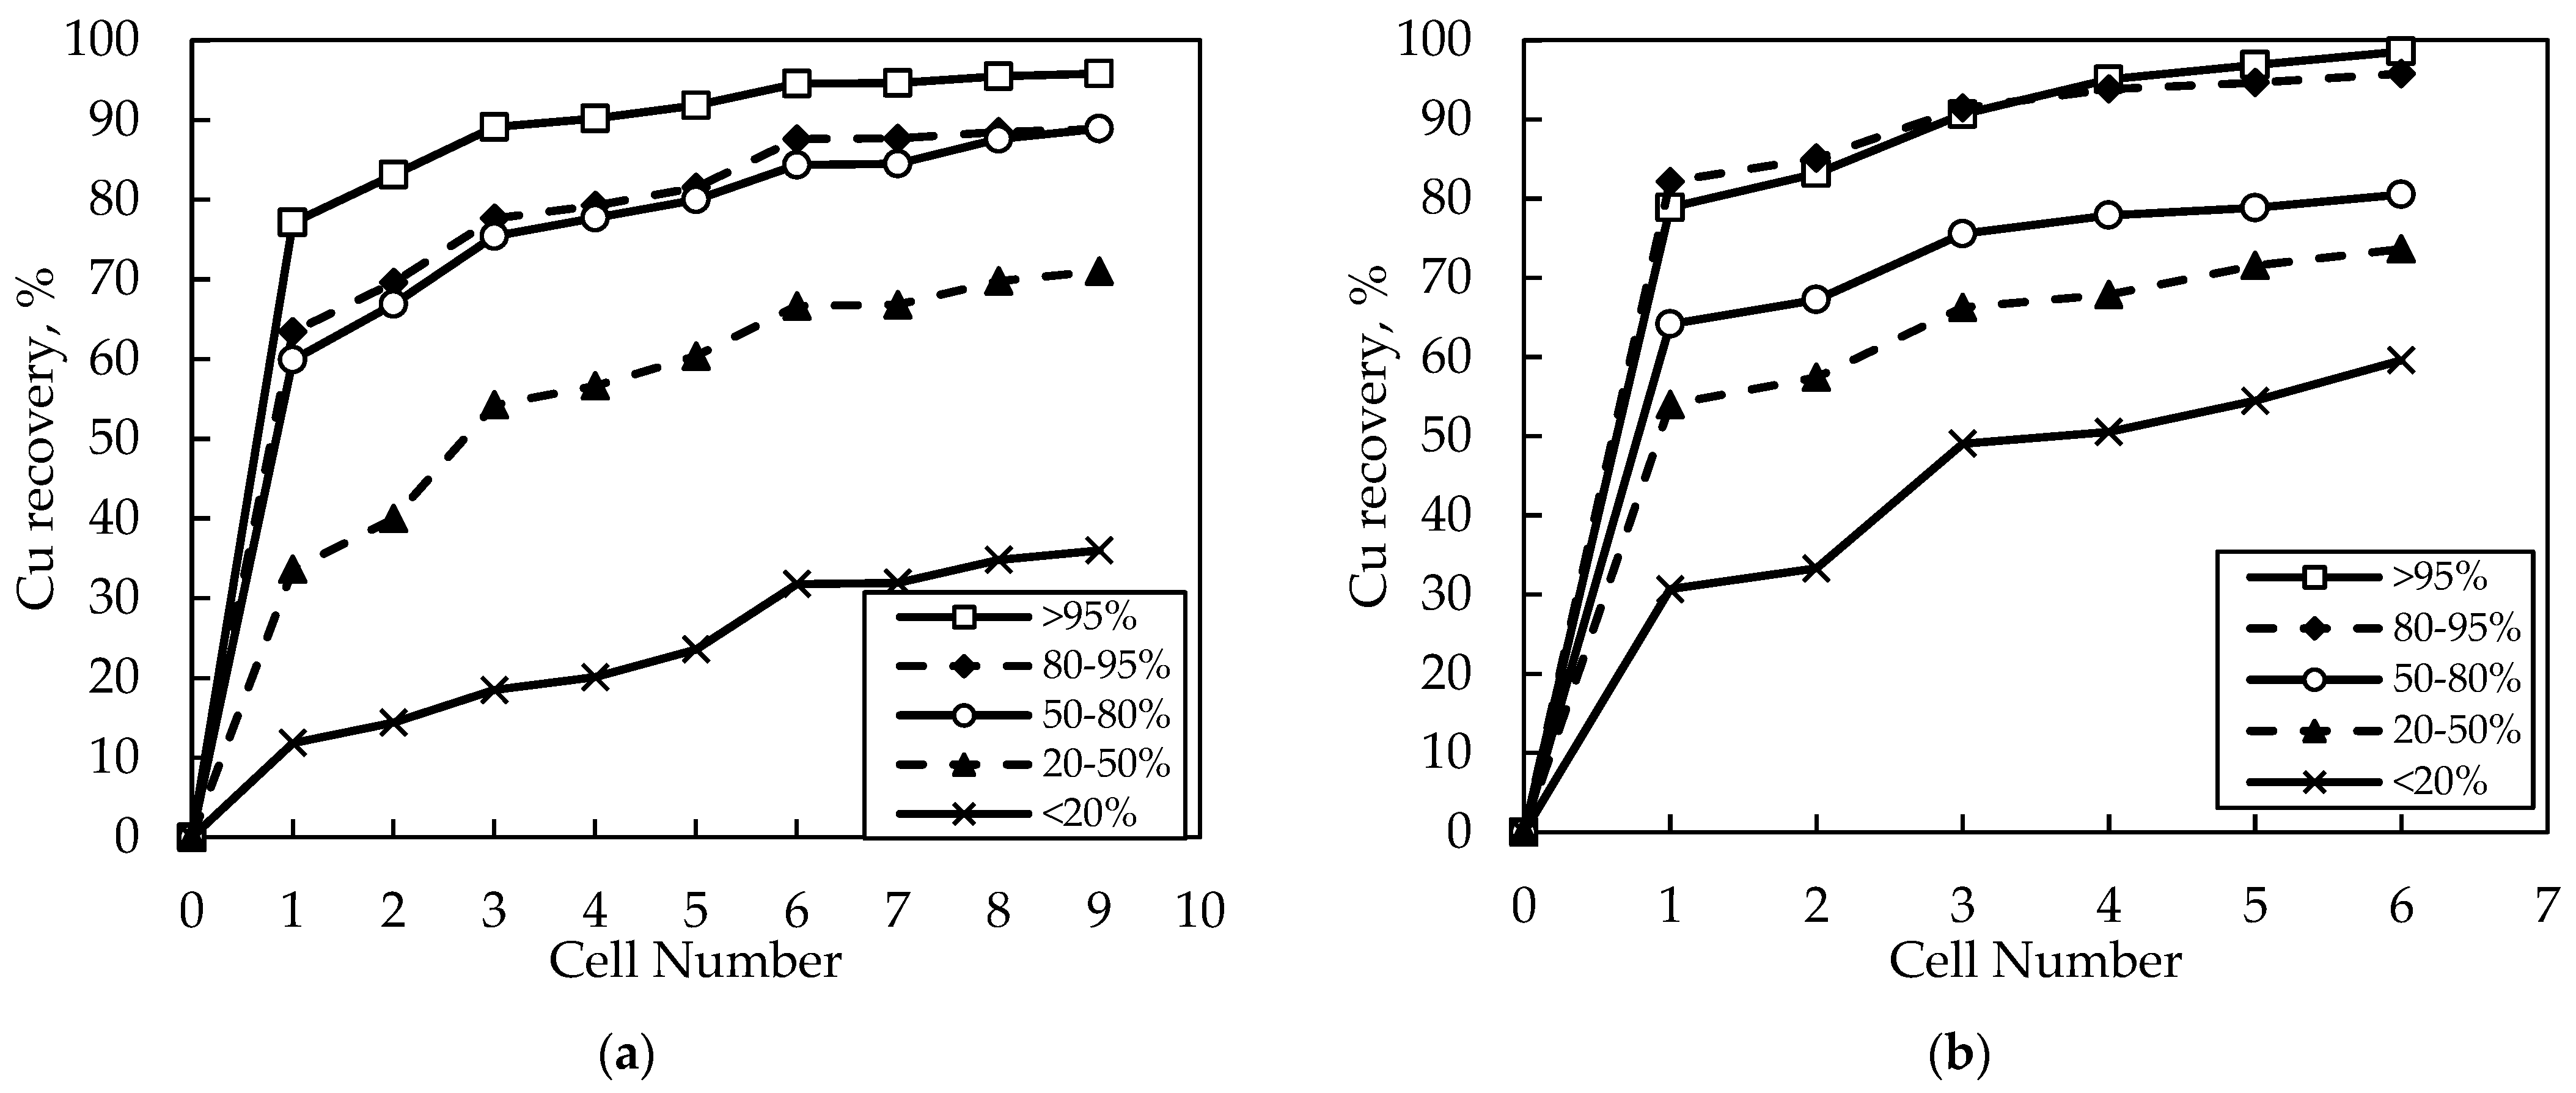
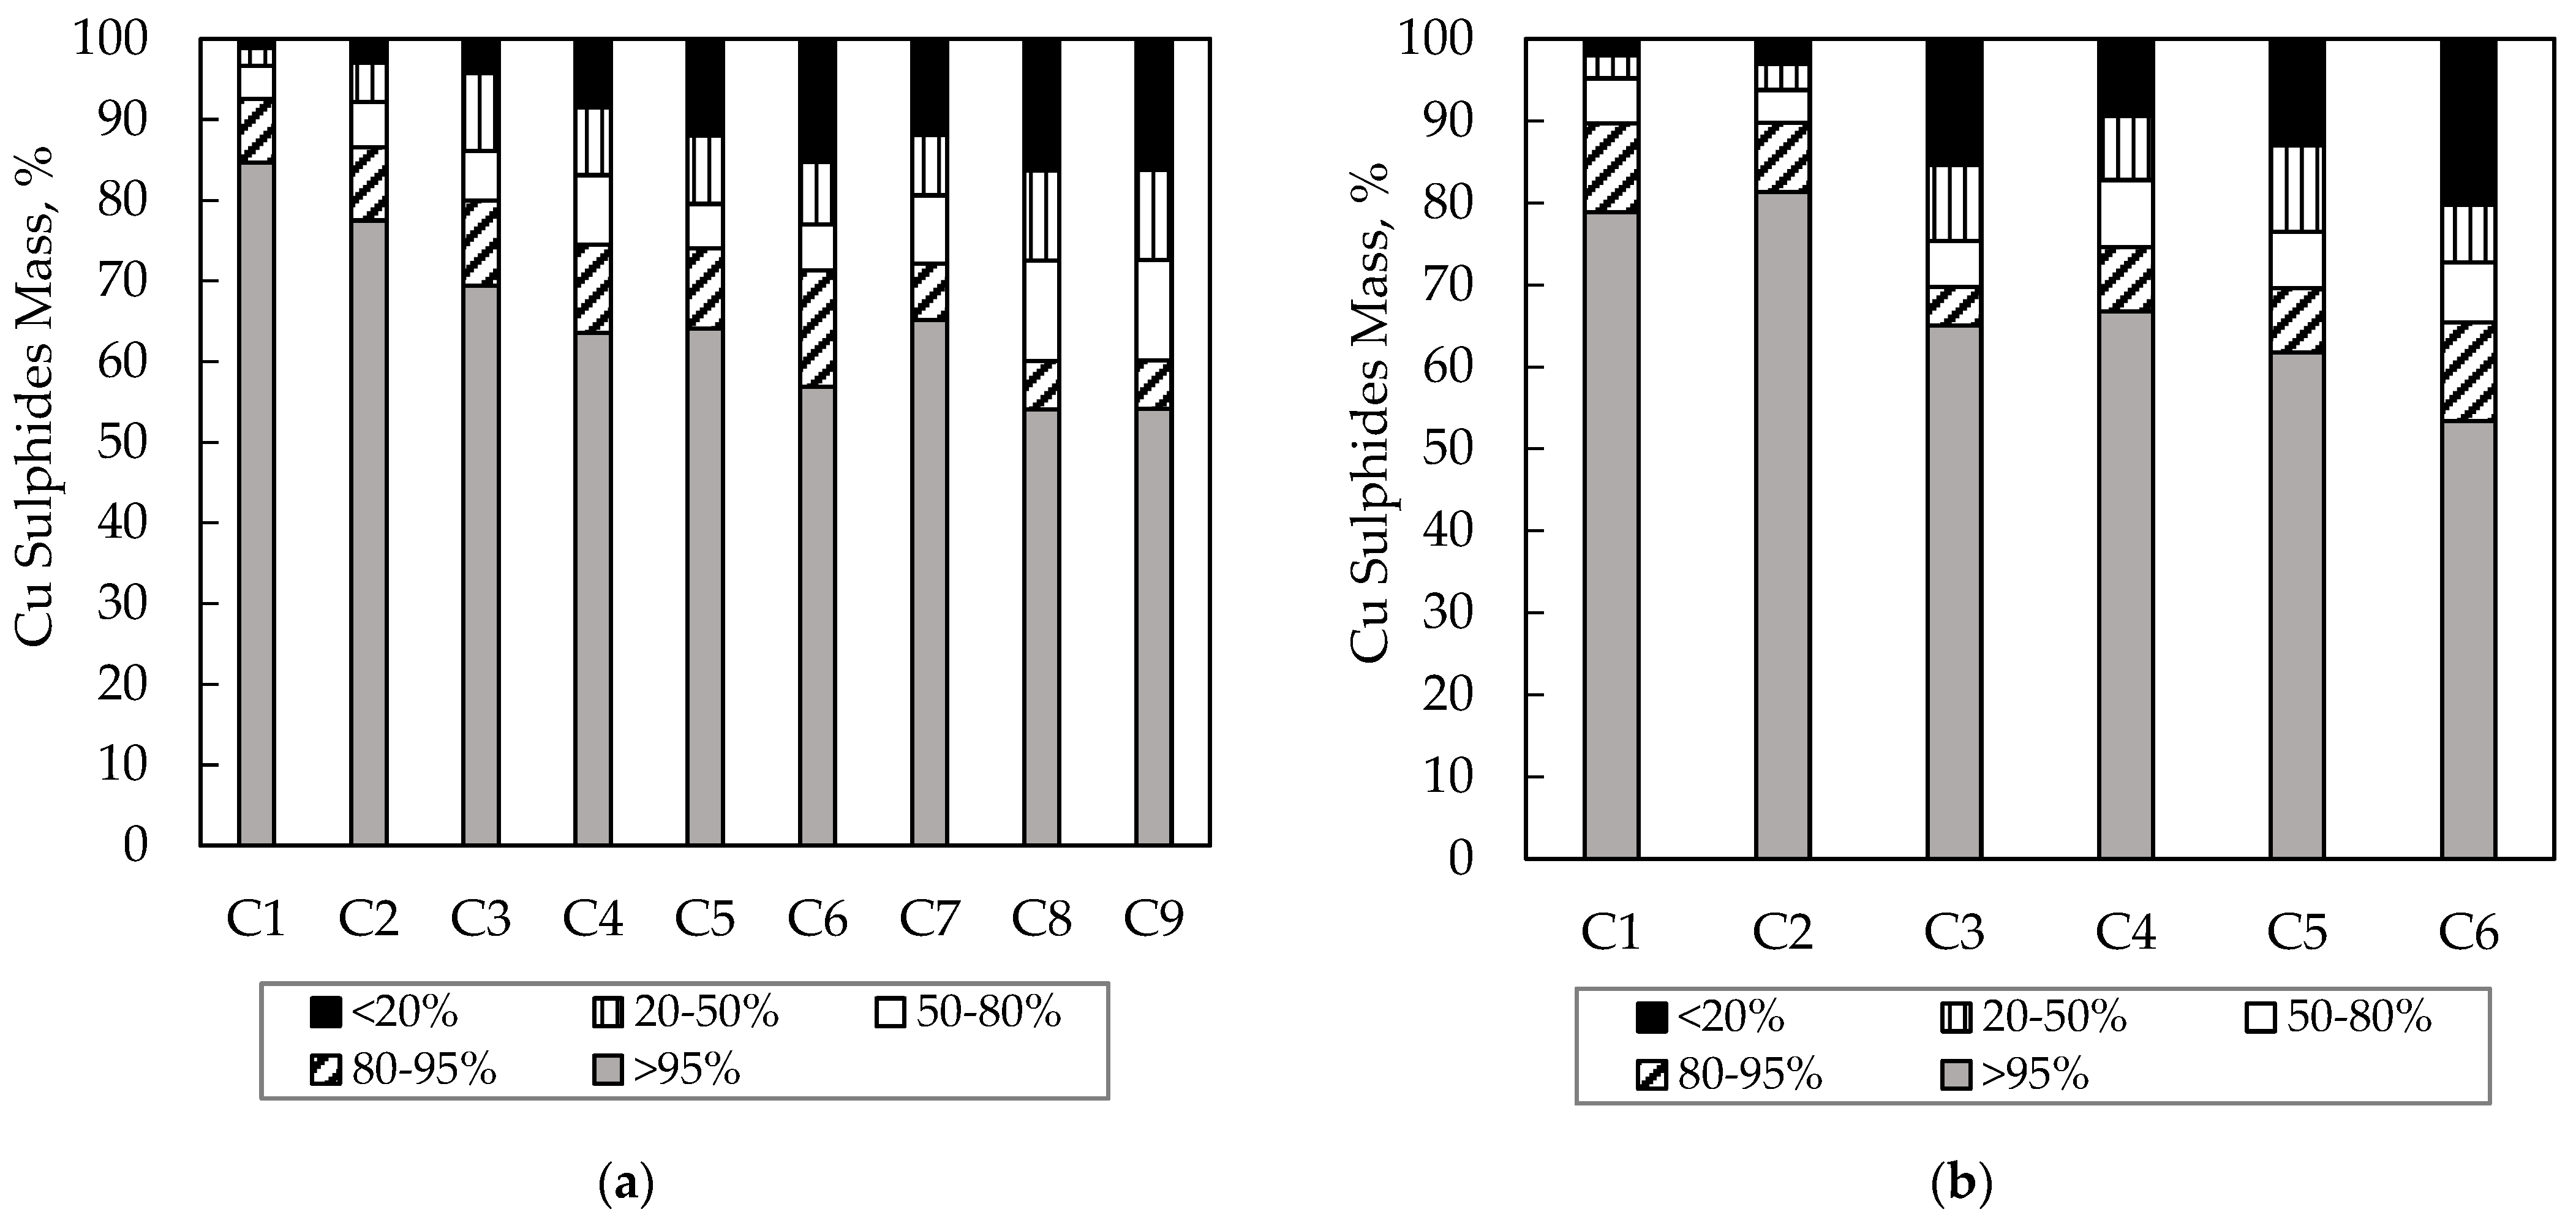
Once the bulk grades were mass balanced, the results from the mineralogical analysis along the banks were reconciled, considering the content of the main minerals in each stream (Cu sulphides, pyrite, molybdenite, insoluble, and clays). In this case, the recovery profiles for each mineral were consistent with those for the elements, e.g., Cu sulphides and Cu or molybdenite and Mo. Additionally, the content of Cu sulphides per liberation class in each stream was reconciled to obtain recovery profiles per 5 liberation class: free (>95% lib.), liberated (>80% lib.), middling (>50% lib.), sub-middling (>20% lib.), and locked (<20% lib.). The weighted recovery for each liberation class corresponded to the Cu sulphides recovery.

3. Results and Discussion

3.1. Flotation Kinetic Results

Figure 3 shows the recovery profiles of Cu, Mo, and Fe along Bank A (Figure 3a) and Bank B (Figure 3b). The results show final Cu recoveries of 88.7% and 94.4% in Banks A and B, respectively, with concentrate grades of 16.4% and 17.7%, respectively. Mo recovery reached 64.1% in Bank A and 81.5% in Bank B, with concentrate grades of 0.26% in both banks. Finally, Fe recoveries of 60.0% and 65.0% were observed in Banks A and B, with concentrate grades of 34.1% and 29.1%, respectively. The mass recovery was 6.6% in Bank A and 10.7% in Bank B.
The mineralogical analysis allowed for evaluating the recovery profiles of the main mineral presented in Banks A and B, as shown in Figure 4a,b, respectively. We found that Bank B showed a higher final recovery of Cu sulphides and molybdenite, compared to Bank A, which is partially due to the higher feed grades showed in Table 2. These differences can also be attributed to the different operating conditions and cell design of the banks. Additionally, clays and insoluble recoveries were also higher in Bank B. The insoluble minerals were mainly composed of silicates and phyllosilicates. On the other hand, Bank A showed a higher pyrite recovery, which increased along the bank, although the pyrite grade in the feed was lower than in Bank B.

3.2. Characterization of Minerals Flotation along the Rougher Banks

3.2.1. Characterization of Cu Recovery per Particle Size and Liberation

Figure 5 shows Cu recovery profiles per particle size class for Banks A and B. It can be observed that coarse particles (+150 µm) had a slower kinetic, whose difference was more significant in Bank A. Particles finer than 150 µm did not show significant differences in recovery.
In general, the results show that Bank B allowed for recovering coarser particles than Bank A. This could occur because of the differences in the operating conditions used in each bank and the different design and volume of the flotation cells (Bank A, 130 m3 vs. Bank B, 300 m3). Cells in Bank B had shorter froth transport distances than those in Bank A, which favoured the recovery of coarser particles. The effect of shortening froth transport distances by modifying launders’ configuration on the metallurgical performance was evaluated in some simulation studies [15], as well as in plant studies [16,17,18,19], where similar results were observed. Additionally, the mineral fed to Bank B was finer than that to Bank A, according to Table 1. This means that Bank A processed more coarse particles that could be much larger than 150 µm, which negatively affected the flotation process. On the other hand, the recovery of the finest class (ultrafine, −20 µm) was higher in Bank A, which can be attributed to the coarser mineral fed to this bank (higher P80 and lower %−20 µm), which surely had less content of ultrafine particles with low floatability.
Figure 6 shows Cu recovery profiles per liberation class for Banks A and B. Recovery gradually increased when liberation increased, a trend observed in both banks. However, Bank B allowed for recovering more locked particles than Bank A. This is consistent with the results from Figure 5, because coarser particles are commonly less liberated, as well as finer particles are typically more liberated.
It should be mentioned that the kinetics curves of Figure 6 are more separated from each other than those observed in Figure 5 for recovery per particle size class. Thus, liberation caused a more significant effect on recovery.
Figure 7 shows the final Cu recovery of Banks A and B as a function of particle size (Figure 7a) and liberation (Figure 7b). The curves of recovery per particle size class follow the expected trend, where recovery decreased for finer and coarser particles (commonly called “Elephant curve”). It can be clearly observed that Bank B was more efficient in recovering coarser particles, while Bank A allowed for reaching a higher recovery of ultrafine particles, as discussed in Figure 5.
The recovery curves per liberation class in Figure 7b show an increase from less to more liberated particles. An apparent linear relationship between the recovery and liberation of particles >20% lib. was observed for both banks. This is consistent with results observed in previous studies, at laboratory and plant scales, where recovery was characterized per particle size and liberation [20,21,22], and whose data were analysed and modelled by Vallejos et al. [23]. Additionally, the recovery in each liberation class was similar for Bank A and Bank B, except for the locked class, where Bank B achieved a higher recovery.

3.2.2. Characterization of Minerals in Concentrate Streams

Figure 8 shows the mineral content in the concentrate streams along Bank A and Bank B (Figure 8a,b, respectively). The results show a strong decrease in the content of Cu sulphides towards the end of the banks, which is due to the valuable mineral depletion along the bank. Additionally, an increase in the content of pyrite and insoluble was observed along the banks. However, Bank A presented a higher content of pyrite along the bank, while Bank B had a higher content of insoluble. In other words, Bank B achieved a better selective depression of pyrite, while Bank A showed better gangue entrainment control. The latter is due to cells in Bank B having shorter froth transport distances, favouring the water recovery, which caused the mechanical entrainment of insoluble. Additionally, the froth depths in the last three cells of Bank B were lower than in the other cells and in Bank A, which had an important effect on froth selectivity (analysed later in Section 3.2.3). Another factor that must be mentioned is that the feed stream to Bank B was finer; thus, there were more ultrafine gangue particles available to be entrained. On the other hand, the higher recovery of pyrite in Bank A can be associated with a higher liberation of this mineral in the feed, because the content of free pyrite in this stream was 50% higher in Bank A. The differences in pyrite recovery can also be associated with a higher pyrite-Cu sulphides association in the feed of Bank A, which favours the pyrite flotation, even when it is not activated.
Figure 9 shows the content of total Cu sulphides per liberation class in the concentrate streams along Bank A (Figure 9a) and Bank B (Figure 9b). We found that the relative content of free Cu sulphides (>95%) in concentrates decreased along the banks, while the content of middling and locked particles increased.
The most significant increase in the Cu sulphides content between the first and the last cells of the banks was observed for locked particles. This occurred because free, liberated, and part of the middling particles were recovered in the first cells and were depleted throughout the banks. Then, the relative content of locked particles fed to the last cells of the bank was higher. Additionally, locked particles were more difficult to recover by true flotation because they have a small exposed surface area, and longer residence times are required.
Figure 10 shows the content of Cu sulphides per association type in the concentrate streams of Bank A and Bank B (Figure 10a,b, respectively). The results show that most of the Cu sulphides were free in the concentrates of both banks, which can also be visualized in Figure 9. Additionally, a similar part of the Cu sulphides is associated with gangue or is a complex association, which increased along the bank as the content of free Cu sulphides decreased. Similar trends were observed for both banks.
It must be noticed that the association of Cu sulphides with pyrite was quite low. Thus, it was observed that pyrite recovered into the concentrates was free or in association with gangue. Therefore, this mineral was partially activated and mainly recovered by true flotation.
Figure 11 shows the content of free and middling minerals in concentrate streams for Bank A (Figure 11a) and Bank B (Figure 11b). The mineral content in the concentrate streams along the banks was analysed based on four groups of minerals: free Cu sulphides, free pyrite, middling (composed of pyrite, Cu sulphides and insoluble associations) and free insoluble (gangue entrainment), which were the main components of the concentrates samples. The results from Bank A and Bank B show a decrease in the content of free Cu sulphides and an increase in middling particles along the banks. Additionally, the content of free pyrite increased significantly along Bank A, while it had parabolic behaviour in Bank B, with a greater contribution of middling and insoluble minerals in the last cells. With respect to the free insoluble, which represents the gangue entrainment, no significant content was observed along Bank A. However, Bank B showed a higher content of free insoluble along the bank and particularly in the last cells, which is consistent with data from Figure 8.
The results show that the decrease in the concentrate Cu grades along the flotation banks was mainly due to the recovery of middling minerals and free pyrite, and to a lesser extent, to free insoluble.

3.2.3. Characterization of Gangue Entrainment

Figure 12 shows the free insoluble content in the concentrates and froth depth profiles along Bank A and Bank B (Figure 12a,b, respectively). The free insoluble content was obtained from the mineralogical analysis and was considered representative of gangue entrainment. The froth depth in each cell was manually measured along Banks A and B.
The results showed the behaviour of gangue entrainment along the banks, which was more significant for Bank B, and the relationship with the froth depth in each cell along the banks. A strong relationship, in which the free insoluble content increased when the froth depth decreased, was observed. This trend was more notable for Bank A.
We observed that the froth depth became critical to regulating the gangue entrainment, especially in the last cells of the flotation banks, in order to maintain a suitable selectivity of the flotation process. Other operating variables, such as the gas flowrate, are also important to control the gangue entrainment.
These results show the imperative requirement of keeping a proper calibration of the level sensors, since the experience from other concentrators showed significant differences (up to 50–100%) when comparing automatic data acquisition versus simple manual measurement used for calibration. The same is relevant for the gas flowrate sensors related to the periodic calibration at the local pressure.

4. Conclusions

The metallurgical performance of two industrial rougher flotation banks was characterized using particle size and mineralogical data for a copper sulphide mineral. This approach gives a better understanding of the whole flotation process than traditional approaches, as it is a useful tool for flotation circuit diagnosis and for improving the industrial operation.
Two flotation rougher banks with cells of 130 m3 and 300 m3 at a CMDIC concentrator were characterized, including the recovery per mineral species, particle size and liberation class, as well as the concentrates composition and gangue entrainment along the banks.
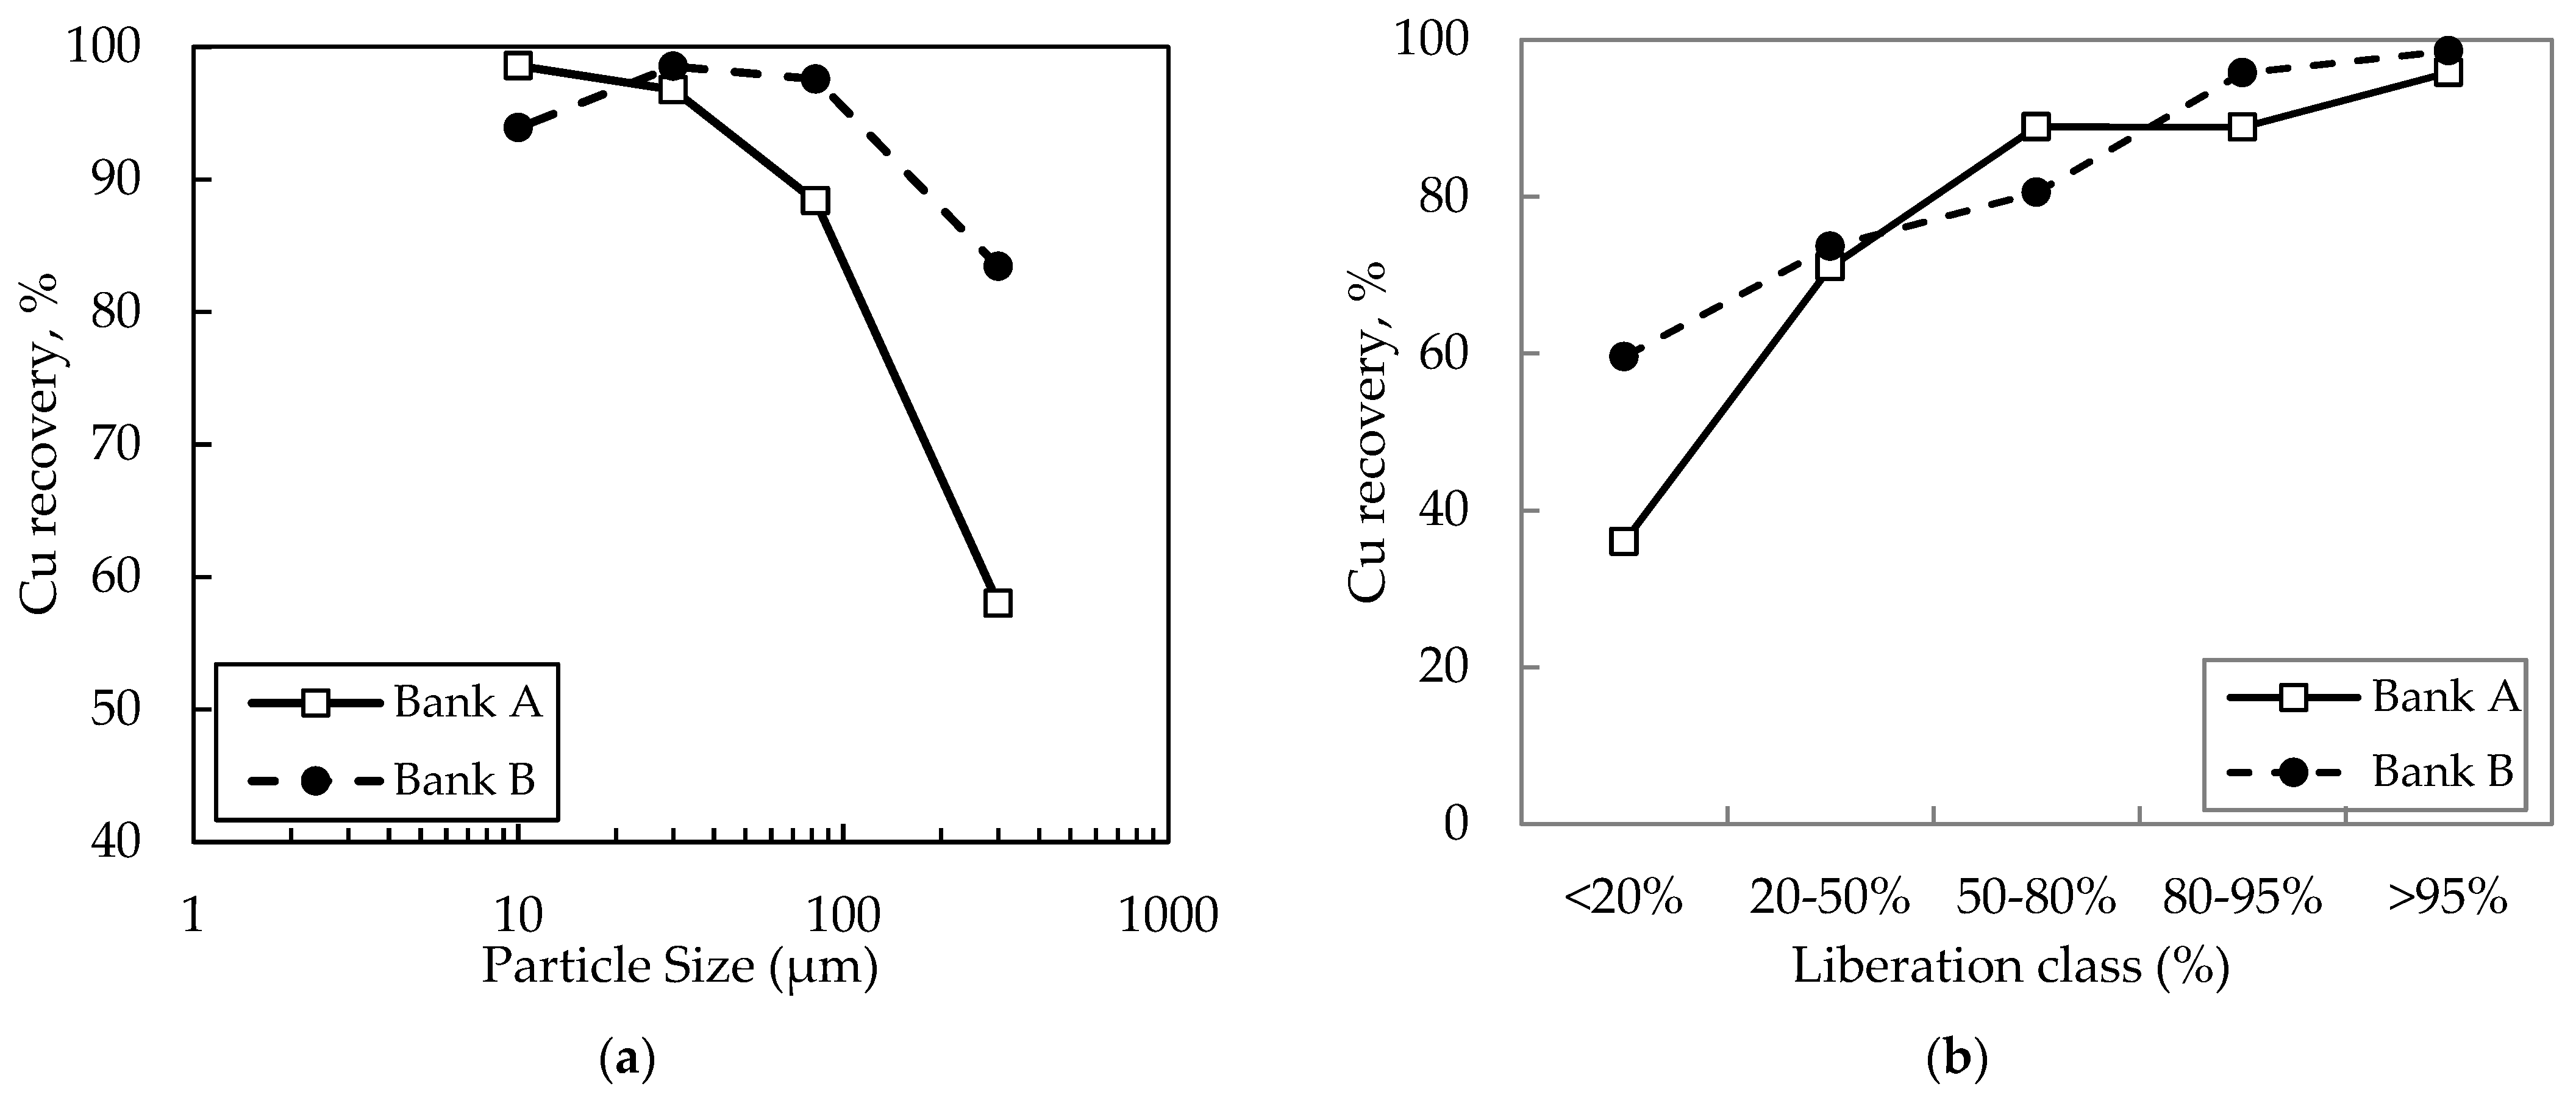
The results from both banks showed that the recovery per particle size class followed the common trend, in which recovery decreases for finer and coarser particles. We observed that Bank B (six 300 m3 cells) was more efficient in recovering coarser and locked particles, because the cells had shorter froth transport distances, and the mineral feed was finer (less presence of overly coarse particles). On the other hand, Bank A (nine 130 m3 cells) allowed for reaching a higher recovery of ultrafine particles, which can be associated with the coarser mineral feed (less presence of ultrafine particles) and the operating conditions of this bank.
The recovery per liberation class showed an apparent linear increase from sub-middling to free particles in both banks. These results validated the relationships observed in previous studies at the laboratory and industrial scale. We found that the changes in liberation caused a more significant effect on recovery than the particle size.
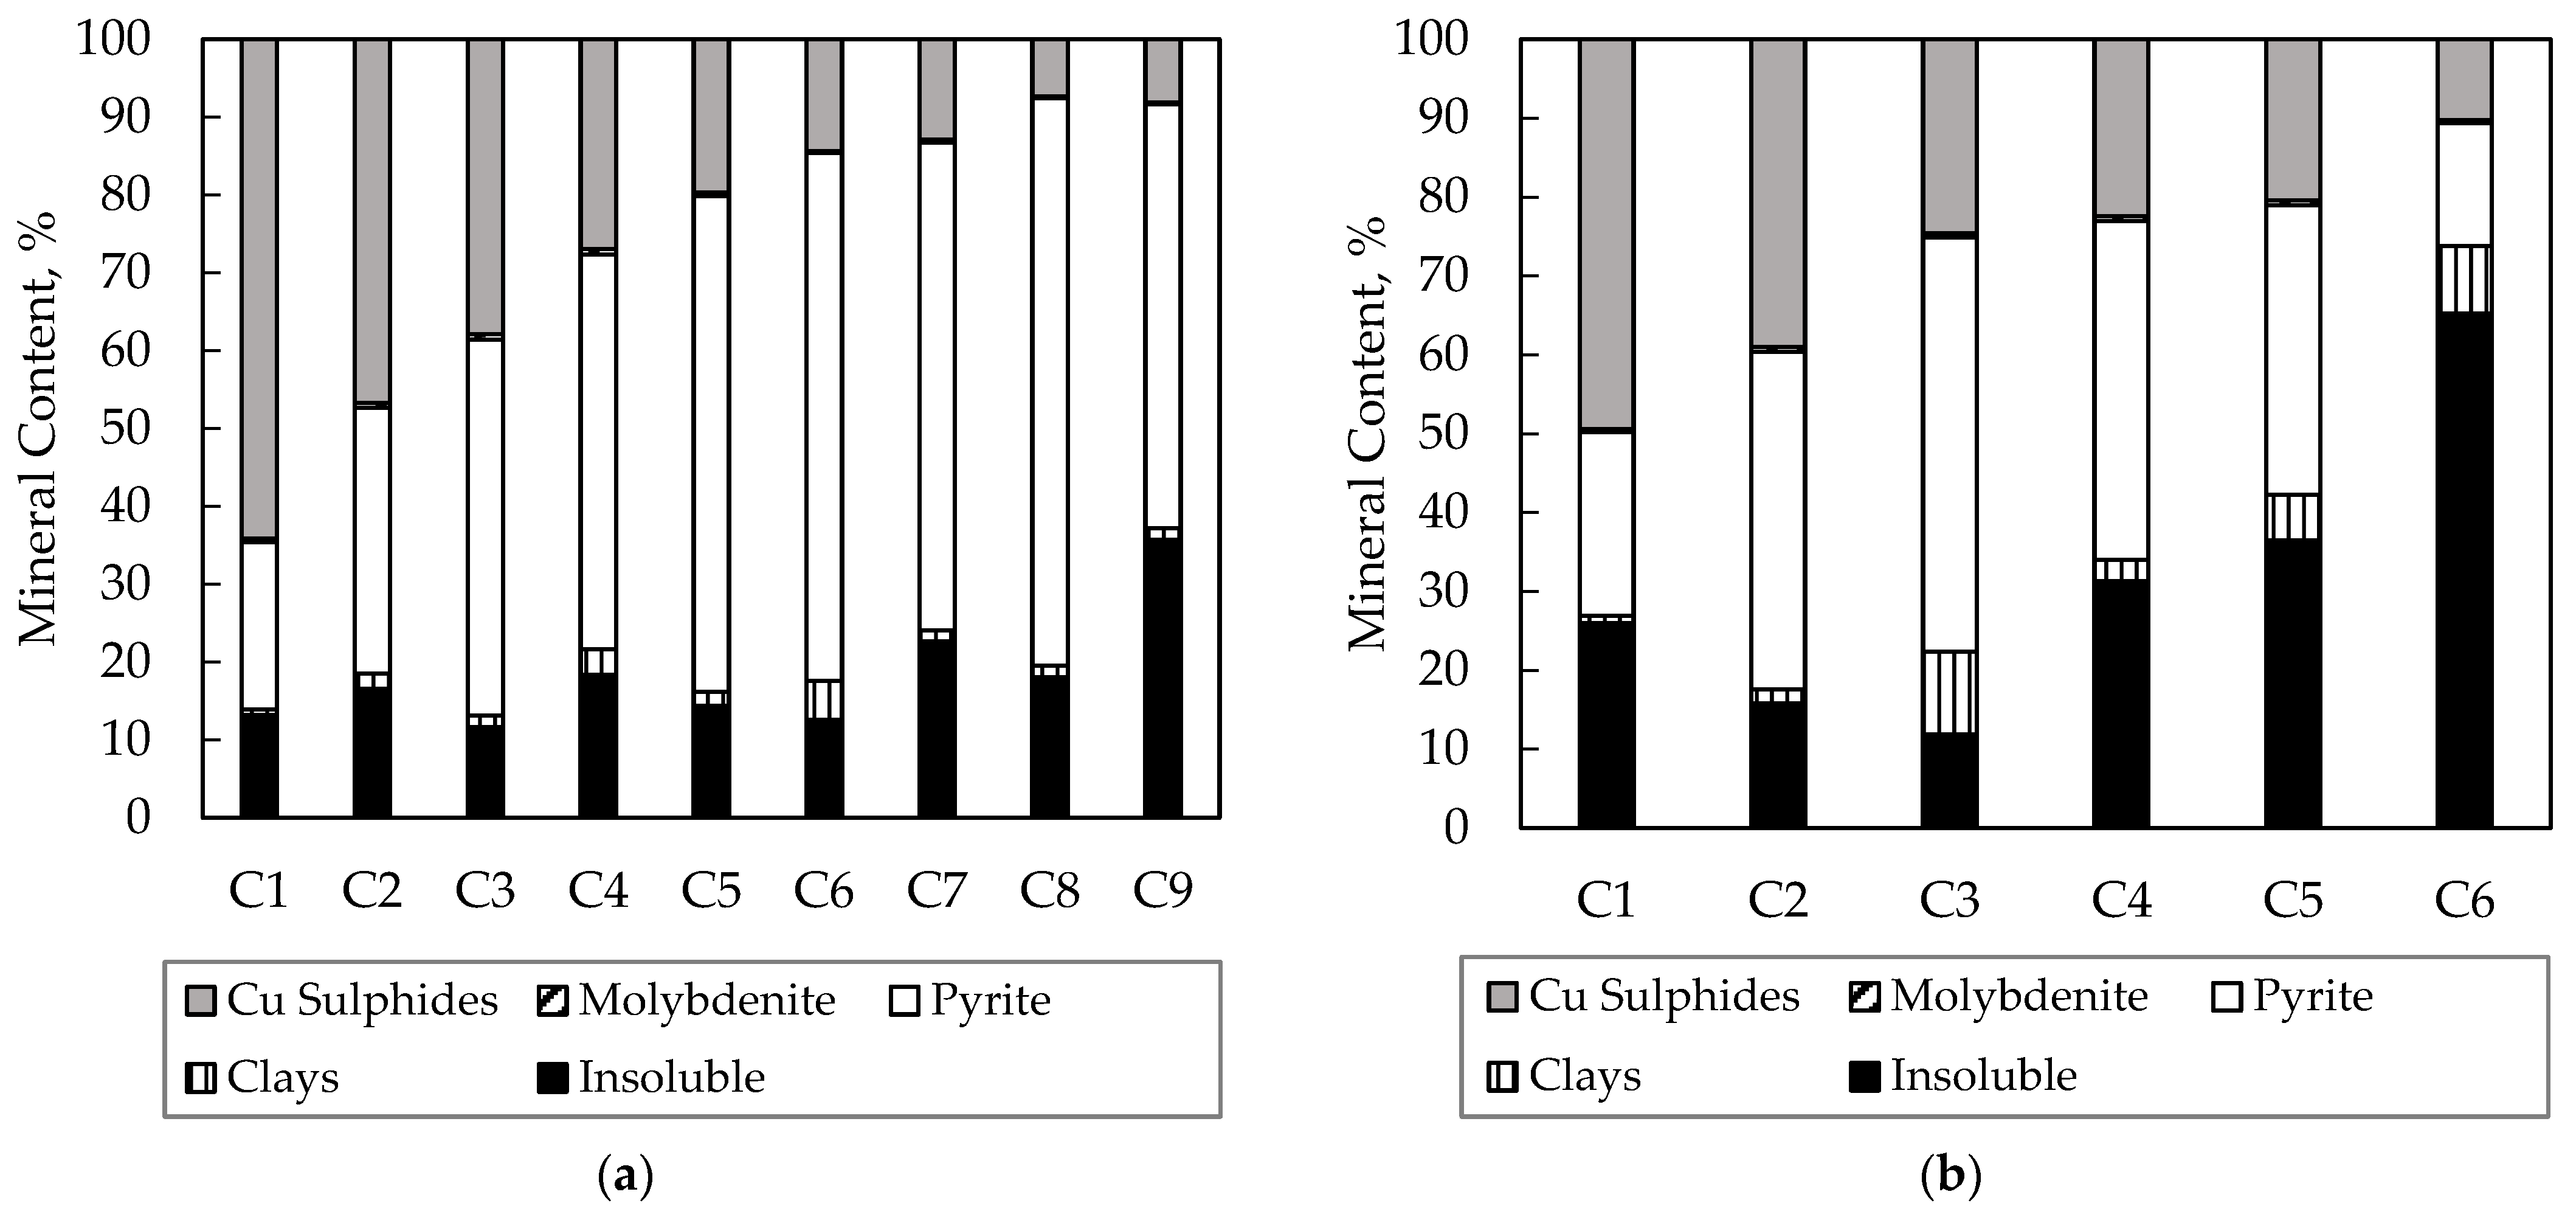
The characterization of concentrate streams along the banks showed a strong decrease in the content of Cu sulphides towards the end of the banks due to the valuable mineral depletion, while the content of pyrite and insoluble increased. We observed that Bank B achieved a better selective depression of pyrite, while Bank A showed better gangue entrainment control (because of the lower presence of ultrafine particles). Bank A showed a higher recovery of pyrite, which can be associated with a higher liberation of this mineral and a higher pyrite-Cu sulphides association in the feed of this bank.
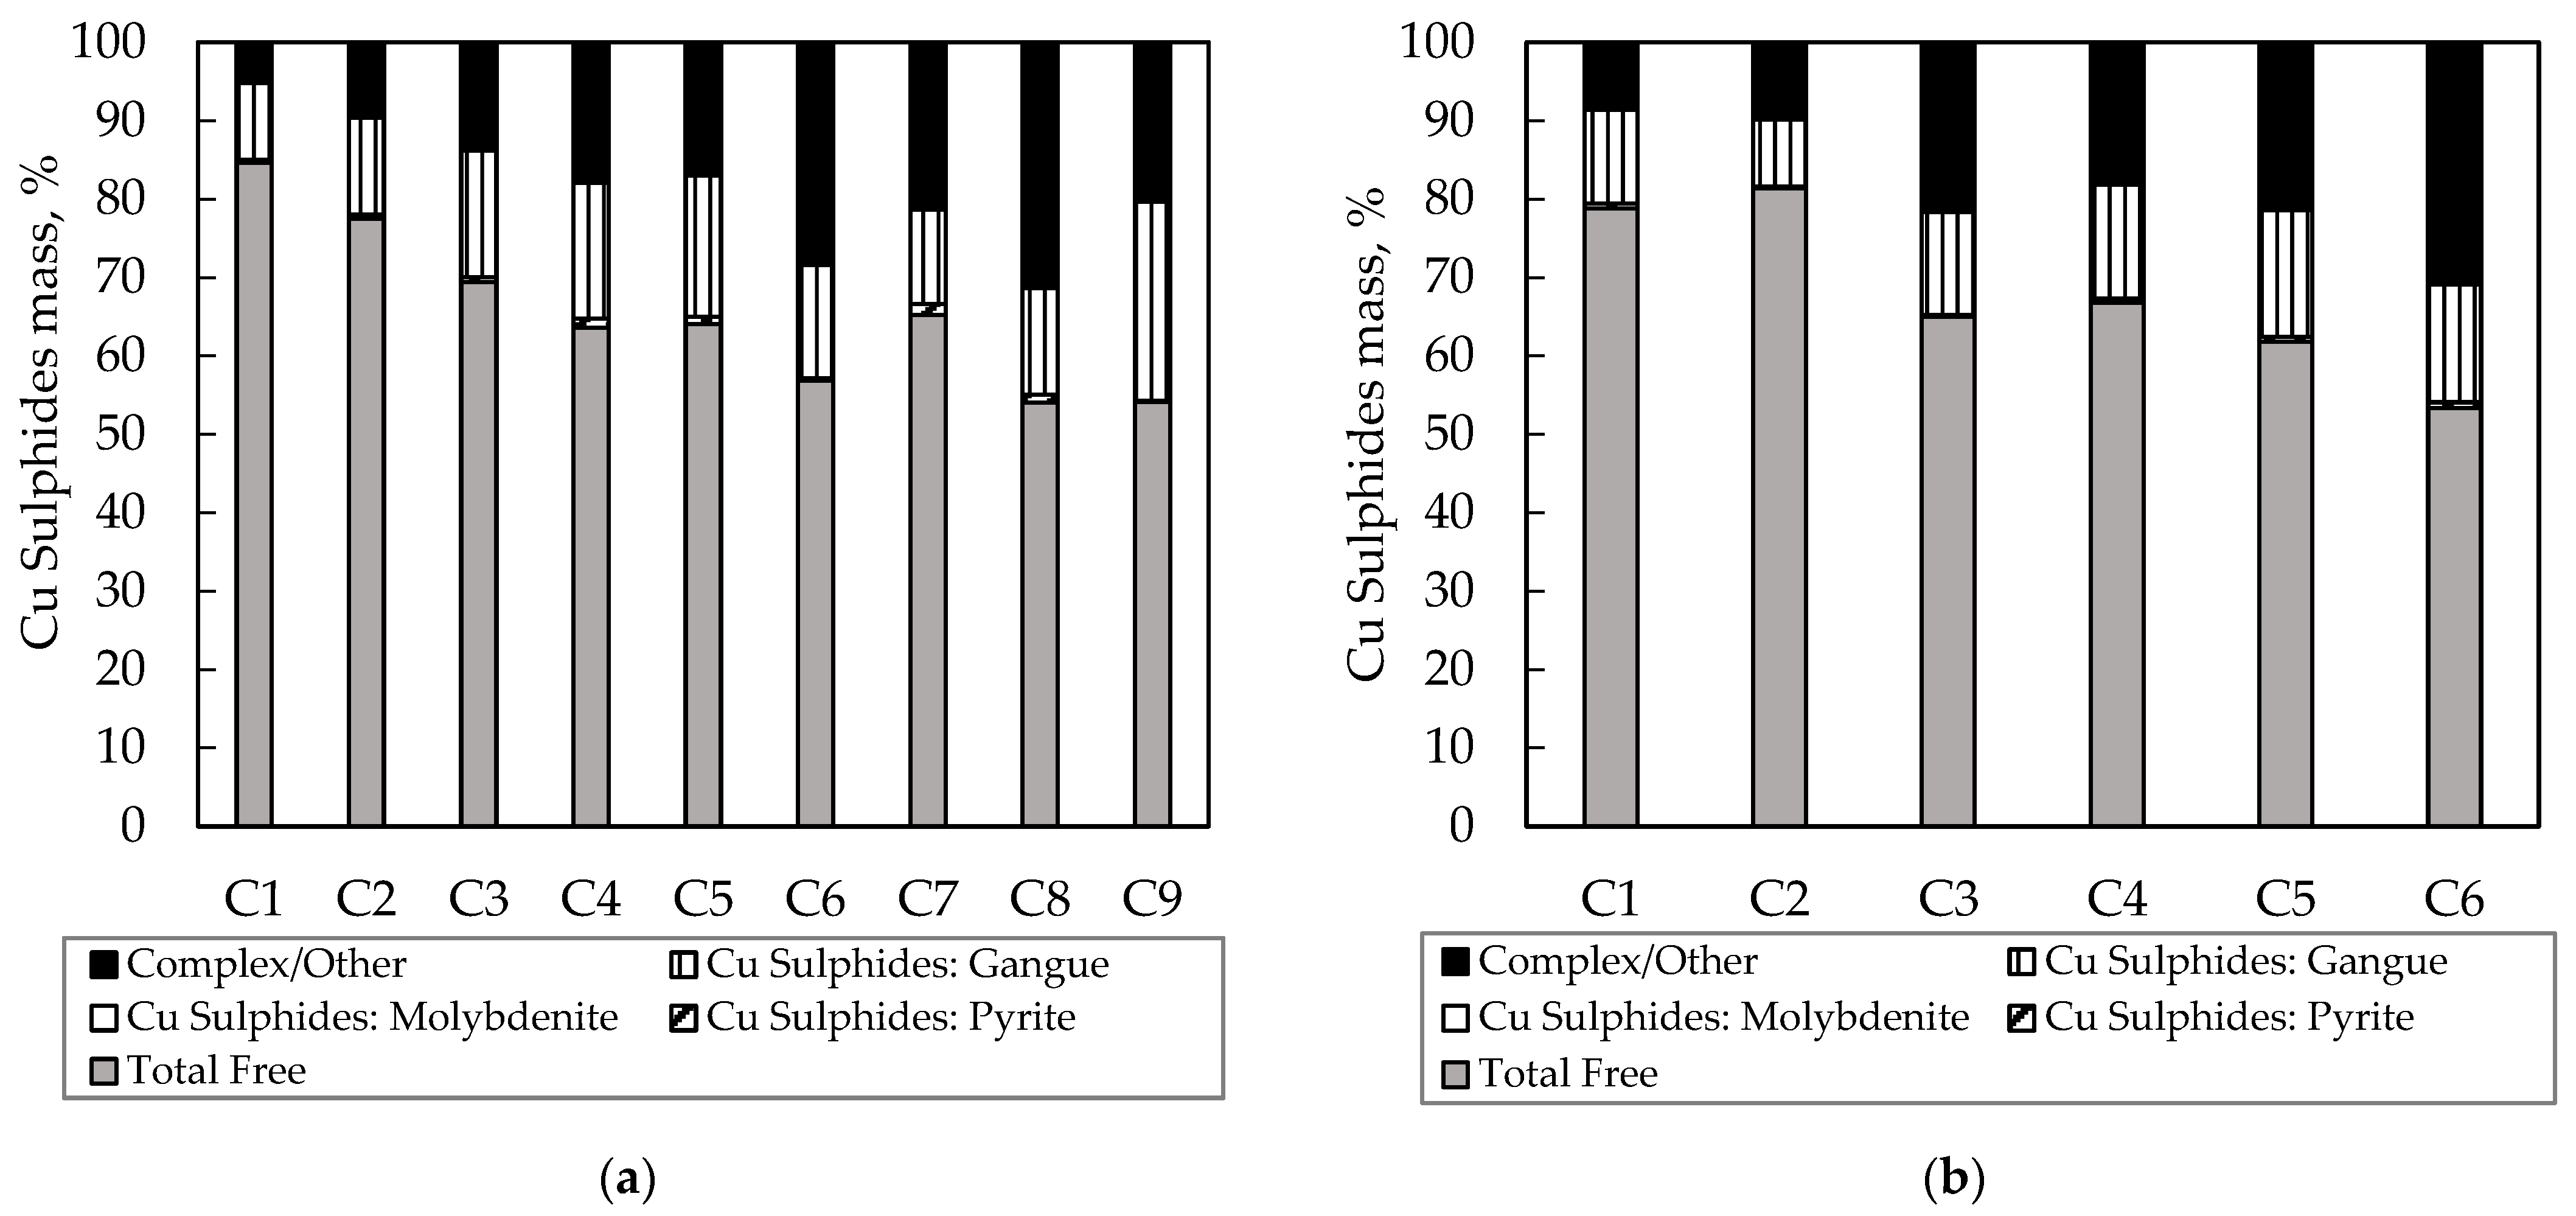
We found that most of the Cu sulphides were free (>95%) in the concentrates and decreased along the banks, while the content of middling and locked particles increased. This occurred because free, liberated, and part of the middling particles were recovered in the first cells and were depleted throughout the banks. Additionally, a smaller portion of the Cu sulphides was associated with gangue or was in a complex association, which increased along the bank as the content of free Cu sulphides decreased.
The results showed that the pyrite recovered into the concentrates was free or in association with gangue. Therefore, this mineral was partially activated and was mainly recovered by true flotation (particularly for Bank A).
We observed that the decrease in the concentrate Cu grades along the flotation banks was mainly due to the recovery of middling minerals and free pyrite, and to a lesser extent, to free insoluble.
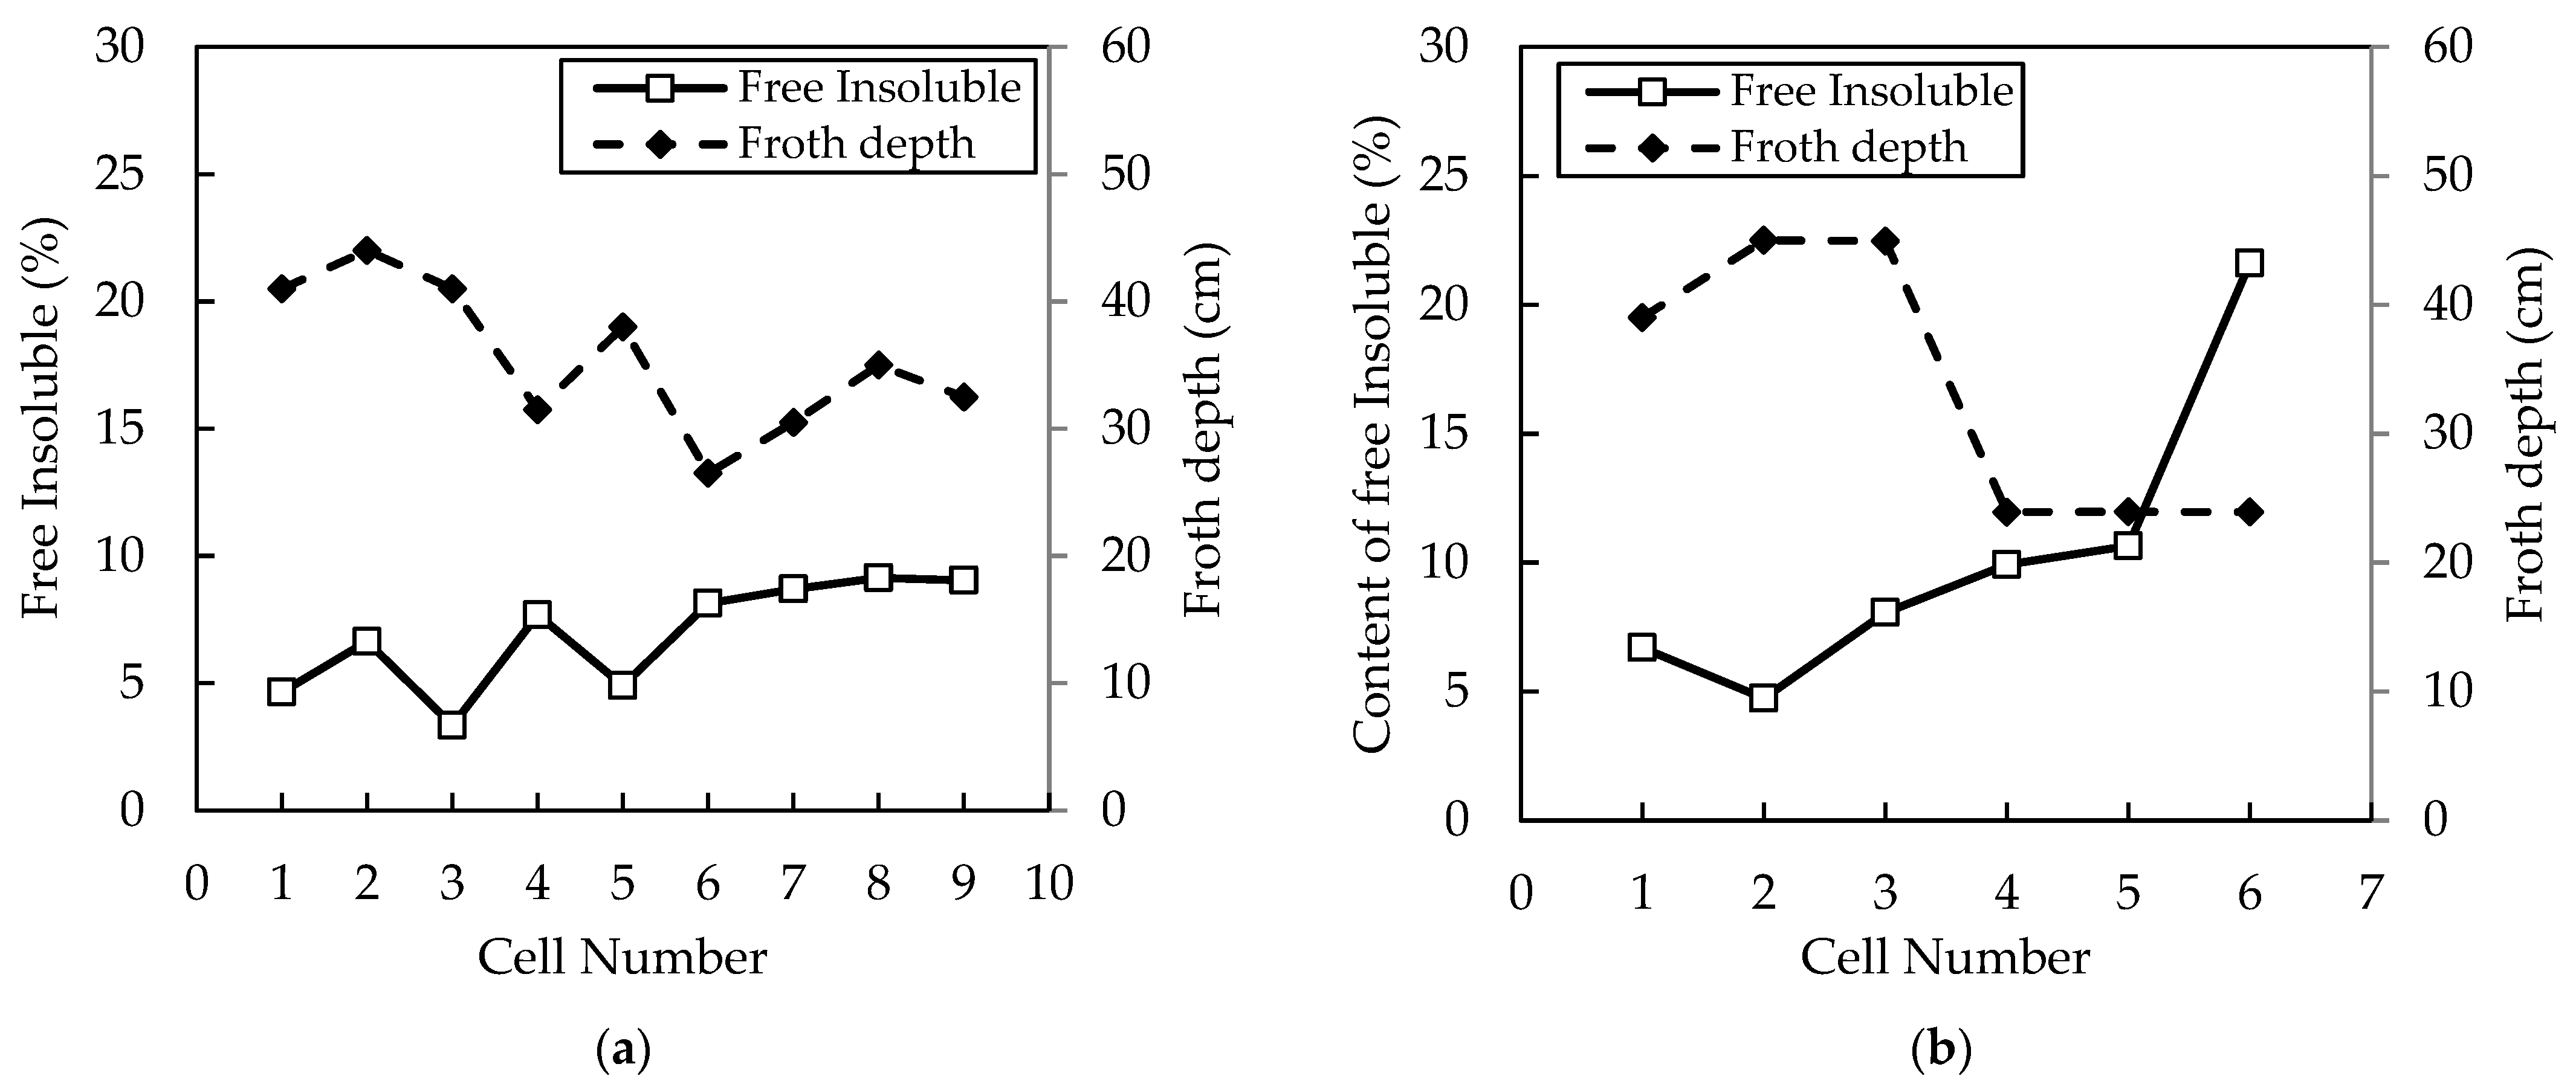
Finally, the results showed an increase in gangue entrainment throughout the banks, which was more significant for Bank B. In addition, a strong relationship between the gangue entrainment and froth depth was observed. Therefore, the froth depth and other variables, such as the gas flowrate, became critical to regulating the gangue entrainment, especially in the last cells of the flotation banks, in order to maintain a suitable selectivity of the flotation process.

Author Contributions

Conceptualization, P.V. and J.Y.; methodology, P.V., J.Y. and J.C.; software, P.V.; validation, J.Y., P.V. and M.R.; formal analysis, P.V.; investigation, J.Y. and P.V.; resources, M.R. and J.C.; data curation, P.V., J.Y. and J.C.; writing—original draft preparation, P.V. and J.Y.; writing—review and editing, P.V., M.R. and J.C.; visualization, J.Y.; supervision, J.Y. and M.R.; project administration, J.Y. and M.R.; funding acquisition, J.Y. and M.R. All authors have read and agreed to the published version of the manuscript.

Funding

This research and the APC were funded by Agencia Nacional de Investigación y Desarrollo (ANID), Fondecyt Project 1201335 and InES gender project (INGE210004).

Data Availability Statement

The data presented in this study are available on request from the corresponding author. The data are not publicly available due to confidentiality restrictions.

Acknowledgments

The authors are grateful to the Agencia Nacional de Investigación y Desarrollo (ANID), FONDECYT Project 1201335, and Universidad Técnica Federico Santa María for providing funding for process modelling and control research. Additionally, we would like to thank Doña Inés de Collahuasi Mining Company, Chile, Anglo American, for allowing this collaborative work to be published.

Conflicts of Interest

The authors declare no conflict of interest. The funders had no role in the design of the study; in the collection, analyses, or interpretation of data; in the writing of the manuscript; or in the decision to publish the results.

References

  1. Le, T.M.K.; Schreithofer, N.; Dahl, O. Dissolution test protocol for estimating water quality changes in minerals processing plants operating with closed water circulation. Minerals 2020, 10, 653. [Google Scholar] [CrossRef]
  2. Li, Y.; Li, W.; Wei, Z.; Xiao, Q.; Lartey, C.; Li, Y.; Song, S. The influence of common chlorides on the adsorption of sbx on chalcopyrite surface during flotation process. Miner. Process. Extr. Metall. Rev. 2018, 40, 129–140. [Google Scholar] [CrossRef]
  3. Hassanzadeh, A. Recovery improvement of coarse particles by stage addition of reagents in industrial copper flotation circuit. J. Dispers. Sci. Technol. 2016, 38, 309–316. [Google Scholar] [CrossRef]
  4. Sadr-Kazemi, N.; Cilliers, J.J. A technique for measuring flotation bubble shell thickness and concentration. Miner. Eng. 2000, 13, 773–776. [Google Scholar] [CrossRef]
  5. Hadler, K. Down the Bank Froth Stability and Flotation Performance. Ph.D. Thesis, University of Manchester, Manchester, UK, 2006. [Google Scholar]
  6. Jowett, A.; Sutherland, D.N. Some theoretical aspects of optimizing complex mineral separation systems. Int. J. Miner. Process. 1985, 14, 85–109. [Google Scholar] [CrossRef]
  7. Miller, P.R.; Reid, A.F.; Zuiderwyk, M.A. QEM*SEM image analysis in the determination of modal assays, mineral associations, and mineral liberation. In Proceedings of the XIV (IMPC) International Mineral Processing Congress, Toronto, ON, Canada, 17–23 October 1982. [Google Scholar]
  8. De Castro, B.; Benzaazoua, M.; Chopard, A.; Plante, B. Automated mineralogical characterization using optical microscopy: Review and recommendations. Miner. Eng. 2022, 189, 107896. [Google Scholar] [CrossRef]
  9. Wills, B.; Finch, J. Wills’ Mineral Processing Technology: An Introduction to the Practical Aspects of ore Treatment and Mineral Recovery, 8th ed.; Elsevier: Amsterdam, The Netherlands, 2016; pp. 297–380. [Google Scholar]
  10. Bu, X.; Xie, G.; Peng, Y.; Ni, C. Kinetics of flotation. Order of process, rate constant distribution and ultimate recovery. Physicochem. Probl. Miner. Process. 2017, 53, 342–365. [Google Scholar]
  11. Kalapudas, R.A. Study on scaling-up of laboratory batch flotation data to industrial size flotation. In Proceedings of the XV International Mineral Processing Congress, Cannes, France, 2–9 June 1985. [Google Scholar]
  12. Kupka, N.; Tolosana-Delgado, R.; Schach, E.; Bachmann, K.; Heinig, T.; Rudolph, M. R as an environment for data mining of process mineralogy data: A case study of an industrial rougher flotation bank. Miner. Eng. 2020, 146, 106111. [Google Scholar] [CrossRef]
  13. Campero, C.; Harris, L. The Legal Geographies of Water Claims: Seawater Desalination in Mining Regions in Chile. Water 2019, 11, 886. [Google Scholar] [CrossRef]
  14. Vinnett, L.; Yianatos, J.; Flores, S. On the mineral recovery estimation in Cu/Mo flotation plants. Miner. Metall. Process. 2016, 33, 97–106. [Google Scholar] [CrossRef]
  15. Vallejos, P.; Yianatos, J.; Grau, R.; Yañez, A. Evaluation of flotation circuits design using a novel approach. Miner. Eng. 2020, 158, 106591. [Google Scholar] [CrossRef]
  16. Grau, R.; Davoise, D.; Yañez, A.; López, A. Optimizing the froth area of large mechanical flotation cells. In Proceedings of the Procemin-Geomet Seminar on Geometallurgy, Santiago, Chile, 20–22 November 2019. [Google Scholar]
  17. Bermudez, G.; Amelunxen, P.; Medina, M.; Taylor, M.; Dube, R. Copper and molybdenum recovery increased by upgrading flotation cells with center launders at Hudbay Constancia. In Proceedings of the SME Annual Meeting, Virtual, 1–5 March 2021. [Google Scholar]
  18. Bermudez, G.; Perkins, T.; Sorensen, R.; Smith, C.; Bartsch, L.; Moyo, J.; Dube, R.; Brändström, M. Froth launder modification in 300 m3 flotation cells at Kennecott Copperton concentrator. In Proceedings of the SME Annual Meeting, Salt Lake City, UT, USA, 27 February–2 March 2022. [Google Scholar]
  19. Seaman, D.R.; Li, K.; Lamson, G.; Seaman, B.A.; Adams, M.H. Overcoming rougher residence time limitations in the rougher flotation bank at Red Chris Mine. In Proceedings of the 15th Mill Operators Conference, Brisbane, Australia, 23–25 June 2021. [Google Scholar]
  20. Welsby, S.D.D.; Vianna, S.M.S.M.; Franzidis, J.P. Assigning physical significance to floatability components. Int. J. Miner. Process. 2010, 97, 59–67. [Google Scholar] [CrossRef]
  21. Vianna, S.M.S.M. The Effect of Particle Size, Collector Coverage and Liberation on the Floatability of Galena Particles in an Ore. Ph.D. Thesis, Department of Mining, Minerals and Materials Engineering, The University of Queensland, Brisbane, Australia, 2004. [Google Scholar]
  22. Savassi, O.N. Estimating the recovery of size-liberation classes in industrial flotation cells: A simple technique for minimizing the propagation of the experimental error. Int. J. Miner. Process. 2006, 78, 85–92. [Google Scholar] [CrossRef]
  23. Vallejos, P.; Yianatos, J.; Vinnett, L. A Model Structure for Size-by-Liberation Recoveries in Flotation. Minerals 2021, 11, 194. [Google Scholar] [CrossRef]
Figure 1. Flotation Bank A (9 cells of 130 m3) at CMDIC concentrator.
Minerals 13 00621 g001
Figure 2. Flotation Bank B (6 cells of 300 m3) at CMDIC concentrator.
Minerals 13 00621 g002
Figure 3. Recovery profiles for Cu, Mo, and Fe: (a) Bank A and (b) Bank B.
Minerals 13 00621 g003
Figure 4. Recovery profiles for main minerals: (a) Bank A and (b) Bank B.
Minerals 13 00621 g004
Figure 5. Cu recovery profiles per particle size class: (a) Bank A and (b) Bank B.
Minerals 13 00621 g005
Figure 6. Cu recovery profiles per liberation class: (a) Bank A and (b) Bank B.
Minerals 13 00621 g006
Figure 7. Final Cu recovery of Banks A and B per: (a) Particle size and (b) Liberation class.
Minerals 13 00621 g007
Figure 8. Content of minerals in concentrate streams along the banks: (a) Bank A and (b) Bank B.
Minerals 13 00621 g008
Figure 9. Content of Cu sulphides per liberation class in concentrate streams in: (a) Bank A and (b) Bank B.
Minerals 13 00621 g009
Figure 10. Content of Cu sulphides per association type in concentrate streams in: (a) Bank A and (b) Bank B.
Minerals 13 00621 g010
Figure 11. Content of free and middling minerals in concentrate streams in: (a) Bank A and (b) Bank B.
Minerals 13 00621 g011
Figure 12. Free insoluble in concentrate streams and froth depth along: (a) Bank A and (b) Bank B.
Minerals 13 00621 g012
Table 1. Feed characteristics for Banks A and B.
Bank ABank B
Tonnage (t/h)5181251
Solid content (%)30.529.8
Particle size, P80 (µm)214134
Mass fraction −20 µm (%)50.656.2
Mass fraction +212 µm (%)20.511.4
Cu grade (%)1.211.99
Mo grade (ppm)262338
Fe grade (%)3.74.8
Table 2. Minerals distribution in feed of Banks A and B.
Bank ABank B
Cu Sulphides (%)3.35.0
Pyrite (%)5.36.2
Molybdenite (ppm)438565
Clays (%)5.66.1
Table 3. Cu sulphides distribution in feed of Banks A and B.
Bank ABank B
Chalcopyrite92.591.2
Bornite5.75.3
Chalcocite1.53.5
Other Sulphides0.300.04
Table 4. Cu sulphides distribution per liberation class in feed of Banks A and B.
Bank ABank B
Free (>95%)75.674.3
Liberated (>80%)8.610.6
Middling (>50%)4.75.6
Sub-Middling (>20%)4.53.7
Locked (<20%)6.75.8
Disclaimer/Publisher’s Note: The statements, opinions and data contained in all publications are solely those of the individual author(s) and contributor(s) and not of MDPI and/or the editor(s). MDPI and/or the editor(s) disclaim responsibility for any injury to people or property resulting from any ideas, methods, instructions or products referred to in the content.

