Article

Investigations of Monomineralic Flotation of Galena, Sphalerite, and Pyrite at Different Temperatures

Department of Mining and Materials Engineering, McGill University, 3610 Rue University, Montreal, QC H3A 0C5, Canada
*
Author to whom correspondence should be addressed.
Minerals 2023, 13(5), 615; https://doi.org/10.3390/min13050615
Submission received: 10 April 2023 / Revised: 20 April 2023 / Accepted: 25 April 2023 / Published: 28 April 2023
(This article belongs to the Special Issue Recent Advances in Flotation Process)

Abstract

:
Temperature variations could potentially impact flotation performance, leading to operational and economic issues. Several historical and currently operating plants across Canada have reported seasonal metal losses as one of their major challenges. Improvements in flotation efficiency at cold temperatures are important for the sustainable development of the industry, especially in view of expanding mining operations to the north and the increasing impact of climate change-originated weather extremes on mining operations. To better understand the driving mechanisms of the seasonal metallurgical variation, the degree of vulnerability of froth flotation to fluctuations in temperature, and to develop recommendations addressing seasonally driven losses, a series of mono-mineral flotation tests were conducted. The observed variations in yield and recovery kinetics for different sulfide minerals follow a similar pattern: higher recovery and slower kinetics at lower temperatures, and lower recoveries and faster kinetics at higher temperature conditions. Following the results of the flotation tests, foam height and stability were investigated at different temperatures to explain the observed variations. A high correlation between changes in mono-mineral flotation behavior and foam properties with temperature was revealed.

1. Introduction

Temperature is one of the most important factors in mineral processing as it can affect milling, classification, and flotation, among other operations [1,2,3]. A comprehensive review of the effects of temperature on flotation revealed that temperature fluctuations affect all four flotation components, namely, water, ore, gas, flotation chemicals, and their interactions [4]. An increase in the flotation pulp temperature leads to higher rates of surface reactions, intensifying the flotation process [2]. Variations in temperature are known to affect not only collection zone pH, viscosity, and bubble formation mechanism, but also froth zone stability [5]. By knowing a given pulp condition and understanding acting mechanisms, one may predict the change in recovery with respect to temperature [6]. Generally, there is a larger impact of temperature variations in fatty-acid flotation, compared to xanthate-based sulphide flotation systems. Such disproportional response could be explained by relatively high solubility of xanthates in cold pulps compared to fatty acids [2]. Therefore, in most cases, it is considered impractical to heat up sulphide pulps during flotation. Limited applications of sulphide pulp heating were mostly found in the separation of molybdenite and copper minerals, as well as in sphalerite recovery [7]. Generally, in sulphide flotation, temperature changes may be used for controlling oxidative reactions and foamability [2].
O’Connor et al. found that, in pyrite flotation, the increased froth stability at temperatures below 10 °C promoted excessive gangue entrainment, leading to poorer concentrate grades [5]. According to Equation (1), entrainment is proportional to the water recovery in the concentrate [8]:
R G = e G · R w
where R G is the recovery of fine gangue, e G is a gangue material constant (dependent on particle size and specific gravity), and R w is water recovery. As for the total recovery of a mineral of interest (hydrophobized mineral particles) R M , it consists of two main parts: water recovery-controlled, and water recovery-independent, as demonstrated in Equation (2):
R M = R i n d + e M · R w
where R i n d is the model’s extrapolated intercept on the recovery axis and e M is entrainment factor for the mineral of interest. Water recovery ( R w ), as shown in Equation (3), is a parameter that depends on two steps: water recovery from pulp zone to froth zone ( R c w ) and water recovery from froth phase to concentrate ( R f w ). The latter is largely affected by froth height H f (dm) and residence time τ f (min), as shown in Equations (4)–(6) [9]:
R w = R c w · R f w 1 R c w + R c w · R f w
R f w H f = e V · ε f · A · H f Q a
τ f = ε f · A · H f Q a
R f w = α e V · τ f
where ε f is air holdup, A is cross-sectional area of the froth phase (dm2), Q a is the rate of air flow (L/min) passing though the froth zone, α is the fraction of the froth that reports to the concentrate, and V is water drainage rate (m/s). Liquid drainage and gas disproportionation constitute two major macroscopic processes destabilizing foams [10].
Coalescence is another important destabilizing mechanism which occurs due to the drainage from inter-bubble liquid film, leading to lamella film thinning and rupture. Therefore, this mechanism, with lamella rupture and a subsequent reduction in foam height, also originates from the drainage macroprocess [11,12]. The rate of liquid drainage [10] (also known as Reynolds drainage) depends on continuous phase viscosity (Equation (7)), which renders it a temperature-dependent parameter when considering Barrier’s equation [13], Equation (8):
V = 2 h 3 · P 3 μ · r 2
log μ = β 0 + β 1 T
where h is the liquid film thickness (m), P is the difference between hydrostatic pressure and disjoining pressure (N/m2), μ is continuous phase dynamic viscosity (Pa·s), r is bubble radius (m), β 0 and β 1 are empirical constants, and T is the temperature (K).
Stabilization of foams may be achieved by increasing continuous phase viscosity, increasing disjoining pressure (by developing osmotic pressure with help of surfactants) [10], attaching mineral particles to the bubbles (mechanically preventing bubble convergence) [2,14], and some other means. Flotation froth should satisfy two principal criteria: it should be stable enough to allow valuable mineral recovery, while possessing flexibility for gangue drainage [2,15].
Bhondayi summarized different attempts for froth stability assessment [15], such as froth half-life time measurements [16], recording froth height at equilibrium [17,18,19,20], froth phase bubble size measurements [21,22], etc. Froth height was found to have a linear negative impact on flotation rate constant k [23]:
k = θ 0 θ 1 · H f
where θ 0 is intercept at zero froth height and θ 1 is the gradient of the flotation rate constant versus froth height plot.
Froth recovery is another important parameter affecting the flotation rate constant [24], which depends on froth half-life time, as per Equation (11) [25]:
k = P · S b · R f
R f = e c · τ f t 1 2
where P is ore floatability parameter, S b is bubble surface area flux (s−1), R f is froth recovery, c is a froth parameter, and t ½ is froth half-life (s).
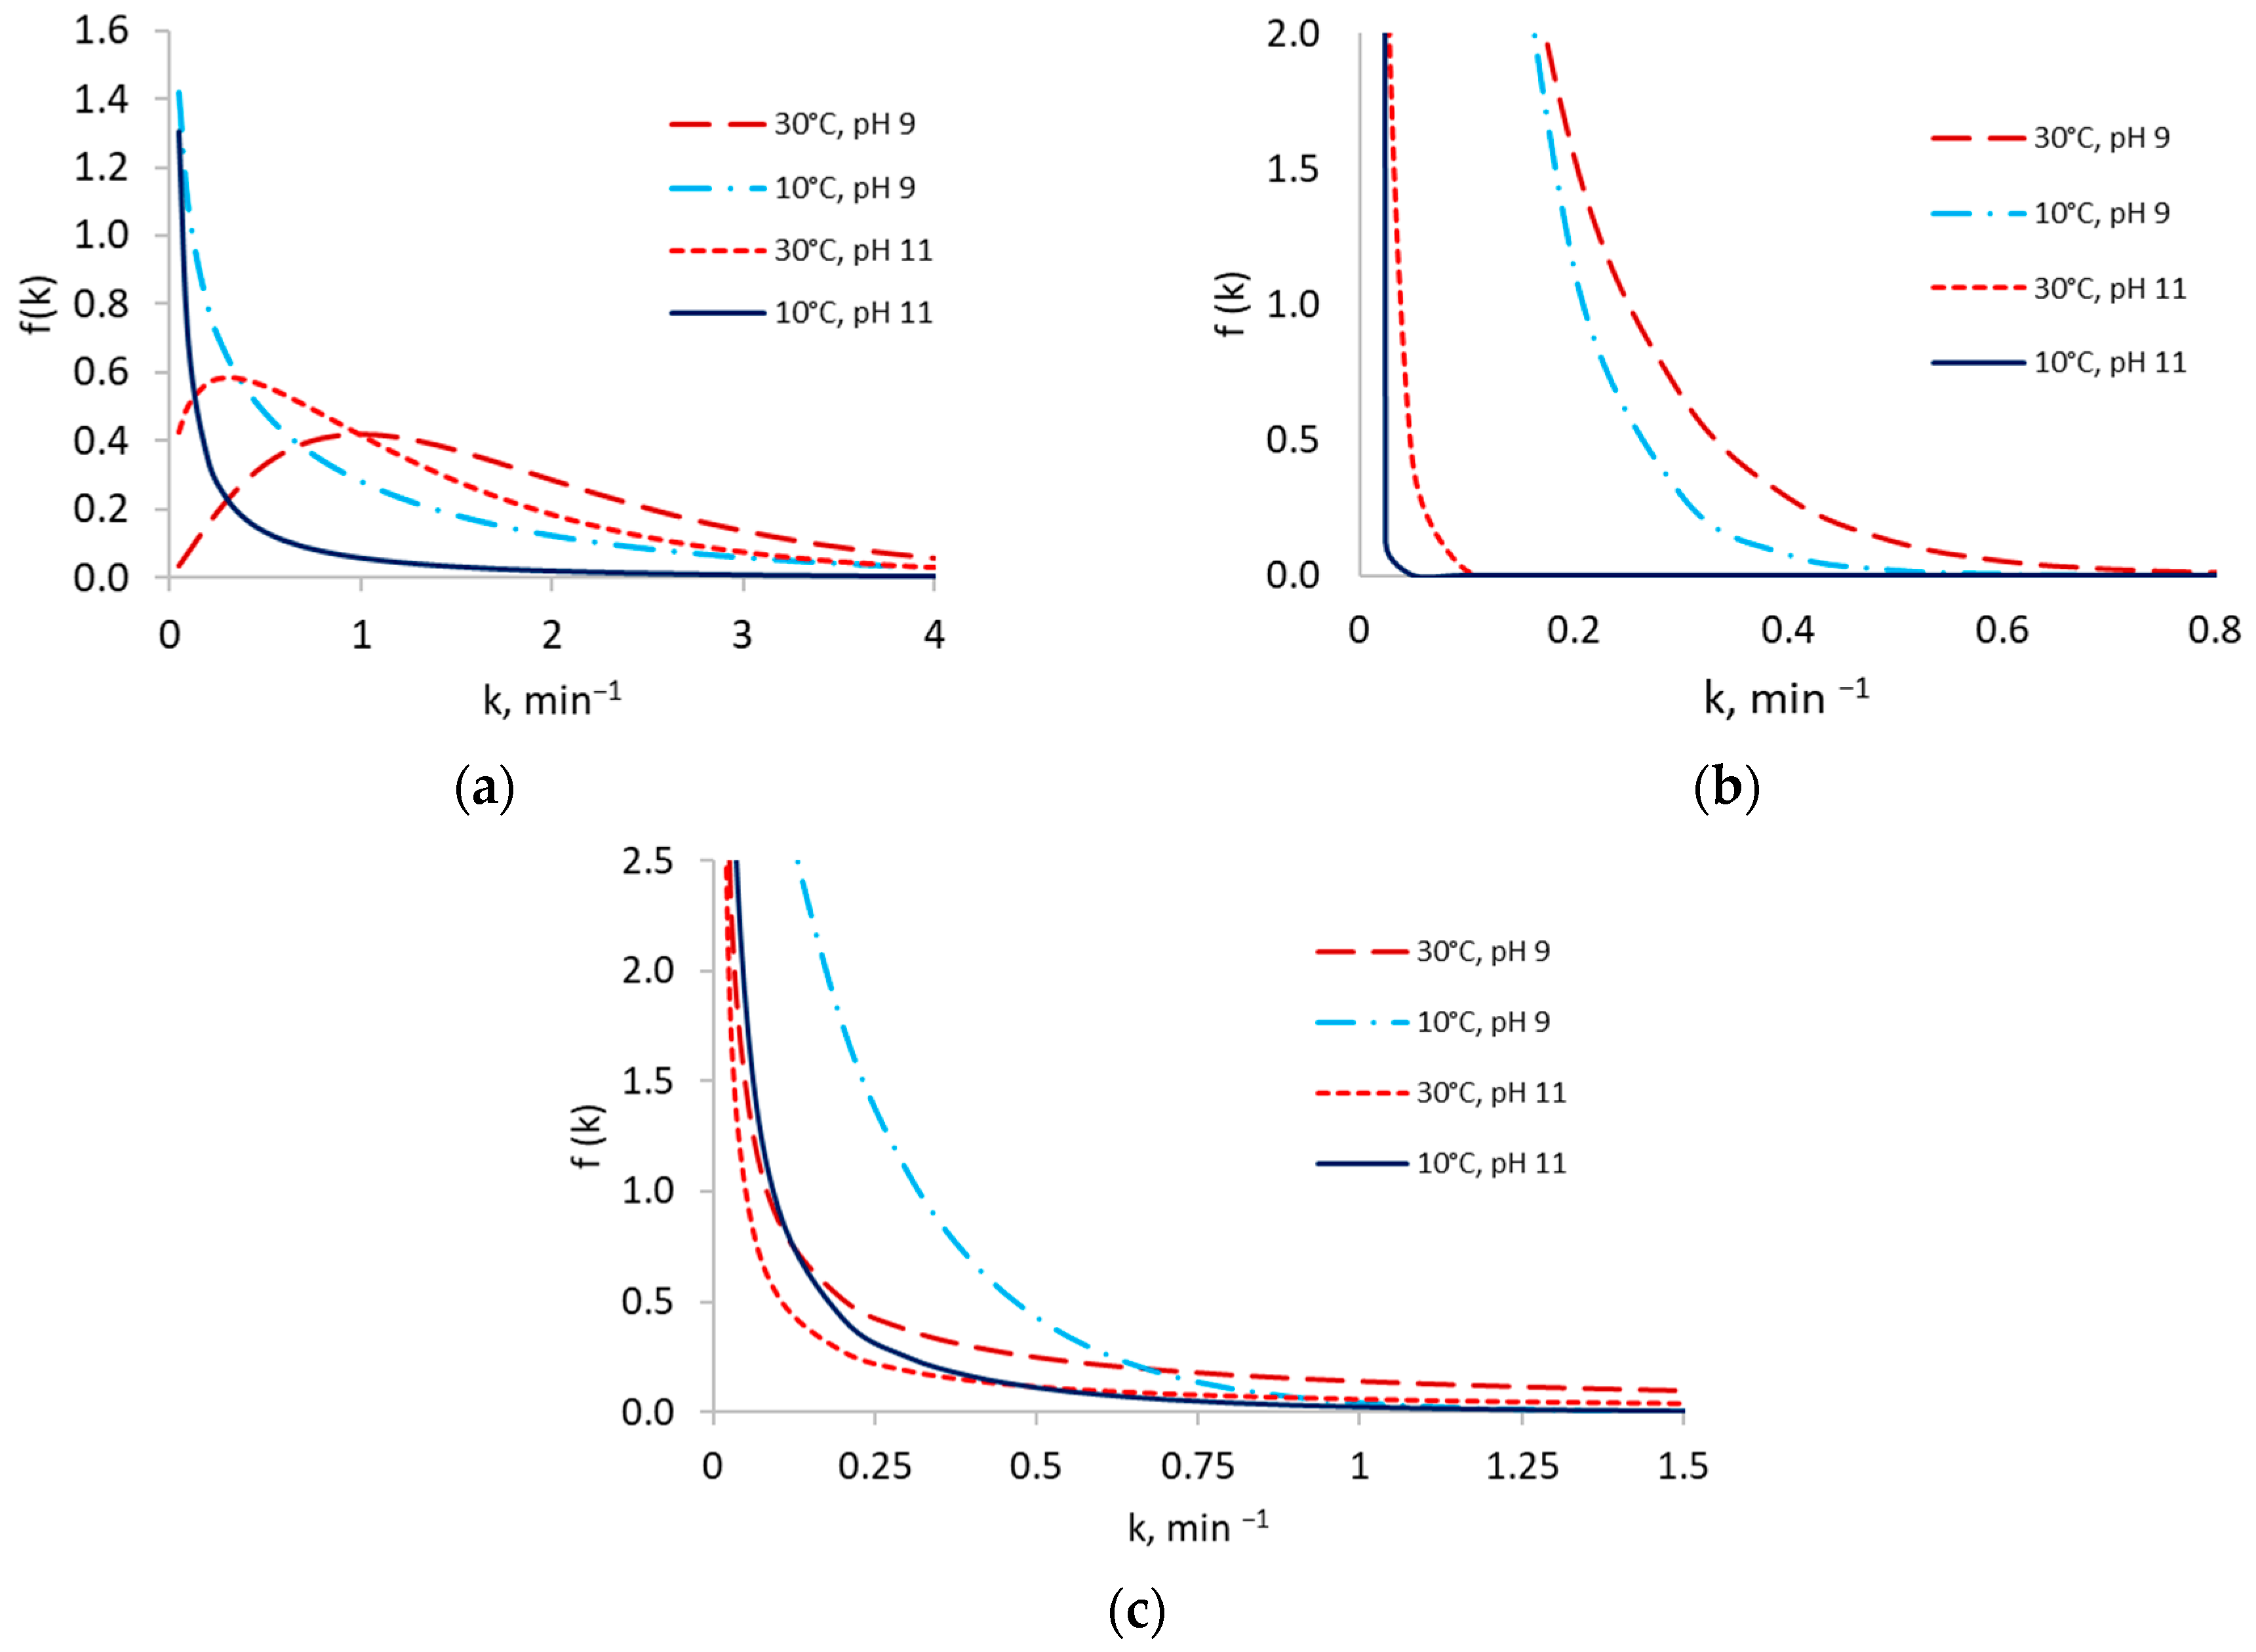
The froth stability mechanism was suggested by Nesset et al. to explain the observed variations in zinc concentrate grade at the Matagami plant (Canada). The proposed explanation was that smaller bubbles observed during flotation in winter decrease water drainage from the froth phase, leading to higher water recoveries and associated increased gangue entrainment [26].
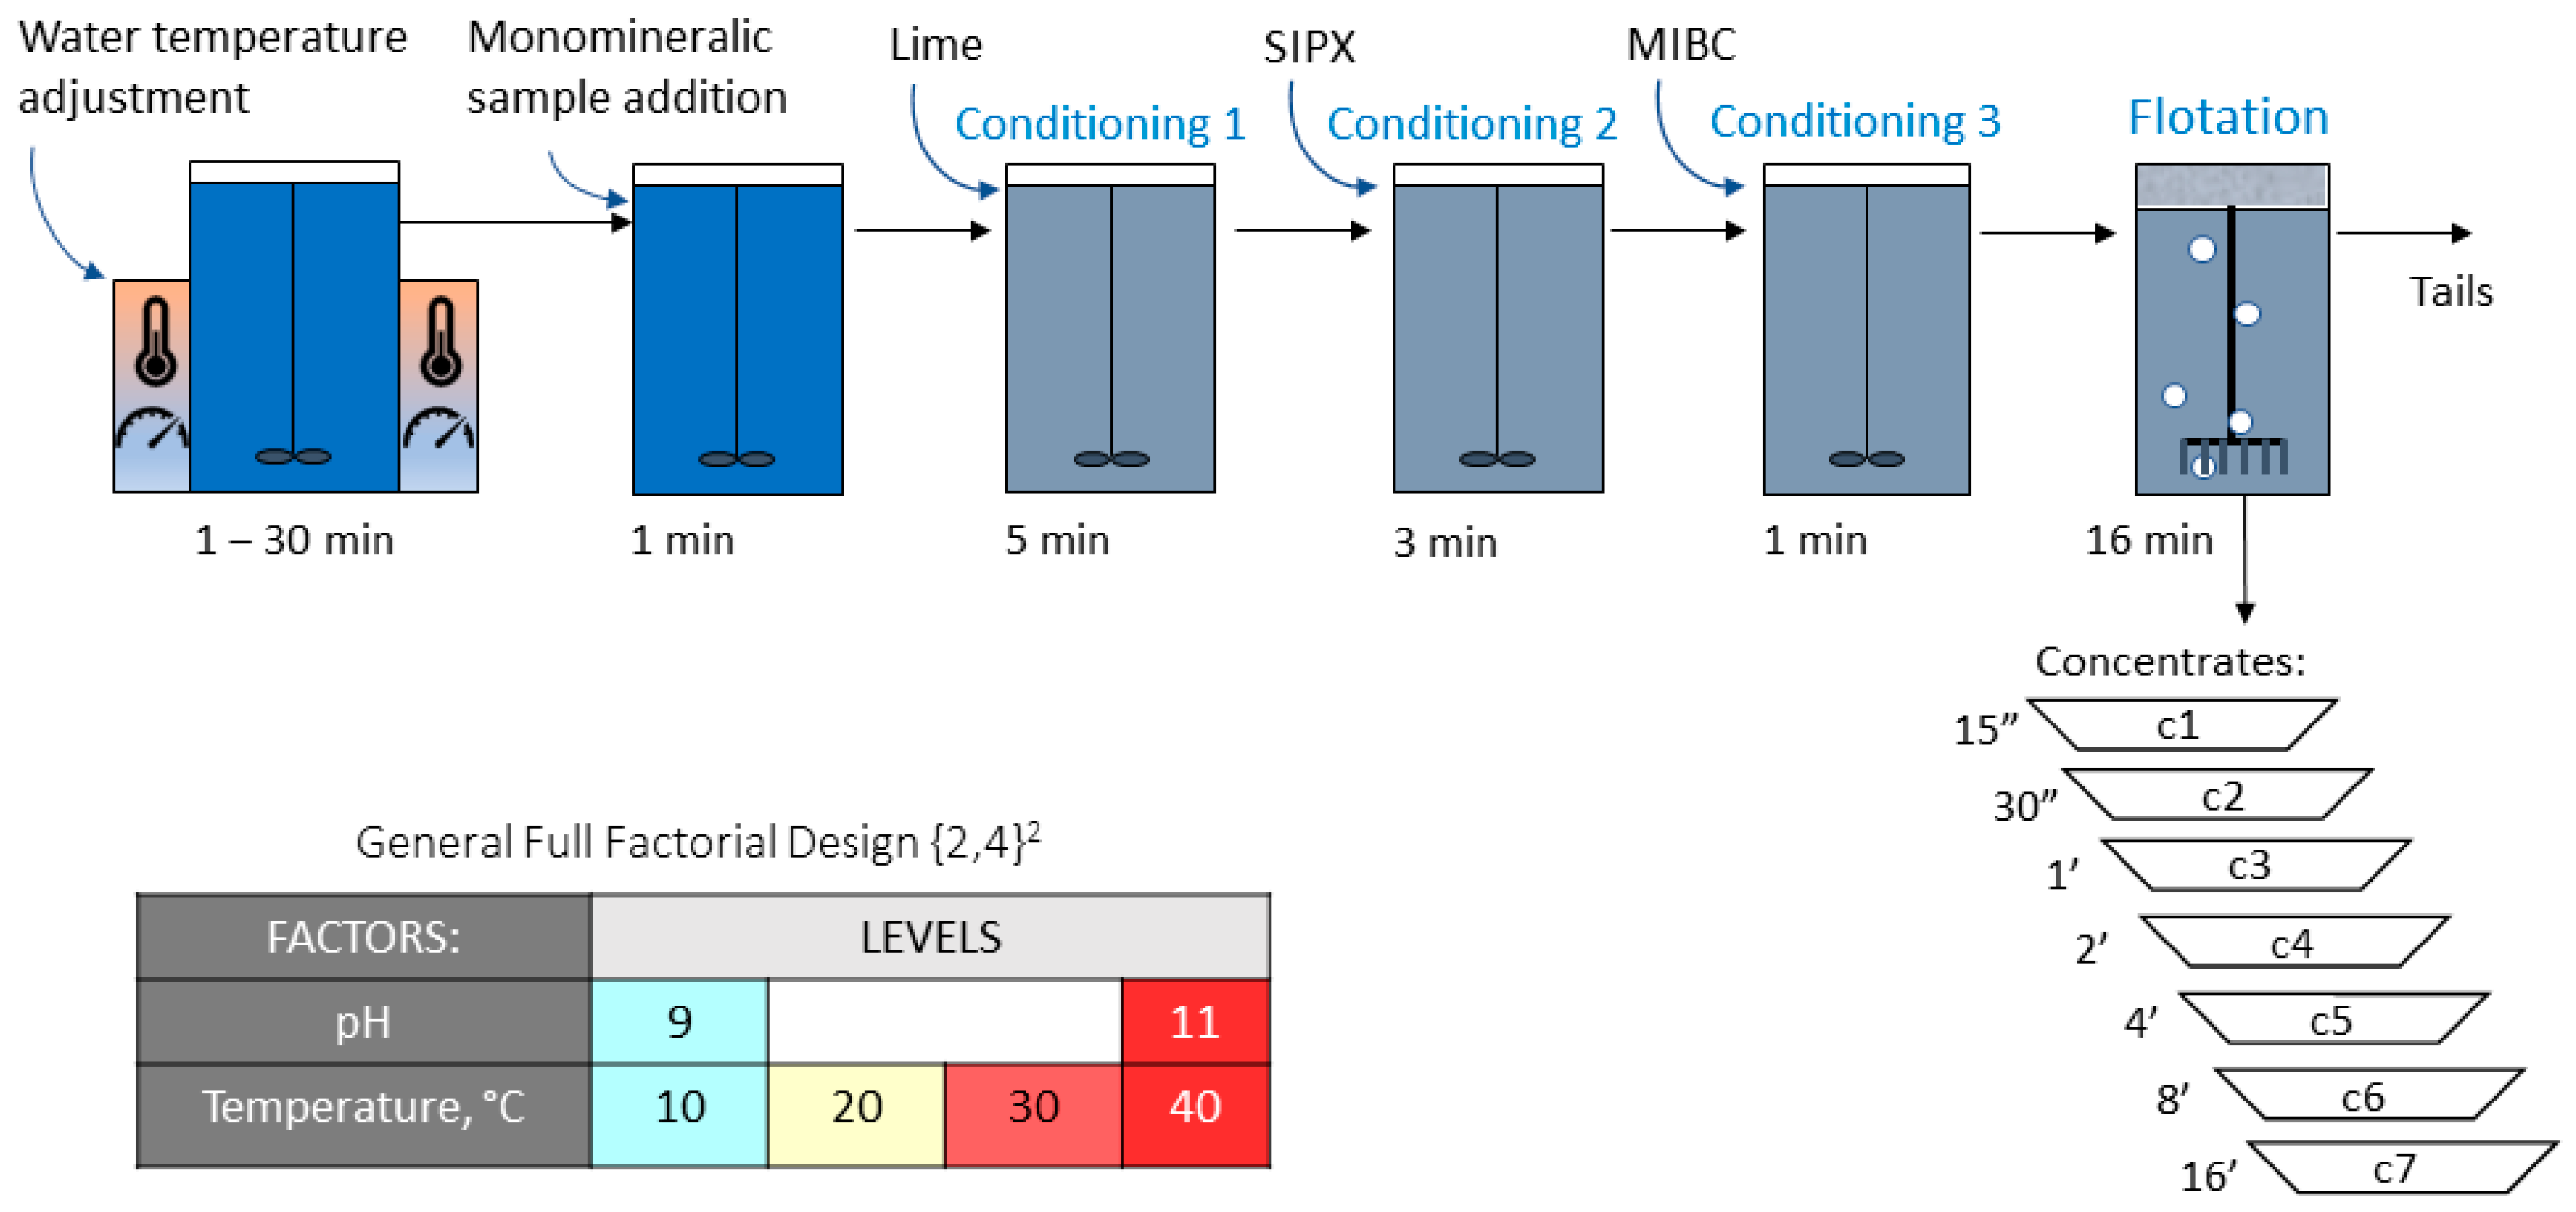
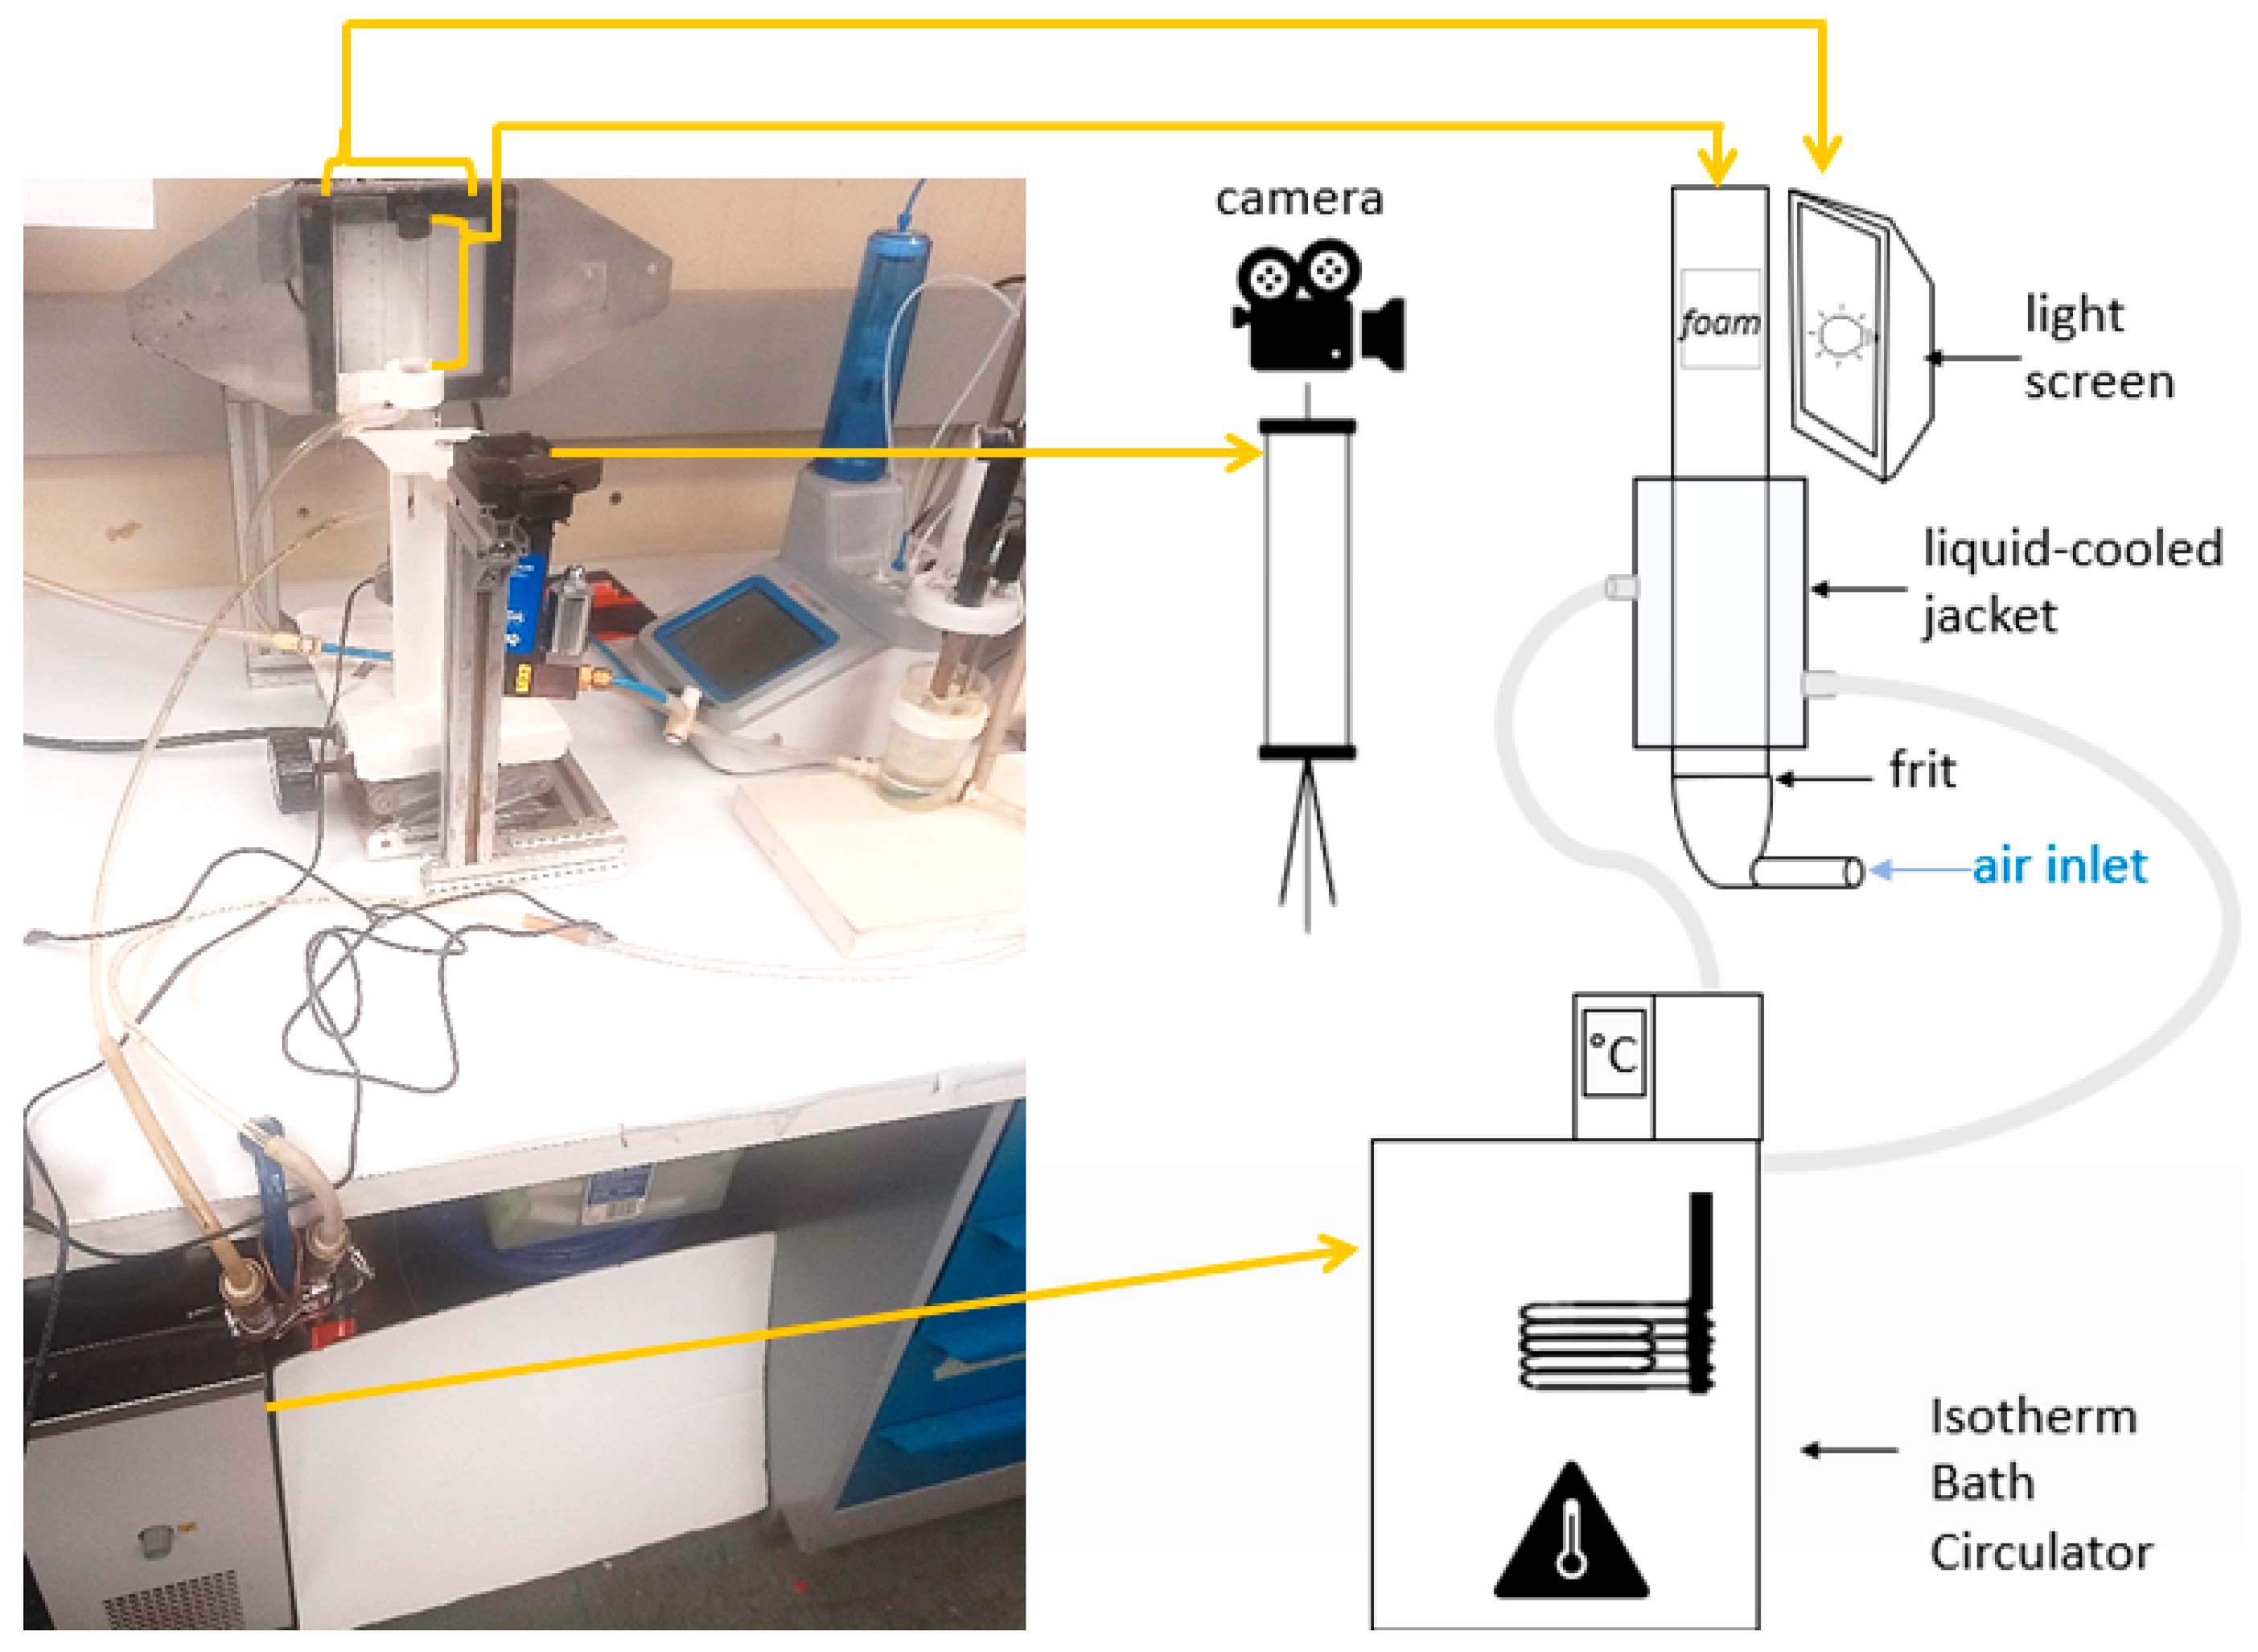
The aim of this research is to investigate the impact of temperature on Pb-Zn systems by performing flotation and foam stability tests with single mineral samples of pyrite, sphalerite, and galena. The test work will allow us to better understand the impacts of water recovery, foam height, and foam half-life time on the flotation responses, while simulating cleaner flotation conditions.

2. Materials and Methods

2.1. Sample Preparation

Galena (Morocco), sphalerite (Pierdes Verdes, Mexico), and pyrite (Huanzala, Peru) samples, all purchased from Ward’s Science (Rochester, NY, USA), were crushed, hand sorted, and dry milled. Galena and pyrite only required hand sorting, whereas the sphalerite was additionally purified using a Mozley table. The detailed sample preparation procedure is shown in Figure 1.
The produced samples were analyzed by Bruker D8 Discovery X-ray Diffractometer (XRD) (Co Kα source, λ = 1.79 Å) (Bruker AXS GmbH, Karlsruhe, Germany) and ATS Scientific Microtrac Sync Size and Shape Particle Analyzer (ATS Scientific Inc., Burlington, Canada). Rietveld refinement was carried out using Materials Analysis Using Diffraction (MAUD) Java program (version 2.992) [27]. The produced samples were more than 90% composed of one mineral phase, which permits them to be termed “monomineralic” [28].
Pyrite, based on the mineralogical composition of the deposit, XRD results, and mineral matching using “Match!” software (version 3.0), was identified to contain pyrite, hematite, Al-phase (corundum), and marcasite. Galena was found to contain some cerussite and fluorite, while sphalerite sample after pre-concentration still contained some galena, quartz, and calcite, as shown in Figure 2 and Table 1. Their particle size distributions, fitted to the Rosin–Rammler model, are provided in Figure 3.

2.2. Flotation Tests

For flotation tests, mechanical Denver D-1 lab flotation machine was used. A 1.3 L metal flotation cell was equipped with water cooling/heating jacket connected to the Fisher Scientific Isotherm® Bath Circulator (Fisher Scientific Inc., Pittsburgh, PA, USA), 3D-printed froth crowder (at the back of the cell with slots for electrodes), water float with water pump (for automatic level control), froth scrapers, and endoscope camera for froth surface filming, see Figure 4. Pulp aeration level was set to 4 L/m, corresponding to the superficial gas velocity of approximately 0.5 cm/s. To avoid excessive turbulence in the cell, agitation was set at 800 rpm. Additionally, an under-froth grid and current stabilizers were 3D-printed and installed. The under-froth grid aimed at weakening the turbulent flows in the cell by dissipating their energy and preventing distraction of froth in the upper zone of the flotation cell (reducing mechanical disruptions of a liquid film in the froth zone to be able to focus on temperature-originated discrepancies) [29]. The pulp density used in the tests was set at approximately 10 wt.% (100 g of sample per test with effective cell volume of 1 L).
Flotation tests were performed according to the general full factorial design with two repeats for each test. Since the most common Pb-Zn selective flotation method (Sheridan–Griswold method) sequentially recovers lead and zinc at alkali conditions [2], the monomineralic flotation tests for galena, sphalerite, and pyrite were performed at pH 9 and 11, which are commonly used pH levels in the industry [30]. Lime was used to adjust the pH, sodium isopropyl xanthate (SIPX) was used as the collector at a dosage of 90 g/t, while methyl isobutyl carbinol (MIBC) served as the frother at a concentration of 30 ppm (which is above the critical coalescence concentration [31,32]). The tested temperatures were 10, 20, 30, and 40 °C. The detailed monomineralic flotation workflow is shown in Figure 5.
Kinetic flotation tests were performed by collecting seven concentrates and fitting the flotation recovery to the gamma distribution model using the least squares approach (Equation (14)) [33,34]:
φ K = e K λ · K p 1 · λ p Γ ( p )
R ^ t = R 1 λ λ + t p
m i n i = 1 n R ^ t i R t i 2
where p is shape factor, λ is scale factor, φ K is probability density function of flotation rate constant distribution, K is flotation rate constant, Γ ( p ) is Euler’s gamma function, R ^ t is modeled recovery at time t , R t is experimental recovery value at time t , and R is infinite recovery.
The image analysis of the top froth bubbles was performed using Cellpose generalist algorithm for cellular segmentation. Cellpose is based on U-net neural network architecture already pre-trained on 70,000 objects [35]. Cellpose was fine-tuned by manually training the algorithm on 1000 bubbles captured by the camera on the froth surface. Such training is required for better recognition of regions of interest. Subsequently, the largest bubble size was plotted versus flotation time. A special model was developed to fit the bubble size data. As a basis of bubble size versus time model, two-parameter Weibull distribution was used, as shown in Equation (15) [36,37]:
F t = 1 e t η β
where η is characteristic life (scale factor), β is Weibull slope (shape parameter), and F t is failure distribution function. When β < 1, the function decreases with time, while when β > 1, the function increases. It has been reported that bubble size on the froth surface rapidly decreases at the beginning of flotation, reaches the “plateau” area, and starts to slightly increase by the end of the flotation process. To produce such a “Bathtub curve”, bi-modal distribution function (beta distribution [38]) was added into Equation (15) to allow β variation with time. Since beta distribution has U-shape only at shape and scale parameters below 1, and Weibull shape parameter needs to be below and above 1 to produce Bathtub curve, a coefficient of 2 was added to the equation before beta distribution term; in addition, an intercept term was added at the beginning of the equation to fit the smallest bubbles in the “plateau” area of the curve. The derived model for the description of top froth bubble size dynamics is provided in Equation (16):
D b m a x t = D b ( e q ) m a x + 1 e t 2 · B a , b , t η
where D b m a x t is the diameter of the top bubble on the froth surface, D b ( e q ) m a x is an “equilibrium” top bubble size in the plateau area of the “Bathtub” curve, B a , b , t is beta distribution of Weibull shape parameter, and a and b are beta distribution shape parameters.

2.3. Foam Stability Tests

Foam stability measurements were performed in a small glass column (2 cm diameter and 20 cm height) equipped with water cooling/heating jacket connected to the Isotherm bath circulator (Figure 6). The gas bubbles were produced with ceramic frit at the bottom of the column. The camera (Canon VIXIA HF R800, Canon Canada Inc., Montreal, Canada) was continuously filming the foam to extract the equilibrium foam height. Central composite design (CCD) with five factors and five levels was implemented for the experimental work. The experimental protocol consisted of water temperature adjustment, chemical conditioning, foam height testing by air injection, and foam half-life time measurements by cutting the air supply at the end of the test (recording foam height versus time). Chemical conditioning included water pH regulation with lime, dosing collector (SIPX), and frother (MIBC) at desired levels. The tested levels for indicated factors are provided in Table 2.
Relationships between input variables and responses were established through second-order polynomial with 2-way interaction terms [39]:
y k = b 0 + i = 1 n b i x i + i = 1 n b i i x i 2 + i = 1 n 1 j = 2 n b i j x i x j + ε
where y is the k t h response, b 0 is an intercept, b i is the equation linear term coefficient, b i i is the equation cubic term coefficient, b i j is the cross-product coefficient, x i and x j are the variables, n is the number of variables (5, in our case), and ε is a residual (error). The analysis of the data was performed by using the statistical software package ‘‘Minitab® Statistical Software’’ (version 21.2). The confidence interval used for analysis of statistical importance was 95%.
The video from the camera was split frame by frame and analyzed using ImageJ (version 1.53t). The processing part included contrast/brightness adjustment, 8-bit conversion of the images, setting thresholds (Otsu threshold), filling the holes, erosion, dilation, noise cleaning by setting size threshold, and size analysis of the obtained 2-bit images with foam. Foam heights were plotted against time and the equilibrium foam height was modeled by an adapted exponential Nesset et al. equation [40]:
F h t = F h ( e q ) + m · e d t
where F h t is foam height at time t (mm), F h ( e q ) is equilibrium foam height (mm), m is foam height reduction after reaching a peak at the beginning of the test (difference between F h t and F h ( e q ) in mm), and d is the foam height decay constant.

2.4. Analysis of Foam Stability in Relation to Flotation Response

To investigate the covariances between foam stability parameters, flotation responses, temperature, and pH, principal component analysis (PCA) was used as a data transformation tool, allowing data dimensionality to be reduced and allowing for the visualization of intercorrelations in the data. This data transformation permits us to describe the same amount of variability contained in the original variables but with fewer uncorrelated dimensions (principal components) [41]. The covariance matrix was constructed by calculating covariance for each pair of variable/response vectors, as per Equation (19):
c o v X , Y = 1 N i = 1 n X i μ X · ( Y i μ Y )
where X and Y is a pair of variable/response vectors compared, N is a number of points, μ X and μ Y are the mean values, and X i and Y i are individual points in the respective vectors. As the next step, to perform the transformation of the covariance matrix A that contains covariations of the initial variables and responses, eigenvalues describing variance of principal components were found by solving Equation (20):
det A λ i I = 0
where λ i are eigenvalues (scalar) and I is the identity matrix. As the third step, corresponding eigenvectors to each λ i were found by solving Equation (21):
A · v i = λ i v i
where v i are eigenvectors. After normalizing eigenvectors by dividing each component by a vector length, a matrix of eigenvectors ( V ) was used to calculate a matrix of scores, as shown in Equation (22):
Z = M · V
where Z is a matrix with scores and M is a matrix with standardized original data [41,42].

3. Results

3.1. Flotation Tests

As can be seen from Table 3, the yield of galena ( γ g ), pyrite ( γ p ), and sphalerite ( γ s ) and the corresponding water recoveries ( γ g w , γ p w , and γ s w ) behave in a similar way, indicating a certain level of correlation between these parameters.
For all tested minerals, it was observed that the concentrates’ yields increase with decreased temperature. The largest observed yield variation in relative terms could be noted for pyrite flotation while, in absolute values, galena was impacted more than pyrite and sphalerite (Figure 7). Conversely, based on the distributions of flotation rate constants for galena and pyrite, there is a distinct shift of the f(k) curves towards lower values at lower temperature. Thus, at cold pulps, higher yields at a lower flotation speed may be expected for these two minerals. Regarding sphalerite, the shift in the flotation rate distribution with temperature was less evident.
Change in the flotation pH, similarly to temperature variations, led to shifts in flotation rate distributions. For all tested minerals, the flotation rate was higher at pH 9 than at pH 11, as seen in Figure 8.
Regarding the top size of bubbles on the froth surface, generally, there were larger bubbles in cold pulps for all tested minerals (Figure 9). Additionally, it was reported that bubble sizes increase with flotation time. The projection area of the largest bubbles on the froth surface for the tests with all three minerals vary approximately between 0.1 and 0.4 cm2. At a temperature of 30 °C, the shapes of bubble size models represent a “bathtub” curve: rapid decrease of bubble size at the beginning of the process, reaching plateau area, and a slight increase in bubble sizes by the end of flotation test. For pulps at 10 °C for pyrite and sphalerite, the shapes of the models are different: there were no extremely large bubbles at the beginning of the flotation, as well as no extensive plateau area. The bubbles for these two minerals continuously increase during the flotation process.

3.1.1. Galena

Results of galena flotation served as a basis for the constructed MiniTab model, the adequacy of which may be confirmed by high F -values and low p -values: F -value   F c r i t i c a l (the critical value for the model in question is 3.5), whereas p -values are significantly below the considered α of 0.05 (Table 4).
High R 2 and R a d j 2 values, and relatively low standard deviation indicate good fit of the models [43].
Equations (23) and (24) demonstrate regressions fitting mineral and water yields, respectively, in galena sample flotation:
y m i n G n = 36.844   + 16.881 · b p H 9 16.881 · b p H 11 + 22.431 · b T 10 + 9.031 · b T 20 12.744 · b T 30 18.719 · b T 40 + 13.544 ·   b p H 9 T 10 + 3.844 · b p H 9 T 20 7.581 · b p H 9 T 30 9.806 · b p H 9 T 40 13.544 · b p H 11 T 10 3.844 ·   b p H 11 T 20 + 7.581 · b p H 11 T 30 + 9.806 · b p H 11 T 40
y w G n = 21.394   + 1.731 · b p H 9 1.731 · b p H 11 + 20.981 · b T 10 + 1.006 ·   b T 20 7.869 · b T 30 14.119 · b T 40 + 3.094 ·   b p H 9 T 10 0.231 · b p H 9 T 20 1.606 · b p H 9 T 30 1.256 · b p H 9 T 40 3.094 · b p H 11 T 10 + 0.231 ·   b p H 11 T 20 + 1.606 · b p H 11 T 30 + 1.256 · b p H 11 T 40
where b is a binary equation coefficient ( b ϵ 0 , 1 ).
As can be seen from Equations (23) and (24), the coefficients in front of p H 11 , and T 30 and T 40 terms are negative, suggesting that increased pH and temperature have a negative impact on mineral and water yields. These trends could also be seen from the main effects and interaction plots (Figure 10).
By consulting the Pareto chart for standardized effects with respect to water and mineral yields, as well as water versus mineral yield plot (Figure 11), it could be concluded that pH is the most important parameter for mineral recovery, while temperature is the most significant factor for water recovery.

3.1.2. Pyrite

Similar to galena flotation results, a model for pyrite flotation is significant, with p -values approaching 0 and F -values considerably greater than F -critical (Table 5).
Good regression model performance was confirmed as all R 2 values were above 0.8 [44]. The standard deviations are also in the acceptable range, considering the objectives of the test work.
From the equations of pyrite and water yields (Equations (25) and (26)), it could be concluded that the mineral yield increases at low pH and temperature, whereas the water recovery generally increases at higher pH and lower temperature, which is also confirmed in Figure 12:
y m i n P y = 10.538 + 0.138 · b p H 9 0.138 · b p H 11 + 12.463 · b T 10 + 0.913 · b T 20 5.863 · b T 30 7.513 · b T 40 + 2.813 · b p H 9 T 10 0.537 · b p H 9 T 20 1.213 · b p H 9 T 30 1.062 · b p H 9 T 40 2.813 · b p H 11 T 10 + 0.537 · b p H 11 T 20 + 1.213 · b p H 11 T 30 + 1.062 · b p H 11 T 40
y w P y = 25.444 1.781 · b p H 9 + 1.781 · b p H 11 + 16.660 · b T 10 + 8.830 · b T 20 7.620 · b T 30 17.870 · b T 40 + 1.230 · b p H 9 T 10 2.340 · b p H 9 T 20 0.790 · b p H 9 T 30 + 1.910 · b p H 9 T 40 1.230 · b p H 11 T 10 + 2.340 · b p H 11 T 20 + 0.790 · b p H 11 T 30 1.910 · b p H 11 T 40
From the Pareto chart (Figure 13a), it can be seen that for pyrite and water recoveries, the most important factor is temperature. For pyrite yield, the second most important factor is the interaction between temperature and pH. For water recovery, the second most important term is pH (Figure 13a). There is a relatively small impact of pH on water recovery as well as an insignificant pH effect on mineral recovery for the pyritic pulp system, which can be seen on the plot with mineral yields versus water recovery. In contrast to galena flotation, for pyrite tests it is more difficult to distinguish pH lines on the scatterplot (Figure 13b).

3.1.3. Sphalerite

Sphalerite models also passed statistical significance and goodness of fit evaluation, demonstrating high R 2 values, F -values above critical, and p -values below the set threshold (Table 6).
The regression models obtained for sphalerite yield (Equation (27)) followed a trend like those of the regression equations for pyrite and galena: higher yields at lower pH and temperatures. Water recovery (Equation (28)) in sphalerite flotation, like for galena, followed a trend like that of mineral recovery, in terms of temperature effects (Figure 14):
y m i n S p h = 30.294 + 13.844 · b p H 9 13.844 · b p H 11 + 20.956 · b T 10 + 6.731 · b T 20 4.294 · b T 30 23.394 · b T 40 + 12.206 · b p H 9 T 10 + 1.981 · b p H 9 T 20 2.744 · b p H 9 T 30 11.444 · b p H 9 T 40 12.206 · b p H 11 T 10 1.981 · b p H 11 T 20 + 2.744 · b p H 11 T 30 + 11.444 · b p H 11 T 40
y w S p h = 25.944 + 0.531 · b p H 9 0.531 · b p H 11 + 19.681 · b T 10 + 1.831 · b T 20 5.944 · b T 30 15.569 · b T 40 1.906 · b p H 9 T 10 + 1.694 · b p H 9 T 20 + 0.319 · b p H 9 T 30 0.106 · b p H 9 T 40 + 1.906 · b p H 11 T 10 1.694 · b p H 11 T 20 0.319 · b p H 11 T 30 + 0.106 · b p H 11 T 40
For sphalerite flotation, the most important factor, based on the absolute t-values provided on the Pareto chart, was pH. The contribution of temperature was also significant, but slightly less than pH (Figure 15a). The mineral yield–water recovery plot looks similar to that of galena: the lower the temperature, the larger deviation of mineral yields at different pH (as observed from Figure 15b).

3.2. Foam Stability Tests

The results of 32 foam stability tests are provided in Table 7.
Response surface regression results and goodness of fit are summarized in Table 8. The F -values observed for both models (responses) were above the F -critical value of 2.65 and, thus, meaning that under the considered confidence level of 95%, the model fits the data better than a model without independent variables (intercept-only model).As can be seen from the p -values calculated from the F -values, the models produced were statistically significant under the assumption of a confidence interval of 95% (alpha = 0.05). Assuming the null hypothesis is true and parameters of the models produced have no effect on responses, there is only a 4.8% chance of achieving same level of variation in foam half-life time, and a less than 0.001% chance of achieving the observed variations in foam heights, which are both below the set alpha value. Therefore, there is sufficient statistical evidence for the models being considered statistically significant.
The regression equations produced for foam half-life time and foam height in coded units are presented in Equations (29) and (30), with statistically significant equation parameters provided in bold:
y ( t ½ ) = 1.546 0.5768 x 1 + 0.01 x 2 + 0.1166 x 3 0.0163 x 4 + 0.1414 x 5 + 0.1554 x 1 2 + 0.0316 x 2 2 + 0.1329 x 3 2 + 0.0579 x 4 2 0.1214 x 5 2 + 0.131 x 1 x 2 + 0.134 x 1 x 3 0.106 x 1 x 4 0.06 x 1 x 5 + 0.044 x 2 x 3 0.031 x 2 x 4 + 0.001 x 2 x 5 0.059 x 3 x 4 + 0.027 x 3 x 5 + 0.077 x 4 x 5
y H f = 11.96 4.429 x 1 + 1.096 x 2 + 0.621 x 3 + 0.138 x 4 + 7.463 x 5 + 1.902 x 1 2 + 0.602 x 2 2 + 0.327 x 3 2 + 0.34 x 4 2 + 1.477 x 5 2 + 0.281 x 1 x 2 0.856 x 1 x 3 0.044 x 1 x 4 3.969 x 1 x 5 + 0.031 x 2 x 3 0.381 x 2 x 4 + 1.044 x 2 x 5 + 0.481 x 3 x 4 0.144 x 3 x 5 0.331 x 4 x 5
Factor-by-factor investigations using the t-test revealed important parameters of the model; the results are displayed in Figure 16a. The level of aeration (Jg), water temperature (T), pH, and MIBC dosage had a pronounced effect on foam stability, while SIPX dosage’s t-value is below 2.2 (tcritical). An increase in Jg, pH, and MIBC dosage had a positive effect on foam height, whereas temperature increase had a clear negative effect. Important two-way interaction terms of the model are temperature × aeration, temperature × temperature, aeration × aeration, pH × aeration, temperature × MIBC dosage, and pH × pH. As for the foam half-life time, only one parameter was found to be statistically significant: temperature. Similar to the foam height case, temperature had a negative impact on the foam half-life time (as seen in Figure 16b).
From the contour plots (Figure 17), Jg appears to have an impact on the foam half-life time at lower temperatures (at higher Jg, foam half-life was longer). However, this effect disappears as soon as temperature increases above 15 °C. Conversely, pH appears to have more pronounced effect at extreme temperatures: at higher temperatures, pH increase stabilizes foam, which is reflected by longer foam half-life. Regarding MIBC dosage, a clear effect could be observed at higher temperatures (above 25 °C).
From the foam height contour plots (Figure 18b) it can be observed that pH has a similar impact on foam depth as foam half-life in pH-temperature coordinates: pH effect is pronounced at elevated temperatures. However, the contour plot of foam height in MIBC–temperature coordinates (Figure 18c) shows that MIBC does not significantly affect foam height when the temperature is above 25 °C. Aeration–temperature pairing influences foam height in a different way (as seen in Figure 18a): temperature has a limited influence on the foamability at low Jg. The effect starts to be more pronounced only when Jg reaches 0.5 cm/s. Above this value, both factors have an approximately similar impact on foam height, as suggested by the 45° contour line.

3.3. Relationship between Foam Stability and Flotation Performance

As it derives from the loading plots (Figure 19), the performed PCA allowed more than 85% of the total variability to be captured for all datasets by two principal components. There is a common correlation pattern between temperature and foam stability parameters (negative correlation with foam height and foam half-life) expressed by vectors facing in the opposite directions. Flotation kinetics parameters (scale and shape of gamma model) for all three minerals also exhibit negative correlation, but with pH. The positions of water recovery vectors are close to the vectors explaining foam stability, indicating high correlation. Regarding mineral yields, pyrite recovery is in good correlation with foam stability parameters, while sphalerite recovery is closely related to flotation kinetics parameter.

4. Discussion

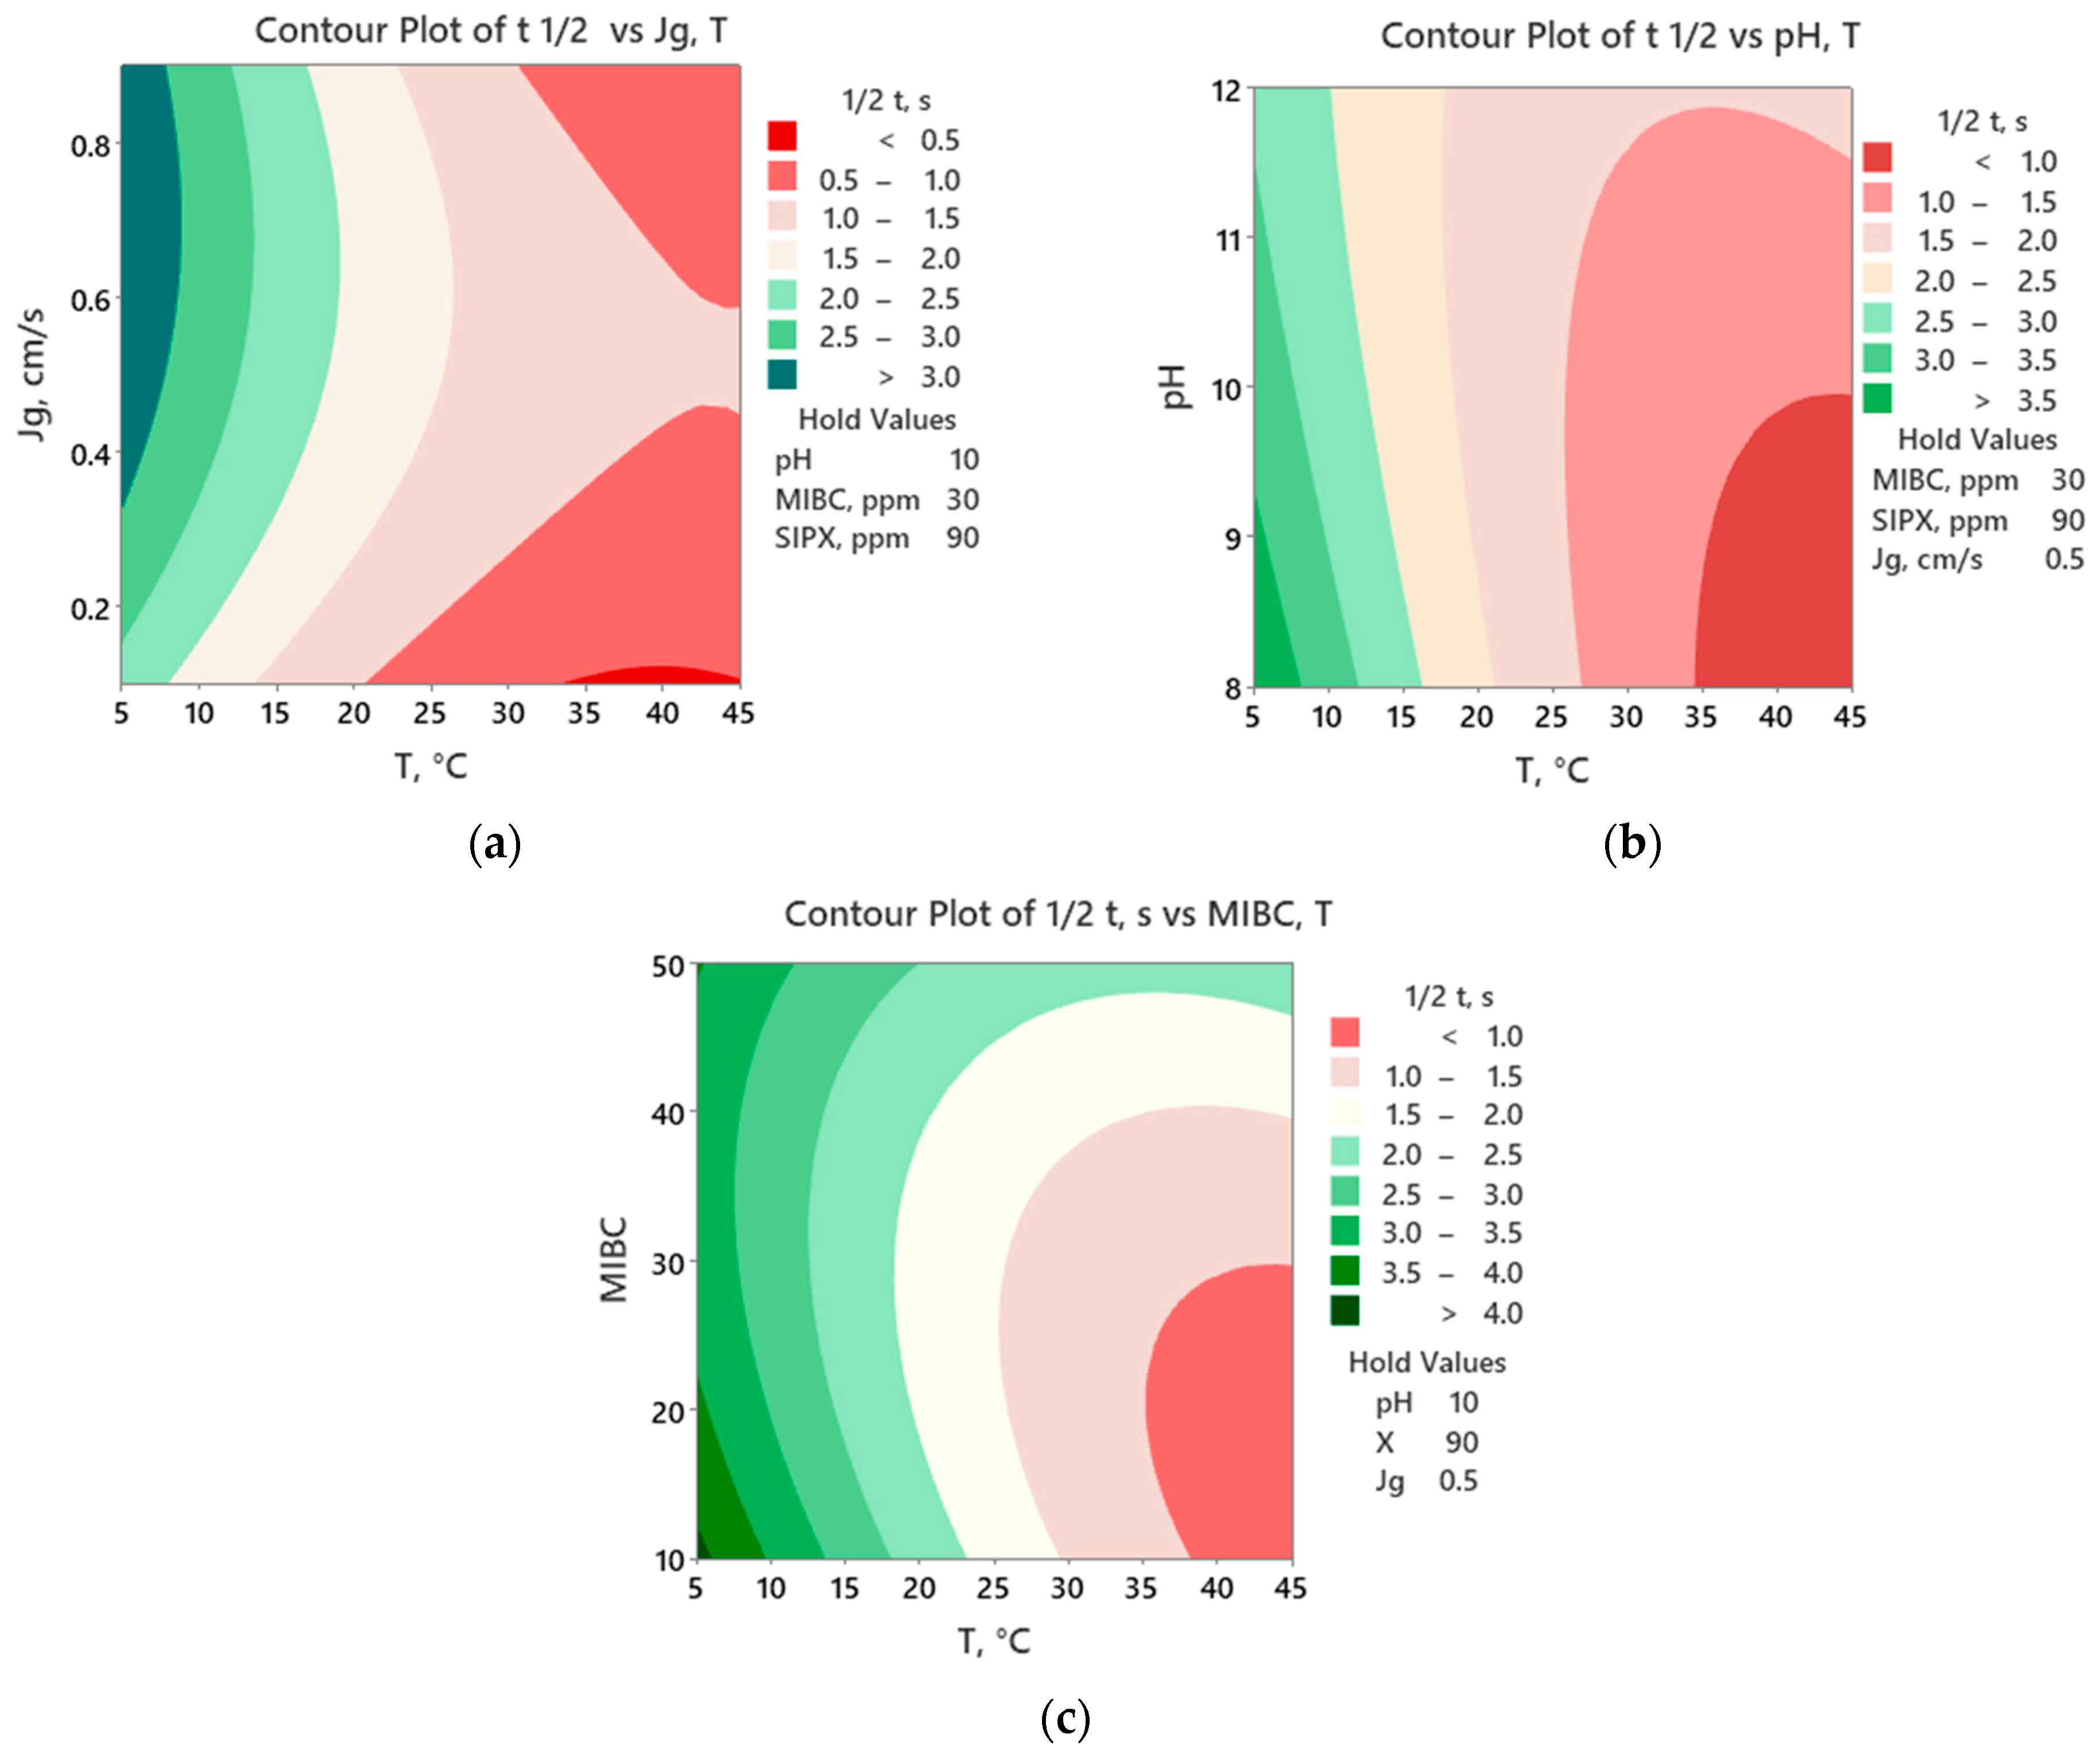
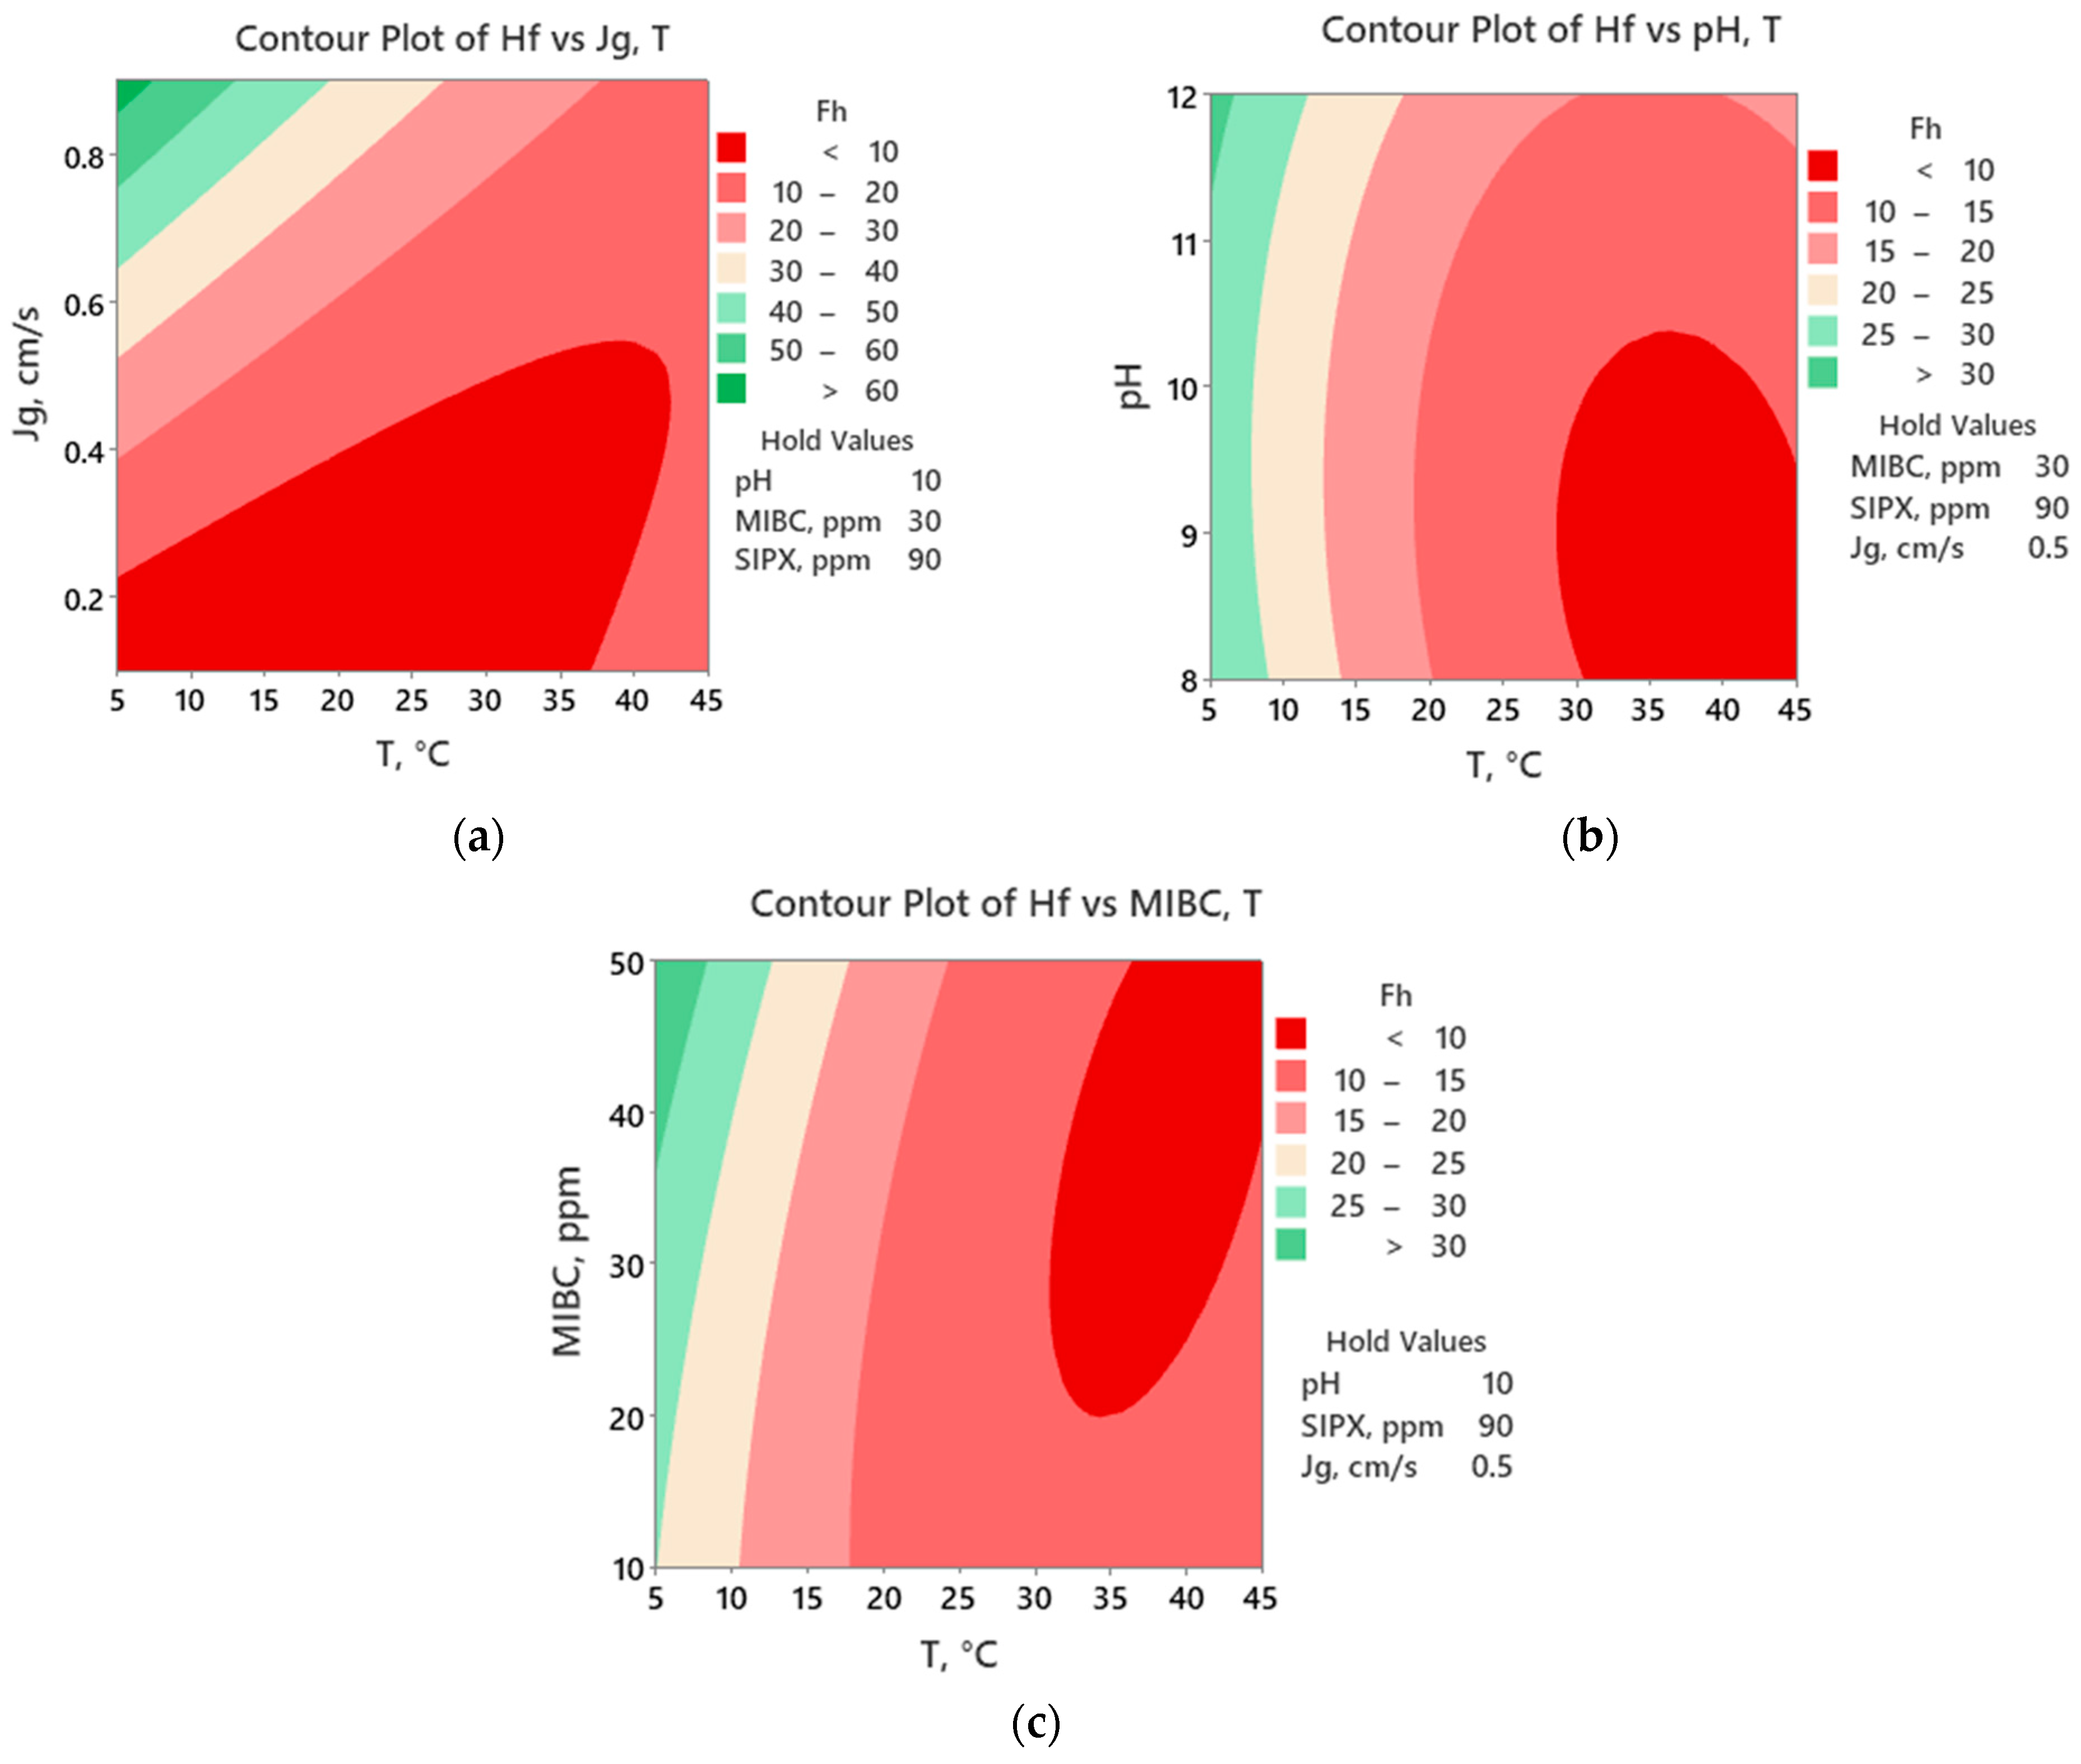
Aeration is the most important factor for foam height. As the gas flow rate increases, thicker foams are produced due to more bubbles accumulating [45], which increases the volume and froth coefficient (a product of froth volume and froth stability in seconds).
Frother dosage is another important parameter for foam stability, proven by the foam height results presented. MIBC adsorption at the air/water interface increases electrostatic repulsion between bubbles, which retards the thinning of the liquid film. From the perspective of disjoining pressure, such electrostatic repulsion creates positive pressure, which stabilizes the foam [46].
The aeration–pH interaction pair could be explained by aeration bubbles coming in full contact with water and helping dissolved CO2 escape from the solution (outgassing). A subsequent drop in carbonates concentration provokes pH increase [47].
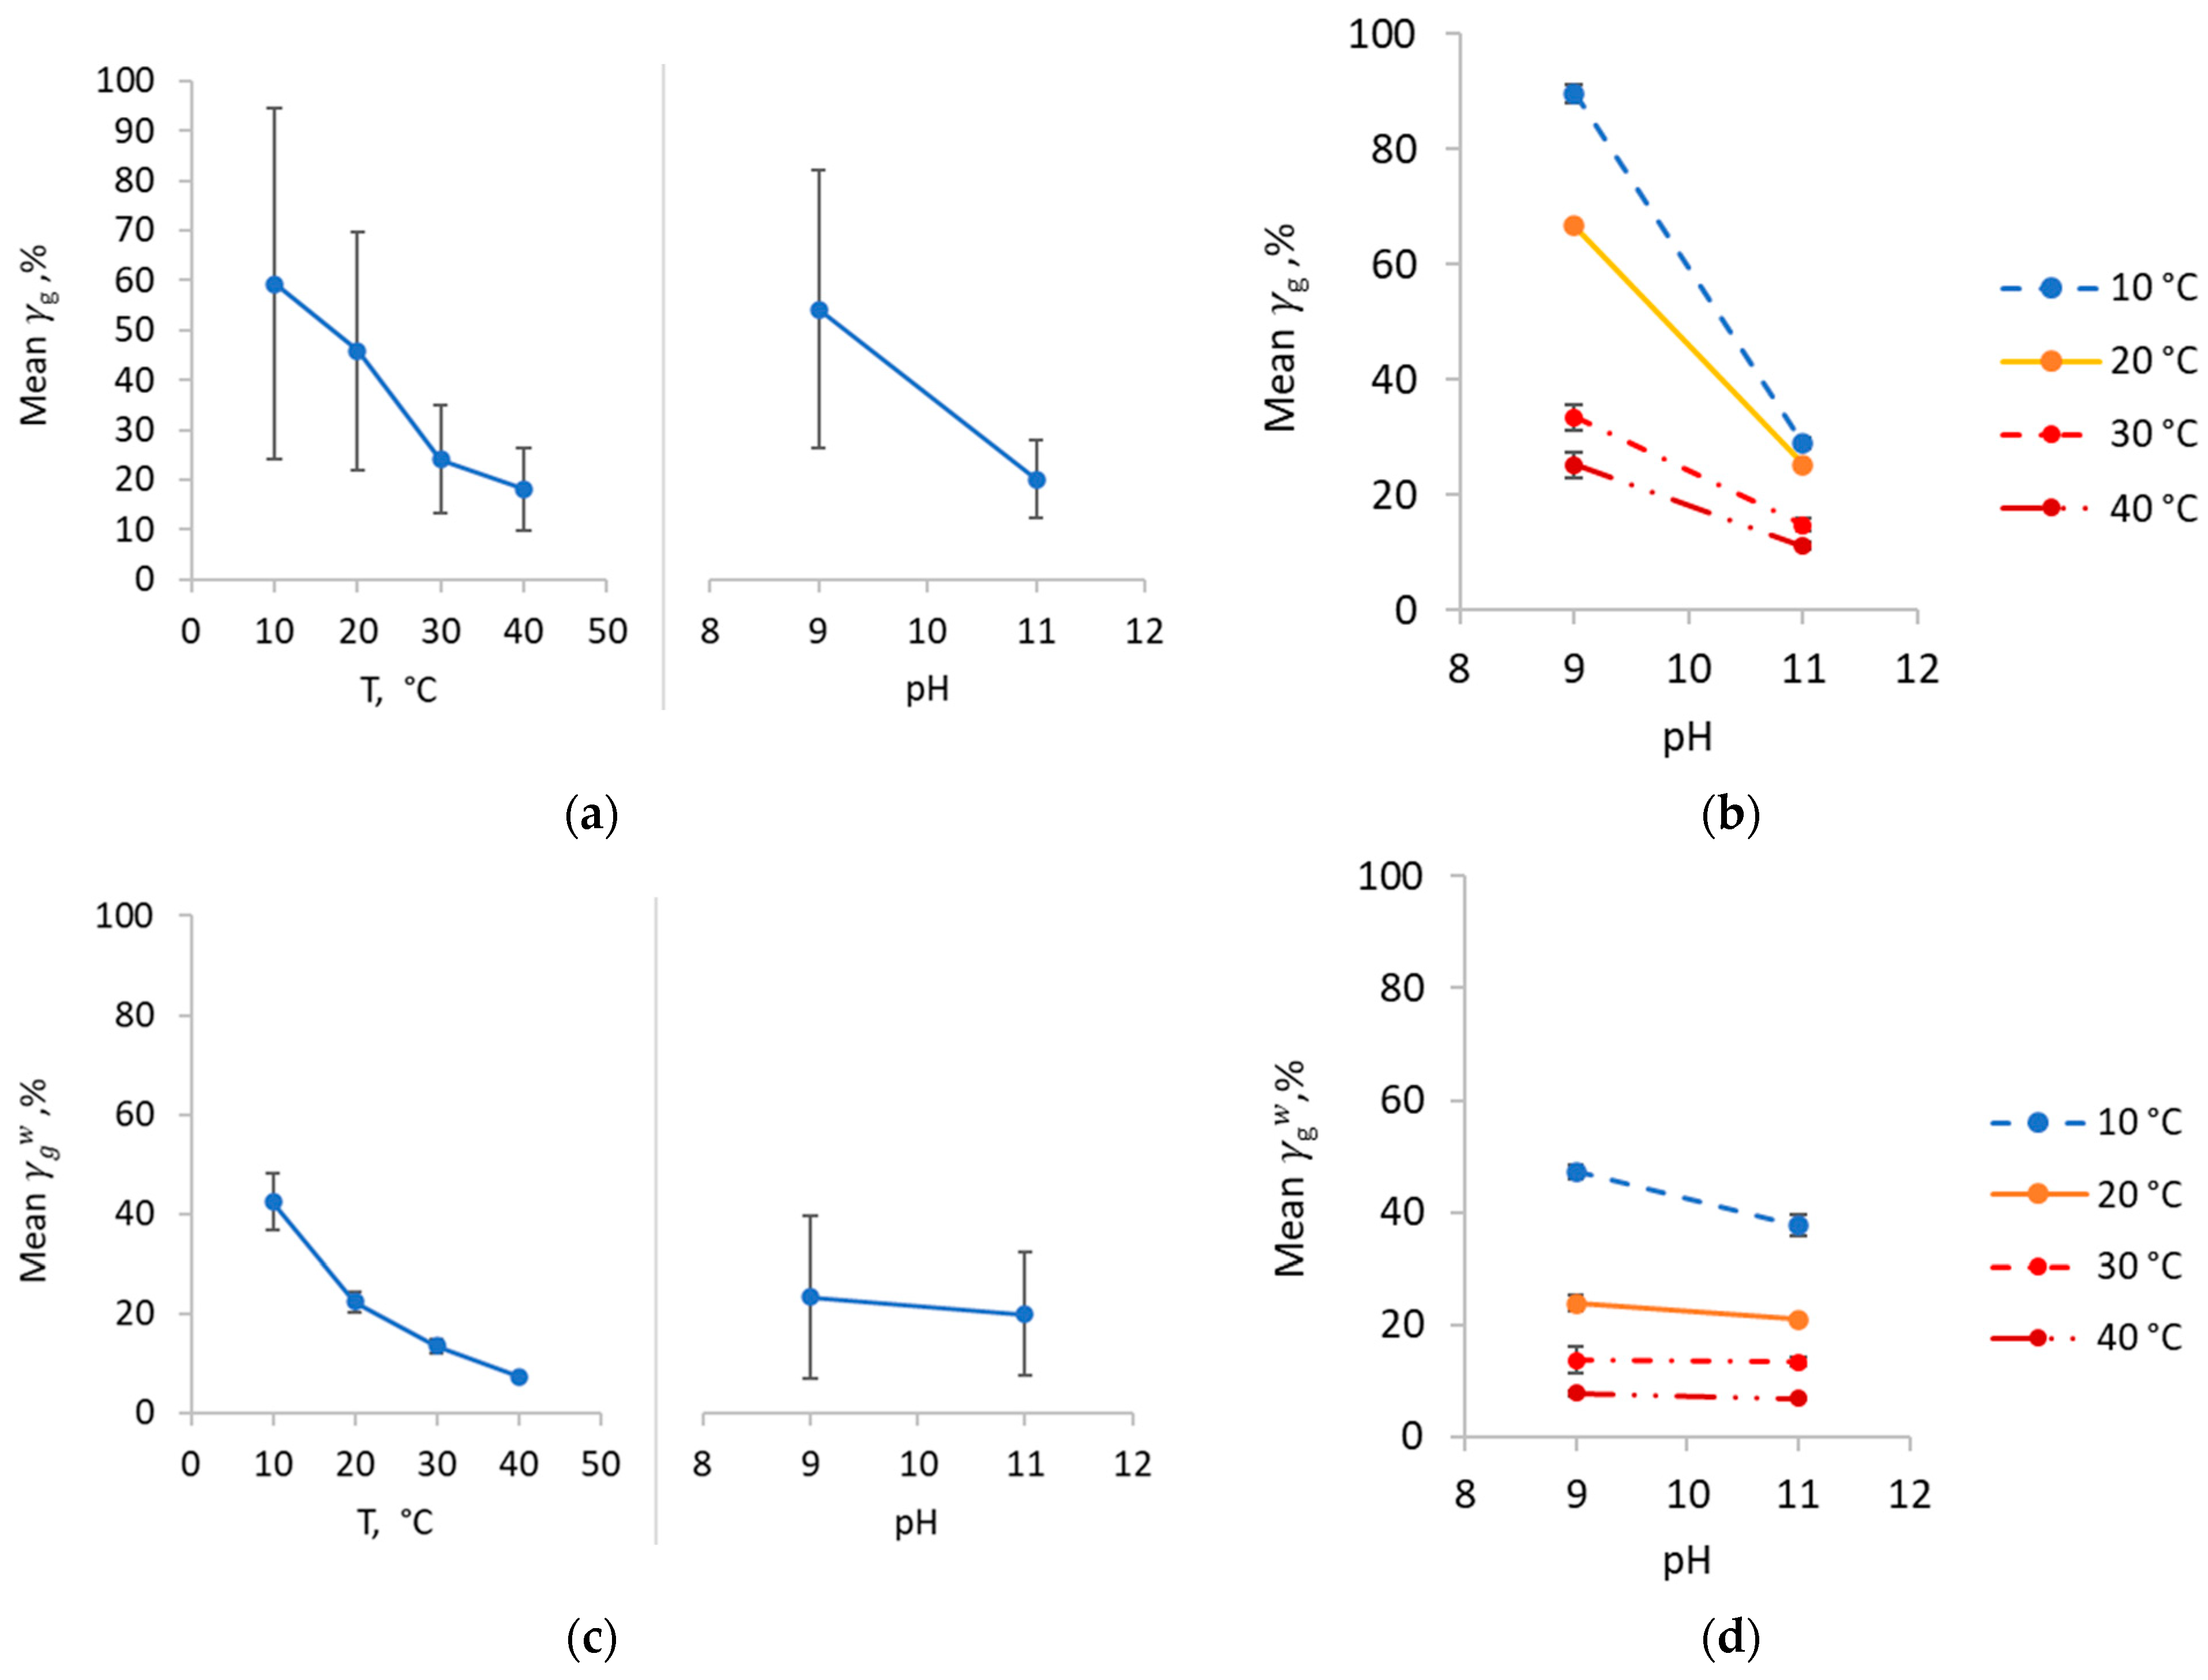
The observed increase in foam height with pH (when pH is controlled by lime) correlates well with the literature [48,49]. The suggested mechanism explaining the increased stability is reduction of repulsive forces of bubbles and particles. This results in an increase in ionic strength of the pulp and subsequent shrinkage of the double layer. The mechanism has previously been confirmed by zeta potential measurements [50,51]. The increased foam stability eventually translates into increased water recovery and solids entrainment. Manipulation of lime dosages were also reported as a possible means of reducing frother consumption [52]. In some cases, high salt concentration (such as that reported for Raglan Mine in Canada [53]) in process water allows flotation to operate without frother.
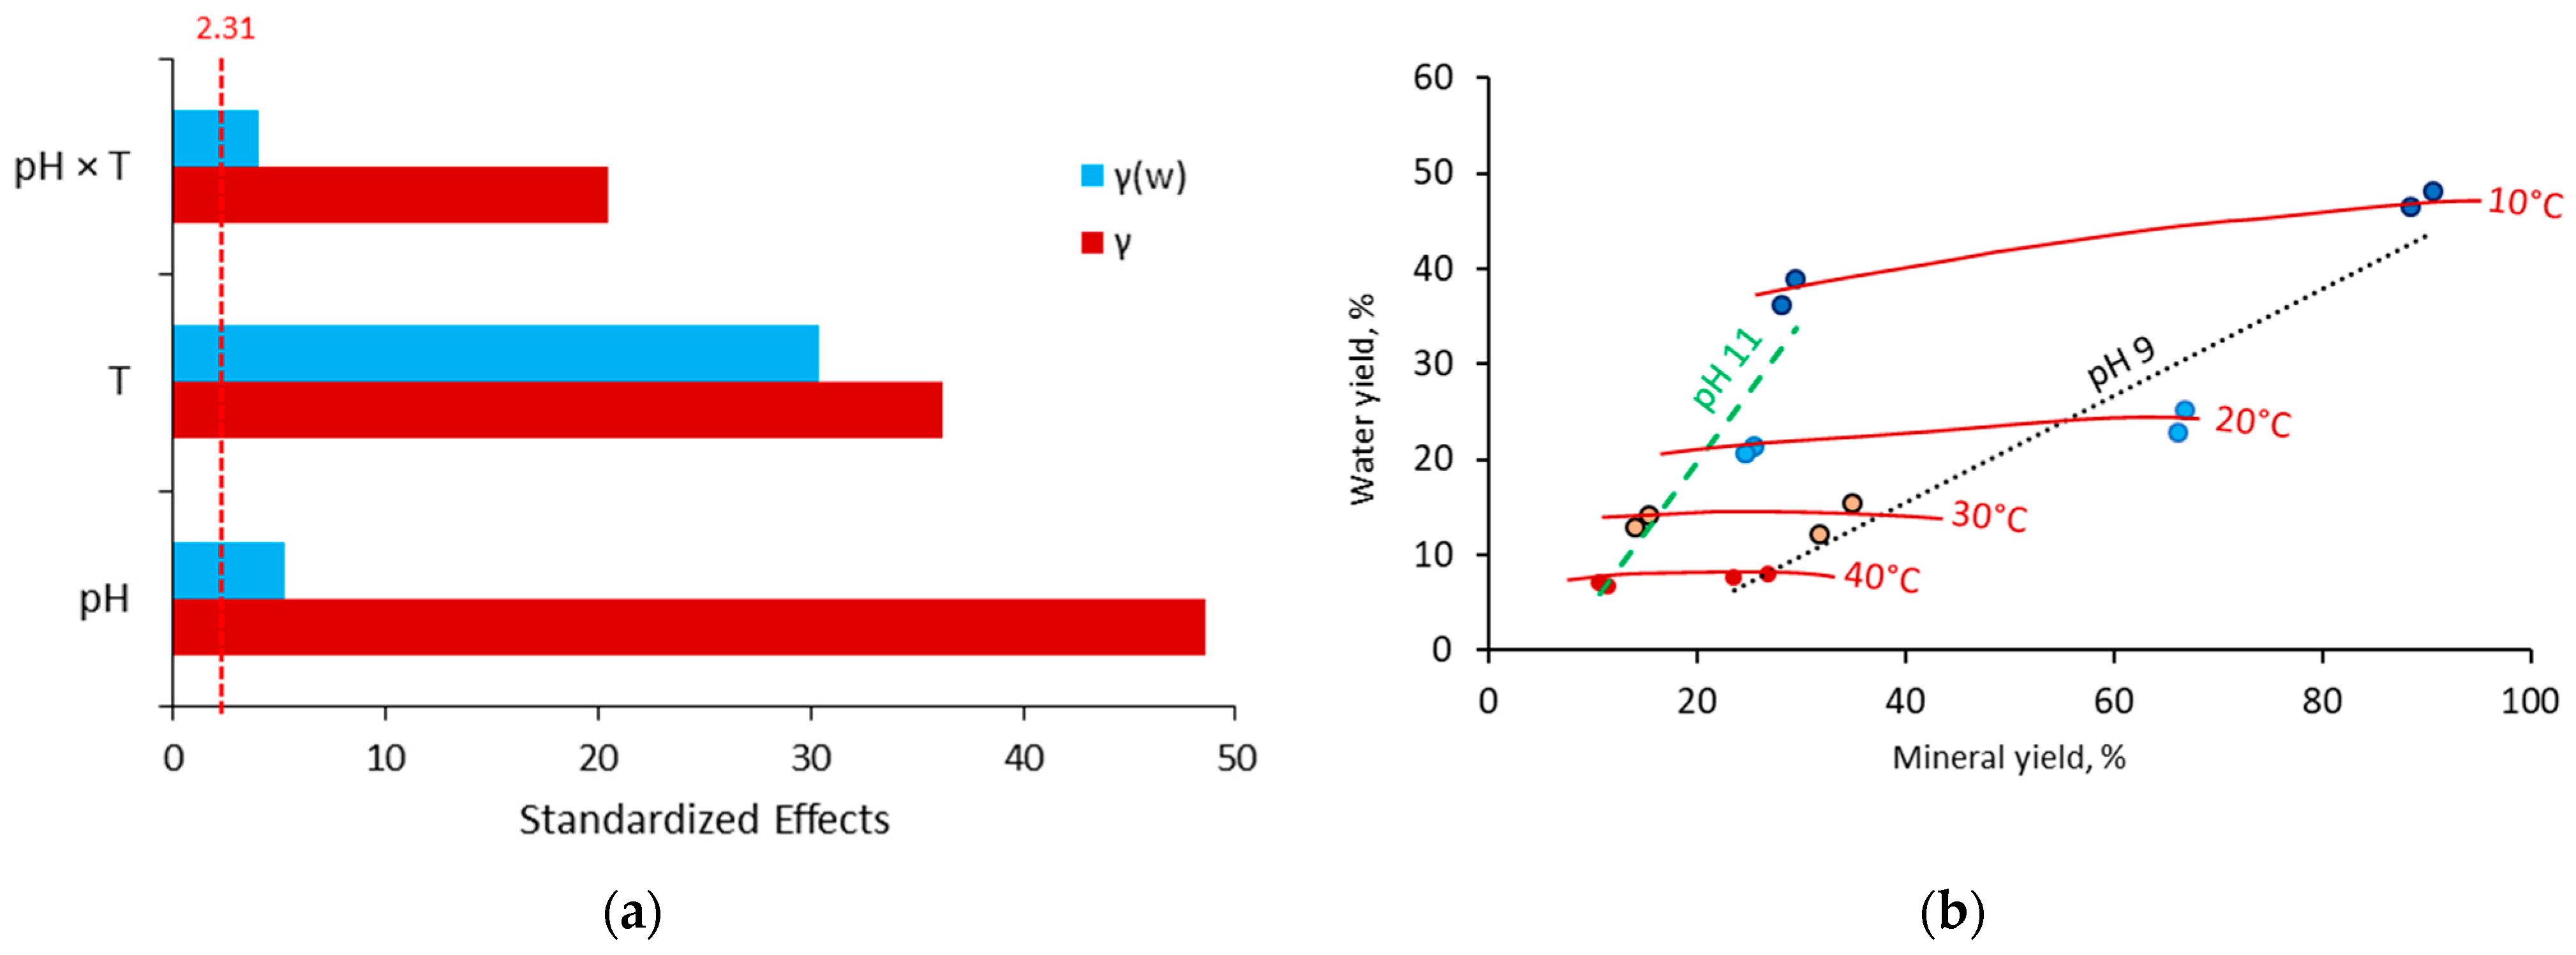
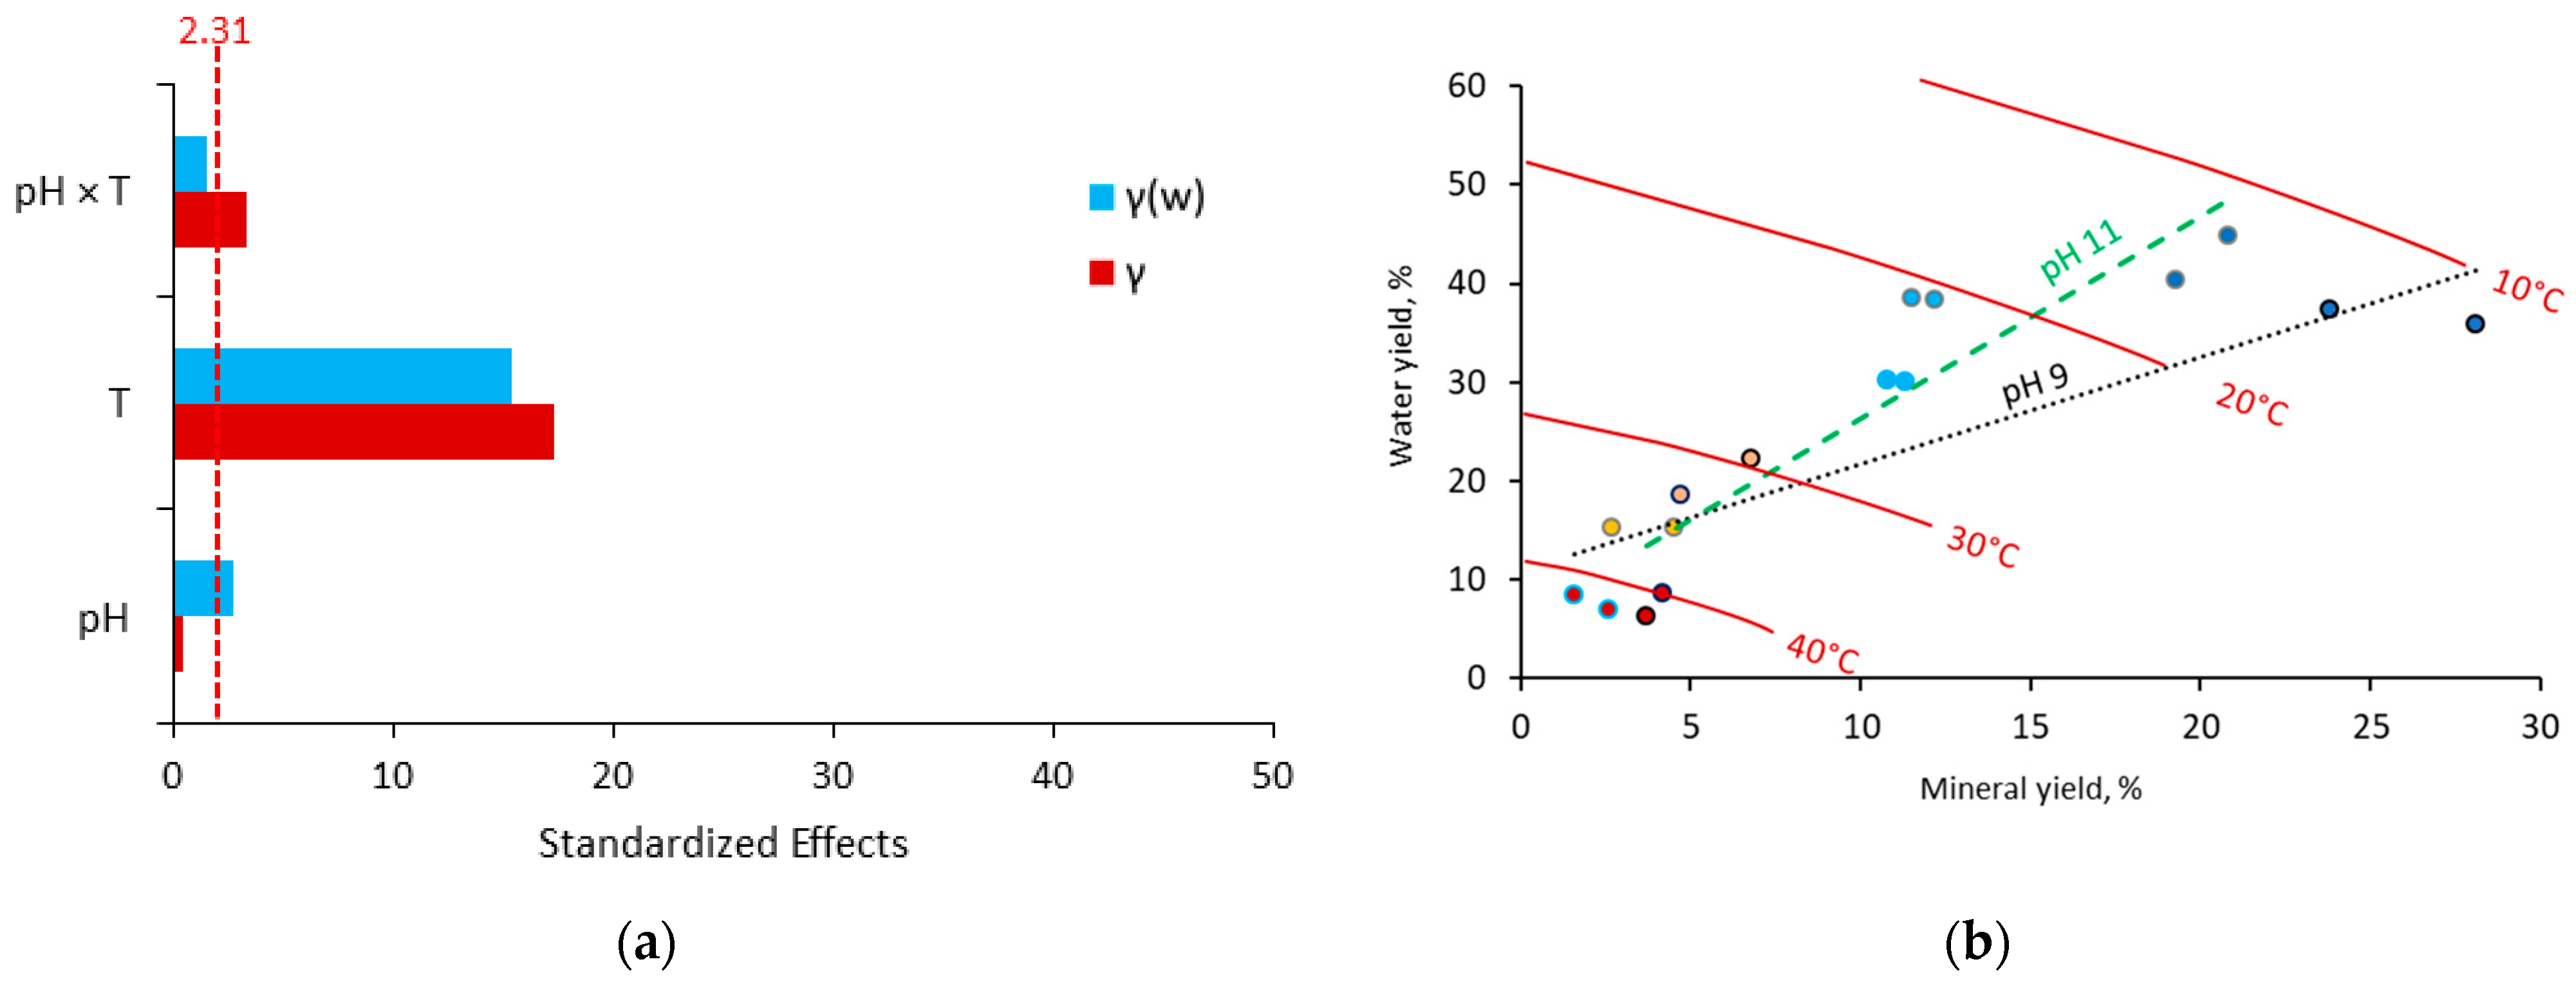
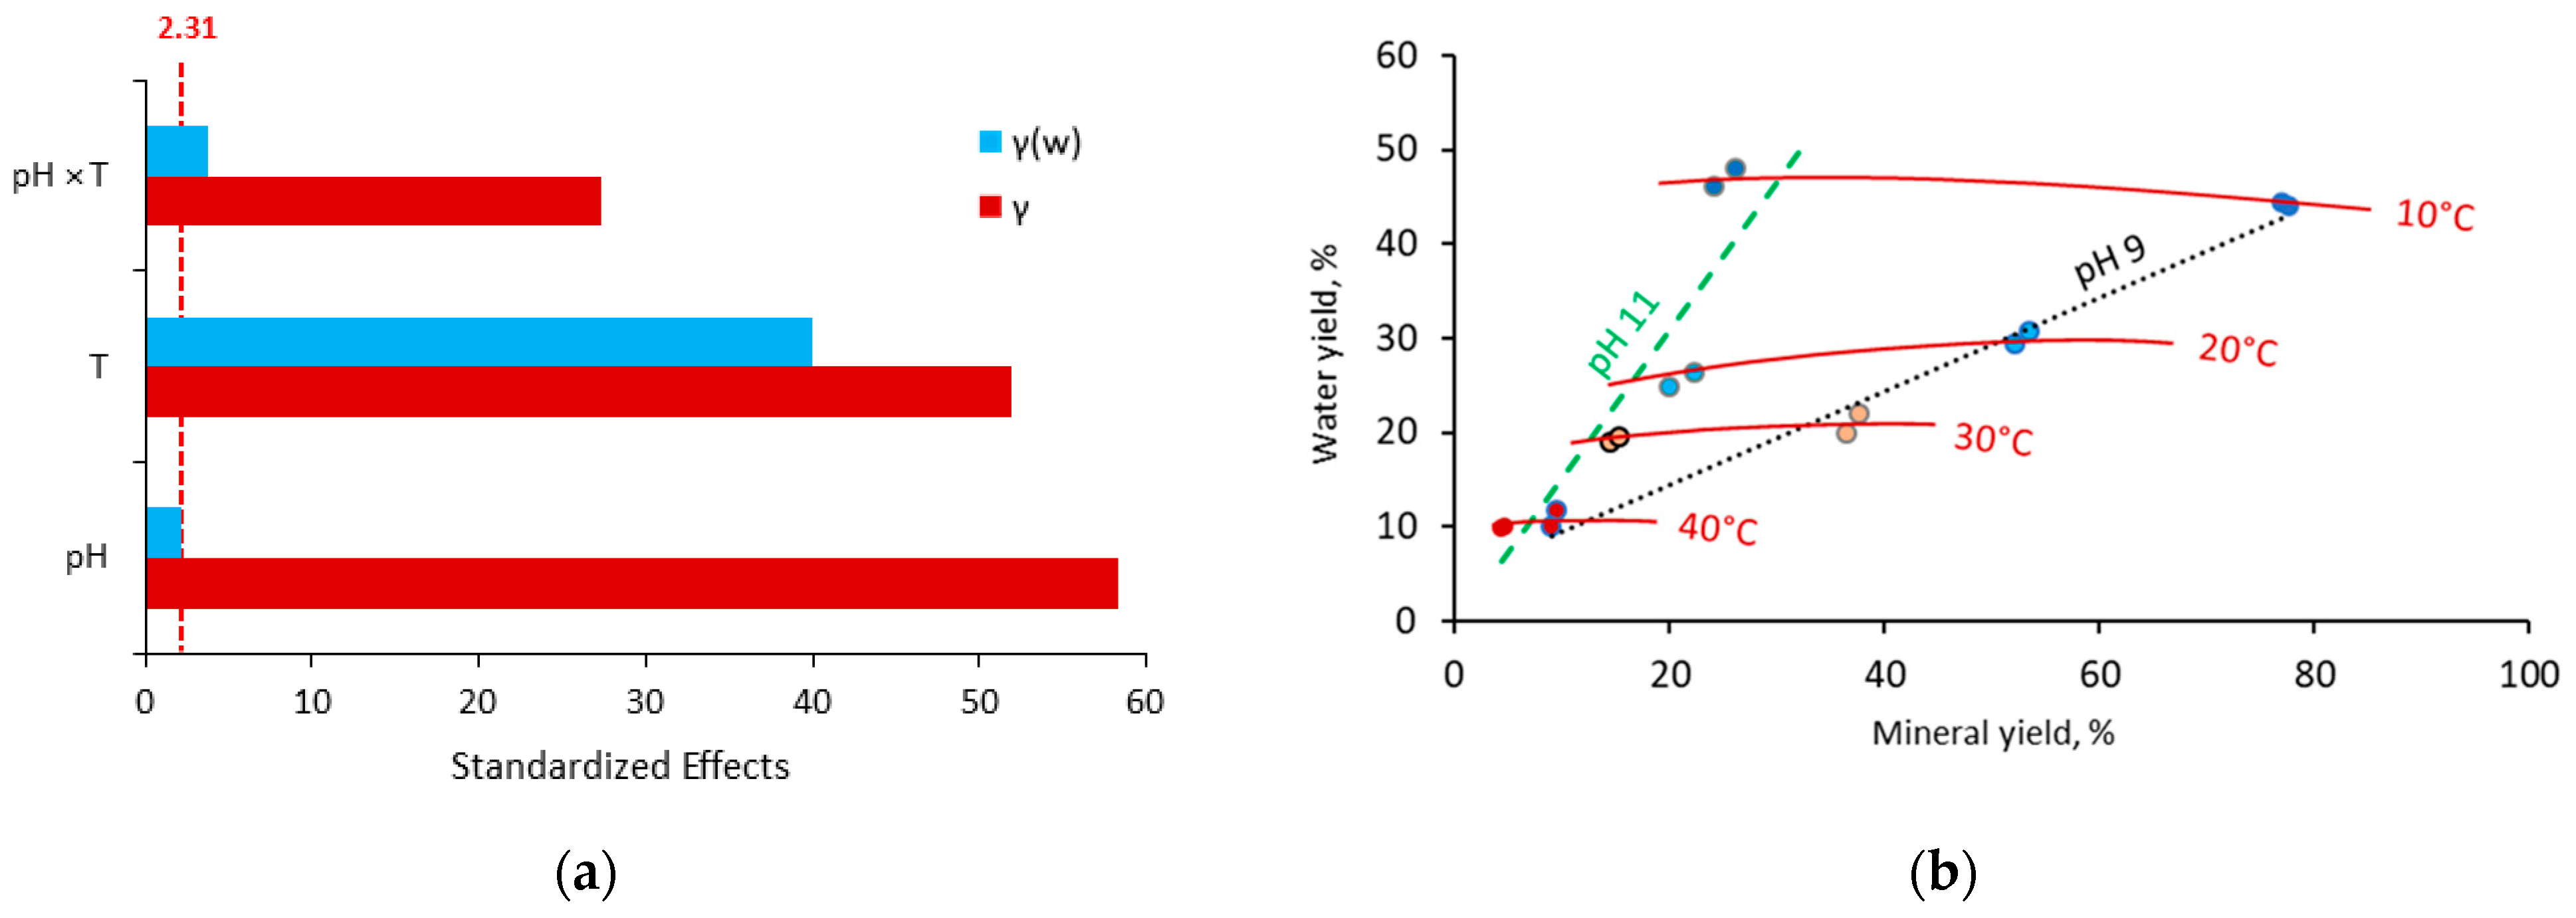
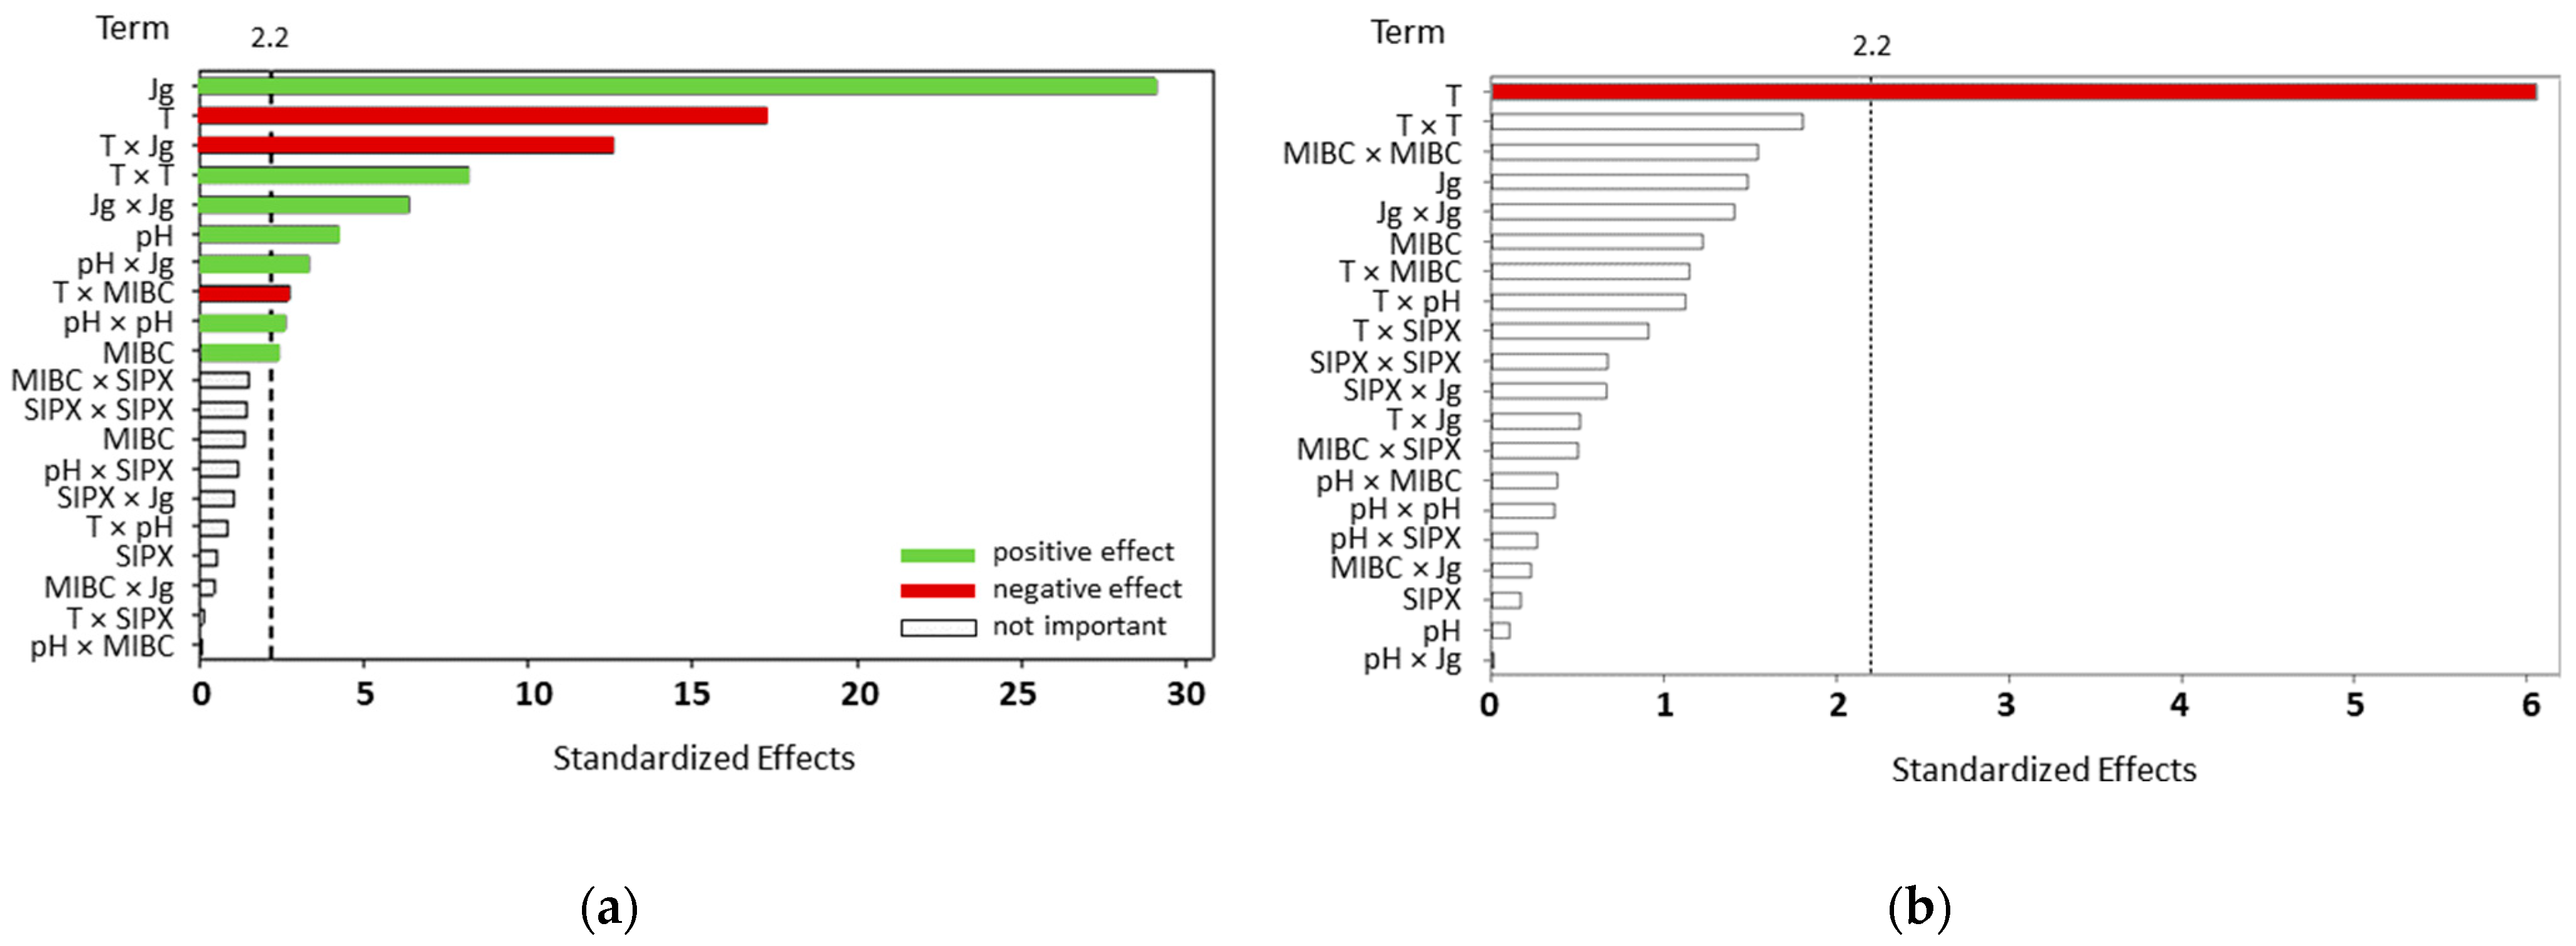
Another significant interaction between factors which control foam height was temperature and MIBC dosage. As seen from the Pareto chart (Figure 16a), the interaction is negative, which could be explained by ease of MIBC evaporation, reflected by low flash point (41 °C) [54]. In the industry, MIBC has been reported to evaporate directly from flotation cells [55]. Thus, an increase in temperature speeds up MIBC evaporation, reducing frother concentration in the system, which produces less stable and, hence, lower height foam/froths.
The impact of aeration–temperature interaction on foamability could be explained in several ways. Foamability was reported to decrease with an increasing gas solubility, which is temperature dependent [56]. Another connection between aeration, temperature, and foam height could be attributed to bubble size. An increase in aeration would increase bubble sizes (which would impact foam drainage); however, an increase in temperature was reported to decrease bubble size [
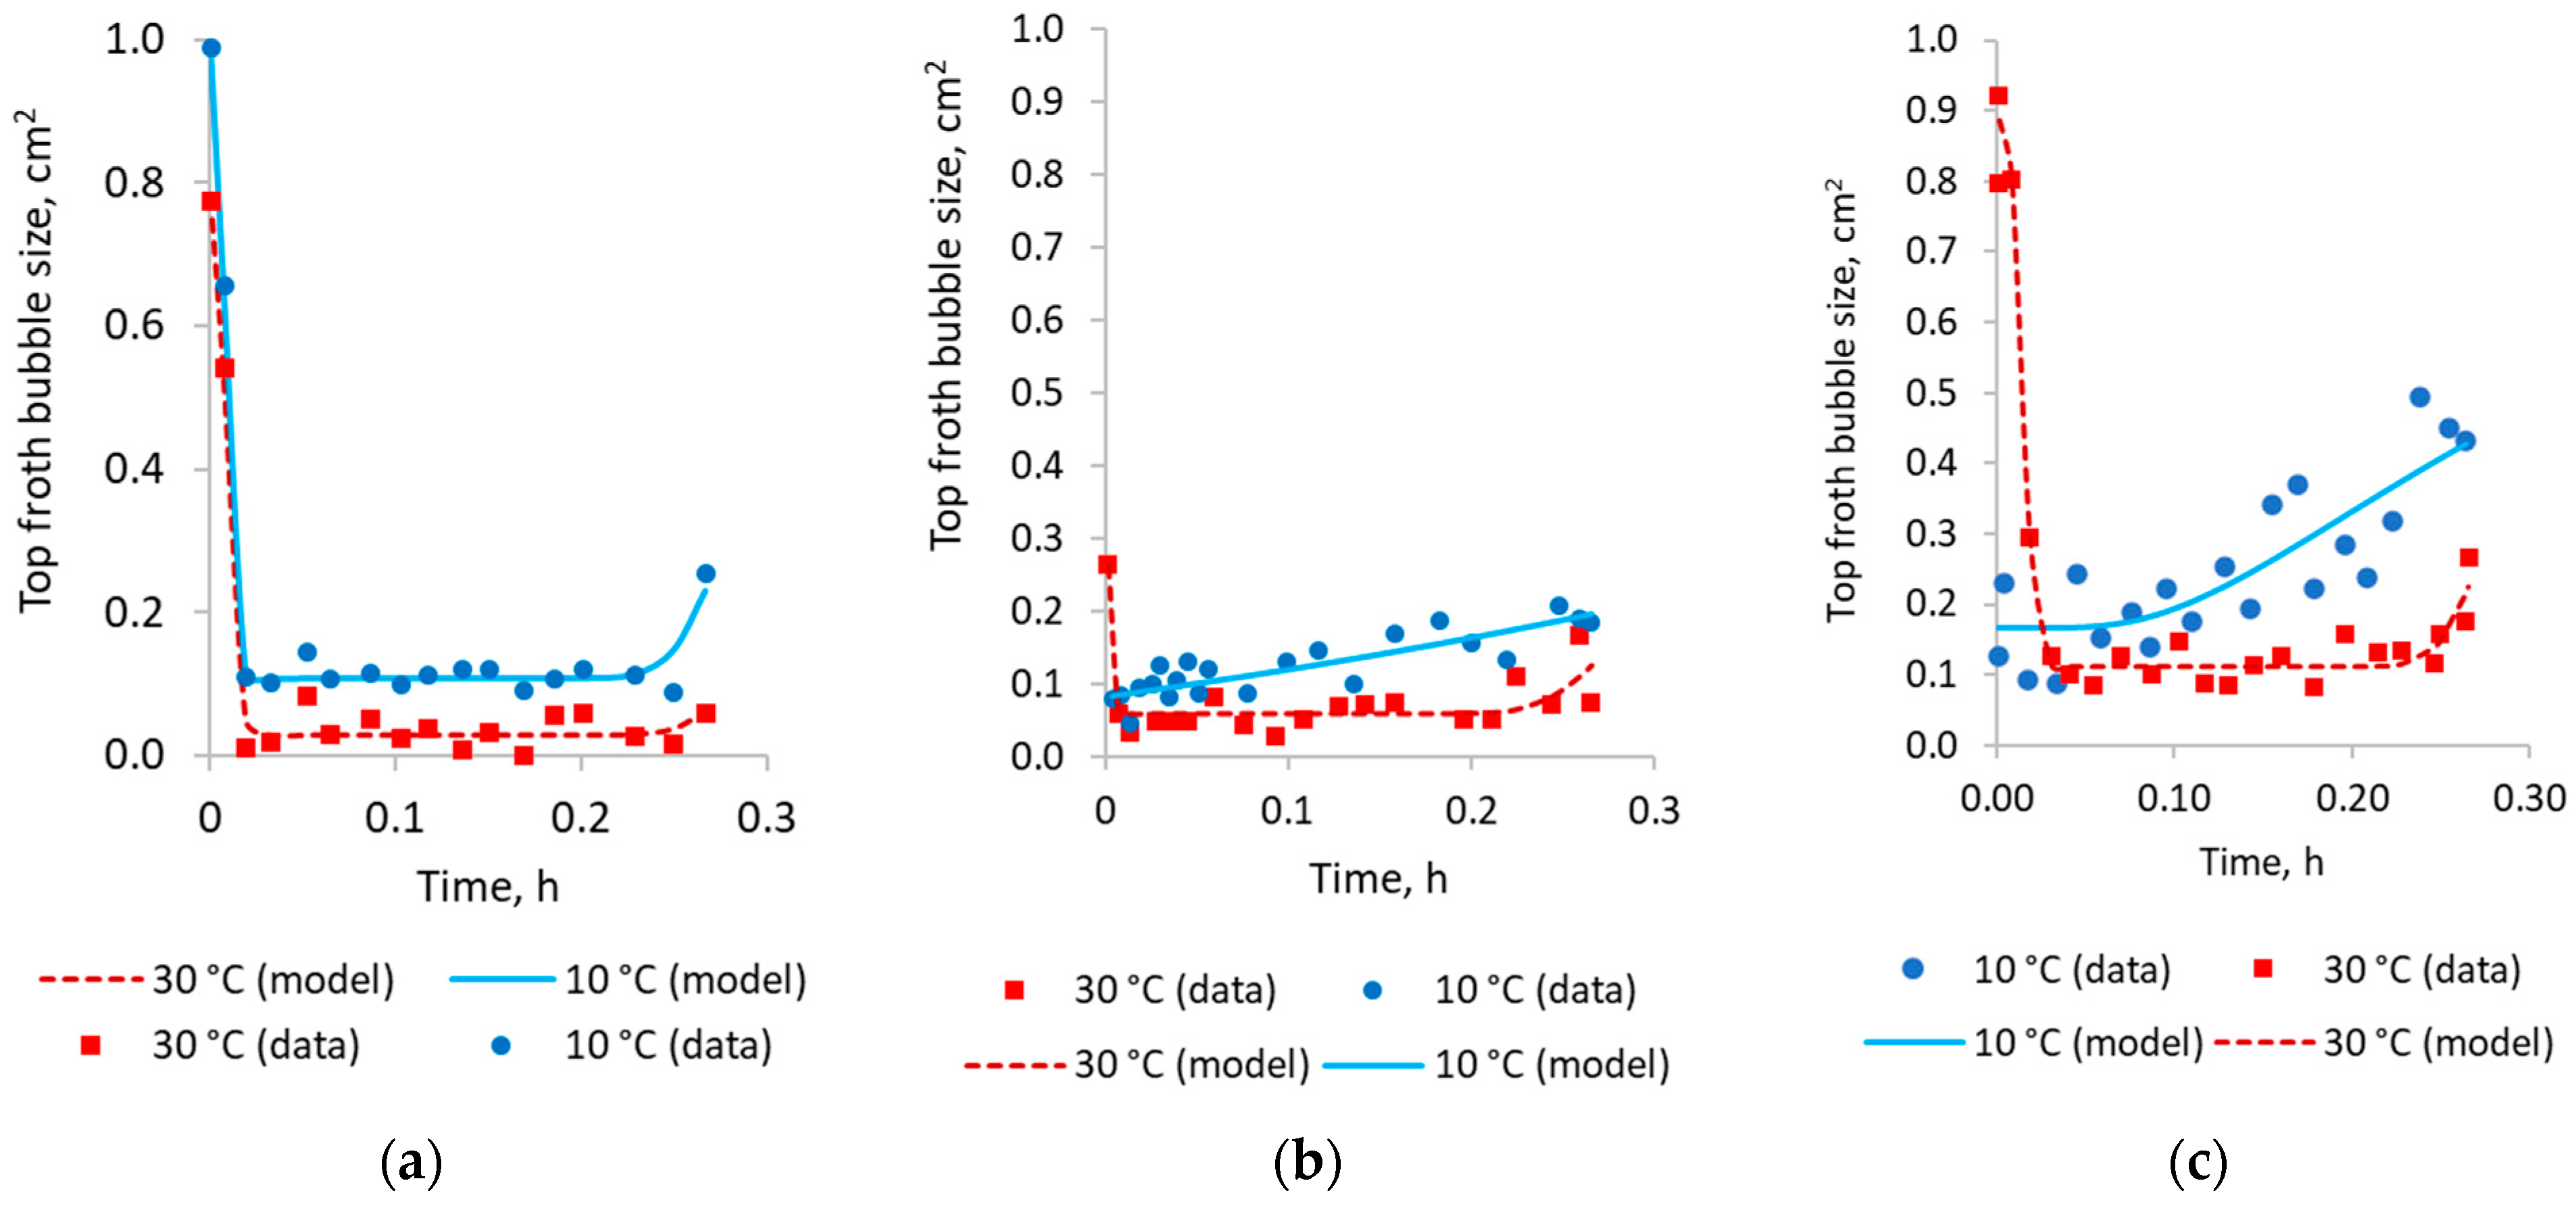
57]. A decrease in bubble size in the froth phase may also be observed in Section 3.1. The observed bubble sizes reported in this work decrease at the beginning as a result of froth drainage and the subsequent bubble collapse. After reaching a steady state (amounts of froth generated and collapsed become equalized), due to low MIBC concentration in the flotation cell (by the frother reporting to the concentrates and the flotation pulp being diluted by the addition of water), the bubble size starts to increase again, indicating froth degradation with time. Concerning bubble size variations with temperature, some research claims such size variations originate from the pulp phase [58] whereas, in other sources, it has been claimed that in thicker foams, bubble sizes are larger as a result of the processes occurring in the foam zone (coalescence) [59]. Most probably, both mechanisms take place, to a different extent depending on the flotation conditions.
For another froth stability parameter—half-life—only temperature was found to be statistically significant. Interestingly, MIBC dosage did not play a critical role for foam stability. This can be explained by the fact that the operating conditions for the tests were above or close to the critical coalescence concentration (around 10 ppm) reported for MIBC in various sources [31,32,60,61,62,63]. This indicates that there was a negligibly low effect or no effect of the tested dosages on bubble size variation and hence, derived foam stability/instability.
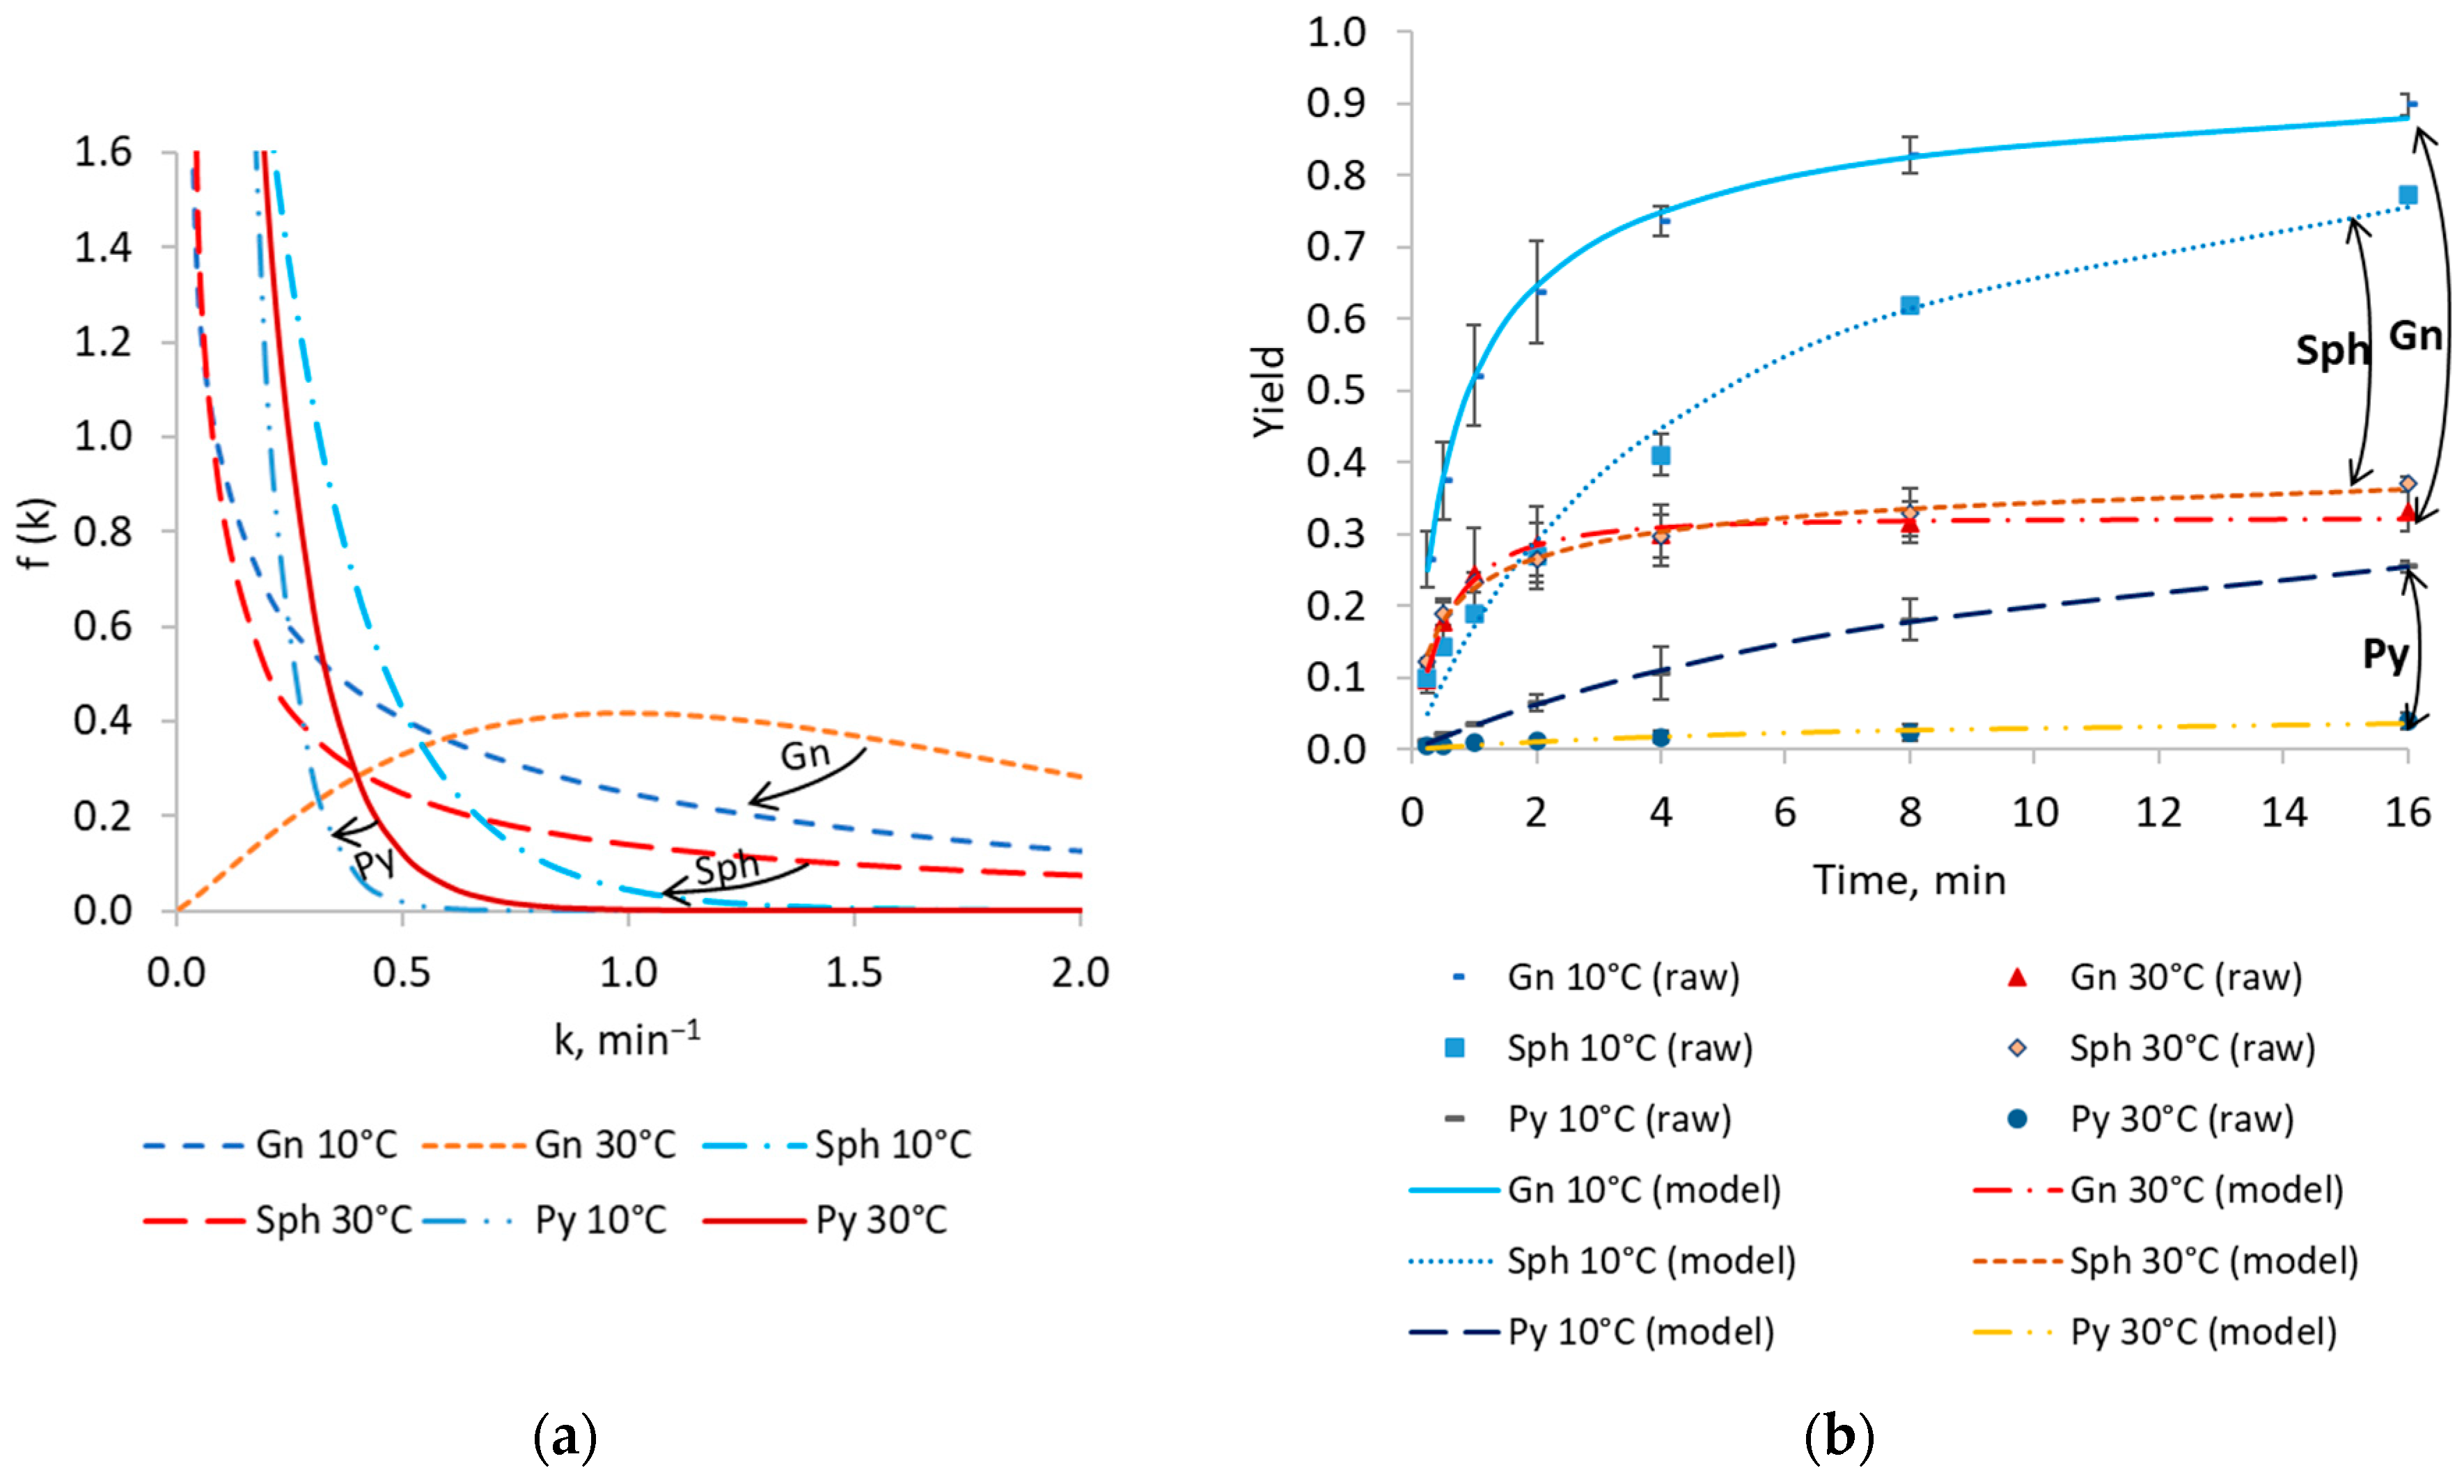
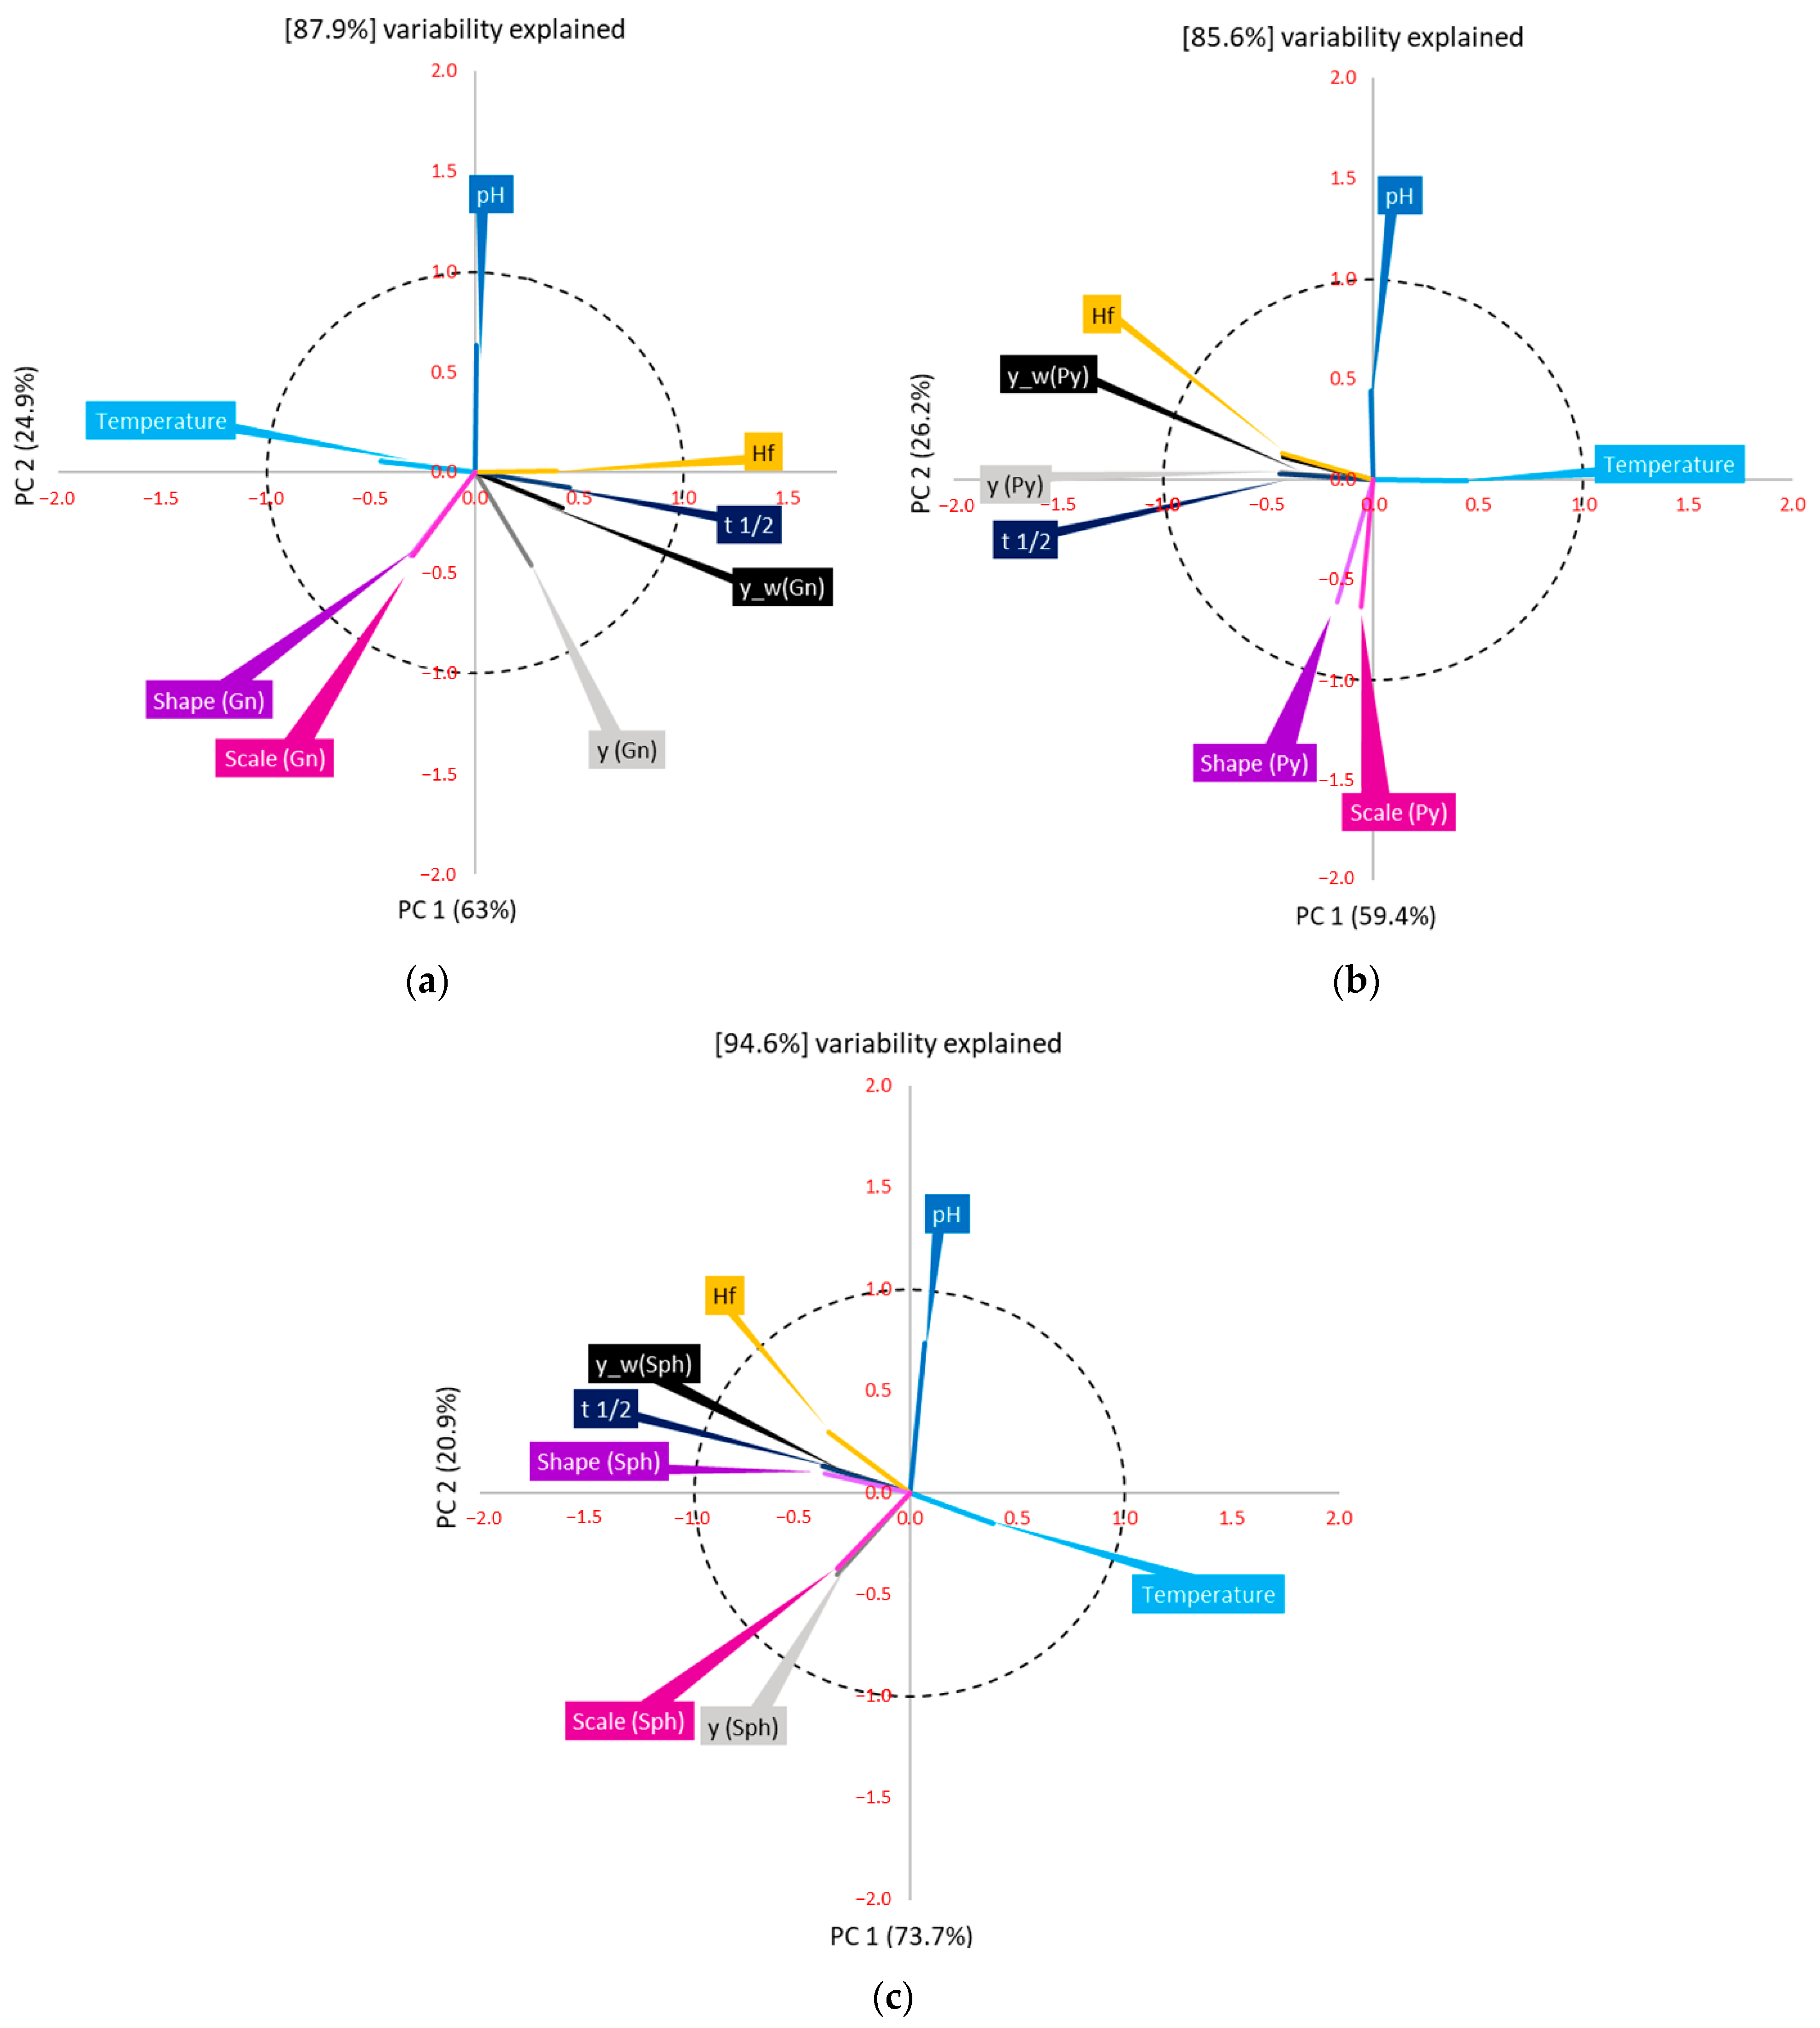
As for the flotation tests, it could be seen from the plots that the largest yields and fastest flotation kinetics were observed for galena, followed by sphalerite and pyrite. This could be attributed to galena being more electrochemically active than pyrite and adsorbing more collector [64]. Moreover, simulations of water molecule adsorption on pyrite and galena surfaces revealed that pyrite is generally more hydrophilic, which was confirmed by contact angle measurements (approximately 50° for galena compared to 20° for pyrite) [65,66]. Sphalerite normally has an inert surface due to a broad band gap which prevents oxygen and xanthate adsorption and renders it poorly floatable in the inactivated state [67,68]. Activated sphalerite, on the contrary, has contact angles closer to the ones observed for galena [69]. In this work, based on the flotation results and mineralogical composition of sphalerite sample, it may be suggested that a certain degree of sphalerite activation occurred, most probably due to the presence of galena (as shown in Table 1).
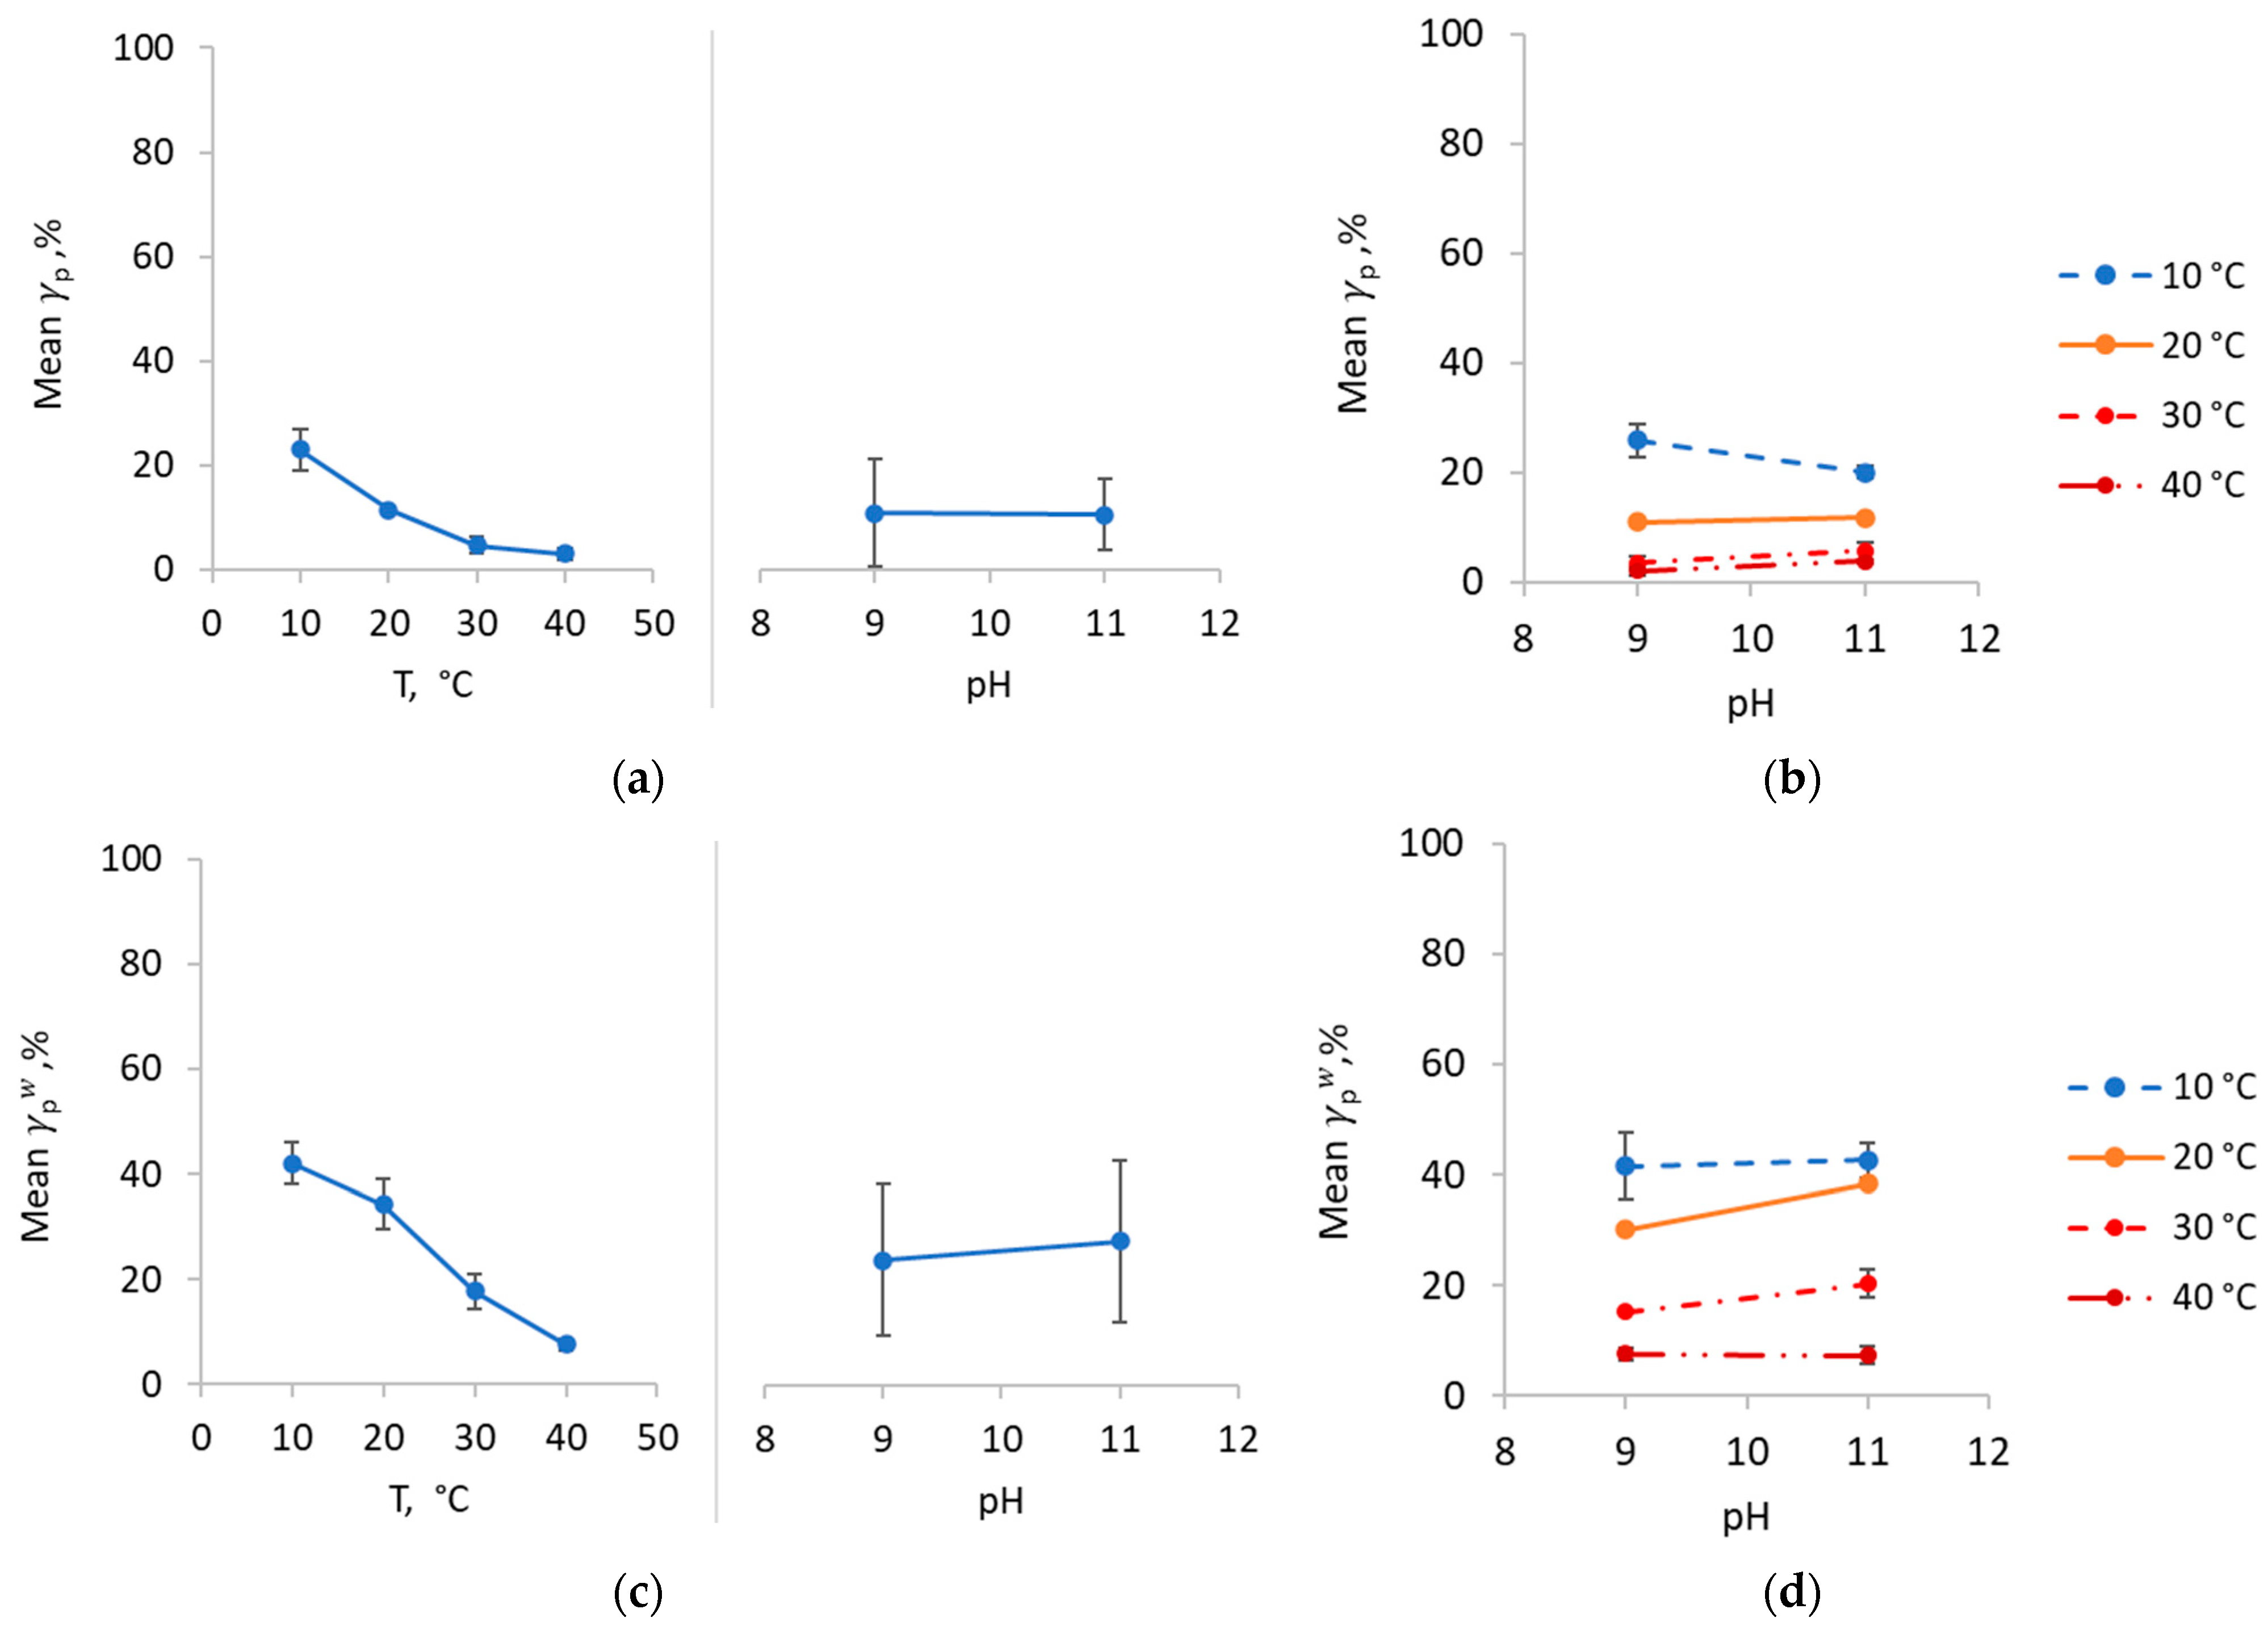
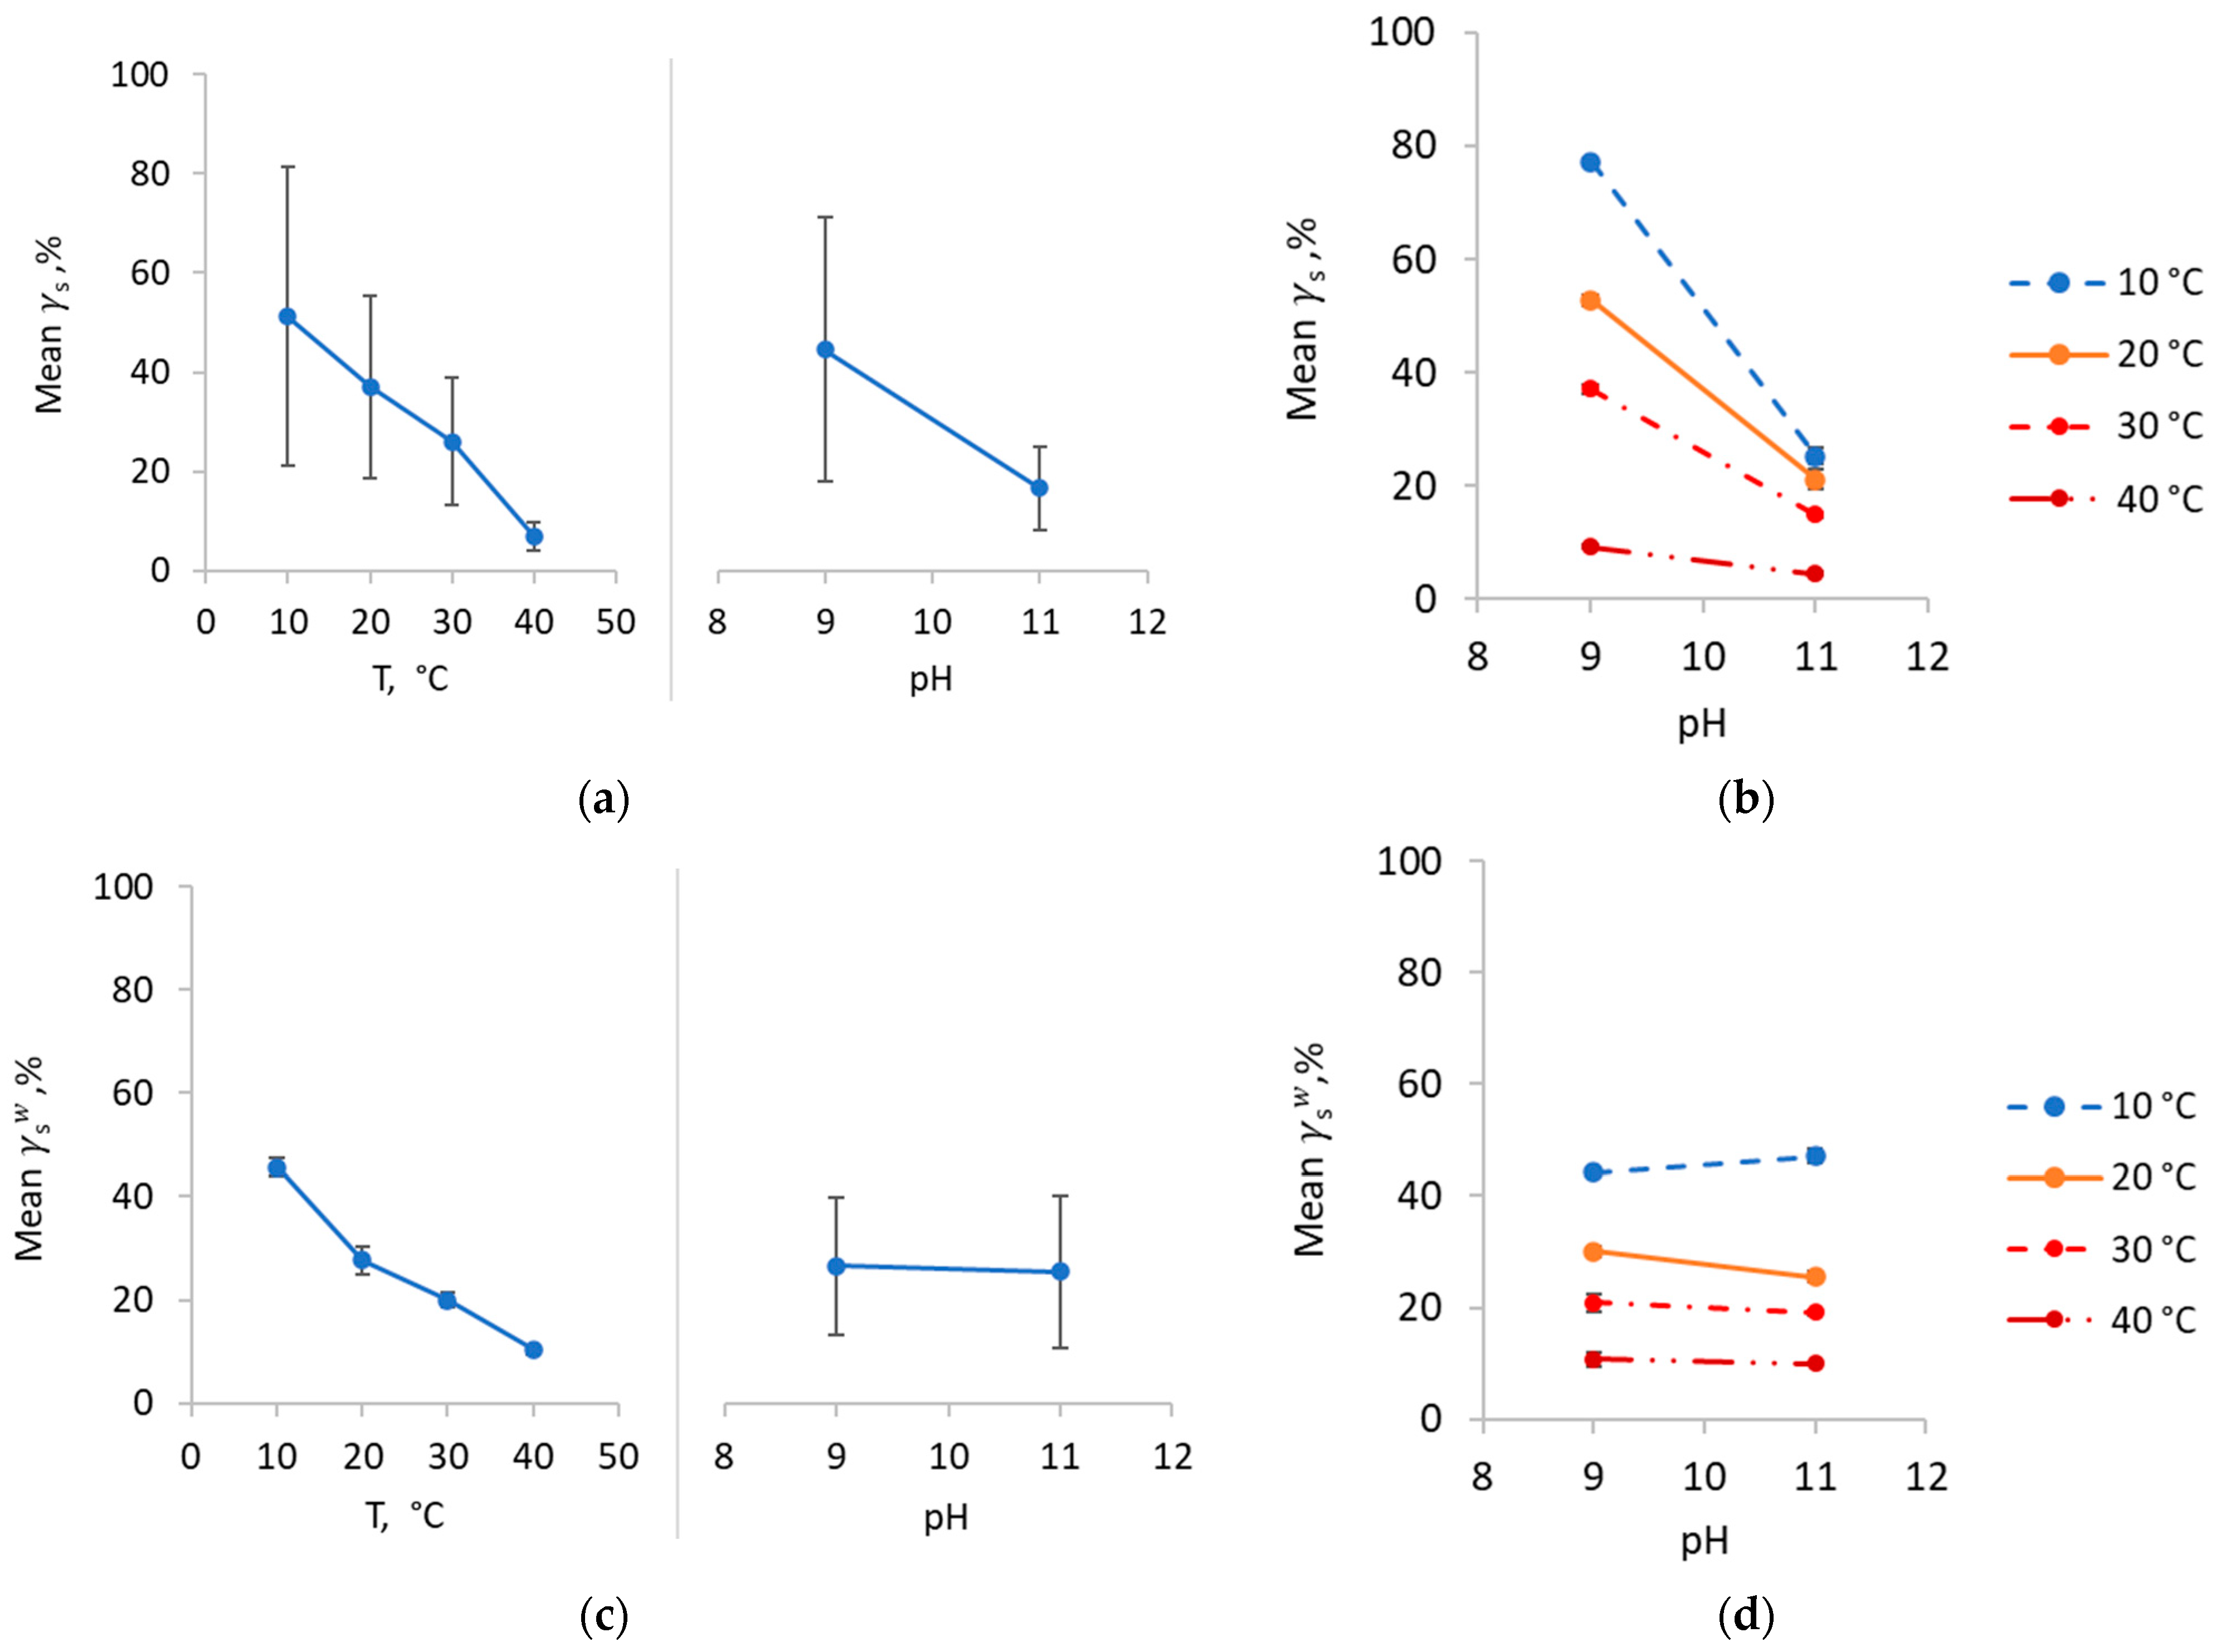
Regarding the impact of temperature on water recovery and mineral yields, from Figure 11, Figure 13 and Figure 15, it can be concluded that only the galena plot clearly exhibited R i n d fraction of the feed, the flotation of which is independent from water recovery. Higher correlations of mineral yields and water recoveries observed for pyrite and sphalerite compared to galena could be attributed to lower mineral densities for the first two minerals (5 and 4.1 g/cm3, respectively, versus 7.6 g/cm3) [70], which makes their drainage from the froth less efficient.
As mentioned in the Introduction, particles are known to enhance foam stability. However, for understanding the fundamental aspects of froth stability, the demonstrated correlations between flotation (three-phase system), and foam stability tests (two-phase system) help to better understand the behavior of the froth flotation process, without masking the impact of individual factors by a strong stabilizing effect of particle presence. As the next research step, froth stability tests will be performed to investigate the extent of foam stabilization with particles. In addition, it should be emphasized that the design of the experiment was used in the research for understanding and explaining flotation and foam stability systems, rather than for optimizing the responses.

5. Conclusions

Mono-mineral flotation tests revealed higher yields at colder temperatures. Flotation rate, on the contrary, was faster at elevated temperatures, which could be explained by smaller bubbles and chemical aspects of flotation. Foam height and half-life were found to be inversely correlated to temperature, while foam height, lime, frother dosages, as well as aeration were found to have a positive impact. The principal component analysis helped to determine that, for all tested minerals, flotation rate model parameters are inversely related to pH, while water recovery was found to be strongly correlated with foam height and half-life. Overall, it may be concluded that froth varies with temperature, which substantially impacts the concentrate grade and mineral yield in flotation plants.

Author Contributions

Conceptualization, K.E.W. and D.P.; methodology, D.P., K.E.W. and O.K.; software, D.P.; validation, D.P., R.L. and O.K.; formal analysis, D.P.; investigation, D.P. and R.L.; resources, K.E.W. and O.K.; data curation, D.P. and R.L.; writing—original draft preparation, D.P.; writing—review and editing, R.L., O.K. and K.E.W.; visualization, D.P.; supervision, K.E.W.; project administration, K.E.W.; funding acquisition, K.E.W. All authors have read and agreed to the published version of the manuscript.

Funding

The authors are grateful for the financial support from the Natural Sciences and Engineering Research Council of Canada (NSERC), Teck Resources Limited, COREM, SGS Canada Inc. and Flottec, under the Collaborative Research and Development Grants Program (CRDPJ-531957-18). The McGill Engineering Doctoral Award (MEDA) from the Faculty of Engineering at McGill University is also acknowledged for providing funding for D. Pashkevich and R. Li. In addition, D. Pashkevich would like to acknowledge the Fonds de recherche du Québec–Nature et technologies (FRQNT) for the award of a doctoral scholarship.

Data Availability Statement

Not applicable.

Conflicts of Interest

The authors declare no conflict of interest.

Nomenclature

SymbolDescriptionUnits
R G is the recovery of fine gangue
e G is a gangue material constant
R w is water recovery
R i n d is the model’s extrapolated intercept on the recovery axis
e M is the entrainment factor for the mineral of interest
ε f is air holdup
A is cross-sectional area of the froth phase (dm2)
Q a is the rate of air flow passing though the froth zone(L/min)
α is the fraction of the froth that reports to the concentrate
V is water drainage rate (m/s)
h is the liquid film thickness (m)
P is the difference between hydrostatic pressure and disjoining pressure (N/m2)
μ is continuous phase dynamic viscosity (Pa·s)
r is bubble radius (m)
β 0 and β 1 are empirical constants
T is the temperature(K)
R c w is water recovery from pulp zone to froth zone
R f w is water recovery from froth phase to the concentrate
H f is froth (foam) height (dm)
τ f is the residence time (min)
θ 0 is intercept at zero froth height
θ 1 is the gradient of the flotation rate constant versus froth height plot
k is the flotation rate constant
P is ore floatability parameter
S b is bubble surface area flux(s−1)
R f is froth recovery
c is a froth parameter
t ½ is froth half-life (s)
p is a shape factor of gamma distribution
λ is a scale factor of gamma distribution
φ K is probability density function of flotation rate constant distribution
K is flotation rate constant
Γ ( p ) is Euler’s gamma function
R ^ t is modeled recovery at time t
R t is experimental recovery value at time t
R is infinite recovery
η is characteristic life (scale factor)
β is Weibull slope (shape parameter)
F t is failure distribution function
D b m a x t is the diameter of the top bubble on the froth surface(cm)
D b ( e q ) m a x is an “equilibrium” top bubble size in the plateau area of the “Bathtub” curve(cm)
B a , b , t is beta distribution of Weibull shape parameter,
a and b are beta distribution shape parameters
y is the k t h response of the second-order model (polynomial)
b 0 is an intercept of the second-order model (polynomial)
b i is the second-order model equation linear term coefficient
b i i is the second-order model equation cubic term coefficient
b i j is the cross-product coefficient of the second-order model
x i and x j are the variables of the second-order model
n is the number of variables
ε is a residual (error)
F h t is foam height at time t (mm)
F h ( e q ) is equilibrium foam height (mm)
m is foam height reduction after reaching a peak at the beginning of the test (difference between F h t and F h ( e q ) ) (mm)
d is the foam height decay constant
X and Y is a pair of variable/response vectors compared
N is the number of points
μ X and μ Y are the mean values
X i and Y i are individual points in the respective vectors
λ i are eigenvalues
I is the identity matrix
v i are eigenvectors
V is a matrix of normalized eigenvectors
Z is a matrix with scores
M is a matrix with standardized original data
γ g is galena flotation yield
γ p is pyrite flotation yield
γ s is sphalerite flotation yield
γ g w is water recovery during galena flotation
γ p w is water recovery during pyrite flotation
γ s w is water recovery during sphalerite flotation

References

  1. Lin, I.J. The Effect of Seasonal Variations in Temperature on the Performance of Mineral Processing Plants. Miner. Eng. 1989, 2, 47–54. [Google Scholar] [CrossRef]
  2. Glembotskij, V.; Klassen, V. Φлoтaциoнныe Мeтoды Обoгaщeния/Flotation Methods of Mineral Processing, 2nd ed.; Nedra: Moscow, Russia, 1981; p. 304. (In Russian) [Google Scholar]
  3. He, M. Slurry Rheology of Limestone and Its Effects on Wet Ultra-fine Grinding. Licentiate Thesis, Luleå University of Technology, Luleå, Sweden, 2005. [Google Scholar]
  4. Pashkevich, D.; Li, R.; Waters, K. Temperature and climate-induced fluctuations in froth flotation: An overview of different ore types. Can. Metall. Q. 2022, 1–38, in press. [Google Scholar] [CrossRef]
  5. O’Connor, C.T.; Dunne, R.C.; Botelho de Sousa, A.M.R. The effect of temperature on the flotation of pyrite. J. S. Afr. Inst. Min. Metall. 1984, 84, 389–394. [Google Scholar] [CrossRef]
  6. Fuerstenau, M.C.; Jameson, G.; Yoon, R.H. Froth Flotation: A Century of Innovation; Society for Mining, Metallurgy, and Exploration, Inc.: Littleton, CL, USA, 2007. [Google Scholar]
  7. Dunne, R.C.; Kawatra, S.K.; Young, C.A. SME Mineral Processing and Extractive Metallurgy Handbook; Society for Mining, Metallurgy & Exploration, Inc.: Littleton, CO, USA, 2019. [Google Scholar]
  8. Warren, J.L. Determination of the contributions of true flotation and entrainment in batch flotation tests. Int. J. Miner. Process. 1985, 14, 33–44. [Google Scholar] [CrossRef]
  9. Zheng, X.; Franzidis, J.P.; Johnson, N.W. An evaluation of different models of water recovery in flotation. Miner. Eng. 2006, 19, 871–882. [Google Scholar] [CrossRef]
  10. Damodaran, S. Protein Stabilization of Emulsions and Foams. J. Food Sci. 2006, 70, R54–R66. [Google Scholar] [CrossRef]
  11. Monsalve, A.; Schechter, R. The Stability of Foams: Dependence of Observation on the Bubble Size Distribution. J. Colloid Interface Sci. 1984, 97, 327–335. [Google Scholar] [CrossRef]
  12. Yu, M.A.; Damodaran, S. Kinetics of Protein Foam Destabilization: Evaluation of a Method Using Bovine Serum Albumin. J. Agric. Food Chem. 1991, 39, 1555–1562. [Google Scholar] [CrossRef]
  13. Kaye, G.W.C.; Laby, T.H. Tables of Physical and Chemical Constants, 16th ed.; Longman: Essex, UK, 1995. [Google Scholar]
  14. Wills, B.A.; Finch, J.A. Wills’ Mineral Processing Technology: An Introduction to the Practical Aspects of Ore Treatment and Mineral Recovery, 8th ed.; Butterworth-Heinemann: Oxford, UK, 2015. [Google Scholar]
  15. Bhondayi, C. A Study of Flotation Froth Phase Behaviour. Ph.D. Thesis, University of Witwatersrand, Johannesburg, South Africa, 2014. [Google Scholar]
  16. Iglesias, E.; Anderez, J.; Forgiarini, A.; Salager, J.-L. A new method to estimate the stability of short-life foams. Colloids Surf. A Physicochem. Eng. Asp. 1995, 98, 167–174. [Google Scholar] [CrossRef]
  17. Barbian, N.; Hadler, K.; Ventura-Medina, E.; Cilliers, J.J. The froth stability column: Linking froth stability and flotation performance. Miner. Eng. 2005, 18, 317–324. [Google Scholar] [CrossRef]
  18. Barbian, N.; Ventura-Medina, E.; Cilliers, J.J. Dynamic froth stability in froth flotation. Miner. Eng. 2003, 16, 1111–1116. [Google Scholar] [CrossRef]
  19. Pugh, R.J. Bubble size measurements and foam test methods. In Bubble and Foam Chemistry; Cambridge University Press: Cambridge, UK, 2016; pp. 372–404. [Google Scholar]
  20. Choung, J.; Walker, J.; Xu, Z.; Masliyah, J. Effect of Temperature on the Stability of Froth Formed in the Recycle Process Water of Oil Sands Extraction. Can. J. Chem. Eng. 2004, 82, 801–806. [Google Scholar] [CrossRef]
  21. Ata, S.; Ahmed, N.; Jameson, G.J. A study of bubble coalescence in flotation froths. Int. J. Miner. Process. 2003, 72, 255–266. [Google Scholar] [CrossRef]
  22. Oetjen, K.; Bilke-Krause, C.; Madani, M.; Willers, T. Temperature effect on foamability, foam stability, and foam structure of milk. Colloids Surf. A Physicochem. Eng. Asp. 2014, 460, 280–285. [Google Scholar] [CrossRef]
  23. Feteris, S.M.; Frew, J.A.; Jowett, A. Modelling the effect of froth depth in flotation. Int. J. Miner. Process. 1987, 20, 121–135. [Google Scholar] [CrossRef]
  24. Gorain, B.K.; Napier-Munn, T.J.; Franzidis, J.P.; Manlapig, E.V. Studies on impeller type, impeller speed and air flow rate in an industrial scale flotation cell. Part 5: Validation of k-S b relationship and effect of froth depth. Miner. Eng. 1998, 11, 615–626. [Google Scholar] [CrossRef]
  25. Zanin, M.; Gredelj, S.; Grano, S.R. Factors affecting froth stability in mineral flotation and implications on minerals recovery: A case study. In Proceedings of the V International Mineral Processing Seminar, Santiago, Chile, 22–24 October 2008; pp. 197–206. [Google Scholar]
  26. Nesset, J.E.; Gomez, C.O.; Finch, J.A.; Hernandez-Aguilar, J.R.; DiFeo, A. The use of gas dispersion measurements to improve flotation performance. In Proceedings of the Canadian Mineral Processors, Ottawa, ON, Canada, 18–20 January 2005; pp. 402–421. [Google Scholar]
  27. Lutterotti, L.; Matthies, S.; Wenk, H.R. MAUD: A friendly Java program for material analysis using diffraction. IUCr Newsl. CPD 1999, 21, 14–15. [Google Scholar]
  28. Guilbert, J.M.; Park, C.F., Jr. The Geology of Ore Deposits; W.H. Freeman: New York, NY, USA, 1986. [Google Scholar]
  29. Chepurnyh, S.F.; Stepanov, J.V.; Kuznetsov, V.D.; Karpenko, T.G.; Plastovets, I.H. Φлoтaциoннaя Мaшинa/Flotation Machine. USSR Patent 751436, USSR State Committee on Inventions and Discoveries, 30 July 1980. (In Russian). [Google Scholar]
  30. Bulatovic, S.M. Handbook of Flotation Reagents: Chemistry, Theory and Practice, 1st ed.; Elsevier: Amsterdam, The Netherlands, 2007. [Google Scholar]
  31. Nesset, J.E.; Zhang, W.; Finch, J.A. A benchmarking tool for assessing flotation cell performance. In Proceedings of the 44th Annual Canadian Mineral Processors Operators Conference, Ottawa, ON, Canada, 17–19 January 2012; pp. 183–209. [Google Scholar]
  32. Nassif, M. Developing Critical Coalescence Concentration Curves Using Dilution and Determining Frother-like Properties of Oil Sands Process. Master’s Thesis, McGill University, Montreal, QC, Canada, 2013. [Google Scholar]
  33. Rubinstein, Y.B.; Filippov, J.A. Kинeтикa Φлoтaции/Flotation Kinetics; Nedra: Moscow, Russia, 1980; p. 375. (In Russian) [Google Scholar]
  34. Vinnett, L.; Grammatikopoulos, T.; El-Menshawy, A.H.; Waters, K.E. Justifying size-by-size flotation rate distributions from size-by-association kinetic responses. Powder Technol. 2022, 395, 168–182. [Google Scholar] [CrossRef]
  35. Stringer, C.; Wang, T.; Michaelos, M.; Pachitariu, M. Cellpose: A generalist algorithm for cellular segmentation. Nat. Methods 2021, 18, 100–106. [Google Scholar] [CrossRef]
  36. Heiser, T.; Hofmeister, P. Bathtub, failure distribution, MTBF, MTTF, and more: They are related. In Proceedings of the MFPT, King of Prussia, PI, USA, 14–16 May 2019. [Google Scholar]
  37. O’Connor, P.D.T.; Kleyner, A. Practical Reliability Engineering, 5th ed.; Wiley: Hoboken, NJ, USA, 2012. [Google Scholar]
  38. Walck, C. Handbook on Statistical Distributions for Experimentalist; University of Stockholm: Stockholm, Sweden, 2007. [Google Scholar]
  39. Mathews, P.G. Design of Experiments with MINITAB; ASQ Quality Press: Milwaukee, WI, USA, 2005. [Google Scholar]
  40. Nesset, J.E.; Finch, J.A.; Gomez, C.O. Operating variables affecting bubble size in force-air mechanical flotation machines. In Proceedings of the 9th Mill Operators Conference, Fremantle, WA, Australia, 19–21 March 2007; pp. 55–65. [Google Scholar]
  41. Daultrey, S. Principal Components Analysis; Geo Abstracts Ltd.: Norwich, UK, 1976; p. 51. [Google Scholar]
  42. Hadavand-Siri, M.; Deutsch, C.V. Some Thoughts on Understanding Correlation Matrices; University of Alberta: Edmonton, AB, Canada, 2012; pp. 408-1–408-6. [Google Scholar]
  43. Faraway, J.J. Practical Regression and Anova Using R; University of Bath: Bath, UK, 2002; Available online: https://cran.r-project.org/doc/contrib/Faraway-PRA.pdf (accessed on 20 January 2023).
  44. Chicco, D.; Warrens, M.J.; Jurman, G. The coefficient of determination R-squared is more informative than SMAPE, MAE, MAPE, MSE and RMSE in regression analysis evaluation. PeerJ Comput. Sci. 2021, 7, 623. [Google Scholar] [CrossRef]
  45. Jiang, J.; Zu, Y.; Li, X.; Meng, Q.; Long, X. Recent progress towards industrial rhamnolipids fermentation: Process optimization and foam control. Bioresour. Technol. 2020, 298, 122394. [Google Scholar] [CrossRef] [PubMed]
  46. Wang, L.; Yoon, R.-H. Stability of foams and froths in the presence of ionic and non-ionic surfactants. Miner. Eng. 2006, 19, 539–547. [Google Scholar] [CrossRef]
  47. Jingwei, W.; Qisen, Z.; Chenyao, G.; Qiangkun, L.; Yawei, H.; Xinman, J.; Yanchao, Z.; Jing, W.; Qiang, Z. Effects of Aeration on Pollution Load and Greenhouse Gas Emissions from Agricultural Drainage Ditches. Water 2022, 14, 3783. [Google Scholar] [CrossRef]
  48. Manono, M.S.; Corin, K.C.; Wiese, J.G. An investigation into the effect of various ions and their ionic strength on the flotation performance of a platinum bearing ore from the Merensky reef. Miner. Eng. 2012, 36, 231–236. [Google Scholar] [CrossRef]
  49. Corin, K.C.; Reddy, A.; Miyen, L.; Wiese, J.G.; Harris, P.J. The effect of ionic strength of plant water on valuable mineral and gangue recovery in a platinum bearing ore from the Merensky reef. Miner. Eng. 2011, 24, 131–137. [Google Scholar] [CrossRef]
  50. Yoon, R.H.; Sabey, J.B. Coal Flotation in Inorganic Salt Solutions; Virginia Polytechnic Institute and State University: Blacksburg, VA, USA, 1982; p. 113. [Google Scholar]
  51. Paulson, O.; Pugh, R.J. Flotation of inherently hydrophobic particles in aqueous solutions of inorganic electrolytes. Langmiur 1996, 12, 4808–4813. [Google Scholar] [CrossRef]
  52. Zanin, M.; Lambert, H.; du Plessis, C.A. Lime use and functionality in sulphide mineral flotation: A review. Miner. Eng. 2019, 143, 105922. [Google Scholar] [CrossRef]
  53. Quinn, J.J.; Kracht, W.; Gomez, C.O.; Gagnon, C.; Finch, J.A. Comparing the effect of salts and frother (MIBC) on gas dispersion and froth properties. Miner. Eng. 2007, 20, 1296–1302. [Google Scholar] [CrossRef]
  54. Methyl Isobutyl Carbinol. Material Safety Data Sheet [Online]. Monument Chemical: Indianapolis, IN, USA. 29 August 2022. Available online: https://monumentchemical.com/uploads/files/SDS/MIBC_-_SDS_(US).pdf?v=1661804588840 (accessed on 5 January 2023).
  55. Poling, G.W. Comments on ODCE Report Regarding Milling Chemicals for Proposed U.S. Borax Quartz Hill Molybdenite Concentrator; U.S. Borax Corp.: Los Angeles, CA, USA, 1984; p. 13. [Google Scholar]
  56. Gevantman, L.H. Solubility of selected gasses in water. In CRC Handbook of Chemistry and Physics, 91st ed.; Haynes, W.M., Ed.; CRC Press: Abingdon, UK, 2010; pp. 80–83. [Google Scholar]
  57. Issaoui, R.; Ben Mansour, L. Experimental study of temperature effects on bubble characteristics and gas holdup in electroflotation column. Desalination Water Treat. 2019, 162, 186–192. [Google Scholar] [CrossRef]
  58. Jackman, M.; Bussonnière, A.; Leung, H.L.; Xu, Z.; Tsai, P.A.; Liu, Q. Effect of temperature on foamability using a thermoresponsive polymer. AIP Adv. 2018, 8, 075320. [Google Scholar] [CrossRef]
  59. Pugh, R.J. Bubble and Foam Chemistry; Cambridge University Press: Cambridge, UK, 2016. [Google Scholar]
  60. Grau, R.A.; Laskowski, J.S.; Heiskanen, K. Effect of frothers on bubble size. Int. J. Miner. Process. 2005, 76, 225–233. [Google Scholar] [CrossRef]
  61. Laskowski, J.S. Testing Flotation Frothers. Physicochem. Probl. Miner. Process. 2004, 38, 13–22. [Google Scholar]
  62. Gupta, A.K.; Banerjee, P.K.; Mishra, A.; Satish, P.; Pradip. Effect of alcohol and polyglycol ether frothers on foam stability, bubble size and coal flotation. Int. J. Miner. Process. 2007, 82, 126–137. [Google Scholar] [CrossRef]
  63. Guven, O.; Batjargal, K.; Ozdemir, O.; Karakashev, S.I.; Grozev, N.A.; Boylu, F.; Çelik, M.S. Experimental Procedure for the Determination of the Critical Coalescence Concentration (CCC) of Simple Frothers. Minerals 2020, 10, 617. [Google Scholar] [CrossRef]
  64. Piantadosi, C.; Smart, R.S.C. Statistical comparison of hydrophobic and hydrophilic species on galena and pyrite particles in flotation concentrates and tails from TOF-SIMS evidence. Int. J. Miner. Process. 2002, 64, 43–54. [Google Scholar] [CrossRef]
  65. Prestidge, C.A.; Ralston, J. Contact Angle Studies of Galena Particles. J. Colloid Interface Sci. 1995, 172, 302–310. [Google Scholar] [CrossRef]
  66. Monte, M.B.M.; Lins, F.F.; Oliveira, J.F. Selective flotation of gold from pyrite under oxidizing conditions. Int. J. Miner. Process. 1997, 51, 255–267. [Google Scholar] [CrossRef]
  67. Abramov, A. Φлoтaция: Cyльφидныe Минepaлы/Flotation: Sulfide Minerals, 8th ed.; Gornaja Kniga: Moscow, Russia, 2013. (In Russian) [Google Scholar]
  68. Yu, J.; Wu, X.; Zhao, Z.; Zhu, Y.; Luo, S. Effect of a Small Amount of Iron Impurity in Sphalerite on Xanthate Adsorption and Flotation Behavior. Minerals 2019, 9, 687. [Google Scholar] [CrossRef]
  69. Gayle, J.B.; Smelley, A.G.; United States, Bureau of Mines. Effects of Temperature Variations on Contact Angles for Coal and Related Substances; U.S. Department of the Interior, Bureau of Mines: Washington, DC, USA, 1960. [Google Scholar]
  70. Carmichael, R.S. Practical Handbook of Physical Properties of Rocks and Minerals; CRC Press: Boca Raton, FL, USA, 2018. [Google Scholar]
Figure 1. Sample preparation procedure for sphalerite, galena, and pyrite samples.
Minerals 13 00615 g001
Figure 2. XRD diffractograms for monomineralic samples: (a) pyrite; (b) galena; (c) sphalerite.
Minerals 13 00615 g002aMinerals 13 00615 g002b
Figure 3. Particle size distributions for galena (Gn), pyrite (Py), and sphalerite (Sph) samples.
Minerals 13 00615 g003
Figure 4. Upgraded Denver flotation setup: (a) Denver cell photo with builds on; (b) 3D model of interior current pacifiers, under-froth grid, level float, and froth crowder at the back.
Minerals 13 00615 g004
Figure 5. Monomineralic flotation workflow.
Minerals 13 00615 g005
Figure 6. Foam stability measurement setup.
Minerals 13 00615 g006
Figure 7. Flotation responses of galena, sphalerite, and pyrite at pH 9, 10 °C, and 30 °C: (a) kinetic yield curves; (b) distributions of flotation rate constants.
Minerals 13 00615 g007
Figure 8. Distributions of flotation rate constants at 10 °C and 30 °C for pH 9 and 11: (a) galena; (b) pyrite; (c) sphalerite.
Minerals 13 00615 g008
Figure 9. Top froth maximum bubble size versus flotation time for at 10 °C and 30 °C for: (a) galena; (b) pyrite; (c) sphalerite.
Minerals 13 00615 g009
Figure 10. Galena flotation main effects and interaction plots: (a) main effects plot for galena recovery; (b) interaction plot for galena recovery; (c) main effects plot for water recovery; (d) interaction plot for water recovery.
Minerals 13 00615 g010
Figure 11. (a) The Pareto chart for galena ( γ g ) and water yields ( γ g w ); (b) water recovery versus galena yield at different pH and temperatures.
Minerals 13 00615 g011
Figure 12. Pyrite flotation main effects and interaction plots: (a) main effects plot for pyrite recovery; (b) interaction plot for pyrite recovery; (c) main effects plot for water recovery; (d) interaction plot for water recovery.
Minerals 13 00615 g012
Figure 13. (a) Pareto chart for pyrite ( γ p ) and water yields ( γ p w ); (b) water recovery versus pyrite yield at different pH and temperatures.
Minerals 13 00615 g013
Figure 14. Sphalerite flotation main effects and interaction plots: (a) main effects plot for sphalerite recovery; (b) iInteraction plot for sphalerite recovery; (c) main effects plot for water recovery; (d) interaction plot for water recovery.
Minerals 13 00615 g014
Figure 15. (a) The Pareto chart for sphalerite ( γ s ) and water yields ( γ s w ); (b) water recovery versus sphalerite yield at different pH and temperatures.
Minerals 13 00615 g015
Figure 16. Pareto chart of standardized effects of model terms on: (a) foam height; (b) foam half-life time.
Minerals 13 00615 g016
Figure 17. Contour plots of foam half-life time in: (a) temperature versus aeration coordinates; (b) temperature versus pH coordinates; (c) temperature versus MIBC coordinates.
Minerals 13 00615 g017
Figure 18. Contour plots of foam height in: (a) temperature versus aeration coordinates; (b) temperature versus pH coordinates; (c) temperature versus MIBC coordinates.
Minerals 13 00615 g018
Figure 19. Loading plots for foam stability responses, temperature, and pH, and flotation responses of: (a) galena; (b) pyrite; (c) sphalerite.
Minerals 13 00615 g019
Table 1. Mineralogical composition of pyrite, galena, and sphalerite samples.
Pyrite SampleGalena SampleSphalerite Sample
Mineralwt.%Mineralwt.%Mineralwt.%
Pyrite94.2Galena95.4Sphalerite92.0
Corundum1.0Fluorite0.7Galena2.4
Hematite1.1Cerussite3.8Albite2.5
Marcasite1.4 Calcite1.6
Anatase2.3 Quartz1.5
Table 2. Central composite design of experimental levels.
VariablesSymbolTested Levels
Lowest Level
(−β)
Highest Level
(+β)
Temperature, °Cx1545
pHx2812
MIBC dosage, ppmx31050
SIPX dosage, ppmx410170
Superficial gas velocity (Jg), cm/sx50.10.9
Table 3. Responses of galena, pyrite, and sphalerite flotation systems under the investigated general factorial design.
RunUncoded VariablesGalena ResponsesPyrite ResponsesSphalerite Responses
pHT, °C γ g γ g w γ p γ p w γ s γ s w
19.030.031.812.04.515.337.721.9
211.030.014.112.86.822.214.518.8
39.040.023.67.52.66.99.611.7
411.010.029.538.920.844.926.247.9
511.020.025.621.311.538.52024.8
69.040.026.88.01.68.599.9
711.040.010.67.03.76.34.710.1
811.040.011.56.64.28.64.39.8
99.020.066.322.811.330.152.229.4
1011.020.024.720.512.238.322.426.3
119.020.066.925.010.830.253.530.6
129.010.090.848.028.145.877.644
1311.030.015.514.04.718.615.319.5
149.010.088.646.423.837.37744.5
159.030.035.015.32.715.236.519.8
1611.010.028.236.219.340.424.246.1
Table 4. General full factorial model summary for galena flotation responses (summary of ANOVA for regression galena flotation model).
F-Valuep-Value R 2 R a d j 2 SD 1
γ g γ g w γ g γ g w γ g γ g w γ g γ g w γ g γ g w
764.89764.890.0000.00099.85%99.52%99.72%99.10%1.391.32
Notes: 1 SD—standard deviation.
Table 5. General full factorial model summary for pyrite flotation responses (summary of ANOVA for regression pyrite flotation model).
F-Valuep-Value R 2 R a d j 2 SD 1
γ p γ p w γ p γ p w γ p γ p w γ p γ p w γ p γ p w
77.5961.030.0000.00098.55%98.16%97.28%96.55%1.382.66
Notes: 1 SD—standard deviation.
Table 6. General full factorial model summary for pyrite flotation responses (summary of ANOVA for regression pyrite flotation model).
F-Valuep-Value R 2 R a d j 2 SD 1
γ s γ s w γ s γ s w γ s γ s w γ s γ s w γ s γ s w
1337.60401.170.0000.00099.91%99.72%99.84%99.47%0.950.98
Notes: 1 SD—standard deviation.
Table 7. Foam stability central composite design results.
RunCoded VariablesFoam Stability Responses
x1x2x3x4x5 H f , mm t ½ , s
1−1−111133.12.7
20020015.12.6
30000012.31.6
4−11−11132.32.7
50000012.51.6
600−20011.71.3
71111117.61.5
811−1−1119.91.0
90000−250.0
10−1−1−1−1130.42.4
111−111−18.91.1
121−1−11113.91.0
13−1111−110.82.2
142000011.11.0
1511−11−17.91.2
160000011.21.6
170200017.41.6
18−1−11−1−19.72.3
1900000131.6
2000020141.3
210−200011.61.5
221−1−1−1−17.91.2
230000010.81.5
24−1−1−11−18.42.9
25111−1−17.61.8
26−111−11362.2
27000−2012.92.0
28−2000028.33.1
2900002311.9
30−11−1−1−17.62.3
311−11−1112.71.2
320000011.71.5
Table 8. Summary of CCD models’ goodness of fit and ANOVA.
F-Valuep-Value R 2 R a d j 2 SD 1
γ s γ s w γ s γ s w γ s γ s w γ s γ s w γ s γ s w
1337.60401.170.0000.00099.91%99.72%99.84%99.47%0.950.98
Notes: 1 SD—standard deviation.
Disclaimer/Publisher’s Note: The statements, opinions and data contained in all publications are solely those of the individual author(s) and contributor(s) and not of MDPI and/or the editor(s). MDPI and/or the editor(s) disclaim responsibility for any injury to people or property resulting from any ideas, methods, instructions or products referred to in the content.

