Article

Magnetostratigraphy of Early Oligocene-Middle Miocene Deposits in the Xunhua Basin on the Tibet Plateau, China, and Their Paleoclimate Significance

1
Key Laboratory of Western Mineral Resources and Geological Engineering, Ministry of Education of China, The School of Earth Science and Resources, Chang’an University, Xi’an 710054, China
2
State Key Laboratory of Loess and Quaternary Geology, Institute of Earth and Environment, Chinese Academy of Sciences, Xi’an 710061, China
*
Author to whom correspondence should be addressed.
Minerals 2023, 13(5), 671; https://doi.org/10.3390/min13050671
Submission received: 27 February 2023 / Revised: 9 May 2023 / Accepted: 10 May 2023 / Published: 13 May 2023

Abstract

:
The growth history of the Tibetan Plateau provides a valuable natural laboratory to understand tectonic processes of the India–Asia collision and their impact on and interactions with Asian and global climate change. However, both Tibetan Plateau growth and Asian paleoenvironments are generally poorly documented in pre-Pliocene times and reflect limited temporal coverage for different parts of the plateau. In this paper, the 238 m thick Cenozoic sediments in the Hongzhuang section of the Xunhua Basin were tested and analyzed via paleomagnetic and environmental magnetic methods. The formation age was determined, and the evolution history of the regional climate environment was analyzed. The magnetostratigraphy study shows that the sediments record a continuous sequence of geomagnetic polarity changes from C5ACn to C10r, which spans an interval of approximately 30~14.3 Ma from the early Oligocene to the middle Miocene. The magnetic susceptibility of the Hongzhuang section is basically similar to the deep-sea oxygen isotope fluctuation, indicating that the monsoon climate change indicated by the magnetic susceptibility is affected by global temperature. It is worth noting that at ~27 Ma and ~15 Ma, there is a negative correlation between magnetic susceptibility and deep-sea oxygen isotope, and magnetic susceptibility lags behind the increase in deep-sea oxygen isotope. Combined with the change in the sedimentary rate curve, we explain the asynchrony between the magnetic susceptibility and the deep-sea oxygen isotope around ~27 Ma and ~15 Ma. As the uplift of the plateau leads to the enhancement of the East Asian summer monsoon, the soil formation in the region is strengthened, resulting in an increase in magnetic susceptibility. At the same time, the rapid uplift of the plateau caused the erosion of the surrounding mountains to strengthen, and the input of near-source materials may promote the increase in magnetic susceptibility.

1. Introduction

The timing of the growth of the Tibetan Plateau has profound implications for understanding the mechanics of continental deformation and associated regional and global climatic changes in the Cenozoic. Climate studies have suggested that the appearance of the monsoonal system in East Asia and the onset of central Asian desertification may be related to Cenozoic Tibetan Plateau uplift and withdrawal of the Paratethys Sea [1,2]. The environmental effects of plateau uplift and its impact on Asian monsoon and Asian inland aridification, development, and the corresponding driving mechanism are crucial issues in the field of paleoclimate research [3,4,5]. The influence of plateau uplift on the formation of Asian monsoons and the aridification of Asian inland has been widely recognized; however, there are great differences in the process and age of plateau uplift, leading to different views on the scope and intensity of its impact on the surrounding environment [5,6,7,8,9,10]. To further constrain the surface uplift history of the Qinghai-Tibet Plateau and its relationship with the Asian climate change, more precise age constraints on the plateau growth and paleoenvironmental evolution from different parts of the plateau are still required. There are also many viewpoints on the evolution process and the formation mechanism of Asian monsoons and Asian inland droughts. At the same time, the deep-sea oxygen isotope clearly records changes in global temperature since the Cenozoic era, and many climate change events have occurred. From the warm period without ice sheet at both poles to the cold period with ice sheet at both poles today, global temperature fluctuations have decreased [11,12,13,14]. At the same time, a strong geological tectonic event also occurred on the northeastern margin of the Qinghai-Tibet Plateau during the Oligocene to the Miocene [15,16,17]. Studies have shown that during this period, multi-stage northeastward accretion events occurred in the northeast margin of the Tibet Plateau. Pares et al. believe that plateau uplift during the Oligocene period has affected the northeast margin of the Qinghai-Tibet Plateau [18], and a rapid uplift event in the northeast margin of the Qinghai-Tibet Plateau from 20 Ma to 25 Ma [16]. By comparing the isotopes in the sediments of the surrounding basins, it is found that the Laji Mountain began to uplift rapidly at 16~11 Ma [19]. The uplift of the Tibetan Plateau has increased the complexity of climate change while global temperature fluctuations have declined. In the past ten years, domestic and foreign scholars have established the magnetic polarity chronology framework of sediments in some basins in the northeastern Qinghai-Tibet Plateau via magnetic stratigraphy. On this basis, the uplift process and climate change in the plateau are discussed through sedimentary records [20,21]. Here, we report a well-dated sedimentary record from the Hongzhuang section of Xunhua Basin at the northeastern margin of the Tibetan Plateau (Figure 1a,b). It deposited a set of continuous red clay sediments from the early Oligocene to the middle Micene, and the area is located in the East Asian monsoon area, the Central Asian arid area, and the northeastern margin of the Qinghai-Tibet Plateau. The intersection area provides a complete climate evolution process. In this study, we present a detailed magnetostratigraphy and magnetic susceptibility the sedimentary record of the Xunhua Basin in order to better understanding of the Oligocene to Miocene tectonism and paleoenvironments of the northeastern margin Tibetan Plateau.

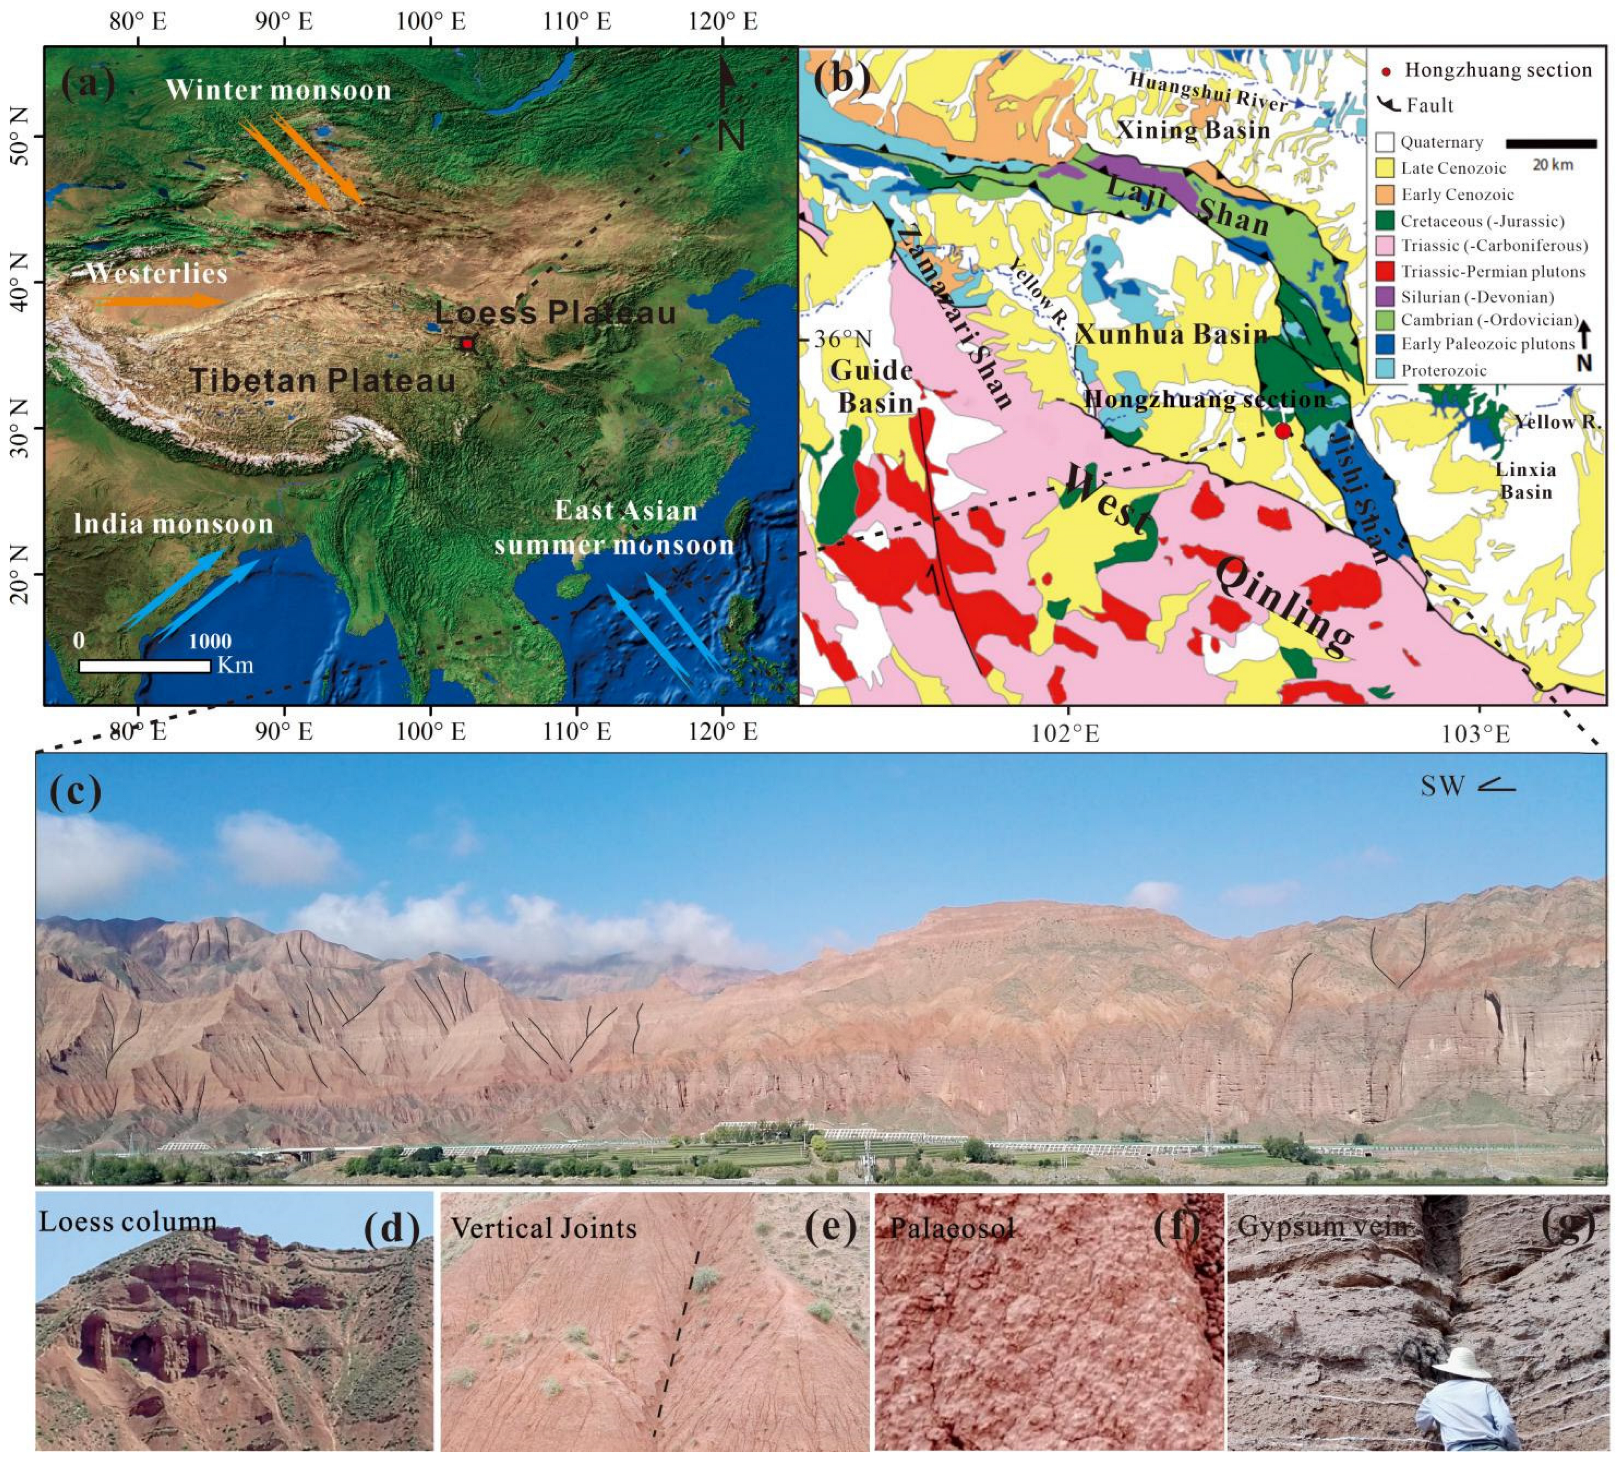
2. Geological Setting and Section Lithology

The Xunhua Basin is located on the northeastern Tibetan Plateau in a climatically sensitive area, representing the transitional zone between the monsoonal coastal region to the east and the arid continental interior to the west (Figure 1a,b). Affected by tectonic uplift, a compressional basin based on the Cretaceous ancient basin was formed. The Xunhua Basin and the Xining Basin on the north side are separated by the Laji Mountain. The east side is opposite to the Linxia Basin, and the west side is the Dehenglong Uplift and the Jianzha Basin. The main faults around the basin include the northern margin fault zone of West Qinling, Jishishan fault zone and Lajishan fault zone. Xunhua Basin is located in a climate-sensitive area, which is a transition area between the eastern monsoon region and the arid region of Central Asia. The basin is located in mid latitudes, in a semi-arid region in which the mean annual temperature is ~8.5 °C and the mean annual precipitation is 264 mm, of which ~75% falls as monsoonal rain during the summer.
The Cenozoic strata of Xunhua Basin and surrounding basins were divided in detail; however, no unified division standard has been formed. The strata from the Oligocene to the Miocene were divided from old to new into Pingguo Formation, Anda Formation, Charang Formation, Lower Dongshan Formation and Herga Formation [23]. In Linxia basin, Xiaomin et al. divided the strata from the Oligocene to the Miocene from the old to the new ones into Tara Formation, Zhongzhuang Formation, Shangzhuang Formation, Dongxiang Formation and Liushu Formation [24]. In Xunhua Basin, Zhang Kexin et al. redivided the strata from old to new into Tara Formation, Xianshuihe Formation Linxia Formation and Jishi Formation [25]. By comparing the lithology and strata with the surrounding basins, this paper adopts the division standard of Zhang Kexin et al. to divide the Cenozoic strata of Hongzhuang section from old to new into Tara Formation, Xianshuihe Formation.
The Hongzhuang section is located near Hongzhuang Village (35°48′40″ N, 102°33′24″ E), approximately 10 km southeast of the main urban area of Xunhua County (Figure 1b). The thickness of the whole section is 240 m, and the stratum is roughly horizontal. The Cenozoic strata are continuous and well-exposed, and are in angular unconformity contact with the underlying Cretaceous Hekou Formation. This section consists of the Cretaceous Hekou Formation, the Paleogene Tala Formation and the Neogene Xianshuihe Formation (Figure 2). According to field observation, Hongzhuang section is mainly composed of red clay, which can be divided into three lithologic subfacies from bottom to top (240–0 m): (1) 240–238 m, which is a purple sandy conglomerate of the early Cretaceous Hekou Formation. (2) 238–106.8 m, which is the alternating deposition of the Oligocene Tala Formation eolian red clay and fluvial sandy conglomerate, including a small amount of gray gravel deposition and gray black mudstone. The conglomerate is well-rounded and mainly composed of fine gravel. The eolian clay debris developed loess columns, vertical joints developed well, and gullies developed along the vertical joints (Figure 1d,e), which is very similar to the sedimentary characteristics of palaeosol on the Chinese Loess Plateau (Figure 1f), and these sedimentary characteristics have been confirmed to be the result of eolian genesis [26]. However, Figure 1f shows a poorly developed paleosol in the Miocene compared to the Quaternary paleosol. (3) 106.8–0 m, it is the alternating deposition of eolian red clay and fluvial–lacustrine facies in the Miocene Xianshuihe Formation. The lower part is mainly eolian deposits, and the grain size of the sediments gradually becomes coarser and coarser upwards, turning into fluvial–lacustrine deposits. At 54 m, a thin layer of gypsum and eolian red clay began to appear (Figure 1g).

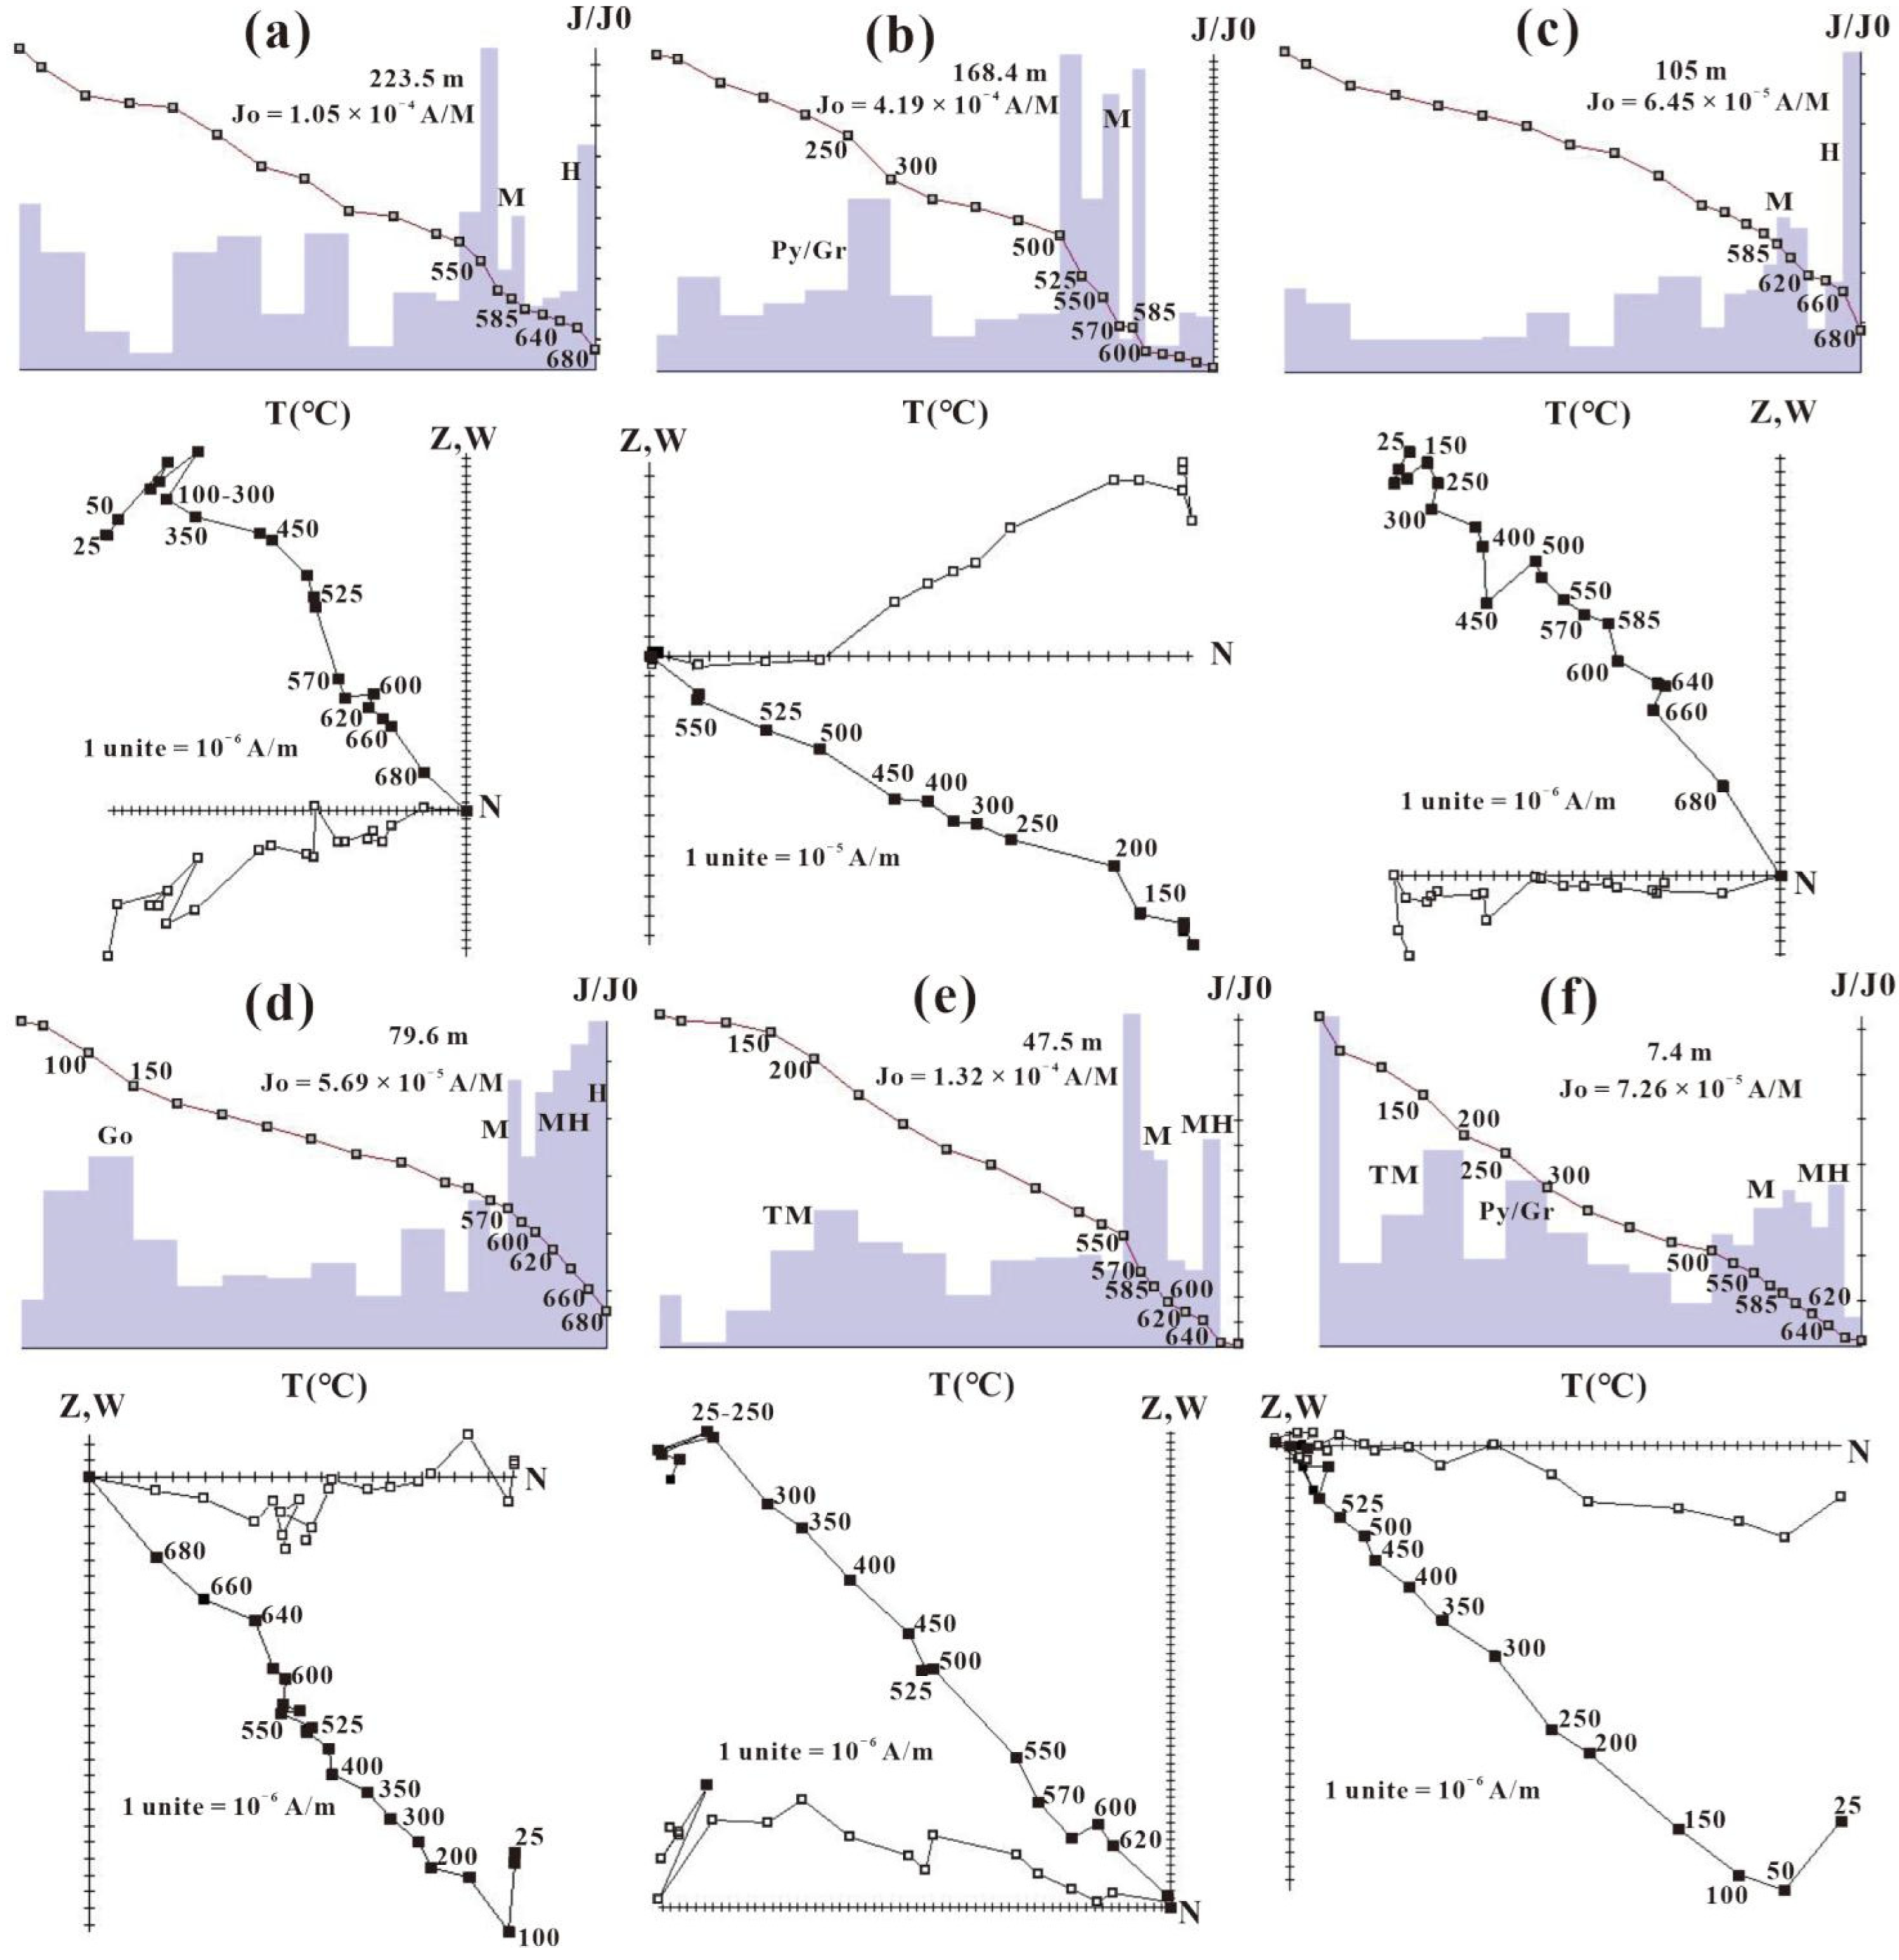
3. Materials and Methods

On the Hongzhuang section, approximately 1177 powder samples were collected every 20 cm for the measurement of rock magnetism. Additionally, 983 orientated block samples with a size of 10 × 10 × 10 cm3 were collected at 20 cm intervals for paleomagnetic measurements. No samples were obtained in the gravel layer with a total thickness of approximately 35 m.
According to experimental requirements, the Bartington MS2 magnetic susceptibility (producing areas: BARTINGTON Company, London, UK) instrument was used to measure the low frequency (470 Hz) and high frequency (4700 Hz) of the powder magnetic susceptibility samples dried at low temperature. Frequency susceptibility is calculated by the difference in mass susceptibility (χfd = χlf − χhf) and the percentage content of mass susceptibility ((χlf − χhf)/χlf × 100%). The paleomagnetic samples were processed into cubes of 2 × 2 × 2 cm3. The thermal demagnetization of the test sample was carried out in a TD-48 thermal demagnetization furnace produced by American Satellite Corporation (ASC) for approximately 19 steps. The thermal demagnetization spacing is 50 °C below 500 °C, the demagnetization temperatures of 500~600 °C are 525 °C, 550 °C and 585 °C, the demagnetization spacing above 600 °C is 20 °C, and the highest demagnetization temperature is 680 °C. The residual magnetic samples were measured on a 2G-760U channel superconducting magnetometer (producing areas: the United States). The demagnetization results were analyzed using Zijderveld’s orthogonal graph method [27], and the direction of characteristic remanence was calculated using Kirschvink’s least squares fitting technique [28]. The above tests were carried out in the magnetic shielding space (less than 300 nT) of the Environmental Magnetic Laboratory of the Institute of Earth Environment, Chinese Academy of Sciences. Data processing uses CorelDRAW 2019, PMage31b2 and Origin 2022 versions.

4. Results

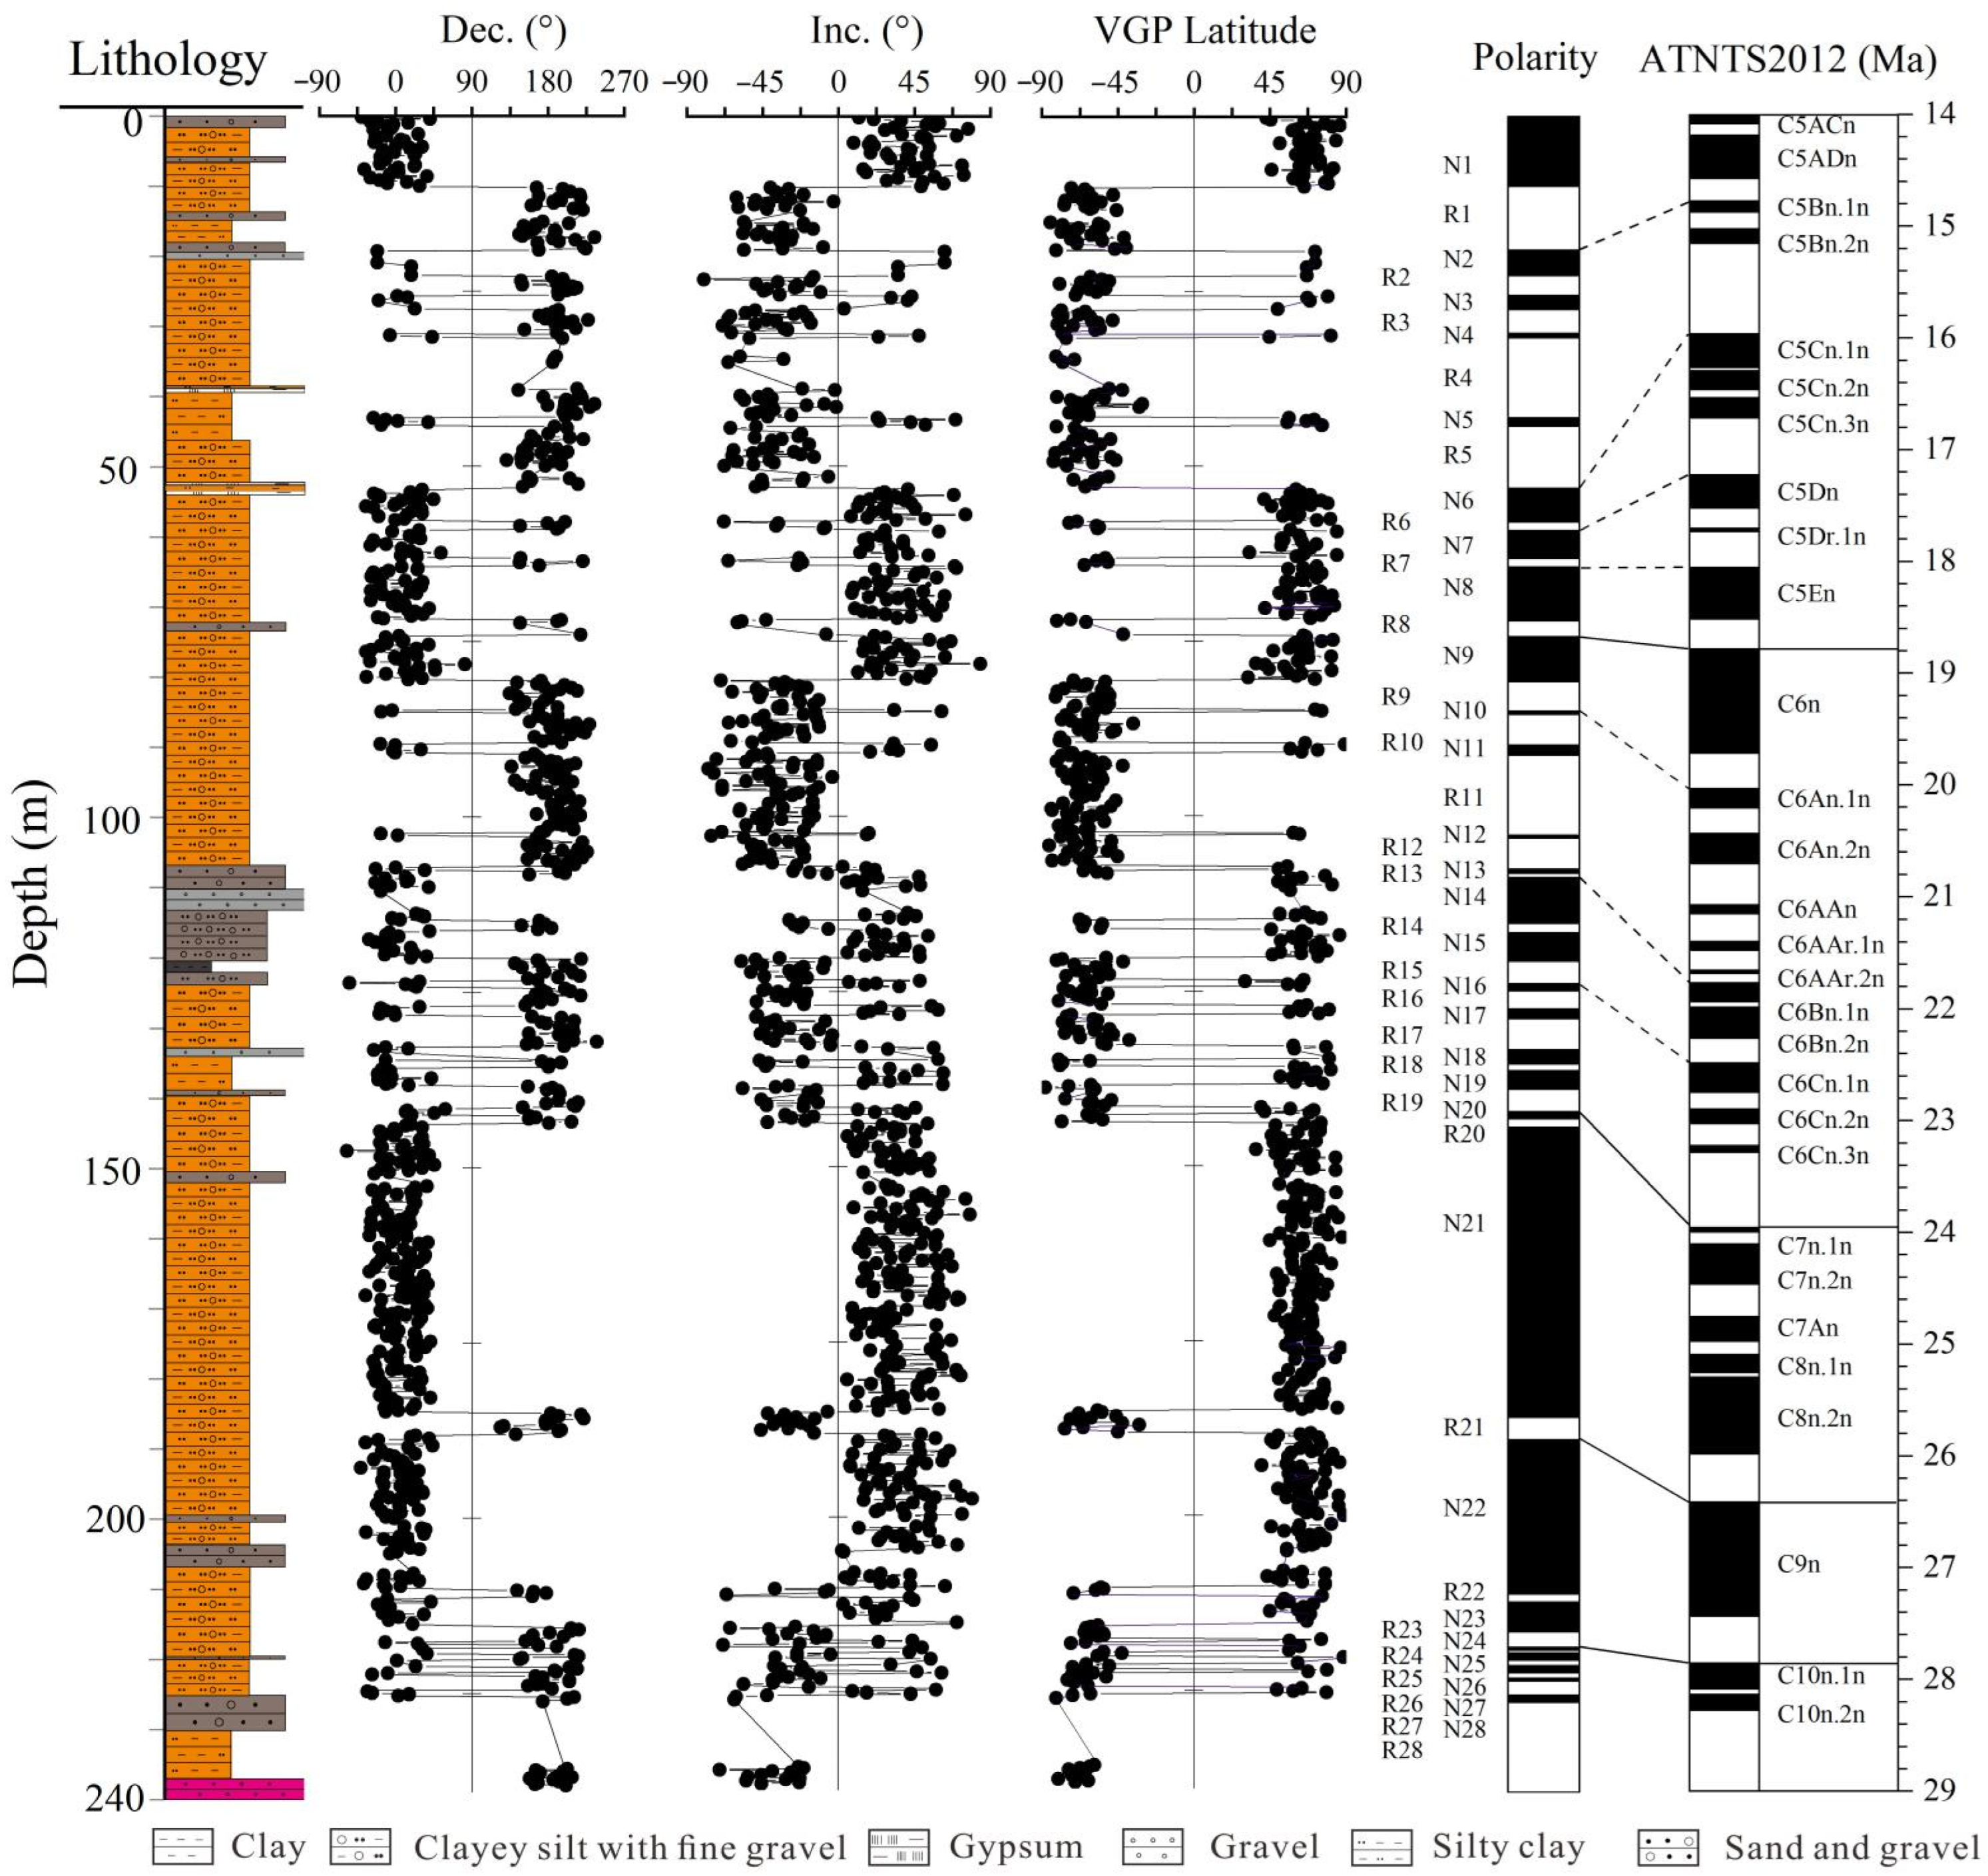
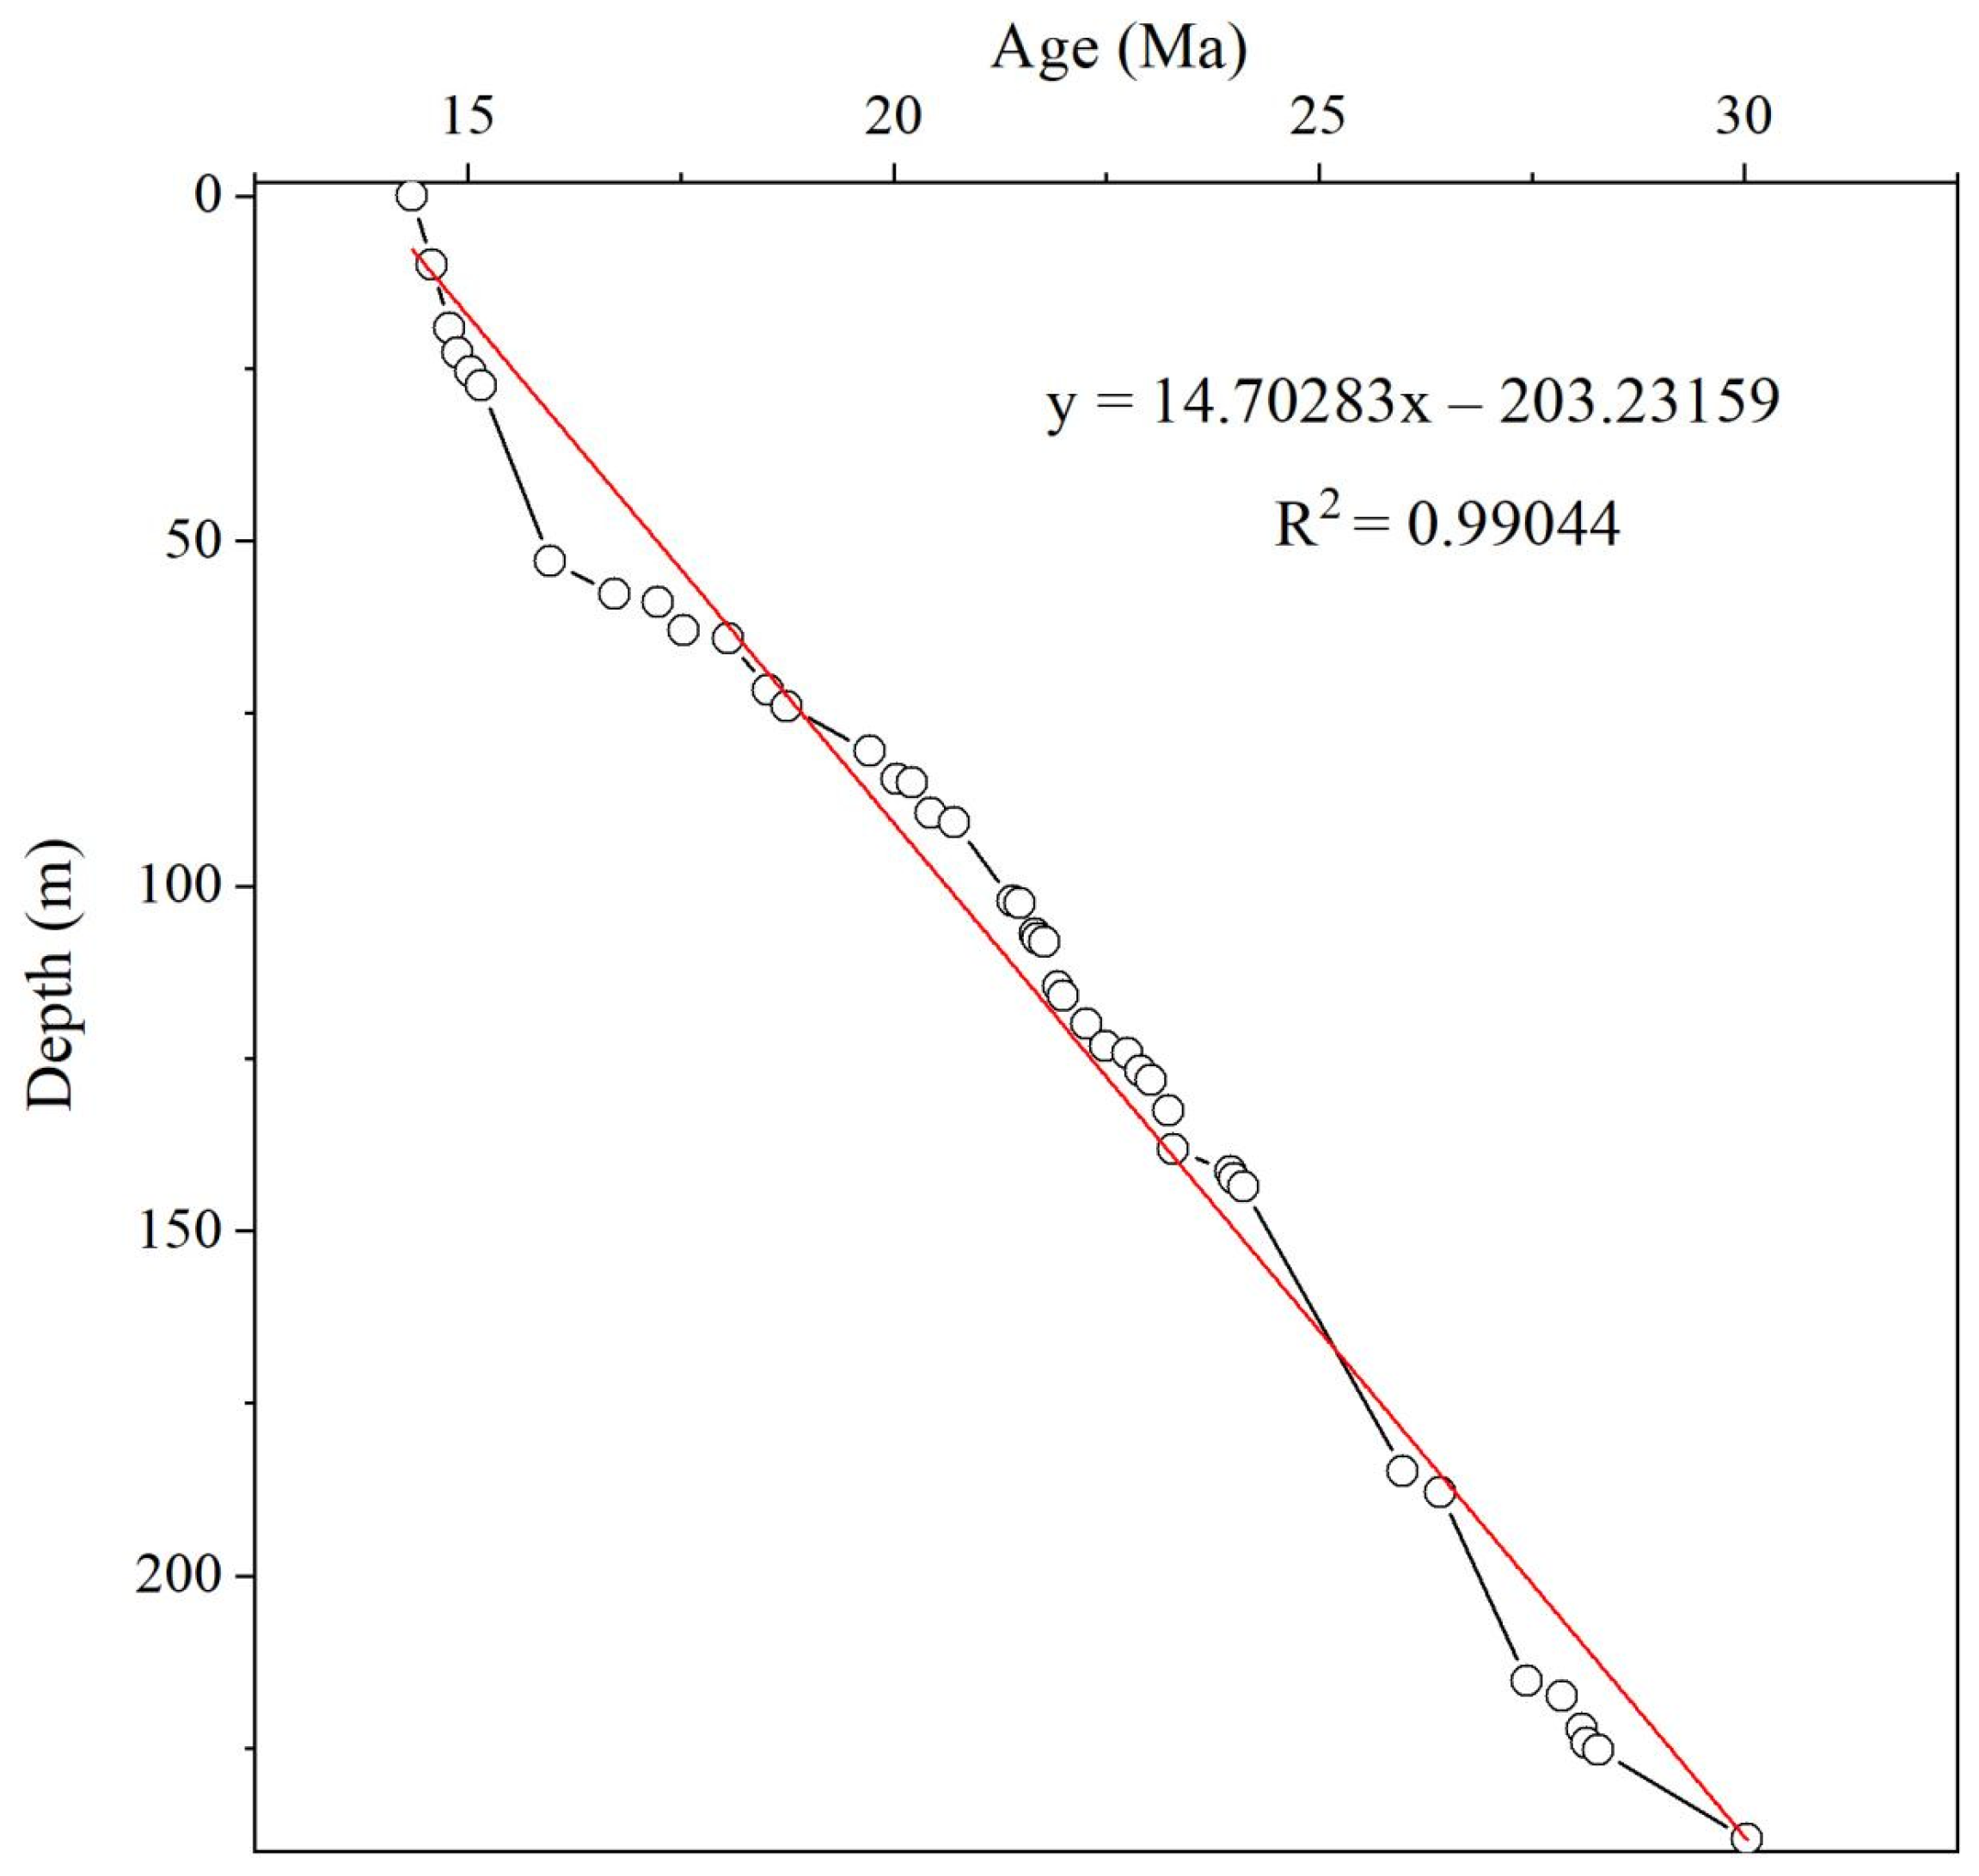
4.1. Magnetostratigraphy

The natural remanent magnetization(NRM) of the samples in the Hongzhuang profile ranges from 4.5 × 10⁻⁴ to 7.5 × 10⁻⁵ A/m, and Figure 3 is a partial representative thermal demagnetization map. Most samples exhibit simple demagnetization behaviour. Between 100 °C and 150 °C and between 150 °C and 200 °C, many samples exhibit a significant decrease in magnetization accompanied by a change in the remanence direction that probable indicates the removal of a secondary remanent magnetization (SRM)carried by goethite and titanomagnetite, respectively (Figure 3d–f). In addition, most of the samples exhibit a low unblocking temperature component that is removed at 250 °C (Figure 3). Above this temperature, a characteristic remanent magnetization (ChRM) is clearly isolated and decays almost linearly to the origin. Two distinct and rapid reductions in magnetization were observed in most samples, at approximately 585 °C and 660–680 °C, indicating the presence of magnetite and haematite, respectively, and which are the major ChRM carriers (Figure 3) [29]. It is worth noting that some samples show a significant rapid decline trend at 200 °C, 300 °C and 640 °C. According to the Curie temperature of related minerals, we believe that it may indicate the presence of titanomagnetite, pyrrhotite or greigite, and maghemite [30,31,32,33].
In the process of establishing the magnetic stratigraphic column, at least four consecutive points in the orthogonal diagram are used to ensure that the maximum angular deviation direction (MAD) of the characteristic remanence is less than 15°, so as to calculate the direction of the characteristic remanence. The anomalies and transition points with a VGP absolute value of less than 45° were removed. Among the 983 paleomagnetic samples tested, 863 samples (88%) provided a reliable characteristic remanence direction, and the paleomagnetic polarity was determined by the characteristic remanence direction. The test results show that the profile records the time scale correlation between the established Hongzhuang section magnetic polar column and the standard polar column at 28 positive polarity and 28 negative polarity, and records the continuous magnetic polarity sequence of C5ACn~C10r (Figure 4) [34]. Using the age limit of the magnetic stratigraphic column, the deposition rate of the strata near the polarity reversal is inferred, and the age span of the profile can be calculated to be 30~14.3 Ma. The relationship between stratigraphic age and sedimentary depth is well-fitted, which proves the effectiveness of the magnetic polar column of the Hongzhuang section (Figure 5).

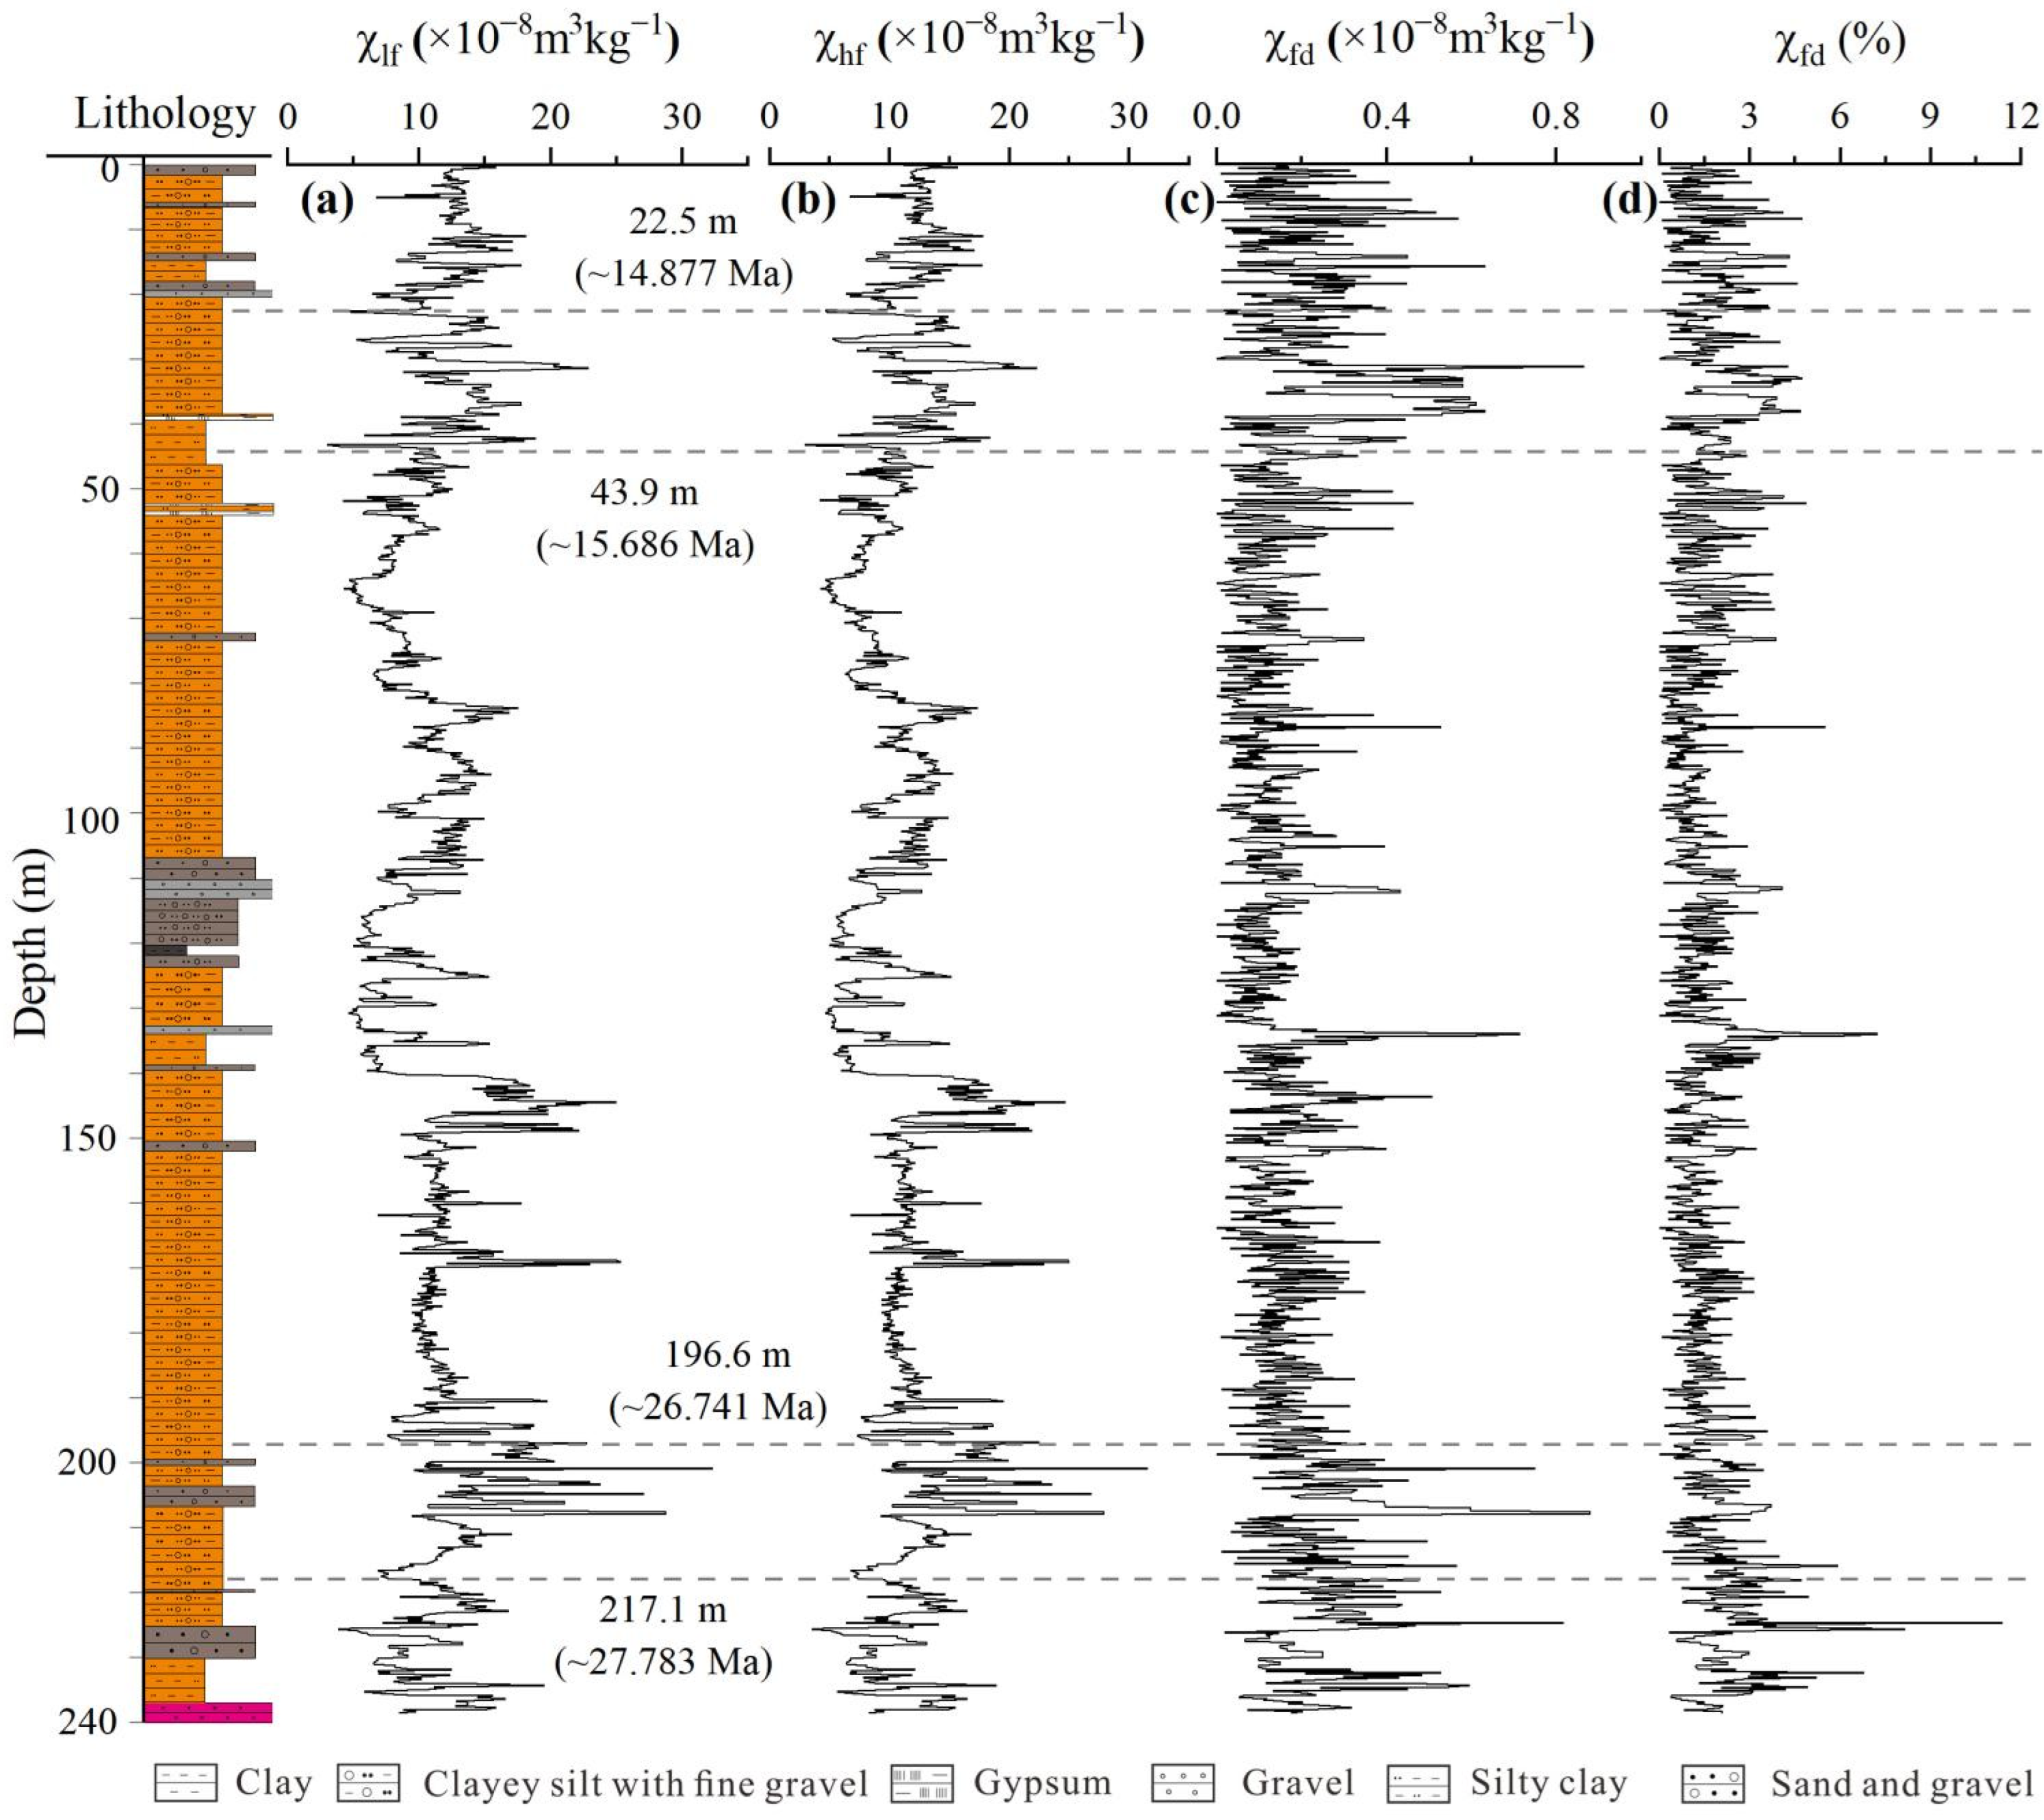
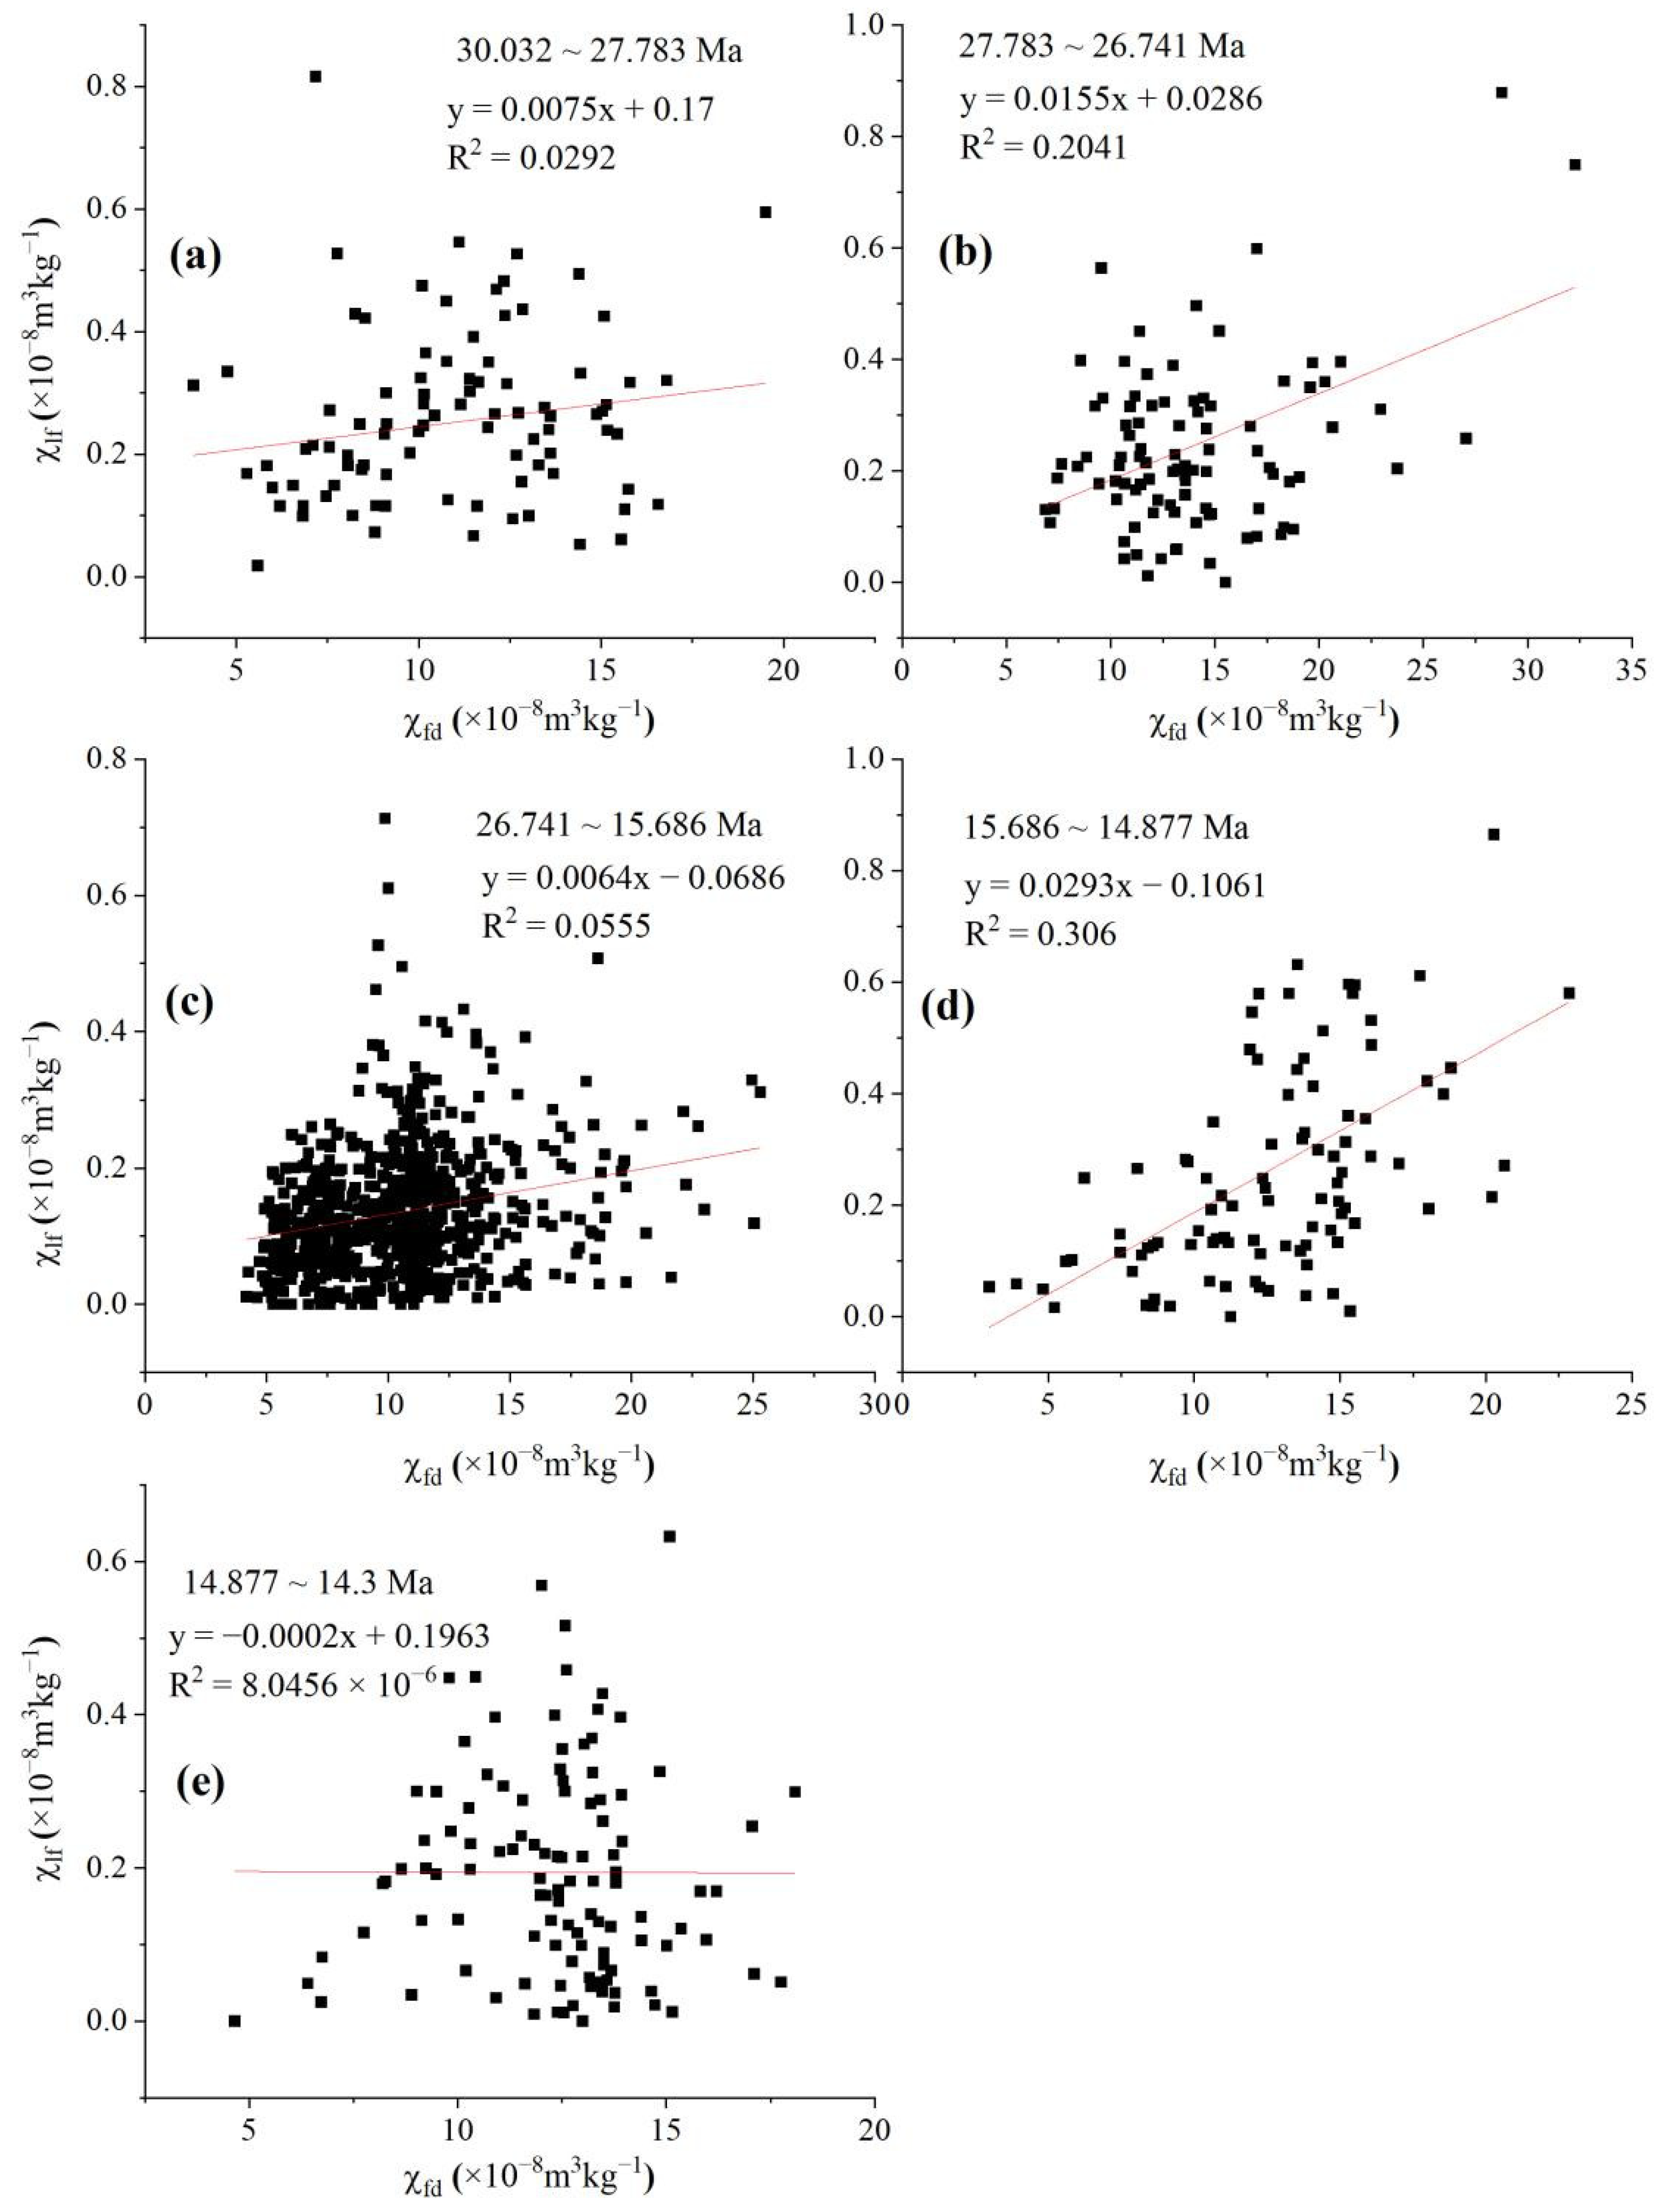
4.2. Magnetic Susceptibility

Figure 6 shows that the low-frequency magnetic susceptibility (χlf) of Hongzhuang section fluctuates between 2.9 × 10⁻⁸ and approximately 32.3 × 10⁻⁸ m3/kg, and the high-frequency magnetic susceptibility(χhf) fluctuates between 2.9 × 10⁻⁸ and approximately 31.5 × 10⁻⁸ m3/kg, and the overall fluctuation trend and microscopic trough peaks are very similar. At the same time, there are obvious high value areas near 27 Ma, 24 Ma and 15 Ma, and there is a step-like rapid downward trend around 23.8 Ma (Figure 6a,b). Compared with the good corresponding relationship between χhf and χlf, the corresponding relationship between frequency magnetic susceptibility (χfd) and the percentage content of frequency magnetic susceptibility (χfd%) and low frequency magnetic susceptibility (χlf) is not obvious, and the percentage content of frequency magnetic susceptibility (χfd%) and frequency magnetic susceptibility (χfd) is relatively low, the change trend is not obvious, and some values approach or equal to zero (Figure 6c,d). This indicates that the content of superparamagnetic particles affecting the magnetic strength of the Hongzhuang section is very small [29]. However, from the piece-wise linear fitting plot of low frequency susceptibility (χlf) and frequency susceptibility percentage content (χfd%), it can be seen that there are obvious differences in the contribution rate of superparamagnetic particles in different periods (Figure 7). The linear fitting relationship between magnetic susceptibility and frequency magnetic susceptibility at approximately 27 Ma and 15 Ma (Figure 7b,d) is significantly improved compared with other stages (Figure 7a,c,e). It shows that the contribution rate of superparamagnetic particles increased significantly in these two periods. It can also be found in Figure 6a,c that the frequency magnetic susceptibility and magnetic susceptibility increase synchronously at approximately 27 Ma and 15 Ma. Superparamagnetic particles are closely related to soil formation. The higher the temperature and humidity of the climate, the longer the duration, the more fine-grained ferromagnetic minerals are formed. On the Chinese Loess Plateau, the frequency magnetic susceptibility of paleosol is higher and the frequency magnetic susceptibility of loess is lower and shows a positive correlation with the change in magnetic susceptibility [36]. The frequency magnetic susceptibility, which has a clearer indication of paleoclimate, can not only reflect the large-scale climate change similar to the magnetic susceptibility record, but is also sensitive to the weak climate fluctuation that cannot be clearly indicated by the magnetic susceptibility [37]. It is considered to be an ideal proxy index to reflect the intensity of soil formation. Therefore, we believe that the increase in correlation coefficient R2 and frequency magnetic susceptibility at approximately 27 Ma and 15 Ma represents the increase in superparamagnetic particles and the enhancement of soil formation.

5. Discussion

The change in magnetic susceptibility of the loess–paleosol sequence in the Loess Plateau of China has been shown to reflect the intensity of the East Asian monsoon and can be used as a quantitative index for the inversion of paleoprecipitation [38,39]. However, under different climatic conditions, the characteristics of environmental magnetic parameters are very different. Due to the high water content in the soil, the magnetic minerals of the strongly developed paleosol are transformed into weak magnetic minerals, resulting in a decrease in magnetic susceptibility [40]. The eolian sediments in the Xining basin have weak pedogenesis due to local climate drought, which makes frequency susceptibility low and stable [41]. More research evidence has shown that the magnetic susceptibility of surface soil sediments is controlled by changes in regional precipitation. The magnetic characteristics of sediments in different climatic zones are also different [42,43]. When the annual precipitation in the region is less than 300 mm, the superparamagnetic particles produced in the sediments are less due to the low soil formation, and the contribution rate of coarse debris magnetic particles to the sediments is larger. When the annual precipitation in the region is greater than 300 mm, the magnetic susceptibility of the surface sediments will increase with increasing precipitation, and soil formation will also increase, showing the increase in frequency magnetic susceptibility (the increase in superparamagnetic magnetic particles in the sediments). However, when the precipitation reaches more than 1000 mm, the situation has changed. Due to excessive precipitation, the water content of the sediment is too high, so the magnetic minerals in the sediment undergo a reduction reaction, which reduces the magnetic strength of the sediment [44,45,46]. At the same time, the effect of temperature on soil formation is also very obvious. When the temperature is low, the soil formation is low, and the superparamagnetic magnetic particles produced in the sediment are less. When the temperature is high, the opposite is true [47,48]. In summary, magnetic susceptibility and other related environmental magnetic indicators are controlled by regional annual precipitation and regional temperature.
The magnetic strength of sediments is not only controlled by the annual precipitation in the region, but also related to the amount of magnetic minerals input from the sediment source. During the active period of the structure, the terrain height difference changes drastically, and the sediments are quickly brought to the sedimentary basin for deposition, which brings a large amount of magnetic material input, and its ferromagnetic material cannot be fully oxidized, resulting in more magnetite with stronger magnetic strength in the sediments. In the period of relatively stable structure, the sediment has undergone a sufficient oxidation process before reaching the sedimentary area, resulting in the formation of hematite with relatively weak magnetic strength [49]. The above research shows that the tectonic uplift also controls the magnetic susceptibility. Recent studies of magnetic stratigraphy and paleostratigraphy in the Qaidam Basin show that two intense tectonic deformations occurred during the Oligocene to Middle Miocene [50,51,52]. Zhang Kexin et al. found a large number of unconformity surfaces in the plateau and surrounding basins around 25 Ma, indicating the dramatic uplift of the plateau during this period [25]. Yin et al. believe that the East Kunlun orogenic belt was rapidly uplifted around 29 to 24 Ma [53]. Pares et al. believe that the plateau uplift during the Oligocene period has affected the northeastern margin of the Qinghai-Tibet Plateau [18]. The uplift event at approximately 20 to 25 Ma recorded at the Xining basin and the rapid denudation event in the source area of Linxia basin was recorded by the apatite fission track at approximately 14 Ma [16,54]. The uplift of the Tibetan Plateau will lead to the increase in land–sea thermal contrast, which will promote the increase in monsoon precipitation in China. In particular, the northward and outward expansion of the Tibetan Plateau has been proved to strengthen the intensity of the East Asian summer monsoon and make it deep into the inland [55,56]. Based on the above points, the change in magnetic susceptibility is closely related to the East Asian summer monsoon and the uplift of the Qinghai-Tibet Plateau.
As shown in Figure 8, the deposition rate, low-frequency magnetic susceptibility and frequency magnetic susceptibility of the Hongzhuang section are compared. In order to facilitate the comparison, we added the deep-sea oxygen isotope change curve (Figure 8a) [14] and the magnetic susceptibility curve of the aeolian sediments in the Zhuanglang area(Figure 8b) [26]. The deposition rate of the study area at approximately 27 Ma, 22 Ma and 15 Ma is obviously accelerated (Figure 8e), which is interpreted as a series of expansion events in the northeast direction of the Tibetan Plateau. By comparing the magnetic susceptibility (Figure 8d) with the deep-sea oxygen isotope (Figure 8a), it can be seen that except for the time periods around 27 Ma and 15 Ma, both the overall change trend and the local micro-fluctuations show a good correspondence, showing a good positive correlation. It can be explained that the intensity of the East Asian summer monsoon is mainly controlled by global temperature. It is worth noting that the negative correlation between magnetic susceptibility and deep-sea oxygen isotope and the phenomenon that magnetic susceptibility lags behind the increase in deep-sea oxygen isotope appear at approximately 27 Ma and 15 Ma, respectively (Figure 8). Combined with Figure 7, it can be seen that the fitting relationship between magnetic susceptibility and frequency magnetic susceptibility at approximately 27 Ma and 15 Ma is significantly better than other time periods, indicating that the soil formation in the two periods is strong, especially at approximately 15 Ma. The magnetic susceptibility of the profile and Zhuanglang red clay showed a significant upward trend, showing a good positive correlation, and the latter’s research has confirmed that the East Asian monsoon was significantly enhanced at approximately 16 Ma, and the formation time of the East Asian monsoon was approximately 25 Ma or earlier [26]. The magnetic susceptibility at approximately 15 Ma (Figure 8) obviously lags behind the increase in global temperature; however, it increases synchronously with the deposition rate. We believe that the increase in magnetic susceptibility during this period is mainly due to the expansion and uplift of the plateau, which leads to the enhancement of the East Asian summer monsoon [57]. The global temperature was at a low level around 27 Ma; however, the deposition rate accelerated significantly during this period, and the plateau uplifted, which should strengthen the East Asian summer monsoon. However, the soil formation is slightly lower than that of 16 Ma. We believe that the slightly lower soil formation in this period is due to the low global temperature. However, the contribution rate of superparamagnetic particles around 27 Ma and 15 Ma is still lower than that of aeolian sediments in the Loess Plateau [58]. We believe that this is due to the acceleration of denudation by the uplift of the plateau, resulting in an increase in the input of magnetic minerals in the source area, increasing the proportion of coarse-grained magnetic minerals, making the contribution rate of superparamagnetic particles low. In summary, this paper believes that the magnetic susceptibility fluctuation in this area during the tectonic gentle period is mainly controlled by the global temperature, and the magnetic susceptibility fluctuation in this area during the tectonic active period is controlled by the East Asian summer monsoon enhancement and the input of coarse-grained magnetic minerals caused by the plateau uplift.

6. Conclusions

The rock magnetism of 238 m aeolian red clay and fluvial and lacustrine sedimentary samples in Hongzhuang section is studied and analyzed, and the following conclusions are obtained:
(1)
Magnetostratigraphy results show that the Cenozoic sedimentary sequence of the Xunhua Basin in the northeastern margin of the Tibet Plateau records a continuous geomagnetic polarity sequence from C5ACn to C10r. Therefore, the interval span of this section is 30–14.3 Ma from the early Oligocene to the middle Miocene.
(2)
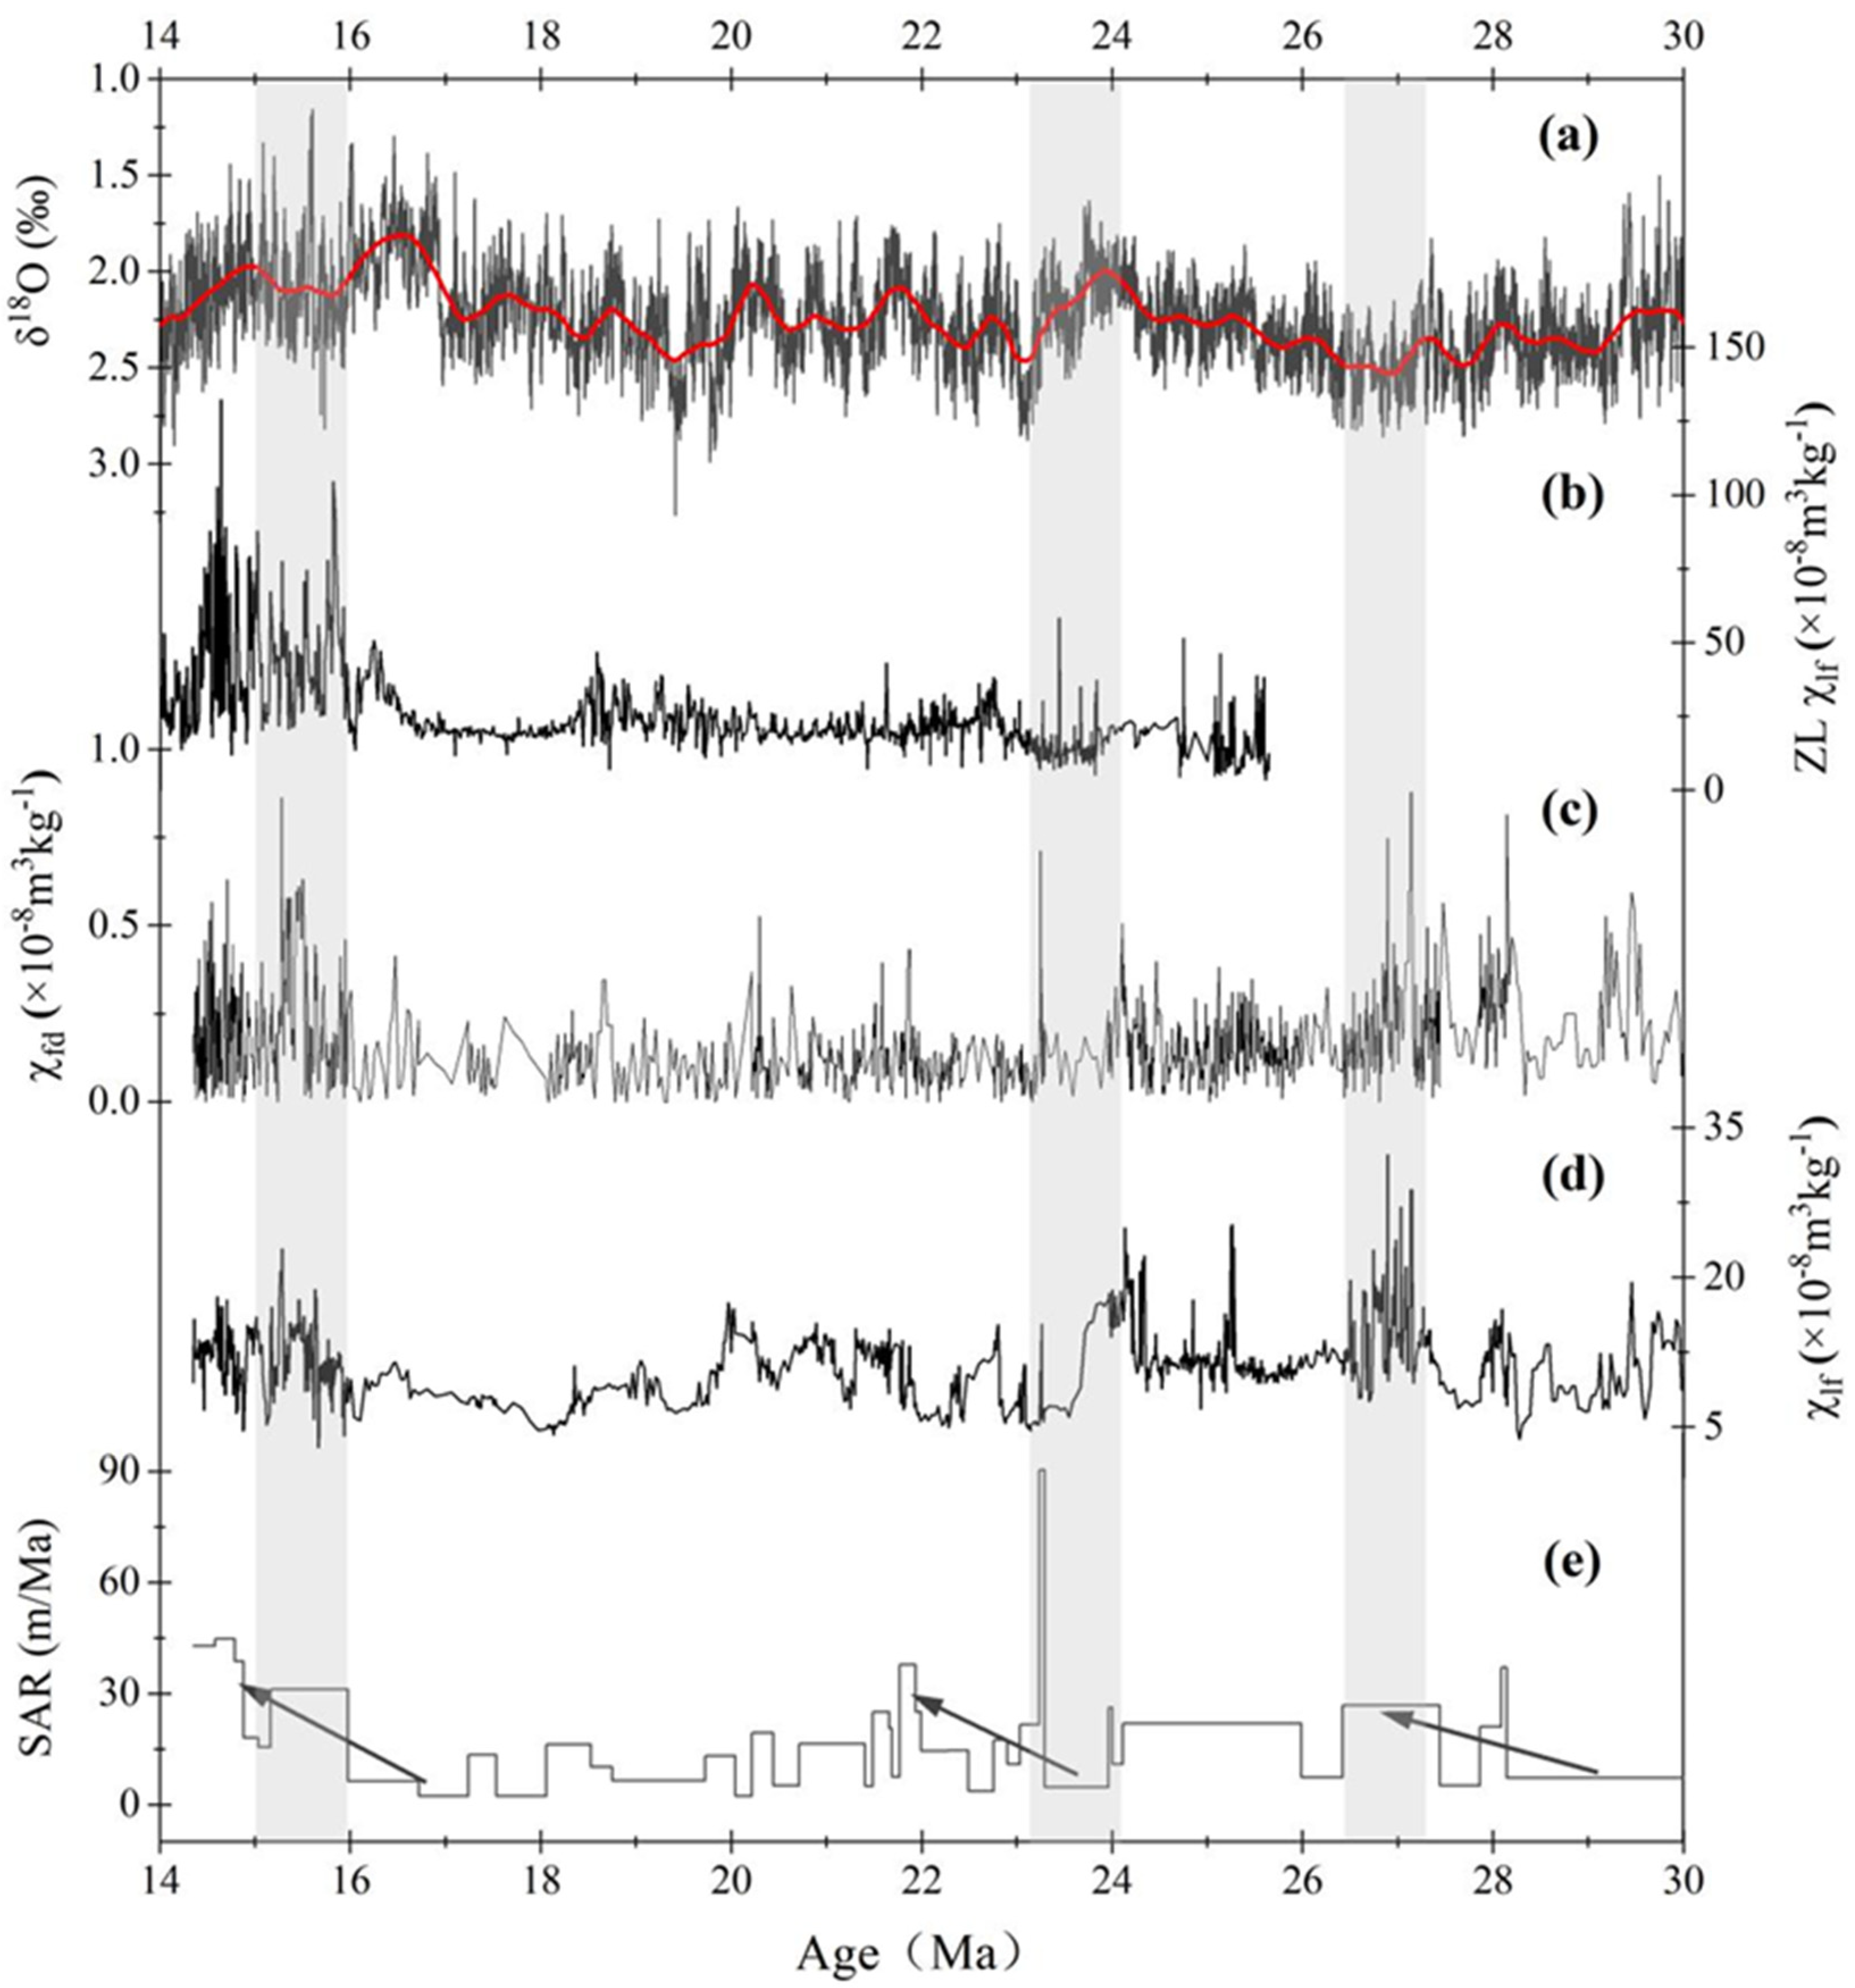
The enhancement events of the East Asian summer monsoon at approximately 27 Ma and 15 Ma are mainly controlled by the uplift of the Tibetan Plateau. The East Asian summer monsoon is mainly controlled by global temperature in 30~14.3 Ma.
(3)
Rock magnetic analysis reveals that the reason for the increase in magnetic susceptibility of sediments is because of the increase in superparamagnetic particles caused by soil formation and the input of near-source magnetic materials resulted in the uplift of mountains around the Xunhua basin, while the plateau expanded to the northeast. The climate in this area is controlled by the combination of the global temperature and the Plateau uplift.

Author Contributions

Conceptualization: P.L., C.F. and A.S.; resources: P.L. and L.C.; data curation, P.L., L.C., J.T. and H.C.; writing—original draft preparation: P.L. and A.S.; writing—review and editing: C.F., X.Q. and A.S.; visualization: J.T. and X.Q.; supervision: C.F., H.C. and X.Q. All authors have read and agreed to the published version of the manuscript.

Funding

This study was supported by National Natural Science Foundation of China (42272221, 41772167); the Second Qinghai-Tibet Plateau Scientific Expedition and Research (STEP) Program (2019QZKK0704); State Key Laboratory of Loess and Quaternary Geology (SKLLQG1905, SKLLQGPY2006); University Research Fund (Grant 300102272901).

Data Availability Statement

Not Applicable.

Acknowledgments

We thank Yang Yanfeng, Yang Huangliang and Du Chen for their hard field work. Thanks to He Zhanhuai for his support with the experimental process.

Conflicts of Interest

The authors declare no conflict of interest.

References

  1. Manabe, S.; Terpstra, T.B. The Effects of Mountains on the General Circulation of the Atmosphere as Identified by Numerical Experiments. J. Atmos. Sci. 1974, 31, 3–42. [Google Scholar] [CrossRef]
  2. Kutzbach, J.E.; Guetter, P.J.; Ruddiman, W.F.; Prell, W.L. Sensitivity of climate to late Cenozoic uplift in southern Asia and the American west: Numerical experiments. J. Geophys. Res. 1989, 94, 18393–18407. [Google Scholar] [CrossRef]
  3. Guo, Z.T.; Ruddiman, W.F.; Hao, Q.Z.; Wu, H.B.; Qiao, Y.S.; Zhu, R.X.; Peng, S.Z.; Wei, J.J.; Yuan, B.Y.; Liu, T.S. Onset of Asian desertification by 22 Myr ago inferred from loess deposits in China. Nature 2002, 416, 159–163. [Google Scholar] [CrossRef] [PubMed]
  4. Li, J.; Wen, S.; Zhang, Q.; Wang, F.; Zheng, B.; Li, B. A discussion on the period, amplitude and type of the uplift of the qinghai-xizang plateau. Sci. China Ser. A 1979, 11, 1314–1328. [Google Scholar]
  5. Liu, T.; Ding, Z. Chinese Loess and the Paleomonsoon. Annu. Rev. Earth Planet. Sci. 1998, 26, 111–146. [Google Scholar] [CrossRef]
  6. Rea, D.K. Delivery of Himalayan Sediment to the Northern Indian Ocean and Its Relation to Global Climate, Sea Level, Uplift, and Seawater Strontium. In Synthesis of Results from Scientific Drilling in the Indian Ocean; American Geophysical Union: Washington, DC, USA, 1992; pp. 387–402. [Google Scholar]
  7. Shen, X. Mechanism of thermo-tectonic evolution of the uplift of the qinghai-xizang plateau. Chin. J. Geol. 1986, 27, 101–113. [Google Scholar]
  8. Coleman, M.; Hodges, K. Evidence for Tibetan plateau uplift below 14 Myr ago from a new minimum age for east-west extension. Nature 1995, 374, 49. [Google Scholar] [CrossRef]
  9. Chung, S.; Lo, C.; Lee, T.; Zhang, Y.; Xie, Y.; Li, X.; Wang, K.; Wang, P. Diachronous uplift of the Tibetan plateau starting 40 Myr ago. Nature 1998, 394, 769–773. [Google Scholar] [CrossRef]
  10. Cerling, T.E.; Harris, J.M.; Macfadden, B.J.; Leakey, M.G.; Quade, J.; Eisenmann, V.; Ehleringer, J.R. Global vegetation change through the Miocene/Pliocene boundary. Nature 1997, 389, 153–158. [Google Scholar] [CrossRef]
  11. Miller, K.G.; Fairbanks, R.G.; Mountain, G.S. Tertiary oxygen isotope synthesis, sea level history, and continental margin erosion. Paleoceanography 1987, 2, 1–19. [Google Scholar] [CrossRef]
  12. Zachos, J.; Pagani, M.; Sloan, L.; Thomas, E.; Billups, K. Trends, Rhythms, and Aberrations in Global Climate 65 Ma to Present. Science 2001, 292, 686–693. [Google Scholar] [CrossRef] [PubMed]
  13. Boulila, S. Coupling between Grand cycles and Events in Earth’s climate during the past 115 million years. Sci. Rep. 2019, 9, 327. [Google Scholar] [CrossRef]
  14. Westerhold, T.; Marwan, N.; Drury, A.J.; Liebrand, D.; Agnini, C.; Anagnostou, E.; Barnet, J.S.K.; Bohaty, S.M.; De Vleeschouwer, D.; Florindo, F.; et al. An astronomically dated record of Earth’s climate and its predictability over the last 66 million years. Science 2020, 369, 1383–1387. [Google Scholar] [CrossRef]
  15. Fang, X.; Garzione, C.; Van der Voo, R.; Li, J.; Fan, M. Flexural subsidence by 29 Ma on the NE edge of Tibet from the magnetostratigraphy of Linxia Basin, China. Earth Planet. Sci. Lett. 2003, 210, 545–560. [Google Scholar] [CrossRef]
  16. Xiao, G.; Guo, Z.; Dupont-Nivet, G.; Lu, H.; Wu, N.; Ge, J.; Hao, Q.; Peng, S.; Li, F.; Abels, H.A.; et al. Evidence for northeastern Tibetan Plateau uplift between 25 and 20Ma in the sedimentary archive of the Xining Basin, Northwestern China. Earth Planet. Sci. Lett. 2012, 317–318, 185–195. [Google Scholar] [CrossRef]
  17. Bian, S.; Gong, J.; Zuza, A.V.; Yang, R.; Yu, X. Late Pliocene onset of the Cona rift, eastern Himalaya, confirms eastward propagation of extension in Himalayan-Tibetan orogen. Earth Planet. Sci. Lett. 2020, 544, 116383. [Google Scholar] [CrossRef]
  18. Pares; Josep, M. Northeastward growth and uplift of the Tibetan Plateau: Magnetostratigraphic insights from the Guide Basin. J. Geophys. Res. Solid Earth 2003, 108, EPM 10-1-2. [Google Scholar] [CrossRef]
  19. Hough, B.; Garzione, C.; Wang, Z.; Lease, R.; Burbank, D.; Yuan, D. Stable Isotope Evidence for Topographic Growth and Basin Segmentation: Implications for the Evolution of the NE Tibetan Plateau. Geol. Soc. Am. Bull. 2011, 123, 168–185. [Google Scholar] [CrossRef]
  20. Wang, W.; Zhang, P.; Liu, C.; Zheng, D.; Yu, J.; Zheng, W.; Wang, Y.; Zhang, H.; Chen, X. Pulsed growth of the West Qinling at ~30 Ma in northeastern Tibet: Evidence from Lanzhou Basin magnetostratigraphy and provenance. J. Geophys. Res. Solid Earth 2016, 121, 7754–7774. [Google Scholar] [CrossRef]
  21. Fang, X.; Fang, Y.; Zan, J.; Zhang, W.; Song, C.; Appel, E.; Meng, Q.; Miao, Y.; Dai, S.; Lu, Y.; et al. Cenozoic magnetostratigraphy of the Xining Basin, NE Tibetan Plateau, and its constraints on paleontological, sedimentological and tectonomorphological evolution. Earth-Sci. Rev. 2019, 190, 460–485. [Google Scholar] [CrossRef]
  22. Lease, R.O.; Burbank, D.W.; Hough, B.; Wang, Z.; Yuan, D. Pulsed Miocene range growth in northeastern Tibet: Insights from Xunhua Basin magnetostratigraphy and provenance. GSA Bull. 2012, 124, 657–677. [Google Scholar] [CrossRef]
  23. Song, C.; Fang, X.; Gao, J.; Sun, D.; Fan, M. Cenozoic sedimentary evolution and tectonic uplift in Guide Basin in northeast Qinghai-Tibet Plateau. J. Sedi. 2001, 19, 493–500. (In Chinese) [Google Scholar]
  24. Fang, X.; Li, G.; Zhu, J.; Chen, H.; Cao, J. Absolute dating and division of Cenozoic stratigraphy in Linxia Basin of Gansu Province. Sci. Bull. 1997, 14, 1457–1471. (In Chinese) [Google Scholar]
  25. Zhang, K.; Wang, G.; Luo, M.; Ji, J.; Xu, Y.; Chen, R.; Chen, F.; Song, B.; Liang, Y.; Zhang, J.; et al. Cenozoic tectono-lithofacies paleogeographic evolution of the Qinghai-Tibet Plateau and its response to tectonic uplift. Sci. China Ser. D Earth Sci. 2010, 35, 697–712. (In Chinese) [Google Scholar]
  26. Qiang, X.; An, Z.; Song, Y.; Chang, H.; Sun, Y.; Liu, W.; Ao, H.; Dong, J.; Fu, C.; Wu, F.; et al. New eolian red clay sequence on the western Chinese Loess Plateau linked to onset of Asian desertification about 25 Ma ago. Sci. China Ser. D Earth Sci. 2011, 54, 136–144. [Google Scholar]
  27. Zijderveld, J.D.A. AC Demagnetization of Rocks: Analysis of Results. Dev. Solid Earth Geophys. 1967, 3, 254–286. [Google Scholar]
  28. Kirschvink, J.L. The least-squares line and plane and the analysis of palaeomagnetic data. Geophys. J. Int. 1980, 62, 699–718. [Google Scholar] [CrossRef]
  29. Maher, B.A. Environmental Magnetism; Springer: Dordrecht, The Netherlands, 1986; pp. 56–57. [Google Scholar]
  30. Fang, X.; Zhang, W.; Meng, Q.; Gao, J.; Wang, X.; King, J.; Song, C.; Dai, S.; Miao, Y. High-resolution magnetostratigraphy of the Neogene Huaitoutala section in the eastern Qaidam Basin on the NE Tibetan Plateau, Qinghai Province, China and its implication on tectonic uplift of the NE Tibetan Plateau. Earth Planet. Sci. Lett. 2007, 258, 293–306. [Google Scholar] [CrossRef]
  31. Torii, M.; Fukuma, K.; Horng, C.S.; Lee, T.Q. Magnetic discrimination of pyrrhotite- and greigite-bearing sediment samples. Geophys. Res. Lett. 1996, 23, 1813–1816. [Google Scholar] [CrossRef]
  32. Fu, C.; Qiang, X.; Xu, X.; Xi, J.; Zuo, J.; An, Z. Late Miocene magnetostratigraphy of Jianzha Basin in the northeastern margin of the Tibetan Plateau and changes in the East Asian summer monsoon. Geol. J. 2018, 53, 282–292. [Google Scholar]
  33. Fu, C.; Bloemendal, J.; Qiang, X.; Hill, M.J.; An, Z. Occurrence of greigite in the Pliocene sediments of Lake Qinghai, China, and its paleoenvironmental and paleomagnetic implications. Geochem. Geophys. Geosys. 2015, 16, 1293–1306. [Google Scholar] [CrossRef]
  34. Gradstein, F.M.; Ogg, J.G. Chapter 2—The Chronostratigraphic Scale. In The Geologic Time Scale; Gradstein, F.M., Ogg, J.G., Schmitz, M.D., Ogg, G.M., Eds.; Elsevier: Boston, MA, USA, 2012; pp. 31–42. [Google Scholar]
  35. Gradstein, F.M.; Ogg, J.G.; Hilgen, F.J. On The Geologic Time Scale. Newsl. Stratigr. 2012, 45, 171–188. [Google Scholar] [CrossRef]
  36. Liu, X.; Rolph, T.; Bloemendal, J.; Shaw, J.; Liu, T. Quantitative estimates of palaeoprecipitation at Xifeng, in the Loess Plateau of China. Palaeogeogr. Palaeoclimatol. Palaeoecol. 1995, 113, 243–248. [Google Scholar] [CrossRef]
  37. Maher, B.A. Characterisation of soils by mineral magnetic measurements. Phys. Earth Planet. Inter. 1986, 42, 76–92. [Google Scholar] [CrossRef]
  38. Zhisheng, A.; Tunghseng, L.; Yanchou, L.; Porter, S.C.; Kukla, G.; Xihao, W.; Yingming, H. The long-term paleomonsoon variation recorded by the loess-paleosol sequence in Central China. Quat. Int. 1990, 7–8, 91–95. [Google Scholar] [CrossRef]
  39. An, Z.; Kukla, G.J.; Porter, S.C.; Xiao, J. Magnetic susceptibility evidence of monsoon variation on the Loess Plateau of central China during the last 130,000 years. Quat. Res. 1991, 36, 29–36. [Google Scholar] [CrossRef]
  40. Hesse, P.; Chlachula, J. Two pedogenic models for paleoclimatic records of magnetic susceptibility from Chinese and Siberian loess. Sci. China Ser. D Earth Sci. 2008, 51, 284–293. [Google Scholar]
  41. Dai, S.; Fang, X.; Dupont-Nivet, G.; Song, C.; Gao, J.; Krijgsman, W.; Langereis, C.; Zhang, W. Magnetostratigraphy of Cenozoic sediments from the Xining Basin: Tectonic implications for the northeastern Tibetan Plateau. J. Geophys. Res. 2006, 111, B11102. [Google Scholar] [CrossRef]
  42. Zan, J.; Fang, X.; Kang, J.; Li, X.; Yan, M. Spatial and altitudinal variations in the magnetic properties of eolian deposits in the northern Tibetan Plateau and its adjacent regions: Implications for delineating the climatic boundary. Earth-Sci. Rev. 2020, 208, 103271. [Google Scholar] [CrossRef]
  43. Xinbo, G.; Hao, Q.; Wang, L.; Oldfield, F.; Bloemendal, J.; Deng, C.; Song, Y.; Ge, J.; Wu, H.; Xu, B.; et al. The different climatic response of pedogenic hematite and ferrimagnetic minerals: Evidence from particle-sized modern soils over the Chinese Loess Plateau. Quat. Sci. Rev. 2018, 179, 69–86. [Google Scholar]
  44. Liu, Z.; Liu, Q.; Torrent, J.; Barrón, V.; Hu, P. Testing the magnetic proxy χFD/HIRM for quantifying paleoprecipitation in modern soil profiles from Shaanxi Province, China. Glob. Planet. Change 2013, 110, 368–378. [Google Scholar] [CrossRef]
  45. Song, Y.; Hao, Q.; Ge, J.; Zhao, D.; Zhang, Y.; Li, Q.; Zuo, X.; Lü, Y.; Wang, P. Quantitative relationships between magnetic enhancement of modern soils and climatic variables over the Chinese Loess Plateau. Quat. Int. 2014, 334–335, 119–131. [Google Scholar] [CrossRef]
  46. Balsam, W.L.; Ellwood, B.B.; Ji, J.; Williams, E.R.; Long, X.; El Hassani, A. Magnetic susceptibility as a proxy for rainfall: Worldwide data from tropical and temperate climate. Quat. Sci. Rev. 2011, 30, 2732–2744. [Google Scholar] [CrossRef]
  47. Nie, J.; King, J.W.; Fang, X. Enhancement mechanisms of magnetic susceptibility in the Chinese red-clay sequence. Geophys. Res. Lett. 2007, 34, L19705. [Google Scholar] [CrossRef]
  48. Liu, Q.; Jackson, M.J.; Banerjee, S.K.; Maher, B.A.; Deng, C.; Pan, Y.; Zhu, R. Mechanism of the magnetic susceptibility enhancements of the Chinese loess. J. Geophys. Res. 2004, 109, B12107. [Google Scholar] [CrossRef]
  49. Sun, Z.; Yang, Z.; Pei, J.; Ge, X.; Wang, X.; Yang, T.; Li, W.; Yuan, S. Magnetostratigraphy of Paleogene sediments from northern Qaidam Basin, China: Implications for tectonic uplift and block rotation in northern Tibetan plateau. Earth Planet. Sci. Lett. 2005, 237, 635–646. [Google Scholar] [CrossRef]
  50. Wang, W.; Zhang, P.; Duan, L.; Zhang, B.; Liu, K.; Huang, R.; Liu, C.; Zhang, Z.; Zheng, D.; Zheng, W.; et al. Cenozoic stratigraphic chronology and sedimentary-tectonic evolution of the Qaidam Basin. Chin. Sci. Bull. 2022, 67, 3452–3475. [Google Scholar] [CrossRef]
  51. Lei, D.; Boxuan, Z.; Weitao, W.; Peizhen, Z.; Qing, T.; Qian, C.; Jiabao, J.; Yonggang, Y.; Rong, H.; Wenjun, Z. Magnetostratigraphy age and tectonic deformation of Lulehe section in Qaidam Basin. Sci. Bull. 2022, 67, 872–887. (In Chinese) [Google Scholar]
  52. Huocan, Y.C.; Weitao, W.; Lei, D.; Boxuan, Z.; Kang, L.; Rong, H.; Peizhen, Z. Paleomagnetic evidence of Cenozoic tectonic deformation in Lulehe area, Qaidam Basin, northeastern margin of Qinghai-Tibet Plateau. Acta Geolog. Sin. 2022, 96, 3345–3359. (In Chinese) [Google Scholar]
  53. Yin, A.; Dang, Y.; Wang, L.; Jiang, W.; Zhou, S.; Chen, X.; Gehrels, G.E.; Mcrivette, M.W. Cenozoic tectonic evolution of Qaidam basin and its surrounding regions (Part 1): The southern Qilian Shan-Nan Shan thrust belt and northern Qaidam basin. GSA Bull. 2008, 120, 813–846. [Google Scholar] [CrossRef]
  54. Dewen, Z.; Peizhen, Z.; Jinglin, W.; Chuanyou, L.; Jixiu, C. Sequence of Late Cenozoic tectonic deformation in the northeastern margin of the Qinghai-Tibet Plateau-Detrital apatite fission track record in Linxia Basin. Sci. China Ser. D 2003, 33, 190–198. (In Chinese) [Google Scholar]
  55. Zhang, R.; Jiang, D.; Zhang, Z. The impact of the uplifts of the manin part and marginal area of the tibetan plateau on the Asian monsoon climate. Quat. Sci. 2016, 36, 945–952. [Google Scholar]
  56. Wu, G.X.; Liu, Y.M.; He, B.; Bao, Q.; Duan, A.M.; Jin, F.F. Thermal Controls on the Asian Summer Monsoon. Sci. Rep. 2012, 2, 404. [Google Scholar] [CrossRef]
  57. Zhisheng, A.; Kutzbach, J.E.; Prell, W.L.; Porter, S.C. Evolution of Asian monsoons and phased uplift of the Himalaya–Tibetan plateau since Late Miocene times. Nature 2001, 411, 62–66. [Google Scholar] [CrossRef] [PubMed]
  58. Qiang, X.; An, Z.; Song, Y. Magnetic properties of Jiaxian red clay sequences from northern Chinese Loess Plateau and its paleoclimatic significance. Sci. China Ser. D Earth Sci. 2005, 48, 1234–1245. [Google Scholar] [CrossRef]
Figure 1. (a) Location, main geological and geographical characteristics, and main atmospheric circulation system of the study area in the Xunhua Basin. (b) The main mountains, faults, and strata characteristics around the Xunhua Basin (modified after [22]). (c) View of the study section (solid black lines indicate vertical joints). (d) Loess column. (e) Vertical Joints (the black dotted line indicates vertical joints). (f) Palaeosol. (g) Gypsum vein.
Minerals 13 00671 g001
Figure 2. Hongzhuang section lithology and sedimentary facies.
Minerals 13 00671 g002
Figure 3. Representative thermal demagnetization diagrams of oriented paleomagnetic samples from Hongzhuang section (directions are the original data in geographical coordinates). (a) Thermal demagnetization curve and orthogonal vector plot (negative polarity) of the sample at 223.5 m. (b) Thermal demagnetization curve and orthogonal vector plot (positive polarity) of the sample at 168.4m. (c) Thermal demagnetization curve and orthogonal vector plot (negative polarity) of the sample at 105 m. (d) Thermal demagnetization curve and orthogonal vector plot (positive polarity) of the sample at 79.6 m. (e) Thermal demagnetization curve and orthogonal vector plot (negative polarity) of the sample at 47.5 m. (f) Thermal demagnetization curve and orthogonal vector plot (positive polarity) of the sample at 7.4m. The temperature steps used are 25 °C, 50 °C, 100 °C, 150 °C, 200 °C, 250 °C, 300 °C, 350 °C, 400 °C, 450 °C, 500 °C, 525 °C, 550 °C, 570 °C, 585 °C, 600 °C, 620 °C, 640 °C, 660 °C, 680 °C. The solid (open) symbol represents the vertical (horizontal) projections, and the intensity unit is mA/m. J0 is the NRM; Py = pyrrhotite, Gr = greigite; Go = goethite; TM = titanomagnetite; MH = maghemite; M = magnetite; H = hematite.
Minerals 13 00671 g003
Figure 4. Lithology and magnetostratigraphic results for the Hongzhuang section and correlation of the inferred polarity sequence with the standard polarity column [35].
Minerals 13 00671 g004
Figure 5. Age versus depth relationship for the Hongzhuang section based on the geomagnetic polarity stratigraphy.
Minerals 13 00671 g005
Figure 6. Lithology and magnetic parameters of Hongzhuang section. (a) Low frequency susceptibility (χlf). (b) High frequency susceptibility (χhf). (c) Frequency susceptibility (χfd). (d) Percentage of frequency magnetic susceptibility (χfd%).
Minerals 13 00671 g006
Figure 7. Piece-wise linear fitting plot of low frequency susceptibility (χlf) and frequency susceptibility (χfd) of Hongzhuang section. (a) 30.032–27.783 Ma magnetic susceptibility and frequency susceptibility fitting diagram. (b) 27.783–26.741 Ma magnetic susceptibility and frequency susceptibility fitting diagram. (c) 26.741–15.686 Ma magnetic susceptibility and frequency susceptibility fitting diagram. (d) 15.686–14.877 Ma magnetic susceptibility and frequency susceptibility fitting diagram. (e) 14.877–14.3 Ma magnetic susceptibility and frequency susceptibility fitting diagram.
Minerals 13 00671 g007
Figure 8. Comparison of paleoenvironmental data and deep-sea oxygen isotope records of the Hongzhuang section. (a) Deep-sea oxygen isotope records [14]. (b) Zhuanglang magnetic susceptibility data [26] (c) The frequency magnetic susceptibility of Hongzhuang profile. (d) The low frequency magnetic susceptibility of Hongzhuang profile. (e) The sedimentary accumulation rate of Hongzhuang profile, the dark arrow represents the uplift event of the Xunhua Basin. The gray area represents the main changes in the record.
Minerals 13 00671 g008
Disclaimer/Publisher’s Note: The statements, opinions and data contained in all publications are solely those of the individual author(s) and contributor(s) and not of MDPI and/or the editor(s). MDPI and/or the editor(s) disclaim responsibility for any injury to people or property resulting from any ideas, methods, instructions or products referred to in the content.

